continental shelf research - core.ac.uk · dynamics (e.g. castelle et al., 2006; bruneau et al.,...
TRANSCRIPT

Research papers
Water-level controls on macro-tidal rip currents
Martin J. Austin a,n,1, Gerd Masselink b, Tim M. Scott b, Paul E. Russell b
a School of Ocean Sciences, Bangor University, Menai Bridge, Anglesey LL59 5AB, UKb School of Marine Science and Engineering, Plymouth University, Drake Circus, Plymouth PL4 8AA, UK
a r t i c l e i n f o
Article history:Received 23 July 2013Received in revised form29 November 2013Accepted 3 December 2013Available online 17 December 2013
Keywords:Rip currentMacro-tidalWater-levelSet-upSurf zone
a b s t r a c t
Field measurements and numerical modelling have been used to investigate the water-level control of ripcurrent dynamics on a macro-tidal beach. Field data collected over 32 complete tidal cycles, spanning arange of wave and tide conditions, demonstrate that rip current strength and behaviour is modulated atthe semi-diurnal frequency by tide-induced changes in the water-level over bar/rip morphology. Peakflow speeds in the rip neck ⟨uv⟩ correspond to the time of maximumwave breaking 1.5 h before and afterlow water.
Alongshore-directed water surface gradients ∂η=∂y were measured along the feeder channel andaround the ends of the inter-tidal bar, with head differences O(0.1 m). The numerical model reproduced∂η=∂y with a good level of skill and showed that ∂η=∂y and ⟨uv⟩ increase with the proportion of breakingwaves Qb over the inter-tidal bar; but ⟨uv⟩ was maximised during peak Qb, maximum ∂η=∂y occurredwhen wave breaking moved offshore to the sub-tidal bar and Qb was reduced. Around low water, theforcing of the rip current by the alongshore pressure-driven feeder current was reduced by the decreasein Qb over the bar and feeder regions, but an offshore flow through the rip channel was maintained by alocalised intensification of ∂η=∂y around the ends of the inter-tidal bar.
& 2014 The Authors. Published by Elsevier Ltd.
1. Introduction
Studies of rip currents in energetic macro-tidal environmentshave been limited (e.g. Bruneau et al., 2009; Austin et al., 2010),but have identified the strong tidal modulation of rip currentspeed and activity. Macro-tidal rip currents are typically associatedwith extensive, well-developed 3D morphology located aroundthe spring low-tide limit, where there is sufficient tidal stationar-ity to allow large length-scale bar/trough systems to develop(Masselink and Short, 1993; Scott et al., 2011). The majority ofprevious studies have focused on micro-tidal environments wherethe length-scale of the bed perturbations is relatively small (e.g.McKenzie, 1958; MacMahan et al., 2008).
Large bathymetric non-uniformities lead to large spatial gra-dients in the depth-induced transformation of short waves acrossthe nearshore. Radiation stresses are forced by this short wavetransformation (Bowen, 1969) and during wave breaking energy isalso transferred to the roller, which becomes an additional sourceof radiation stress (Deigaard, 1993). The set-up gradients within
the surf zone are balanced by the formation of pressure gradientforces, leading to significant pressure-driven currents (e.g. Haaset al., 2003). Haller et al. (2002) analysed the alongshore momen-tum balance during a set of laboratory experiments and demon-strated that the magnitude of the alongshore rip feeder currentwas controlled by the balance between the alongshore pressuregradient force generated by high set-up over the bar crests and theopposing radiation stress gradient generated by larger wavespropagating into the rip channel. The region of maximum feederstrength was also shifted into the trough landwards of the inter-tidal bar. These observations complement those of Nielsen et al.(2001), who measured the total water-level over-height landwardof the bar driving the alongshore feeder channel.
Rapid changes in the water level in macro-tidal environmentsalso provide a significant temporal control on rip current activity.The control is twofold: (1) changes in water level modulate theexpression of the morphology (Castelle et al., 2006; Austin et al.,2010); and (2) result in limited stationarity across the nearshoreand hence the rapid cross-shore translation of the surf zone. Thesetwo processes combine, to effectively switch the rip currents onand off several hours before and after low water, respectively, bycontrolling the spatial pattern of wave energy dissipation and thusthe formation of the pressure-driven currents.
When bar/rip morphology is well-developed, rip flows becomeincreasingly channelised by the morphology around low water(Brander, 1999; Austin et al., 2010). The emergence of the barcrests, over which waves are breaking, probably reduces the
Contents lists available at ScienceDirect
journal homepage: www.elsevier.com/locate/csr
Continental Shelf Research
0278-4343 & 2014 The Authors. Published by Elsevier Ltd.http://dx.doi.org/10.1016/j.csr.2013.12.004
n Corresponding author. Tel.: þ44 1248382803.E-mail address: [email protected] (M.J. Austin).1 Previously at: School of Marine Science and Engineering, Plymouth
University, Drake Circus, Plymouth PL4 8AA, UK.
Continental Shelf Research 75 (2014) 28–40
Open access under CC BY license.
Open access under CC BY license.

pressure-driven alongshore feeder current forcing of the ripcurrents. Significantly, although rip flows were reduced duringthese periods, they did not stop. One of the key observations ofboth Brander (1999) and Austin et al. (2010) was that waterdraining directly from the ends of the emergent inter-tidal barsappeared to be the main forcing for the rip currents at thisextremely low stage of the tide; however, this drainage was notquantified.
The limited tidal stationarity of macro-tidal beaches introducessignificant challenges to making field measurements. Arrays ofsensors deployed across the complex bar/rip morphology dry-outat different times and it becomes difficult to obtain a completesynoptic overview of the rip circulation and forcing when waterdepths are very shallow. When combined with field observations,numerical modelling becomes a powerful tool to obtain additionalinformation across the very shallow inter-tidal beachface. Severalrecent studies have used depth-averaged modelling approachesbased on field measurements to investigate rip current hydro-dynamics (e.g. Castelle et al., 2006; Bruneau et al., 2011). Thesestudies have demonstrated that these models can reproducewave-driven rip current circulation forced by wave groups(Reniers et al., 2006; Austin et al., 2013) or shear instabilities(Haller and Dalrymple, 2001).
The purpose of this paper is to investigate the dynamics of ripcurrent flows on a macro-tidal beach around the period ofdominant rip activity at low water. We hypothesise that the ripcurrents are forced by a combination of the wave dissipation-induced radiation stress gradient and locally generated watersurface gradients around the terminal ends of the inter-tidalsandbars. We use Eulerian and Lagrangian field observationscollected around well-developed low tide bar/rip morphologyduring a period of large spring tides and moderate wave condi-tions to quantify the rip current flow and forcing. The field datais augmented by a 2D depth-averaged wave/flow model, which isused to quantify the nearshore distribution of short-wave dissipa-tion and the presence of alongshore water surface gradients.
2. Methodology
2.1. Study site
During October 2011 a 16-day field experiment was conducted atPerranporth beach, Cornwall, UK over a spring–neap–spring tidal
cycle (Fig. 1). Perranporth is a macro-tidal beach with a semi-diurnaltidal regime and a mean spring range of 6.3 m. It is classified as alow tide bar/rip beach (Scott et al., 2011) and thus exhibits apronounced inter-tidal bar/rip morphology around the Mean LowWater Spring (MLWS) region and a sub-tidal bar, which vary onseasonal and storm-event timescale. The intertidal beach is rela-tively flat ( tan β¼ 0:015–0:025) and the beach is composed ofmedium quartz sand (D50 ¼ 0:34 mm). The beach faces west–north-west and is predominantly exposed to Atlantic swell, but alsoreceives locally generated wind waves (typically from the north).A directional wave rider (DWR) buoy is located close inshore inapproximately 13 m water depth, and reported an annual averagesignificant wave height and a peak period of Hs ¼ 1:4 m andTp ¼ 10:5 s, respectively, between 2006 and 2012.
2.2. Field experiment
In situ instrument rig arrays were deployed around the MLWSshoreline region to record water level, wave height and flowvelocity across the inter-tidal bar, feeder and rip channels(Fig. 1). Two instrument arrays were deployed. The first was anarray of three rigs over the intertidal bar (R1, R2 and R4), eachmounting a pair of bi-directional miniature electromagnetic cur-rent meters (EMCM) and a high-precision pressure transducer(PT). The second array was orientated across the feeder and ripchannel with two rigs along the feeder channel (R5 and R6), eachmounting a 3D-Acoustic Doppler Velocimeter (ADV) and a PT, andtwo rigs (R7 and R8) in the rip channel, each also mounting a3D-ADV and a PT. Four additional bottom-mounted self-recordingPT's were deployed around the bar/rip region and a further twowere deployed � 500 m offshore to record the wave conditionsinput to the beachface. The beachface PT's were buried � 0:25 mto measure hydrostatic pressure and avoid contamination of thewater-level signal by the dynamic pressure variation (i.e. accel-erating/decelerating flows reducing/enhancing pressure). All ofthe instrument rigs were self-recording and sampled at 4 Hz. Thisinstrument configuration was designed to maximise the spatialcoverage over the bar/rip system and data were sampled over atotal of 33 complete tidal cycles.
Fifteen GPS-tracked surf-zone drifters were used to record theLagrangian currents over the bar/rip system. The drifters were of arobust design modified from that of Schmit et al. (2003), Spydellet al. (2007), and MacMahan et al. (2009), and were modular in
Fig. 1. (Left) Location map of Perranporth indicating the experimental region (circled) and the nearshore directional wave-rider buoy (DWR). (Right) Perranporthbathymetry and instrument locations transformed onto the XBeach model grid. Shading indicates bottom elevation relative to Ordnance Datum Newlyn (ODN) and iscontoured at 0.5 m intervals. Heavy contours plot the MLWS and MSL elevations. Alongshore transect A–A is indicated.
M.J. Austin et al. / Continental Shelf Research 75 (2014) 28–40 29

nature allowing any damaged components to be easily replaced inthe field. The GPS units were custom-made in-house and recordedthe raw L1 GPS carrier-phase information, which was logged to amemory card at 1 Hz. The raw GPS data were post-processed from astatic base station to provide an accuracy of o0:4 m in horizontalposition and o0:01 m s�1 in velocity.
Drifter deployments were for 3–5 h periods centred on low tidewhen the rip currents were most active. Drifters were individuallyseeded (rather than in clusters) from the beach into the feeder andrip regions to maintain both spatial and temporal coverage acrossthe bar/rip, maximising the synoptic understanding of circulationpatterns through the rip system. Due to the rate of change of tidalelevation within a macro-tidal regime it is desirable to have drifterobservations throughout the entire rip system at least for every30 min. For further details of the drifter data processing, refer toAustin et al. (2013).
The inter- and sub-tidal beach were surveyed regularlythroughout the field experiment. Inter-tidal topography (dunefoot to MLWS shoreline) was surveyed using a Trimble real-timekinematic (RTK) GPS system mounted on an all-terrain vehicle(ATV) during low tide periods. Sub-tidal bathymetry was collectedusing RTK-GPS and a single-beam echo sounder mounted onto apersonal water craft (PWC) during high tide. Bathymetric datawere collected along regularly spaced cross-shore transects(Δy¼ 25 m), which overlapped with the intertidal survey byapproximately 100 m. The ATV and PWC survey datasets weresubsequently merged together and interpolated onto a regulargrid using a quadratic loess scale-controlled interpolation method(Plant et al., 2002). The in situ instruments were surveyed using alaser total station, with an accuracy of o1 cm.
2.3. Modelling approach
The XBeach model (cf. Roelvink et al., 2009) was used to solvecoupled 2D horizontal equations for wave propagation and flow,
for varying spectral wave and flow boundary conditions. XBeachincludes a non-stationary wave driver with directional spreading,which accounts for wave-group generated surf motions that areimportant for rip current dynamics (e.g. MacMahan et al., 2004).Wave–current interaction was included in the model using theformulation of Yu and Slinn (2003), where the offshore-directedrip currents impart negative feedback on the wave forcing. For thisapplication, XBeach was run only in hydrodynamic mode withoutsediment transport or morphological updating to minimise com-putational time.
The model bathymetry was based on the combined bathy-metric and topographic survey data measured during the fieldexperiment at the time nearest to the simulation time of interest.A rectilinear computational grid was generated, which optimisedthe spatial resolution across the surf zone in the centre of themodel domain (Δx¼ 2 m, Δy¼ 5 m), which is 860 m�1220 m inthe cross- and alongshore directions, respectively. The waveconditions at the offshore boundary of the XBeach model weredescribed by the 2D spectral output from a nested SWAN model(cf. Austin et al., 2013), appropriate to the simulation time. Thetidal level along the offshore boundary of the model was variedover each simulation, based on a local prediction derived from theharmonic analysis of a long-term dataset.
The XBeach model has a number of free parameters that areused to calibrate the model. In this hydrodynamic-only model, theparameters that required tuning were those governing the short-wave breaking: the breaker parameter (γ) and the breaker slopecoefficient in the roller model (β¼ 0:05). All other parameterswere set to their recommended default values. The hydrodynamicsof the model were calibrated with measured Eulerian data and thecomputed nearshore circulation patterns were validated againstLagrangian drifter measurements by Austin et al. (2013).
The advective-deterministic approach (ADA) for wave breaking(Daly et al., 2012) was used (break¼4). Wave breaking within theADA model is turned on and off through upper and lower values of
284 286 288 290 292 294 296 298 300−5
0
5T30T17T3
284 286 288 290 292 294 296 298 3000
1
2
3
284 286 288 290 292 294 296 298 3005
10
15
20
284 286 288 290 292 294 296 298 300−20
0
20
yd (2011)
a
b
c
d
Fig. 2. Nearshore wave and tide forcing during the field experiment. (a) Tidal elevation η; (b) significant wave height Hs; (c) peak Tp (black) and significant Ts (red) waveperiod; and (d) peak wave direction Dp relative to the shoreline from the nearshore wave buoy versus time. The grey shaded region indicates the period discussed in thefollowing sections. (For interpretation of the references to colour in this figure caption, the reader is referred to the web version of this paper.)
M.J. Austin et al. / Continental Shelf Research 75 (2014) 28–4030

the breaker parameter γ and the state of breaking is advectedlandwards at the individual wave celerity. Breaking occurs whenHE4γb and stops when HEoγr , where HE is the (energy-based)short wave height, γb and γr are the breaker and reformationparameters, respectively, and are expressed as follows:
γb ¼HE;b
hand γr ¼
HE;r
hð1Þ
where h is the local water depth. The values of the breakerparameters used were γb ¼ 0:55 and γr ¼ 0:3, as calibrated forPerranporth by Austin et al. (2013). For values of HE between thebreaking limits the state of breaking B, which has binary values,propagates with the celerity of the individual wave cx controlledby the differential in Eq. (3):
B¼ 1; HE4γbh ð2Þ
∂B∂t
¼ cx∂B∂t
¼ 0; γrhoHEoγbh ð3Þ
B¼ 0; HEoγrh: ð4Þ
Advecting B landward ensures that the wave breaking history ismaintained for its duration (while B¼1) and ensures that pre-mature wave breaking does not occur (Daly et al., 2012). The time-averaged proportion of breaking waves Qb at any location istherefore the time-average of B at that point, so
Qb ¼ ⟨B⟩: ð5Þ
Three model simulations were carried out centred on the lowtide periods during yeardays 297–299 (T28–T30). Data were out-put across the model domain at 30-s intervals and as 10-minaverages, while point data were output at 1 Hz at locationscorresponding to the instrument rig locations.
3. Results
3.1. Tide and wave conditions
Water levels and nearshore waves were measured using PT2located 500 m seaward of the low tide surf zone in 12 m waterdepth and directional wave rider buoy located 1 km offshore in15 m of water (Fig. 2). Tidal range varied between 2.5 m and 7.3 mand progressed from springs to neaps and returned to springsduring the experiment (yearday 284–300). Wave height and peakperiod varied between 0.4 m and 2.4 m and between 6 s and 18 s,respectively. Wave direction was relatively shore-normal, butreflects the influence of westerly swell waves and northerly windseas, with the exception of yearday 295 when strong southerlywinds were experienced. Herein we analyse the data collectedduring yeardays 297–299 (T28–30) when the forcing conditionsremained relatively constant with moderate-energy, approxi-mately shore-normal, waves (Hs ¼ 0:9 m; Tp ¼ 12 s) and largespring tide ranges; we therefore assume that changes in the ripdynamics are primarily due to tidal variations.
3.2. Mean rip characteristics
The mean Lagrangian currents measured using GPS driftersduring T30 indicate a complex circulation pattern across the lowtide surf zone (Fig. 3). Drifter data were averaged into 10�10 mspatial bins across two temporal windows, one reflecting the mid-tide period �2:5 to �0:5 hoLTo0:5–2:5 h when the rip wasgenerally active, and the other at low tide �0:5 hoLTo0:5 hwhen the rip is more constrained. Only bins with greater than3 degrees of freedom were included in the averaging.
At mid-tide, currents flow offshore through the rip channel at[Xm ¼ 720 m, Ym ¼ 1200 m] before turning alongshore and flowingprincipally northwards in the trough between the inter- and sub-tidal bars; some flow splits-off to the south. The current then
Fig. 3. (Top) The mean rip circulation pattern averaged within 10�10 m bins over the periods �2:5 to �0:5oLTo0:5–2:5 h (left) and �0:5oLTo0:5 h (right) during T30.Vectors plot rip speed with the scale shown in the top right corner, contours plot bathymetry at 0.25 m intervals. (Bottom) Number of degrees of freedom dof within eachaveraging bin. Bins with dof o3 were discounted.
M.J. Austin et al. / Continental Shelf Research 75 (2014) 28–40 31

rotates seawards and circulates across a deep depression in thesub-tidal bar at [Xm ¼ 600 m, Ym ¼ 1350 m], reflecting a couplingbetween the inter- and sub-tidal bar systems.
Around the lowest tidal levels, the overall circulation is similar,but the following key differences are observed: (1) the forcingfrom the southerly flowing feeder is reduced; (2) the segment offlow splitting-off to the south stops; and (3) the main rip flow ismore shore-normal extending � 50 m further seaward.
3.3. Kinematic rip characteristics
Time series of Eulerian data collected over T29–T30 at threedistinct morphological locations demonstrate the temporal andspatial variability of the surf zone motion (Fig. 4). The semi-diurnal water depth variation is 46:5 m, which modulates the
wave height as the surf zone migrates cross-shore. Cross-shore andalongshore flow velocities are typically strongest when ho4 m, anddisplay the greatest variance over the bar crest (R4). Low-frequencymotions are also evident in the flow velocity signals, with peaks inthe alongshore current (in opposing directions) around low water atR4 and R5, and a corresponding offshore-directed signal at R8.
The water-level spectrum at the bar crest (R4) indicates thatthe incoming wave field contains significant energy at 12 s and43 s, corresponding to incident and infragravity waves, respec-tively. The incident wave peak is also present in the u and v
spectra, but the infragravity peak becomes indistinct due to ageneral increase in low frequency energy. The distribution ofenergy across the feeder channel (R5) is similar to R4, but theincident wave peak is significantly reduced for h, u and v, due tobreaking-induced dissipation across the bar. Within the rip
00 060
2
4
6
8
R4 − BAR
00 06
−1
0
1
00 06
−1
0
1
t (HH)
10−4
10−2
10−2 10−1
100
100 10−2 10−1 100 10−2 10−1 100
43 s
−
12 s
−
f (Hz)
00 06
R5 − FEEDER
00 06
00 06t (HH)
f (Hz)
00 06
R8 − RIP
00 06
00 06t (HH)
f (Hz)
huv
Fig. 4. Example Eulerian time series data collected between low tide T29 and T30. From top: Water depth h; cross-shore flow velocity u (black) and lowpass filtered u (grey;filter cutoff 33 s); alongshore flow velocity v (black) and lowpass filtered v (grey) and (bottom) spectral density for h, u and v indicating the principle incident andinfragravity peaks at 12 s and 43 s, respectively. Spectra were computed using Welch's segment-averaging method from 17-min time series with 4096 samples and sixteen50% overlapping segments. The mean water depth at R4 was 1.2 m (indicated by vertical black dashed line in the upper panels).
M.J. Austin et al. / Continental Shelf Research 75 (2014) 28–4032

channel (R8), the spectrum of h is again similar to R4, but there isno distinct infragravity peak. Instead, there is a general increase inlow frequency energy for both u and v.
A number of 10-min mean hydrodynamic parameters werecomputed from the time series of h, u and v recorded across all ofthe instrument rigs. The 10-min time series segments werede-trended using a 2nd-order polynomial filter to remove thenon-stationary effects of the tidal variation in water-level. Themean cross-shore ⟨u⟩ and alongshore ⟨v⟩ flow velocities, where ⟨ � ⟩indicates time-averaging over the 10-min period were computed.Band-passed velocity amplitudes for the cross-shore velocity (Um)and the alongshore velocity (Vm) were computed as 2
ffiffiffiffis
p, within
the infragravity, ig (o0:05 Hz) and incident, ss (0.05–0.33 Hz)frequency bands, where s is the variance of the u or v time series.The scalar quantity of the rip speed ⟨uv⟩ ð ¼ ⟨
ffiffiffiffiffiffiffiffiffiffiffiffiffiffiffiu2þv2
p⟩Þ and the
relative wave height H=h were also computed.An ensemble-average of the hydrodynamic conditions within
the rip channel (R8) over the three tidal cycles was generated byaveraging a number of the parameters defined above relative tothe time of low water (T). Fig. 5 indicates that the ensemble isrepresentative of the conditions over an individual tide. Maximum⟨u⟩ occurs 2 h either side of low water and is directed offshore at�0.4 m s�1. Alongshore-directed flows ⟨v⟩ are weaker and direc-ted towards the south at (�0.2 m s�1) and peak before ⟨u⟩. It isalso noteworthy that ⟨v⟩ is influenced by the mean tidal currents,flowing north from the mid-flood tide, before reversing to thesouth at high tide. The cross-shore infragravity velocity amplitudeUm;ig begins to increase 4 h before low water, peaking at low water.The relative wave height H=h indicates that wave breaking in therip channel (H=h40:4) only occurs in the period 2–3 h either sideof low water. At lower tidal levels, depth-induced breaking overthe sub-tidal bar reduces H=h in the inner-surf zone.
The hydrodynamic process signature (Wright and Short, 1984)over the bar/rip system was computed to demonstrate the spatialdistribution of the important hydrodynamic processes around lowwater (Fig. 6). Across the inter-tidal bar (R2 and R4), the incident-band signal dominates and is approximately double the magnitude
−6 −5 −4 −3 −2 −1 0 1 2 3 4 5 60246
EXAMPLE
−6 −5 −4 −3 −2 −1 0 1 2 3 4 5 6
−0.5
0
0.5
−6 −5 −4 −3 −2 −1 0 1 2 3 4 5 6
−0.5
0
0.5
−6 −5 −4 −3 −2 −1 0 1 2 3 4 5 60
0.5
−6 −5 −4 −3 −2 −1 0 1 2 3 4 5 60
0.25
0.5
t−T (hr)
−6 −5 −4 −3 −2 −1 0 1 2 3 4 5 60246
ENSEMBLE
−6 −5 −4 −3 −2 −1 0 1 2 3 4 5 6
−0.5
0
0.5
−6 −5 −4 −3 −2 −1 0 1 2 3 4 5 6
−0.5
0
0.5
−6 −5 −4 −3 −2 −1 0 1 2 3 4 5 60
0.5
−6 −5 −4 −3 −2 −1 0 1 2 3 4 5 60
0.25
0.5
t−T (hr)
Fig. 5. (Left) Example hydrodynamics collected in the rip channel at R8 during T28 and (right) ensemble-averaged hydrodynamics for T28–T30 versus time relative to hightide (T). From top: 10-min time-averaged water depth h; cross-shore flow velocity ⟨u⟩; alongshore flow velocity ⟨v⟩; cross-shore infragravity velocity amplitude Um;ig; andrelative wave height H=h. Error bars are 71 standard deviation for the ensemble-average.
Ym (m)X
m (m
)
800 900 1000 1100 1200 1300 1400 1500 1600 1700 1800
400
500
600
700
800
900
1000
Fig. 6. Snap-shot of the hydrodynamic process signature plotted over the bar/ripmorphology for h¼1 m at R4. Bandpass-filtered velocity amplitude defined as2
ffiffiffiffiffiffisup
(where su is the variance of the velocity time series) for the cross-shoreincident Um;ss and infragravity bands Um;ig , the alongshore-directed Vm;ss and Vm;ig;the mean time-averaged cross-shore and alongshore-directed currents u; v and theresultant rip speed ⟨uv⟩. All quantities are normalised by Um;ss and the sub-plots arearranged to reflect their real-world relative positions. Negative values of ⟨u⟩ and ⟨v⟩reflect offshore- and southerly-directed flows, respectively.
M.J. Austin et al. / Continental Shelf Research 75 (2014) 28–40 33
of the infragravity-band. At R4 the alongshore-directed mean flowcomponent is important. Landwards of the bar (R1, R5 and R6) thealongshore mean flow component becomes increasingly impor-tant moving towards the rip channel, becoming the same magni-tude as Um;ss by R6. At the landward end of the rip channel (R7) thealongshore mean flow component dominates, but the cross-shoremean component and both infragravity components are impor-tant. At the rip neck (R8), the alongshore component is negligibleand the cross-shore mean component is secondary only to Um;ss.
This spatial distribution of hydrodynamic processes is indica-tive of the rip circulation measured by the drifters (Fig. 3).Incoming waves break over the inter-tidal bar, establishing analongshore current over and seaward of the crest. Landwards ofthe bar crest, the flow becomes increasingly alongshore dominatedtowards the rip channel. Due to the morphological configuration,the rip channel cuts across the surf zone at an angle beforebecoming shore-normal. This is reflected in the flows observedat R7, which were strongly oblique (large ⟨u⟩ and ⟨v⟩ components)before becoming offshore-directed at R8. The ⟨v⟩ component of theflow at R7 probably over-shoots the position of R8, resulting in thenegligible alongshore flow at R8.
While the spatial distribution of the hydrodynamic processes isquantified in Fig. 6, there is no temporal information. Theensemble average (Fig. 5) provides confidence that the hydrody-namic process signature can also be averaged over the same threetides. Therefore a temporally averaged process signature for thebar (R4), feeder (R5) and rip channel (R8) locations was computedfrom the ensemble-averaged hydrodynamics recorded over T28–T30 (Fig. 7).
The bar crest and feeder channel locations dry-out at low waterand several clear trends are evident in the data: (1) the relativeproportion of Um;ss at all locations increases towards low water,peaking at t�T ¼ �3 h, before decreasing and reaching a minimaat low water; (2) the proportion of infragravity motions Um;ig
increases steadily from o0:2 at high tide and peaks at approxi-mately t�T ¼ �1:5 h in the feeder channel; (3) strong alongshore-directed flows are recorded in the feeder channel in the periodseither side of low water from t�T ¼ �3 to �1 and 1–3 h;(4) strong offshore-directed flows in the rip channel correspondto strong alongshore-directed flows in the feeder during the sameperiod; and (5) the rip continues to flow over low water, despitethe lack of forcing from the feeder channel, suggesting an addi-tional forcing process.
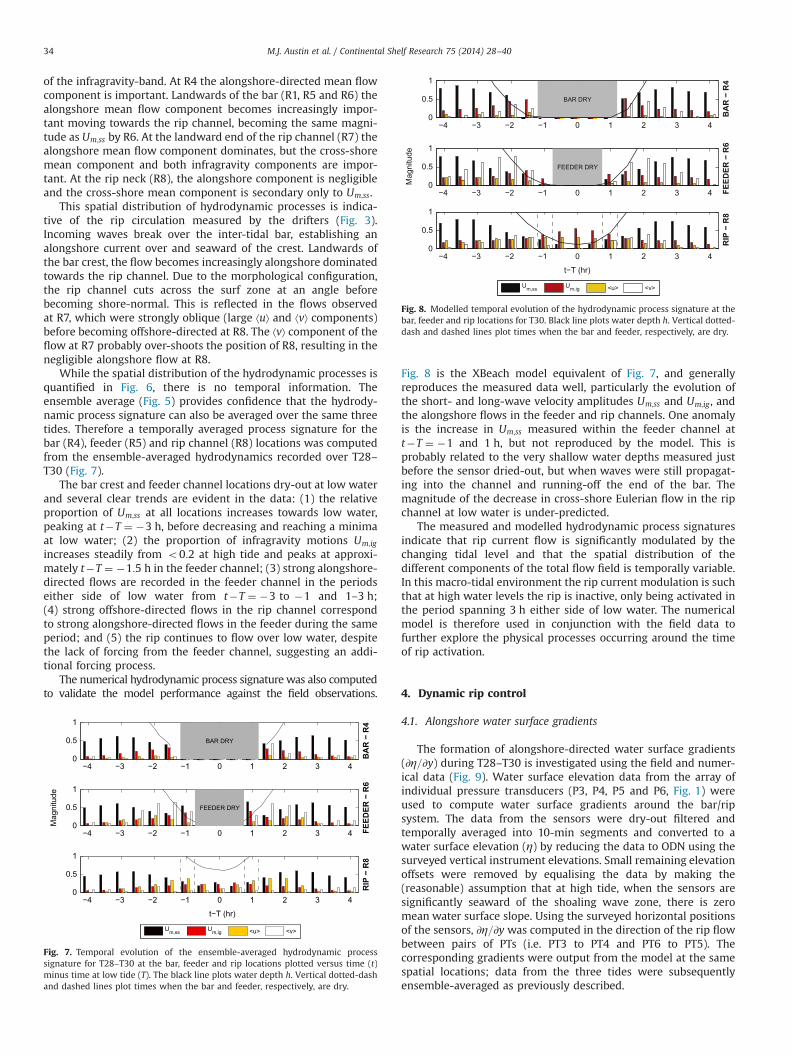
The numerical hydrodynamic process signature was also computedto validate the model performance against the field observations.
Fig. 8 is the XBeach model equivalent of Fig. 7, and generallyreproduces the measured data well, particularly the evolution ofthe short- and long-wave velocity amplitudes Um;ss and Um;ig , andthe alongshore flows in the feeder and rip channels. One anomalyis the increase in Um;ss measured within the feeder channel att�T ¼ �1 and 1 h, but not reproduced by the model. This isprobably related to the very shallow water depths measured justbefore the sensor dried-out, but when waves were still propagat-ing into the channel and running-off the end of the bar. Themagnitude of the decrease in cross-shore Eulerian flow in the ripchannel at low water is under-predicted.
The measured and modelled hydrodynamic process signaturesindicate that rip current flow is significantly modulated by thechanging tidal level and that the spatial distribution of thedifferent components of the total flow field is temporally variable.In this macro-tidal environment the rip current modulation is suchthat at high water levels the rip is inactive, only being activated inthe period spanning 3 h either side of low water. The numericalmodel is therefore used in conjunction with the field data tofurther explore the physical processes occurring around the timeof rip activation.
4. Dynamic rip control
4.1. Alongshore water surface gradients
The formation of alongshore-directed water surface gradients(∂η=∂y) during T28–T30 is investigated using the field and numer-ical data (Fig. 9). Water surface elevation data from the array ofindividual pressure transducers (P3, P4, P5 and P6, Fig. 1) wereused to compute water surface gradients around the bar/ripsystem. The data from the sensors were dry-out filtered andtemporally averaged into 10-min segments and converted to awater surface elevation (η) by reducing the data to ODN using thesurveyed vertical instrument elevations. Small remaining elevationoffsets were removed by equalising the data by making the(reasonable) assumption that at high tide, when the sensors aresignificantly seaward of the shoaling wave zone, there is zeromean water surface slope. Using the surveyed horizontal positionsof the sensors, ∂η=∂y was computed in the direction of the rip flowbetween pairs of PTs (i.e. PT3 to PT4 and PT6 to PT5). Thecorresponding gradients were output from the model at the samespatial locations; data from the three tides were subsequentlyensemble-averaged as previously described.
−4 −3 −2 −1 0 1 2 3 40
0.5
1
BAR DRY
BA
R −
R4
−4 −3 −2 −1 0 1 2 3 40
0.5
1
Mag
nitu
de
FEED
ER −
R6
FEEDER DRY
−4 −3 −2 −1 0 1 2 3 40
0.5
1
t−T (hr)
RIP
− R
8
Fig. 7. Temporal evolution of the ensemble-averaged hydrodynamic processsignature for T28–T30 at the bar, feeder and rip locations plotted versus time (t)minus time at low tide (T). The black line plots water depth h. Vertical dotted-dashand dashed lines plot times when the bar and feeder, respectively, are dry.
−4 −3 −2 −1 0 1 2 3 40
0.5
1
BAR DRY
BA
R −
R4
−4 −3 −2 −1 0 1 2 3 40
0.5
1
FEED
ER −
R6
FEEDER DRY
−4 −3 −2 −1 0 1 2 3 40
0.5
1
RIP
− R
8
t−T (hr)
Mag
nitu
de
Fig. 8. Modelled temporal evolution of the hydrodynamic process signature at thebar, feeder and rip locations for T30. Black line plots water depth h. Vertical dotted-dash and dashed lines plot times when the bar and feeder, respectively, are dry.
M.J. Austin et al. / Continental Shelf Research 75 (2014) 28–4034

First, the measured and modelled water depths h were com-pared for PT3 and PT5, with the measured water depths being wellreproduced by the model. The water surface elevation difference(∂η, not shown) between the horizontally separated PT's is 2–5 cmaround 2 h before low water, increasing to 7–15 cm in theshallowest depths. The measured alongshore water surface gradients(∂η=∂y) are generally well reproduced by the model, particularly with
respect to their trends, although the amplitudes around low waterare slightly over-predicted by the model. There are two key pointsworth noting. First, during low tidal levels, when wave breaking istransitioning between inter- and sub-tidal bars, the predicted ∂η=∂yincreases at a slightly faster rate than the measured values; thecurves re-converge around low water. This is probably due to themodel not exactly reproducing the spatial and temporal transition ofwave dissipation between the inter- and sub-tidal bars. Secondly, inthe measured data, ∂η=∂y for PT6–PT5 reverses for � 60�min at thebeginning of the flood tide, which the model does not reproduce.
The measured and modelled water surface gradients arecompared to the flow speed ⟨uv⟩ at three locations on the beach-face (R5, R7 and R8; Fig. 10). The flow speed, rather than the ⟨u⟩and ⟨v⟩ velocity components, is used to minimise any errorsintroduced by the model not exactly reproducing the rip flowcirculation pattern. There is a linear increase in the flow speed forgradients ∂η=∂yr0:5� 10�3, above which the speeds remainroughly constant (R8 and R5) or progressively decrease (R7).
4.2. Spatial evolution of alongshore gradients
Fig. 11 details the spatial evolution of the modelled alongshore-directed water surface gradient at two intervals during the fallingtide of a tidal half-cycle and shows the pattern of wave breakingand the resultant flow field. At t�T ¼ �2, spatially variable wavebreaking occurs over the bar/rip system and the proportion ofbreaking waves is clearly reduced over the rip feeder channels. Thestrong dissipation over the inter-tidal bar crest forces strong flowsalong the feeder channels, which are reflected in the flow field bywide oblique currents. These diverge from the landward trough ofthe inter-tidal bar and flow alongshore from the southerly feeder,and offshore to the crescentic sub-tidal bar from the northernfeeder.
0 2 4 6
x 10−3 x 10−3
0
0.2
0.4
0.6
0.8
∂η/∂y ∂η/∂y
x 10−3 x 10⁻³∂η/∂y ∂η/∂y
<uv>
∂η/∂y PT3 − PT4
R8R7R5
0 2 4 60
0.2
0.4
0.6
0.8M
EASU
RED
∂η/∂y PT6 − PT5
0 2 4 60
0.2
0.4
0.6
0.8
<uv>
R8R7R5
0 2 4 60
0.2
0.4
0.6
0.8
MO
DEL
LED
Fig. 10. Temporally averaged flow speed at R5, R7 and R8 as a function of ∂η=∂y in the feeder channel (left) and at the bar end (right). (Top) Measured data along the feederchannel (a) and at the end of the inter-tidal bar (b); (bottom) modelled data from the feeder (c) and bar (d). Solid black lines are a guide to interpretation.
−6 −5 −4 −3 −2 −1 0 1 2 3 4 5 6−2
0
2
4
6
8x 10⁻³
∂η/∂
y (−
) | h
(m)
t−T (hr)
PT3
− PT
4
−6 −5 −4 −3 −2 −1 0 1 2 3 4 5 6−2
0
2
4
6
8x 10⁻³
∂η/∂
y (−
) | h
(m)
t−T (hr)
PT5
− PT
6
Fig. 9. Ensemble-averaged measured and modelled water surface gradient anddepth between PT pairs. (a) Measured (- -) and modelled (þ) water depth h (/103),and measured (○) and modelled (□) alongshore water surface gradient ∂η=∂y forPT3–PT4 in the feeder channel. (b) Same as (a) for PT6–PT5 located at the southernend of the inter-tidal bar.
M.J. Austin et al. / Continental Shelf Research 75 (2014) 28–40 35

Around low water (t�T ¼ 0), waves break across the sub-tidalbar and the seaward slope of the inter-tidal bar and leave isolatedregions with no wave breaking in the centre of the surf zone.Maximum alongshore-directed water surface gradients of the oppo-site sign exist at the ends of the inter-tidal bar and the maximumoffshore-directed rip current velocity is located between and slightlyseaward of these maxima. Current velocities over the whole surfzone region are reduced, but the rip current is now a narrow jet,flowing offshore normal to the shoreline, before rotating to the northand feeding the larger-scale circulation over the sub-tidal bar that isexiting the surf zone, as observed in Fig. 3.
4.3. Alongshore non-uniformity
The alongshore non-uniformity of Qb around the low tideperiod appears to force the rip current via the highly localised∂η=∂y around the ends of the bars when the feeder channels are
dry and there is no mass flux over the inter-tidal bar. Fig. 12a plotsthe temporal evolution of ∂η=∂y along transect A–A, which passesthrough the R8 position (see Fig. 1). Before wave breaking occursacross the nearshore (t�T ¼ �5 h), ∂η=∂y is negligible and ripcurrent speeds are low. Mean offshore-directed flows (Fig. 12b)begin to increase at t�T ¼ �3 h, when Qb begins to increase overthe inter-tidal bars and as set-up gradients are being established.At t�T ¼ �2 h, Qb starts decreasing over the rip channelsand wave breaking primarily occurs over the bar crests (andmoves offshore to the sub-tidal bar). Rip flow velocity increases,but the flow is widely distributed over a 200 m wide alongshoreregion.
Between t�T ¼ �2 and t�T ¼ �1, a positive (southwardacting) ∂η=∂y is established on the northern side of the rip channel(Ym ¼ 1200 m). This corresponds to the time when ⟨u⟩ increasessignificantly, the rip speed ⟨uv⟩ is maximised and the currentbecomes increasingly channelised. This positive ∂η=∂y therefore
Fig. 11. (a) Modelled 10-min mean alongshore-directed water surface gradient ∂η=∂y at two output times: t�T ¼ �2; and at low water t�T ¼ 0. Hot colours indicate a slopetowards the south (left) and cold towards the north (right). Over the region of the rip channel, indicated by the black box, the maxima and minima of the water surface slopeare indicated by the black squares and the maximum offshore-directed flow velocity by the green dot; (b) Qb, where darker shading indicates a greater proportion ofbreaking waves; (c) modelled current speed ⟨uv⟩, where darker colours indicate faster speeds; and (d) quiver plot of rip circulation for each output time. (For interpretation ofthe references to colour in this figure caption, the reader is referred to the web version of this paper.)
M.J. Austin et al. / Continental Shelf Research 75 (2014) 28–4036
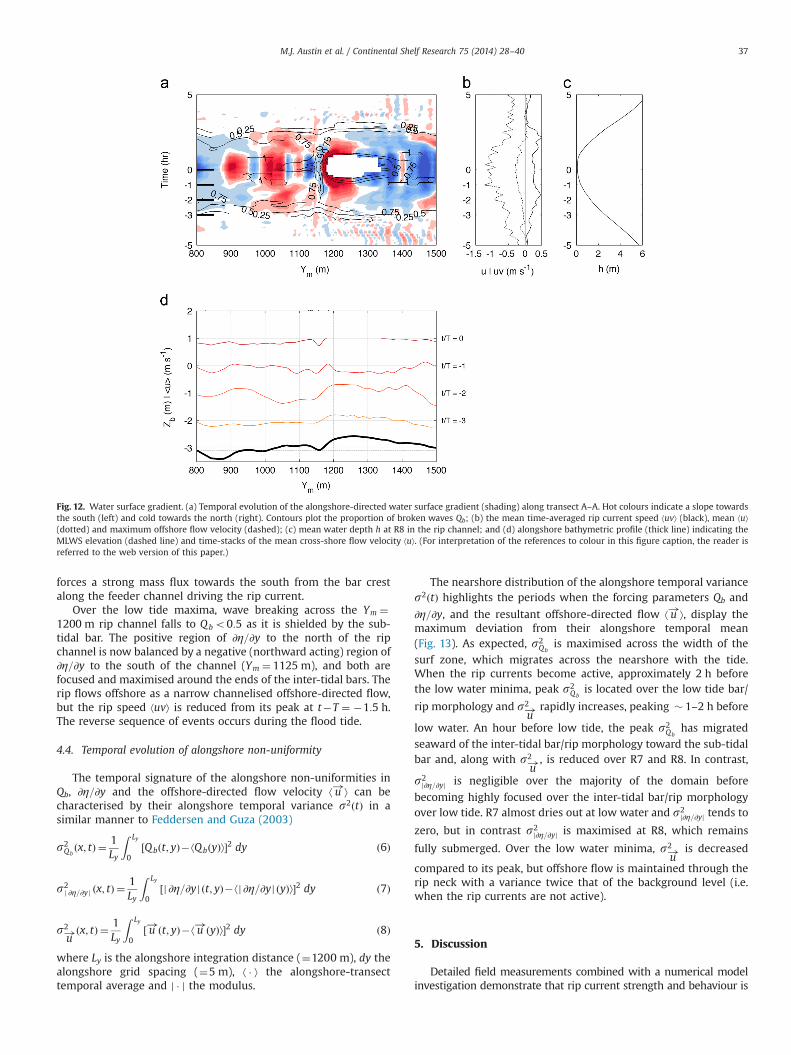
forces a strong mass flux towards the south from the bar crestalong the feeder channel driving the rip current.
Over the low tide maxima, wave breaking across the Ym ¼1200 m rip channel falls to Qbo0:5 as it is shielded by the sub-tidal bar. The positive region of ∂η=∂y to the north of the ripchannel is now balanced by a negative (northward acting) region of∂η=∂y to the south of the channel (Ym ¼ 1125 m), and both arefocused and maximised around the ends of the inter-tidal bars. Therip flows offshore as a narrow channelised offshore-directed flow,but the rip speed ⟨uv⟩ is reduced from its peak at t�T ¼ �1:5 h.The reverse sequence of events occurs during the flood tide.
4.4. Temporal evolution of alongshore non-uniformity
The temporal signature of the alongshore non-uniformities inQb, ∂η=∂y and the offshore-directed flow velocity ⟨ u!⟩ can becharacterised by their alongshore temporal variance s2ðtÞ in asimilar manner to Feddersen and Guza (2003)
s2Qbðx; tÞ ¼ 1
Ly
Z Ly
0½Qbðt; yÞ� ⟨QbðyÞ⟩�2 dy ð6Þ
s2j ∂η=∂yj ðx; tÞ ¼
1Ly
Z Ly
0½j ∂η=∂yj ðt; yÞ� ⟨j ∂η=∂yj ðyÞ⟩�2 dy ð7Þ
s2
u!ðx; tÞ ¼ 1Ly
Z Ly
0½ u!ðt; yÞ�⟨ u!ðyÞ⟩�2 dy ð8Þ
where Ly is the alongshore integration distance (¼1200 m), dy thealongshore grid spacing (¼5 m), ⟨ � ⟩ the alongshore-transecttemporal average and j � j the modulus.
The nearshore distribution of the alongshore temporal variances2ðtÞ highlights the periods when the forcing parameters Qb and
∂η=∂y, and the resultant offshore-directed flow ⟨ u!⟩, display themaximum deviation from their alongshore temporal mean(Fig. 13). As expected, s2
Qbis maximised across the width of the
surf zone, which migrates across the nearshore with the tide.When the rip currents become active, approximately 2 h beforethe low water minima, peak s2
Qbis located over the low tide bar/
rip morphology and s2
u! rapidly increases, peaking � 1–2 h before
low water. An hour before low tide, the peak s2Qb
has migratedseaward of the inter-tidal bar/rip morphology toward the sub-tidalbar and, along with s2
u!, is reduced over R7 and R8. In contrast,
s2j∂η=∂yj is negligible over the majority of the domain before
becoming highly focused over the inter-tidal bar/rip morphologyover low tide. R7 almost dries out at low water and s2
j∂η=∂yj tends to
zero, but in contrast s2j∂η=∂yj is maximised at R8, which remains
fully submerged. Over the low water minima, s2
u! is decreased
compared to its peak, but offshore flow is maintained through therip neck with a variance twice that of the background level (i.e.when the rip currents are not active).
5. Discussion
Detailed field measurements combined with a numerical modelinvestigation demonstrate that rip current strength and behaviour is
Fig. 12. Water surface gradient. (a) Temporal evolution of the alongshore-directed water surface gradient (shading) along transect A–A. Hot colours indicate a slope towardsthe south (left) and cold towards the north (right). Contours plot the proportion of broken waves Qb; (b) the mean time-averaged rip current speed ⟨uv⟩ (black), mean ⟨u⟩(dotted) and maximum offshore flow velocity (dashed); (c) mean water depth h at R8 in the rip channel; and (d) alongshore bathymetric profile (thick line) indicating theMLWS elevation (dashed line) and time-stacks of the mean cross-shore flow velocity ⟨u⟩. (For interpretation of the references to colour in this figure caption, the reader isreferred to the web version of this paper.)
M.J. Austin et al. / Continental Shelf Research 75 (2014) 28–40 37

modulated at the semi-diurnal frequency by tide-induced changes inthe water level over complex inter- and sub-tidal bar/rip morphol-ogy. Three spring low tide cycles when the wave forcing remainedapproximately constant were analysed, leaving the tide as the mainvariable factor. In common with other recent observations in similarmacro-tidal environments (Bruneau et al., 2009; Austin et al., 2010)rip current flows are maximised around, but not at, low water. Athigher tidal elevations, the nearshore is dominated by meanderingalongshore-directed currents and bed-return flow.
The mean circulation around the rip system remained fairlyconsistent with the generally accepted ideas of rip current forcingby radiation stress and pressure gradients (i.e. Bowen and Inman,1969; Sonu, 1972; MacMahan et al., 2006). The hydrodynamicprocess signature (Wright and Short, 1984) demonstrates weakonshore flows over the inter-tidal bar crest, which rotate alongshoreand strengthen before flowing offshore through the oblique ripchannel. Although the rip speeds are high throughout the ripchannel, its oblique nature results in a strong alongshore componentat the landward end, which becomes more offshore-directed at therip neck. It also highlights the increased contribution of infragravity-frequency motions in the feeder channel landwards of the bar crestas the incident motions are dissipated. The temporal evolution of theprocess signature clearly highlights that first the bar crest and thenthe feeder channel locations are emergent and dry-out over lowwater. However, although the rip speeds decrease as the forcing fromthe bar/feeder tends to zero, a significant mean seaward-directedflow persists through the rip channel.
Measured and modelled flow velocities are positively corre-lated with the alongshore-directed water surface gradients (∂η=∂y)with stronger flows generally observed for larger gradients. Watersurface gradients recorded along the feeder channel and at the endof the inter-tidal bar are intensified around low water. Overall,examining the combined flow speed ⟨uv⟩ and thus removing thedirectionality of the resolved ⟨u⟩ and ⟨v⟩ components, the datascale well with ∂η=∂y. However, there is a significant inflection inthe curves for ∂η=∂y≳0:5� 10�3, which corresponds with the timeof maximum wave dissipation over the bar/rip region and stron-gest rip speeds ⟨uv⟩, observed � 1:5 h before low water.
The drying of the bar-crest/feeder regions, inflection in thegradient-velocity curves and the slight decrease in observed flowvelocities for the peak gradients observed at low water suggest thatthere is more than one factor forcing the rip currents and that thebalance between them changes approaching low tide. Model outputsof ∂η=∂y and Qb over the entire domain at two key time stepsapproaching low water (Fig. 11) demonstrate an decrease in Qb overthe inter-tidal bar and feeder regions in the period t�T ¼ �2 to �1.At the same time there is a coincident increase in ∂η=∂y, stronglyfocused around the ends of the bar (along the sides of the rip channel)and the currents within the rip channel rotate offshore flowing normalto the plane between the maxima and the minima of ∂η=∂y. This isclearly demonstrated in Fig. 14, which plots ⟨uv⟩ in the rip channel inQb–∂η=∂y parameter space, showing that ⟨uv⟩ and ∂η=∂y are low untilQb exceeds � 0:75. ∂η=∂y increases rapidly once Qb≳0:9 and ⟨uv⟩ isapproximately maintained, but then as ∂η=∂y is maximised there isclear hysteresis and Qb rapidly tends to zero and ⟨uv⟩ is reduced.
Examining ∂η=∂y over the alongshore transect through the ripchannel (Fig. 12) clearly shows the development of the alongshore
Fig. 13. Temporal alongshore non-uniformity s2. (a) Temporal signature of s2Qb, (b) s2
j∂η=∂yj and (c) s2
⟨ u!⟩. The dash and dotted-dash lines indicate the cross-shore position of
the rip channel rigs R7 and R8, respectively. (d–e) Evolution of s2Qb, s2
j∂η=∂yj and s2
⟨ u!⟩at R8 (black) and R7 (red dash). (For interpretation of the references to colour in this
figure caption, the reader is referred to the web version of this paper.)
0 0.25 0.5 0.75 10
1
2
3
4
5
6x 10⁻³
Qb,PT6
dh/d
y P
T6−P
T5
<uv>
(m s
−1)
0
0.1
0.2
0.3
0.4
0.5
Fig. 14. Scatter plot of modelled rip speed at R8 in Qb;PT6 and j∂η=∂yjPT6�PT5
parameter space. Darker shading represents greater flow speed.
M.J. Austin et al. / Continental Shelf Research 75 (2014) 28–4038

gradients and the link with Qb. When wave breaking over the bar/ripis minimal ∂η=∂y is small, but as Qb increases so does ∂η=∂y. Initially astrong positive (southward acting) gradient forms, which is notbalanced by an equivalent negative gradient and a broad rip currentflows to the south. This is probably the result of the morphologicaldominance of the northerly feeder channel and its pressure-drivencurrent. Moving towards low water, the bar becomes increasinglyemergent and the forcing from the feeder decreases as it dries-out,but the local alongshore gradients around the bar ends intensify. Theopposing positive and negative gradients now almost balance andthe rip current becomes focussed into the centre of the rip channeland offshore flow is maintained, albeit at a reduced speed. Thetemporal alongshore non-uniformities show similar behaviour.
Previous field data from micro- (Brander, 1999) and meso-tidal(Brander and Short, 2000; Bruneau et al., 2011) environments alsoappear to indicate the occurrence of peak rip flow immediately eitherside of low water, rather than at low water; these observations werenot stressed at the time. Brander (1999) states the underlyinghypothesis that rip flow is maximised when the morphologicalexpression of the rip channel is also maximised, as it is at low water.However, these previous observations, together with those of Austinet al. (2010) and the present work, suggest that whilst maximisingthe expression of the channel morphology does increase rip flowspeed, at the low water minimum the forcing is reduced to such anextent that the flow decreases.
At low water, the rip channel becomes morphologically isolatedfrom the feeder channels. The minimal wave dissipation across therip, combined with the continued wave breaking along the edge ofthe rip channel, indicates an increase in local set-up (∂η=∂y) at thebar ends, forcing water to drain into the rip channel; this supportsthe previous field observations (Brander, 1999; Austin et al., 2010;Bruneau et al., 2011). The weakening of the flow directly aroundlow water may be linked to two factors: (1) the limited spatialextent of ∂η=∂y around the ends of the bar; and (2) to a change inthe balance of the alongshore pressure gradient force generated atthe ends of the bars and the opposing radiation stress gradient inthe rip channel forced by relatively larger waves (Haller et al.,2002), that have reformed while propagating up the rip channelafter initially breaking over the sub-tidal bar.
An interesting alternative explanation for the spatially confinedrip flow at low water is the generation of vorticity by short-crestedbreaking waves along the terminal ends of the bars (Clark et al.,2012). Opposing left- and right-breaking waves along the sides ofthe rip channel form counter-rotating vortices that maintain therip flow around low water; the spatially constrained dissipationlimits the vorticity generation and hence the flow speed.
6. Conclusions
Water-level controls on macro-tidal rip current dynamics wereinvestigated through field measurements and numerical model-ling. Field data, spanning a range of wave and tide conditions,demonstrate that rip current strength and behaviour is modulatedat the semi-diurnal frequency by tide-induced changes in thewater-level over bar/rip morphology. Peak flow speeds ⟨uv⟩ wereobserved in the rip neck 1.5 h before and after low water,corresponding to the time when wave dissipation was maximisedover the bar/feeder region. When the inter-tidal bar and feederwere dry around low water, rip flow was maintained, but ⟨uv⟩ wasreduced.
The development of alongshore-directed water surface gradi-ents ∂η=∂y along the feeder channel and at the bar ends wasobserved from � 4 h before low water; ∂η=∂y was maximisedapproximately 1.5 h before low water. A positive correlationbetween ∂η=∂y and ⟨uv⟩ was observed, which appears to
correspond to the time of maximum wave-breaking over thebar/rip region; above this value, ⟨uv⟩ remains constant ordecreases.
The numerical model was able to reproduce ∂η=∂y with a goodlevel of skill and demonstrated a dependence of ∂η=∂y and ⟨uv⟩ onthe proportion of breaking waves Qb. Spatially, across the bar/ripregion, once QbZ0:75, ∂η=∂y, ⟨uv⟩ increased; however, peak ∂η=∂ywas observed when Qb decreased as wave breaking moved off-shore to the sub-tidal bar approximately 1-hour before low water.
The reduction in Qb over the bar and feeder regions decreasedthe pressure-driven feeder current, but offshore flow through therip channel was maintained by a localised intensification of ∂η=∂yaround the ends of the inter-tidal bar. Around low water, the peaktemporal alongshore non-uniformity of Qb is located over the sub-tidal bar, whereas ∂η=∂y is maximised over the rip channelmaintaining offshore flow through the rip channel. Future fieldand numerical studies of ∂η=∂y over a more spatially dense arraywill be crucial to further improve our understanding of ripcirculation in very shallow waters, the exchange between inter-and sub-tidal bar rips and to investigate the potential role of short-crested breaking wave vorticity.
Acknowledgements
We would like to thank our excellent field and technical team:Peter Ganderton, Anthony Thorpe, Claire Earlie, Ellie Woodward,Tim Poate, Robert McCall, Megan Sheriden, Ivan Burton, RichardKenyon, Pedro Almeida, Hanna Richardson, Jak McCarroll, KitStokes, Barbara Proenca, Joana van Nieuwkoop, Ruth Stafford, MattHilton, Bruno Castelle, Nicolas Bruneau, Dano Roelvink, Ap vanDongeren, Leo Sembiring, Jack Puleo, Mark Davidson, Iain Fairley,Fran Sieck, Emily Beaumont and Jon Miles. We would also like tothank the RNLI, and in particular Dickon Berriman, for theirassistance at Perranporth. Phil Maynard from the PerranporthYHA is also thanked for his ongoing assistance. This researchwas funded by the NERC-RNLI partnership grant NE/H004262/1,Dynamics of Rip Currents and Implications for Beach Safety. Wealso acknowledge the constructive comments made by severalreviewers.
References
Austin, M.J., Scott, T.M., Brown, J.W., Brown, J.A., MacMahan, J.H., Masselink, G.,Russell, P.E., 2010. Temporal observations of rip current circulation on a macro-tidal beach. Cont. Shelf Res. 30 (9), 1149–1165.
Austin, M.J., Scott, T.M., Russell, P.E., Masselink, G., 2013. Rip current prediction:development, validation and evaluation of an operational tool. J. Coast. Res. 29(2), 283–300.
Bowen, A.J., 1969. Rip currents, 1. Theoretical investigations. J. Geophys. Res. 74,5467–5478.
Bowen, A.J., Inman, D., 1969. Rip currents, 2. Laboratory and field observations.J. Geophys. Res. 74 (23), 5479–5490.
Brander, R.W., 1999. Field observations on the morphodynamic evolution of a low-energy rip current system. Mar. Geol. 157 (3–4), 199–217.
Brander, R.W., Short, A.D., 2000. Morphodynamics of a large-scale rip currentsystem at Muriwai Beach, New Zealand. Mar. Geol. 165 (1–4), 27–39.
Bruneau, N., Bonneton, P., Castelle, B., Pedreros, R., 2011. Modeling rip currentcirculations and vorticity in a high-energy mesotidal–macrotidal environment.J. Geophys. Res. 116 (July (C7)), 1–17.
Bruneau, N., Castelle, B., Bonneton, P., Pedreros, R., Almar, R., Bonneton, N., Bretel, P.,Parisot, J.-P., Sénéchal, N., 2009. Field observations of an evolving rip current ona meso-macrotidal well-developed inner bar and rip morphology. Cont. ShelfRes. 29, 1650–1662.
Castelle, B., Bonneton, P., Senechal, N., Dupuis, H., Butel, R., Michel, D., 2006.Dynamics of wave-induced currents over an alongshore non-uniform multiple-barred sandy beach on the Aquitanian Coast, France. Cont. Shelf Res. 26(January (1)), 113–131.
Clark, D.B., Elgar, S., Raubenheimer, B., 2012. Vorticity generation by short-crested wavebreaking. Geophys. Res. Lett. 39 (24), http://dx.doi.org/10.1029/2012GL054034.
Daly, C., Roelvink, J.A., van Dongeren, A., van Thiel de Vires, J., McCall, R.T., 2012.Validation of an advective-deterministic approach to short wave breaking in asurf beat model. Coast. Eng. 60, 69–83.
M.J. Austin et al. / Continental Shelf Research 75 (2014) 28–40 39

Deigaard, R., 1993. A note on the three dimensional shear stress distribution in asurf zone. J. Coast. Res. 20, 157–171.
Feddersen, F., Guza, R.T., 2003. Observations of nearshore circulation: alongshoreuniformity. J. Geophys. Res. 108 (C1), http://dx.doi.org/10.1029/2001JC001293.
Haas, K., Svendesen, I.A., Haller, M.C., Zhao, Q., 2003. Quasi-three-dimensionalmodeling of rip current systems. J. Geophys. Res. 108 (C7), 3217, http://dx.doi.org/10.1029/2002JC001355.
Haller, M., Dalrymple, R., 2001. Rip current instabilities. J. Fluid Mech. 433, 161–192.Haller, M., Dalrymple, R., Svendesen, I., 2002. Experimental study of nearshore
dynamics on a barred beach with rip channels. J. Geophys. Res. 107 (14), 1–21.MacMahan, J., Thornton, E., Reniers, A.J.H.M., 2006. Rip current review. Coast. Eng.
53 (2–3), 191–208.MacMahan, J.H., Brown, J., Thornton, E.B., 2009. Low-cost hand-held global
positioning system for measuring surf zone currents. J. Coast. Res. 25 (3),744–754.
MacMahan, J.H., Reniers, A., Thornton, E.B., Stanton, T.P., 2004. Infragravity ripcurrent pulsations. J. Geophys. Res. 109 (C01033), http://dx.doi.org/10.1029/2003JC002068.
MacMahan, J.H., Thornton, E.B., Reniers, A.J.H.M., Stanton, T.P., Symonds, G., 2008.Rip currents induced by small bathymetric variations. Mar. Geol. 255 (3–4),156–164.
Masselink, G., Short, A.D., 1993. The effect of tide range on beach morphodynamicsand morphology. J. Coast. Res. 9, 785–800.
McKenzie, P., 1958. Rip-current systems. J. Geol. 66 (2), 103–113.Nielsen, P., Brander, R.W., Hughes, M.G., 2001. Rip currents: observations of
hydraulic gradients, friction factors and wave pump efficiency. In: Hanson, H.,Larson, M. (Eds.), Coastal Dynamics '01. ASCE, Lund, Sweden, pp. 483–492.
Plant, N.G., Holland, K., Puleo, J.A., 2002. Analysis of the scale of errors in nearshorebathymetric data. Mar. Geol. 191 (November (1–2)), 71–86.
Reniers, A.J.H.M., MacMahan, J.H., Thornton, E.B., Stanton, T.P., 2006. Modellinginfragravity motions on a rip-channel beach. Coast. Eng. 53 (2–3), 209–222.
Roelvink, D., Reniers, A., van Dongeren, A., van Thiel de Vries, J., McCall, R.,Lescinski, J., 2009. Modelling storm impacts on beaches, dunes and barrierislands. Coast. Eng. 56 (November (11–12)), 1133–1152.
Schmit, W.B., Woodward, K., Millikan, R., Guza, R.T., Raubenheimer, B., Elgar, S.,2003. A GPS-tracked surf zone drifter. J. Atmos. Ocean Technol. 20, 1069–1075.
Scott, T.M., Masselink, G., Russell, P.E., 2011. Morphodynamic characteristics andclassification of beaches in England and Wales. Mar. Geol. 286, 1–20.
Sonu, C.J., 1972. Field observation on nearshore circulation and meanderingcurrents. J. Geophys. Res. 77, 3232–3247.
Spydell, M., Feddersen, F., Guza, R.T., Schmit, W.E., 2007. Observing surf-zonedispersion with drifters. J. Phys. Oceanogr. 37 (12), 2920–2939.
Wright, L.D., Short, A.D., 1984. Morphodynamic variability of surf zones andbeaches: a synthesis. Mar. Geol. 56, 93–118.
Yu, J., Slinn, D.N., 2003. Effects of wave–current interaction on rip currents.J. Geophys. Res. 108, 3088, http://dx.doi.org/10.1029/2001JC001105.
M.J. Austin et al. / Continental Shelf Research 75 (2014) 28–4040