contingency analysis enhancements - utilicast · 2019-08-19 · contingency analysis enhancements...
TRANSCRIPT

Contingency Analysis Enhancements
Kiamran Radjabli Utilicast, San Diego, USA
Email: [email protected]
Abstract— Contingency Analysis can provide a powerful insight into potential operational emergencies if the real-time analysis is extended into near future. Predictive look-ahead analysis can take advantage of forecasted loads and generation, scheduled outages, and transmission dynamic ratings based on a weather forecast. This paper proposes to use simple estimate of outage probability in the predictive contingency analysis. In real time, the probability of outage is estimated using line loading and extreme weather conditions factor. For evaluation of each contingency, risk index presented as a product of severity and the contingency’s normalized probability. Monitoring of projected near-term risks provides enhanced assessment of the contingency trends developing in the network. The look-ahead analysis becomes even more vital in case of quickly changing adverse weather conditions. It is proposed to perform “(N-X)” contingency analysis on high intensity storm area and tracking risk index for all contingencies.
Index Terms—contingency, visualization, adverse weather, look-ahead analysis, outage probability, predictive study, risk index, severity, trending, situational awareness, storm analysis.
I. INTRODUCTION
Contingency Analysis (CA) is performed on the network model to determine violations of steady-state operating limits in case of contingency occurrence. Usually, real-time Contingency Analysis (RTCA) is based on running “(N-1)” outage analysis using the power flow base case obtained from State Estimator (SE) solution. However, the available power system real-time and forecast data provide an opportunity to carry out a more comprehensive look-ahead study in order to enhance the situational awareness of operators. The paper presents several different directions of RTCA development that can better prepare operators for the fast developing emergencies in the power system. The paper proposes to execute a predictive real-time analysis and estimate contingency probability in order to assess risks of contingency occurrence. For inclement weather conditions, the near-future assessment includes a more complex “(N-X)” outage analysis for the high intensity area, where N is the total number of network elements, and X is the number of simultaneously outaged elements.
Manuscript received April 15, 2015. Kiamran Radjabli.
II. LOOK-AHEAD CONTINGENCY ANALYSIS
Traditional RTCA uses the real-time estimated solution with an assumption that at the time of studied outages, the pre-contingency state and the load in the power network are going to stay the same. In reality, the network state, loads, and generation always change in the large power system depending on the hour of the day, and in case of inclement weather conditions, the pre-contingency state of the power system may change significantly. Some market operators and reliability coordinators carry out 24-hour ahead offline studies to prepare for the next day market. However, the real-time analysis is performed only on a single real-time point. It can be useful for operations to enhance the real-time horizon and perform multi time point near future studies in real-time. It is possible to extrapolate the state of power network in near future using load forecast, interchange schedules, and generation forecast information or electricity market target. The scheduled outages are transferred into the look-ahead study to ensure that the correct topology is used in the predictive analysis. Historical tracking and predictive monitoring of high severity contingencies provide an assessment of both the current state and electrical problems as they develop in the power network.
The short-term individual generation forecasts can be estimated from unit commitment or obtained from market operators. The Short Term Load Forecast provides calculations of hourly forecast for area load based on the weather, usually with 1-2% accuracy. The load forecast for each station can be obtained based on the load area forecast distributed among the individual stations. The distribution factors for individual loads can be calculated using their historical values compared to the area load values. Conforming loads consist of constant and variable components. The latter one is calculated as individual load’s participation factor in the total area load changes. Non-conforming loads stay unchanged.
A simplified functional diagram is shown on the Fig.1 for a “30-min” look-ahead RTCA. At the beginning, the “30-min base case” needs to be established. Area Load Forecast for the next 30 minutes is distributed to the station
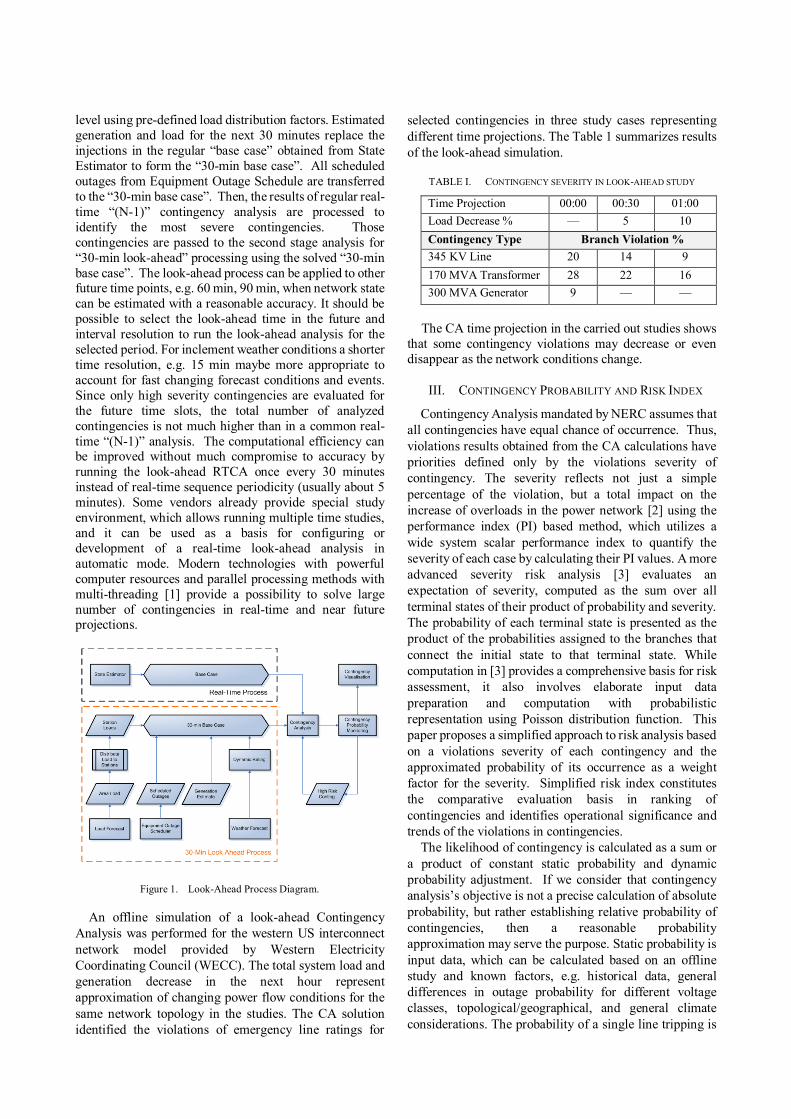
level using pre-defined load distribution factors. Estimated generation and load for the next 30 minutes replace the injections in the regular “base case” obtained from State Estimator to form the “30-min base case”. All scheduled outages from Equipment Outage Schedule are transferred to the “30-min base case”. Then, the results of regular real-time “(N-1)” contingency analysis are processed to identify the most severe contingencies. Those contingencies are passed to the second stage analysis for “30-min look-ahead” processing using the solved “30-min base case”. The look-ahead process can be applied to other future time points, e.g. 60 min, 90 min, when network state can be estimated with a reasonable accuracy. It should be possible to select the look-ahead time in the future and interval resolution to run the look-ahead analysis for the selected period. For inclement weather conditions a shorter time resolution, e.g. 15 min maybe more appropriate to account for fast changing forecast conditions and events. Since only high severity contingencies are evaluated for the future time slots, the total number of analyzed contingencies is not much higher than in a common real-time “(N-1)” analysis. The computational efficiency can be improved without much compromise to accuracy by running the look-ahead RTCA once every 30 minutes instead of real-time sequence periodicity (usually about 5 minutes). Some vendors already provide special study environment, which allows running multiple time studies, and it can be used as a basis for configuring or development of a real-time look-ahead analysis in automatic mode. Modern technologies with powerful computer resources and parallel processing methods with multi-threading [1] provide a possibility to solve large number of contingencies in real-time and near future projections.
Figure 1. Look-Ahead Process Diagram.
An offline simulation of a look-ahead Contingency Analysis was performed for the western US interconnect network model provided by Western Electricity Coordinating Council (WECC). The total system load and generation decrease in the next hour represent approximation of changing power flow conditions for the same network topology in the studies. The CA solution identified the violations of emergency line ratings for
selected contingencies in three study cases representing different time projections. The Table 1 summarizes results of the look-ahead simulation.
TABLE I. CONTINGENCY SEVERITY IN LOOK-AHEAD STUDY
Time Projection 00:00 00:30 01:00 Load Decrease % — 5 10 Contingency Type Branch Violation % 345 KV Line 20 14 9 170 MVA Transformer 28 22 16 300 MVA Generator 9 — —
The CA time projection in the carried out studies shows
that some contingency violations may decrease or even disappear as the network conditions change.
III. CONTINGENCY PROBABILITY AND RISK INDEX
Contingency Analysis mandated by NERC assumes that all contingencies have equal chance of occurrence. Thus, violations results obtained from the CA calculations have priorities defined only by the violations severity of contingency. The severity reflects not just a simple percentage of the violation, but a total impact on the increase of overloads in the power network [2] using the performance index (PI) based method, which utilizes a wide system scalar performance index to quantify the severity of each case by calculating their PI values. A more advanced severity risk analysis [3] evaluates an expectation of severity, computed as the sum over all terminal states of their product of probability and severity. The probability of each terminal state is presented as the product of the probabilities assigned to the branches that connect the initial state to that terminal state. While computation in [3] provides a comprehensive basis for risk assessment, it also involves elaborate input data preparation and computation with probabilistic representation using Poisson distribution function. This paper proposes a simplified approach to risk analysis based on a violations severity of each contingency and the approximated probability of its occurrence as a weight factor for the severity. Simplified risk index constitutes the comparative evaluation basis in ranking of contingencies and identifies operational significance and trends of the violations in contingencies.
The likelihood of contingency is calculated as a sum or a product of constant static probability and dynamic probability adjustment. If we consider that contingency analysis’s objective is not a precise calculation of absolute probability, but rather establishing relative probability of contingencies, then a reasonable probability approximation may serve the purpose. Static probability is input data, which can be calculated based on an offline study and known factors, e.g. historical data, general differences in outage probability for different voltage classes, topological/geographical, and general climate considerations. The probability of a single line tripping is
caused by unusual events: lighting, storms, or line touching vegetation, etc., and therefore, is modeled with statistical data on line outages. Typically, such probabilities of outages for a single line or transformer are in the range of 0.001 to 0.02 for long transmission lines under normal weather conditions [4], where high voltage class equipment usually has lower outage probability. Dynamic probability adjustment can be a value calculated online from the real-time conditions, which include MVA loading stress/overload on the outage line, proximity to a forced outage for the current connectivity. During inclement weather conditions like storms and hurricanes, it is reasonable to consider adverse weather elements to increase outage probability. The weather elements that are considered to be adverse weather conditions are lightning, wind, precipitation, and the statistics of their effects on outage probability has been accumulated in the industry [5]. Transmission owners in the USA are required to report transmission line outage data to NERC’s Transmission Availability Data System (TADS). The State of Reliability NERC 2014 report indicates that the highest TADS event average probabilities are attributed to lightning (0.095) and weather excluding lightning (0.05). The probabilities of outages determined by failed substation/circuit equipment and power system conditions including overloads are much lower (0.025 and 0.011).
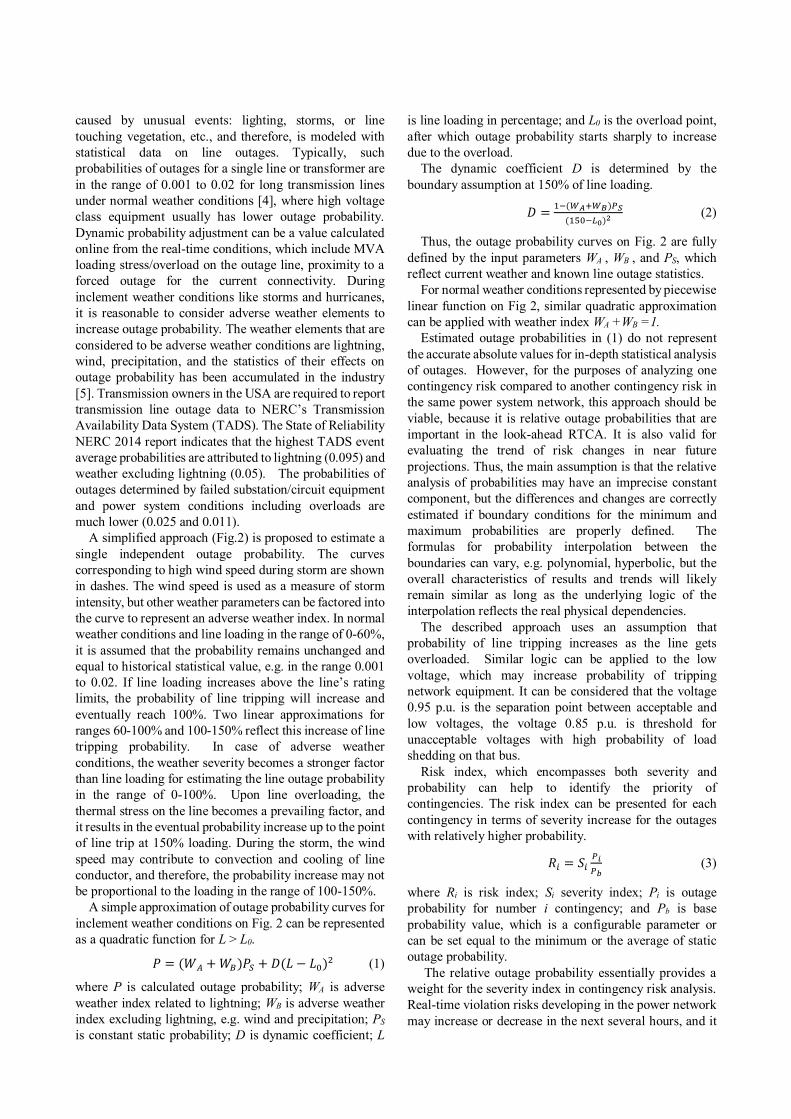
A simplified approach (Fig.2) is proposed to estimate a single independent outage probability. The curves corresponding to high wind speed during storm are shown in dashes. The wind speed is used as a measure of storm intensity, but other weather parameters can be factored into the curve to represent an adverse weather index. In normal weather conditions and line loading in the range of 0-60%, it is assumed that the probability remains unchanged and equal to historical statistical value, e.g. in the range 0.001 to 0.02. If line loading increases above the line’s rating limits, the probability of line tripping will increase and eventually reach 100%. Two linear approximations for ranges 60-100% and 100-150% reflect this increase of line tripping probability. In case of adverse weather conditions, the weather severity becomes a stronger factor than line loading for estimating the line outage probability in the range of 0-100%. Upon line overloading, the thermal stress on the line becomes a prevailing factor, and it results in the eventual probability increase up to the point of line trip at 150% loading. During the storm, the wind speed may contribute to convection and cooling of line conductor, and therefore, the probability increase may not be proportional to the loading in the range of 100-150%.
A simple approximation of outage probability curves for inclement weather conditions on Fig. 2 can be represented as a quadratic function for L > L0.
푃 = (푊 +푊 )푃 + 퐷(퐿 − 퐿 ) (1)
where P is calculated outage probability; WA is adverse weather index related to lightning; WB is adverse weather index excluding lightning, e.g. wind and precipitation; PS is constant static probability; D is dynamic coefficient; L
is line loading in percentage; and L0 is the overload point, after which outage probability starts sharply to increase due to the overload.
The dynamic coefficient D is determined by the boundary assumption at 150% of line loading.
퐷 = ( )( ) (2)
Thus, the outage probability curves on Fig. 2 are fully defined by the input parameters WA , WB , and PS, which reflect current weather and known line outage statistics.
For normal weather conditions represented by piecewise linear function on Fig 2, similar quadratic approximation can be applied with weather index WA +WB =1.
Estimated outage probabilities in (1) do not represent the accurate absolute values for in-depth statistical analysis of outages. However, for the purposes of analyzing one contingency risk compared to another contingency risk in the same power system network, this approach should be viable, because it is relative outage probabilities that are important in the look-ahead RTCA. It is also valid for evaluating the trend of risk changes in near future projections. Thus, the main assumption is that the relative analysis of probabilities may have an imprecise constant component, but the differences and changes are correctly estimated if boundary conditions for the minimum and maximum probabilities are properly defined. The formulas for probability interpolation between the boundaries can vary, e.g. polynomial, hyperbolic, but the overall characteristics of results and trends will likely remain similar as long as the underlying logic of the interpolation reflects the real physical dependencies.
The described approach uses an assumption that probability of line tripping increases as the line gets overloaded. Similar logic can be applied to the low voltage, which may increase probability of tripping network equipment. It can be considered that the voltage 0.95 p.u. is the separation point between acceptable and low voltages, the voltage 0.85 p.u. is threshold for unacceptable voltages with high probability of load shedding on that bus.
Risk index, which encompasses both severity and probability can help to identify the priority of contingencies. The risk index can be presented for each contingency in terms of severity increase for the outages with relatively higher probability.
푅 = 푆 (3)
where Ri is risk index; Si severity index; Pi is outage probability for number i contingency; and Pb is base probability value, which is a configurable parameter or can be set equal to the minimum or the average of static outage probability.
The relative outage probability essentially provides a weight for the severity index in contingency risk analysis. Real-time violation risks developing in the power network may increase or decrease in the next several hours, and it
is logical to assign an operational priority to the risks with increasing trends in the power grid. Thus, a predictive chart of risk value for each contingency may significantly improve the situational awareness in the control center and prepare operators for most severe and probable “what if” scenarios. The predictive RTCA results need to summarize the following information: contingency name, number of violations, severity, probability, current risk index, projected risk indexes, and indication of near future increases of contingency risks.
Figure 2. Outage probability as function of transmission line loading.
IV. STORM STUDY
A. Modeling Storm Conditions for Contingency Analysis
It is feasible to model the inclement weather conditions (e.g. ice storms, hurricanes, heat waves, tornadoes) and its effects on the power system in advanced network applications. Contingency Analysis can help evaluate possible disaster impacts on electrical grid and assess risks prior to the actual occurrence of storms in study mode and in real time during the storm development. CA can improve reliability coordination during the storm and give utility advance warning to develop a good strategy response to a particular storm geographical pattern. The forecasted coordinates of storm geography can be translated into the corresponding network elements of the grid using geo-spatial information. Then, instead of standard “(N-1)” analysis, it is possible to perform “(N-X)” contingency analysis and voltage stability analysis for high intensity areas of the storm. The number of possible contingency combinations 퐶 is very high for the study of X outages, and for a large network, the computation time is substantial. The segregation of network elements into storm intensity zone significantly reduces the computation time. Execution of CA in a network with about 1000 elements and outages defined for every single element takes about 0.5 min on a single- processor modern computer. This result can be extrapolated to (N-X) analysis
assuming the same speed of full AC power flow solution per contingency. The computation time summary in Table 2 shows that if (N-2) and (N-3) zones constitute 10% and 3% respectively, then the total computation time is within 5 min execution time. However, an increase of the number of network elements will result in significant increase of the computation time and will require multi-processor approach.
TABLE II. COMPUTATION TIME FOR (N-X) CONTINGENCY ANALYSIS
CA Type N-1 N-2 N-3 Analyzed Zone, % 100 10 3 Computation Time, min (1000 contingencies)
0.5 2.5 2.0
Computation Time, min (2000 contingencies)
0.9 10 17.1
Assuming that GPS coordinates exist for all transmission elements, the “(N-X)” contingency definitions have to be generated dynamically for the geographical footprint of the storm area, which propagates and changes its pattern in time. If “(N-X)” analysis is performed only in the forecasted epicenter of storm area rather than the whole power network, then it will reflect the realistic development of the storm and reduce the amount of calculations. The emergency ratings of the transmission lines and transformers can be dynamically adjusted to take into consideration various storm factors including temperature, humidity, icing, and wind using weather forecast and actual measurements for the storm area.
The main objective of the storm analysis is to improve the ability to forecast the impact of extreme weather events and to increase situational awareness of system conditions that require corrective action to minimize impact to transmission system reliability and maximize use of available resources during abnormal conditions. The storm analysis should determine whether the available generation reserve is sufficient, prepare emergency reserve and import of power, ensure that the reserve is deliverable to the customer load during the outage conditions, devise a topology reconfiguration and load-shed schemes.
B. Outline of Design
The following outlines a design approach to “storm studies”: 1) Run three types of contingency analysis:
a) Offline day-ahead study as storm preparation activity
b) Real-time for the current time point c) Look-ahead real-time projection for multi-time
points 2) Use geospatial information to translate dynamically the storm geography pattern into the network grid elements.
0.00
0.10
0.20
0.30
0.40
0.50
0.60
0.70
0.80
0.90
1.00
0 50 100 150
Ou
tg
e P
ro
ba
bil
ity
Line Loading in %
110 mph70 mph
< 5 mph

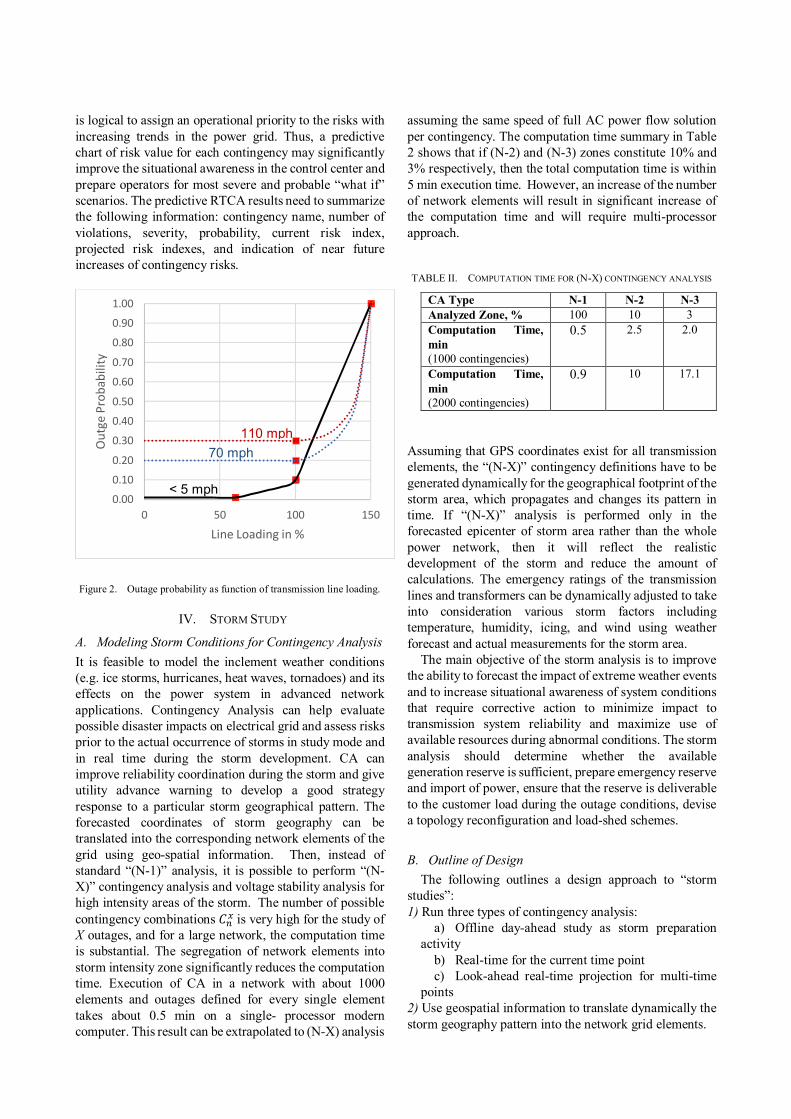
3) Based on the storm development/forecast pattern dynamically divide the storm geography and corresponding network elements into three types of “storm threat zones” (Fig. 3):
a) Low b) Medium c) High
4) Calculate line ratings for three zones using the storm forecast pattern. The assignment of these dynamic ratings for “storm threat zones” should be also dynamic in time, i.e. changing in real-time as per short-term forecast. 5) For each “storm threat zone”, automatically generate dynamic list of contingency definitions:
a) Low – (N-1) b) Medium – (N-2) c) High – (N-3)
6) Run Contingency Analysis for all zones. Identify all load shed limit violations. For the simulation of cascading outages add branches with load shed violations to contingency definitions list assuming that load shed violations will translate into actual outages. Re-run CA for the expanded list of outages. 7) For the generated list of contingency, calculate probability of outages. The line loading, “storm threat zone” and the adverse weather index should be used to estimate the outage probability. 8) Identify contingencies, which will cause tripping of power generators, islanding, substantial loss of power supply, brown outs, and black outs. Analyze diverged contingencies with simplified analysis (e.g. DC power flow, evaluation of generation, load plus losses) to assess sufficiency of generation and reserve. 9) Perform a detailed analysis of the identified high-risk contingencies and devise a corrective action plan, e.g. reschedule of planned outages, load shed, re-dispatch possibly using linear generations shift factors for each of the look-ahead hours.
Figure 3. Storm threat zones.
C. Dynamic Line Ratings
In the past, most utilities and market operators used static thermal limits for monitoring overloads of transmission lines in real time. Some Reliability Coordinators in the US have already switched to the modeling of dynamic ratings on transmission facilities in State Estimator and Contingency Analysis. This result in greater utilization of the existing transmission system capacity, and for market operations, in reduction of overall system costs for congestion. Dynamic ratings may also become beneficial in the analysis of adverse weather conditions for the area affected by a storm when multiple violations are very likely to happen. Static seasonal ratings for all transmission facilities are still required as they are used in case of telemetry failure for calculating dynamic rating or for those facilities that do not have capability to get dynamic rating.
Transmission facilities are typically rated assuming a high ambient temperature with low amounts of convection cooling. The conservative rating may be appropriate for summer weather patterns. However, during storm events, it may be desirable to assess additional or reduced transmission capacity if the actual ambient temperature and convection are known or calculated. The ambient temperature can be obtained either from the weather stations monitoring the actual temperature in the regions or simply using the temperature field devices. It is possible to determine the current dynamic rating of a designated facility using ambient temperature and the function of equipment rating vs. temperature function. The wind speed and direction have substantial effect on the transmission capacity [6], e.g. increase of 1 m/sec at 90° angle may result in about 20% increase of conductor rating. It is usually more difficult to monitor and obtain wind speed data in relation to a specific transmission facility, and in spite of its importance, this parameter is rarely used in dynamic rating calculations. However, some vendors offer field devices that can measure and transmit the actual conductor rating that takes in consideration both temperature and wind factors [7]. For RTCA in storm conditions it is very important to incorporate correctly the wind data into the calculations both for dynamic rating and for outage probability adjustments.
V. VISUALIZATION OF RESULTS
Usually, results of all contingency violations are presented as alarm messages indicating the contingency name and general attributes of the violation, e.g. violated network element, violation type (voltage/overload), and the percentage of violation. Displaying additional information on contingencies described in this paper may significantly enhance the visualization perspective. The RTCA results summarized on a tabular display may encompass control area, weather and/or storm threat zone, contingency name, severity, probability, calculated risk index, predicted increase/decrease of risk index in the next hour. Sorting and filtering of the list will enable selection
of results that require priority attention. The ability to select any contingency from the list and monitor the past and predicted future trends of risk indexes should improve the network security management.
Some software vendors already provide sophisticated software modules with advanced graphical visualization of results obtained in real-time and study calculations of State Estimator, Power Flow, and stability. The advanced graphics presentation depicts collected or processed information using color or icons on top of a geographic layout such as a geographic map. The graphics may show voltage contours, overloads, 3-D single line diagram with data bars, stack column chart, pie charts, weighted graphs with physical characteristics of underlying data [8], [9]. Similar graphical presentation can be applied for post-contingency visualization of the power flow solution, especially for high risk contingency.
The graphical representation can incorporate the contingency probability, risk index, and weather conditions. For example, a user should be able to select any contingency and visualize the contours of weather patterns, contingency probability, and violations with different colors and intensity.
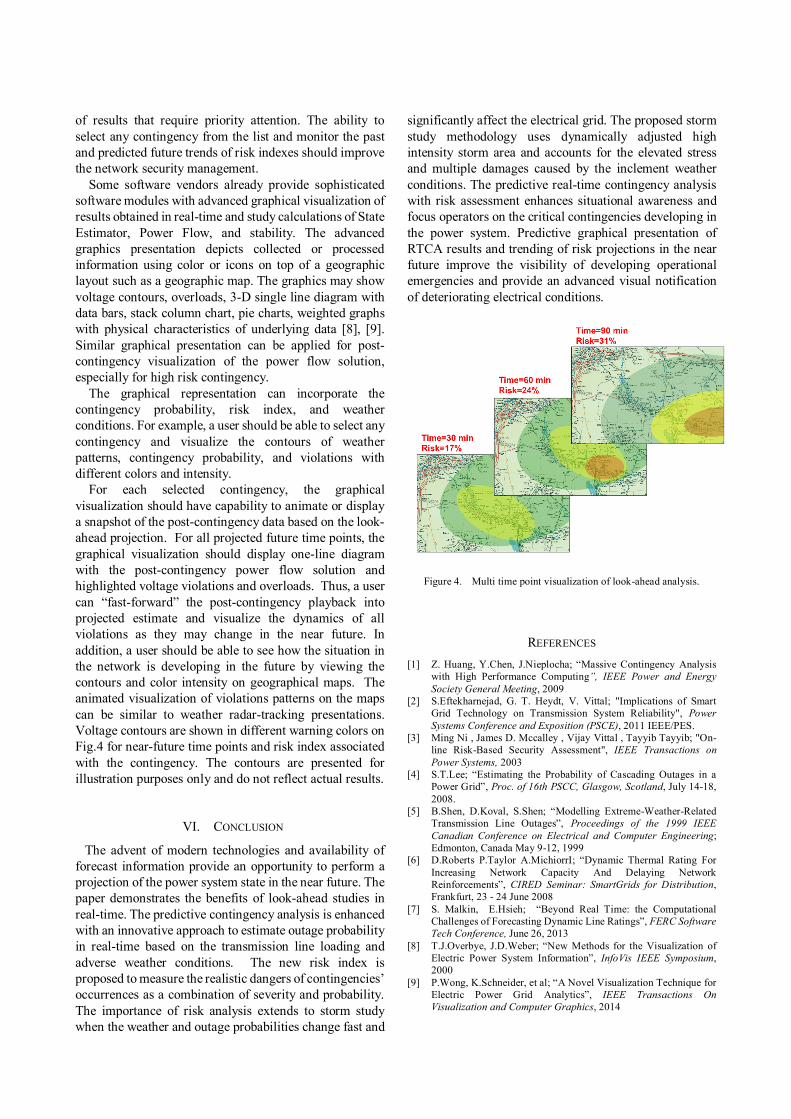
For each selected contingency, the graphical visualization should have capability to animate or display a snapshot of the post-contingency data based on the look-ahead projection. For all projected future time points, the graphical visualization should display one-line diagram with the post-contingency power flow solution and highlighted voltage violations and overloads. Thus, a user can “fast-forward” the post-contingency playback into projected estimate and visualize the dynamics of all violations as they may change in the near future. In addition, a user should be able to see how the situation in the network is developing in the future by viewing the contours and color intensity on geographical maps. The animated visualization of violations patterns on the maps can be similar to weather radar-tracking presentations. Voltage contours are shown in different warning colors on Fig.4 for near-future time points and risk index associated with the contingency. The contours are presented for illustration purposes only and do not reflect actual results.
VI. CONCLUSION
The advent of modern technologies and availability of forecast information provide an opportunity to perform a projection of the power system state in the near future. The paper demonstrates the benefits of look-ahead studies in real-time. The predictive contingency analysis is enhanced with an innovative approach to estimate outage probability in real-time based on the transmission line loading and adverse weather conditions. The new risk index is proposed to measure the realistic dangers of contingencies’ occurrences as a combination of severity and probability. The importance of risk analysis extends to storm study when the weather and outage probabilities change fast and
significantly affect the electrical grid. The proposed storm study methodology uses dynamically adjusted high intensity storm area and accounts for the elevated stress and multiple damages caused by the inclement weather conditions. The predictive real-time contingency analysis with risk assessment enhances situational awareness and focus operators on the critical contingencies developing in the power system. Predictive graphical presentation of RTCA results and trending of risk projections in the near future improve the visibility of developing operational emergencies and provide an advanced visual notification of deteriorating electrical conditions.
Figure 4. Multi time point visualization of look-ahead analysis.
REFERENCES [1] Z. Huang, Y.Chen, J.Nieplocha; “Massive Contingency Analysis
with High Performance Computing”, IEEE Power and Energy
Society General Meeting, 2009 [2] S.Eftekharnejad, G. T. Heydt, V. Vittal; "Implications of Smart
Grid Technology on Transmission System Reliability", Power
Systems Conference and Exposition (PSCE), 2011 IEEE/PES. [3] Ming Ni , James D. Mccalley , Vijay Vittal , Tayyib Tayyib; "On-
line Risk-Based Security Assessment", IEEE Transactions on
Power Systems, 2003 [4] S.T.Lee; “Estimating the Probability of Cascading Outages in a
Power Grid”, Proc. of 16th PSCC, Glasgow, Scotland, July 14-18, 2008.
[5] B.Shen, D.Koval, S.Shen; “Modelling Extreme-Weather-Related Transmission Line Outages”, Proceedings of the 1999 IEEE
Canadian Conference on Electrical and Computer Engineering; Edmonton, Canada May 9-12, 1999
[6] D.Roberts P.Taylor A.MichiorrI; “Dynamic Thermal Rating For Increasing Network Capacity And Delaying Network Reinforcements”, CIRED Seminar: SmartGrids for Distribution, Frankfurt, 23 - 24 June 2008
[7] S. Malkin, E.Hsieh; “Beyond Real Time: the Computational Challenges of Forecasting Dynamic Line Ratings”, FERC Software
Tech Conference, June 26, 2013 [8] T.J.Overbye, J.D.Weber; “New Methods for the Visualization of
Electric Power System Information”, InfoVis IEEE Symposium, 2000
[9] P.Wong, K.Schneider, et al; “A Novel Visualization Technique for Electric Power Grid Analytics”, IEEE Transactions On
Visualization and Computer Graphics, 2014

Kiamran Radjabli was born in 1959 in Baku, Azerbaijan. He earned his Master of Science and Doctorate degrees in Electrical Engineering from Moscow Power Engineering Institute. He is a Professional Engineer licensed in Ontario, Canada.
He provided energy management consulting services to a number of electrical organizations in North America and abroad. From 1998 to 2013
Kiamran worked in KEMA. From 2013 to date, he works for Utilicast and provides consulting services to the World Bank. He is specializing in EMS/SCADA and real time applications, generation and transmission, power network analysis, power system modeling, and system simulation.