continued earnings improvement text despite...
TRANSCRIPT

TextText
Continued earnings improvement despite temporary headwinds in operationsPresentation of the Q1/2018 resultsMartin Lindqvist, President & CEOHåkan Folin, CFOApril 20, 2018

Agenda
2
Q1/2018 – In summary
Q1/2018 – Performance by divisionFinancials
Outlook
Q&A

Q1/2018 – In summary
3
Generally good demand
Good growth in strategic areasPositive outlook – volume and price
Improved earnings despite operational headwinds
HYBRIT takes the next step AGM approved dividend of SEK 1.00 per share

Q1 negatively impacted by operational issues in Sweden
4
Lack of rail car capacity of slabs between Luleåand Borlänge
Alternative sea transport via Oxelösund usedResulting in delays, higher shipment costs, and output and shipment losses
Production disruption in Oxelösund in the blast furnace
Resulted in 2 weeks of lost steel making production, and also impacting rolling
Luleå
OxelösundBorlänge

55
Spot price development: Hot Rolled Coil (HRC) in Northern Europe, Plate in US, HRC in China
Indexed (Jan 2013 =100)
Q1
Northern Europe/HRC
US/Plate
HRC, Northern Europe
Plate, US
HRC, China
0
20
40
60
80
100
120
140
160
Jan13
Mar13
May13
Jul13
Sep13
Nov13
Jan14
Mar14
May14
Jul14
Sep14
Nov14
Jan15
Mar15
May15
Jul15
Sep15
Nov15
Jan16
Mar16
May16
Jul16
Sep16
Nov16
Jan17
Mar17
May17
Jul17
Sep17
Nov17
Jan18
Mar18
Northern Europe US China
Strong demand both in Europe and North America
Good demand continued, low imports,inventories in balance, spot prices
increasedStrong demand fromboth end-users and
distributors, low inventories, plate spot
prices increased sharply

Q1/2018 -Performance by division
6
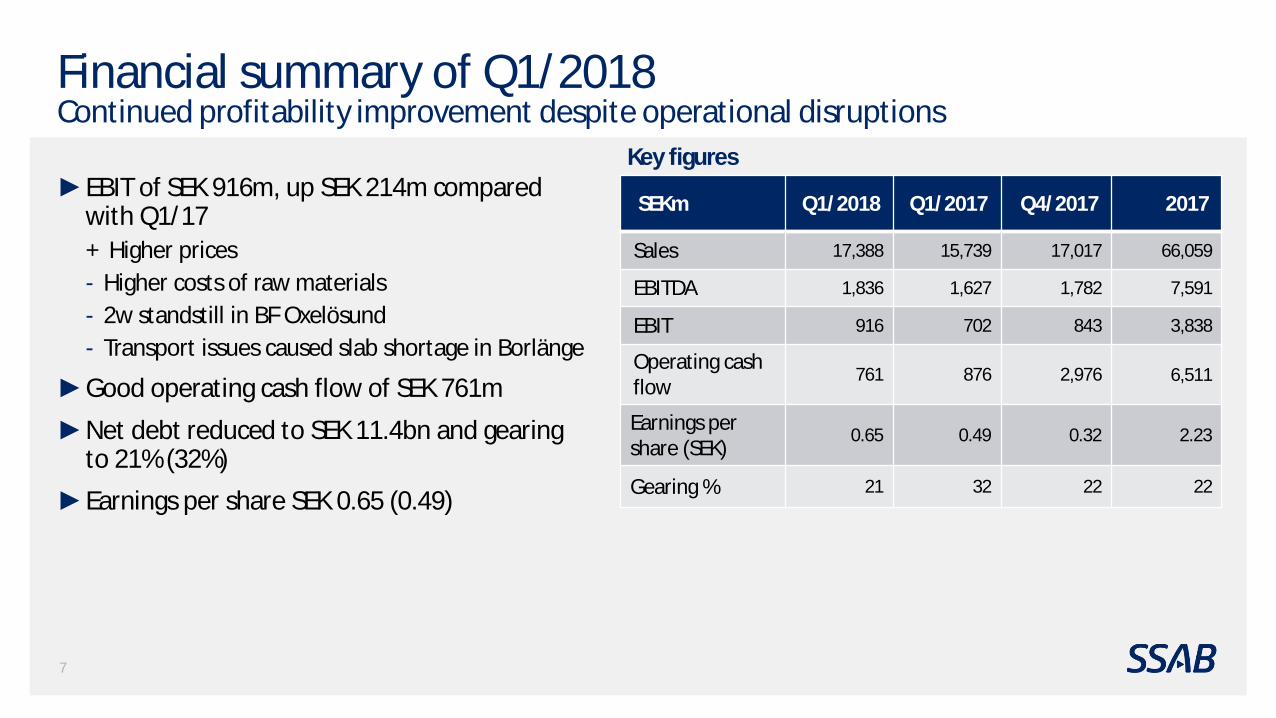
Financial summary of Q1/2018Continued profitability improvement despite operational disruptions
7
EBIT of SEK 916m, up SEK 214m comparedwith Q1/17+ Higher prices- Higher costs of raw materials- 2w standstill in BF Oxelösund- Transport issues caused slab shortage in Borlänge
Good operating cash flow of SEK 761m
Net debt reduced to SEK 11.4bn and gearing to 21% (32%)Earnings per share SEK 0.65 (0.49)
SEKm Q1/2018 Q1/2017 Q4/2017 2017
Sales 17,388 15,739 17,017 66,059
EBITDA 1,836 1,627 1,782 7,591
EBIT 916 702 843 3,838
Operating cash flow
761 876 2,976 6,511
Earnings per share (SEK)
0.65 0.49 0.32 2.23
Gearing % 21 32 22 22
Key figures

Sales and EBITDA marginSEKm
8
SSAB Special SteelsGood demand continued in all segments, especially Construction Machinery and Material Handling
EBIT of SEK 434m, up SEK 191m comparedwith Q1/17+ Higher prices+ Higher volumes- Higher costs of raw materials- Standstill in BF Oxelösund
Shipments +9% vs. Q4/17 and +25% vs. Q1/17
SEKm Q1/2018 Q1/2017 Q4/2017 2017
Sales 4,674 3,925 4,368 16,053
EBITDA 569 377 777 2,002
EBIT 434 243 641 1,465
Shipments,ktonnes 346 277 318 1,192
-5%
0%
5%
10%
15%
20%
25%
-500
500
1,500
2,500
3,500
4,500
5,500
Q1 Q2 Q3 Q4 Q1 Q2 Q3 Q4 Q1
2016 2017 2018
Sales EBITDA %

9
SSAB Special SteelsShipments
(thousand tonnes)
277318
346
0
50
100
150
200
250
300
350
400
Q1 2017 Q4 2017 Q1 2018
243
641
434
0
100
200
300
400
500
600
700
Q1 2017 Q4 2017 Q1 2018
Operating profit(SEK millions)
KtonSEKm
Lost sales and underabsorption
+ SEK 265 m. compensation for breakdown
Negative impactfrom standstill
Standstill in Q1 did not impactshipmentsImpacted by
breakdown in rolling mill

SEKm
10
SSAB Europe
10
Good demand continued in all segments
EBIT in Q1/18 was SEK 657m, down SEK 169m vs. Q1/17+ Higher prices
Higher raw material costsTransportation problems causing slab shortage in BorlängeLower volume
Shipments +4% vs. Q4/17, but -4% vs. Q1/17+ Automotive premium continued at good level,
+11% vs. Q1/17
Sales and EBITDA margin
SEKm Q1/2018 Q1/2017 Q4/2017 2017
Sales 8,051 7,657 7,768 31,048
EBITDA 998 1,182 811 4,405
EBIT 1) 657 826 460 2,988
Shipments,ktonnes 939 982 901 3,745
1) Excluding depreciation/amortization on surplus values on intangible and tangible fixed assets related to the acquisition of Rautaruukki.
0%2%4%6%8%10%12%14%16%18%20%
01,0002,0003,0004,0005,0006,0007,0008,0009,000
Q1 Q2 Q3 Q4 Q1 Q2 Q3 Q4 Q1
2016 2017 2018
Sales EBITDA %

SSAB Americas
11
Demand improved and plate prices continued to increase
EBIT in Q1/18 was SEK 129m, up SEK 286m from Q1/17+ Higher prices+ Higher volumes+ No maintenance outage (Q1-Q2/17 in Mobile)- Higher raw material costs
Shipments +8% vs. Q1/17, but slightly lower than in Q4/17
SEKm Sales and EBITDA margin
SEKm Q1/2018 Q1/2017 Q4/2017 2017
Sales 3,363 3,019 3,230 12,727
EBITDA 283 8 141 818
EBIT 1) 129 -157 -15 183
Shipments,ktonnes 523 486 525 1,971
1) Excluding depreciation/amortization on surplus values on intangible and tangible fixed assets related to the acquisition of IPSCO.
0%2%4%6%8%10%12%14%16%18%20%
0
1,000
2,000
3,000
4,000
Q1 Q2 Q3 Q4 Q1 Q2 Q3 Q4 Q1
2016 2017 2018
Sales EBITDA %

Tibnor
Sales increased by 2% both vs. Q1/17 and Q4/17
EBIT in Q1/18 was SEK 67m, down SEK 32m from Q1/17
Lower volumes and margins
12
SEKm Sales and EBITDA margin
SEKm Q1/2018 Q1/2017 Q4/2017 2017
Sales 2,058 2,019 2,012 7,821
EBITDA 87 118 63 334
EBIT 1) 67 99 42 252
Shipments (kton) 176 190 180 7161) Excluding depreciation/amortization on surplus values on intangible and tangible fixed assets related to the acquisition of Rautaruukki.
0%
1%
2%
3%
4%
5%
6%
7%
0
500
1,000
1,500
2,000
2,500
Q1 Q2 Q3 Q4 Q1 Q2 Q3 Q4 Q1
2016 2017 2018
Sales EBITDA %
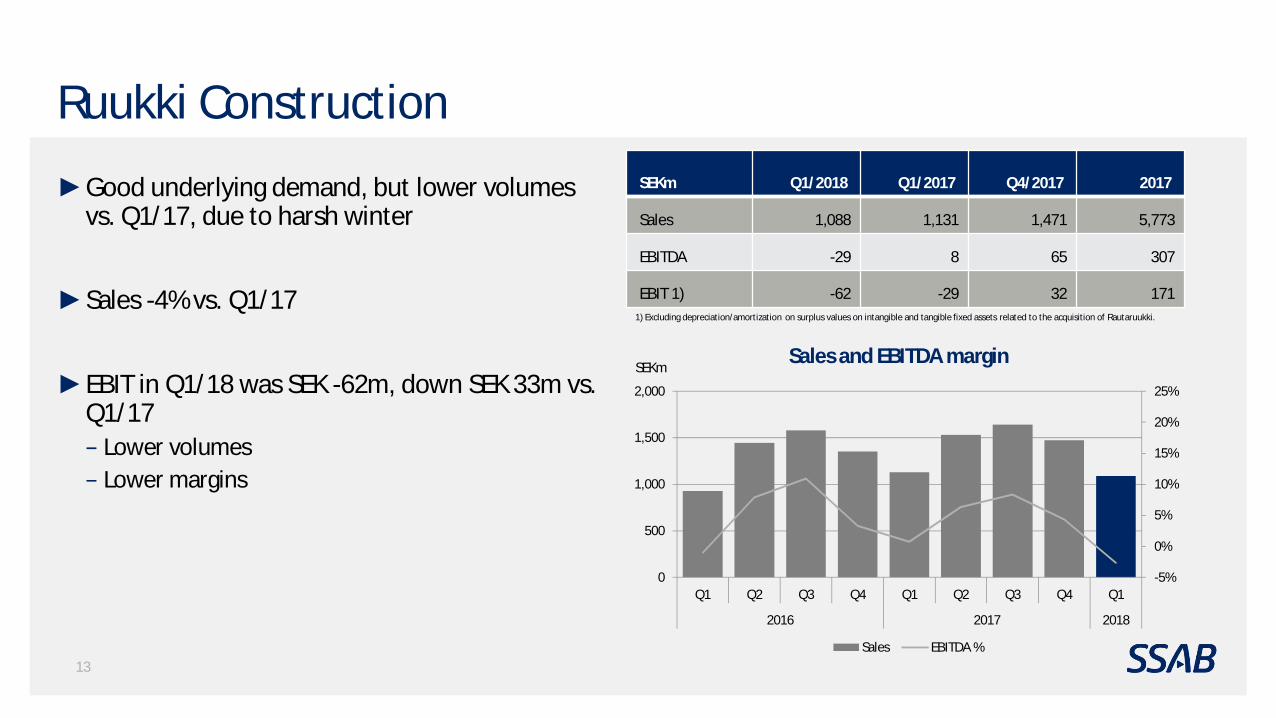
Ruukki Construction
Good underlying demand, but lower volumes vs. Q1/17, due to harsh winter
Sales -4% vs. Q1/17
EBIT in Q1/18 was SEK -62m, down SEK 33m vs. Q1/17
Lower volumesLower margins
13
SEKmSales and EBITDA margin
SEKm Q1/2018 Q1/2017 Q4/2017 2017
Sales 1,088 1,131 1,471 5,773
EBITDA -29 8 65 307
EBIT 1) -62 -29 32 1711) Excluding depreciation/amortization on surplus values on intangible and tangible fixed assets related to the acquisition of Rautaruukki.
-5%
0%
5%
10%
15%
20%
25%
0
500
1,000
1,500
2,000
Q1 Q2 Q3 Q4 Q1 Q2 Q3 Q4 Q1
2016 2017 2018
Sales EBITDA %

Financials

Improvement year-on-year continued
15
Sales
EBITDA and EBITDA margin
Shipments1
EBITDA per tonne delivered steel
1) Including the steel operations: Special Steels, Europe and Americas
02,0004,0006,0008,000
10,00012,00014,00016,00018,00020,000
Q1 Q2 Q3 Q4 Q1 Q2 Q3 Q4 Q1
2016 2017 2018
SEK
mill
ion
0200400600800
1,0001,2001,4001,6001,8002,000
Q1 Q2 Q3 Q4 Q1 Q2 Q3 Q4 Q1
2016 2017 2018
kton
s
0.0 %
2.0 %
4.0 %
6.0 %
8.0 %
10.0 %
12.0 %
14.0 %
0
500
1,000
1,500
2,000
2,500
Q1 Q2 Q3 Q4 Q1 Q2 Q3 Q4 Q1
2016 2017 2018
SEK
mill
ion
EBITDA EBITDA %
0200400600800
100012001400
Q1 Q2 Q3 Q4 Q1 Q2 Q3 Q4 Q1
2016 2017 2018
SEK/
tonn
e

Change in operating profit Q1/2018 vs. Q1/2017
SEKm
16
916
280702
Q1/2018Other
74
FXFixed cost
-210
Var COGS
-1 130
Volume
0
Price
1 200
Q1/2017

Change in operating profit Q1/2018 vs. Q4/2017
SEKm
17
*Includes the compensation of SEK 265m for the breakdown in Oxelösund
520
100
175
110916
Q1/2018Other*
-197
FXFixed costVar COGS
-635
VolumePriceQ4/2017*
843

Continued positive cash flow in Q1SEKm Q1/2018 Q1/2017 Q4/2017 2017
Operating profit before depreciation/amortization 1,836 1,627 1 782 7 591
Change in working capital -799 -526 1 736 303
Maintenance expenditure -285 -215 -563 -1 366
Other 9 -10 21 -17
Operating cash flow 761 876 2 976 6 511
Financial items -141 -222 -197 -943
Taxes -236 -21 -94 -249
Cash flow from current operations 384 633 2 685 5 319
Strategic capital expenditure in plant and machinery-63 -44 -85 -237
Acquisitions of shares and operations -10 0 0 -11
Divestments of shares and operations 0 0 1 1
Cash flow before dividend 311 589 2 601 5 072
18

Cash flow trend
Potential to further improve profitability
Well-investedReduction of working capital/sales
Lower interest cost
Tax rate ~20%
19
0
1,000
2,000
3,000
4,000
5,000
6,000
7,000
Q1/14 Q2/14 Q3/14 Q4/14 Q1/15 Q2/15 Q3/15 Q4/15 Q1/16 Q2/16 Q3/16 Q4/16 Q1/17 Q2/17 Q3/17 Q4/17 Q1/18
Operating cash flow (Rolling 12 months)
SEKmOperating cash flow

Maturity profile and net debt
20
Loans maturing in 2018-2020 amounts to around SEK 9.2bn
Duration of the loan portfolio was 5.5 years (5.5 at the end of 2017)
Net gearing ratio decreased from 22% at the end of 2017 to below 21%
Net debt decreased by SEK 183m during Q1/18 and amounted to SEK 11.4bn
SEKm
Maturity profile Q1/2018
9.2bn
Back-up facilities
Cash
0
2,000
4,000
6,000
8,000
10,000
12,000
14,000
Cash andback-upfacilities
2018 2019 2020 2021 2022 2023+

Iron ore and coking coal – Purchase prices increased
21
Average coking coal purchase price in Q1/18 was 23% higher in terms of SEK (+27% in USD) vs. Q4/17
Coking coal
Iron ore
Average pellet purchase price in Q1/18 was 18% higher in terms of SEK (+21% in USD) vs. Q4/17
SSAB’s purchase price, coking coal and iron ore
Indexed
50
100
150
200
250
300
Q4 2015 Q1 2016 Q2 2016 Q3 2016 Q4 2016 Q1 2017 Q2 2017 Q3 2017 Q4 2017 Q1 2018
Coal ( SSAB purchase price, index) Iron ore (SSAB purchase price, index)

0
50
100
150
200
250
300
350
400
Jan-
15Fe
b-15
Mar
-15
Apr-
15M
ay-1
5Ju
n-15
Jul-1
5Au
g-15
Sep-
15O
ct-1
5N
ov-1
5De
c-15
Jan-
16Fe
b-16
Mar
-16
Apr-
16M
ay-1
6Ju
n-16
Jul-1
6Au
g-16
Sep-
16O
ct-1
6N
ov-1
6De
c-16
Jan-
17Fe
b-17
Mar
-17
Apr-
17M
ay-1
7Ju
n-17
Jul-1
7Au
g-17
Sep-
17O
ct-1
7N
ov-1
7De
c-17
Jan-
18Fe
b-18
Mar
-18
Apr-
18
Chicago #1HM Scrap (AMM) [USD/gross ton]
Scrap – Upwards price trend continued
22
SSAB’s average purchase price for scrap was 23% higher in Q1/18 vs. Q4/17 (USD)
Spot prices have increased also in April
Scrap spot priceUSD/gross ton
Q1/2018
Source: AMM

Outlook

SSAB’s outlook for Q2/2018
24
Segment Volume trend Q2 vs. Q1 Comment
SSAB Special Steels High level in Q1
SSAB Europe Transport problem resolved
SSAB Americas Strong demand
In North America, demand for heavy plate is expected to remain strong
In Europe, demand for strip and heavy plate is expected to remain good
The underlying demand for high-strength steels is anticipated to be good in most markets
The prices realized by the three steel divisions are expected to be somewhat higher during the second quarter, particularly for SSAB Americas

25
Initiative for fossil-free steel – HYBRITJoint venture with Vattenfall and LKAB
Successful pre-feasibility study closed in Q1 2018
Planning and designing of pilot plants in Luleå and the iron ore field in Norrbotten
First ground to be broken during the summer

Summary
26
Generally good demand
Good growth in strategic areasPositive outlook - volume and price
Improved earnings despite operational headwinds

Questions & Answers

Appendix

Major planned maintenance outages in 2018
29
No major planned maintenance outages in Q2/18
Costs in 2018 are estimated to be SEK 885m (1,010) Lower cost in SSAB Americas compared to 2017
SEKm Q1/18 Q2/18 Q3/18 Q4/18 2018 2017
SSAB Special Steels
- - - 230 230 230
SSAB Europe - 40 210 125 375 390
SSAB Americas - - - 280 280 390
Total - 40 210 635 885 1,010
Note: The estimates shown in table includes direct maintenance cost and cost of lower capacity utilization (under absorption), but excludes lost margins.

SSAB’s key customer segments – outlook Segment Outlook for Q2
vs. Q1 Comments on outlook
Heavy TransportSolid demand expected in Europe, especially heavy truck segment
Slight improvement expected for Railcar production in US (dry goods)
Automotive Automotive is expected to remain at high level in Europe, increase in Asia and slow down in US
Construction MachineryDemand in the main European markets is expected to continue at good level
Continued recovery in US expected
Material HandlingHigh activity in the Mining sector
Pick-up also in investments of new machinery
EnergyContinued solid demand in wind energy expected
Oil-related segments has improved, higher activity in line pipe
Construction Demand expected to be seasonally improving
Service Centers (US) Demand in general expected to remain good
30

Anti-dumping measures are in placeand under preparation in EU and the US
Cold-rolled carbon steels (China, Russia)Hot-Rolled flat carbon steels (China) • Final AD duties for strip 18%-36% in April 2017 and 65%-74% for
plate in Feb 2017
Hot-Rolled flat carbon steels (Brazil, Russia, Iran, Serbia and Ukraine)
Definitive AD duties on imports of hot rolled coil from Brazil, Iran, Russia and Ukraine in Oct 2017
Under preparationIn place
Europe
US
Hot-rolled sheet and coils (China, Russia, India, Ukraine, Indonesia, Taiwan, Thailand)Hot-rolled sheet and coils (Australia, Brazil, Japan, Korea, Netherlands, Turkey)Heavy plate (China, India, Indonesia, Russia, Ukraine)Heavy plate (China, Austria, Belgium, Taiwan, France, Germany, Italy, Japan, South Korea)• Final AD decision for the 8 countries in March 2017 – increased
duties vs. preliminary duties
• Final AD and CVD decision on Chinese plate AD margin of 68% and a subsidy (CVD) margin of 251%
As a result of the Section 232 steel investigation a duty of 25% was imposed on imports from all countries (exceptions for a number of countries, including a temporary exception for the EU-28)
Corrosion Resistant Steel (China) Provisional anti-dumping duties of 17.2%-28.5% in Aug 2017
Cold-rolled sheet and coils (Brazil, India, Korea, Russia, United Kingdom)Heavy plate (Turkey, Brazil, South Africa)
Preliminary AD decision in place for Turkey, Brazil, South Africa
31

Net debt and gearing continued to decrease
32
Net gearing ratio decreased from 22% at the end of 2017 to below 21%
Net debt decreased by SEK 183m during Q1/18 and amounted to SEK 11.4bn
%SEKm
Net debt and net debt/equity ratio
0
10
20
30
40
50
60
2012 2013 2014 2015 2016 2017 Q1/20180
5,000
10,000
15,000
20,000
25,000
30,000
Net interest bearing debt, SEKm Net gearing ratio, %

Debt cost and duration%
Duration on debt portfolio and interest rate
33
Duration of the loan portfolio was 5.5 years (5.5 at the end of 2017)
Averaged fixed interest term was 1.0 years (1.1 in Q4/17) Average interest rate was 3.60% (3.42 % in Q4/17)
Years
0.00
0.50
1.00
1.50
2.00
2.50
3.00
3.50
4.00
Q1 Q2 Q3 Q4 Q1 Q2 Q3 Q4 Q1
2016 2017 2018
0.0
1.0
2.0
3.0
4.0
5.0
6.0
Avg. duration (rhs) Avg. interest rate
