contracting: an overview of why, when, where, & the future pie 231 by: joe parcell extension...
Post on 21-Dec-2015
217 views
TRANSCRIPT
Contracting: An Overview of Why, When, Where, & the Future
PIE 231
by:
Joe Parcell
Extension Economist
University of Missouri - Columbia
(573) 882-6533
What is a Contract?
A written or oral agreement between two or more parties involving an enforceable commitment to do or refrain from doing something.
Soure: Hall, C., and M. Langemeier. “Contracts as a Risk Management Tool.” Texas Agricultural Experiment Service, Risk Management Education
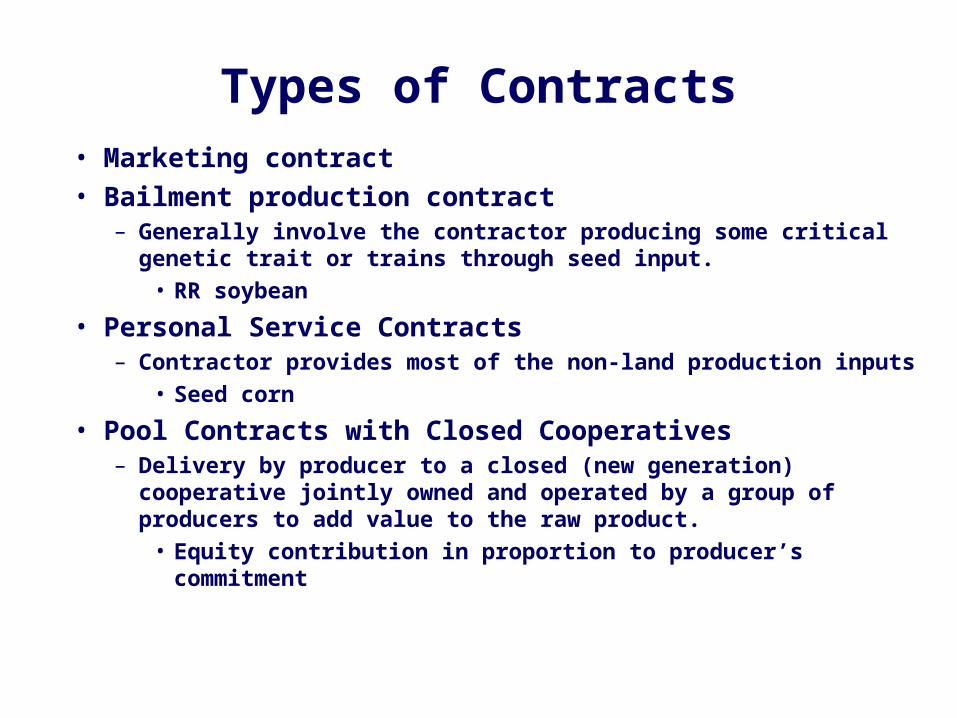
Types of Contracts
• Marketing contract• Bailment production contract
– Generally involve the contractor producing some critical genetic trait or trains through seed input.
• RR soybean
• Personal Service Contracts– Contractor provides most of the non-land production inputs
• Seed corn
• Pool Contracts with Closed Cooperatives– Delivery by producer to a closed (new generation) cooperative jointly
owned and operated by a group of producers to add value to the raw product.
• Equity contribution in proportion to producer’s commitment

Types of Contracting
• Production– Production management contracts
– Resource-providing contracts
• Marketing– Forward price
– Delayed or deferred
– Basis
– Flat price
– Hedge to arrive
– Quality attributes

Production vs. Marketing Contracts• Production
– Contractor
• Arranges to have a specific quality and quantity of commodity produced
• Usually owns the commodity being produced
• Makes most of the
production decisions
• Marketing
– Contractor• Buys a known quality and
quantity of the commodity for a negotiated price
• Doesn’t own the commodity until it is delivered
• Has little influence over production decisions

Production vs. Marketing Contracts• Production
– Contractee (operator)
• Provides service and other fixed inputs
• Supplies a small part of total production inputs
• Usually does not own the commodity
• Marketing
– Contractee (operator)
• Has a buyer and price for commodity before harvested
• Supplies and finances nearly all of inputs
• Owns commodity while being produced

Production vs. Marketing Contracts• Production
– Contractee (operator)
• Few production decisions
• Few price or market uncertainties
• Marketing
– Contractee (operator)
• Makes most of production decisions
• Assumes nearly all production related risks


Relative Price Risk (Percent of Mean Price)source: USDA, ERS, 1999
0 5 10 15 20 25 30
Rice
Sorghum
Wheat
Corn
Soybean
Hogs
All Cattle

Corn Price Variability (Percent of Mean Price)source: USDA, ERS, 1999
0
10
20
30
40
50
60
1920s 1930s 1940s 1950s 1960s 1970s 1980s 1990-96

To What Extent has Contracting Occurred?

Production Contractssource: USDA, ERS, 1997
0%
20%
40%
60%
80%
100%
Broilers Cattle Eggs Hogs Vegetables

Value of Production - Marketing Contractsource: USDA, ERS, 1997
0%
10%
20%
30%
40%

Value of Production - Marketing Contractsource: USDA, ERS, 1997
0%
20%
40%
60%
80%
100%
Fruits Peanuts Potatoes Sugar beets
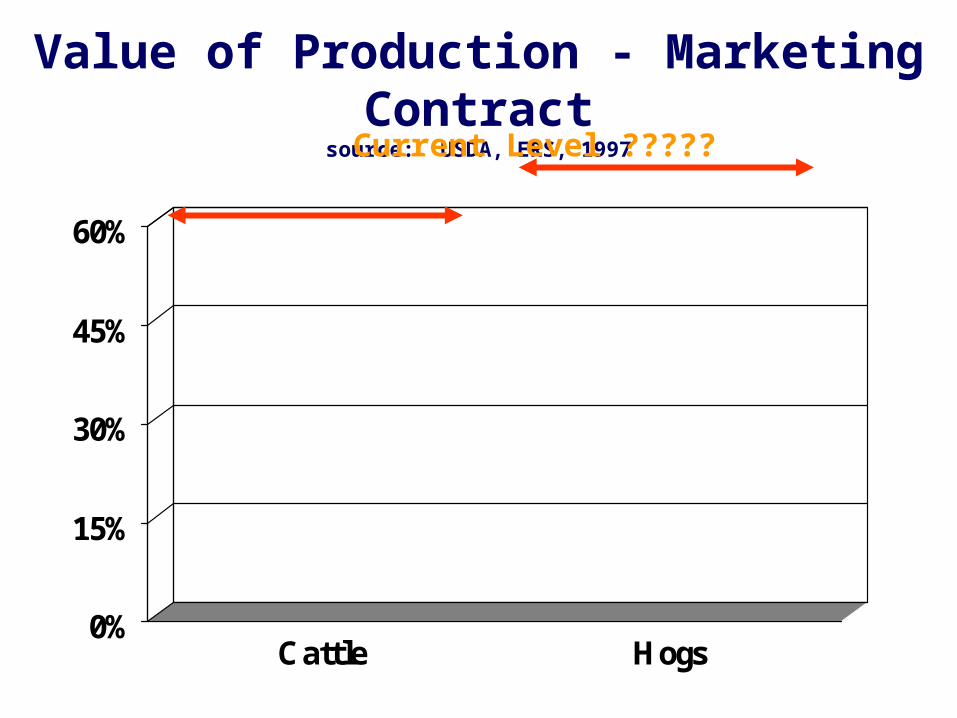
Value of Production - Marketing Contractsource: USDA, ERS, 1997
0%
15%
30%
45%
60%
Cattle Hogs
Current Level ?????

Weekly Contracted or Formulated Kansas Fed Cattle as Percent of Marketings, 1991 - March 2000
0
10
20
30
40
50
60
70
80
90
100
1/4/91 1/4/93 1/4/95 1/4/97 1/4/99
Week
Co
ntr
ac
t %
of
Ma
rke
tin
gs
Source: USDA and K-State Research and Extension

“Typical” AMS Price ReportDC_LS130Dodge City, KS Fri Mar 10, 2000 USDA-KS Dept of AgMarket News
Kansas Feedlot Sales - as of 3:00 Friday
Confirmed: 50 week ago: none year ago: none
Trade quiet. Not enough slaughter steer or heifer salesconfirmed for a market test. Inquiry and demand fair. Salesconfirmed on 50 slaughter heifers Friday. This week's confirmedsales 81900 head including 35200 head or about 43 percentpreviously contracted or formulated cattle.Sales FOB feedlot net weights after 4 percent shrink.
Source: USDA Kansas Dept of Ag Market News Dodge City, KS

Percentage of Days Mid-Session Fed Cattle Cash Price Not Reported by AMS, Kansas, Nebraska, and Texas, 1991-99
0
10
20
30
40
50
60
70
91 92 93 94 95 96 97 98 99
Year
Per
cen
tag
e o
f D
ays
Nebraska
Texas
Kansas
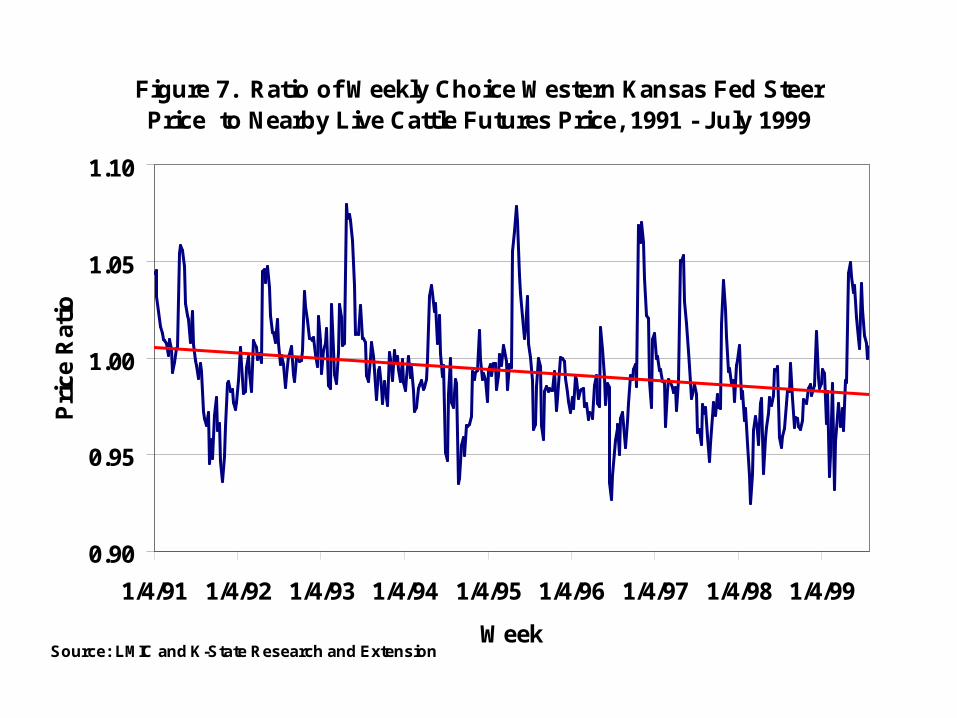
Figure 7. Ratio of Weekly Choice Western Kansas Fed Steer Price to Nearby Live Cattle Futures Price, 1991 - July 1999
0.90
0.95
1.00
1.05
1.10
1/4/91 1/4/92 1/4/93 1/4/94 1/4/95 1/4/96 1/4/97 1/4/98 1/4/99
Week
Pri
ce R
atio
Source: LMIC and K-State Research and Extension

Table 1. Hog Pricing Methods,Table 1. Hog Pricing Methods,January 1999 and 1997January 1999 and 1997
Pricing Method
% of Hogs
Jan 2000 Jan 1999 1997Formula (off cash market) 47.2 39.1
Fixed tied to futures (cash contract) 8.5 2.9Fixed tied to feed price, no ledger 3.3Fixed tied to feed price, with ledger 9.0
5.3
Window risk sharing, no ledger 3.8Window risk sharing, with ledger 0.8
3.1
Other (packer-owned, transfer) 1.7 6.1
Total Non-Cash Purchases 74.3 56.6Total Cash Market Purchases 25.7 43.4
Source: Grimes and Plain, University of Missouri
44.2 3.4 2.9 6.9 3.6 1.0 2.3
64.235.8

Figure 8. Ratio of Weekly Iowa-S. Minn. Barrow and Gilt Price to Nearby Lean Pork Futures Price, 1991 - July 1999
0.35
0.45
0.55
0.65
0.75
0.85
1/5/91 1/5/92 1/5/93 1/5/94 1/5/95 1/5/96 1/5/97 1/5/98 1/5/99
Week
Pri
ce R
atio
Dec '98
Source: LMIC and K-State Research and Extension

Percent of Acres Planted to VACC by Farm Size (source: University of Illinois)
0%
10%
20%
30%
40%
50%
ALL 1 to 499 500 to 999 1000 to1499
> 1500
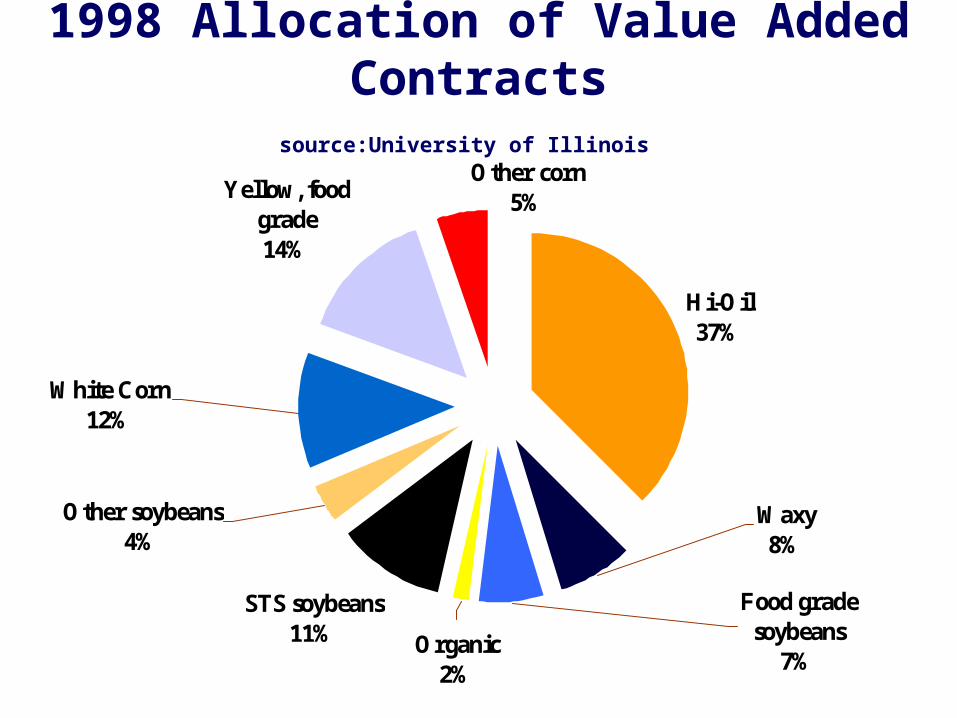
1998 Allocation of Value Added Contractssource:University of Illinois
Hi-Oil37%
STS soybeans11%
Yellow, food grade14%
Other corn5%
White Corn12%
Other soybeans4%
Organic2%
Food grade soybeans
7%
Waxy8%

Reason for Producing VACCsource:University of Illinois
Reason All 1-499 500-999
1000-1499
>1500
To increase profit 1.27 1.36 1.24 1.21 1.35
To earn a premium 1.89 1.88 1.68 1.89 2.07
To diversify risk 3.30 3.21 3.16 3.45 3.24
Future contractingopportunities
3.44 4.08 3.22 3.45 .43
To learn about new crops 4.49 4.77 4.53 4.58 4.26
To expand total acreagefarmed
4.86 5.15 4.64 4.93 4.88
1=most important, 2= second most important, . . . 6=least important

Producer Involvementsource:University of Illinois
All 1-499 500-999
1000-1499
>1500
Produced VACC in the past 3years
24.5 7.2 22.9 38.6 41.5
if no, would consider 57.0 40.2 66.9 68.4 71.2
% of farms producing VACCin: 1996 31.7 4.2 12.4 21.7 23.7
1997 16.5 5.5 15.9 24.1 28.8
1998 22.6 5.5 15.9 24.1 28.8
VACC acreage as a % of totalacres operated in 1998: 7.4 3.0 5.1 10.2 7.2

Importance of Information on VACCsource:University of Illinois
Information All 1-499 500-999
1000-1499
>1500
Average premiums paid 2.23 2.29 1.89 2.25 2.48
Typical contract terms 2.86 3.00 2.75 2.91 2.85
Availability of contract types 2.82 3.15 2.67 2.91 2.73
Addition risks of contracting 3.18 3.21 3.03 3.20 3.29
What firms are offeringcontracts
3.56 3.31 3.19 3.82 3.63
Contract terms that farmersshould avoid
3.54 3.92 2.97 3.84 3.52
1=most important, 2= second most important, . . . 6=least important

Investment in Facilitiessource:University of Illinois
Type of Investment All 1-499 500-999 1000-1499 >1500
Storage bins or facilities 16.6 5.9 0.3 21.9 18.4
Harvesting equipment 11.8 11.8 7.7 14.1 12.2
Planting equipment 7.1 5.9 7.7 7.8 6.1
What are Elevator Managers Thinking?

Elevator Survey Results of IP Importancesource: E-Markets, Inc. and Context Consulting
0.2
0.03
0.24
0.03
0.22
0.130.18
0.41
0.17
0.41
0%
5%
10%
15%
20%
25%
30%
35%
40%
45%
1 2 3 4 5
Importance (1 = not important, . . ., 6 = very important)
TodayIn 5 Years

Elevator Survey Resultssource: E-Markets, Inc. and Context Consulting
0.64
0.25
0.11
0
0%
10%
20%
30%
40%
50%
60%
70%
YES NO Don't Know Refused
Do you anticipate increasing your involvement with specility grains over the next two years?

Outlook for Missouri Producers

Value vs. Cost of IP
• Marginal Value = Marginal Cost
– The premium paid for the commodity must at least equal the cost of obtaining the premium.
– The cost of altering production to not receive a discount must be at most as great as the discount.
What are the Demand Drivers and Where will Contracting (IP) occur?


