contractors’ corner
TRANSCRIPT
36
CONTRACTORS’ CORNER
I took an unusual phone from an irrigator in the 1990s. “Rob”, he said, “I think there’s a wheel barrow in my pipeline. Can you locate it?”
Wheel barrows were used to carry kit for reinstating cement lining during MSCL pipeline construction in the old days, and it was not the fi rst time I had heard of a wheel barrow being left in a large pipeline.
So, I agreed to help this client out. We were dealing with a 500 mm diameter PVC rising main that delivered
recycled water from a pumping station to a reservoir 10 km away. Th e problem was that, aft er a year in operation, there was about a 10% reduction in pumping output. Th e client assured me that he had tested the pumps and they were OK. It just had to be a ‘wheel barrow’ in the pipe.
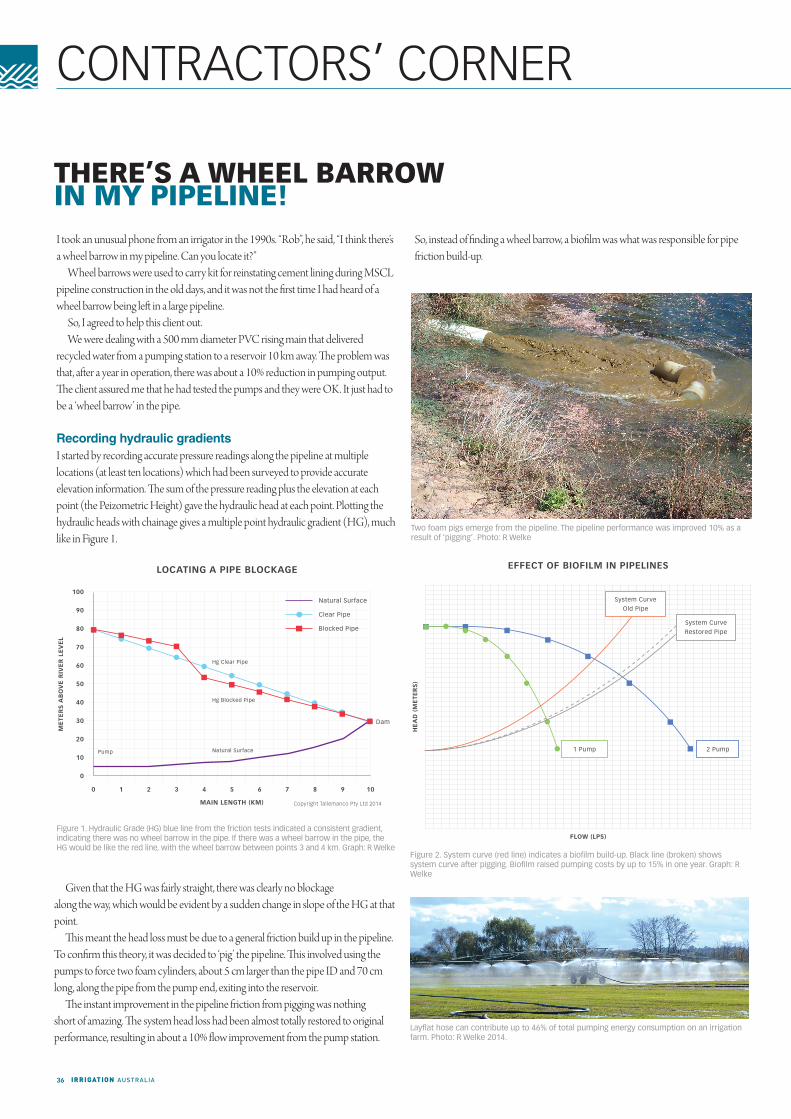
Recording hydraulic gradientsI started by recording accurate pressure readings along the pipeline at multiple locations (at least ten locations) which had been surveyed to provide accurate elevation information. Th e sum of the pressure reading plus the elevation at each point (the Peizometric Height) gave the hydraulic head at each point. Plott ing the hydraulic heads with chainage gives a multiple point hydraulic gradient (HG), much like in Figure 1.
THERE’S A WHEEL BARROW IN MY PIPELINE!
Figure 1. Hydraulic Grade (HG) blue line from the friction tests indicated a consistent gradient, indicating there was no wheel barrow in the pipe. If there was a wheel barrow in the pipe, the HG would be like the red line, with the wheel barrow between points 3 and 4 km. Graph: R Welke
Figure 2. System curve (red line) indicates a biofi lm build-up. Black line (broken) shows system curve after pigging. Biofi lm raised pumping costs by up to 15% in one year. Graph: R Welke
Two foam pigs emerge from the pipeline. The pipeline performance was improved 10% as a result of ‘pigging’. Photo: R Welke
Layfl at hose can contribute up to 46% of total pumping energy consumption on an irrigation farm. Photo: R Welke 2014.
100
90
80
70
60
50
40
30
20
10
0
LOCATING A PIPE BLOCKAGE
MAIN LENGTH (KM) Copyright Tallemanco Pty Ltd 2014
Pump Natural Surface
Hg Blocked Pipe
Hg Clear Pipe
Dam
ME
TER
S A
BO
VE
RIV
ER
LE
VE
L
0 1 2 3 4 5 6 7 8 9 10
Natural Surface
Clear Pipe
Blocked Pipe
Given that the HG was fairly straight, there was clearly no blockage along the way, which would be evident by a sudden change in slope of the HG at that point.
Th is meant the head loss must be due to a general friction build up in the pipeline. To confi rm this theory, it was decided to ‘pig’ the pipeline. Th is involved using the pumps to force two foam cylinders, about 5 cm larger than the pipe ID and 70 cm long, along the pipe from the pump end, exiting into the reservoir.
Th e instant improvement in the pipeline friction from pigging was nothing short of amazing. Th e system head loss had been almost totally restored to original performance, resulting in about a 10% fl ow improvement from the pump station.
So, instead of fi nding a wheel barrow, a biofi lm was what was responsible for pipe friction build-up.
EFFECT OF BIOFILM IN PIPELINES
FLOW (LPS)
HE
AD
(M
ETE
RS
)
System Curve
Old Pipe
System Curve
Restored Pipe
2 Pump1 Pump

Rob Welke, Tallemenco Pty Ltd, Adelaide
Pipeline energy effi ciencyPipeline performance can be always be viewed from an energy effi ciency perspective. Figure 2 shows the biofi lm aff ected (red line) and restored (black line) system curves for the client’s pipeline, before and aft er pigging.
Th e increase in system head due to biofi lm caused the pumps not only to operate at a higher head, but that some of the pumping was forced into peak electricity tariff . Th e reduced performance pipeline ultimately accounted for about 15% additional pumping energy costs.
Not everyone has a 500NB pipeline!Not everyone has a 500 mm pipeline in their irrigation system, so how does this relate to the average irrigator?
A new 500NB PVC pipe has a Hazen & Williams (H&W) friction value of about C=155. When reduced to C=140 (10%) through biofi lm build-up the pipe will have the equivalent of a wall roughness of 0.13 mm. Th e same roughness in an 80 mm pipe represents an H&W C value of 130. Th at’s a 16% reduction in fl ow, or a 32% friction loss increase for the same fl ow. And that’s just in the fi rst year.
Layfl at hose has high energy costA case in point was observed in an energy effi ciency audit recently on a turf farm in NSW. A 200 m long 3” layfl at pipe delivering water to a soft hose boom had a head loss of 26 m head compared with the manufacturer's rating of 14 m for the same fl ow, and with no kinks in the hose. Th at’s a whopping 85% increase in head loss.
Not surprising considering that this layfl at was transporting algae contaminated river water and lay in the hot sun all summer, breeding those litt le critt ers on the pipe inside wall.
Calculated in terms of energy consumption, the layfl at hose was responsible for 46% of total pumping energy costs through its small diameter with biofi lm build-up.
Solution is larger pipeWhat’s the solution? Move to a larger diameter hose. A 3½” hose has a new pipe head loss of only 6 m/200 m at the same fl ow, but when that deteriorates due to biofi lm, headloss may rise to only about 10 m/200 m instead of 26 m/200 m, kinks and fi tt ings excluded. Th at’s a 28% saving on pumping energy costs. In terms of absolute energy consumption, if pumping 50 ML/year at 30 c/kWh, that’s a saving of $950 a year, or $10,700 over ten years.
Everyone has a wheel barrow in their pipelines, and it only gets bigger with time. You can’t get rid of it, but you can control its eff ects, either through energy effi cient pipeline design in the fi rst place, or try ‘pigging’ the pipe to get rid of that wheel barrow.
Information For information contact Rob Welke, Tallemenco Pty Ltd, phone 0414 492 256, website www.talle.biz or email [email protected] .