contrast-transfer improvement for electrode …€¦ · · 2008-07-07contrast-transfer...
TRANSCRIPT

INSTITUTE OF PHYSICS PUBLISHING PHYSICS IN MEDICINE AND BIOLOGY
Phys. Med. Biol. 51 (2006) 6403–6418 doi:10.1088/0031-9155/51/24/008
Contrast-transfer improvement for electrodedisplacement elastography
Shyam Bharat1,2 and Tomy Varghese1,2
1 Department of Medical Physics, University of Wisconsin-Madison, 1300 University Avenue,1530 MSC, Madison, WI 53706, USA2 Department of Electrical and Computer Engineering, University of Wisconsin-Madison,1300 University Avenue, 1530 MSC, Madison, WI 53706, USA
E-mail: [email protected]
Received 3 April 2006, in final form 25 October 2006Published 28 November 2006Online at stacks.iop.org/PMB/51/6403
AbstractElectrode displacement elastography is a strain imaging method that can be usedfor in-vivo imaging of radiofrequency ablation-induced lesions in abdominalorgans such as the liver and kidney. In this technique, tissue motion ordeformation is introduced by displacing the same electrode used to create thelesion. Minute displacements (on the order of a fraction of a millimetre) areapplied to the thermal lesion through the electrode, resulting in localized tissuedeformation. Ultrasound echo signals acquired before and after the electrode-induced displacements are then utilized to generate strain images. However,these local strains depend on the modulus distribution of the tissue region beingimaged. Therefore, a quantitative evaluation of the conversion efficiency frommodulus contrast to strain contrast in electrode-displacement elastograms iswarranted. The contrast-transfer efficiency is defined as the ratio (in dB) ofthe observed elastographic strain contrast and the underlying true moduluscontrast. It represents a measure of the efficiency with which elastogramsdepict the underlying modulus distribution in tissue. In this paper, we develop acontrast-transfer efficiency formalism for electrode displacement elastography(referred to as contrast-transfer improvement). Changes in the contrast-transferimprovement as a function of the underlying true modulus contrast and thedepth of the inclusion in the simulated phantom are studied. We present finiteelement analyses obtained using a two-dimensional mechanical deformationand tissue motion model. The results obtained using finite element analysesare corroborated using experimental analysis and an ultrasound simulationprogram so as to incorporate noise artifacts.
0031-9155/06/246403+16$30.00 © 2006 IOP Publishing Ltd Printed in the UK 6403
6404 S Bharat and T Varghese
Introduction
Elastography is an imaging modality that involves the imaging of local strains incurred in tissueas a result of mechanical stimuli (Ophir et al 1991, Insana et al 2001, Varghese et al 2001, Hallet al 2003). Elastic properties of tissue are known to be correlated with pathological changesthat occur in tissue (Fung 1981). Cancers like scirrhous carcinoma of the breast manifestas extremely hard nodules (Anderson 1953, Ponnekanti et al 1995, Krouskop et al 1998).Hence, manual palpation has been extensively used for detection of tumours in the breast andprostate. However, this method is rendered ineffective when the tumours are small in sizeand located deep in the body. Sonography has also been utilized for imaging the extent ofabdominal lesions created using techniques such as radiofrequency (RF), microwave or high-intensity focused ultrasound (HIFU) ablations (Solbiati et al 1997a, 1997b, 2001). However,in many cases, lesions do not possess echogenic properties that differ from that of normaltissue, making them ultrasonically undetectable. For example, in spite of being significantlystiffer than surrounding normal tissue, tumours of the prostate may not be visible (isoechoic)in standard ultrasound examinations (Scheipers et al 2003). Also, similar acoustic backscatterproperties of the lesion and normal tissue lead to poor contrast on B-mode images (Goldberget al 1998, Goldberg 2001). Elastography is hypothesized to possess the ability to differentiatetumours or lesions from normal tissue with better contrast than currently achievable in existingimaging techniques.
External compression elastography, where tissue motion is induced using an externalcompression plate or by the ultrasound transducer itself, is the most common elastographicimaging technique (Ophir et al 1991, Insana et al 2001, Varghese et al 2001, Hall et al 2003).This method works well for superficial organs like the breast and prostate. However, in caseof abdominal organs like the liver and kidneys that are not directly accessible, compressionhas to be applied through the skin, leading to non-uniform contact between the compressorand the body, which culminates in elastograms with low signal-to-noise ratio (SNRe) andcontrast-to-noise ratio (CNRe). Other problems associated with imaging these organs usingthe external compression technique are excessive lateral and elevational motion caused bothdue to the compression process and physiological motion resulting from cardiovascular andrespiratory processes (Kolen et al 2002, Varghese et al 2002a, 2002b). An alternativemethod of introducing motion or deformation in tissue is possible for monitoring the sizeand extent of lesions created using RF ablation (Varghese et al 2002b, Jiang et al 2007, Bharatet al 2005).
Elastography has been used in the imaging of coagulated regions created using ablativetherapies (Stafford et al 1998, Righetti et al 1999, Wu et al 2001, Varghese et al 2002a, 2002b).RF ablation is a procedure where an electrode is placed into the area of tissue to be ablatedfor localized thermal therapy. Ionic agitation in the tissue adjacent to the electrically activeregion of the electrode causes intense localized heating, leading to instant tissue necrosis ifthe ablation temperature is greater than 60 ◦C (Solbiati et al 1997a). The resulting lesions areknown to be significantly stiffer than the untreated regions, due to a process known as proteindenaturation (Righetti et al 1999, Wu et al 2001, Varghese et al 2002b, 2003). This leads tothe possibility of elastographic imaging of these lesions. Electrode displacement elastographycan be used as an alternative to external compression elastography in this case, because ofthe imaging geometry. In this method, localized tissue motion is induced by applying minutedisplacements (on the order of a fraction of a millimetre) to the unconstrained end of the sameelectrode used to create the thermal lesion (Varghese et al 2002b, Jiang et al 2007, Bharat et al2005). This method of tissue displacement offers the flexibility of performing elastographicimaging either during or immediately after the RF ablation procedure.
Contrast-transfer improvement for electrode displacement elastography 6405
The resulting tissue motion or deformation due to electrode displacement is thereforelocalized and restricted to regions surrounding the RF electrode. In a recent study involvingexperiments on a single-inclusion tissue-mimicking (TM) phantom, we found that the observedstrain contrast on the electrode-displacement elastograms was consistently higher than theknown modulus contrast between the inclusion and the background (Bharat et al 2005). Thiswas a departure from the previously described contrast-transfer efficiency (CTE) criterion(Ponnekanti et al 1995, Kallel et al 1996) for external compression elastography, wherethe observed elastographic strain contrast was always less than or equal to the underlyingmodulus contrast. The CTE for external compression elastography is defined as the ratio ofthe observed elastographic strain contrast and the true underlying modulus contrast, expressedin decibels (dB). Since the quantity mapped in elastograms is the internal stain incurred intissue due to an external stimulus, the information depicted (strain) is not an inherent propertyof tissue, but is a function of the tissue characteristics (modulus) and the applied externalstimulus (stress). The CTE provides a quantitative measure of this conversion from theunderlying tissue modulus to the observed elastographic strains. Ponnekanti et al found thatstiffer lesions in a softer background were displayed on elastograms with a higher CTE, ascompared to softer lesions in a stiffer background (Ponnekanti et al 1995). Under all differentcontrast conditions, the CTE obtained was always less than 0 dB. An exception was the casewhere the true modulus contrast ratio between the lesion and the background was 1:1, wherethe CTE equalled 0 dB. In general, for stiffer lesions in a softer background, the observedstrain contrast was close to the true modulus contrast, while for softer lesions in a stifferbackground, the observed strain contrast was significantly lower than the actual moduluscontrast. In this paper, we present a CTE formalism for electrode-displacement elastography(referred to as contrast-transfer improvement (CTI), to differentiate it from the term ‘CTE’for external compression elastography) and compare results with that obtained for externalcompression elastography. We have included results from the finite element analysis (FEA)of two-dimensional tissue deformation for a simulated single inclusion phantom. The finiteelement analysis displacements are then incorporated into an ultrasound simulation program.Our simulation results are also corroborated by results obtained from phantom experiments.
Materials and methods
Finite element analysis
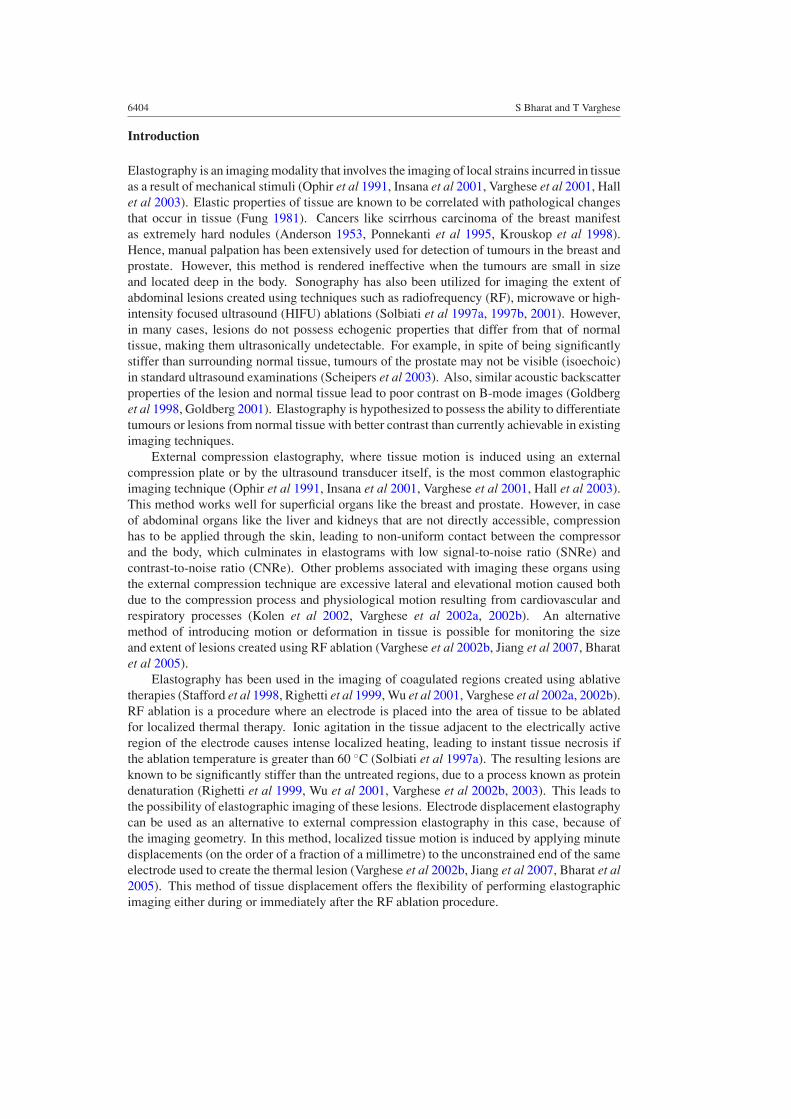
A commercial finite element analysis package, ANSYS (ANSYS Inc., Pittsburgh, PA, USA)was used for modelling the two-dimensional tissue deformation in response to the mechanicalstimuli. The dimensions of the two-dimensional (2D) tissue phantom were 120 mm (height) ×40 mm (width). A single cylindrical inclusion with a radius of 8 mm was incorporatedinto the simulated phantom. This cylindrical inclusion was centred at different depths(20 mm, 40 mm, 60 mm, 80 mm and 100 mm from the surface of the ultrasound transducer)in the background of the tissue phantom. Each depth was studied as a separate case. AnRF electrode, with a diameter of 1 mm, was embedded in the inclusion, with the lower endof the electrode extending 12 mm into the inclusion from the top surface of the phantom.Figure 1(a) shows a schematic representation of this model, with the inclusion centred at40 mm from the upper surface of the tissue background in the simulated phantom, which alsodenotes the surface of the ultrasound transducer. A second 2D tissue phantom with dimensions40 mm × 40 mm was also created for use in conjunction with a frequency-domain basedultrasound simulation program (Li and Zagzebski 1999). Details regarding this are providedin the next sub-section, where we will refer to this phantom as the ‘modified’ phantom.
6406 S Bharat and T Varghese
120 mm.
40 mm .
RF electrode
Background tissue
Inclusion (8 mm. radius)
40 mm.
(a) (b)
Figure 1. (a) The 2D ANSYS simulated phantom used to simulate RF electrode displacement.The displacements are applied to the upper unconstrained end of the RF electrode. (b) The nodalmesh created in ANSYS. The nodal displacements are used to calculate strains in the simulatedphantom.
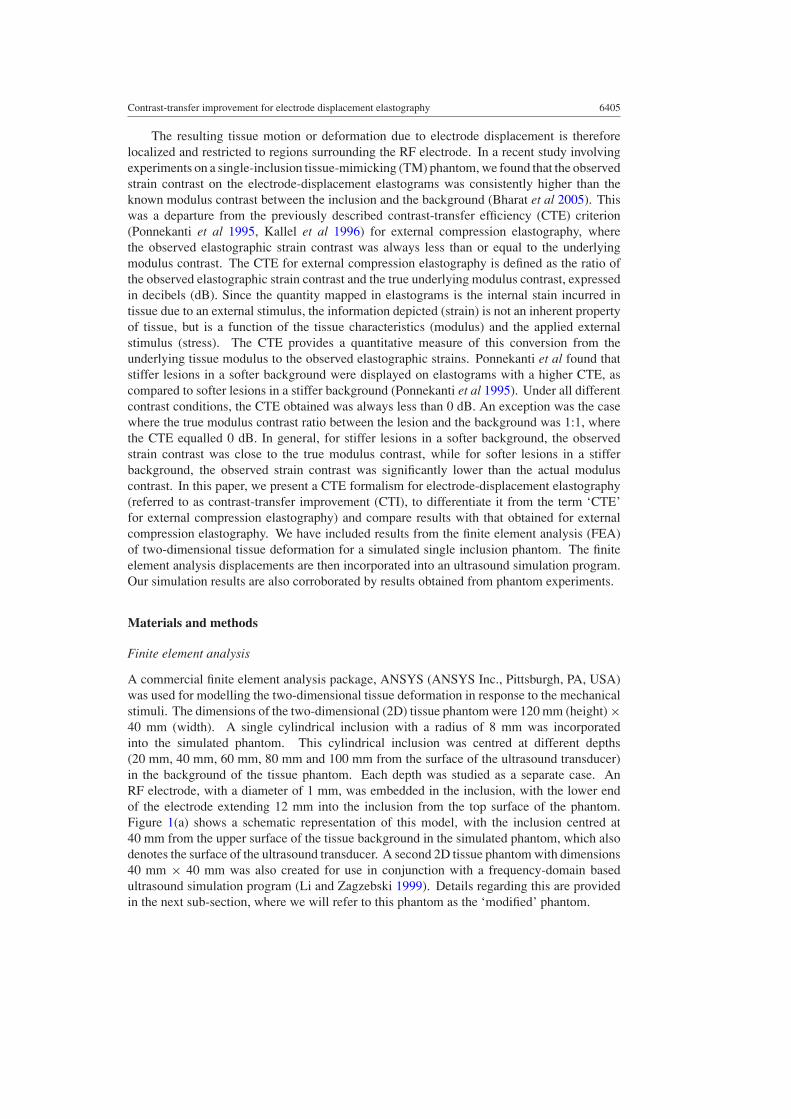
Table 1. The table presents the different moduli values used in the simulations and the resultingmodulus contrast between the inclusion and the background.
Modulus of Modulus Underlying true Underlying truethe inclusion of the modulus contrast ‘Ct’ modulus contrast(simulated lesion) background (ratio of inclusion and in dBin kPa in kPa background moduli) (20∗log10Ct)
1 10 1:10 −202 10 1:5 −13.97945 10 1:2 −6.0206
10 10 1:1 020 10 2:1 6.020650 10 5:1 13.9794
100 10 10:1 20
The mechanical properties of the simulated phantom were chosen such that the inclusion-background elastic moduli ratios and Poisson’s ratios match previously published values forliver tissue (Emelianov et al 1998, Wen Chun et al 2002, Kiss et al 2004). Both soft inclusionsin a stiffer background and stiffer inclusions in a soft background were simulated. Differentknown possibilities regarding the variations in tumour or inclusion stiffness were simulated.For example, hepatocellular carcinomas are known to be softer than a healthy liver (WenChun et al 2002), while haemangiomas appear as stiffer regions (when compared to healthytissue) on strain images. This appearance on strain images is probably due to the stiffer outershell that surrounds the softer haemangioma (Emelianov et al 1998). The elastic modulus ofthe background tissue (which models untreated tissue) was fixed at 10 kPa, while the elasticmodulus of the inclusion was varied from 1 kPa to 100 kPa in finite steps, thus leading toinclusion–background moduli ratios ranging from 1:10 to 10:1, respectively. Table 1 lists thevarious moduli values used for the inclusion and the resulting inclusion–background moduli
Contrast-transfer improvement for electrode displacement elastography 6407
ratios. Poisson’s ratio for both treated tissue (inclusion) and untreated tissue (background)was fixed at 0.495, to model the incompressible nature of soft tissue (Jiang et al 2007). Forthe RF ablation electrode, Young’s modulus and Poisson’s ratio were chosen to be those forgold (78 GPa and 0.44 respectively), assuming gold as the electrode material (Panescu 1997).
The density of the mesh utilized for the ANSYS simulated phantom was varied in thephantom, with regions closer to the tip of the RF electrode meshed with comparativelyhigher density (to obtain fine displacement estimates), since the displacement applied to theunconstrained end of the electrode would result in greater displacements in regions closer tothe electrode. On the other hand, the mesh applied to the background was coarser than thatapplied to the inclusion to improve the computational speed. In addition, the narrow width ofthe electrode made it imperative that the electrode be meshed with a fine mesh as well. Themeshed tissue model is illustrated in figure 1(b).
The ultrasound transducer used for imaging was assumed to be in the same plane as theRF electrode, in contact with the upper surface of the tissue model. Hence, for the 2D case,only the nodes belonging to the background and inclusion (and not the electrode) were selectedfor further processing to obtain axial strain images. Tissue motion was induced by applyingminute displacements (not greater than 2.4 mm) to the unconstrained end (top end) of the RFelectrode. The displacement can be either towards or away from the transducer. Implicit inthis technique is the assumption that part of the tissue in contact with the electrode is alwaysbound to the electrode. This has been shown to be the case with RF ablation and describedin the literature (Mikami et al 2004), where it was found that, during RF ablation, proteindestruction and carbonization occurring around the electrically active region of the ablationelectrode causes adhesion between the electrode and the ablated tissue (i.e. the inclusion inour simulated phantom). In addition, there is no adhesion between the electrode and thebackground (which corresponds to untreated tissue after the ablation procedure). The contactinteraction between the background and the electrode is entirely governed by the coefficient offriction between the electrode and the background (Serway 1990). We found in our simulationsthat varying the coefficient of friction from 0.01 to 0.99 does not significantly affect the straincontrast and subsequently the CTI of the resulting strain images. The statistical significancein the dependence of the CTI on the coefficient of friction was evaluated using a pairedt-test and the p-value obtained was 0.0984, indicating that the CTI in electrode displacementelastography does not depend on the coefficient of friction.
The different boundary conditions associated with the displacement of the RF electrodetowards and away from the transducer are discussed below. For the case where the RFelectrode displacement is moved towards the transducer, the ultrasound transducer constrainsthe motion of the upper boundary of the simulated tissue phantom in the vertical direction(Jiang et al 2007). In addition, since the applied displacement causes localized motion, weassume that the sides and bottom of the simulated phantom do not move. For the case of RFelectrode displacement away from the transducer, all the above boundary conditions remainthe same except that for the upper surface of the simulated phantom which is in contact withthe transducer. Since the transducer in this case does not constrain the upper surface, thevertical constraint for this surface is relaxed (Jiang et al 2007).
The axial nodal displacements resulting from a 0.6 mm perturbation of the electrode werefed into a linear least squares program for strain calculation, implemented in Matlab (TheMathWorks, Natick, MA, USA), after performing bilinear interpolation to obtain displacementestimates in a regular 2D Cartesian matrix format. For the ideal FEA strain images, the trendsin CTI were evaluated for different underlying modulus contrasts between the inclusionand background (10:1, 5:1, 2:1, 1:1, 1:2, 1:5 and 1:10) and for different inclusion depths(20 mm, 40 mm, 60 mm, 80 mm and 100 mm from the surface of the ultrasound transducer).

6408 S Bharat and T Varghese
All these cases were studied for RF electrode displacement both towards and away from theultrasound transducer. The external compression CTE values for different underlying truemodulus contrasts were obtained from the results published by Ponnekanti et al ( 1995).
Ultrasound simulation program
In addition to evaluating the ideal strain images obtained from the axial displacements resultingfrom the FEA, we evaluated the contribution of ultrasonic speckle to the CTI. An ultrasoundsimulation program was used to simulate pre- and post-displacement RF data based on the FEAdisplacement data. In our simulations, we used a frequency-domain ultrasound simulationprogram developed by Li and Zagzebski (1999). The inputs to this program were the lateral andaxial displacement fields from ANSYS, after appropriate interpolation to a regular Cartesiangrid. A 128 element linear array transducer consisting of 0.15 mm × 10 mm elements with a0.2 mm centre-to-centre separation was used in the simulation. Gaussian shaped incidentpulses with a centre frequency of 10 MHz and an 80 % bandwidth (full-width at half-maximum)were modelled. Scatterers in the medium were modelled using 100 µm radius polystyrenebeads, which were randomly distributed in the phantom at a high enough number density(per resolution cell) to ensure Rayleigh scattering (Wagner et al 1983). Finally, the speed ofsound for the phantom was assumed to be 1540 m s−1 and attenuation effects were ignoredto minimize computational complexity. The pre- and post-displacement RF data from thissimulation program were compared using a one-dimensional (1D) cross-correlation programin Matlab to calculate the axial displacement field. A linear least squares method was used tocalculate the axial strain distribution. This axial strain map obtained constitutes the ‘simulated’strain images, which are compared with the ideal FEA strain images obtained earlier.
To reduce the computational time, the ‘modified’ phantom mentioned earlier was usedand the nodal displacements from this modified ANSYS-simulated phantom were used inthe ultrasound simulation program. Eight independent runs of the ultrasound simulationwere carried out to generate errorbars for comparison with the FEA-generated results.Figure 2(a) shows a simulated B-mode image for an 8 mm radius cylindrical inclusion centred at20 mm in a 40 mm × 40 mm phantom. Figures 2(b) and (c) show corresponding strain imagesfrom the FEA and ultrasound simulation, respectively. The changes in CTI at different trueinclusion–background modulus contrasts were used for comparison between the ideal andsimulated strain images.
Tissue-mimicking phantom
The CTI values obtained from FEA-generated strain images were also validated using CTIvalues obtained from experimental strain images of a custom-made tissue mimicking (TM)phantom. A schematic diagram of the TM phantom for electrode displacement elastographyis shown in figure 3. The TM materials used in the phantom have been described previously(Madsen et al 2003) and consist of dispersions of microscopic safflower oil droplets in agelatin matrix. The 19 mm diameter spherical inclusion was formed and bonded around thehooked end of a stainless steel rod, the latter representing an ablation electrode. A storagemodulus (real part of the complex Young’s modulus) of 50 ± 2 kPa was measured at 1 Hz forthe inclusion material using a Bose EnduraTEC R© model 3200 system (Madsen et al 2005).Surrounding the inclusion and bonded to it is the background material with a storage modulusof 11 ± 2 kPa. Thus, the inclusion is approximately five times stiffer than the background.Oil droplets in both materials provide tissue-like ultrasonic backscatter and attenuation. Theinclusion is centred in the 12 cm × 12 cm × 12 cm cube of background material.

Contrast-transfer improvement for electrode displacement elastography 6409
0
0.01
0.02
Dep
th (
mm
)
0 10 20 30 40
0
10
20
30
(b)
Width (mm)
Dep
th (
mm
)
0 10 20 30 40
0
10
20
30
0
0.005
0.01
0.015
0.02
Dep
th (
mm
)
0 10 20 30 40
0
10
20
30
Width (mm)
Width (mm)
(a)
(c)
Figure 2. (a) B-mode image from the US simulation program. (b) Ideal strain image obtainedfrom FEA-generated displacements. (c) Simulated strain image, obtained using pre- and post-displacement data gathered from the US simulation program.
To generate elastograms, the simulated electrode was displaced vertically using a steppermotor system, producing a maximum displacement of 0.2 mm. Two real-time ultrasoundscanners, namely an Ultrasonix 500RP (Ultrasonix Medical Corporation, Bothell, WA, USA)and an Aloka SSD 2000 (Aloka, Tokyo, Japan), were used to acquire RF data. Lineararray transducers having a centre frequency of 5 MHz were used. The Ultrasonix transducerhas a 49 mm footprint with a 60% bandwidth, while the transducer used with the AlokaSSD 2000 system has a 40 mm footprint with a 70% bandwidth. In the case of the Ultrasonix500RP system, digitization of RF echo signals was performed internally at a 40 MHz samplingfrequency, while for the Aloka SSD 2000 system, digitization was performed using an external12-bit data acquisition board (Gage, Montreal, QC, Canada) at a sampling rate of 100 MHz.
The ultrasound transducer was placed adjacent to the electrode, in a plane approximatelyparallel to that of the electrode as shown in figure 3. Pre- and post-displacement RF datawere acquired for two different displacement conditions: (1) displacement of the RF electrode(inclusion) away from the ultrasound transducer and (2) displacement of the RF electrode(inclusion) towards the ultrasound transducer, the latter following an initial displacement of0.25 mm away from the transducer. Ten independent data sets were acquired for a 0.2 mmdisplacement, for both the above-mentioned data acquisition methods. Higher displacementsof the electrode were avoided so as to prevent damage by way of loss of bonding of theinclusion to the hooked end of the electrode. The ten data sets were acquired by rotatingthe ultrasound transducer around the electrode and recording one data set for a particular

6410 S Bharat and T Varghese
Figure 3. Experimental set-up showing the single-spherical inclusion phantom with an electrodeembedded in the inclusion. RF electrode displacement for elastography is induced by applyingprecise, stepper-motor controlled displacements to the upper unconstrained end of the electrode.Pre- and post-displacement raw RF data are collected using the ultrasound transducer positionedadjacent to the electrode.
orientation of the transducer with respect to the electrode to obtain independent data sets.Again, a 1D cross correlation algorithm in conjunction with a linear least-squares method wasused to estimate axial strains resulting from the electrode perturbations.
Computation of the CTI
Ponnekanti et al described the CTE as the ratio of the observed elastographic strain contrastand the true underlying modulus contrast, for external compression elastography (Ponnekantiet al 1995). Mathematically, it is given by the following equations:
CTE = Co
Ct(1)
In dB, CTE(dB) = Co(dB) − Ct(dB) (2)
where Co is the observed elastographic strain contrast and Ct is the true underlying moduluscontrast. In this case, contrast is defined to be between the inclusion and the background.

Contrast-transfer improvement for electrode displacement elastography 6411
0
0.015
0.03
Width (mm)
Dep
th (
mm
)
0 20 40
0
40
80
ROI 2
ROI 1
Figure 4. Illustration of the CTI computation using pixel values from the regions of interest (ROIs)shown on the strain image.
Mathematically, the expression for the CTI is the same as that for the CTE (equations (1)and (2)). For calculating the values of Co under different conditions, rectangular regionsof interest (ROIs) were selected within the inclusion and in the background, as shown infigure 4. The main difference in the method of CTI calculation for electrode displacementelastography versus CTE for external compression elastography is the selection of the ROI inthe background. Ponnekanti et al used the mean value of all the background strain pixels inthe absence of the inclusion as an estimate of the background strain (Ponnekanti et al 1995),whereas we use a rectangular ROI (ROI 2) to calculate the value of background strain to beused in the strain contrast calculation. The reasoning behind the choice of ROI 2 is presentedin the next paragraph. The ratio of the mean pixel value in ROI 2 and the mean pixel valuein ROI 1 is then taken to be the value of Co. ROI 1 within the inclusion was chosen so asto maximize the number of pixels used for calculation, subject to the constraint that they laywithin the inclusion.
An important characteristic of the electrode displacement method is the localized natureof the displacements. As observed in figure 4, the local strains or displacements to the rightand left side of the inclusion are very small. We did not choose our background ROI (ROI 2) tolie in these regions of low strain, as they would not then accurately represent the backgroundstrain. This precluded the use of all background pixels in the calculation of the backgroundstrain and necessitated the use of an ROI. Regarding the choice of the ROI location, thisleft the regions above and below the inclusion as possible locations for ROI 2. The regionfor the ROI 2 in the background was selected slightly above the inclusion, as illustrated infigure 4. However, a similar region can also be selected below the inclusion. The otherparameter to be selected was the position of the background ROI 2 above the inclusion. Wechose ROI 2 to be as close to the inclusion as possible, while avoiding the regions of highstrain values just above the inclusion. Since these regions have increased strain, they couldsuffer from increased decorrelation resulting from higher (or possibly lateral) displacementsthat could not be tracked by the algorithm for the simulated and experimental elastograms.The reason for choosing a location near the inclusion for ROI 2 is because the visual contrastdemarcation is generally made by the human eye for regions located close to each other.

6412 S Bharat and T Varghese
Width (mm)
Dep
th (
mm
)
0 20 40
0
40
80
120
10:1
(a)
Width (mm)D
epth
(m
m)
0 20 40
0
40
80
120
1:1
(b)
1:10
(c)
Width (mm)
Dep
th (
mm
)
0 20 40
0
40
80
120
Figure 5. Ideal strain images obtained from FEA-generated displacements, for different inclusion–background modulus contrasts of (a) 10:1, (b) 1:1 and (c) 1:10, respectively.
The true modulus contrast, Ct, is obtained from the modulus values of the inclusion and thebackground that is input to the ANSYS simulated phantom.
The CTI describes the mechanical efficiency with which the strain elastograms depict theunderlying modulus distribution. If the applied stress field is uniform throughout the phantom,then the relationship between the modulus and the strain would be linear, and we would expecta CTI of 1 (or 0 dB) when the moduli of the inclusion and the background are the same (similarto the CTE for external compression elastography).
Results
The trends in CTI were studied as a function of true modulus contrast and inclusiondepth within the simulated phantom, for RF electrode displacement both towards and awayfrom the ultrasound transducer. Figure 5 shows sample strain images generated usinglocal displacements obtained from the FEA simulations, for the three different inclusion–background modulus contrasts, namely 10:1, 1:1 and 1:10. Figure 6 illustrates the trends inCTI as a function of different underlying modulus contrasts. The horizontal axis (x-axis) isthe underlying modulus contrast of the inclusion and background. The vertical axis (y-axis)stands for CTI values corresponding to different modulus contrasts. All data points to the leftof the x = 0 plane represent CTI values for softer inclusions in a stiffer background, whileall data points to the right of the x = 0 plane represent CTI values for stiffer inclusions in asofter background. This plot displays CTI results from the 120 mm × 40 mm FEA simulatedphantom, for the inclusion centred at 40 mm from the transducer and a 0.6 mm displacementof the electrode both towards and away from the transducer.
Figure 6 also shows the CTE values corresponding to the external compression method(Ponnekanti et al 1995, Kallel et al 1996). Note that the CTI trend for electrode displacementelastography follows the CTE curve for external compression elastography, for the caseof softer inclusions in a stiffer background. In other words, the curves are similar to theleft of the 0 dB point on the x-axis. However, in the case of stiffer inclusions in a softerbackground, the CTI values for electrode displacement elastography are significantly higher

Contrast-transfer improvement for electrode displacement elastography 6413
Figure 6. The variation in CTI for different true modulus contrasts is shown here. The strainimages used to calculate the CTI are obtained from FEA-generated displacements. Two cases forelectrode displacement (ED) elastography are shown, namely RF electrode displacement towardsand away from the transducer. CTE data for external compression (EC) elastography are providedas a measure for comparison. Also, the standard error for the experimental CTI (for strain imagesobtained from the TM phantom) is shown superimposed on the graph for CTI from FEA-generatedstrain images. The two different errorbars shown correspond to the standard deviation for the casesof RF electrode displacement towards and away from the transducer.
(This figure is in colour only in the electronic version)
than the corresponding CTE for external compression elastography. CTI values for both thedisplacement directions in electrode displacement elastography are fairly similar, for all valuesof the underlying modulus contrast. Figure 6 also displays a comparison between the CTIvalues for the FEA and experimental strain images, which will be discussed later.
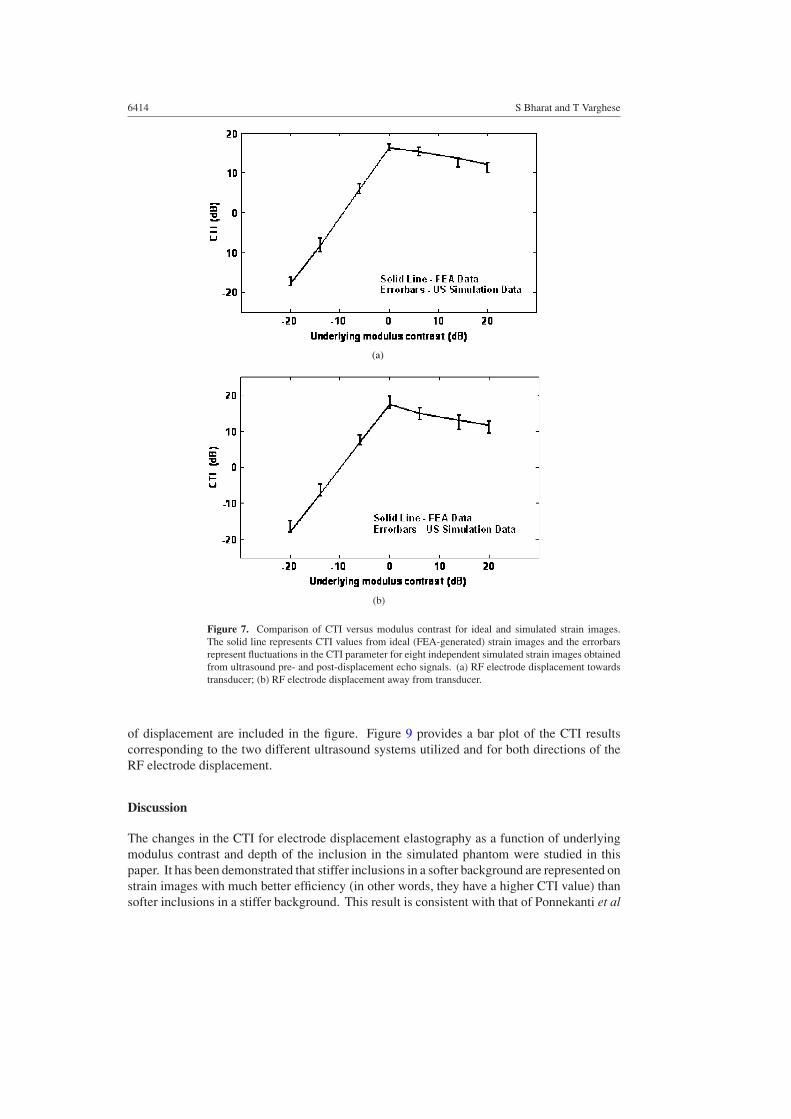
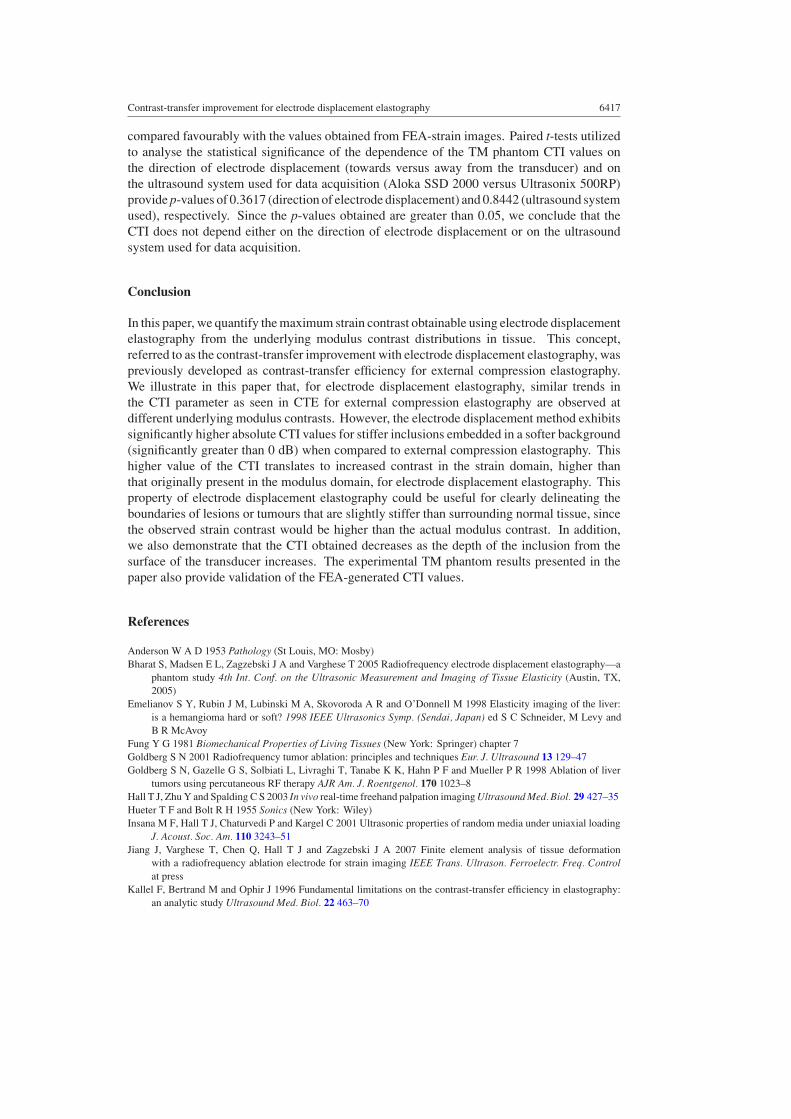
Figure 7 shows the CTI results obtained using the ultrasound simulation program aserrorbars resulting from eight independent realizations for each value of the modulus contrast.The results here represent both RF electrode displacement towards the transducer (figure 7(a))and RF electrode displacement away from the transducer (figure 7(b)). The solid lines in theplots represent CTI values from FEA-generated strain images. The FEA simulated phantomused had dimensions of 40 mm × 40 mm, where the displacements obtained after the RFelectrode displacement was utilized in the ultrasound simulation program. The errorbarsdenotes the variation in the CTI, computed from the strain images using the ultrasoundsimulated data. The plots show good agreement between the CTI values for FEA and simulatedstrain images, for both directions of RF electrode displacement.
Figure 8 presents plots of the variation in CTI as a function of the depth of the inclusion.Note that the CTI value progressively decreases as a function of the inclusion depth. Observethat shallower inclusions have a higher CTI value than deeper inclusions. Figures 6 and 9provide a comparison between the CTI values for the FEA and experimental strain images.Since the experimental phantom used had a modulus contrast of approximately 5:1 betweenthe inclusion and the background, only one value of the modulus contrast was compared.Figure 6 shows a superimposition of the experimental CTI phantom results on the CTI plotfor ideal strain images. The errorbars represent results from ten independent experiments, asdiscussed in the ‘materials and methods’ section. Results corresponding to both directions
6414 S Bharat and T Varghese
(a)
(b)
Figure 7. Comparison of CTI versus modulus contrast for ideal and simulated strain images.The solid line represents CTI values from ideal (FEA-generated) strain images and the errorbarsrepresent fluctuations in the CTI parameter for eight independent simulated strain images obtainedfrom ultrasound pre- and post-displacement echo signals. (a) RF electrode displacement towardstransducer; (b) RF electrode displacement away from transducer.
of displacement are included in the figure. Figure 9 provides a bar plot of the CTI resultscorresponding to the two different ultrasound systems utilized and for both directions of theRF electrode displacement.
Discussion
The changes in the CTI for electrode displacement elastography as a function of underlyingmodulus contrast and depth of the inclusion in the simulated phantom were studied in thispaper. It has been demonstrated that stiffer inclusions in a softer background are represented onstrain images with much better efficiency (in other words, they have a higher CTI value) thansofter inclusions in a stiffer background. This result is consistent with that of Ponnekanti et al

Contrast-transfer improvement for electrode displacement elastography 6415
Figure 8. The changes in CTI as a function of the depth of the inclusion, where the location ofthe inclusion is progressively varied in finite steps from a depth of 20 mm (closest to the surface)to a depth of 100 mm (farthest from the surface). The strain images used to calculate the CTI areobtained from FEA-generated displacements.
Figure 9. Bar graph showing the variations in CTI for data collected using two different ultrasoundsystems and for both directions of displacement. The height of the solid bars represents the CTIvalue for ideal strain images, while the errorbars represent standard deviation of experimental CTIvalues for each case.
(1995), who found similar characteristics for the CTE in external compression elastography.These results can be traced back to an important finding made in the mid-1950s, whenit was found that softer inclusions in a stiffer background appear stiffer than they reallyare, albeit when Poisson’s ratio is non-zero (Hueter and Bolt 1955). Since we assumePoisson’s ratio of 0.495 to simulate the incompressibility property of tissue, the low CTIfor softer inclusions in a stiffer background can be attributed to this effect (Ponnekantiet al 1995). Intuitively, these trends can be understood by observing figures 5(a)–(c). A stifferinclusion in a softer background (10:1 modulus contrast, figure 5 (a)) can be visually delineatedmuch better on the elastogram than a softer inclusion in a stiffer background (1:10 moduluscontrast, figure 5(c)). Another apparent similarity between electrode displacement and externalcompression elastography is that the CTI curve peaks at a 0 dB modulus contrast. Also,

6416 S Bharat and T Varghese
low contrast inclusions are represented on strain images with higher CTI than correspondinghigh contrast inclusions.
Though the above-mentioned similarities in the CTI and CTE trend exist for electrodedisplacement and external compression elastography, respectively, a significant difference inthe absolute values of the CTI/CTE parameter for both methods can be clearly visualized.In external compression elastograms, the maximum CTE value reached is 0 dB (at 0 dB truemodulus contrast), while electrode displacement elastograms have CTI values much in excessof 0 dB (approximately 10–15 dB for stiffer inclusions). In other words, this is representativeof the fact that, in electrode displacement elastography, the elastographic strain contrast isactually higher than the true underlying modulus contrast. We first observed this effect inour laboratory, while performing experiments on the specially constructed TM phantom forelectrode displacement elastography (Bharat et al 2005). A possible explanation for this effectmay lie in the mode of tissue perturbation utilized for electrode displacement elastography.Since displacements are applied only to the RF electrode and not uniformly over the entiresimulated phantom surface (as in external compression elastography), the resulting tissuemotion is restricted to regions in contact with the electrode along its path in tissue. Thisresults in higher strains in regions adjacent to the electrode and a reduction in strain as wemove away from the electrode in a direction perpendicular to the electrode. Hence, viablestrain or displacement information is only available in the regions close to the electrode. Thisentailed utilizing the higher strain regions, as shown in figure 4, to represent ‘backgroundstrain’ and effectively resulted in a higher elastographic strain contrast and subsequent CTIestimate. Having said so, these increased strains above and below the inclusion improve lesiondetection in a clinical set-up, as it provides added contrast even for low-contrast situations. Forexample, a lesion which is only twice as stiff as the surrounding normal tissue may show upon an electrode displacement elastogram with a much higher strain contrast, leading to moreefficient detection (in terms of the strain contrast or the CTI) and in boundary delineation.
As mentioned earlier, the electrode was displaced by 0.6 mm in our simulations. Higherdisplacements of the RF electrode would increase the localized displacement and deformationof the inclusion resulting in increased signal decorrelation, similar to that observed withexternal compression elastography. Larger displacements in our phantom experiments wererestricted due to the possibility of damaging the phantom in terms of the loss of bondingcontact between the electrode and the TM material. Similarly, in clinical situations, increaseddisplacements would lead to loss of contact between the electrically active regions of theelectrode and the ablated tissue, which would in turn render this method ineffective.
The depth of the inclusion has an impact on the CTI parameter, with shallower inclusionshaving higher CTI values than deeper inclusions. The effect of this decrease in the CTI withdepth, however, is not visually discernable in the strain images. The decrease in CTI withdepth is due to the reduced effective force (stress) on the inclusion. Since the external force isonly applied at the upper end of the electrode, the effective force transmitted to the inclusionis lower for deeper inclusions. This was confirmed independently by FEA simulations wherethe length of the RF electrode was varied, while the depth of the inclusion was maintainedconstant. A paired t-test was utilized to characterize the depth-dependence of the CTI. Thep-value obtained was 0.0159. Since the p-value is less than 0.05, we concluded that the dropin CTI as a function of inclusion depth is significant. Lastly, although our simulations did notincorporate ultrasonic attenuation effects, it must be noted that increased attenuation wouldlead to a lower sonographic signal-to-noise ratio (SNRs) resulting in reduced SNRe in strainimages of inclusions at greater depths (18–20 cm) (Varghese and Ophir 1997).
The CTI results presented in this paper are also corroborated with the experimentallyobtained values of the CTI, for the modulus contrast obtained with the TM phantom, which
Contrast-transfer improvement for electrode displacement elastography 6417
compared favourably with the values obtained from FEA-strain images. Paired t-tests utilizedto analyse the statistical significance of the dependence of the TM phantom CTI values onthe direction of electrode displacement (towards versus away from the transducer) and onthe ultrasound system used for data acquisition (Aloka SSD 2000 versus Ultrasonix 500RP)provide p-values of 0.3617 (direction of electrode displacement) and 0.8442 (ultrasound systemused), respectively. Since the p-values obtained are greater than 0.05, we conclude that theCTI does not depend either on the direction of electrode displacement or on the ultrasoundsystem used for data acquisition.
Conclusion
In this paper, we quantify the maximum strain contrast obtainable using electrode displacementelastography from the underlying modulus contrast distributions in tissue. This concept,referred to as the contrast-transfer improvement with electrode displacement elastography, waspreviously developed as contrast-transfer efficiency for external compression elastography.We illustrate in this paper that, for electrode displacement elastography, similar trends inthe CTI parameter as seen in CTE for external compression elastography are observed atdifferent underlying modulus contrasts. However, the electrode displacement method exhibitssignificantly higher absolute CTI values for stiffer inclusions embedded in a softer background(significantly greater than 0 dB) when compared to external compression elastography. Thishigher value of the CTI translates to increased contrast in the strain domain, higher thanthat originally present in the modulus domain, for electrode displacement elastography. Thisproperty of electrode displacement elastography could be useful for clearly delineating theboundaries of lesions or tumours that are slightly stiffer than surrounding normal tissue, sincethe observed strain contrast would be higher than the actual modulus contrast. In addition,we also demonstrate that the CTI obtained decreases as the depth of the inclusion from thesurface of the transducer increases. The experimental TM phantom results presented in thepaper also provide validation of the FEA-generated CTI values.
References
Anderson W A D 1953 Pathology (St Louis, MO: Mosby)Bharat S, Madsen E L, Zagzebski J A and Varghese T 2005 Radiofrequency electrode displacement elastography—a
phantom study 4th Int. Conf. on the Ultrasonic Measurement and Imaging of Tissue Elasticity (Austin, TX,2005)
Emelianov S Y, Rubin J M, Lubinski M A, Skovoroda A R and O’Donnell M 1998 Elasticity imaging of the liver:is a hemangioma hard or soft? 1998 IEEE Ultrasonics Symp. (Sendai, Japan) ed S C Schneider, M Levy andB R McAvoy
Fung Y G 1981 Biomechanical Properties of Living Tissues (New York: Springer) chapter 7Goldberg S N 2001 Radiofrequency tumor ablation: principles and techniques Eur. J. Ultrasound 13 129–47Goldberg S N, Gazelle G S, Solbiati L, Livraghi T, Tanabe K K, Hahn P F and Mueller P R 1998 Ablation of liver
tumors using percutaneous RF therapy AJR Am. J. Roentgenol. 170 1023–8Hall T J, Zhu Y and Spalding C S 2003 In vivo real-time freehand palpation imaging Ultrasound Med. Biol. 29 427–35Hueter T F and Bolt R H 1955 Sonics (New York: Wiley)Insana M F, Hall T J, Chaturvedi P and Kargel C 2001 Ultrasonic properties of random media under uniaxial loading
J. Acoust. Soc. Am. 110 3243–51Jiang J, Varghese T, Chen Q, Hall T J and Zagzebski J A 2007 Finite element analysis of tissue deformation
with a radiofrequency ablation electrode for strain imaging IEEE Trans. Ultrason. Ferroelectr. Freq. Controlat press
Kallel F, Bertrand M and Ophir J 1996 Fundamental limitations on the contrast-transfer efficiency in elastography:an analytic study Ultrasound Med. Biol. 22 463–70

6418 S Bharat and T Varghese
Kiss M Z, Varghese T and Hall T J 2004 Viscoelastic characterization of in vitro canine tissue Phys. Med.Biol. 49 4207–18
Kolen A F, Bamber J C and Ahmed E E 2002 Analysis of cardiovascular induced liver motion for application toelasticity imaging of the liver in vivo J. Ultrasound Med. 21 S53 (Abstract)
Krouskop T A, Wheeler T M, Kallel F and Hall T 1998 The elastic moduli of breast and prostate tissues undercompression Ultrason. Imaging 20 260–74
Li Y and Zagzebski J A 1999 Frequency domain model for generating B-mode images with array transducers IEEETrans. Ultrason. Ferroelectr. Freq. Control 46 690–9
Madsen E L, Frank G R, Krouskop T A, Varghese T, Kallel F and Ophir J 2003 Tissue-mimicking oil-in-gelatinemulsions for use in heterogeneous elastography phantoms Ultrason. Imaging 25 17–38
Madsen E L, Hobson M A, Shi H, Varghese T and Frank G R 2005 Tissue-mimicking Agar/gelatin Materials for usein Heterogeneous Elastography Phantoms Phys. Med. Biol. 50 5597–618
Mikami T and T A and H K 2004 Performance of bipolar forceps during coagulation and its dependence on the tipmaterial: a quantitative experiment assay Neurosurgery 100 133–8
Ophir J, Cespedes I, Ponnekanti H, Yazdi Y and Li X 1991 Elastography: a quantitative method for imaging theelasticity of biological tissues Ultrason. Imaging 13 111–34
Panescu D 1997 Intraventricular electrogram mapping and radiofrequency cardiac ablation for ventricular tachycardiaPhysiol. Meas. 18 1–38
Ponnekanti H, Ophir J, Yijun H and Cespedes I 1995 Fundamental mechanical limitations on the visualization ofelasticity contrast in elastography Ultrasound Med. Biol. 21 533–43
Righetti R, Kallel F, Stafford R J, Price R E, Krouskop T A, Hazle J D and Ophir J 1999 Elastographic characterizationof HIFU-induced lesions in canine livers Ultrasound Med. Biol. 25 1099–113
Scheipers U, Ermert H, Sommerfeld H J, Garcia-Schurmann M, Senge T and Philippou S 2003 Ultrasonic multifeaturetissue characterization for prostate diagnostics Ultrasound Med. Biol. 29 1137–49
Serway R A 1990 Physics for Scientists and Engineers 3rd edn (Philadelphia, PA: Saunders)Solbiati L, Goldberg S N, Ierace T, Livraghi T, Meloni F, Dellanoce M, Sironi S and Gazelle G S 1997a Hepatic
metastases: percutaneous radio-frequency ablation with cooled-tip electrodes Radiology 205 367–73Solbiati L et al 1997b Percutaneous US-guided radio-frequency tissue ablation of liver metastases: treatment and
follow-up in 16 patients Radiology 202 195–203Solbiati L, Ierace T, Tonolini M, Osti V and Cova L 2001 Radiofrequency thermal ablation of hepatic metastases Eur.
J. Ultrasound 13 149–58Stafford R J, Kallel F, Price R E, Cromeens D M, Krouskop T A, Hazle J D and Ophir J 1998 Elastographic imaging
of thermal lesions in soft tissue: a preliminary study in vitro Ultrasound Med. Biol. 24 1449–58Varghese T and Ophir J 1997 The nonstationary strain filter in elastography: I. Frequency dependent attenuation
Ultrasound Med. Biol. 23 1343–56Varghese T, Ophir J, Konofagou E, Kallel F and Righetti R 2001 Tradeoffs in elastographic imaging Ultrason. Imaging
23 216–48Varghese T, Techavipoo U, Liu W, Zagzebski J A, Chen Q, Frank G and Lee F T Jr 2003 Elastographic measurement
of the areas and volumes of thermal lesions resulting from radiofrequency ablation: pathologic correlation AJRAm. J. Roentgenol. 181 701–7
Varghese T, Zagzebski J A and Lee F T Jr 2002b Elastographic imaging of thermal lesions in the liver in vivo followingradiofrequency ablation: preliminary results Ultrasound Med. Biol. 28 1467–73
Varghese T, Zagzebski J A, Techavipoo U and Chen Q 2002a Elastographic Imaging of in-vivo soft tissue US PatentP02153US
Wagner R F, Smith S W, Sandrik J M and Lopez H 1983 Statistics of speckle in ultrasound B-scans IEEE Trans.Sonics Ultrason. 30 156–63
Wen Chun Y, Pai Chi L, Yung Ming J, Hey Chi H, Po Ling K, Meng Lin L, Pei Ming Y and Po Huang L 2002 Elasticmodulus measurements of human liver and correlation with pathology Ultrasound Med. Biol. 28 467–74
Wu T, Felmlee J P, Greenleaf J F, Riederer S J and Ehman R L 2001 Assessment of thermal tissue ablation with MRelastography Magn. Reson. Med. 45 80–7