contribution of the u - economic growth...
TRANSCRIPT

CONTRIBUTION OF THE U.S. MOTOR VEHICLE INDUSTRY
TO THE ECONOMIES OF THE UNITED STATES, CALIFORNIA, NEW YORK, AND NEW JERSEY IN 2003
Prepared for Alliance of Automobile Manufacturers, Inc.
Prepared by Institute of Labor and Industrial Relations
University of Michigan
and Economics and Business Group Center for Automotive Research
May 2004 The statements, findings, and conclusions herein are those of the authors and do not necessarily reflect the views of the project sponsor.
CONTRIBUTION OF THE U.S. MOTOR VEHICLE INDUSTRY TO THE ECONOMIES OF THE UNITED STATES,
CALIFORNIA, NEW YORK, AND NEW JERSEY IN 2003
EXECUTIVE SUMMARY
�� The purpose of this study is to update our previous study to estimate the contribution of the U.S. motor vehicle industry in 2003 to the economies of the United States, California, New York, and New Jersey.
�� The estimates are generated using a state-of-the-art economic model in conjunction with survey data from twenty-one automotive firms in the United States and from the National Automobile Dealers Association. The results include the effects of new motor vehicle retail activities and industry spin-off activities.
�� The employment contribution associated with automotive manufacturing activity in the United States is estimated to be about 5.2 million jobs in the private sector, and the compensation contribution is estimated to be almost $250 billion, measured in 2003 dollars. The comparable employment and compensation contributions for California are 321,000 jobs and over $17 billion in compensation; for New Jersey, 111,100 jobs and $6.5 billion; and for New York, 194,200 jobs and $11.7 billion.
�� The employment contribution associated with new-vehicle-related sales and service activity in the United States is estimated to be about 1.9 million jobs in the private sector, and the compensation contribution is estimated to be over $86 billion, measured in 2003 dollars. The comparable employment and compensation contributions for California are 235,400 jobs and $12.3 billion in compensation; for New Jersey, 58,600 jobs and $3.3 billion; and for New York, 94,900 jobs and $5.5 billion.
�� The employment contribution associated with the total automotive industry, combining new vehicle production, sales, and service is estimated to be 7,057,300 jobs in the private sector of the U.S. economy, and the compensation contribution is estimated to be almost $335 billion, measured in 2003 dollars. The comparable employment and compensation contributions for California are 556,500 jobs and $29.5 billion in compensation; for New Jersey, 169,700 jobs and $9.8 billion; and for New York, 289,100 jobs and $17.2 billion.
�� There are yet more potential benefits that cannot be quantified, such as the intangible advantages of technological transfers associated with the U.S. motor vehicle industry. Nevertheless, the results of the study do confirm that the health of the automotive industry is very important to the overall health of the United States economy.
ACKNOWLEDGMENTS
This report is a joint effort of staff members from two institutions: the Institute of Labor
and Industrial Relations (ILIR) at the University of Michigan and the Economics and
Business Group at the Center for Automotive Research (CAR) in Ann Arbor, Michigan.
We would like to give special recognition to a staff member at each institution.
Jacqueline Murray of ILIR edited the main body of the study, including both text and
formatting; the quality of the presentation has been greatly enhanced by her efforts.
Bernard Swiecki of CAR administered the critical industry data collection process of the
study and interacted with analysts at each of the auto firms. This was a significant effort
and Bernard carried it out with dedication and persistence. We would also like to thank
Sherri Lawrence and George Treyz at Regional Economic Models, Inc., for their
guidance on certain aspects of the project. We are indebted to Paul Taylor, Chief
Economist of the National Automobile Dealers Association, who provided key data and
insights on the vehicle dealership part of the study.
Finally, we gratefully express our appreciation to the Alliance of Automobile
Manufacturers, Inc., for the opportunity to carry out the study, and to the staff from
twenty-one automotive companies who contributed their time to provide the information
without which the study would not have gotten off the ground.
�The Authors
CONTRIBUTION OF THE U.S. MOTOR VEHICLE INDUSTRY TO THE ECONOMIES OF THE UNITED STATES,
CALIFORNIA, NEW YORK, AND NEW JERSEY IN 2003
INTRODUCTION
The motor vehicle industry continues to be one of the most important sectors of the U.S.
economy. It is sufficiently prominent to influence the movements of Gross Domestic
Product, and it employs hundreds of thousands of workers in well-paying jobs across
the country. Significant as the industry statistics are, however, they still understate the
contribution of the industry to the national and regional economies. They refer only
tangentially to new motor vehicle dealer retail activities, and they focus on direct activity
in manufacturing, ignoring spin-off activities related to automotive production. Spin-off
activities come from two sources: indirect effects, or purchases from local suppliers (for
example, steel); and expenditure-induced effects, or spending by people who receive
income attributable to automotive industry activity (for example, spending by realtors of
income received from selling homes to autoworkers). It is the sum of these direct and
spin-off activities from the making, selling, and servicing of new vehicles that determines
the total contribution of the automotive industry to the national and regional economies.
For regions with little if any direct automotive manufacturing activity, the industry can
still contribute to their economies because spin-off employment is generated by the
feedback effects of direct automotive employment in other regions. For instance, when
autoworkers in Michigan go to movies, California’s entertainment industry benefits—an
effect that our model is sufficiently sophisticated to capture.
2
To fill the information void, we published a study three years ago that provided
estimates for all fifty states of the economic contribution associated with the automotive
industry in 1998, including the effects of new motor vehicle retail activities and industry
spin-off activities (Institute of Labor and Industrial Relations, University of Michigan et al.
2001). The purpose of this report is to update the results of the previous study to 2003,
for the country as a whole and for three states selected by the sponsor: California, New
Jersey, and New York. As in the previous research project, the estimates are
generated from simulations using a state-of-the-art economic model in conjunction with
input data provided by the motor vehicle firms in the United States and by the National
Automobile Dealers Association. Compared with the study of three years ago, the study
update is enhanced by an improved economic modeling technology, an enriched
methodology, and a fully updated survey of activities for twenty-one automotive firms in
the United States.1 The changes in the industry over the past five years are captured in
the new results. The results remain based on the industry classification scheme used in
the previous study (Standard Industrial Classification codes), rather than on the system
recently released by the federal government (North American Industrial Classification
System), which will be used in future studies.
The following sections of the report summarize our estimates of the contribution of the
U.S. motor vehicle industry, measured in jobs and personal income, to the economies of
the country and the three selected states. The industry results are divided into three
1 We define the automotive industry to include the value of the production or sale of light vehicles by the following vehicle manufacturers: Audi, BMW, DaimlerChrysler, Ford, General Motors, Honda, Hyundai, Isuzu, Jaguar, Kia, Mazda, Mercedes, Mitsubishi, Nissan, Porsche, Saab, Subaru, Suzuki, Toyota, Volkswagen, and Volvo. We also include in our industry definition the sales and service activities connected to new vehicle sales located at new light-vehicle dealerships.
3
parts: automotive manufacturing, new vehicle dealers, and the total automotive industry.
More details on the methods of the study, including information on the
economic/demographic model, input data, and research procedures, are presented in
the final section.
CONTRIBUTION OF AUTOMOTIVE MANUFACTURING
The tables in this section show our estimates of the employment and income
contributions of automotive manufacturing to the private sector of the U.S. economy for
2003. Estimates are also presented for the states of California, New Jersey, New York,
and for the balance of the country. The estimates include both direct employment and
payroll, and the spin-off jobs and compensation that result from automotive
manufacturing’s direct activity. Data on direct employment and compensation for
automotive manufacturing are from the survey of the twenty-one participating firms
enumerated in the introductory section (footnote 1).
Summary estimates of the employment and income contributions are shown in table 1.2
Both blue-collar and white-collar workers employed by the manufacturing firms are
included in the direct effect. According to the data compiled from the survey of motor
vehicle firms, 498,200 workers were employed in automotive manufacturing nationwide
in 2003. (All of the employment estimates reported in this study are rounded to the
nearest hundred workers). This is shown as direct employment in table 1. In contrast
to our previous study
for 1998, the auto parts companies Visteon and Delphi are no
2 In the tables, employment represents the total number of private sector jobs, including the self-employed; compensation in the private sector consists of wage and salary disbursements, fringe benefits, and net incomes of owners of unincorporated businesses.

4
Table 1 Contribution of the Automotive Manufacturing Industry to the Private Sector
in the United States, California, New Jersey, and New York 2003
U.S.
California
New Jersey
New York
Balance of U.S.
Employment* Direct 498,200 25,000 9,000 10,200 454,000 Spin-off 4,676,200 296,100 102,100 184,000 4,094,000 Total (direct plus spin-off) 5,174,400 321,100 111,100 194,200 4,548,000 Multiplier** 10.4 n.a. n.a. n.a. n.a.
Compensation (billions of $) 248.70 17.12 6.53 11.65 213.39 Plus: transfer payments –18.58 –1.45 –0.49 –0.99 –15.65 Less: social insurance contributions 16.17 1.05 0.43 0.74 13.96 Less: personal income taxes 31.15 2.43 1.00 1.71 26.01 = private disposable personal income 182.80 12.20 4.62 8.22 157.77
Contribution as % of total private economy Employment 3.8 1.9 2.8 2.2 4.2 Compensation 4.6 2.3 3.3 2.6 5.4
*Values for employment are rounded to the nearest hundred workers. **T
regions, where much of the job gain is due to feedback effects from auto industry activity in other he multiplier is not applicable as a measure of job leverage for direct employment in subnational
regions.
longer included in direct employment because they have since become independent
organizations, although they are still included in total employment. Also, the direct
effect is not made up solely of workers assigned to the motor vehicle industry
classification. Some direct employees are classified in credit and finance and in
wholesale trade and port service activities.
Spin-off employment for the United States (including indirect plus expenditure-induced
effects) from these automotive manufacturing activities is estimated to be 4,676,200
jobs. The sum of direct and spin-off jobs equals 5,174,400. The resulting number of
jobs created (direct plus spin-off) for every direct job introduced constitutes the
“employment multiplier.” In this case, the employment multiplier is 10.4. The
5
employment multiplier can be interpreted in two ways: (1) there are 10.4 times as many
private sector jobs generated as there are direct automotive manufacturing jobs
(5,174,400 � 498,200), or (2) there are 9.4 spin-off jobs generated for every direct job (1
direct job + 9.4 spin-off jobs = 10.4 jobs).
The contribution of automotive manufacturing to compensation in the private sector
(calculated as the direct plus spin-off effects) is estimated to be almost $250 billion,
measured in 2003 dollars. This estimate of compensation is prior to deductions for
personal income taxes and contributions to social insurance programs, and does not
include transfer payments. As shown in table 1, there is a reduction in transfer
payments of $18.6 billion associated with U.S. automotive manufacturing activity in
2003, and personal income tax revenues are increased by over $31 billion. The
implication for disposable personal income, or personal income after taxes and
including transfers, is an increase of about $183 billion in the domestic economy for
2003.
To put the employment and compensation contributions in some context, these
contributions are represented in table 1 as a share of the total private sector economy
for each region. For the U.S. economy, the economic contribution of direct and spin-off
automotive manufacturing activities in 2003 represents 3.8 percent of total private
sector jobs and 4.6 percent of private sector compensation. The compensation share is
greater than the employment share because compensation in the auto industry is higher
on average than in other industries.
6
Compared with the previous results published for 1998, there are fewer direct
automotive manufacturing jobs reported by the companies for 2003, but more jobs in
total attributable to the industry. Consequently, the employment multiplier is now larger,
10.4 versus the previously estimated 7.6. In part, this reflects the transfer of workers at
Visteon and Delphi from the auto companies to their own independent organizations,
thus removing them from direct employment while still including them in total
employment. The greater job leverage for automotive manufacturing also reflects the
tremendous productivity gains realized by the industry in the past five years. Greater
production per autoworker generates more employment per autoworker in the rest of
the economy.
Summary estimates of the employment and income contributions of automotive
manufacturing in California, New Jersey, New York, and the balance of the United
States are shown in the remaining columns of table 1. All of the results were generated
to be consistent with those for the nation. According to the data compiled from the
survey of motor vehicle firms, 25,000 workers were employed in automotive
manufacturing in California in 2003, 9,000 in New Jersey, and 10,200 in New York.
This leaves 454,000 direct employees in the rest of the country. Spin-off employment in
California is estimated to be 296,100 jobs, resulting in 321,000 private sector workers
associated with automotive manufacturing activity in the state (25,000 + 296,100 =
321,100). The industry contributes 111,100 total private sector jobs in New Jersey,
194,200 in New York, and 4,548,000 in the remaining forty-seven states. Thus,
automotive manufacturing contributes a significant number of jobs in total to these
regional economies, even though some do not have many direct industry workers.
7
Unlike the results for the nation as a whole, for the regions the number of total jobs
contributed relative to direct industry jobs should not be interpreted as a measure of job
leverage for direct jobs. For instance, in California, the addition of another direct worker
in automotive manufacturing does not imply from the results in table 1 that another 12.8
jobs in total will accrue to the state economy (321,100 � 25,000 = 12.8). This is
because much of the job gain in California is due to feedback effects from auto industry
activity in other regions. In the real economy, spin-off activity is not generated solely by
direct activity within a state or region, but also by activity in other regions. For example,
an increase in vehicle production in Michigan could in turn boost purchases from auto
suppliers in California. Since job multipliers are usually interpreted as measures of job
leverage, we do not report them in table 1 for the subnational regions.
The contribution of automotive manufacturing to compensation in the private sector is
estimated to be over $17 billion for California, $6.5 billion for New Jersey, and $11.7
billion for New York; the contribution for the rest of the country totals over $213 billion.
For the three states, there is a reduction in transfer payments ranging from $0.5 billion
to $1.5 billion associated with automotive manufacturing activity in 2003, as well as
increases in personal income tax revenues between $1 billion and $2.4 billion. The
regional employment and compensation contributions are represented at the bottom of
table 1 as a share of the total private sector economy for each region. The employment
contribution of direct and spin-off automotive manufacturing activity in 2003 represents
1.9 percent of the private sector jobs in California, 2.8 percent in New Jersey, 2.2
percent in New York, and 4.2 percent in the rest of the country. Corresponding
estimates for the compensation contribution are 2.3 percent in California, 3.3 percent in
8
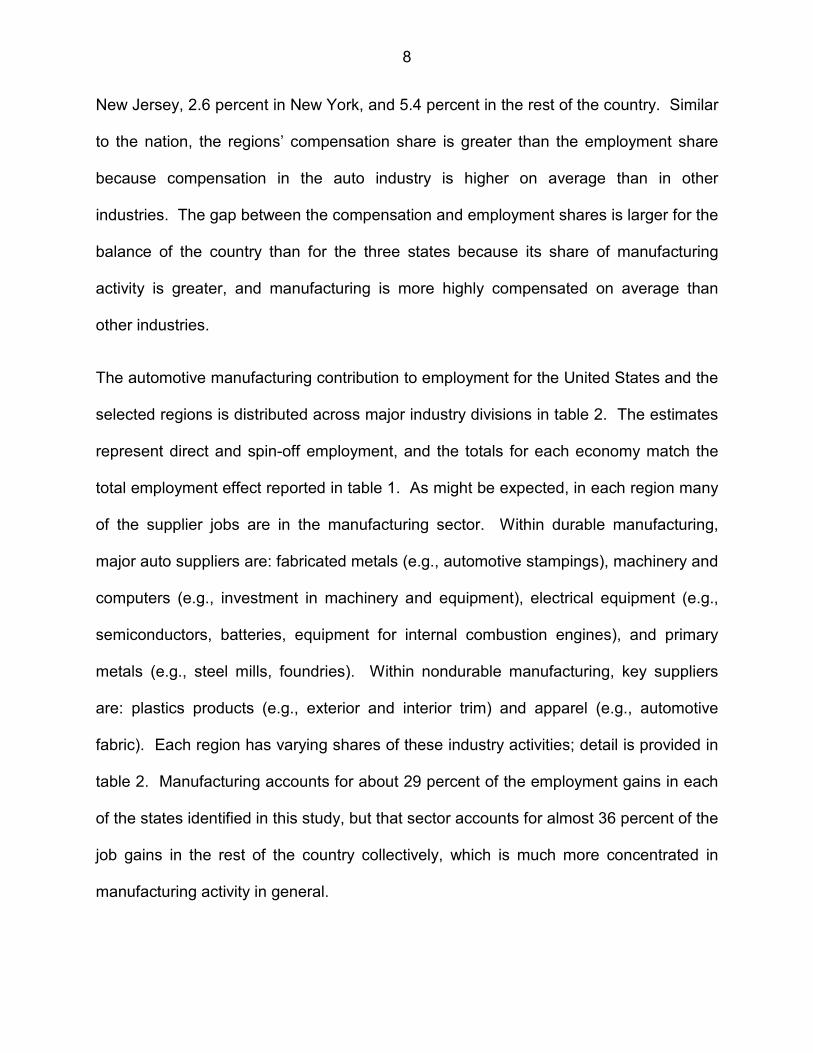
New Jersey, 2.6 percent in New York, and 5.4 percent in the rest of the country. Similar
to the nation, the regions’ compensation share is greater than the employment share
because compensation in the auto industry is higher on average than in other
industries. The gap between the compensation and employment shares is larger for the
balance of the country than for the three states because its share of manufacturing
activity is greater, and manufacturing is more highly compensated on average than
other industries.
The automotive manufacturing contribution to employment for the United States and the
selected regions is distributed across major industry divisions in table 2. The estimates
represent direct and spin-off employment, and the totals for each economy match the
total employment effect reported in table 1. As might be expected, in each region many
of the supplier jobs are in the manufacturing sector. Within durable manufacturing,
major auto suppliers are: fabricated metals (e.g., automotive stampings), machinery and
computers (e.g., investment in machinery and equipment), electrical equipment (e.g.,
semiconductors, batteries, equipment for internal combustion engines), and primary
metals (e.g., steel mills, foundries). Within nondurable manufacturing, key suppliers
are: plastics products (e.g., exterior and interior trim) and apparel (e.g., automotive
fabric). Each region has varying shares of these industry activities; detail is provided in
table 2. Manufacturing accounts for about 29 percent of the employment gains in each
of the states identified in this study, but that sector accounts for almost 36 percent of the
job gains in the rest of the country collectively, which is much more concentrated in
manufacturing activity in general.
9
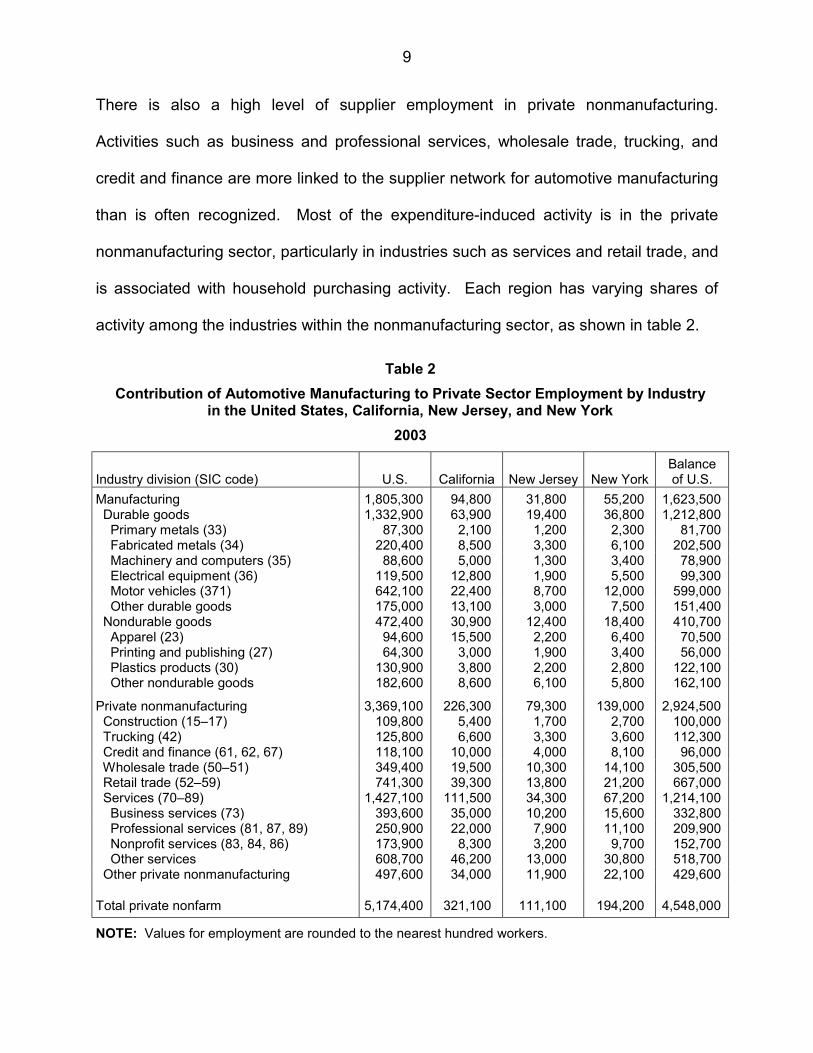
There is also a high level of supplier employment in private nonmanufacturing.
Activities such as business and professional services, wholesale trade, trucking, and
credit and finance are more linked to the supplier network for automotive manufacturing
than is often recognized. Most of the expenditure-induced activity is in the private
nonmanufacturing sector, particularly in industries such as services and retail trade, and
is associated with household purchasing activity. Each region has varying shares of
activity among the industries within the nonmanufacturing sector, as shown in table 2.
Table 2 Contribution of Automotive Manufacturing to Private Sector Employment by Industry
in the United States, California, New Jersey, and New York 2003
Industry division (SIC code)
U.S.
California
New Jersey
New York
Balance of U.S.
Manufacturing 1,805,300 94,800 31,800 55,200 1,623,500 Durable goods 1,332,900 63,900 19,400 36,800 1,212,800 Primary metals (33) 87,300 2,100 1,200 2,300 81,700 Fabricated metals (34) 220,400 8,500 3,300 6,100 202,500 Machinery and computers (35) 88,600 5,000 1,300 3,400 78,900 Electrical equipment (36) 119,500 12,800 1,900 5,500 99,300 Motor vehicles (371) 642,100 22,400 8,700 12,000 599,000 Other durable goods 175,000 13,100 3,000 7,500 151,400 Nondurable goods 472,400 30,900 12,400 18,400 410,700 Apparel (23) 94,600 15,500 2,200 6,400 70,500 Printing and publishing (27) 64,300 3,000 1,900 3,400 56,000 Plastics products (30) 130,900 3,800 2,200 2,800 122,100 Other nondurable goods 182,600 8,600 6,100 5,800 162,100
Private nonmanufacturing 3,369,100 226,300 79,300 139,000 2,924,500 Construction (15–17) 109,800 5,400 1,700 2,700 100,000 Trucking (42) 125,800 6,600 3,300 3,600 112,300 Credit and finance (61, 62, 67) 118,100 10,000 4,000 8,100 96,000 Wholesale trade (50–51) 349,400 19,500 10,300 14,100 305,500 Retail trade (52–59) 741,300 39,300 13,800 21,200 667,000 Services (70–89) 1,427,100 111,500 34,300 67,200 1,214,100 Business services (73) 393,600 35,000 10,200 15,600 332,800 Professional services (81, 87, 89) 250,900 22,000 7,900 11,100 209,900 Nonprofit services (83, 84, 86) 173,900 8,300 3,200 9,700 152,700 Other services 608,700 46,200 13,000 30,800 518,700 Other private nonmanufacturing 497,600 34,000 11,900 22,100 429,600
Total private nonfarm 5,174,400 321,100 111,100 194,200 4,548,000
NOTE: Values for employment are rounded to the nearest hundred workers.
10
CONTRIBUTION OF NEW VEHICLE DEALERS
Until our previous study, little analysis existed on the economic contribution of dealer
activity. In this study, we update the new vehicle dealer results to 2003. The general
explanations given in the previous section pertain to this section as well, and will not be
repeated in the same detail.
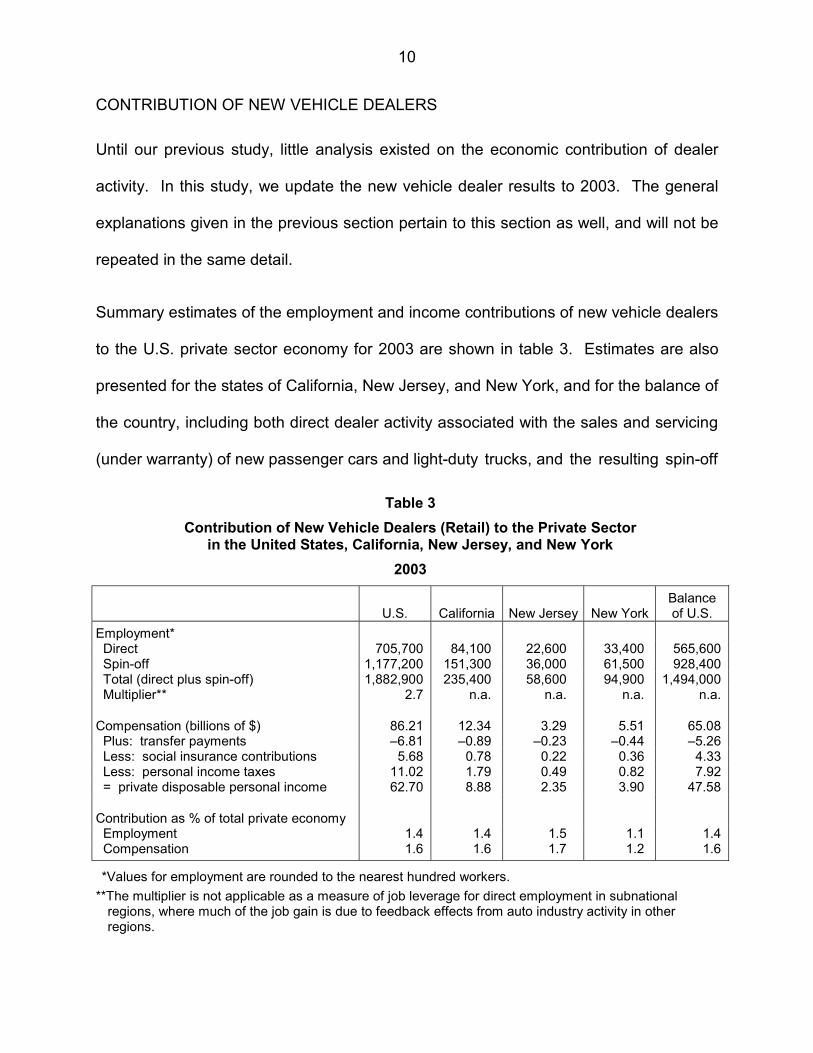
Summary estimates of the employment and income contributions of new vehicle dealers
to the U.S. private sector economy for 2003 are shown in table 3. Estimates are also
presented for the states of California, New Jersey, and New York, and for the balance of
the country, including both direct dealer activity associated with the sales and servicing
(under warranty) of new passenger cars and light-duty trucks, and the resulting spin-off
Table 3 Contribution of New Vehicle Dealers (Retail) to the Private Sector
in the United States, California, New Jersey, and New York 2003
U.S.
California
New Jersey
New York
Balance of U.S.
Employment* Direct 705,700 84,100 22,600 33,400 565,600 Spin-off 1,177,200 151,300 36,000 61,500 928,400 Total (direct plus spin-off) 1,882,900 235,400 58,600 94,900 1,494,000 Multiplier** 2.7 n.a. n.a. n.a. n.a.
Compensation (billions of $) 86.21 12.34 3.29 5.51 65.08 Plus: transfer payments –6.81 –0.89 –0.23 –0.44 –5.26 Less: social insurance contributions 5.68 0.78 0.22 0.36 4.33 Less: personal income taxes 11.02 1.79 0.49 0.82 7.92 = private disposable personal income 62.70 8.88 2.35 3.90 47.58
Contribution as % of total private economy Employment 1.4 1.4 1.5 1.1 1.4 Compensation 1.6 1.6 1.7 1.2 1.6
*Values for employment are rounded to the nearest hundred workers. **T
regions, where much of the job gain is due to feedback effects from auto industry activity in other he multiplier is not applicable as a measure of job leverage for direct employment in subnational
regions.
11
activity. Data on direct dealer activity were obtained from the National Automobile
Dealers Association, and the new vehicle share of sales, parts, and service was isolated
by the authors of this study. That percentage was then used to calculate employment
and payroll for new-vehicle-related sales, parts, and service (see the section on
methods for more detail). Thus, activity associated with the sale of previously owned
vehicles and repair work on non-new vehicles was excluded from our estimates of the
direct dealer effect.
Our estimate of direct employment nationwide in new-vehicle-related sales and service
activity is 705,700 jobs in 2003. Spin-off employment from this activity is estimated to
be 1,177,200 jobs. Thus, the employment contribution associated with new-vehicle-
related sales and service activity in the United States is estimated to be about 1.9
million jobs in the private sector. The resulting employment multiplier is 2.7, the same
value as estimated in our earlier study; that is, there are 2.7 times as many jobs
generated as there are direct jobs (1,882,900 � 705,700 = 2.7). The employment
multiplier for dealer activity is considerably lower than the multiplier for manufacturing
activity because the supplier chain is not as extensive for dealers, and employee
compensation for expenditures is not as high on average.
The contribution of dealer activity to compensation in the private sector (calculated as
the direct plus spin-off effects) is estimated to be over $86 billion, measured in 2003
dollars. The estimate of compensation is prior to deductions for personal income taxes
and contributions to social insurance programs, and does not include transfer
payments. As shown in table 3, there is a reduction in transfer payments of $6.8 billion
associated with U.S. dealer activity in 2003, and personal income tax revenues are
12
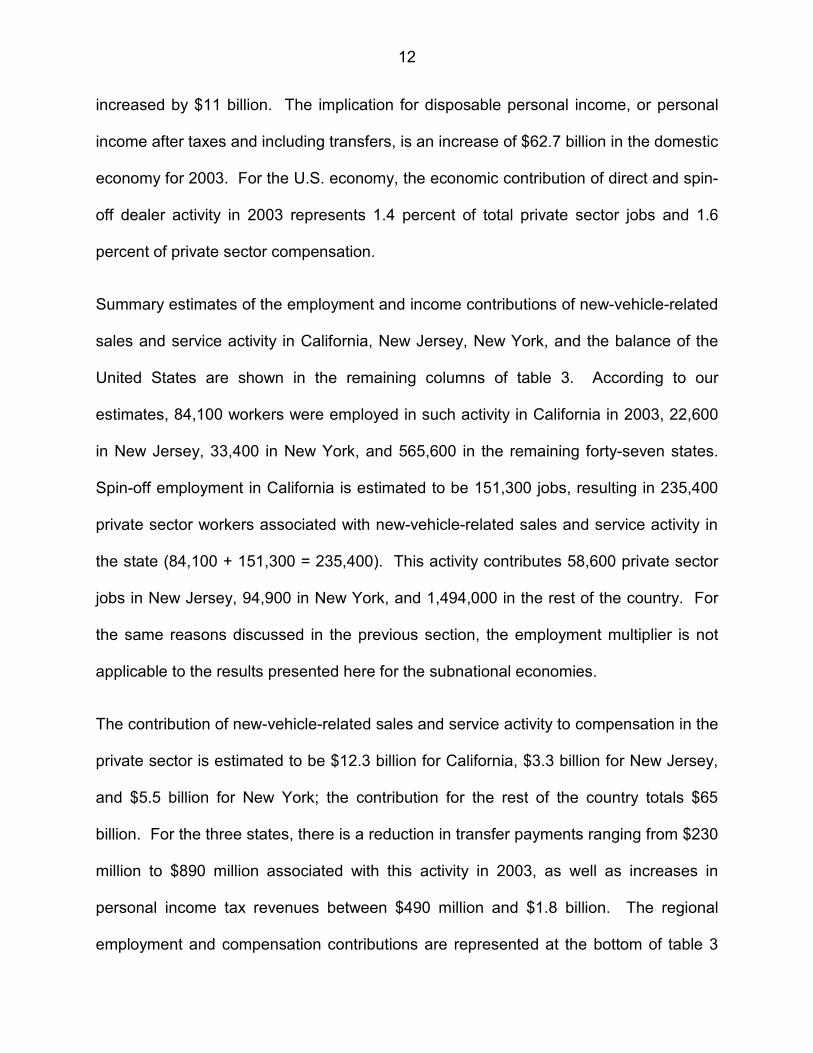
increased by $11 billion. The implication for disposable personal income, or personal
income after taxes and including transfers, is an increase of $62.7 billion in the domestic
economy for 2003. For the U.S. economy, the economic contribution of direct and spin-
off dealer activity in 2003 represents 1.4 percent of total private sector jobs and 1.6
percent of private sector compensation.
Summary estimates of the employment and income contributions of new-vehicle-related
sales and service activity in California, New Jersey, New York, and the balance of the
United States are shown in the remaining columns of table 3. According to our
estimates, 84,100 workers were employed in such activity in California in 2003, 22,600
in New Jersey, 33,400 in New York, and 565,600 in the remaining forty-seven states.
Spin-off employment in California is estimated to be 151,300 jobs, resulting in 235,400
private sector workers associated with new-vehicle-related sales and service activity in
the state (84,100 + 151,300 = 235,400). This activity contributes 58,600 private sector
jobs in New Jersey, 94,900 in New York, and 1,494,000 in the rest of the country. For
the same reasons discussed in the previous section, the employment multiplier is not
applicable to the results presented here for the subnational economies.
The contribution of new-vehicle-related sales and service activity to compensation in the
private sector is estimated to be $12.3 billion for California, $3.3 billion for New Jersey,
and $5.5 billion for New York; the contribution for the rest of the country totals $65
billion. For the three states, there is a reduction in transfer payments ranging from $230
million to $890 million associated with this activity in 2003, as well as increases in
personal income tax revenues between $490 million and $1.8 billion. The regional
employment and compensation contributions are represented at the bottom of table 3
13
as a share of the total private sector economy for each region. The employment
contribution of direct and spin-off new-vehicle-related sales and service activity in 2003
represents 1.4 percent of the private sector jobs in California, 1.5 percent in New
Jersey, 1.1 percent in New York, and 1.4 percent in the balance of the country.
Corresponding estimates for the compensation contribution are 1.6 percent in
California, 1.7 percent in New Jersey, 1.2 percent in New York, and 1.6 percent in the
rest of the country.
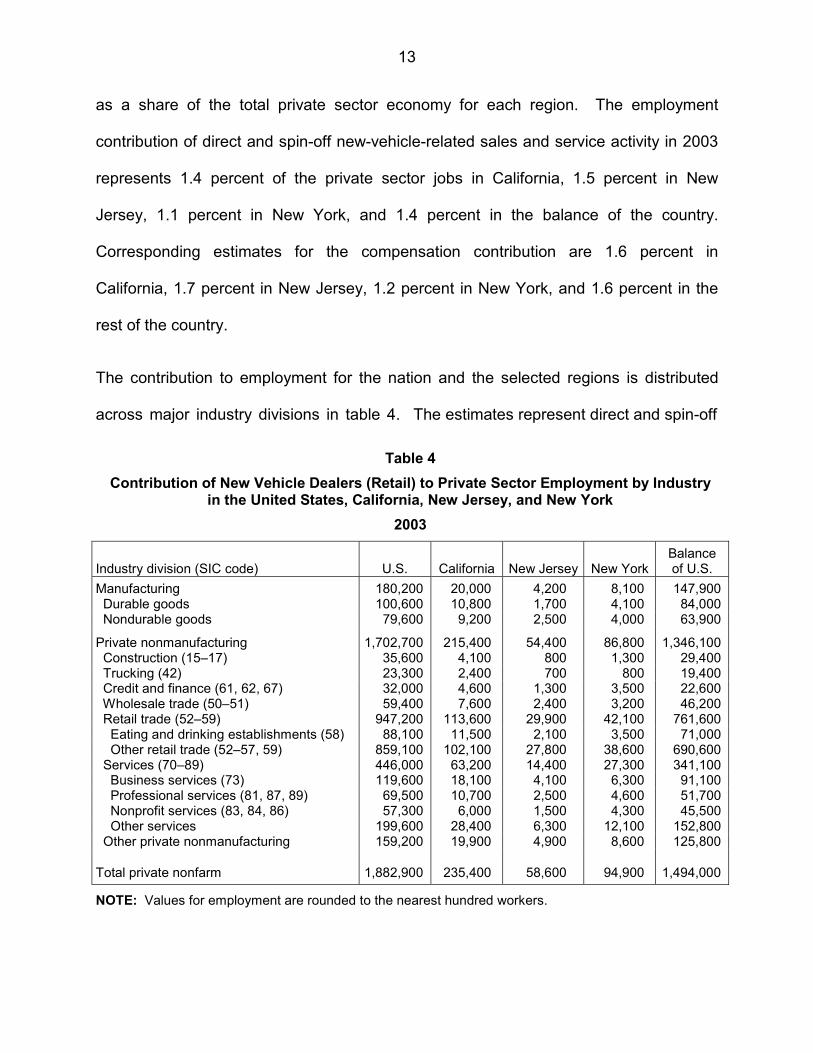
The contribution to employment for the nation and the selected regions is distributed
across major industry divisions in table 4. The estimates represent direct and spin-off
Table 4 Contribution of New Vehicle Dealers (Retail) to Private Sector Employment by Industry
in the United States, California, New Jersey, and New York 2003
Industry division (SIC code)
U.S.
California
New Jersey
New York
Balance of U.S.
Manufacturing 180,200 20,000 4,200 8,100 147,900 Durable goods 100,600 10,800 1,700 4,100 84,000 Nondurable goods 79,600 9,200 2,500 4,000 63,900
Private nonmanufacturing 1,702,700 215,400 54,400 86,800 1,346,100 Construction (15–17) 35,600 4,100 800 1,300 29,400 Trucking (42) 23,300 2,400 700 800 19,400 Credit and finance (61, 62, 67) 32,000 4,600 1,300 3,500 22,600 Wholesale trade (50–51) 59,400 7,600 2,400 3,200 46,200 Retail trade (52–59) 947,200 113,600 29,900 42,100 761,600 Eating and drinking establishments (58) 88,100 11,500 2,100 3,500 71,000 Other retail trade (52–57, 59) 859,100 102,100 27,800 38,600 690,600 Services (70–89) 446,000 63,200 14,400 27,300 341,100 Business services (73) 119,600 18,100 4,100 6,300 91,100 Professional services (81, 87, 89) 69,500 10,700 2,500 4,600 51,700 Nonprofit services (83, 84, 86) 57,300 6,000 1,500 4,300 45,500 Other services 199,600 28,400 6,300 12,100 152,800 Other private nonmanufacturing 159,200 19,900 4,900 8,600 125,800
Total private nonfarm 1,882,900 235,400 58,600 94,900 1,494,000
NOTE: Values for employment are rounded to the nearest hundred workers.
14
employment, and the totals for each economy duplicate the total employment effect
reported in table 3. Most of the jobs that new-vehicle-related sales and service activity
contributes to the economy in each region are in the private nonmanufacturing sector; in
fact, about nine jobs in ten in each region are found in that sector, whereas only one job
in ten is in manufacturing. When direct dealership employment is included, about half of
the jobs are in retail trade in every region except New York, where retail’s share is
somewhat lower. Much of the spin-off employment contribution is from expenditure-
induced activity due to household purchasing, and this activity is heavily concentrated in
the private nonmanufacturing sector. Detail on the industry distribution for individual
regions is provided in table 4.
CONTRIBUTION OF THE TOTAL AUTOMOTIVE INDUSTRY
Combining the estimates for automotive manufacturing and new vehicle dealers in the
previous two sections yields the bottom line for the automotive industry as a whole,
including new vehicle production, sales, and service nationwide and for the states of
California, New Jersey, New York, and the rest of the states collectively. These bottom-
line estimates for 2003 are shown in table 5. Direct employment of 1,203,900 (498,200
automotive manufacturing jobs from table 1 + 705,700 new vehicle dealer jobs from
table 3) combined with spin-off employment of 5,853,400 sums to a contribution to
private sector employment of 7,057,300 in the U.S. economy. The corresponding
employment multiplier is 5.9 (7,057,300 � 1,203,900); that is, there are 5.9 times as
many jobs generated as there are direct jobs.
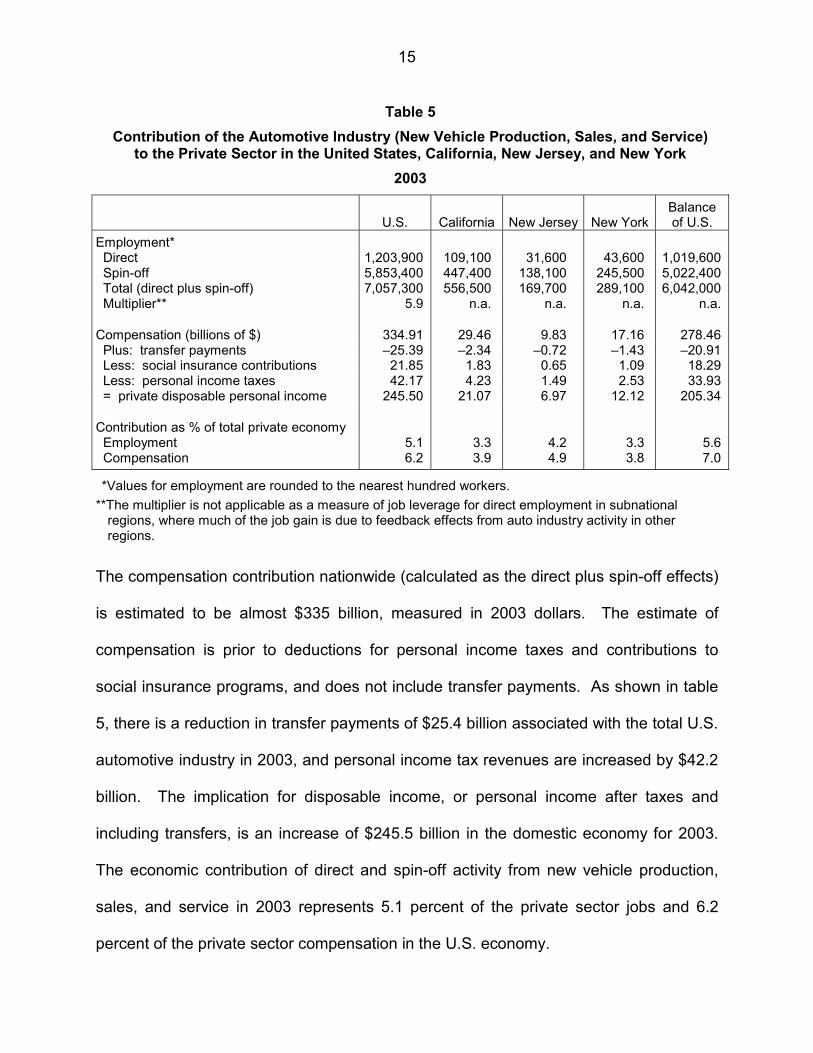
15
Table 5 Contribution of the Automotive Industry (New Vehicle Production, Sales, and Service)
to the Private Sector in the United States, California, New Jersey, and New York 2003
U.S.
California
New Jersey
New York
Balance of U.S.
Employment* Direct 1,203,900 109,100 31,600 43,600 1,019,600 Spin-off 5,853,400 447,400 138,100 245,500 5,022,400 Total (direct plus spin-off) 7,057,300 556,500 169,700 289,100 6,042,000 Multiplier** 5.9 n.a. n.a. n.a. n.a.
Compensation (billions of $) 334.91 29.46 9.83 17.16 278.46 Plus: transfer payments –25.39 –2.34 –0.72 –1.43 –20.91 Less: social insurance contributions 21.85 1.83 0.65 1.09 18.29 Less: personal income taxes 42.17 4.23 1.49 2.53 33.93 = private disposable personal income 245.50 21.07 6.97 12.12 205.34
Contribution as % of total private economy Employment 5.1 3.3 4.2 3.3 5.6 Compensation 6.2 3.9 4.9 3.8 7.0
*Values for employment are rounded to the nearest hundred workers. **T
regions, where much of the job gain is due to feedback effects from auto industry activity in other he multiplier is not applicable as a measure of job leverage for direct employment in subnational
regions.
The compensation contribution nationwide (calculated as the direct plus spin-off effects)
is estimated to be almost $335 billion, measured in 2003 dollars. The estimate of
compensation is prior to deductions for personal income taxes and contributions to
social insurance programs, and does not include transfer payments. As shown in table
5, there is a reduction in transfer payments of $25.4 billion associated with the total U.S.
automotive industry in 2003, and personal income tax revenues are increased by $42.2
billion. The implication for disposable income, or personal income after taxes and
including transfers, is an increase of $245.5 billion in the domestic economy for 2003.
The economic contribution of direct and spin-off activity from new vehicle production,
sales, and service in 2003 represents 5.1 percent of the private sector jobs and 6.2
percent of the private sector compensation in the U.S. economy.
16
Comparable summary estimates of the employment and income contributions of total
automotive industry activity in California, New Jersey, New York, and the balance of the
United States are shown in the remaining columns of table 5. Direct industry
employment in 2003 was 109,100 in California, 31,600 in New Jersey, 43,600 in New
York, and 1,019,600 in the remaining states. Spin-off employment in California is
estimated to be 447,400 jobs, resulting in 556,500 private sector workers associated
with new vehicle production, sales, and service in the state (109,100 + 447,400).
Comparable contributions for the other regions are 169,700 private sector jobs in New
Jersey, 289,100 in New York, and 6,042,000 in the remaining forty-seven states.
The contribution of the automotive industry in total to compensation in the private sector
is estimated to be $29.5 billion for California, $9.8 billion for New Jersey, and $17.2
billion for New York; the contribution for the rest of the country totals $278.5 billion. For
the three states, there is a reduction in transfer payments ranging from $0.7 billion to
$2.3 billion associated with total automotive activity in 2003, as well as increases in
personal income tax revenues between $1.5 billion and $4.2 billion. The employment
contribution of direct and spin-off activity from new vehicle production, sales, and
service in 2003 represents 3.3 percent of the private sector jobs in California, 4.2
percent in New Jersey, 3.3 percent in New York, and 5.6 percent in the rest of the
country. Corresponding estimates for the compensation contribution are 3.9 percent in
California, 4.9 percent in New Jersey, 3.8 percent in New York, and 7 percent in the rest
of the country. The compensation share is greater than the employment share because
compensation in the auto industry is higher on average than in other industries. The
gap between the compensation and employment shares is larger for the balance of the
17
country than for the three states because its share of manufacturing activity is greater,
and manufacturing is more highly compensated on average than other industries.
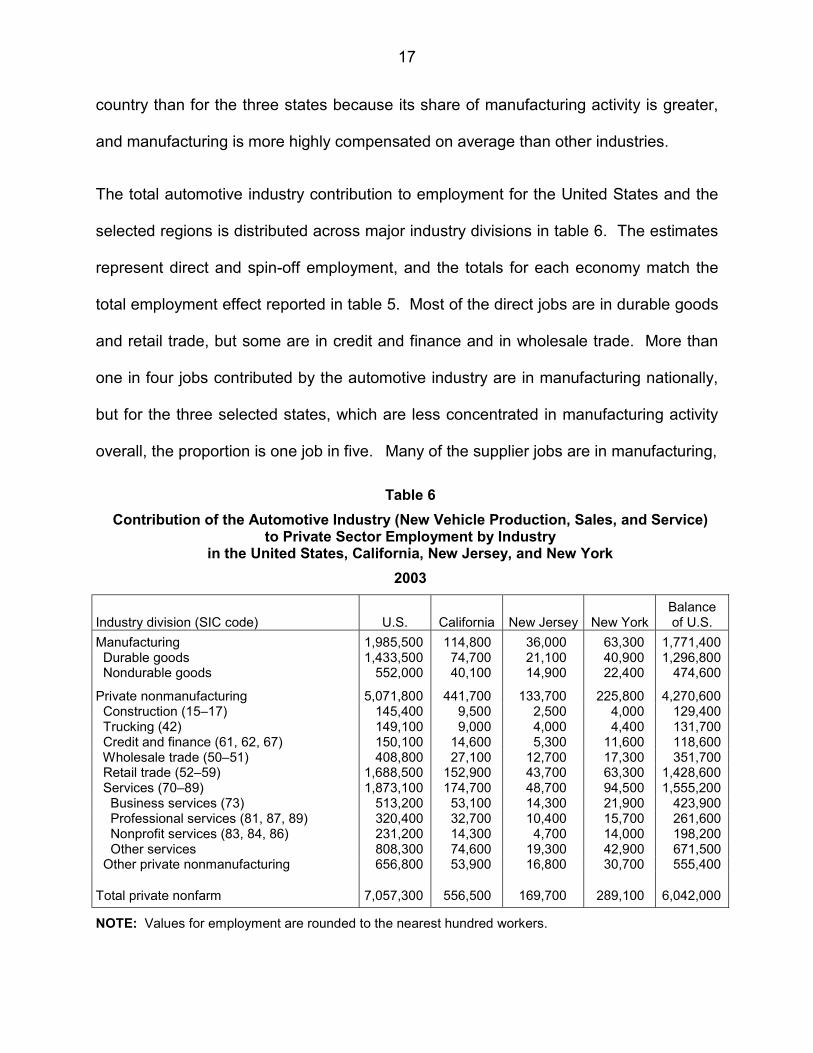
The total automotive industry contribution to employment for the United States and the
selected regions is distributed across major industry divisions in table 6. The estimates
represent direct and spin-off employment, and the totals for each economy match the
total employment effect reported in table 5. Most of the direct jobs are in durable goods
and retail trade, but some are in credit and finance and in wholesale trade. More than
one in four jobs contributed by the automotive industry are in manufacturing nationally,
but for the three selected states, which are less concentrated in manufacturing activity
overall, the proportion is one job in five. Many of the supplier jobs are in manufacturing,
Table 6 Contribution of the Automotive Industry (New Vehicle Production, Sales, and Service)
to Private Sector Employment by Industry in the United States, California, New Jersey, and New York
2003
Industry division (SIC code)
U.S.
California
New Jersey
New York
Balance of U.S.
Manufacturing 1,985,500 114,800 36,000 63,300 1,771,400 Durable goods 1,433,500 74,700 21,100 40,900 1,296,800 Nondurable goods 552,000 40,100 14,900 22,400 474,600
Private nonmanufacturing 5,071,800 441,700 133,700 225,800 4,270,600 Construction (15–17) 145,400 9,500 2,500 4,000 129,400 Trucking (42) 149,100 9,000 4,000 4,400 131,700 Credit and finance (61, 62, 67) 150,100 14,600 5,300 11,600 118,600 Wholesale trade (50–51) 408,800 27,100 12,700 17,300 351,700 Retail trade (52–59) 1,688,500 152,900 43,700 63,300 1,428,600 Services (70–89) 1,873,100 174,700 48,700 94,500 1,555,200 Business services (73) 513,200 53,100 14,300 21,900 423,900 Professional services (81, 87, 89) 320,400 32,700 10,400 15,700 261,600 Nonprofit services (83, 84, 86) 231,200 14,300 4,700 14,000 198,200 Other services 808,300 74,600 19,300 42,900 671,500 Other private nonmanufacturing 656,800 53,900 16,800 30,700 555,400
Total private nonfarm 7,057,300 556,500 169,700 289,100 6,042,000
NOTE: Values for employment are rounded to the nearest hundred workers.

18
but many are also in private nonmanufacturing, including business and professional
services, wholesale trade, trucking, and credit and finance. In all of the regions, most of
the expenditure-induced spin-off jobs are in private nonmanufacturing, especially in
retail trade and services, reflecting household purchasing activity. In fact, all three of
the selected states find the majority of their total employment contributions in these two
industries. There is more detail on the industry distribution of the employment
contributions for each region in table 6.
There are yet more potential benefits that cannot be quantified. For instance, our
estimates do not include the qualitative effects that would produce additional benefits for
the national and regional economies, such as the intangible advantages of technological
transfers associated with the automotive industry in the United States. The results of
the study do confirm, though, that the health of the automotive industry is very important
to the overall health of the United States economy.
METHODS
The general approach is to use a state-of-the-art economic model, in conjunction with
primary data from a survey of twenty-one automotive firms and from the National
Automobile Dealers Association (NADA), and a research design enhanced from our
previous study, to generate estimates of the contribution associated with the automotive
industry in the U.S. economy. A summary of the model, data, and procedures follows.
Macroeconomic Model
To estimate the contribution of the U.S. automotive industry, we use an
economic/demographic model constructed by Regional Economic Models, Inc. (REMI)
19
of Amherst, Massachusetts, and adapted by our research team for the purposes of this
study. The REMI model has been fully documented and peer-reviewed in the
professional literature (Treyz 1993, Treyz et al. 1992). The REMI model has been
designed particularly for carrying out simulations of the type generated for this study,
and has been used extensively for such studies over the past two decades.
The version of the U.S. model system used for this study includes models of the
California, New Jersey, and New York economies, and a model of the rest of the United
States. This design allows us to simulate the interaction among each of the three state
economies and the rest of the nation, so that interregional migration and trade flows are
identified, including feedback effects among regions. In the real economy, spin-off
activity is generated not only by changes in direct activity within the same region, but
also by changes in activity in other regions. Because of its design, the REMI model is
able to provide estimates of the effects of these interregional trade flows, resulting in
much more accurate estimates of the regional contribution of automotive industry
activity. The model also captures the buying and selling relationships among a fairly
detailed breakout of industries, again increasing the accuracy of the results.
Data
This study and its predecessor had access to the richest data set ever assembled on
domestic auto industry employment and compensation. For the part of the study on
automotive manufacturing, employment and payroll data for California, New Jersey,
New York, and the country as a whole were collected from twenty-one automotive firms
that sell new light vehicles in the United States (identified in footnote 1). Salaried and
20
hourly employees were broken out into eight different categories, enabling us both to
control for double-counting jobs and to assign the workers in the model to their correct
functional activities and compensation (an example is given in the following section, on
procedures). The survey data were collected for the most recent complete year, 2003.
For the part of the study on new vehicle dealers, survey data on dealerships were
provided by NADA. The proportion of dealer activity associated with the sale and
servicing of light vehicles was estimated by the authors of this study from the
background information provided. We used data on gross revenue (sales minus the
cost of vehicles and parts) plus advertising and rent to isolate the share of activity at
new car dealers associated with the sales and service of new vehicles. New vehicles
were defined as those still under warranty. The data do not directly identify how much
of the service and parts activity is attributable to new vehicles, so we analyzed the
subcategories of service and parts activity and estimated the share of each subcategory
attributable to new vehicles. Then we combined the shares of the subcategories to
arrive at an overall estimate of the service and parts activity share attributable to new
vehicles, so as to include all warranty-related work and all other service work on
vehicles that are still under warranty. When combined with the data for new vehicle
sales, we estimate that 62.5 percent of dealer activity in the United States is attributable
to new vehicles; the values vary by state.
Procedures
The general procedure in estimating the economic contribution of the automotive
industry is to adjust the model so as to remove the industry from each of the state and
21
regional economies and then to have the model generate the economywide impact,
including the spin-off effects. We begin by generating a baseline simulation for the
economies of California, New Jersey, New York, and the balance of the country, before
any changes are made. We then generate an alternative simulation in which we
remove the industry from the baseline simulation, to determine hypothetically how
different the economies would be. The decrease in activity associated with the removal
of automotive activity constitutes our estimate of the contribution of the industry to the
state and regional economies. The contribution to the entire national economy is
calculated by summing the regional contributions.
The study should not be interpreted as representing the economic activity that would be
lost if the automotive industry did not operate in the United States. That catastrophic
scenario would be mitigated over time by significant compensating adjustments, which
are inappropriate to include in an analysis whose purpose is to dissect the industry’s
current presence in the domestic economy.
The general approach here is straightforward, but its actual application is much more
complex, for several reasons. First, for the model to be able to distinguish between a
catastrophic impact scenario and a contribution scenario, we had to neutralize several
compensating adjustments in the model that would otherwise respond to the complete
loss of the industry. Second, since the survey data from the auto firms were collected
by type of activity and the model requires these activities to be sorted by Standard
Industrial Classification (SIC) code, we made the necessary assignments based on
function of activity. For example, our analysis suggests that many white-collar workers
in the automotive industry are functionally most like workers in professional services.
22
Consequently, we input headquarters workers and engineering and design workers in
their functional category (with the correct assignment of wages), for the purpose of
having the model generate more accurate numbers of spin-off jobs. In our final
accounting, these direct jobs are reassigned to the motor vehicle industry. Also, within
manufacturing, we were careful to distinguish between vehicle assembly and parts
workers. Third, adjustments were made to avoid double-counting jobs. Also, the model
was adjusted so that the correct payroll values were used for all of the direct
employees. Several adjustments were also made to generate accurate estimates of
dealer contributions. The most significant of these adjustments was the isolation of the
new vehicle share of dealership activity across sales, parts, and service, in order to
compute new-vehicle-related employment. The model was also adjusted so that dealer
wages were consistent with the NADA data.
Along with its predecessor, this is one of the two most comprehensive studies in the
literature on the contribution of the U.S. motor vehicle industry to the U.S. economy.
The current study is smaller in scope than the previous study, focusing on four regions
of the country rather than fifty-one, but it benefits from the evolutionary effects of
ongoing research: the models, data, and methods have all improved, leading to
increasingly accurate results. Another significant improvement is close to operational,
that being the incorporation into our economic model of the new industry classification
scheme recently released by the federal government (the North American Industrial
Classification System, or NAICS). The new classifications are based on the service or
product provided by each facility rather than on the output of the parent establishment.
NAICS also reflects the changes in technology and the diversification of services that

23
have occurred in recent decades. This new data system will further enhance our ability
to represent the industry in our inputs to the model, and improve the capability of the
model so that it will produce even more finely tuned results. Future studies will be able
to take advantage of these enhancements.

24
REFERENCES
Institute of Labor and Industrial Relations, University of Michigan; Office for the Study of Automotive Transportation, University of Michigan Transportation Research Institute; and Center for Automotive Research. Contribution of the Automotive Industry to the U.S. Economy in 1998: the Nation and its Fifty States. Ann Arbor: University of Michigan, 2001. National Automobile Dealers Association, McLean, VA. Dealer survey data obtained at the request of the study authors. Treyz, George I. Regional Economic Modeling: A Systematic Approach to Economic Forecasting and Policy Analysis. Boston: Kluwer Academic Publishers, 1993. Treyz, George I., Dan S. Rickman, and Gang Shao. “The REMI Economic-Demographic Forecasting and Simulation Model.” International Regional Science Review 14, no. 3 (1992):221–53.