contributions of the u.s. honey industry to the u.s. economy
TRANSCRIPT

Contributions of the U.S. Honey Industry to
the U.S. Economy
A Report Funded by and Prepared for the National Honey Board
Photo Source: National Honey Board
William A. Matthews, Daniel A. Sumner and Tristan Hanon*
University of California Agricultural Issues Center
* Dr. William A. Matthews is a Project Economist at the UC Agricultural Issues Center. Daniel
A. Sumner is the director of the UC Agricultural Issues Center and the Frank Buck Distinguished
Professor in the Department of Agricultural and Resource Economics at the University of
California, Davis. Tristan M. Hanon is a Ph.D. student in agricultural economics at UC Davis
and Student Researcher at the UC Agricultural Issues Center

1
Acknowledgements
The authors would like to acknowledge the contributions of those who helped in the
analysis of data and the development of this report. We would like to thank Antione Champetier
for providing his expertise on the economics of bees and pollination services that helped guide
this work. We would like to thank Sonskuln Thaomohr and Dustin Messner for contributing to
the analysis of trade data relative to honey and their assistance in editing report contents.
Finally, we would like to thank all the beekeepers, honey packers and honey importers who took
the time to respond to our industry survey. Without out their willingness to share cost and
revenue information relative to their businesses the quality of this report would be diminished.
2
Table of Contents
Acknowledgements 1
Table of Contents 2
List of Tables and Figures 3
Executive Summary 5
Introduction 12
Section 1. Background, Context and Methods for Determining the Economic
Contributions of the U.S. Honey and Beekeeping Industry 13
1.1 Economic Background and Context of U.S. Beekeeping and Honey Production 13
1.1.1 Honey Bee Colonies in the United States 13
1.1.2 Revenue Generation for U.S. Beekeepers and the U.S. Honey Market 15
1.2 Modeling and Measuring the Economic Linkages and Contribution 18
Section 2. Economic Contributions of U.S. Honey Production, Honey Packing and
Honey Importing to the U.S. Economy
39
2.1 Economic Contributions of U.S. Beekeeping, Honey Importing and Honey
Packing
39
2.2 Economic Contributions of Honey in U.S. Food Processing and Manufacturing 43
Concluding Remarks 45
References 53

3
List of Tables and Figures
Table ES.1 Core Facts About the US Honey Industry in 2017 9
Table ES.2: Contributions of Honey Production, Processing and Importing to the
U.S. Economy 10
Table ES.3: Contributions of Honey-Based Manufactured Food Products to the U.S.
Economy 11
Table 1.1: Total Number of Bee Colonies in the U.S. at the Start of Each Quarter,
2015-2017 21
Table 1.2: Average Maximum Number of Bee Colonies per Quarter and Number of
Honey Producing Colonies for Top Ten Honey Producing States, 2015-2017 21
Figure 1.1: Annual Number of Honey Producing Bee Colonies in the United States, 2007-2017
22
Figure 1.2: Commercial Bee Movements and Crops in the United States 23
Figure 1.3: Number of Honey Producing Bee Colonies Per State, 2007 and 2017 24
Figure 1.4: Annual US Beekeeping Revenues Generated by Source, 2015-2017 25
Figure 1.5: Average Share of Annual Revenue Generated for Beekeepers by Source, 2015-2017
26
Figure 1.6: Total Annual US Honey Consumption1, 1997-2017 27
Figure 1.7: Comparison of Changes in Annual Per Capita U.S. Sweetener Deliveries for U.S. Food and Beverage Use by Product, 1997-2017
28
Table 1.3 Annual Per Capita Deliveries of Sweeteners for U.S. Food and Beverage Use by Product in 1997, 2007 and 2017
28
Figure 1.8: Index of Annual U.S. Honey Production, Number of Hives and Yield per Hive, 2007-2017
29
Table 1.4: Annual Honey Production, Number of Colonies and Yield per Colony for 2007, 2012 and 2017
29
Figure 1.9: Total Volume of U.S. Honey Exports, 1997-2017 30 Table 1.5: Volume of U.S. Export of Honey by Destination Country in 1997, 2007 and 2017
30
Figure 1.10: Total Annual U.S. Production and Import of Honey, 1997-2017 31
Table 1.6: Source of US Honey Supply by Year for 2007, 2012 and 2017 32
Figure 1.11: Share of Organic Honey Imports to Total Honey Imports, 2012-2017
33
Figure 1.12: Inflation Adjusted Monthly Retail, Wholesale and Import Prices for Honey, January 2008 – December 2017.
34
Figure 1.13: Flow Chart of U.S. Honey and Honey Bee Industry 35
Figure 1.14: Share of Beekeeper Costs of Production by Category 36
Figure 1.15: Share of Honey Packer Costs of Production by Category 37
BOX 1.1: Using Input-Output Models to Measure Economy-wide Impacts and Contributions
38

4
List of Tables and Figures
Table 2.1: Economic Aggregates for the U.S. Honey Industry, 2017 46
Table 2.2: Impact Multipliers for the US Honey Industry Sectors of Beekeeping, Honey Processing and Honey Importing
47
Table 2.3: Economic Impacts of the U.S. Beekeeping Industry in 2017 by Output. 48
Table 2.4: Estimates of Direct Output for U.S. Honey Importers and U.S. Honey Packers, 2017
49
Table 2.5: Economic Impacts of Honey Packing and Honey Import Industry by Output.
50
Table 2.6: Contribution of U.S. Honey Production, Packing and Importing to U.S. Employment and Gross Domestic Product, 2017
51
Table 2.7: Economic Impacts of Honey In Food Processing Sector. 52
5
Contributions of the U.S. Honey Industry to the U.S. Economy
Report for the National Honey Board
Executive Summary
The people of the United States consumed 596 million pounds of honey in 2017 or about
1.82 pounds of honey per capita (Table ES.1). We estimate that about half of total consumption
is through manufactured food products that contain honey as an ingredient, such as bread and
cookies, with the other half consumed as retail packaged honey. U.S. beekeepers produced 148
million pounds honey from about 2.7 million bee colonies at a yield of 55.3 pounds per hive. US
production equals about a quarter of total US honey supply in 2017 with the remaining 75
percent, or 448 million pounds imported from foreign suppliers.
The United States honey industry is an integral part of agriculture across the country.
Unlike production of many agricultural commodities, which may be isolated to one state or one
region of the country, commercial honey bee colonies reside in each of the 50 states. Over the
last decade demand for honey in the U.S. has quickly outpaced U.S. production resulting in the
large imports of honey. To meet U.S. demand for honey the honey industry relies on production
of U.S. beekeepers, the services of U.S. based honey importers and honey packers to further
process and package honey for U.S. consumers.
In this report we use well-established methods to document linkages from
beekeeping/honey production, honey packers and U.S. honey importers to the rest of the U.S.
economy and measure how beekeeping, honey importing, and honey packing contribute to
income and jobs throughout the U.S. economy. In 2017, U.S. honey production, importing and
honey packing contributed about $4.7 billion in total sales. Of this, $318 million were from sales
of honey from beekeepers to honey packers, $57 million were services provided by honey

6
importers, about $1.6 billion were from sales of honey packers and the rest were sales from
associated industries. Being careful to remove any double counting of economic activity, the
honey industry contributed $2.1 billion in value added to the gross domestic product (GDP) in
2017. Of this, about $169 million were from value added by beekeepers, $38 million were value
added from honey importers, and $511 million were value added directly from honey packers
and the rest were value added in associated industries and activities. About 22,000 jobs in the
U.S. were dependent on the U.S. production, importing and packing of honey. Of these, about
13,639 jobs were direct hires by beekeepers, honey importers, and honey packers with the rest
coming from associated industries and activities.
The economic contributions of the honey industry begin with labor and inputs to
beekeepers. U.S. beekeepers hire workers and buy inputs, including bee feed and health
products, hive materials, and services from other industries. These input purchases create
indirect economic activity that would not occur in the U.S. without the demand from beekeepers.
Likewise, honey importers and honey packers purchase inputs and hire labor in order to
accomplish their tasks associated with bringing honey to U.S. consumers and further link the
honey industry to the U.S. economy. In addition to these indirect impacts through purchased
inputs, income earned by labor hired directly by beekeepers, honey importers, and honey packers
and those employed by suppliers of inputs to the honey industry generate consumption of goods
and services throughout the economy, which in turn induces more jobs and more income for
those outside the honey industry. These induced effects spread the impact of the honey industry
throughout the U.S. into all industries and to workers in every occupation.
We have quantified the myriad impacts using honey-specific data for 2017 and a database
and model of economic linkages (IMPLAN). The method traces quantitatively the direct
7
employment, incomes and value added in beekeeping, honey importing and honey packing back
through the economy to measure the size of the overall impact.
Table ES.2 shows that in 2017 U.S. honey sales from beekeepers were about $318
million, sales of honey importing services were about $57 million, and sales (wholesale) of
packaged honey from honey packers were about $1.58 billion. The sum of the U.S. value of
output attributable to honey production, importing and processing was about $4.74 billion. This
figure adds the output value of beekeeper honey production, import services and packaged honey
products and other outputs involved in the production and marketing of honey throughout the
marketing chain. In that sense, the value of some honey may be counted more than once as it
moves through the marketing chain.
Table ES.2 also shows that the U.S. GDP attributable to the U.S. honey industry was
$2.087 billion in 2017. This total is listed in the honey packing column to reflect the full value
added of the industry, including the beekeeping sector, honey import sector all the way through
the honey packer sector. Value added is the contribution of honey production, honey importing
and honey packing to the national economy calculated to remove double counting of the same
output in more than one sector and of intermediate inputs such as bee feed to beekeepers or
beekeeper-honey to honey packers. The calculation attributes to each sector the amount of
economic value that sector adds to the intermediate inputs in purchases. This is the amount that
the honey industry added to the U.S. economy. Of the $2.087 billion in honey industry value
added, about $587 million were generated as income to workers and owners within the honey
industry. Another $1.135 billion in value added were from indirect and induced labor income.
Table ES.2 also shows a total of 22,084 jobs were the outgrowth of the demand for honey
in the U.S. in 2017. About 7,642 of these jobs were in beekeeping and another 4,624 were hired

8
in the honey packing sector. Honey importing provided an additional 236 direct jobs to the U.S.
economy. Another 8,445 jobs were created in other industries through indirect and induced
impacts.
Much of the increase in honey consumption in the US over the past decade comes from
increased use of honey as an ingredient in manufactured food products. We estimate that honey
is a major ingredient for about 0.4% of all manufactured products in the US. Also, the
manufacture of these products supply jobs and economic output to the US economy. We
estimate that honey-based manufactured products had a direct output of $737 million in 2017.
When including indirect and induced effects total output to the US economy was $2.16 billion
(Table ES.3). Direct value added from honey-based manufactured products is estimated at $277
million with total value added to the US economy equaling $939 million. In addition, the
manufacture of honey-based food products supported 7,968 jobs in the US economy with 2,192
of these jobs being direct food-manufacturing jobs (Table ES.3).

9
Table ES.1 Core Facts About the US Honey Industry in 2017
US Honey Fact Value
US Honey Production Number of honey-producing hives (million) 2.699
Total pounds of honey produced (million lbs.) 147.64 Pounds of honey produced per hive 55.3
US Honey Trade Volumes (million lbs.)
Pounds of organic honey imported to US 62.84 Pounds of non-organic honey imported to US 384.67
Total pounds of honey imported to US 447.51 Total pounds of US honey exported 9.9
US Honey Consumption
Total pounds of honey consumed* (million lbs.) 596 Population of US (millions) 327
Pounds of honey per capita in US 1.82
Source: Honey production data comes from USDA NASS Annual Honey Report. Honey trade
data comes from U.S. International Trade Commission. Honey consumption data comes from
USDA ERS Sugar and Sweeteners Outlook.
*Total pounds of honey consumed in U.S. in 2017 is calculated as follows. (U.S. production +
U.S. imports + 2016 ending stocks) - (U.S. exports + 2017 ending stocks)

10
Table ES.2: Contributions of Honey Production, Processing and Importing to the U.S.
Economy
Beekeeping
Honey Importing
Honey Packing
Total Honey
U.S. Honey Industry Sales
Direct (millions) $318 $57 $1,583 $1,958 Full effect (Millions) $887 $133 $4,742
Contributions of U.S. Honey to Value Added (U.S. GDP)
Direct (millions) $169 $38 $511 $844 Full Effect (millions) $448 $81 $2,087*
Contributions of U.S. Honey to Employment
Direct 7,642 236 4,624 13,639 Full Effect 10,750 688 22,084*
Source: Data comes from authors’ calculations using industry supplied data and the IMPLAN
database.

11
Table ES.3: Contributions of Honey-Based Manufactured Food Products to the U.S.
Economy
Economic Impact
Honey-Based Manufactured Food Product Sales
Direct (millions) $737 Full effect (millions) $2,160
Contributions of Honey-Based Manufactured Food Products to Value Added (U.S. GDP)
Direct (millions) $277 Full Effect (millions) $939
Contributions of U.S. Honey to Employment Direct 2,192
Full Effect 7,968
Source: Data comes from authors’ calculations using industry supplied data and the IMPLAN
database.
12
Introduction
After briefly describing recent economic patterns and trends of the U.S. honey industry,
this report turns to describing the linkages between the U.S. honey industry and the rest of the
national economy. We summarize these linkages by highlighting the number of jobs in the U.S.
that are tied to honey production, importing and packing and how much the industry contributes
the U.S. GDP.
Section 1 provides the background and context with a series of charts and tables. It then
discusses the methodology we use to measure linkages. Section 2 provides detailed data on
sales, jobs and value added of the U.S. honey industry.

13
Section 1. Background, Context and Methods for Determining the Economic
Contributions of the U.S. Honey and Beekeeping Industry
1.1 Economic Background and Context of U.S. Beekeeping and Honey Production
1.1.1 Honey Bee Colonies in the United States
Every state in the U.S. contains commercial bee keepers who manage 5 or more colonies
(USDA NASS 2018). In total, during the three-year period of 2015, 2016 and 2017, the total
number of commercial honey bee colonies in the United States fluctuated annually between
about 2.6 million and 3.2 million depending on the time of year (Table 1.1). The highest average
number of honey bee colonies in the US from 2015 to 2017 occurs during the third quarter
starting July 1 and going through September 30 when about 3.1 million colonies are active in the
US. This number declines to just over 2.7 million at the start of the calendar year (Table 1.1).
On average, when considering the highest volume of total bee colonies during the year, about 87
percent of the total colonies are producing harvested honey. In 2017 the highest volume of bee
colonies was estimated at just under 3 million and about 2.7 million hives produced harvested
honey.
When examining the average maximum number of bee colonies per quarter in each of the
top ten honey producing states, the movement of bee colonies around the country becomes
apparent (Table 1.2). The highest concentration of bee colonies occurs in California during the
first quarter of the calendar year, which coincides with the pollination of California’s 1.2 million
acres of almond trees. On average about half of all bee colonies in the US, or over 1.5 million,
are found in California during this time. Bee colony populations in California drop below 1
million during the summer months of July to September. Still, on average, only about 300,000,
about 20 percent of California located colonies produced harvested honey from 2015 through

14
2017. In contrast, over 90 percent of the maximum number of bee colonies found in North
Dakota produced harvested honey annually and 128 percent of the maximum number of bee
colonies in South Dakota produced harvested honey (Table 1.2). This demonstrates the complex
management of bee colonies in the US and the extensive movement of colonies throughout the
country.
When considering only bee colonies from which honey was harvested during the year the
estimates fall between 2.6 million and 2.8 million colonies for 2015, 2016 and 2017. During the
10-year period between 2007 and 2017 the number of honey-producing colonies in the U.S.
trended upwards (Figure 1.1). This increase occurred despite negative pressure on bee
populations from issues such as colony collapse disorder, use of pesticides in agricultural
production, or increased prevalence of certain bee diseases and predatory pests. Given the overall
10-year upward trend, there were substantial changes in honey producing colony numbers from
year to year. The largest spikes in bee colony numbers occurred between 2009 and 2011: in
2009, the number of colonies was about 2.5 million, which increased to about 2.7 million in
2010, before falling to about 2.5 million once again in 2011. Notwithstanding the year-to-year
peaks and troughs in colony numbers, the total number of bee colonies from which honey is
harvested in the US has increased by about 10 percent since 2007.
Although USDA lists bee colonies in all 50 states, the distribution of bee colonies
between the United States is complex. As stated previously, beekeepers continually move their
colonies all over the country to provide pollination services, track forage to cut down on
supplemental feeding costs and provide colonies with pest and disease treatments when
necessary (Goodrich B. 2018, Lee et. al 2018, Lee et. al 2017).

15
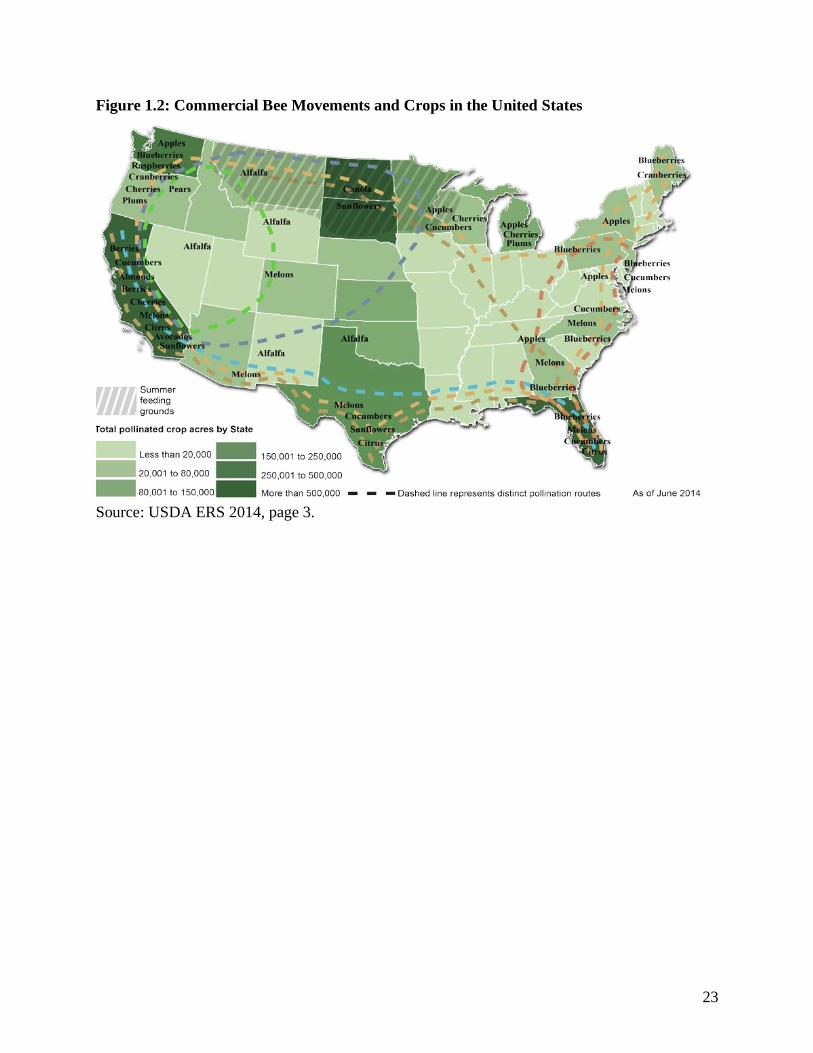
It is common for bee colonies to move around the country in various patterns, with
common stops for summer feeding in the Dakotas, Montana, and Minnesota. Based on observed
transportation routes, it is possible that a colony provides pollination services in Florida, Maine,
Michigan, Washington, Oregon, California, and Texas, along with feeding stops in the summer,
all within one year (Figure 1.2). While operations may have one location where colonies return
to for forage or winter hibernation, it is likely that beekeepers locate colonies in many different
states throughout the year, for at least some amount of time.
The more than 20,000 beekeepers in the U.S. differ in how they operate, but a typical
migratory pattern might go as follows: The beekeeping year begins in January waiting for
almonds to bloom in California. Once almond bloom is over, the beekeeper moves colonies up
through the Pacific Northwest pollinating apples and other spring-blooming crops. In May, the
beekeeper takes the colonies to North Dakota to produce honey from clover, canola and
sunflowers (Goodrich B. 2018, Lee et. al 2018, Lee et. al 2017).
When looking at colonies from which honey was harvested the highest concentrations are
in the Dakotas with North Dakota having the greater share. On average about 28 percent of
colonies in the US from which honey was harvested were in North and South Dakota annually.
Overall, the top seven states for bee colonies remain the same between 2007 and 2017, with the
majority of these states seeing an increase in colony numbers or only a slight decrease (Figure
1.3).
1.1.2 Revenue Generation for U.S. Beekeepers and the U.S. Honey Market
Beekeeping operations receive income from three main sources: honey sales, pollination
services, and the sale of other apiary products such as beeswax, nucs, and queens. Honey sales
are the most public face of beekeeping, given that honey is a product directly marketed to

16
consumers, but pollination services are as important if not more so in generating revenue. In
2015 and 2016, both honey sales and pollination services generated between $330 million and
$340 million for U.S. beekeepers, while in 2017 pollination services generated about $435
million (Figure 1.4). Over the three-year period of 2015, 2016 and 2017 pollination services
accounted for 43 percent of total revenues generated for US beekeepers while honey sales
generated 38 percent of revenues (Figure 1.5).
Demand for honey in the U.S. obviously has a major impact on beekeeper revenue.
Overall honey consumption in the United States has trended upwards over the past twenty years,
with most of the growth in consumption occurring in the past decade (Figure 1.6). Between 1997
and 2009, honey consumption levels fluctuated between a low of 325 million pounds and a high
of 425 million pounds, with a yearly average of about 370 million pounds.
Over this period, U.S. honey consumption increased about 20 percent, which in large part
can be attributed to the growth in US population. In contrast, from 2009 to 2017 honey
consumption increased about 65 percent, far outpacing population growth and signaling a growth
in per capita consumption of honey (Figure 1.7). Overall, despite a slight fall between 2014 and
2016, about 65 percent more honey was consumed in the U.S. in 2017 than in 1997.
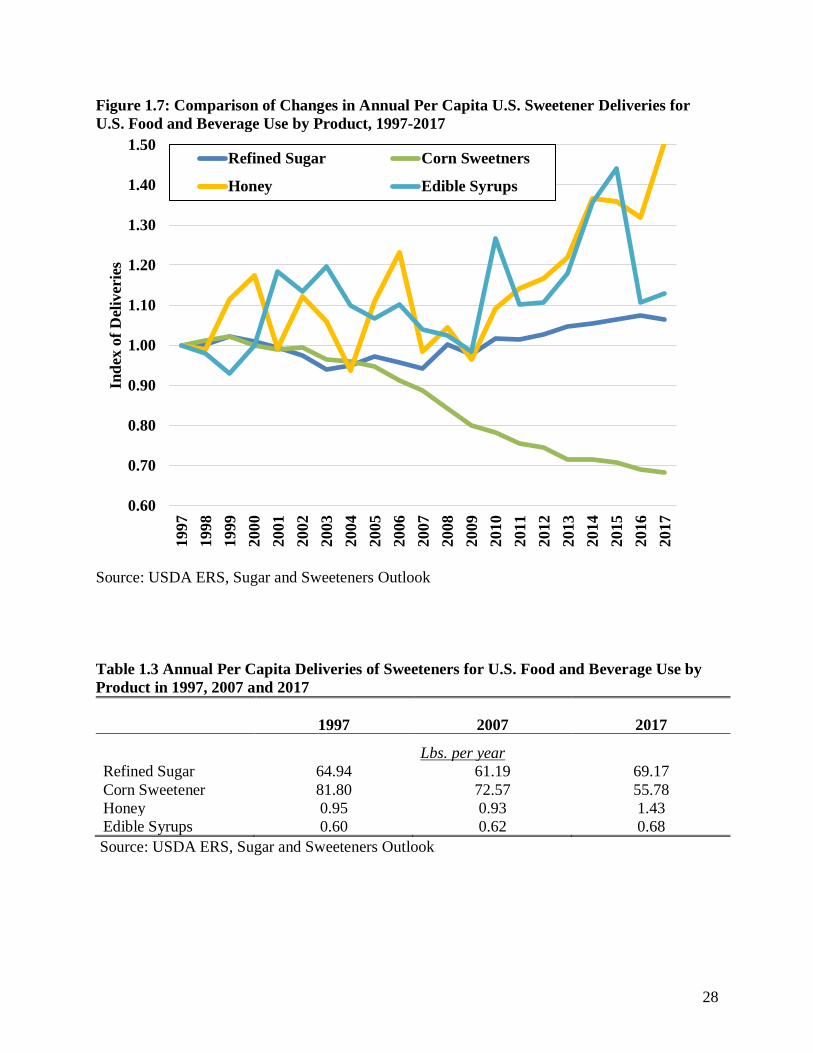
The increase in per capita honey consumption may, in part, be a response from
consumers wanting to switch to a healthier sweetener option. When comparing deliveries of
honey for food and beverage use in the U.S. with other sweeteners the increase in per capita use
of honey coincides with a decrease in consumption of corn sweetener (Figure 1.7 and Table 1.3).
From 1997 to 2009 deliveries of honey fluctuated from year to year but the overall trend was flat.
Since 2009 honey deliveries have increased steadily resulting in 2017 deliveries being over 65

17
percent greater per capita. Meanwhile, corn sweetener deliveries, although still high in volume,
have declined over 30 percent since the early 2000’s.
Despite honey consumption increasing over the past decade, honey production in the US
has not followed suit (Figure 1.8 and Table 1.4). Over the same time period production of honey
does not appear to have followed any particular trend. Spikes in production occur in 2008, 2010,
and 2014, but these are countered with declines in 2009, 2012 and 2017. As a result, volume of
honey production in 2017 is at the same level as in 2007. Since the period also saw an increase in
the number of colonies in the US, as discussed earlier, honey yield per colony has fallen. Though
the spikes in honey production also correspond to spikes in yield per colony, yield has trended
downward while production has stayed constant. The decline in honey yield per colony over the
past decade can be explained, in part, by a shift amongst beekeepers away from focusing on
honey production as a primary source of revenue and more toward pollination services as their
main business (Lee et. al 2018, Lee et. al 2017).
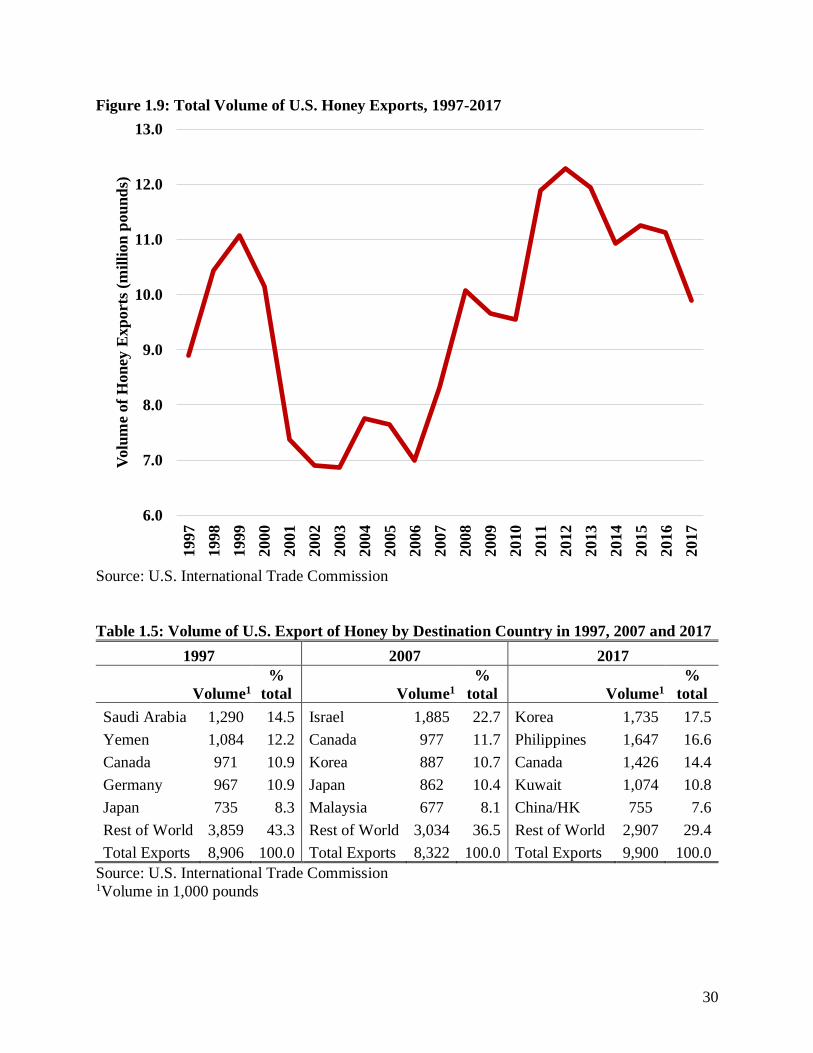
The stagnation in US honey production means the increase in consumption has been met
through increased U.S. honey imports. The result is that although the US does export some
honey (Figure 1.9 and Table 1.5) the country is a large net importer of honey products (Figure
1.10). During the late 1990s and into the early 2000s U.S. honey production kept ahead of honey
imports. Starting in 2002, with the exception of 2004, honey imports outpaced domestic
production at an increasing rate. In 2017, imports of honey were three times the level of US
production, with US production at about 150 million pounds and imports at 450 million pounds
(Figure 1.10).
Argentina has traditionally been an important source of US honey imports, providing
over 20 percent of the US supply in 2012. Over the past decade, India and Vietnam have

18
increased shipments of honey to the US, with both countries surpassing Argentina in 2017. India
represents about 17 percent of US supply, with Vietnam and Argentina both making up about 13
percent of supply. In general, imports of honey come primarily from Asia and South America,
with Canada also being a consistent source of honey shipments (Table 1.6).
A small but growing segment of honey imports is organic honey (Figure 1.11). In 2012
organic honey accounted for 2.3 percent of the total volume of honey imported into the U.S. By
2017 this share had grown to 14 percent of honey import volume. The largest supplier of organic
honey to the U.S. is Brazil which accounts for 75 to 95 percent of organic honey imports
annually since 2012. Overall, honey imports have gone from 60 percent of U.S. supply in 2007
to 75 percent of supply in 2017. As mentioned previously, this is due to a substantial increase in
consumption alongside an unchanging level of domestic production.
The increase in honey consumption coincides with steady increases in retail and
wholesale honey prices (Figure 1.12). When adjusted for inflation retail honey prices rose
steadily from about $4.50 per pound in early 2008 to about $6.70 per pound at the end of 2017.
This is a 49 percent increase in per unit retail price. In the US, there is a consistent difference
between the retail and wholesale prices of honey, suggesting that processing and distribution
costs have remained constant over time. The price of imported honey is far below the wholesale
price of US honey and has had a much more gradual increase in price, before falling over the
course of 2015 and 2016.
1.2 Modeling and Measuring the Economic Linkages and Contribution
Figure 1.13 is a flow chart that describes the ways in which U.S. beekeepers and honey
processors are linked to the broader economy. Also included are the linkages for U.S.

19
beekeepers in providing pollination services and other byproducts from beekeeping.
Beekeeping operations interact directly with the US economy through the jobs they provide and
the inputs they purchase from complementary suppliers. The largest expense for beekeepers in
the United States is labor but they also purchase hive materials, feed and bee health supplies and
inputs from other industries within the U.S. (Figure 1.14) The honey produced by U.S.
beekeepers and imported honey are the largest input expense for U.S. honey packing plants
(Figure 1.15). Those plants also use labor and purchase a variety of other inputs and capital
goods to make honey products that are then sold in the United States.
Not apparent in Figure 1.13 are U.S. economic impacts induced by income spent or saved
by beekeepers and their workers or by the input providers and their workers who support the
U.S. beekeeping industry and earn their living through jobs linked to beekeeping and honey
production.
Our approach to tracing economic linkage and contributions uses an input-output model.
Input-output models link the magnitude of changes in an industry to the associated changes in all
the other industries and segments throughout the economy. An expansion in the demand for
honey produced and processed in the U.S. causes more employment and other economic activity
for beekeepers and honey processing plants. But that additional production and processing
causes increased demand for materials and services supplied by firms from outside the honey
industry, such as bee feed, bee health and accounting services; supplies used by the apiary; and
electricity, packaging, equipment and trucking used by processors. Moreover, income generated
by this honey-induced economic expansion will be spent on other services, from groceries and
new cars to schoolteachers and bus drivers. Input-output models and the associated data on

20
economic linkages in the economy allow us to quantify these impacts using recent spending and
employment patterns, without double counting or leaving out impacts.
We use the IMPLAN model and database for 2016. These data have a complete set of
purchase flows among industries and sectors of the economy. We are able to construct specific
sectors within the model that represent beekeeping, honey packing and honey importing using
data provided by industry participants. The construction of these sectors uses pre-existing
sectors within IMPLAN. For beekeeping we use a sector associated with farm production of
animal products other than cattle and poultry, for honey packing the sector identified with food
manufacturing is used and for honey importing the sector associated with wholesale supply of
farm commodities. For each of the honey industry segments the associated IMPLAN sector was
modified using industry participant data. This allowed the IMPLAN model to better fit the
realities of the U.S. honey industry and its interaction with the rest of the economy. The specific
measures examined using the IMPLAN input-output model are explained in Box 1.1.

21
Table 1.1: Total Number of Bee Colonies in the U.S. at the Start of Each Quarter, 2015-
2017
Year January 1
Colonies
April 1
Colonies
July 1
Colonies
October 1
Colonies
Number of
Honey
Producing
Colonies1
million colonies
2015 2.825 2.850 3.133 2.875 2.660
2016 2.620 2.801 3.181 3.032 2.775
2017 2.694 2.641 2.995 2.850 2.669
Average 2015-2017 2.713 2.764 3.103 2.919 2.701
Source: Number of bee colonies per quarter comes from USDA NASS Bee Colonies Report.
Number of honey-producing bee colonies per year comes from USDA NASS Honey Report. 1Honey producing colonies are the maximum number of colonies from which honey was
harvested during the year.
Table 1.2: Average Maximum Number of Bee Colonies per Quarter and Number of Honey
Producing Colonies for Top Ten Honey Producing States, 2015-20171
State
Jan-
March
Colonies
April-
June
Colonies
July-
Sept
Colonies
Oct-
Dec
Colonies
Number of
Honey
Producing
Colonies2
Share of
Honey
Producing to
Maximum
Number of
Colonies
1,000 colonies
California 1,528 1,095 763 1,263 307 0.20
North Dakota 120 465 513 358 477 0.93
Texas 300 331 131 282 126 0.38
Florida 283 248 207 267 213 0.76
South Dakota 63 200 215 154 275 1.28
Montana 52 168 158 123 150 0.89
Idaho 113 81 125 151 94 0.62
Minnesota 54 122 137 106 124 0.91
Georgia 117 127 112 126 88 0.70
Michigan 49 90 102 87 89 0.87
Source: Maximum number of bee colonies per quarter comes from USDA NASS Bee Colonies
Report. Number of honey-producing bee colonies per year comes from USDA NASS Honey
Report. 1 Maximum number of colonies is the number of colonies at the start of each quarter plus all the
colonies moved into that state during the quarter. 2 Honey producing colonies are the maximum number of colonies from which honey was
harvested during the year in that state. Colonies that produced honey in more than one state were
counted in each state.

22
Figure 1.1: Annual Number of Honey Producing Bee Colonies in the United States, 2007-
2017
Source: USDA NASS
Note: Only colonies from which honey was harvested are included in this graph.
2.30
2.35
2.40
2.45
2.50
2.55
2.60
2.65
2.70
2.75
2.80
2007
2008
2009
2010
2011
2012
2013
2014
2015
2016
2017
Nu
mb
er o
f B
ee C
olo
nie
s (m
illi
on
s)
2007 = 2.44 million colonies
2017 = 2.67 million colonies
23
Figure 1.2: Commercial Bee Movements and Crops in the United States
Source: USDA ERS 2014, page 3.

24
Figure 1.3: Number of Honey Producing Bee Colonies Per State, 2007 and 2017
Source: USDA NASS
Note: Only colonies from which honey was harvested are included in these graphs.
ND
420,000
CA
340,000
SD
255,000
Other 40
States
674,000
2007 Total Number of
Colonies in U.S. =
2,443,000
ND
455,000
CA
335,000
SD
255,000
Other 40
States
747,000
2017 Total Number
of Colonies in U.S. =
2,669,000

25
Figure 1.4: Annual US Beekeeping Revenues Generated by Source, 2015-2017
Source: USDA NASS Annual Honey Report
$0
$50
$100
$150
$200
$250
$300
$350
$400
$450
2015 2016 2017
US
Bee
kee
per
Gro
ss R
even
ue
by S
ou
rce
($m
illi
on
)
Income from Honey Sales
Income from Pollination Services
Income from Other Apiary Products Sales

26
Figure 1.5: Average Share of Annual Revenue Generated for Beekeepers by Source, 2015-
2017
Source: USDA NASS Annual Honey Report
Honey Sales
38%
Pollination
Services
43%
Other Apiary Products
Sales …

27
Figure 1.6: Total Annual US Honey Consumption1, 1997-2017
Source: USDA ERS Sugar and Sweeteners Yearbook 1Total honey consumption = honey production + honey imports - honey exports.
300
350
400
450
500
550
600
1997
1998
1999
2000
2001
2002
2003
2004
2005
2006
2007
2008
2009
2010
2011
2012
2013
2014
2015
2016
2017
Tota
l H
on
ey C
on
sum
pti
on
(in
mil
lion
pou
nd
s)
28
Figure 1.7: Comparison of Changes in Annual Per Capita U.S. Sweetener Deliveries for
U.S. Food and Beverage Use by Product, 1997-2017
Source: USDA ERS, Sugar and Sweeteners Outlook
Table 1.3 Annual Per Capita Deliveries of Sweeteners for U.S. Food and Beverage Use by
Product in 1997, 2007 and 2017
1997 2007 2017
Lbs. per year
Refined Sugar 64.94 61.19 69.17
Corn Sweetener 81.80 72.57 55.78
Honey 0.95 0.93 1.43
Edible Syrups 0.60 0.62 0.68
Source: USDA ERS, Sugar and Sweeteners Outlook
0.60
0.70
0.80
0.90
1.00
1.10
1.20
1.30
1.40
1.50
1997
1998
1999
2000
2001
2002
2003
2004
2005
2006
2007
2008
2009
2010
2011
2012
2013
2014
2015
2016
2017
Ind
ex o
f D
eliv
erie
s
Refined Sugar Corn Sweetners
Honey Edible Syrups

29
Figure 1.8: Index of Annual U.S. Honey Production, Number of Colonies and Yield per
Hive, 2007-2017
Source: USDA NASS Annual Honey Report
Table 1.4: Annual Honey Production, Number of Colonies and Yield per Colony for 2007,
2012 and 2017
2007 2012 2017
Honey Production (million lbs.) 148.3 142.3 147.6
Number of Hives (1,000) 2,443 2,539 2,669
Yield (lbs./colony) 60.7 56.0 55.3
Source: USDA NASS Annual Honey Report
0.90
0.95
1.00
1.05
1.10
1.15
1.20
1.25
2007 2008 2009 2010 2011 2012 2013 2014 2015 2016 2017
Ind
ex V
alu
e (2
007=
1)
Pounds Honey Production
Number of Hives
Yield per Hive
30
Figure 1.9: Total Volume of U.S. Honey Exports, 1997-2017
Source: U.S. International Trade Commission
Table 1.5: Volume of U.S. Export of Honey by Destination Country in 1997, 2007 and 2017
1997 2007 2017
Volume1
%
total Volume1
%
total Volume1
%
total
Saudi Arabia 1,290 14.5 Israel 1,885 22.7 Korea 1,735 17.5
Yemen 1,084 12.2 Canada 977 11.7 Philippines 1,647 16.6
Canada 971 10.9 Korea 887 10.7 Canada 1,426 14.4
Germany 967 10.9 Japan 862 10.4 Kuwait 1,074 10.8
Japan 735 8.3 Malaysia 677 8.1 China/HK 755 7.6
Rest of World 3,859 43.3 Rest of World 3,034 36.5 Rest of World 2,907 29.4
Total Exports 8,906 100.0 Total Exports 8,322 100.0 Total Exports 9,900 100.0
Source: U.S. International Trade Commission 1Volume in 1,000 pounds
6.0
7.0
8.0
9.0
10.0
11.0
12.0
13.0
1997
1998
1999
2000
2001
2002
2003
2004
2005
2006
2007
2008
2009
2010
2011
2012
2013
2014
2015
2016
2017
Volu
me
of
Hon
ey E
xp
ort
s (m
illi
on
pou
nd
s)

31
Figure 1.10: Total Annual U.S. Production and Import of Honey, 1997-2017
Source: USDA NASS Annual Honey Report and U.S. International Trade Commission
100
150
200
250
300
350
400
4501997
1998
1999
2000
2001
2002
2003
2004
2005
2006
2007
2008
2009
2010
2011
2012
2013
2014
2015
2016
2017
Volu
me
of
Hon
ey (
1 m
illi
on
pou
nd
s)
Production
Imports

32
Table 1.6: Source of US Honey Supply by Year for 2007, 2012 and 2017
2007 2012 2017
Source of Honey
Volume
of
Honey1
Share
of US
Supply
(%) Source of Honey
Volume
of
Honey1
Share
of US
Supply
(%) Source of Honey
Volume
of
Honey1
Share
of US
Supply
(%)
Previous Year Stock 40.7 11.3 Previous Year Stock 36.8 8.3 Previous Year Stock 41.3 6.9
US Production 148.3 41.1 US Production 142.3 31.9 US Production 147.6 24.8
Argentina 44.9 12.5 Argentina 93.7 21.0 India 99.6 16.7
China 38.6 10.7 India 47.3 10.6 Vietnam 80.0 13.4
Vietnam 34.6 9.6 Vietnam 45.6 10.2 Argentina 78.0 13.1
Canada 30.8 8.5 Canada 35.2 7.9 Brazil 53.0 8.9
Brazil 26.7 7.4 Brazil 24.9 5.6 Ukraine 42.7 7.2
India 16.9 4.7 Uruguay 24.0 5.4 Canada 34.8 5.8
Russia 9.2 2.6 Mexico 13.6 3.1 Mexico 10.5 1.8
Mexico 7.0 1.9 Malaysia 4.6 1.0 Thailand 9.9 1.7
Uruguay 4.2 1.2 Chile 3.8 0.9 New Zealand 9.3 1.6
Malaysia 4.2 1.2 New Zealand 2.1 0.5 Uruguay 8.9 1.5
Rest of World 15.4 4.3 Rest of World 16.1 3.6 Rest of World 20.9 3.5
Total Imports 232.5 64.5 Total Imports 310.9 69.7 Total Imports 447.5 75.1
Total US Exports -8.3 Total US Exports -12.3 Total US Exports -9.9
Stock Held -52.6 Stock Held -31.8 Stock Held -30.6
Total US Supply 361.1 100.0 Total US Supply 445.8 100.0 Total US Supply 596.1 100.0
Source: US honey import data comes from U.S. International Trade Commission; US honey production data comes from USDA
NASS Annual Honey Report. 1 Volumes reported in 1 million pounds.

33
Figure 1.11: Share of Organic Honey Imports to Total Honey Imports, 2012-2017
Source: U.S. International Trade Commission
2.0%
4.0%
6.0%
8.0%
10.0%
12.0%
14.0%
16.0%
2012 2013 2014 2015 2016 2017
Sh
are
of
All
Hon
ey I
mp
ort
s

34
Figure 1.12: Inflation Adjusted Monthly Retail, Wholesale and Import Prices for
Honey, January 2008 – December 2017.
Source: Import price data estimated from U.S. International Trade Commission trade
data. Wholesale and retail honey prices received comes from National Honey Board via
Bee Culture magazine.
$0.0
$1.0
$2.0
$3.0
$4.0
$5.0
$6.0
$7.0
Jan
-08
Ju
l-08
Jan
-09
Ju
l-09
Jan
-10
Ju
l-10
Jan
-11
Ju
l-11
Jan
-12
Ju
l-12
Jan
-13
Ju
l-13
Jan
-14
Ju
l-14
Jan
-15
Ju
l-15
Jan
-16
Ju
l-16
Jan
-17
Ju
l-17
Pri
ce p
er P
ou
nd
Retail Price
Wholesale Price
Import Price

35
Figure 1.13: Flow Chart of U.S. Honey and Honey Bee Industry
Fees and Taxes
Labor
Fuel
Lube and Repairs
Materials
Custom/Rent
U.S. Beekeeping
Insurance
Cash and Non-cash Beekeeper Inputs
Office Expense
Buildings
Hives
Fuel Tanks
Land
Equipment
Honey Imports
Honey Packers
US Honey Sales
Pollination
Services Beekeeping
Byproducts
(beeswax,
queens,
nucs, etc.)
Cash and non-
cash Honey
Packer Inputs

36
Figure 1.14: Share of Beekeeper Costs of Production by Category
Source: Survey data collected by UC AIC from beekeepers
Labor
50%
Bee Feed and
Medication
18%
Hive Materials
3%
Other
Operating
Inputs
13%
Cash Overhead
16%

37
Figure 1.15: Share of Honey Packer Costs of Production by Category
Source: Survey data collected by UC AIC from honey packers
Labor
31%
Honey from
U.S.
beekeepers
26%
Imported
honey
27%
Capital
Overhead
2%
Other
Operating
Inputs
14%

38
BOX 1.1
Using Input-Output Models to Measure Economy-wide Impacts and Contributions
Input-output models link the magnitude of changes in an industry or segment of the
economy to the associated changes in all other industries and segments throughout the economy.
For example, an expansion of demand for honey causes more employment and other economic
activity in beekeeping and honey packing industries and these activities cause increased demand
for materials and services from outside the industry such as packaging, and trucking. Moreover,
income generated by this economic expansion will be spent on other goods and services. Input-
output models and the associated data on economic linkages in the economy provide the tools
and information to quantify these impacts as “multiplier effects” without double counting or
leaving out impacts. Impacts are classified as direct, indirect and induced effects.
Direct Effects: Direct effects are impacts directly within the affected industry. For example,
hiring 50 workers to move beehives has a direct employment effect of 50 jobs.
Indirect Effects: Indirect effects are the changes in industries outside the directly affected
industry through purchases from supporting industries of input goods and services. For example,
an increase in honey demand would entail increased volume of packaging purchased from
suppliers, and these input suppliers have purchases of their own that ripple further.
Induced Effects: Induced effects are economic ripples that result from added consumption
generated by the added income spent by those with income from the direct and indirect effects.
For example, beekeepers, packers and their employees spend their incomes at local grocery
stores, auto dealerships and barbershops and these local firms have workers of their own.
The sum of direct, indirect and induced impacts tells us the complete impact or
contribution of the beekeeping/honey industry on the U.S. economy. We report the contributions
using three economic measures.
Value of Output: The value of direct output or service contribution of an industry or segment.
For example, the direct value of beekeeper output is simply the sum of market values of honey
and honey byproducts produced and pollination services offered. For honey packers it’s the total
market value of processed and packaged honey above the value of honey coming from
beekeepers.
Value Added: Value added is the measure of salaries and wages, proprietor income and profit
minus business taxes. It is that proportion of value of output contributed by labor and capital
within the sector. An industry’s value added is the economic contribution of a sector above the
cost of goods and services purchased from other sectors. Value added for honey, honey
byproducts and pollination services is the industry’s contribution to the U.S. economy.
Employment: Employment is defined as the number of jobs including part-time or seasonal
employment. It is not converted to full-time equivalent (FTE) employment
39
Section 2. Economic Contributions of U.S. Honey Production, Honey Packing and Honey
Importing to the U.S. Economy
2.1 Economic Contributions of U.S. Beekeeping, Honey Importing and Honey Packing
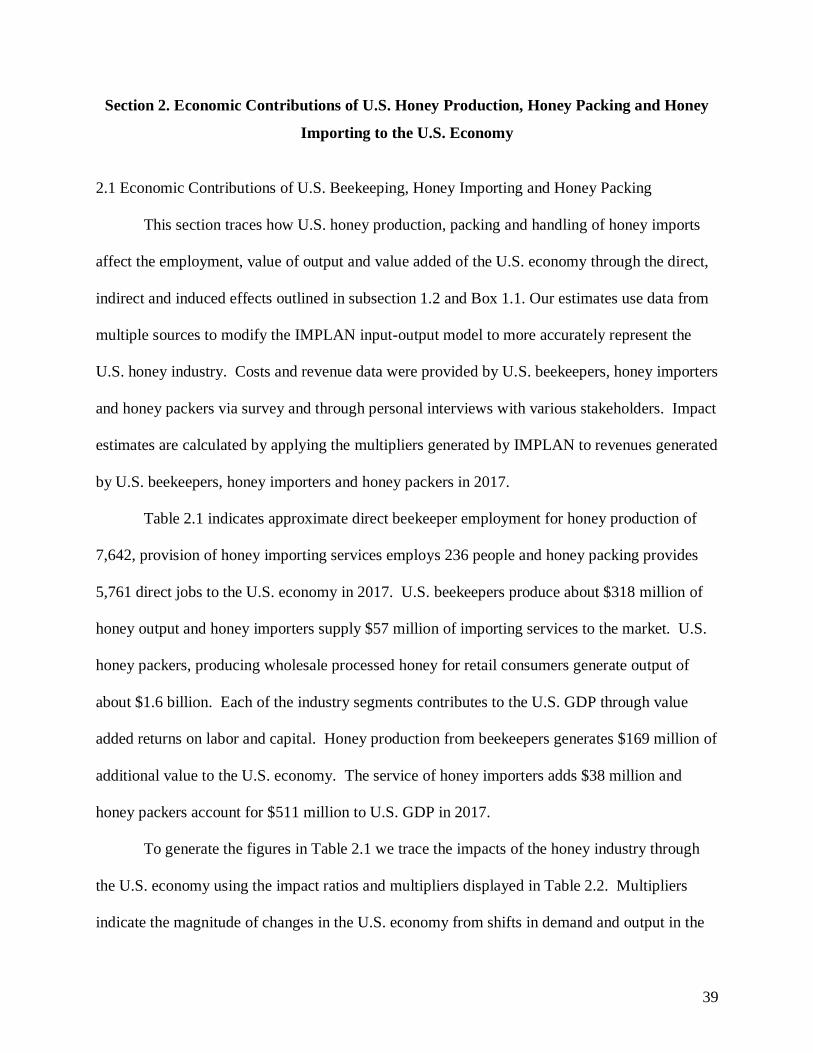
This section traces how U.S. honey production, packing and handling of honey imports
affect the employment, value of output and value added of the U.S. economy through the direct,
indirect and induced effects outlined in subsection 1.2 and Box 1.1. Our estimates use data from
multiple sources to modify the IMPLAN input-output model to more accurately represent the
U.S. honey industry. Costs and revenue data were provided by U.S. beekeepers, honey importers
and honey packers via survey and through personal interviews with various stakeholders. Impact
estimates are calculated by applying the multipliers generated by IMPLAN to revenues generated
by U.S. beekeepers, honey importers and honey packers in 2017.
Table 2.1 indicates approximate direct beekeeper employment for honey production of
7,642, provision of honey importing services employs 236 people and honey packing provides
5,761 direct jobs to the U.S. economy in 2017. U.S. beekeepers produce about $318 million of
honey output and honey importers supply $57 million of importing services to the market. U.S.
honey packers, producing wholesale processed honey for retail consumers generate output of
about $1.6 billion. Each of the industry segments contributes to the U.S. GDP through value
added returns on labor and capital. Honey production from beekeepers generates $169 million of
additional value to the U.S. economy. The service of honey importers adds $38 million and
honey packers account for $511 million to U.S. GDP in 2017.
To generate the figures in Table 2.1 we trace the impacts of the honey industry through
the U.S. economy using the impact ratios and multipliers displayed in Table 2.2. Multipliers
indicate the magnitude of changes in the U.S. economy from shifts in demand and output in the

40
U.S. honey industry. We start with the direct value of output “multiplier” of 1.0 and then note
that, for beekeeping, indirect output adds another $821,000 for every additional $1 million
dollars of beekeeping output. Each $1 million of output from honey packing and honey import
services promotes an additional $1.118 million and $512,000 in indirect output, respectively.
Induced effects add another $967,000 for beekeeping, $877,000 for honey packing and $800,000
for honey import services for each $1 million increase in sector outputs. Overall, every $1
million increase in direct output for beekeeping ripples through the economy and creates an
additional $1.79 million in economic output. The ripple effects from honey packers and honey
importers add an additional $2 million and $1.31 million for every $1 million increase,
respectively.
Contributions to national GDP come from that portion of gross earnings that reflect
returns to capital and labor plus the business taxes paid by sector and defined as value added.
Direct value added is about $532,000 per $1 million dollars of beekeeping revenue, $323,000 per
$1 million of honey processing output and $669,000 per $1 million of honey import service
revenues. Beekeeping indirect and induced impacts add another $875,000 in value added for a
total value added of $1.4 million per $1 million dollars of beekeeping revenue earned. Honey
packers, like most processing industries, purchase inputs for assembly at a greater rate than
beekeepers and, therefore, have lower direct effects and higher indirect and induced effects.
Every $1 million of output from honey packing creates an additional $1.32 million in value
added to the U.S. economy. Honey importers add an additional $746,000 to the U.S. GDP
through indirect and induced effects of $1 million increase in output.
The majority of value added to the U.S. economy from the three honey sectors comes in
the form of labor income. Labor income is the portion of sales revenues that goes toward

41
employee compensation and proprietor income. For beekeeping, every $1 million in gross sales
of honey directly generates $453,000 in labor income and an additional $506,000 in labor
income from indirect and induced effects. As mentioned previously, honey packers generate
lower direct effects on labor income ($267,000 per $1 million of output) but a higher effect
($600,000) on indirect and induced labor income due to greater reliance on input suppliers,
relative to beekeepers. Honey importers, who provide a service of wholesaling imported honey
to honey packers and food manufacturers, have the lowest total effect on labor income
generating $783,000 per $1 million of gross revenues earned.
Employment effects in Table 2.2 are interpreted as the number of jobs created per $1
million of output earned. For beekeeping, every additional $1 million of output generates 24
direct beekeeping jobs. Approximately10 additional jobs are created in the economy from
indirect and induced effects for a total of 34 jobs created from every $1 million in beekeeper
revenue generated. Honey packers and honey importers each generate 14 and 12 jobs
respectively for every $1 million in sales earned.
Using the multipliers generated with IMPLAN and applying gross revenues for
beekeeping, honey packing and honey importing we are able to calculate the economic impact
the U.S. honey industry had on the U.S. economy in 2017. Table 2.3 shows the total economic
impacts from beekeeping in the United States. Total beekeeping impacts are broken down into
the three main sources of revenue generation: sales of honey, sales of pollination services and
sales of byproducts such as beeswax, queens and nucs. In 2017, pollination services provided
the largest source of revenue U.S. beekeepers generating $435 million in direct output (USDA
NASS 2018). Honey sales earned beekeepers $318 million and byproduct sales generated an
additional $163 million for U.S. beekeepers (USDA NASS 2018). In total, beekeeping in the

42
U.S. generated $916 million in direct output and $2.55 billion in total output for the U.S.
economy in 2017. Furthermore, beekeeping activity added $1.29 billion in value added to the
national GDP and provided a total of 30,948 jobs to the U.S. economy with 22,000 of those jobs
as direct beekeeping jobs (Table 2.3).
Honey importers provide a service of wholesaling imported honey to honey packers and
food manufacturers in the U.S. The contribution of honey importers on the U.S. economy occurs
from the revenues generated and jobs provided from wholesaling already imported honey.
Therefore, gross revenues for honey importers do not include the import value of foreign honey
as this value would contribute to the economies of foreign suppliers and not the U.S. economy
(Table 2.4). The direct output of honey importers is calculated at $57 million, which reflects a
10 percent margin earned by importers on the total value of honey imported in the U.S. in 2017.
Of the $57 million earned by honey importers in 2017 more than a third ($20 million) went to
employee compensation and proprietor income (Table 2.5). Overall, honey import services
contributed $38 million to the U.S. GDP directly and an additional $43 million through indirect
and induced effects. Honey importers supported 236 jobs directly and 688 jobs in total
throughout the economy (Table 2.5).
The U.S. honey packing industry had an estimated $1.58 billion in direct output in 2017
(Table 2.4). This estimate is calculated assuming that half of the total supply of honey in the
U.S. is processed by honey packers for retail consumers with the other half designated for food
manufacturers as processed food ingredients. The volume of honey handled by U.S. honey
packers is estimated at 298.1 million pounds in 2017. We further assume the volume of honey
processed by honey packers consists of 100 percent of U.S. production with the remaining
volume coming from imports. The value of output for honey packers in 2017 is equal to total

43
volume of honey multiplied by the average wholesale price per pound (Table 2.4). The $1.58
billion in direct output from honey packers generated $511 million in direct value added to the
U.S. economy. Over 80 percent of the direct value-added contribution came in the form of
employee compensation and proprietor income. The ripple effects from honey packers, which
reverberates to U.S. beekeepers and honey importers, generated an additional $3.2 billion in
economic output and $1.5 billion in value added to the U.S. economy through indirect and
induced effects. Honey packers also supported 4,624 direct jobs and a total of 22,084 jobs
throughout the U.S. economy.
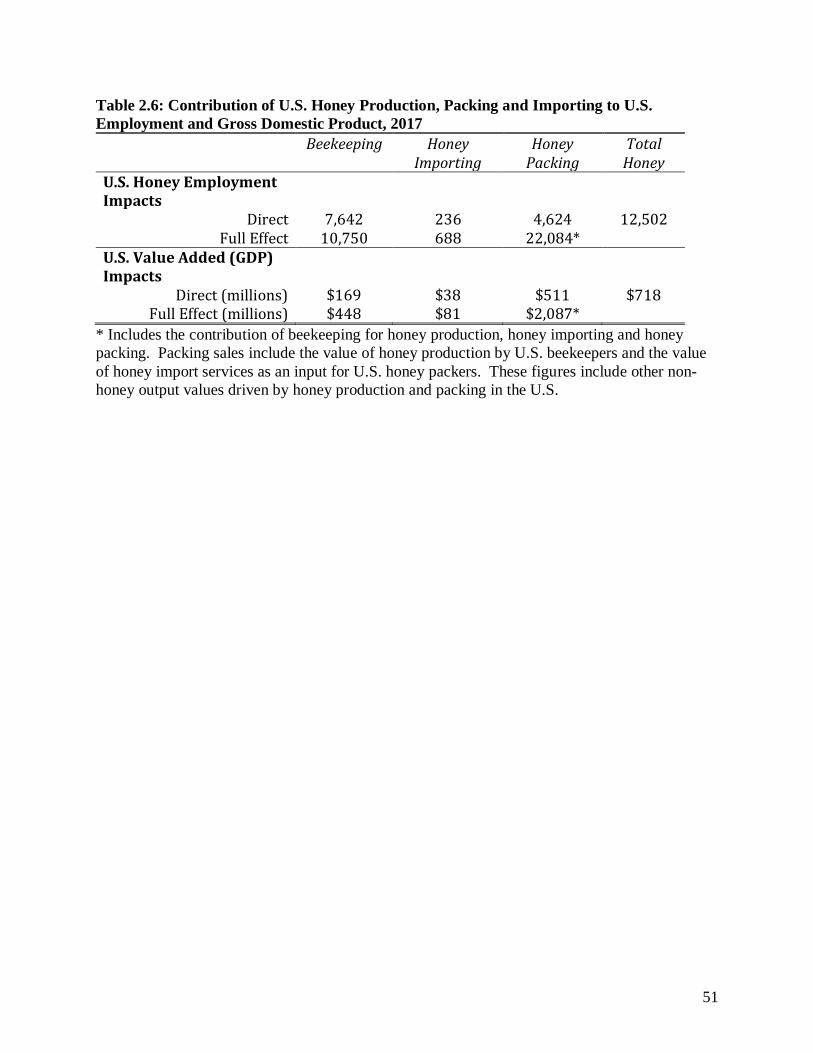
Overall the U.S. honey industry, including production from U.S. beekeepers, handling of
honey imports in the U.S. and packing of U.S. honey supply contributes a total of 13,639 direct
jobs in the U.S. economy and adds $844 million to the U.S. GDP (Table 2.6).
2.2 Economic Contributions of Honey in U.S. Food Processing and Manufacturing
We estimate that over half of the honey consumed in the U.S. is as an ingredient in
processed food products such as breakfast cereals and bakery goods. We further assume that all
of the honey used in food processing is imported honey. In the previous sub-section, we
discussed the impacts of the U.S. honey industry by examining the “upstream” effects of
beekeeping, honey importing and honey packing. This analysis allows examination of how
shifts in honey production, imports or packing would impact the U.S. economy through changes
in value of purchased inputs and hired labor necessary to deliver honey products to the U.S.
market. We also believe it is worthy to discuss the potential impacts that honey has on
downstream food processing. In other words, examine the impact that a restriction in honey
imports or honey availability would have on the food processing sector.
44
To conduct this analysis, we choose six food processing industry sectors within IMPLAN
that would use honey as an input ingredient. The six sectors selected are 1) breakfast cereal
manufacturing, 2) bread and bakery products manufacturing, 3) cookie and cracker
manufacturing, 4) flavoring syrup and concentrate manufacturing, 5) dressing and sauce
manufacturing and 6) other snack food manufacturing. To determine the impact of honey as an
input, we estimate honey’s share of aggregate expenditures on intermediate inputs for all six
manufacturing sectors. Using values within the IMPLAN database, total intermediate
expenditures across the six sectors was $88.5 billion. The value of imported honey designated
for food processing was $420 million, or about 0.47% of total expenditures. We apply this share
of total expenditures to the aggregate economic impacts from the six food processing sectors to
estimate the value of food processing dependent on honey as an input ingredient (Table 2.7).
Direct output for the U.S. food processing sectors related to honey-inclusive products is
about $737 million with total output of about $2.2 billion. The value-added to the U.S. economy
from the manufacture of these products totaled $939 million when including indirect and induced
effects. Of this, more than half ($515 million) was in the form of labor income. The number of
direct jobs attributed to the manufacture of honey-inclusive products is 2,192 and just under
8,000 jobs in the U.S. economy are impacted by the production of honey-inclusive processed
food products.

45
Concluding Remarks
The U.S. honey industry, including honey production by U.S. beekeepers, honey
importers and honey packers, directly supports 12,502 jobs in the U.S. economy and contributes
$718 million to the U.S. GDP in 2017. When including indirect and induced effects about 22,084
jobs in the US are supported by honey production and sales and $2.1 billion in new value is
added to the US economy. Consumption of honey in the United States is increasing and
consumers’ choice of honey as a sweetener over other options is gaining in popularity. Much of
the increase in honey consumption comes in the form of processed food products. The
availability of honey as an input ingredient impacts the U.S. economy through the jobs supported
and labor income generated from the manufacture of honey-inclusive food products.
In addition to the contributions the honey industry makes to the U.S. economy, honey
production contributes to the national health and well-being of its citizens by offering a healthful,
nutritious and enjoyable sweetener option to U.S. food consumers.

46
Table 2.1: Economic Aggregates for the U.S. Honey Industry, 2017
Beekeeping
Honey Importing
Honey Packing
Direct Employment 7,642 236 4,624
Direct Value of Output ($millions of sales) $318 $57 $1,583
Direct Value Added ($millions of returns to labor and capital plus business taxes within the sector)
$169 $38 $511
Source: IMPLAN data set and authors’ calculations for adjustments to 2017 honey production
and prices from USDA, US Dept of Commerce and The National Honey Board.
47
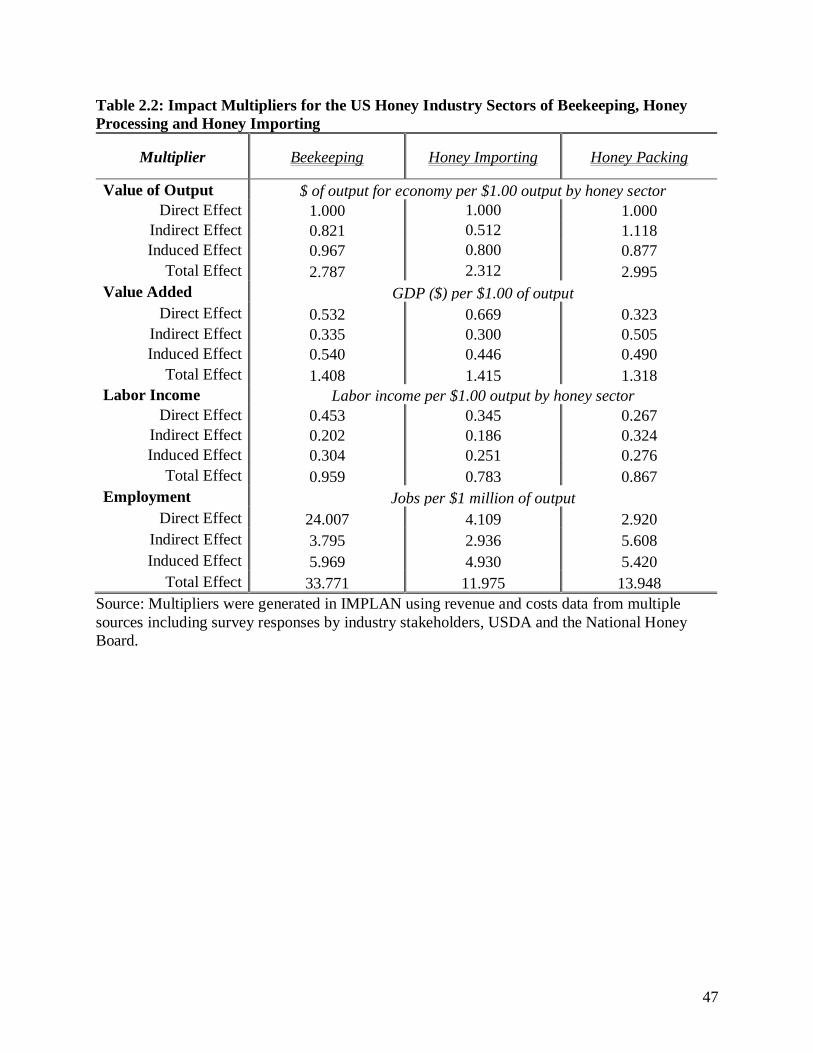
Table 2.2: Impact Multipliers for the US Honey Industry Sectors of Beekeeping, Honey
Processing and Honey Importing
Multiplier Beekeeping Honey Importing Honey Packing
Value of Output $ of output for economy per $1.00 output by honey sector
Direct Effect 1.000 1.000 1.000
Indirect Effect 0.821 0.512 1.118
Induced Effect 0.967 0.800 0.877
Total Effect 2.787 2.312 2.995
Value Added GDP ($) per $1.00 of output
Direct Effect 0.532 0.669 0.323
Indirect Effect 0.335 0.300 0.505
Induced Effect 0.540 0.446 0.490
Total Effect 1.408 1.415 1.318
Labor Income Labor income per $1.00 output by honey sector
Direct Effect 0.453 0.345 0.267
Indirect Effect 0.202 0.186 0.324
Induced Effect 0.304 0.251 0.276
Total Effect 0.959 0.783 0.867
Employment Jobs per $1 million of output
Direct Effect 24.007 4.109 2.920
Indirect Effect 3.795 2.936 5.608
Induced Effect 5.969 4.930 5.420
Total Effect 33.771 11.975 13.948
Source: Multipliers were generated in IMPLAN using revenue and costs data from multiple
sources including survey responses by industry stakeholders, USDA and the National Honey
Board.

48
Table 2.3: Economic Impacts of the U.S. Beekeeping Industry in 2017 by Output.
Impact Measure Honey Pollination
Services
Bee
Byproducts1
Total
Beekeeping
Value of Sector Output $1,000,000
Direct Output $318 $435 $163 $916
Indirect Output $261 $357 $134 $752
Induced Output $308 $421 $158 $886
Total Output $887 $1,212 $455 $2,554
Value Added
Direct Value Added $169 $232 $87 $488
Indirect Value Added $107 $146 $55 $307
Induced Value Added $172 $235 $88 $495
Total Value Added $448 $612 $230 $1,290
Labor Income
Direct Labor Income $144 $197 $74 $415
Indirect Labor Income $64 $88 $33 $185
Induced Labor Income $97 $132 $50 $278
Total Labor Income $305 $417 $156 $879
Employment Number of Jobs
Direct Employment 7,642 10,443 3,915 22,000
Indirect Employment 1,208 1,651 619 3,478
Induced Employment 1,900 2,597 974 5,470
Total Employment 10,750 14,691 5,508 30,948
Source: Values were estimated by UC AIC staff by applying beekeeping input-output multipliers
generated in IMPLAN and using gross revenue data provided by USDA NASS. 1 Bee byproducts include sales of beeswax, queens, nucs and other non-honey byproducts.

49
Table 2.4: Estimates of Direct Output for U.S. Honey Importers and U.S. Honey Packers,
2017
Honey Importers Honey Packers
Volume of imported honey (lbs)
448.7 million
Volume of U.S. honey production (lbs)
147.6 million
Import price ($/lbs) $1.28 34% volume of honey imports (lbs)
150.5 million
Total value $574 million Total volume (lbs) 298.1 million
Importer revenue from service (10% total import value)
$57.4 million
Wholesale price ($/lbs)
$5.31
Packer revenue $1.583 billion
Import price and volume data come from USDA AMS National Honey Report, February 2018.
Volume of U.S. honey production data comes from 2017 USDA NASS Annual Honey Report.
The 2017 wholesale price is the average monthly wholesale price estimated from data provided
by the National Honey Board.

50
Table 2.5: Economic Impacts of Honey Packing and Honey Import Industry by Output.
Impact Measure Honey Import Service Honey Packing
Value of Sector Output $1,000,000
Direct Output $57 $1,583
Indirect Output $29 $1,770
Induced Output $46 $1,388
Total Output $133 $4,742
Value Added Direct Value Added $38 $511
Indirect Value Added $17 $800
Induced Value Added $26 $776
Total Value Added $81 $2,087
Labor Income Direct Labor Income $20 $423
Indirect Labor Income $11 $513
Induced Labor Income $14 $437
Total Labor Income $45 $1,372
Employment Number of Jobs
Direct Employment 236 4,624
Indirect Employment 169 8,879
Induced Employment 283 8,581
Total Employment 688 22,084
Source: Values were estimated by UC AIC staff by applying appropriate input-output multipliers
generated in IMPLAN to estimated gross revenues generated through honey import services and
honey packing.
51
Table 2.6: Contribution of U.S. Honey Production, Packing and Importing to U.S.
Employment and Gross Domestic Product, 2017
Beekeeping Honey Importing
Honey Packing
Total Honey
U.S. Honey Employment Impacts
Direct 7,642 236 4,624 12,502 Full Effect 10,750 688 22,084*
U.S. Value Added (GDP) Impacts
Direct (millions) $169 $38 $511 $718 Full Effect (millions) $448 $81 $2,087*
* Includes the contribution of beekeeping for honey production, honey importing and honey
packing. Packing sales include the value of honey production by U.S. beekeepers and the value
of honey import services as an input for U.S. honey packers. These figures include other non-
honey output values driven by honey production and packing in the U.S.

52
Table 2.7: Economic Impacts of Honey In Food Processing Sector.
Impact Measure Food Processing Sectors
Value of Sector Output $1,000,000
Direct Output $737
Indirect Output $898
Induced Output $525
Total Output $2,160
Value Added Direct Value Added $277
Indirect Value Added $369
Induced Value Added $293
Total Value Added $939
Labor Income
Direct Labor Income $124
Indirect Labor Income $226
Induced Labor Income $165
Total Labor Income $515
Employment Number of Jobs
Direct Employment 2,192
Indirect Employment 3,045
Induced Employment 2,731
Total Employment 7,968
Source: Values were estimated by UC AIC staff by applying appropriate input-output multipliers
generated in IMPLAN to estimated gross revenues generated in food processing sectors. Sectors
included in this analysis include breakfast cereal manufacturing, bread bakery products, cookie
and cracker manufacturing, flavoring syrup and concentrate manufacturing, dressing and sauce
manufacturing and general snack food manufacturing.

53
References
Goodrich, B. 2018. A Bee Economist Explains Honey Bees’ Vital Role in Growing Tasty
Almonds. The Conversation; Academic Rigor, Journalistic Flair.
https://theconversation.com/a-bee-economist-explains-honey-bees-vital-role-in-growing-
tasty-almonds-101421. (Accessed August 15, 2018).
Lee H., A. Champetier, D.A. Sumner, and J. Bond. "Bee-conomics Revisited: A Decade of New
Data Is Consistent with the Market Hypothesis." ARE Update 20(5)(2017):1-4.
University of California Giannini Foundation of Agricultural Economics.
Lee H., D. A. Sumner and A. Champetier; Pollination Markets and the Coupled Futures of
Almonds and Honey Bees: Simulating Impacts of Shifts in Demands and Costs,
American Journal of Agricultural Economics, , aay063,
https://doi.org/10.1093/ajae/aay063
National Honey Board. 2018. International Bulk Prices. https://www.honey.com/honey-
industry/statistics/international-bulk-prices. (Accessed multiple times).
National Honey Board. 2018. Retail Honey Prices. https://www.honey.com/honey-
industry/statistics/retail-honey-price. (Accessed multiple times).
National Honey Board. 2018. Wholesale Honey Prices. https://www.honey.com/honey-
industry/statistics/wholesale-honey-price. (Accessed multiple times).
USDA Agricultural Marketing Service. 2018. National Honey Report. Federal Market News
Service: Issue 38, no 2. Washington, D.C.
USDA Economic Research Service. 2014. Fruit and Tree Nuts Outlook: Economic Insight. By J.
Bond, K. Plattner and K. Hunt. Washington, D.C.
USDA Economic Research Service. 2018. Sugar and Sweeteners Outlook. Washington, D.C.
USDA National Agricultural Statistics Service. 2018. 2017 Annual Honey Report. Washington,
D.C.
U.S. International Trade Commission.2018. Dataweb online database. https://dataweb.usitc.gov/.
Accessed multiple times.