control of intestinal stem cell function and proliferation...
TRANSCRIPT
ART ICLES
Control of intestinal stem cell function and proliferationby mitochondrial pyruvate metabolismJohn C. Schell1, Dona R. Wisidagama2, Claire Bensard1, Helong Zhao3, Peng Wei1, Jason Tanner1, Aimee Flores4,5,Jeffrey Mohlman6, Lise K. Sorensen3, Christian S. Earl1, Kristofor A. Olson1, Ren Miao1, T. CameronWaller1,Don Delker7, Priyanka Kanth7, Lei Jiang8,9, Ralph J. DeBerardinis8, Mary P. Bronner6, Dean Y. Li3, James E. Cox1,Heather R. Christofk4,10, William E. Lowry4,5, Carl S. Thummel2 and Jared Rutter1,11,12
Most differentiated cells convert glucose to pyruvate in the cytosol through glycolysis, followed by pyruvate oxidation in themitochondria. These processes are linked by the mitochondrial pyruvate carrier (MPC), which is required for efficientmitochondrial pyruvate uptake. In contrast, proliferative cells, including many cancer and stem cells, perform glycolysis robustlybut limit fractional mitochondrial pyruvate oxidation. We sought to understand the role this transition from glycolysis to pyruvateoxidation plays in stem cell maintenance and differentiation. Loss of the MPC in Lgr5-EGFP-positive stem cells, or treatment ofintestinal organoids with an MPC inhibitor, increases proliferation and expands the stem cell compartment. Similarly, geneticdeletion of the MPC in Drosophila intestinal stem cells also increases proliferation, whereas MPC overexpression suppresses stemcell proliferation. These data demonstrate that limiting mitochondrial pyruvate metabolism is necessary and sufficient to maintainthe proliferation of intestinal stem cells.
It was first observed almost 100 years ago that, unlike differentiatedcells, cancer cells tend to avidly consume glucose, but not fully oxidizethe pyruvate that is generated from glycolysis1. This was originallyproposed to be due to dysfunctional or absent mitochondria, but ithas become increasingly clear that mitochondria remain functionaland critical. Mitochondria are particularly important in proliferatingcells because essential steps in the biosynthesis of amino acids,nucleotide and lipid occur therein2–5. Most proliferating stem cellpopulations also exhibit a similar glycolytic metabolic program6–9,which transitions to a program of mitochondrial carbohydrateoxidation during differentiation10,11. The first distinct step incarbohydrate oxidation is import of pyruvate into the mitochondrialmatrix, where it gains access to the pyruvate dehydrogenase complex(PDH) and enters the tricarboxylic acid (TCA) cycle as acetyl-CoA.We, and others, recently discovered the two proteins that assembleto form the mitochondrial pyruvate carrier (MPC)12,13. This complexis necessary and sufficient for mitochondrial pyruvate import inyeast, flies and mammals, and thereby serves as the junction between
cytoplasmic glycolysis and mitochondrial oxidative phosphorylation.We previously showed that decreased expression and activity ofthe MPC underlies the glycolytic program in colon cancer cellsin vitro and that forced re-expression of the MPC subunits increasedcarbohydrate oxidation and impaired the ability of these cells toform colonies in vitro and tumours in vivo14. This impairmentof tumorigenicity was coincident with a loss of key markers andphenotypes associated with stem cells. This prompted us to examinewhether glycolytic non-transformed stem cells might also exhibit lowMPC expression and mitochondrial pyruvate oxidation, which mustincrease during differentiation.
RESULTSMPC expression is low in intestinal stem cells and increasesfollowing differentiationAs a model system, we have studied LGR5+ intestinal stem cells(ISCs), which reside near the base of the intestinal crypt and con-tinuously proliferate. Their progeny differentiate and populate the
1Department of Biochemistry, University of Utah School of Medicine, Salt Lake City, Utah 84112, USA. 2Department of Human Genetics, University of Utah School ofMedicine, Salt Lake City, Utah 84112, USA. 3Department of Molecular Medicine, University of Utah School of Medicine, Salt Lake City, Utah 84112, USA. 4Eli andEdythe Broad Center for Regenerative Medicine, University of California Los Angeles, Los Angeles, California 90095, USA. 5Department of Molecular Cell andDevelopmental Biology, University of California Los Angeles, Los Angeles, California 90095, USA. 6Department of Pathology, University of Utah School of Medicine,Salt Lake City, Utah 84112, USA. 7Department of Internal Medicine, University of Utah School of Medicine, Salt Lake City, Utah 84112, USA. 8Children’s MedicalCenter Research Institute, University of Texas Southwestern Medical Center, Dallas, Texas 75390, USA. 9Department of Molecular and Cellular Endocrinology,Beckman Research Institute at City of Hope, Duarte, California 91010, USA. 10Department of Biological Chemistry, University of California Los Angeles, Los Angeles,California 90095, USA. 11Howard Hughes Medical Institute, University of Utah School of Medicine, Salt Lake City, Utah 84112, USA.12Correspondence should be addressed to J.R. (e-mail: [email protected])
Received 4 October 2016; accepted 18 July 2017; published online 14 August 2017; DOI: 10.1038/ncb3593
NATURE CELL BIOLOGY VOLUME 19 | NUMBER 9 | SEPTEMBER 2017 1027
© 2017 Macmillan Publishers Limited, part of Springer Nature. All rights reserved.
ART ICLES
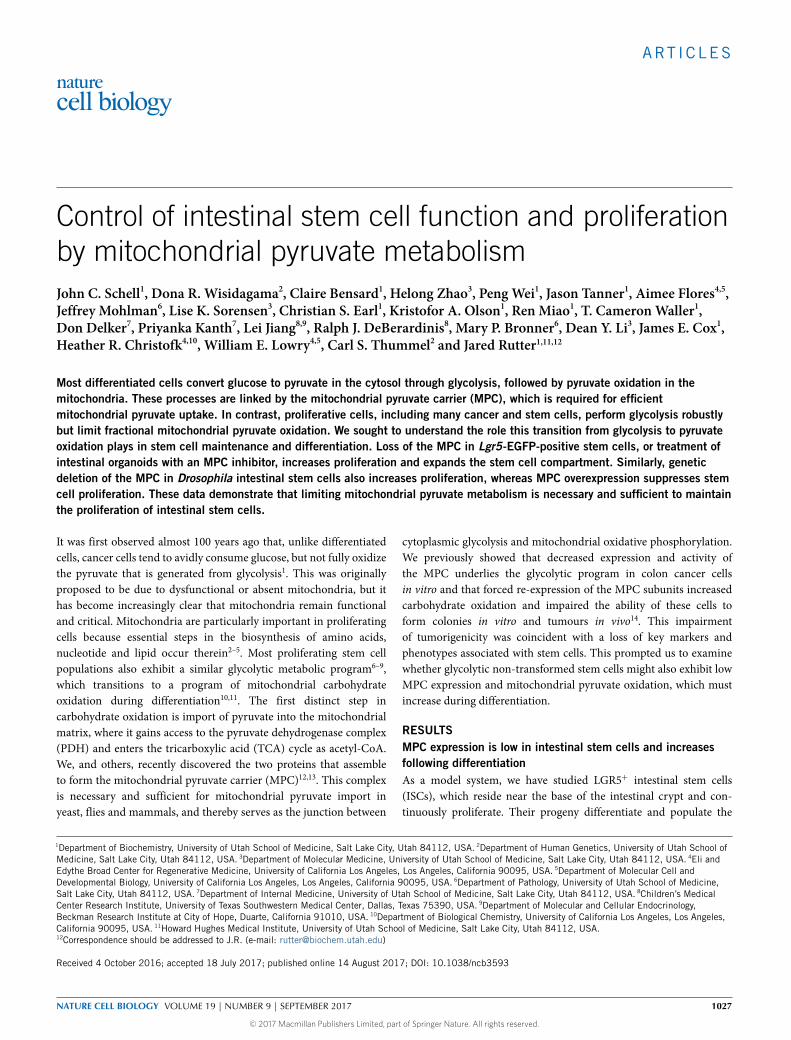
intestinal epithelium, which is completely renewed approximatelyevery 5 days15,16. Using EGFP fluorescence from an Lgr5-EGFP-IRES-CreERT2 allele, we single-cell-sorted intestinal crypt stem cells intolow-, medium- and high-LGR5-expressing populations (Supplemen-tary Fig. 1a). As expected Lgr5messenger RNA, as well as that of othermarkers of stem cells, correlated with Lgr5-EGFP expression, whileKrt20 and other markers of differentiation anti-correlated with EGFP(Fig. 1a,b and Supplementary Table 1). The pattern ofMpc1 andMpc2expression resembled that of differentiation genes, exhibiting lowerexpression in the more stem-like cells that increased with differenti-ation. In vitro organoids maintained in stem cell or differentiation-promoting conditions displayed a similar pattern. When grown inbasal medium containing EGF andNoggin, organoids exhibit a largelydifferentiated gene expression pattern, which is progressively morestem-like when R-spondin 1 and Wnt3a are added to the medium(Fig. 1c,d and Supplementary Table 2). Expression of Mpc1 and, to alesser extent, Mpc2 again correlate with the expression of differenti-ation genes. Both in vivo and in vitro, the expression of indicators ofmitochondrial biogenesis such as Tfam and Nrf1 was higher in morestem-like cell populations (Fig. 1a–d) suggesting that the decreasedMPC expression is not due to a global suppression of mitochondrialgene expression. Similarly, immunohistochemical analysis of the prox-imal small intestine (jejunum) revealed that MPC1 was nearly absentfrom the base of the crypt, the site of LGR5+ ISCs, but stronglyexpressed through the upper crypt and villus, whereas VDAC, amarker of total mitochondrial mass, was more abundant at the base ofthe crypt relative to the remainder of the intestinal epithelium in bothmouse and human (Fig. 1e). Similar anti-correlation of MPC1 andLGR5 expression was observed by immunofluorescence staining ofsmall intestine (Fig. 1f). This pattern of MPC1 and VDAC expressionwas consistent throughout the murine small intestine (jejunum andileum) and NRF1, TFAM and PDK1 were also more abundant in thecrypt cells in human intestine while the differentiation mark CK20was less abundant17,18 (Supplementary Fig. 1b,c). Electron microscopyalso showed high mitochondrial content in crypt stem cells, andisolated Lgr5-EGFP stem cells robustly stain with a dye dependenton mitochondrial membrane potential (Fig. 1g,h). These data areconsistent with the hypothesis that crypt stem cells contain functionalmitochondrial, but that they are geared toward biosynthetic activitiesor oxidation of fatty acids or other non-carbohydrate fuels.
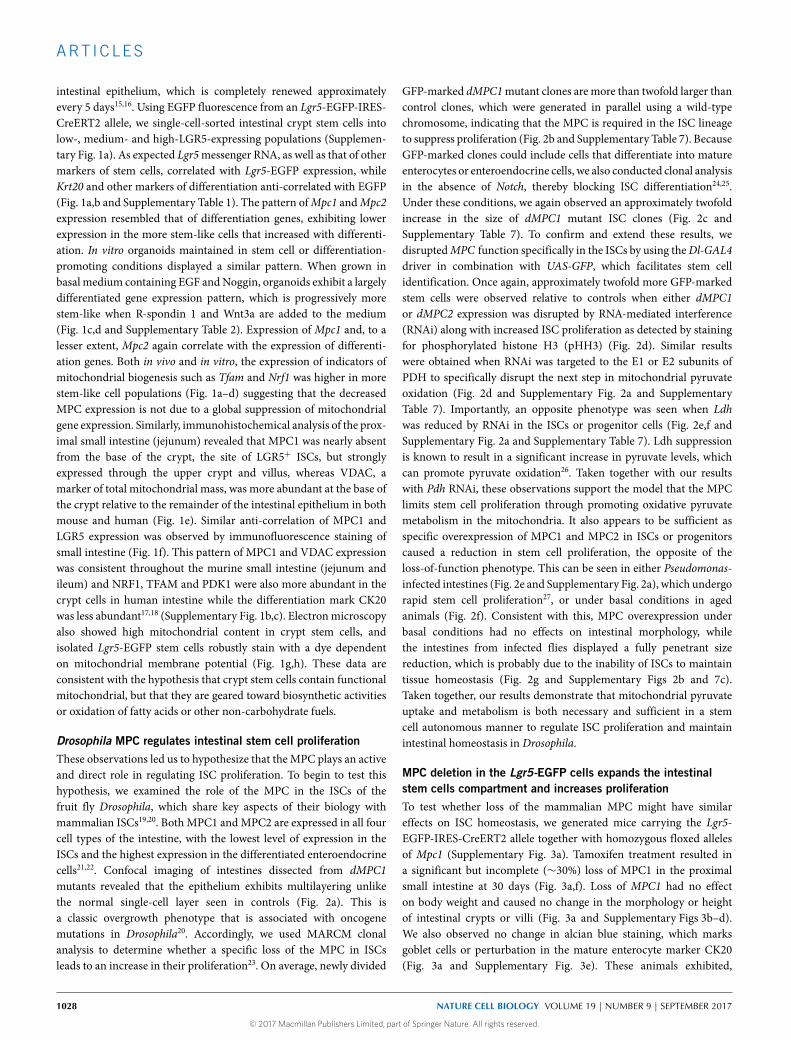
Drosophila MPC regulates intestinal stem cell proliferationThese observations led us to hypothesize that the MPC plays an activeand direct role in regulating ISC proliferation. To begin to test thishypothesis, we examined the role of the MPC in the ISCs of thefruit fly Drosophila, which share key aspects of their biology withmammalian ISCs19,20. Both MPC1 andMPC2 are expressed in all fourcell types of the intestine, with the lowest level of expression in theISCs and the highest expression in the differentiated enteroendocrinecells21,22. Confocal imaging of intestines dissected from dMPC1mutants revealed that the epithelium exhibits multilayering unlikethe normal single-cell layer seen in controls (Fig. 2a). This isa classic overgrowth phenotype that is associated with oncogenemutations in Drosophila20. Accordingly, we used MARCM clonalanalysis to determine whether a specific loss of the MPC in ISCsleads to an increase in their proliferation23. On average, newly divided
GFP-marked dMPC1mutant clones are more than twofold larger thancontrol clones, which were generated in parallel using a wild-typechromosome, indicating that the MPC is required in the ISC lineageto suppress proliferation (Fig. 2b and Supplementary Table 7). BecauseGFP-marked clones could include cells that differentiate into matureenterocytes or enteroendocrine cells, we also conducted clonal analysisin the absence of Notch, thereby blocking ISC differentiation24,25.Under these conditions, we again observed an approximately twofoldincrease in the size of dMPC1 mutant ISC clones (Fig. 2c andSupplementary Table 7). To confirm and extend these results, wedisruptedMPC function specifically in the ISCs by using theDl-GAL4driver in combination with UAS-GFP, which facilitates stem cellidentification. Once again, approximately twofold more GFP-markedstem cells were observed relative to controls when either dMPC1or dMPC2 expression was disrupted by RNA-mediated interference(RNAi) along with increased ISC proliferation as detected by stainingfor phosphorylated histone H3 (pHH3) (Fig. 2d). Similar resultswere obtained when RNAi was targeted to the E1 or E2 subunits ofPDH to specifically disrupt the next step in mitochondrial pyruvateoxidation (Fig. 2d and Supplementary Fig. 2a and SupplementaryTable 7). Importantly, an opposite phenotype was seen when Ldhwas reduced by RNAi in the ISCs or progenitor cells (Fig. 2e,f andSupplementary Fig. 2a and Supplementary Table 7). Ldh suppressionis known to result in a significant increase in pyruvate levels, whichcan promote pyruvate oxidation26. Taken together with our resultswith Pdh RNAi, these observations support the model that the MPClimits stem cell proliferation through promoting oxidative pyruvatemetabolism in the mitochondria. It also appears to be sufficient asspecific overexpression of MPC1 and MPC2 in ISCs or progenitorscaused a reduction in stem cell proliferation, the opposite of theloss-of-function phenotype. This can be seen in either Pseudomonas-infected intestines (Fig. 2e and Supplementary Fig. 2a), which undergorapid stem cell proliferation27, or under basal conditions in agedanimals (Fig. 2f). Consistent with this, MPC overexpression underbasal conditions had no effects on intestinal morphology, whilethe intestines from infected flies displayed a fully penetrant sizereduction, which is probably due to the inability of ISCs to maintaintissue homeostasis (Fig. 2g and Supplementary Figs 2b and 7c).Taken together, our results demonstrate that mitochondrial pyruvateuptake and metabolism is both necessary and sufficient in a stemcell autonomous manner to regulate ISC proliferation and maintainintestinal homeostasis in Drosophila.
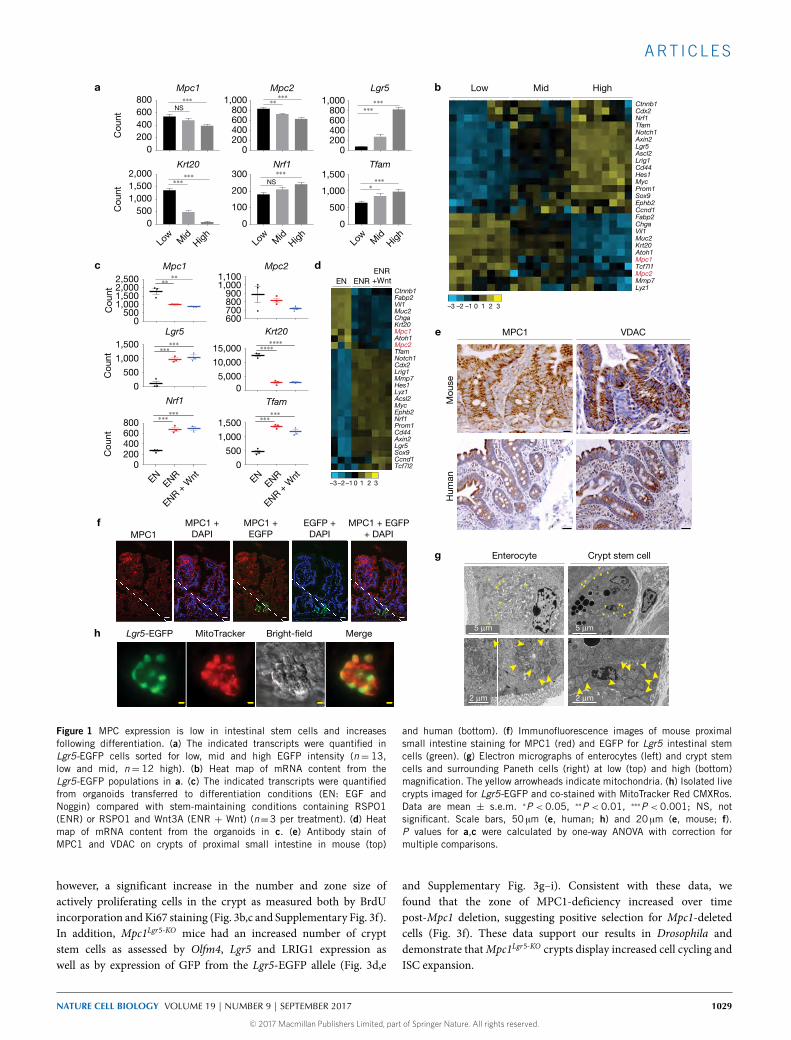
MPC deletion in the Lgr5-EGFP cells expands the intestinalstem cells compartment and increases proliferationTo test whether loss of the mammalian MPC might have similareffects on ISC homeostasis, we generated mice carrying the Lgr5-EGFP-IRES-CreERT2 allele together with homozygous floxed allelesof Mpc1 (Supplementary Fig. 3a). Tamoxifen treatment resulted ina significant but incomplete (∼30%) loss of MPC1 in the proximalsmall intestine at 30 days (Fig. 3a,f). Loss of MPC1 had no effecton body weight and caused no change in the morphology or heightof intestinal crypts or villi (Fig. 3a and Supplementary Figs 3b–d).We also observed no change in alcian blue staining, which marksgoblet cells or perturbation in the mature enterocyte marker CK20(Fig. 3a and Supplementary Fig. 3e). These animals exhibited,
1028
© 2017 Macmillan Publishers Limited, part of Springer Nature. All rights reserved.
NATURE CELL BIOLOGY VOLUME 19 | NUMBER 9 | SEPTEMBER 2017
ART ICLES
ENR+WntEN ENR
Ctnnb1Fabp2Vil1Muc2ChgaKrt20Mpc1Atoh1Mpc2TfamNotch1Cdx2Lrig1Mmp7Hes1Lyz1Acsl2MycEphb2Nrf1Prom1Cd44Axin2Lgr5Sox9Ccnd1Tcf7l2
3210–1–2–3
3210–1–2–3
Low Mid High
Ctnnb1Cdx2Nrf1TfamNotch1Axin2Lgr5Ascl2Lrig1Cd44Hes1MycProm1Sox9Ephb2Ccnd1Fabp2ChgaVil1Muc2Krt20Atoh1Mpc1Tcf7l1Mpc2Mmp7Lyz1
Lgr5-EGFP MitoTracker Bright-field Merge
a b
d
Enterocyte Crypt stem cellg
h
c
0200400600800
1,000Mpc2∗∗
∗∗∗
0200400600800
Cou
nt
Mpc1
NS∗∗∗
0200400600800
1,000Lgr5
∗∗∗∗∗∗
0
100
200
300Nrf1∗∗∗
NS
0
500
1,000
1,500Tfam
∗∗∗∗
0500
1,0001,5002,000
Cou
nt
Krt20
∗∗∗∗∗∗
MPC1 VDAC
Mou
seH
uman
e
fMPC1
MPC1 +DAPI
MPC1 +EGFP
EGFP +DAPI
MPC1 + EGFP+ DAPI
0500
1,0001,5002,0002,500
Cou
nt
Mpc1
∗∗∗∗
600700800900
1,0001,100
Mpc2
0
500
1,000
1,500
Cou
nt
Lgr5∗∗∗
∗∗∗
05,000
10,000
15,000
Krt20∗∗∗∗
∗∗∗∗
ENENR
ENR + W
nt0
200400600800
Cou
nt
Nrf1∗∗∗
∗∗∗
ENENR
ENR + W
nt0
500
1,000
1,500
Tfam
∗∗∗∗∗∗
Low
Mid
High Low
Mid
High Low
Mid
High
5 μm 5 μm
2 μm 2 μm
Figure 1 MPC expression is low in intestinal stem cells and increasesfollowing differentiation. (a) The indicated transcripts were quantified inLgr5-EGFP cells sorted for low, mid and high EGFP intensity (n= 13,low and mid, n= 12 high). (b) Heat map of mRNA content from theLgr5-EGFP populations in a. (c) The indicated transcripts were quantifiedfrom organoids transferred to differentiation conditions (EN: EGF andNoggin) compared with stem-maintaining conditions containing RSPO1(ENR) or RSPO1 and Wnt3A (ENR + Wnt) (n=3 per treatment). (d) Heatmap of mRNA content from the organoids in c. (e) Antibody stain ofMPC1 and VDAC on crypts of proximal small intestine in mouse (top)
and human (bottom). (f) Immunofluorescence images of mouse proximalsmall intestine staining for MPC1 (red) and EGFP for Lgr5 intestinal stemcells (green). (g) Electron micrographs of enterocytes (left) and crypt stemcells and surrounding Paneth cells (right) at low (top) and high (bottom)magnification. The yellow arrowheads indicate mitochondria. (h) Isolated livecrypts imaged for Lgr5-EGFP and co-stained with MitoTracker Red CMXRos.Data are mean ± s.e.m. ∗P < 0.05, ∗∗P < 0.01, ∗∗∗P < 0.001; NS, notsignificant. Scale bars, 50 µm (e, human; h) and 20 µm (e, mouse; f).P values for a,c were calculated by one-way ANOVA with correction formultiple comparisons.
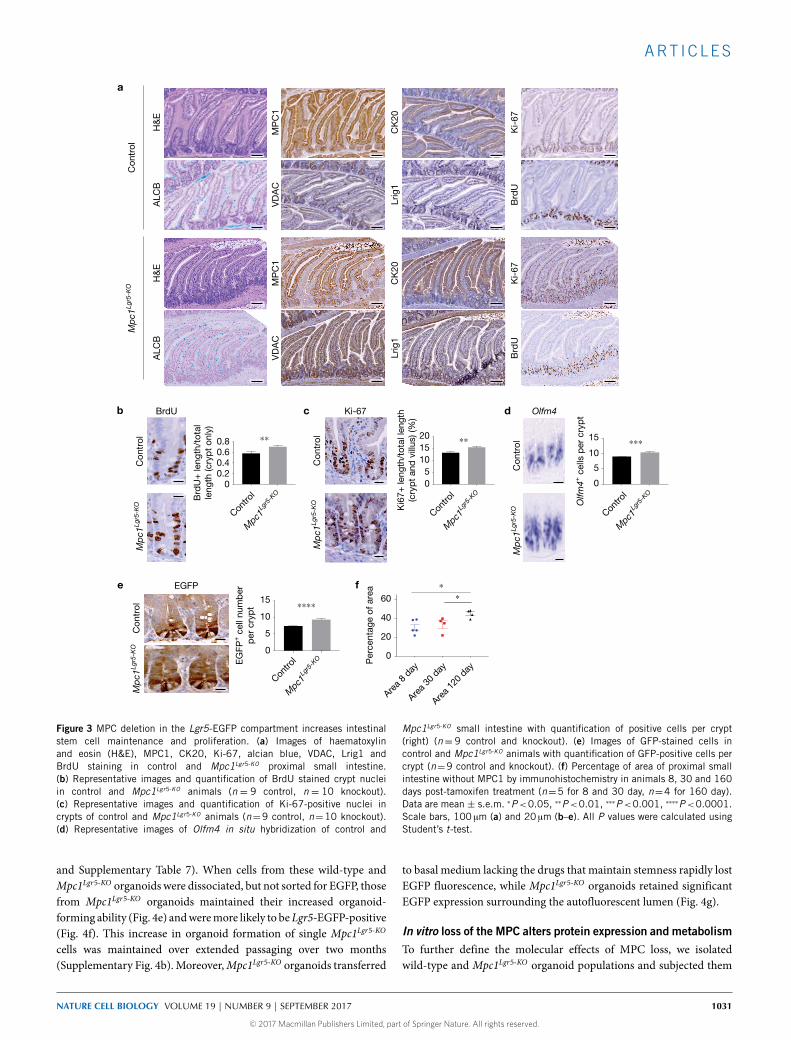
however, a significant increase in the number and zone size ofactively proliferating cells in the crypt as measured both by BrdUincorporation andKi67 staining (Fig. 3b,c and Supplementary Fig. 3f).In addition, Mpc1Lgr5-KO mice had an increased number of cryptstem cells as assessed by Olfm4, Lgr5 and LRIG1 expression aswell as by expression of GFP from the Lgr5-EGFP allele (Fig. 3d,e
and Supplementary Fig. 3g–i). Consistent with these data, wefound that the zone of MPC1-deficiency increased over timepost-Mpc1 deletion, suggesting positive selection for Mpc1-deletedcells (Fig. 3f). These data support our results in Drosophila anddemonstrate thatMpc1Lgr5-KO crypts display increased cell cycling andISC expansion.
NATURE CELL BIOLOGY VOLUME 19 | NUMBER 9 | SEPTEMBER 2017
© 2017 Macmillan Publishers Limited, part of Springer Nature. All rights reserved.
1029
ART ICLES
dMPC1– dMPC1–
dMPC1
–
PD
H
a b
d
80604020
0
No.
of c
ells
per
clo
ne
0
Contro
l
Contro
l
dMPC1
PDH-E1
dMPC1
dMPC2
PDH-E1
PDH-E2
10203040
50
GFP
+ c
ells
c
Notch, dMPC1–
Notch
2520
1015
50
No.
of c
ells
per
clo
ne
dM
PC
1
∗∗∗∗
Control Control
Contro
l
Notch
Not
ch
dMPC1
–
Con
trol
30 μm30 μm 100 μm
f
PH
H3+
cel
ls p
er in
test
ine
10
20
30
40
0
Contro
l
MPC o
/eLd
h
dMPC1
gesg>MPC1-MPC2Control Control esg>MPC1-MPC2
23 days old Pe infected
∗∗
∗∗
∗
05
25201510
∗∗
PH
H3+
cel
lsp
er in
test
ine
∗∗∗e Control –Pe
dMPC o/e Ldh RNAi dMPC1 RNAi PDH RNAi
PH
H3+
cel
lsp
er in
test
ine
102030
5060
40
0
Contro
l –Pe
Contro
l
MPC o
/eLd
h
dMPC1
PDH-E1
Control ∗∗∗
∗∗∗∗∗∗
50 μm
30 μm
500 μm
Figure 2 Drosophila MPC regulates intestinal stem cell proliferation.(a) Intestines from controls and dMPC1 mutants stained with phalloidin(red) and DAPI (blue), (n=10 control, n=7 knockout). (b) MARCM dMPC1mutant clones marked by GFP along with quantification of clone size(n= 13 clones from control, n= 12 clones from knockout, 15 animalsassessed for each group). (c) MARCM dMPC1 mutant clones with NotchRNAi marked by GFP along with quantification (n = 31 from control,n= 38 from knockout). (d) Dl-GAL4 used to target RNAi as indicated,(control n= 8, dMPC1 RNAi n= 8, dMPC2 RNAi n= 8, PDH-E1 n= 7,PDH-E2 n=7 experimental replicates). Increased proliferation as detectedby staining for phosphorylated histone H3 (pHH3) (PHH3 + cells countedfrom control n = 8, dMPC1 RNAi n = 8, PDH-E1 n = 7). (e) Dl-GAL4
used to target RNAi as indicated or MPC overexpression (o/e) underinfected conditions (control n= 5 (no infection), control with infectionn=10, dMPC o/e n=10, Ldh RNAi n=10, dMPC1 RNAi n=10, PDHRNAi n=10). (f) esg-GAL4 was used to direct MPC overexpression (o/e)or RNAi targeting Ldh or dMPC1 under uninfected basal conditions in23-day-old adults maintained at 29 ◦C (control n=10, MPC o/e n=10,Ldh RNAi n=10, dMPC1 RNAi n=10). (g) Intestine size is unaffectedin animals overexpressing MPC under basal conditions in aged flies(left two panels) and reduced in infected animals (right two panels)(n= 10 for control and MPC o/e). Data are mean ± s.e.m. ∗P < 0.05,∗∗P<0.01, ∗∗∗P<0.001. All P values were calculated using Student’s t-test.Pe, Pseudomonas entomophila.
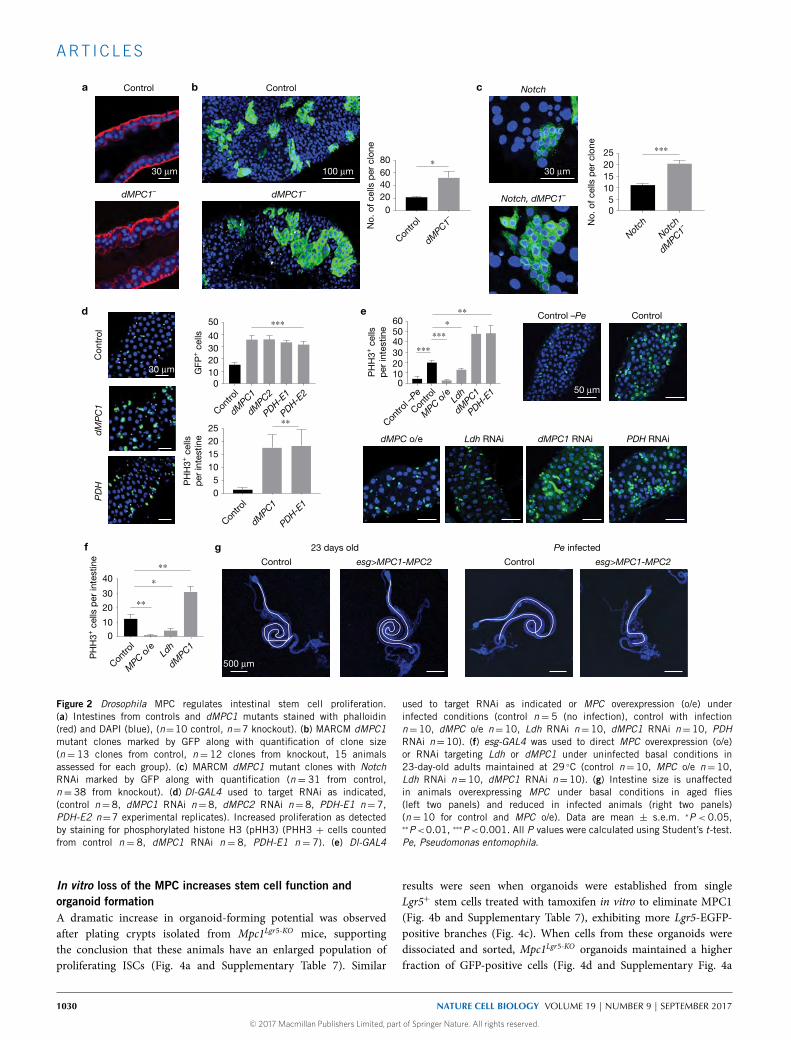
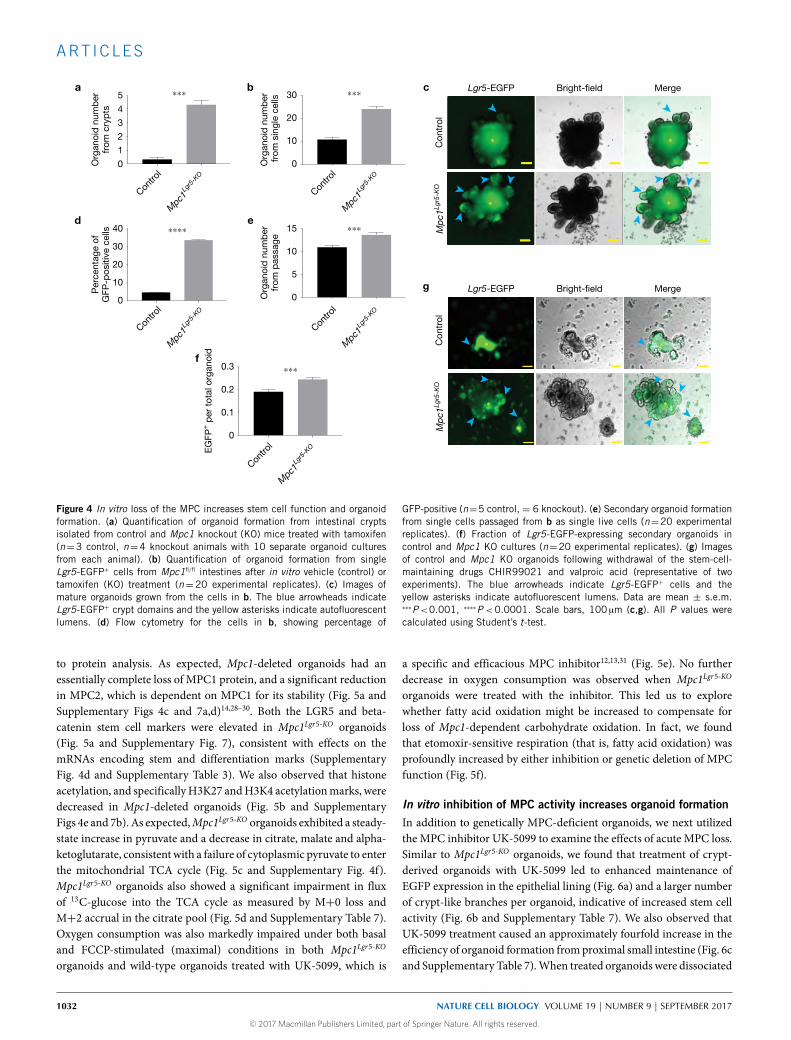
In vitro loss of the MPC increases stem cell function andorganoid formationA dramatic increase in organoid-forming potential was observedafter plating crypts isolated from Mpc1Lgr5-KO mice, supportingthe conclusion that these animals have an enlarged population ofproliferating ISCs (Fig. 4a and Supplementary Table 7). Similar
results were seen when organoids were established from singleLgr5+ stem cells treated with tamoxifen in vitro to eliminate MPC1(Fig. 4b and Supplementary Table 7), exhibiting more Lgr5-EGFP-positive branches (Fig. 4c). When cells from these organoids weredissociated and sorted, Mpc1Lgr5-KO organoids maintained a higherfraction of GFP-positive cells (Fig. 4d and Supplementary Fig. 4a
1030
© 2017 Macmillan Publishers Limited, part of Springer Nature. All rights reserved.
NATURE CELL BIOLOGY VOLUME 19 | NUMBER 9 | SEPTEMBER 2017
ART ICLES
EGFP
Con
trol
Mp
c1Lg
r5-K
O
a
b c d
e f
0
5
10
15
EG
FP+ c
ell n
umb
erp
er c
ryp
t ∗∗∗∗
Con
trol
Mp
c1Lg
r5-K
O
Ki-67
05
101520
Ki6
7+ le
ngth
/tot
al le
ngth
(cry
pt
and
vill
us) (
%)
∗∗
Ki-
67B
rdU
CK
20Lr
ig1
MP
C1
VD
AC
H&
EA
LCB
H&
EA
LCB
MP
C1
VD
AC
CK
20Lr
ig1
Ki-
67B
rdU
0
5
10
15
Olfm
4+ c
ells
per
cry
pt
∗∗∗
Con
trol
Mp
c1Lg
r5-K
O
Olfm4
Con
trol
Mp
c1Lg
r5-K
O
Area 8
day
Area 3
0 day
Area 1
20 d
ay0
20
40
60
Per
cent
age
of a
rea
∗∗
BrdU
00.20.40.60.8
Brd
U+
leng
th/t
otal
leng
th (c
ryp
t on
ly)
∗∗
Con
trol
Mp
c1Lg
r5-K
O
Contro
l
Mpc1
Lgr5
-KO
Contro
l
Mpc1
Lgr5
-KO
Contro
l
Mpc1
Lgr5
-KO
Contro
l
Mpc1
Lgr5
-KO
Figure 3 MPC deletion in the Lgr5-EGFP compartment increases intestinalstem cell maintenance and proliferation. (a) Images of haematoxylinand eosin (H&E), MPC1, CK20, Ki-67, alcian blue, VDAC, Lrig1 andBrdU staining in control and Mpc1Lgr5-KO proximal small intestine.(b) Representative images and quantification of BrdU stained crypt nucleiin control and Mpc1Lgr5-KO animals (n = 9 control, n = 10 knockout).(c) Representative images and quantification of Ki-67-positive nuclei incrypts of control and Mpc1Lgr5-KO animals (n=9 control, n=10 knockout).(d) Representative images of Olfm4 in situ hybridization of control and
Mpc1Lgr5-KO small intestine with quantification of positive cells per crypt(right) (n= 9 control and knockout). (e) Images of GFP-stained cells incontrol and Mpc1Lgr5-KO animals with quantification of GFP-positive cells percrypt (n=9 control and knockout). (f) Percentage of area of proximal smallintestine without MPC1 by immunohistochemistry in animals 8, 30 and 160days post-tamoxifen treatment (n=5 for 8 and 30 day, n=4 for 160 day).Data are mean ± s.e.m. ∗P<0.05, ∗∗P<0.01, ∗∗∗P<0.001, ∗∗∗∗P<0.0001.Scale bars, 100 µm (a) and 20 µm (b–e). All P values were calculated usingStudent’s t-test.
and Supplementary Table 7). When cells from these wild-type andMpc1Lgr5-KO organoids were dissociated, but not sorted for EGFP, thosefrom Mpc1Lgr5-KO organoids maintained their increased organoid-forming ability (Fig. 4e) andweremore likely to beLgr5-EGFP-positive(Fig. 4f). This increase in organoid formation of single Mpc1Lgr5-KO
cells was maintained over extended passaging over two months(Supplementary Fig. 4b). Moreover,Mpc1Lgr5-KO organoids transferred
to basal medium lacking the drugs that maintain stemness rapidly lostEGFP fluorescence, while Mpc1Lgr5-KO organoids retained significantEGFP expression surrounding the autofluorescent lumen (Fig. 4g).
In vitro loss of the MPC alters protein expression and metabolismTo further define the molecular effects of MPC loss, we isolatedwild-type and Mpc1Lgr5-KO organoid populations and subjected them
NATURE CELL BIOLOGY VOLUME 19 | NUMBER 9 | SEPTEMBER 2017
© 2017 Macmillan Publishers Limited, part of Springer Nature. All rights reserved.
1031
ART ICLES
a b c
e
f
Contro
l0
1
2
3
4
5O
rgan
oid
num
ber
from
cry
pts
∗∗∗
Mpc1
Lgr5
-KO
Contro
l
Mpc1
Lgr5
-KO
Contro
l
Mpc1
Lgr5
-KO
Contro
l
Mpc1
Lgr5
-KO
Contro
l0
10
20
30
Org
anoi
d n
umb
er fr
om s
ingl
e ce
lls
∗∗∗
Mpc1
Lgr5
-KO
0
5
10
15
Org
anoi
d n
umb
erfr
om p
assa
ge
∗∗∗
0
0.1
0.2
0.3
EG
FP+ p
er t
otal
org
anoi
d
∗∗∗
∗
Con
trol
∗
∗ ∗
Lgr5-EGFP Bright-field Merge
Lgr5-EGFP Bright-field Merge
Mp
c1Lg
r5-K
OC
ontr
olM
pc1
Lgr5
-KO
∗ ∗
∗ ∗
∗∗
0
10
20
30
40
Per
cent
age
ofG
FP-p
ositi
ve c
ells ∗∗∗∗
d
g
Figure 4 In vitro loss of the MPC increases stem cell function and organoidformation. (a) Quantification of organoid formation from intestinal cryptsisolated from control and Mpc1 knockout (KO) mice treated with tamoxifen(n=3 control, n=4 knockout animals with 10 separate organoid culturesfrom each animal). (b) Quantification of organoid formation from singleLgr5-EGFP+ cells from Mpc1fl/fl intestines after in vitro vehicle (control) ortamoxifen (KO) treatment (n=20 experimental replicates). (c) Images ofmature organoids grown from the cells in b. The blue arrowheads indicateLgr5-EGFP+ crypt domains and the yellow asterisks indicate autofluorescentlumens. (d) Flow cytometry for the cells in b, showing percentage of
GFP-positive (n=5 control, = 6 knockout). (e) Secondary organoid formationfrom single cells passaged from b as single live cells (n=20 experimentalreplicates). (f) Fraction of Lgr5-EGFP-expressing secondary organoids incontrol and Mpc1 KO cultures (n=20 experimental replicates). (g) Imagesof control and Mpc1 KO organoids following withdrawal of the stem-cell-maintaining drugs CHIR99021 and valproic acid (representative of twoexperiments). The blue arrowheads indicate Lgr5-EGFP+ cells and theyellow asterisks indicate autofluorescent lumens. Data are mean ± s.e.m.∗∗∗P<0.001, ∗∗∗∗P <0.0001. Scale bars, 100 µm (c,g). All P values werecalculated using Student’s t-test.
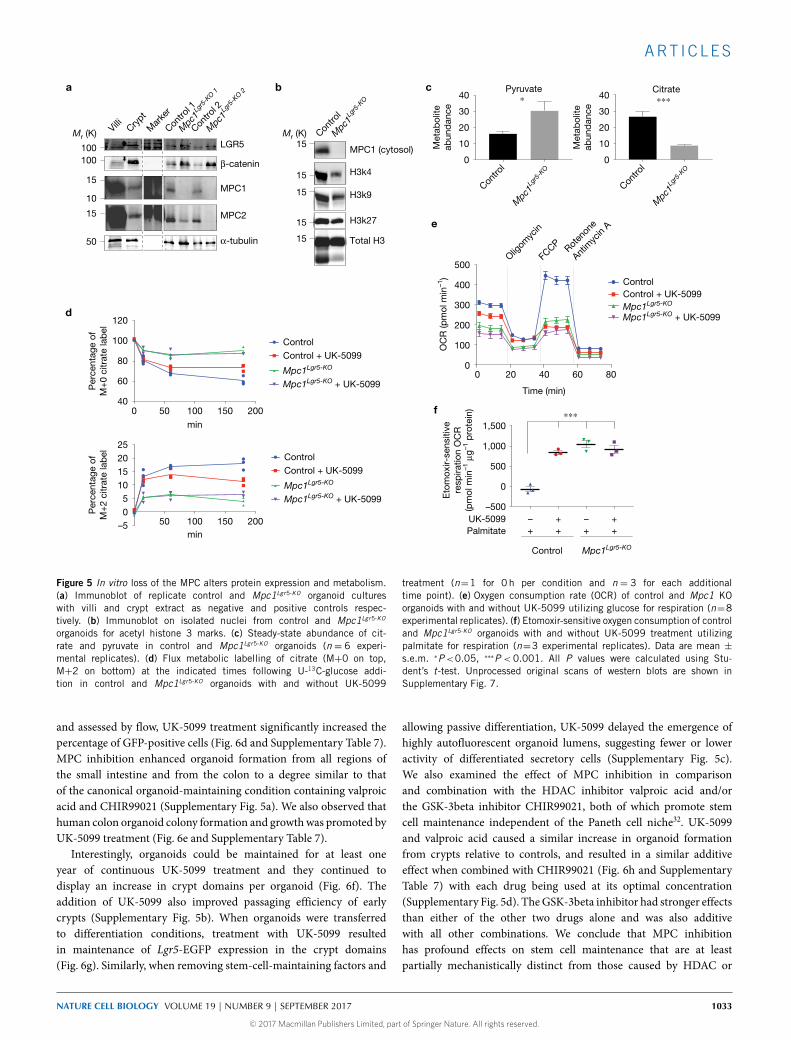
to protein analysis. As expected, Mpc1-deleted organoids had anessentially complete loss of MPC1 protein, and a significant reductionin MPC2, which is dependent on MPC1 for its stability (Fig. 5a andSupplementary Figs 4c and 7a,d)14,28–30. Both the LGR5 and beta-catenin stem cell markers were elevated in Mpc1Lgr5-KO organoids(Fig. 5a and Supplementary Fig. 7), consistent with effects on themRNAs encoding stem and differentiation marks (SupplementaryFig. 4d and Supplementary Table 3). We also observed that histoneacetylation, and specificallyH3K27 andH3K4 acetylationmarks, weredecreased in Mpc1-deleted organoids (Fig. 5b and SupplementaryFigs 4e and 7b). As expected,Mpc1Lgr5-KO organoids exhibited a steady-state increase in pyruvate and a decrease in citrate, malate and alpha-ketoglutarate, consistent with a failure of cytoplasmic pyruvate to enterthe mitochondrial TCA cycle (Fig. 5c and Supplementary Fig. 4f).Mpc1Lgr5-KO organoids also showed a significant impairment in fluxof 13C-glucose into the TCA cycle as measured by M+0 loss andM+2 accrual in the citrate pool (Fig. 5d and Supplementary Table 7).Oxygen consumption was also markedly impaired under both basaland FCCP-stimulated (maximal) conditions in both Mpc1Lgr5-KO
organoids and wild-type organoids treated with UK-5099, which is
a specific and efficacious MPC inhibitor12,13,31 (Fig. 5e). No furtherdecrease in oxygen consumption was observed when Mpc1Lgr5-KO
organoids were treated with the inhibitor. This led us to explorewhether fatty acid oxidation might be increased to compensate forloss of Mpc1-dependent carbohydrate oxidation. In fact, we foundthat etomoxir-sensitive respiration (that is, fatty acid oxidation) wasprofoundly increased by either inhibition or genetic deletion of MPCfunction (Fig. 5f).
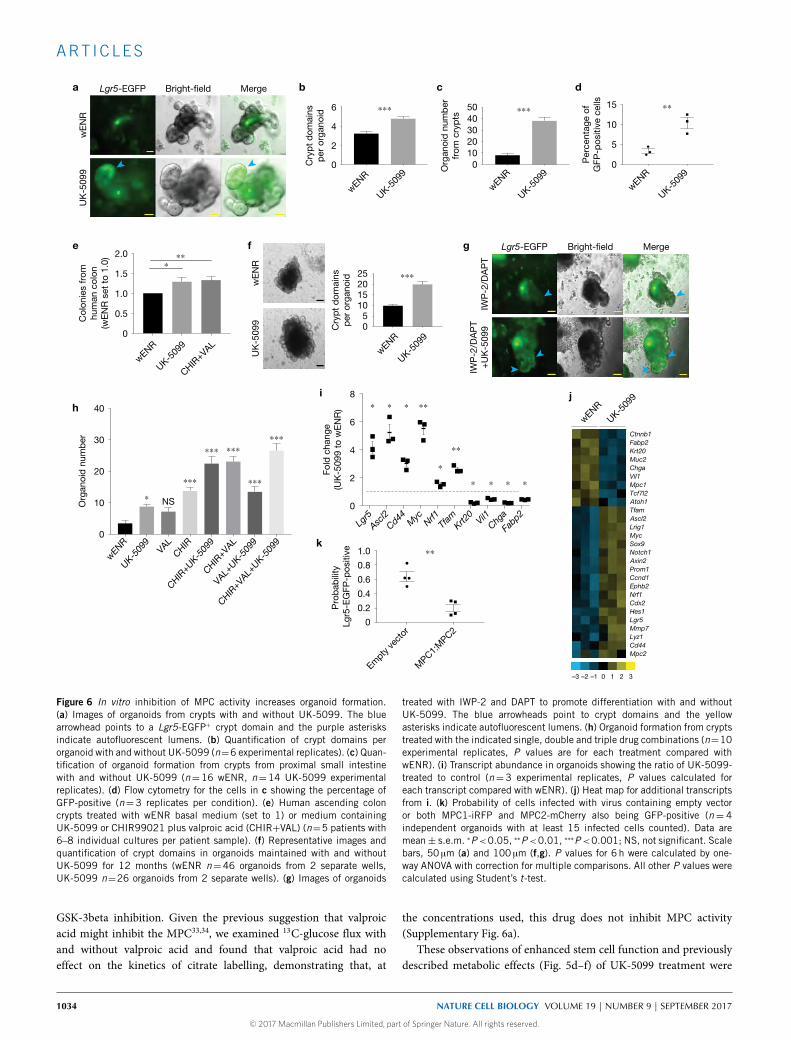
In vitro inhibition of MPC activity increases organoid formationIn addition to genetically MPC-deficient organoids, we next utilizedthe MPC inhibitor UK-5099 to examine the effects of acute MPC loss.Similar to Mpc1Lgr5-KO organoids, we found that treatment of crypt-derived organoids with UK-5099 led to enhanced maintenance ofEGFP expression in the epithelial lining (Fig. 6a) and a larger numberof crypt-like branches per organoid, indicative of increased stem cellactivity (Fig. 6b and Supplementary Table 7). We also observed thatUK-5099 treatment caused an approximately fourfold increase in theefficiency of organoid formation fromproximal small intestine (Fig. 6cand Supplementary Table 7).When treated organoids were dissociated
1032
© 2017 Macmillan Publishers Limited, part of Springer Nature. All rights reserved.
NATURE CELL BIOLOGY VOLUME 19 | NUMBER 9 | SEPTEMBER 2017
ART ICLES
Villi
H3k4
H3k9
H3k27
Total H3
MPC1 (cytosol)
a
0 20 40 60 800
100
200
300
400
500
OC
R (p
mol
min
–1) Control
Control + UK-5099
Time (min)
0
10
20
30
40
Met
abol
iteab
und
ance
Pyruvate∗
Citrate∗∗∗
MPC2
α-tubulin
MPC1
LGR5
β-catenin
0 50 100 150 20040
60
80
100
120
min
Per
cent
age
ofM
+0
citr
ate
lab
el
ControlControl + UK-5099
Mpc1Lgr5-KO
Mpc1Lgr5-KO + UK-5099
ControlControl + UK-5099
Mpc1Lgr5-KO
Mpc1Lgr5-KO + UK-5099
50 100 150 200–505
10152025
min
Per
cent
age
ofM
+2
citr
ate
lab
el
Mr (K) Mr (K)
100100
15
10
50
15
15
–500
0
500
1,000
1,500
Eto
mox
ir-se
nsiti
vere
spira
tion
OC
R(p
mol
min
–1 μ
g–1 p
rote
in)
UK-5099Palmitate
+ +++ ++
– –
∗∗∗
15
15
15
15
Crypt
Mar
ker
Contro
l 1
Mpc1
Lgr5
-KO 1
Contro
l
Mpc1
Lgr5
-KO
Contro
l
Mpc1
Lgr5
-KO
0
10
20
30
40
Met
abol
iteab
und
ance
Contro
l
Mpc1
Lgr5
-KO
Contro
l 2
Mpc1
Lgr5
-KO 2
Oligom
ycin
FCCP Rot
enon
e
Antim
ycin
A
Mpc1Lgr5-KO
Mpc1Lgr5-KO + UK-5099
Control Mpc1Lgr5-KO
d
e
f
b c
Figure 5 In vitro loss of the MPC alters protein expression and metabolism.(a) Immunoblot of replicate control and Mpc1Lgr5-KO organoid cultureswith villi and crypt extract as negative and positive controls respec-tively. (b) Immunoblot on isolated nuclei from control and Mpc1Lgr5-KO
organoids for acetyl histone 3 marks. (c) Steady-state abundance of cit-rate and pyruvate in control and Mpc1Lgr5-KO organoids (n = 6 experi-mental replicates). (d) Flux metabolic labelling of citrate (M+0 on top,M+2 on bottom) at the indicated times following U-13C-glucose addi-tion in control and Mpc1Lgr5-KO organoids with and without UK-5099
treatment (n=1 for 0 h per condition and n = 3 for each additionaltime point). (e) Oxygen consumption rate (OCR) of control and Mpc1 KOorganoids with and without UK-5099 utilizing glucose for respiration (n=8experimental replicates). (f) Etomoxir-sensitive oxygen consumption of controland Mpc1Lgr5-KO organoids with and without UK-5099 treatment utilizingpalmitate for respiration (n=3 experimental replicates). Data are mean ±s.e.m. ∗P<0.05, ∗∗∗P < 0.001. All P values were calculated using Stu-dent’s t-test. Unprocessed original scans of western blots are shown inSupplementary Fig. 7.
and assessed by flow, UK-5099 treatment significantly increased thepercentage of GFP-positive cells (Fig. 6d and Supplementary Table 7).MPC inhibition enhanced organoid formation from all regions ofthe small intestine and from the colon to a degree similar to thatof the canonical organoid-maintaining condition containing valproicacid and CHIR99021 (Supplementary Fig. 5a). We also observed thathuman colon organoid colony formation and growthwas promoted byUK-5099 treatment (Fig. 6e and Supplementary Table 7).
Interestingly, organoids could be maintained for at least oneyear of continuous UK-5099 treatment and they continued todisplay an increase in crypt domains per organoid (Fig. 6f). Theaddition of UK-5099 also improved passaging efficiency of earlycrypts (Supplementary Fig. 5b). When organoids were transferredto differentiation conditions, treatment with UK-5099 resultedin maintenance of Lgr5-EGFP expression in the crypt domains(Fig. 6g). Similarly, when removing stem-cell-maintaining factors and
allowing passive differentiation, UK-5099 delayed the emergence ofhighly autofluorescent organoid lumens, suggesting fewer or loweractivity of differentiated secretory cells (Supplementary Fig. 5c).We also examined the effect of MPC inhibition in comparisonand combination with the HDAC inhibitor valproic acid and/orthe GSK-3beta inhibitor CHIR99021, both of which promote stemcell maintenance independent of the Paneth cell niche32. UK-5099and valproic acid caused a similar increase in organoid formationfrom crypts relative to controls, and resulted in a similar additiveeffect when combined with CHIR99021 (Fig. 6h and SupplementaryTable 7) with each drug being used at its optimal concentration(Supplementary Fig. 5d). TheGSK-3beta inhibitor had stronger effectsthan either of the other two drugs alone and was also additivewith all other combinations. We conclude that MPC inhibitionhas profound effects on stem cell maintenance that are at leastpartially mechanistically distinct from those caused by HDAC or
NATURE CELL BIOLOGY VOLUME 19 | NUMBER 9 | SEPTEMBER 2017
© 2017 Macmillan Publishers Limited, part of Springer Nature. All rights reserved.
1033
ART ICLES
UK
-509
9w
EN
RLgr5-EGFP Bright-field Merge
∗
∗ ∗
∗
wENR
UK-509
90
1020304050
Org
anoi
d n
umb
erfr
om c
ryp
ts
∗∗∗
wENR
UK-509
90
2
4
6
Cry
pt
dom
ains
per
org
anoi
d ∗∗∗
Lgr5-EGFP Bright-field Merge
IWP
-2/D
AP
T+
UK
-509
9IW
P-2
/DA
PT
∗
∗ ∗
∗
wENR
UK-509
9VA
LCHIR
CHIR+U
K-509
9
CHIR+V
AL
VAL+
UK-509
9
CHIR+V
AL+UK-5
099
0
10
20
30
40
Org
anoi
d n
umb
er
∗ NS
∗∗∗
∗∗∗ ∗∗∗
∗∗∗
∗∗∗
3210–1–2–3
Ctnnb1Fabp2Krt20Muc2ChgaVil1Mpc1Tcf7l2Atoh1TfamAscl2Lrig1MycSox9Notch1Axin2Prom1Ccnd1Ephb2Nrf1Cdx2Hes1Lgr5Mmp7Lyz1Cd44Mpc2
wENR
UK-509
9
a
wE
NR
UK
-509
9 05
10152025
Cry
pt
dom
ains
per
org
anoi
d ∗∗∗
0
0.5
1.0
1.5
2.0
Col
onie
s fr
omhu
man
col
on(w
EN
R s
et t
o 1.
0) ∗∗∗
wENR
UK-509
90
5
10
15
Per
cent
age
ofG
FP-p
ositi
ve c
ells
∗∗
Empty
vect
or
MPC1:
MPC2
0
0.2
0.4
0.6
0.8
1.0
Pro
bab
ility
Lg
r5-E
GFP
-pos
itive ∗∗
Lgr5
Ascl2
Cd44 Myc
Nrf1Tf
amKrt2
0Vil1
Chga
Fabp2
0
2
4
6
8
Fold
cha
nge
(UK
-509
9 to
wE
NR
) ∗ ∗ ∗ ∗∗
∗ ∗ ∗ ∗
∗
∗∗
b
e
hi
k
j
f g
c d
UK-509
9
wENR
UK-509
9
wENR
CHIR+VAL
Figure 6 In vitro inhibition of MPC activity increases organoid formation.(a) Images of organoids from crypts with and without UK-5099. The bluearrowhead points to a Lgr5-EGFP+ crypt domain and the purple asterisksindicate autofluorescent lumens. (b) Quantification of crypt domains perorganoid with and without UK-5099 (n=6 experimental replicates). (c) Quan-tification of organoid formation from crypts from proximal small intestinewith and without UK-5099 (n=16 wENR, n=14 UK-5099 experimentalreplicates). (d) Flow cytometry for the cells in c showing the percentage ofGFP-positive (n=3 replicates per condition). (e) Human ascending coloncrypts treated with wENR basal medium (set to 1) or medium containingUK-5099 or CHIR99021 plus valproic acid (CHIR+VAL) (n=5 patients with6–8 individual cultures per patient sample). (f) Representative images andquantification of crypt domains in organoids maintained with and withoutUK-5099 for 12 months (wENR n=46 organoids from 2 separate wells,UK-5099 n=26 organoids from 2 separate wells). (g) Images of organoids
treated with IWP-2 and DAPT to promote differentiation with and withoutUK-5099. The blue arrowheads point to crypt domains and the yellowasterisks indicate autofluorescent lumens. (h) Organoid formation from cryptstreated with the indicated single, double and triple drug combinations (n=10experimental replicates, P values are for each treatment compared withwENR). (i) Transcript abundance in organoids showing the ratio of UK-5099-treated to control (n=3 experimental replicates, P values calculated foreach transcript compared with wENR). (j) Heat map for additional transcriptsfrom i. (k) Probability of cells infected with virus containing empty vectoror both MPC1-iRFP and MPC2-mCherry also being GFP-positive (n= 4independent organoids with at least 15 infected cells counted). Data aremean± s.e.m. ∗P<0.05, ∗∗P<0.01, ∗∗∗P<0.001; NS, not significant. Scalebars, 50 µm (a) and 100 µm (f,g). P values for 6 h were calculated by one-way ANOVA with correction for multiple comparisons. All other P values werecalculated using Student’s t-test.
GSK-3beta inhibition. Given the previous suggestion that valproicacid might inhibit the MPC33,34, we examined 13C-glucose flux withand without valproic acid and found that valproic acid had noeffect on the kinetics of citrate labelling, demonstrating that, at
the concentrations used, this drug does not inhibit MPC activity(Supplementary Fig. 6a).
These observations of enhanced stem cell function and previouslydescribed metabolic effects (Fig. 5d–f) of UK-5099 treatment were
1034
© 2017 Macmillan Publishers Limited, part of Springer Nature. All rights reserved.
NATURE CELL BIOLOGY VOLUME 19 | NUMBER 9 | SEPTEMBER 2017

ART ICLES
accompanied by changes in the expression of molecular markers ofstemness. UK-5099 treatment in mixed organoid populations led toa robust increase in several stem cell markers, including Lgr5, Ascl2,Cd44 and Myc, along with a substantial decrease in the abundance ofthe Krt20, Villin1, Chga and Fabp2 differentiation markers (Fig. 6i,jand Supplementary Table 4). These data demonstrate that loss ofmitochondrial pyruvate import leads to enhanced maintenance ofmolecular and functional markers of ISCs (and decreased markersof differentiation) to a degree similar to well-described stem-cell-maintaining agents.
Finally, we performed the converse of prior experiments and testedthe hypothesis that forced expression of Mpc1 and Mpc2 in LGR5+
ISCs causes a loss of stemness. Indeed, using a previously validated sys-tem for overexpression14, we found that those cells expressing exoge-nousMpc1 andMpc2, which are both required forMPC function, weremuch less likely to maintain Lgr5 expression, as indicated by EGFPfluorescence (Fig. 6k and Supplementary Fig. 6b and SupplementaryTable 7). This is consistent with work suggesting that stimulatingglucose oxidation with the small molecule dichloroacetate (DCA) orby substitution of glucose with galactose promotes differentiation10.
DISCUSSIONOur studies in Drosophila, intestinal organoids and mice providestrong evidence that the MPC is necessary and sufficient in a cellautonomous manner to suppress stem cell proliferation. Consistentwith this, we have demonstrated that ISCs maintain low expressionof the subunits that comprise the MPC, which enforces a modeof carbohydrate metabolism wherein glucose is metabolized inthe cytosol to pyruvate and other biosynthetic intermediates. Thisglycolytic metabolic program appears to be sufficient to drive robustand continuous stem cell proliferation35. We also observed highmitochondrial content in ISCs, which must be geared primarilytoward biosynthetic functions and/or oxidation of other substratessuch as fatty acids. Increased fatty acids, the metabolism of which isenhanced in MPC-deficient andMPC-inhibited organoids, have beenshown to promote ISC expansion and proliferation via enhanced beta-catenin signalling and increasing tumour-initiating capacity36. MPCexpression increases following differentiation, consistent with the shiftin demand from macromolecule biosynthesis to ATP productionin support of post-mitotic differentiated cell function. A similarswitch in MPC expression can be seen following differentiation ofembryonic stem cells, haematopoietic stem cells and trophoblast stemcells37–41. Conversely,MPCexpression is reduced after reprogrammingfibroblasts to induced pluripotent stem cells42–45. This suggests that theeffects of altering pyruvate flux that we observe herein might not berestricted to ISCs, but instead be representative of similar effects onmultiple stem cell populations (see also the accompanyingmanuscripton hair follicle stem cells46). Interestingly, Myc is known to drive ametabolic program that is similar to that observed followingMPC loss,characterized by increased glycolysis and reliance on glutamine andfatty acid oxidation with reduced glucose oxidation47–49. This suggeststhat Myc may play a role in repressing the MPC in stem cells, possiblyacting downstream of Wnt/beta-catenin signalling50. Consistent withthis, Myc and its repressive co-factors localize to the Mpc1 promoterand Myc expression is strongly anti-correlated with Mpc1 expression(Supplementary Fig. 6c)14,51–54.
Taken together, our studies demonstrate that changes in the MPCand mitochondrial pyruvate metabolism are required to properlyorchestrate the proliferation and homeostasis of intestinal stem cells.Importantly, this metabolic program—mediated at least partially bythe MPC—appears to be instructive for, rather than a downstreamconsequence of, cell fate. Future work will define the extent to whichthe results presented herein relate to those showing that diet qualityand quantity can modulate ISC behaviour. It is tempting to speculatethat ISC metabolism is used as a signal for increased or decreaseddemand for intestinal epithelium. Perhaps of most importance willbe to define the mechanisms whereby altered partitioning of pyruvatemetabolism affects stem cell proliferation and fate. We speculate thatthe robust changes that we observed in fatty acid oxidation and histoneacetylation, which are probably downstream of altered metaboliteutilization for acetyl-CoA production, play an important role36,55–57.While the mechanisms are not as yet defined, these studies establish aparadigmwhereinmitochondrialmetabolismdoes notmerely providea permissive context for proliferation or differentiation, but ratherplays a direct and instructive role in controlling stem cell fate. �
METHODSMethods, including statements of data availability and any associatedaccession codes and references, are available in the online version ofthis paper.
Note: Supplementary Information is available in the online version of the paper
ACKNOWLEDGEMENTSWe thank B. Edgar (University of Utah, USA) for stocks and reagents, C. Micchelli(Washington University School of Medicine, USA) for providing the Notch RNAiline, K. Beebe for helpful advice and comments on the Drosophila intestinal studies,G. Lam for establishing the Drosophila MPC overexpression strain, O. Yilmazand D. Sabatini for assistance and insight into intestinal stem cell metabolism,D. Tantin for critiques and comments, members of the Rutter laboratory forassistance and advice, J. O’Shea, R. Orbus and C. DeHeer for assistance withNanoString, W. Swiatek for mouse assistance, ARUP Institute for Clinical andExperimental Pathology, and S. R. Tripp and E. Hammond for histology; L. Nikolovaat the University of Utah Electron Microscopy Core Laboratory performed electronmicroscopy; mass spectrometry analysis was performed at the Mass Spectrometryand Proteomics Core Facility at the University of Utah. Mass spectrometryequipment was obtained through NCRR Shared Instrumentation Grant no. 1 S10RR020883-01, 1 S10 RR025532-01A1, NIH 1 S10OD021505-01 (J.E.C.) and theDiabetes andMetabolismCenter at theUniversity ofUtah. This studywas conductedwith support from the Biorepository and Molecular Pathology Shared Resourcesupported by the Cancer Center Support Grant awarded to the Huntsman CancerInstitute by the National Cancer Institute of the National Institutes of Health.Nanostring transcript analysis utilized the Molecular Diagnostics Section of theBiorepository and Molecular Pathology Shared Resource and was supported bythe National Cancer Institute of the National Institutes of Health under AwardNumber P30CA042014 (the content is solely the responsibility of the authors anddoes not necessarily represent the official views of the NIH). J. Marvin at theUniversity of Utah Flow Cytometry Facility carried out flow sorting (NationalCancer Institute through Award Number 5P30CA042014-24, National Center forResearch Resources of the National Institutes of Health under Award Number1S10RR026802-01). Fundingwas also provided byHHMI (J.R.), Treadwell (J.R.) andRO1GM094232 (to J.R. and C.S.T.). J.C.S. was supported by an NIH DevelopmentalBiology Training Grant (5T32 HD07491) and a University of Utah GraduateResearch Fellowship. D.R.W. was supported by a University of Utah GraduateResearch Fellowship.
AUTHOR CONTRIBUTIONSConceptualization, J.C.S., D.R.W., C.S.T. and J.R.; methodology, J.C.S., D.R.W., C.B.,H.Z., P.W., J.T., A.F., J.M., L.K.S., C.S.E., K.A.O., D.D., P.K., M.P.B., D.Y.L., J.E.C.,H.R.C., W.E.L., C.S.T. and J.R.; investigation, J.C.S., D.R.W., C.B., H.Z., P.W., J.T.,A.F., J.M., L.K.S., C.S.E., R.M., D.D. and P.K.; formal analysis, J.C.S., D.R.W., C.B.,P.W., T.C.W., R.M., L.J., R.J.D. and J.E.C.; writing—original draft, review and editing,
NATURE CELL BIOLOGY VOLUME 19 | NUMBER 9 | SEPTEMBER 2017
© 2017 Macmillan Publishers Limited, part of Springer Nature. All rights reserved.
1035
ART ICLES
J.C.S., D.R.W., C.S.T. and J.R.; funding acquisition, C.S.T. and J.R.; resources, D.Y.L.,J.C., C.S.T. and J.R.; supervision, C.S.T. and J.R.
COMPETING FINANCIAL INTERESTSThe authors declare no competing financial interests.
Published online at http://dx.doi.org/10.1038/ncb3593Reprints and permissions information is available online at www.nature.com/reprintsPublisher’s note: Springer Nature remains neutral with regard to jurisdictional claimsin published maps and institutional affiliations.
1. Warburg, O. On respiratory impairment in cancer cells. Science 124,269–270 (1956).
2. Birsoy, K. et al. An essential role of the mitochondrial electron transport chain in cellproliferation is to enable aspartate synthesis. Cell 162, 540–551 (2015).
3. Sullivan, L. B. et al. Supporting aspartate biosynthesis is an essential function ofrespiration in proliferating cells. Cell 162, 552–563 (2015).
4. Flavell, R. B. Mitochondrion as a multifunctional organelle. Nature 230,504–506 (1971).
5. Martínez-Reyes, I. et al. TCA cycle and mitochondrial membrane potential arenecessary for diverse biological functions. Mol. Cell 61, 199–209 (2016).
6. Simsek, T. et al. The distinct metabolic profile of hematopoietic stem cells reflectstheir location in a hypoxic niche. Cell Stem Cell 7, 380–390 (2010).
7. Ito, K. & Suda, T. Metabolic requirements for the maintenance of self-renewing stemcells. Nat. Rev. Mol. Cell Biol. 15, 243–256 (2014).
8. Stringari, C. et al. Metabolic trajectory of cellular differentiation in small intestine byPhasor Fluorescence Lifetime Microscopy of NADH. Sci. Rep. 2, 568 (2012).
9. Fan, Y.-Y. et al. A bioassay to measure energy metabolism in mouse colonic crypts,organoids, and sorted stem cells. Am. J. Physiol. Gastrointest. Liver Physiol. 309,G1–G9 (2015).
10. Rodríguez-Colman, M. J. et al. Interplay between metabolic identities in theintestinal crypt supports stem cell function. Nature 543, 424–427 (2017).
11. Berger, E. et al. Mitochondrial function controls intestinal epithelial stemness andproliferation. Nat. Commun. 7, 13171 (2016).
12. Bricker, D. K. et al. A mitochondrial pyruvate carrier required for pyruvate uptake inyeast, Drosophila, and humans. Science 337, 96–100 (2012).
13. Herzig, S. et al. Identification and functional expression of the mitochondrial pyruvatecarrier. Science 337, 93–96 (2012).
14. Schell, J. C. et al. A role for the mitochondrial pyruvate carrier as a repressor of theWarburg effect and colon cancer cell growth. Mol. Cell 56, 400–413 (2014).
15. Sato, T. et al. Single Lgr5 stem cells build crypt-villus structures in vitro without amesenchymal niche. Nature 459, 262–265 (2009).
16. Sato, T. & Clevers, H. Primary mouse small intestinal epithelial cell cultures.MethodsMol. Biol. 945, 319–328 (2013).
17. Uhlen, M. et al. Towards a knowledge-based Human Protein Atlas. Nat. Biotechnol.28, 1248–1250 (2010).
18. Uhlen, M., Pontén, F. & Lindskog, C. Charting the human proteome: understandingdisease using a tissue-based atlas. Science 347, 1274–1274 (2015).
19. Jiang, H. & Edgar, B. A. Intestinal stem cell function in Drosophila and mice.Curr. Opin. Genet. Dev. 22, 354–360 (2012).
20. Li, H. & Jasper, H. Gastrointestinal stem cells in health and disease: from flies tohumans. Dis. Model Mech. 9, 487–499 (2016).
21. Dutta, D. et al. Regional cell-specific transcriptome mapping reveals regulatorycomplexity in the adult Drosophila midgut. Cell Rep. 12, 346–358 (2015).
22. Buchon, N. et al. Morphological and molecular characterization of adult midgutcompartmentalization in Drosophila. Cell Rep. 3, 1725–1738 (2013).
23. Wu, J. S. & Luo, L. A protocol for mosaic analysis with a repressible cell marker(MARCM) in Drosophila. Nat. Protoc. 1, 2583–2589 (2006).
24. Micchelli, C. A. & Perrimon, N. Evidence that stem cells reside in the adultDrosophila midgut epithelium. Nature 439, 475–479 (2006).
25. Ohlstein, B. & Spradling, A. The adult Drosophila posterior midgut is maintained bypluripotent stem cells. Nature 439, 470–474 (2006).
26. Li, H. et al. Drosophila larvae synthesize the putative oncometabolite L-2-hydroxyglutarate during normal developmental growth. Proc. Natl Acad. Sci. USA114, 1353–1358 (2017).
27. Micchelli, C. A. Whole-mount immunostaining of the adult Drosophila gastro-intestinal tract. Methods 68, 273–279 (2014).
28. Vigueira, P. A. et al. Mitochondrial pyruvate carrier 2 hypomorphism in mice leads todefects in glucose-stimulated insulin secretion. Cell Rep. 7, 2042–2053 (2014).
29. Vacanti, N. M. et al. Regulation of substrate utilization by the mitochondrial pyruvatecarrier. Mol. Cell 56, 425–435 (2014).
30. Bender, T., Pena, G. & Martinou, J.-C. Regulation of mitochondrial pyruvate uptakeby alternative pyruvate carrier complexes. EMBO J. 34, 911–924 (2015).
31. Yang, C. et al. Glutamine oxidation maintains the TCA cycle and cell survival duringimpaired mitochondrial pyruvate transport. Mol. Cell 56, 414–424 (2014).
32. Yin, X. et al. Niche-independent high-purity cultures of Lgr5+ intestinal stem cellsand their progeny. Nat. Methods 11, 106–112 (2014).
33. Aires, C. C. P. et al. Pyruvate uptake is inhibited by valproic acid and metabolites inmitochondrial membranes. FEBS Lett. 582, 3359–3366 (2008).
34. Benavides, J., Martin, A., Ugarte, M. & Valdivieso, F. Inhibition by valproicacid of pyruvate uptake by brain mitochondria. Biochem. Pharmacol. 31,1633–1636 (1982).
35. Dailey, M. J. Nutrient-induced intestinal adaption and its effect in obesity. Physiol.Behav. 136, 74–78 (2014).
36. Beyaz, S. et al. High-fat diet enhances stemness and tumorigenicity of intestinalprogenitors. Nature 531, 53–58 (2016).
37. Cao, F. et al. Transcriptional and functional profiling of human embryonic stem cell-derived cardiomyocytes. PLoS ONE 3, e3474 (2008).
38. Chen, B.-Z. et al. Identification of microRNAs expressed highly in pancreatic islet-like cell clusters differentiated from human embryonic stem cells. Cell Biol. Int. 35,29–37 (2011).
39. Ralston, A. et al. Gata3 regulates trophoblast development downstream of Tead4 andin parallel to Cdx2. Development 137, 395–403 (2010).
40. Muntean, A. G. et al. The PAF complex synergizes with MLL fusion proteins at HOXloci to promote leukemogenesis. Cancer Cell 17, 609–621 (2010).
41. Keller, M. A. et al. Transcriptional regulatory network analysis of developing humanerythroid progenitors reveals patterns of coregulation and potential transcriptionalregulators. Physiol. Genomics 28, 114–128 (2006).
42. Tateno, H. et al. Glycome diagnosis of human induced pluripotent stem cells usinglectin microarray. J. Biol. Chem. 286, 20345–20353 (2011).
43. Nishino, K. et al. DNA methylation dynamics in human induced pluripotent stemcells over time. PLoS Genet. 7, e1002085 (2011).
44. Saito, S. et al. Possible linkages between the inner and outer cellular states of humaninduced pluripotent stem cells. BMC Syst. Biol. 5 (Suppl. 1), S17 (2011).
45. Wang, X.-M. et al. The gene expression profiles of induced pluripotent stemcells from individuals with childhood cerebral adrenoleukodystrophy areconsistent with proposed mechanisms of pathogenesis. Stem Cell Res. Ther. 3,39 (2012).
46. Flores, A. et al. Lactate dehydrogenase activity drives hair follicle stem cell activation.Nat. Cell Biol. http://dx.doi.org/10.1038/ncb3575 (2017).
47. Camarda, R. et al. Inhibition of fatty acid oxidation as a therapy for MYC-overexpressing triple-negative breast cancer. Nat. Med. 22, 427–432 (2016).
48. Boroughs, L. K. & DeBerardinis, R. J. Metabolic pathways promoting cancer cellsurvival and growth. Nat. Cell Biol. 17, 351–359 (2015).
49. Edmunds, L. R. et al. c-Myc programs fatty acid metabolism and dictates acetyl-CoAabundance and fate. J. Biol. Chem. 289, 25382–25392 (2014).
50. Pate, K. T. et al. Wnt signaling directs a metabolic program of glycolysis andangiogenesis in colon cancer. EMBO J. 33, 1454–1473 (2014).
51. Gerstein, M. B. et al. Architecture of the human regulatory network derived fromENCODE data. Nature 489, 91–100 (2012).
52. Wang, J. et al. Factorbook.org: a Wiki-based database for transcription factor-binding data generated by the ENCODE consortium. Nucleic Acids Res. 41,D171–D176 (2013).
53. Wang, J. et al. Sequence features and chromatin structure around thegenomic regions bound by 119 human transcription factors. Genome Res. 22,1798–1812 (2012).
54. Karolchik, D. et al. The UCSC Genome Browser database: 2014 update. NucleicAcids Res. 42, D764–D770 (2014).
55. McCool, K. W., Xu, X., Singer, D. B., Murdoch, F. E. & Fritsch, M. K. The role ofhistone acetylation in regulating early gene expression patterns during earlyembryonic stem cell differentiation. J. Biol. Chem. 282, 6696–6706 (2007).
56. Roostaee, A., Benoit, Y. D., Boudjadi, S. & Beaulieu, J.-F. Epigenetics in intestinalepithelial cell renewal. J. Cell. Physiol. 231, 2361–2367 (2016).
57. Golob, J. L., Paige, S. L., Muskheli, V., Pabon, L. & Murry, C. E. Chromatinremodeling during mouse and human embryonic stem cell differentiation. Dev. Dyn.237, 1389–1398 (2008).
1036
© 2017 Macmillan Publishers Limited, part of Springer Nature. All rights reserved.
NATURE CELL BIOLOGY VOLUME 19 | NUMBER 9 | SEPTEMBER 2017
DOI: 10.1038/ncb3593 METHODS
METHODSMice. Heterozygous Lgr5-EGFP-IRES-CreERT2 mice were obtained from JacksonLabs58. MPC1 fl/fl mice were generated as previously described59. Control animalsconsisted of Lgr5-EGFP-IRES-CreERT2 × MPC1 WT/WT or MPC1 fl/fl micenegative for Lgr5-EGFP-IRES-CreERT2. For in vivo knockout 6- to 8-week-old micewere injected intraperitoneally with 100 µl of 20mgml−1 tamoxifen (Sigma AldrichT5648) dissolved in peanut oil (Sigma Aldrich P2144) for three successive days andeuthanized 8, 30 or 160 days later. BrdU (Invitrogen b23151) was dissolved in PBSto 10mgml−1 and 100 µl was injected intraperitoneally 4 h before euthanization tolabel dividing cells. Injections were carried out in the morning (between 7:00 and11:00) and tissue was collected 4 h later ±10min from the time of injection. A2 cm section was used for crypt dissociation and organoid formation as describedbelow. The remainder of the small intestine was divided and fixed in buffered 10%formalin (Fisher Scientific 23-245-685) as previously described60 for 48 h, transferredto 70% ethanol and paraffin-embedded for sectioning and staining. No formalrandomization was performed for animal studies, animals were used as they becameavailable, paired with littermate controls where possible, there was no preferencefor male or female animals, and both genders were included in each analysis. AllIACUC guidelines were followed and the protocol for animal experiments carriedout in this study was submitted to the University of Utah Institutional Animal Careand Use Committee.
Drosophila stocks. Drosophila stocks were maintained on standard food containing3% sucrose, 6% glucose, 8% yeast and 1% agar in a 25 ◦C incubator. FordMPC1 genetic studies, control flies were homozygous for a precise excisionof the P(XP)CG14290[d00809] P-element insertion, and mutant flies were trans-heterozygous for the two deletion alleles, dMPC11 and dMPC12, as describedpreviously12.Dl-GAL4 (a gift from B. Edgar) was used to target RNAi to the ISCs andesg-GAL4 (a gift fromB. Edgar) was used to target RNAi to the ISCs and enteroblasts.RNAi transgenic stocks are as follows:UAS-dMPC1RNAi andUAS-dMPC2-RNAi12,UAS-PDH-E1 (VDRC101856),UAS-PDH-E2 (VDRC102893) andUAS-Notch-RNAi(a gift fromC.Micchelli). Temperature-sensitiveTub-GAL80tswas utilized to restrictRNAi to adults. For temperature-shift experiments, animals were raised at 18 ◦Cand 4–5-day-old adults were transferred to 29 ◦C for five days after which intestineswere dissected for analysis. Pseudomonas infections were performed as describedpreviously27. The Pseudomonas strain was a gift from B. Edgar. Overexpression oftheMPC was achieved by inserting the open reading frames for dMPC1 and dMPC2downstream from the UAS promoter in the pUAST-attB vector, with the codingsequence for the P2A peptide joining the two MPC coding regions61. This wasinserted into the attP40 site on the second chromosome using standard methods,and expression was achieved using GAL4 drivers specific to the ISCs or progenitorcells. AllDrosophila studies were performed following standard ethical guidelines forworking with this organism. As is standard in studies of Drosophila intestinal stemcells, all experiments were performed in females, which have a higher rate of basalstem cell proliferation than males. Experiments were conducted in adults aged fourdays to three weeks after eclosion.
Mosaic analysis. The MARCM system was used to generate wild-type and dMPC1mutant lineages as previously described23. Four- to five-day-old adult female flies ofthe following genotypes were subjected to two 38 ◦C heat pulses for 30–40min: y,w, hs-FLP, UAS-GFP / w ; +; Tub-GAL4, FRT82B, Tub-Gal80 / FRT82B (control),y, w, hs-FLP, UAS-GFP / w ; +; Tub-GAL4, FRT82B, Tub-Gal80 / FRT82B dMPC11(mutant). Clones were analysed three weeks after induction. The number of nucleiin GFP-expressing clones was used for quantification. For the dMPC1 MARCMstudies in the presence of Notch RNAi, intestines were analysed five days after cloneinduction. Intestines were stained with antibodies to detect GFP and Prospero,with DAPI to mark nuclei. Animals of the following genotype were used: y, w,hs-FLP, UAS-GFP / w ; UAS-Notch-RNAi ; Tub-GAL4, FRT82B, Tub-GAL80 / FRT82B(control,NotchRNAi only), y, w, hs-FLP,UAS-GFP / w; UAS-Notch-RNAi; Tub-GAL4,FRT82B, Tub-GAL80 / FRT82B dMPC11 (Notch RNAi and dMPC1 mutant clones).Only clones that were negative for enteroendocrine cells (Prospero negative) andenterocytes (larger nuclei) were included in the analysis.
Histology and immunostaining. Adult flies were dissected in 1×PBS and thegastrointestinal tract was fixed in 4% formaldehyde (Polysciences, EM grade)overnight at 4 ◦C. Tissues were washed four times with 0.1% Triton, 1×PBS(PBST) and incubated with PBST and primary antibodies overnight, washed again,and then incubated for 3–4 h with secondary antibodies in PBST. Samples weremounted using Vectashield (Vector) with DAPI. Antibody information is providedin Supplementary Table 5. Images were acquired using anOlympus FV1000 confocalmicroscope and assembled into Z stack projections for the figures. For the RNAiexperiments, GFP-positive cells were quantified per×40 frame in themid-R2 regionof the intestine. For the number of dividing cells, the average number of PHH3-positive cells for the entire midgut was reported.
Crypt and single-cell isolation. Small intestinal crypts and single GFP-positive cellswere isolated as previously described15. The entire small intestine was harvested,opened longitudinally and washed with PBS. Mucus and villi were scraped anddiscarded using a thin glass coverslip and tissue was cut into small (approximately2 cm) sections. These were washed again in PBS and incubated in 2.5mM EDTAdiluted in PBS for 1 h with gentle agitation at 4 ◦C. Crypts were liberated andcollected by centrifugation (400g for 5min at 4 ◦C) followed by washing withPBS to remove EDTA. Crypts in PBS were passed through a 70-µm cell strainerand centrifuged as before. This pellet was resuspended in 50% culture medium(described below) and 50% Corning Growth Factor-Reduced Matrigel (FisherScientific no. 356231) for culture or dissociated for single cells. Single-cell isolationwas carried out as described previously62 by resuspending crypts in TrypLE Express(Invitrogen no. 1260413) withDNase I (Gold Biotechnology no. D-300-1) for 10minat 37 ◦C. Dissociated cells were washed in culture medium without growth factors,centrifuged at 700g , resuspended and passed through a 35-µm strainer (FisherScientific no. 08-771-23) and analysed by FACS. Negative staining was carried outwith DAPI and single live cells were collected, pelleted and snap-frozen for analysisor resuspended for culture.
Culture of crypts and single cells. Crypts or single cells were maintained aspreviously described15 with minimal modification. For regional specific assaysof organoid formation the intestine was divided up as follows: the duodenumwas classified as the first 4–5 cm, jejunum was classified as the proximal half,and ileum the distal half. The entire colon, excluding the caecum and rectumwere pooled and crypts isolated. Medium consisted of advanced DMEM/F12(Invitrogen no. 12634028) medium prepared with HEPES (Invitrogen no. 15630-080), Glutamax (Invitrogen no. 35050061), and Penicillin–Streptomycin (Invitrogenno. 15140122) with N-2 supplement (Invitrogen no. 17502048), B27 serum-freesupplement (Invitrogen no. 17504044) N -acetyl-L-cysteine (1mM) containing allgrowth factors (Wnt3A to final concentration 2.5 ngml−1: Peprotech no. 315-20,Noggin to final concentration 100 ngml−1: Peprotech no. 250-38, EGF to finalconcentration 50 ngml−1: Gold Biotechnology no. 1350-04-500, mRSPO1-Fc-conditioned medium from 293T cells provided by C. Kuo at Stanford University,USA, as previously described63) and 50% Matrigel (Fisher Scientific no. 356321).Crypts were resuspended in medium and Matrigel was spotted in the centre ofwells in a 48-well plate and allowed to polymerize at 37 ◦C prior to overlayingwith medium. Inhibitors CHIR99021 (3 µM, R & D Systems no. 4423), valproicacid (1mM made fresh each day, R & D Systems no. 28-151-100) and UK-5099(10 µM, R & D Systems no. 4186) used to compare organoid formation from cryptswere added to the crypt Matrigel mixture as well as to the medium overlay andchanged every 2–3 days. These drug concentrations were identified as standard fromprevious studies (CHIR99021: 3 µM, valproic Acid: 1mM, and UK-5099 10 µM) butwere titrated for efficacy at dosages of 0.5×, 1.0×, 3.0× and 9.0×. Total organoidnumber and number of crypt domains per organoid were counted after 9 days. Forsingle cells, CHIR99021 and valproic acid were added to maintain Lgr5 stem cellsas previously described32 along with Rho kinase inhibitor Y-27613 (10 µM FisherScientific no. 125410), Jagged-1 (1 µMAnaSpec, Inc no. AS-61298).
Organoid knockout. Single Lgr5-EGFP-positive cells from MPC1 fl/fl × Lgr5-EGFP-IRES-CreERT2 were sorted and plated as above. Control genetically matchedsamples received dimethylsulfoxide and genetic recombination was induced using(Z)-4-hydroxytamoxifen (200 nM, Fisher Scientific no. 34-1210). Organoids grownfrom these were re-sorted for live EGFP-positive cells and plated as above orcollected for mRNA analysis. Prior to use of knockout organoid culture in furtherexperiments, loss of MPC1 was verified by western blot where we also looked for asignificant destabilization of MPC2. If we could still detect MPC1 protein, cultureswere retreated with (Z)-4-hydroxytamoxifen and purified by flow cytometry. Inaddition, we routinely assessed MPC1 when blotting for other targets to ensure theknockout was stable and no wild-type escaper cells repopulated the culture.
Secondary organoids.Organoids were passaged to single cells as above. Cell viabilitywas determined by exclusion of 0.2% trypan blue (Sigma Aldrich) and both cellnumber and viability counted using the Cellometer Auto T4 (Nexcelom). Organoidformation and percentage of EGFP positivity from single live cells was measuredonce mature organoids had formed (7–9 days).
Organoid differentiation. Organoids grown for differentiation were passaged tosingle cells and allowed to establish for 6–8 days in standard medium. Followingthis, medium was replaced with medium lacking Wnt3A and RSPO1-conditionedmedium (EN) lacking Wnt3A (ENR), or medium supplemented with 90 ngml−1Wnt3A (ENR +Wnt). Organoids were maintained in this medium for 48 h withfresh medium added after 24 h. To promote robust differentiation, IWP-2 (2 µMFisher Scientific no. 35-331-0) and DAPT (10 µM Fisher Scientific no. 26-341-0)were added to organoidmedium along with vehicle (dimethylsulfoxide) or UK-5099
NATURE CELL BIOLOGY
© 2017 Macmillan Publishers Limited, part of Springer Nature. All rights reserved.
METHODS DOI: 10.1038/ncb3593
(20 µM). Images were taken of live organoids to assess the loss of GFP signal. For pas-sive differentiation, crypts were plated identically and allowed to form inwENRwithCHIR and valproic acid. The medium was then changed to basal medium (wENR)treated with vehicle (dimethylsulfoxide) or UK-5099 (10 µM) and the emergence ofhyperintense autofluorescent organoid lumens was observed and quantified.
MPCoverexpression.Viral infection of Lgr5 stem cells was carried out as previouslydescribed with modifications64. Organoids were dissociated to single cells asdescribed above with TrypLE and DNase followed by resuspension, filtering andpelleting. This cell pellet was then resuspended in 2× wENR that containednicotinamide (10mM), Y-27613 (10 µM), Polybrene (10 µgml−1) and CHIR99021(3 µM). This cell suspension was added 1:1 with concentrated virus. The cell/virusmixture was incubated for 10min at 37 ◦C, spun for 30min at 200g at roomtemperature, resuspended and plated into 48-well plates and incubated in a tissueculture incubator for 4 h. After infection, cells were collected fromwells, centrifugedat 700g for 10min, washed and resuspended in fresh cold medium. This wasmixed withMatrigel as described above and spotted for organoid growth. Lentiviruswas produced as previously described65. hMPC1 was subcloned into LeGO-iG2from Addgene (no. 27341) with GFP substituted for iRFP713 from Addgene(no. 45468). hMPC2 was subcloned into LeGO-iC2 from Addgene (no. 27345)(plasmidwithoutMPC2 also used as empty vector control). Lentiviral packaging andexpression vectors were transfected into 293T with Lipofectamine 2000 (Invitrogenno. 11668019) to begin viral production. Supernatant was collected and pooled every24 h from 24–96 h. This was then spun at 1,500g for 10min to remove cell debris,passed through a 0.45 µm filter, and centrifuged in∼30ml aliquots overnight at 4 ◦Cat 14,000g to concentrate viral particles. This was then resuspended in∼500 µl HBSSand used for infection or aliquots and frozen at −80 ◦C. Organoids from single-cellinfection were then allowed to form and imaged 6–8 days later for analysis.
Immunohistochemistry. All tissue processing, staining and analysis was done ina blinded manner. Paraffin sections (3–4 µm for immunohistochemistry, 7 µm forin situ hybridization) were cut on positively charged slides (BBC), placed at 60 ◦C for30min, and placed on an automated slide stainer (BenchMark, Discovery, VentanaMedical Systems) for processing. Slides were de-paraffinized with EZ prep solution,pre-treated with Cell Conditioner 1, pH 8.5, and stained with primary antibodyfor 1 h at 37 ◦C (Supplementary Table 5). Secondary antibody (rabbit 1:100 forVDAC1 and MPC1, rat 1:100 for BrdU) was applied and detection performed usingIView DAB detection kit followed by haematoxylin counterstaining. Slides werescanned using an automated slide scanner (Zeiss Axio Scan.Z1). For analysis ofOlfm4 and Lgr5 staining, images of Swiss-rolled proximal small intestine were used.Areas with a high density of crypts in cross-section that were continuous with villiwere used for counting the number of stained cells. Multiple crypts from at leastthree different areas were counted and the average cell number was calculated permouse. At least nine control and nine knockout animals were used and imageswere unused only if staining did not work or tissue orientation in cross-sectionwas inadequate for counting. For histological analysis all small intestinal tissue wasprocessed, stained and imaged blinded. Animals were excluded from analysis iftissue orientation, staining or acquisition failed and precluded analysis and for noother reason. For analysis, images of the proximal small intestine were selected thatcontained areas with crypts in cross-section continuous with villi. Three separateareas and a minimum of ten total crypts were analysed and averaged to give avalue for that animal used for statistics. IRB for histology of human intestine: U ofUT IRB 91019.
Immunofluorescence staining of mouse small intestine. Tissue for immunofluo-rescence was prepared as follows: the jejunum from LGR5 Cre+ mice was extractedand fixed at room temperature in 4% PFA for 2.5 h. This was followed by washingin PBS and equilibrating in OCT on ice then transferred to a chilled mould thatwas frozen on dry ice and stored at −80 ◦C. From this block, 10 µm sections werecut and transferred to slides, which were cured for 30min at room temperature inthe dark. OCT mounting media was washed twice, 5min each using PBS at 37 ◦C.Sections were blocked/permeablized by treating for 1 h in a humid dark box in1×PBS+Ca+Mg, 0.1% saponin, 10% donkey serum, 3% BSA. For staining: anti-MPC1 Sigma cat. no. HPA045119 in 1×PBS + 10% normal donkey serum,+3%BSA–no saponin at 1:100, incubated in the dark overnight at 4 ◦C. The nextmorning,slides were washed twice with PBS for 2min each. Secondary antibody (1:100(10 µgml−1 donkey anti-rabbit IgG Alexa 594 conjugate) +5 µgml−1 DAPI in 1 ×PBS+3% BSA) was incubated at room temperature for 3 h. Slides were then washedtwice with PBS as above and mounted using 100mgml−1 PVP mounting medium(Tris buffer +0.02% azide + 5% DABCO + 100mgml−1 polyvinylpyrrolidone +1/25 volume glycerol) and cured for 2 h at room temperature.
Human colon crypt isolation and growth. Human colon biopsy samples fororganoid cultures were collected under IRB 00051140, Molecular markers of
sporadic hyperplastic colon polyps. Patients with a history of inflammatory boweldisease or patients with a personal or family history of familial colon cancer wereexcluded from the study. Briefly, study patients underwent screening colonoscopy aspart of their regular clinical care. Participants scheduled for colonoscopy were notrecruited for the study alone. Informed consent was obtained prior to any sedation.The study was approved by the IRB at the University of Utah and VA MedicalCenter. All samples were labelled with code numbers to protect confidentiality. Allprocedures were clinically indicated and recommended by the patients’ physicianor consultant. As per US preventative services task force (USPSTF), colon cancerscreening is recommended for subjects who are 50 years and older for detection andmanagement of colon polyps and colon cancer.
Removing colon polyps and obtaining colonic tissue is a standard procedureduring colonoscopy. The biopsy forceps used to obtain colon biopsies are 2 to 3mmin diameter. Endoscopic biopsies are commonly taken as part of regular clinicalcare to diagnose problems and evaluate suspicious tissues. The risks associated withthis are minor; patients do not feel the biopsies because the colon does not havepain receptors (just stretch receptors), and bleeding is self-limited. In all situations,minimizing any potential risk to the participants was a priority. If in the clinicaljudgement of the physician, biopsies should not be taken, they are not. In addition, iftaking biopsies will make the endoscopic procedure too long, they will not be taken.
Crypt imaging. Intestinal crypts were isolated as above and transferred to basalmedium lacking growth factors. MitoTracker Red CMXRos (Invitrogen no. M7512)was prepared according to the manufacturer’s instructions and added to suspendedcrypts in medium to a final concentration of 50 nM and incubated at 37 ◦Cfor 20min.
Organoid imaging. Live organoids were imaged on the Axio Observer Z1 imagingsystem (Carl Zeiss) fitted with a heated humidity-controlled stage (LiveCell 05-11-0032 Rev B) and analysed using Zen 2 software (Carl Zeiss). The laser intensitywas kept constant when making comparisons of organoids and adjustments forbrightness and contrast were made to the entire image equally across groupsbeing compared.
In situ hybridization. For detection of Lgr5 and Olfm4 mRNA, we designedriboprobes targeting the coding sequence to the 3′UTR region of these genes(Supplementary Table 5). Targeted probe region DNAs were amplified usingstandard PCR, with the amplicon length of about 500 bp. These DNA ampliconswere used to generate DIG-labelled riboprobes using T7 RNA polymerase. Forstaining, formalin-fixed paraffin-embedded tissue sections were de-paraffinizedwith Citrisolv, washed in 100% ethanol, and air-dried. Slides were blocked withBoehringer Blocking Reagent (Roche) and yeast tRNA at 68 ◦C for 1 h. Probes(0.5 ngml−1) were hybridized to sections at 68 ◦C overnight. After washing, sectionswere again blocked with Boehringer Blocking Reagent and 10% sheep serum atroom temperature for 1 h. Alkaline-phosphatase-labelled sheep anti-DIG antibody(Roche) was incubated with sections at 1:2,000 dilution at 4 ◦C overnight. Afterwashing, positive signals were developed using NBT/BCIP substrate (Thermo).Slides were then fixed in 10% neutral buffered formalin and mounted with aqueousmounting medium.
RNA extraction and analysis. Lgr5-GFP sorted cells were directly lysed in bufferRLT (Qiagen no. 79216) containing 2-mercaptoethanol (Sigma Aldrich no. M6250)and total lysate was assayed for transcript count as per the manufacturer’sinstructions. Total RNA was purified from organoids using the RNeasy Mini Kit(Qiagen) with 100 ng used for the assay.
mRNA analysis via NanoString. Transcript abundance was compared using theNanoString Elements platform. A custom gene set was created containing intestinalstem cell and differentiation genes including five housekeeping genes (ActB, B2m,Cltc, GusB, Rpl19, Tbp and Ywhaz). nSolver analysis software was used for dataanalysis with raw counts normalized to positive control probes and housekeepinggenes. Only samples passing quality control were used for normalization andanalysis. Data were visualized with Java Treeview and graphed using Prism 7(GraphPad). Source data for the generation of heat maps in the manuscript areprovided in Supplementary Tables 1–4. Sequences for probe design and source datafor the generation of heat maps are provided in Supplementary Table 6.
Immunoblot analysis. Biological replicate organoids from independent single-cell isolations were harvested, washed in cold PBS and snap-frozen. Pellets wereresuspended in tissue lysis buffer containing protease and phosphatase inhibitorsas previously described14. Samples were disrupted by sonication, cleared bycentrifugation at 10,000g for 5min, and protein concentration was determined byBCA assay (Thermo Scientific) and diluted to allow for loading equal volumes. Forhistone acetylation assays, organoids were collected and nuclei were purified using
© 2017 Macmillan Publishers Limited, part of Springer Nature. All rights reserved.
NATURE CELL BIOLOGY
DOI: 10.1038/ncb3593 METHODS
the NE-PERNuclear and Cytoplasmic Extraction Kit (ThermoFisher cat. no. 78835)and following all instructions. Samples were resolved by SDS–PAGE, and analysedby immunoblotting for organoid experiments and Tris-Tricine Gel for Drosophilaexperiments. Primary antibodies were obtained from Abcam or Cell SignalingTechnology: Supplementary Table 5. Corresponding secondary antibodies (rabbit:680 and mouse: 800 channel) were visualized using the Odyssey scanner (Li-Cor).
Steady-state metabolomics. For steady-state metabolite accumulation, control andknockout organoids were passaged to single cells and replated in basal mediumwithout drug (wENR). These organoids were grown for 8 days withmedium changesevery 2–3 days and approximately 12 h prior to harvest medium was refreshed. Forharvest, organoids in Matrigel were mechanically disrupted and dissolved usingice-cold 0.9% sodium chloride, spun to 5,000g for 30 s, supernatant aspirated andsamples snap-frozen with liquid nitrogen. Metabolites were extracted as previouslydescribed12. Briefly 450 µl of cold 90% methanol solution with internal standards(1 µg of d4-succinic acid) was added to each sample, vortexed briefly and sonicatedfor 3min. This was kept at −20 ◦C for 1 h, centrifuged at 20,000g for 5min at 4 ◦C,and the supernatant transferred to a new tube, and sample was dried in a speed-vac.All GC–MS analysis was performed with a Waters GCT Premier mass spectrometerfitted with an Agilent 6890 gas chromatograph and a Gerstel MPS2 autosampler.Dried samples were suspended in 40 µl of 40mgml−1 O-methoxylamine hydrochlo-ride (MOX) in pyridine and incubated for one hour at 30 ◦C. Metabolites wereidentified and their peak area was recorded using QuanLynx. These data were trans-ferred to an Excel spread sheet (Microsoft).Metabolite identity was established usinga combination of an in-house metabolite library developed using pure purchasedstandards and the commercially available NIST library.
Flux metabolic labelling and cell lines. Organoids were passaged and grown asabove. Multiple (∼30) 5 µl organoid Matrigel spots were plated into wells of a 6-well plate, overlaid with medium, and allowed to establish for approximately 1 week.Sixteen hours before beginning flux labelling, medium was changed to minimalmedium (wENRas above)with andwithoutUK-5099 (10 µM).At time 0, samplewastaken for reference and medium was removed, organoid plates washed gently withwarm PBS and changed to flux medium consisting of SILAC Advanced DMEM/F12(ThermoFisher no. A2494301) with 10mMU-13C6-glucose (CLM-1396-10), growthfactors and supplements as above but lacking glutamine, unlabelled glucose, oramino acids. Flux labelling of cell lines was carried out as above in DMEM lackingany carbon source (Invitrogen 11966025) supplementedwith 10mMU-13C6-glucose(CLM-1396-10), Glutamax (Invitrogen no. 35050061), and 10% fetal calf serum. Fordrug treatment, 10 µM UK-5099 and 1mM valproic acid were added to the abovemedium. C2C12 cells were purchased from ATCC (CRL-1772) and tMEFs were agift from D. Tantin (University of Utah, USA). No cell lines used in this study werefound in the database of commonly misidentified cell lines that is maintained byICLAC and NCBI Biosample. The cell lines were not authenticated and were nottested for mycoplasma contamination.
Electron microscopy. Tissue was saved for electron microscopy by cuttingapproximately 1mm doughnuts and fixed overnight at 4 ◦C in fresh 2.5%glutaraldehyde (Electron Microscopy Sciences no. 16320) diluted in PBS. The nextday tissue was washed three times in cacodylate buffer. Secondary fixation wascarried out in 2% osmium tetroxide at room temperature for 1 h followed by twowashes with cacodylate buffer followed by one wash with water. Staining usedsaturated uranyl acetate for 1 h at room temperature, washed three times with water,and dehydratedwith a graded ethanol series (30%, 50%, 70%, 95%×2, 100%×3, andfinally absolute acetone). Infiltration was carried out with Epon epoxy resin (30%for 5 h, 70% overnight, 100% for 8 h with three changes) and tissue was embeddedwith 100% fresh resin. Polymerization in fresh resin was carried out at 60 ◦C for48 h followed by ultracutting (Leica UC6 ultratome) at 70 nm. Images were collectedusing a JEM-1400 Plus Transmission Electron Microscope (JEOL).
Seahorse. Control and MPC1 knockout organoids for oxygen consumption studieswere passaged by mechanical disruption rather than complete dissociation to singlecells. Organoid fragments were spotted into a 6-well dish with multiple <10 µlspots per well and overlaid with 2ml of organoid growth medium. Two daysfollowing plating, the medium was changed with the addition of vehicle or 10 µMUK-5099. For assay, seahorse analysis, organoids were extracted from Matrigelwith gentle pipetting to minimize disaggregation. An XF96 well plate was coatedwith a 1:10 dilution of Matrigel in PBS and allowed to sit at room temperaturefor 1 h. Organoids were evenly seeded in each well with the respective medium(wENR CV ± UK-5099). The following day, organoids were run on an XF96eAnalyzer for a Mito Stress Test in standard assay medium (DMEM, 25mM glucose,2mM pyruvate, 2mM glutamine, pH 7.4) using the manufacturer’s protocol andstandard drug concentrations (oligomycin 2 µM, FCCP 2 µM, rotenone 0.5 µM, andantimycin A 0.5 µM).
For fatty acid oxidation, substrate-limitedmediumwas prepared as adapted fromthe stem cell recipe (all concentrations were kept the same except B27 supplementwas 66.6 µl, D-glucose 0.5mM, 1mM glutamine and carnitine 0.5mM per 5ml of4× medium). The following drugs were added to substrate-limited medium: 3 µMCHIR99021, 1mM valproic acid, ±10 µM UK-5099. Medium was changed andthe organoids were maintained for 6 h in substrate-limited conditions. FAO Assayrunning buffer was standard 1× KHB (111mMNaCl, 4.7mMKCl, 1.25mMCaCl2,2.0mM MgSO4, 1.2mM Na2HPO4) + 2.5mM D-glucose, 0.5mM L-carnitine, and5mM HEPES buffer (pH 7.4). The following drugs were added to 1× KHB: 3 µMCHIR99021, 1mM valproic acid,±10 µMUK-5099. Followingmedium change into1× KHB, the plate was maintained at 37 ◦C in a non-CO2 incubator. At 30minpost media change, 40 µM final Etomoxir (R & D Systems cat. no. 4539) or vehiclewas added; and at 45min post media change, BSA or palmitate, (Agilent cat.no. 102720-100) was added according to the manufacturer’s protocol. Followingthe addition of the BSA or palmitate substrates, the assay was run in the XF96eAnalyzer for the Mito Stress Test. The assay protocol was adapted as follows (threemeasurements per phase, acute injection followed by 3min mixing, 3min waiting,3minmeasuring)with the final concentrations of drugs as follows (oligomycin 2 µM,FCCP 2 µM, rotenone 0.5 µM and antimycin A 0.5 µM). Normalization to cellularproteinwas quantified by Pierce BCAassay (Fisher Scientific cat. no. 23227) and readon a photometric plate reader (Varioskan Flash). Results were analysed in WAVEsoftware and processed through the XFMito Stress Test Report and Glycolysis StressTest Generators.
ENCODE ChIP-seq for MPC1 promoter. This track shows ChIP-seq data fromthe Myers Lab at the Hudson Alpha Institute for Biotechnology and by the labo-ratories of M. Snyder, M. Gerstein and S. Weissman at Yale University, P. Farnhamat the University of Southern California, K. Struhl at Harvard, K. White at theUniversity of Chicago, and V. Iyer at the University of Texas, Austin. These datawere processed into uniform peak calls by the ENCODE Analysis Working Grouppipeline developed by A. Kundaje. The clustering of the uniform peaks was per-formed by UCSC (https://genome.ucsc.edu/cgi-bin/hgGateway). The Factorbookmotif identifications and localizations (and valuable assistance with interpretation)were provided by J.Wang, B. H. Kim and J. Zhuang of the Zlab (Weng Lab) at UMassMedical School.
Statistics and reproducibility. No pre-specified effect size was calculated, andno statistical method was used to predetermine sample size. For comparisonsof multiple groups, an ordinary one-way ANOVA with Dunnett or Holm–Sidakcorrection for multiple comparisons (Fig. 1a groups compared with low, 1c groupscompared with EN, 4f groups compared with wENR) was used. Statistical tests wereappropriate for comparisons being made; for all t-tests and ANOVA, data meetassumptions of the tests; assessment of variation was carried out but not included.Formouse studies, an n of 10 was chosen for control (equal Lgr5-EGFP heterozygous×Mpc1WT/WTand Lgr5-EGFPwild-type×Mpc1 fl/fl) and knockout (Lgr5-EGFPheterozygous × Mpc1 fl/fl) comprised of both males and females. No statisticalmethod was used to predetermine sample size. Experiments were not randomized.Investigators were not blinded to allocation during experiments and outcomeassessment. Reproducibility: Fig. 2a: representative of two experiments; Fig. 2b:representative of two experiments; Fig. 2c representative of three experiments(pooled); Fig. 2d representative of three experiments; Fig. 2e representative of twoexperiments; Fig. 2f representative of two experiments; Fig. 2g representative of threeexperiments; Fig. 4a: representative of two experiments; Fig. 4b: representative of twoexperiments; Fig. 4c: representative of two experiments; Fig. 4d: representative of twoexperiments; Fig. 4g: representative of two experiments; Fig. 5d: representative oftwo experiments; Fig. 6a: representative of two experiments; Fig. 6b: representativeof two experiments; Fig. 6c: representative of two experiments; Fig. 6d: representativeof two experiments; Fig. 6e: four individual patients, n= 6 replicates, averagedand pooled; Fig. 6g: representative of two experiments; Fig. 6h: representativeof two experiments; Fig. 6k: two independent infections, data pooled andSupplementary Fig. 2a: representative of three experiments; Supplementary Fig. 4b:representative of three experiments; Supplementary Fig. 6a: representative of twoexperiments and Supplementary Fig. 6b: two independent infections, data pooled (asin Fig. 6k).
Code availability. The software tools used for ENCODE are freely available at:https://genome.ucsc.edu/ENCODE/encodeTools.html.
Data availability. Previously published ENCODE ChIP-Seq data for Myc that werere-analysed here are available under UCSC accession codes wgEncodeEH000545,wgEncodeEH001867, wgEncodeEH000670, wgEncodeEH002800, wgEncodeEH000536 and wgEncodeEH001133.
Data corresponding tomRNA transcript abundance have been deposited at GEOunder the accession numbers GSE100830 and GSE100831.
NATURE CELL BIOLOGY
© 2017 Macmillan Publishers Limited, part of Springer Nature. All rights reserved.
METHODS DOI: 10.1038/ncb3593
Metabolomics data have been deposited in Figshare and can be accessed underhttp://dx.doi.org/10.6084/m9.figshare.5117269.v1.
Source data for the figures have been provided as Supplementary Table 7.All other data supporting the findings of this study are available from the
corresponding author on reasonable request.
58. Barker, N. et al. Identification of stem cells in small intestine and colon by markergene Lgr5. Nature 449, 1003–1007 (2007).
59. Gray, L. R. et al. Hepatic mitochondrial pyruvate carrier 1 is required for efficientregulation of gluconeogenesis and whole-body glucose homeostasis. Cell Metab. 22,669–681 (2015).
60. Moolenbeek, C. & Ruitenberg, E. J. The ‘Swiss roll’: a simple technique forhistological studies of the rodent intestine. Lab. Anim. 15, 57–59 (1981).
61. Daniels, R. W., Rossano, A. J., Macleod, G. T. & Ganetzky, B. Expression of multipletransgenes from a single construct using viral 2A peptides in Drosophila. PLoS ONE9, e100637 (2014).
62. Sato, T. et al. Paneth cells constitute the niche for Lgr5 stem cells in intestinal crypts.Nature 469, 415–418 (2011).
63. Ootani, A. et al. Sustained in vitro intestinal epithelial culture within a Wnt-dependent stem cell niche. Nat. Med. 15, 701–706 (2009).
64. Simmini, S. et al. Transformation of intestinal stem cells into gastric stem cells onloss of transcription factor Cdx2. Nat. Commun. 5, 5728 (2014).
65. Weber, K., Mock, U., Petrowitz, B., Bartsch, U. & Fehse, B. Lentiviral gene ontology(LeGO) vectors equipped with novel drug-selectable fluorescent proteins: newbuilding blocks for cell marking and multi-gene analysis. Gene Ther. 17,511–520 (2010).
© 2017 Macmillan Publishers Limited, part of Springer Nature. All rights reserved.
NATURE CELL BIOLOGY

S U P P L E M E N TA RY I N F O R M AT I O N
WWW.NATURE.COM/NATURECELLBIOLOGY 1
© 2017 Macmillan Publishers Limited, part of Springer Nature. All rights reserved.
In the format provided by the authors and unedited.DOI: 10.1038/ncb3593
Supplemental Figure 1a b
cTFAM NRF1 PDK1 CK20
Du
od
enu
mSm
all I
nte
stin
eC
olo
n
Sid
e Sc
atte
r - A
rea
Sid
e Sc
atte
r - A
rea
Sid
e Sc
atte
r - H
eig
ht
Sid
e Sc
atte
r - H
eig
ht
Forw
ard
Sca
tter
- H
eig
ht
Forw
ard
Sca
tter
- H
eig
ht
Forw
ard
Sca
tter
-Are
aFo
rwar
d S
catt
er -A
rea
Side Scatter - Width
Side Scatter - Width
Forward Scatter - Width
Forward Scatter - Width
Forward Scatter - Area
Forward Scatter - Area
GFP
GFP
Cont
rol
Lgr5
-EG
FP+
Pro
xim
al (J
ejun
um)
Dis
tal (
Ileum
)
VDAC MPC1
Supplementary Figure 1 Additional images of flow gating and IHC in mouse and human a, Gating startegy for sorting of Lgr5-EGFP positive stem cells for transcript abundance. Top showing final gating for collection of GFP-low, GFP-mid, and GFP-high cells for transcript abundance. Bottom showing full gating strategy exclusion of cell debris and purification of singlet cells.
b, IHC of VDAC1 and MPC1 throughout the mouse small intestine from proximal to distal showing staining of crypt base and differentiating transient amplifying cells. (scale bar = 20 um). c, Human Protein Atlas (http://www.proteinatlas.org) images of duodenum, small intestine, and colon stained for TFAM, NRF1, PDK1, and CK20 (scale bar = 20 um (b), 100 um (c)).
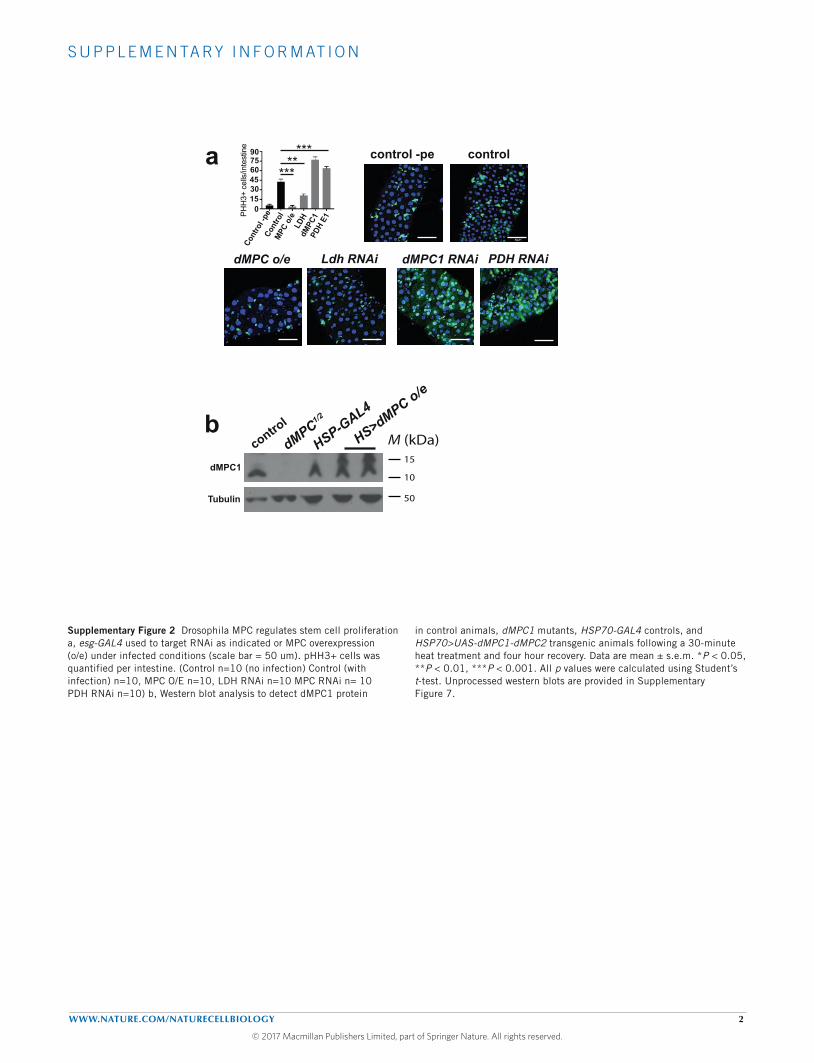
S U P P L E M E N TA RY I N F O R M AT I O N
WWW.NATURE.COM/NATURECELLBIOLOGY 2
© 2017 Macmillan Publishers Limited, part of Springer Nature. All rights reserved.
bcontro
l
dMPC1/2
HSP-GAL4
HS>dMPC o/e
dMPC1
Tubulin
a
P
A
control -pe control
dMPC o/e Ldh RNAi dMPC1 RNAi PDH RNAiCo
ntro
l -pe
Cont
rol
MPC o
/eLD
HdM
PC1
PDH
E1
PHH
3+ c
ells
/inte
stin
e
0153045607590
***
*****
Supplemental Figure 2
M (kDa)15
50
10
Supplementary Figure 2 Drosophila MPC regulates stem cell proliferation a, esg-GAL4 used to target RNAi as indicated or MPC overexpression (o/e) under infected conditions (scale bar = 50 um). pHH3+ cells was quantified per intestine. (Control n=10 (no infection) Control (with infection) n=10, MPC O/E n=10, LDH RNAi n=10 MPC RNAi n= 10 PDH RNAi n=10) b, Western blot analysis to detect dMPC1 protein
in control animals, dMPC1 mutants, HSP70-GAL4 controls, and HSP70>UAS-dMPC1-dMPC2 transgenic animals following a 30-minute heat treatment and four hour recovery. Data are mean ± s.e.m. *P < 0.05, **P < 0.01, ***P < 0.001. All p values were calculated using Student’s t-test. Unprocessed western blots are provided in Supplementary Figure 7.
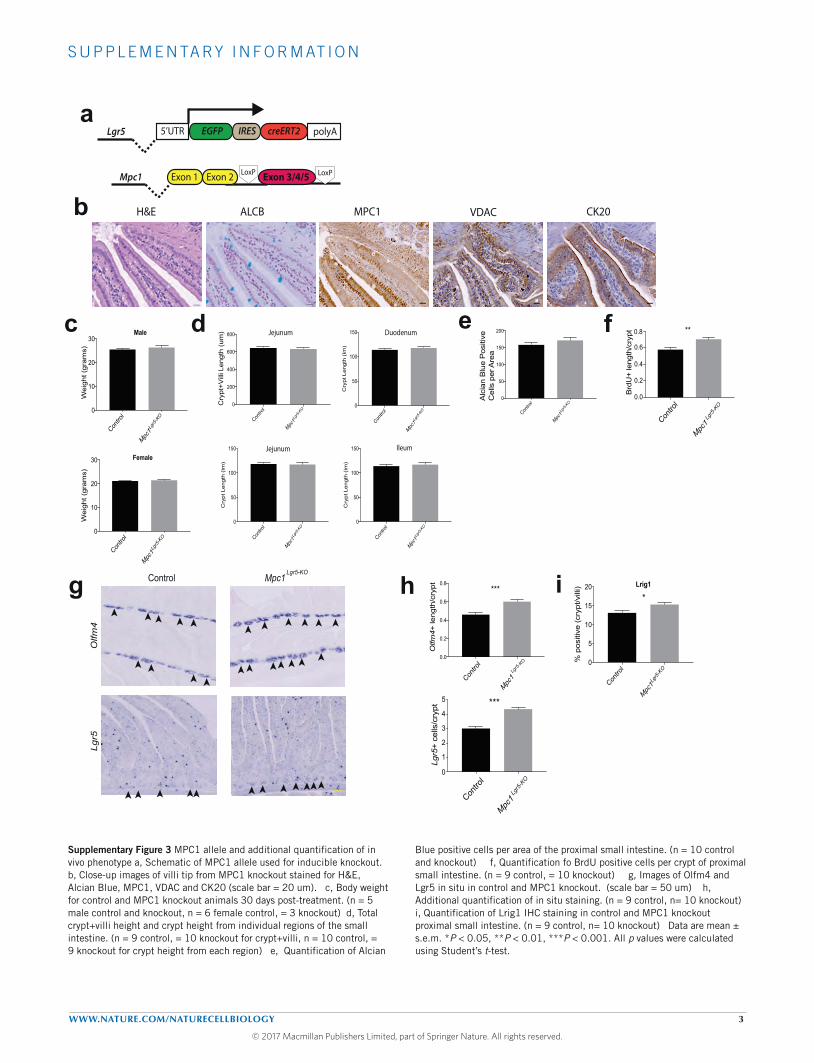
S U P P L E M E N TA RY I N F O R M AT I O N
WWW.NATURE.COM/NATURECELLBIOLOGY 3
© 2017 Macmillan Publishers Limited, part of Springer Nature. All rights reserved.
Contro
l0
1
2
3
4
5
Lgr5
+ ce
lls/c
rypt ***
Mpc1Lg
r5-K
O
H&E ALCB MPC1 VDAC CK20
5’UTR EGFP IRES creERT2 polyALgr5
Mpc1 Exon 1 Exon 2 LoxP Exon 3/4/5 LoxP
Contro
l
Mpc1
0.0
0.2
0.4
0.6
0.8
Olfm
4+ le
ngth
/cry
pt ***
Lgr5-
KO
Control Mpc1
Olfm
4Lg
r5
Lgr5-KO
g h
Contro
l
Mpc1Lg
r5-K
O0
10
20
30
Wei
ght (
gram
s)
Male
Contro
l
Mpc1Lg
r5-K
O0
10
20
30
Wei
ght (
gram
s)
Female
Contro
l
Mpc1Lg
r5-K
O0
5
10
15
20%
pos
itive
(cr
ypt/v
illi) Lrig1
*
Contro
l
Mpc1Lg
r5-K
O0
50
100
150
200
Alc
ian
Blu
e P
ositi
ve
Cel
ls p
er A
rea
c
Contro
l
Mpc1Lg
r5-K
O0
50
100
150
Cry
pt L
engt
h (ì
m)
Duodenum
Contro
l
Mpc1Lg
r5-K
O0
50
100
150
Cry
pt L
engt
h (ì
m)
Jejunum
Contro
l
Mpc1Lg
r5-K
O0
50
100
150
Cry
pt L
engt
h (ì
m)
Ileum
b
a
i
Supplemental Figure 3
Contro
l0.0
0.2
0.4
0.6
0.8
Brd
U+
leng
th/c
rypt **
Mpc1Lg
r5-K
O
d
Contro
l
Mpc1Lg
r5-K
O0
200
400
600
800
Cry
pt+V
illi L
engt
h (u
m) Jejunum
e f
Supplementary Figure 3 MPC1 allele and additional quantification of in vivo phenotype a, Schematic of MPC1 allele used for inducible knockout. b, Close-up images of villi tip from MPC1 knockout stained for H&E, Alcian Blue, MPC1, VDAC and CK20 (scale bar = 20 um). c, Body weight for control and MPC1 knockout animals 30 days post-treatment. (n = 5 male control and knockout, n = 6 female control, = 3 knockout) d, Total crypt+villi height and crypt height from individual regions of the small intestine. (n = 9 control, = 10 knockout for crypt+villi, n = 10 control, = 9 knockout for crypt height from each region) e, Quantification of Alcian
Blue positive cells per area of the proximal small intestine. (n = 10 control and knockout) f, Quantification fo BrdU positive cells per crypt of proximal small intestine. (n = 9 control, = 10 knockout) g, Images of Olfm4 and Lgr5 in situ in control and MPC1 knockout. (scale bar = 50 um) h, Additional quantification of in situ staining. (n = 9 control, n= 10 knockout) i, Quantification of Lrig1 IHC staining in control and MPC1 knockout proximal small intestine. (n = 9 control, n= 10 knockout) Data are mean ± s.e.m. *P < 0.05, **P < 0.01, ***P < 0.001. All p values were calculated using Student’s t-test.
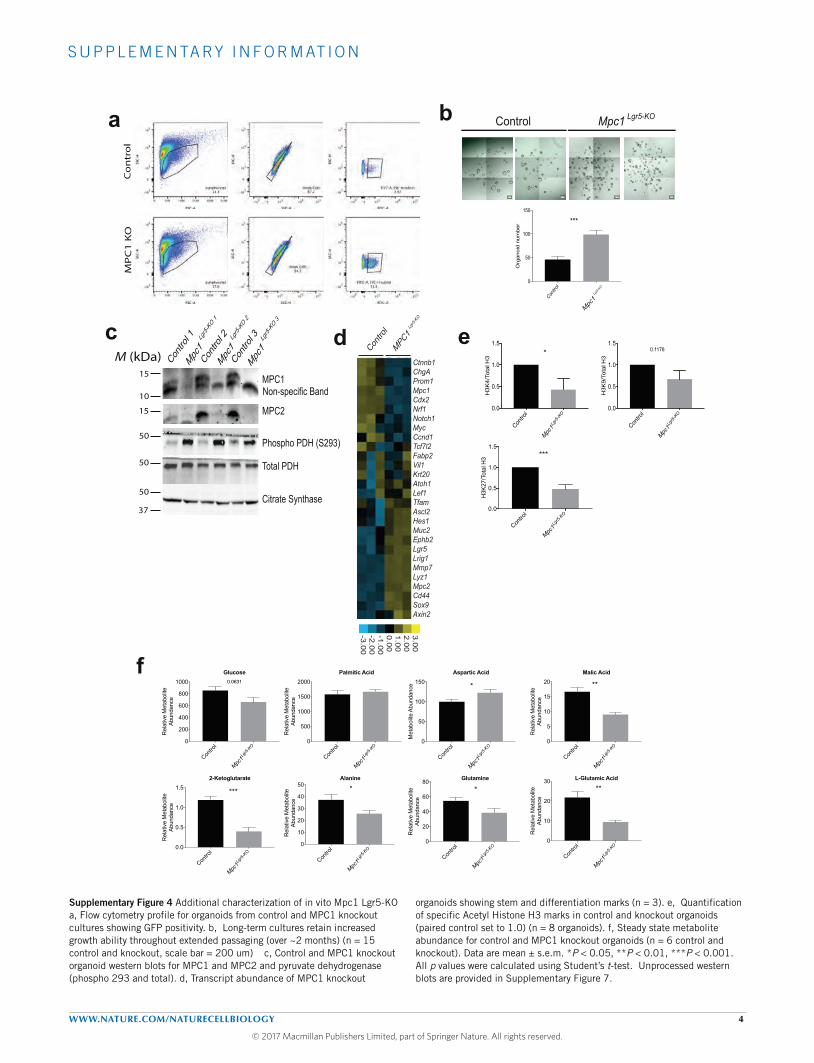
S U P P L E M E N TA RY I N F O R M AT I O N
WWW.NATURE.COM/NATURECELLBIOLOGY 4
© 2017 Macmillan Publishers Limited, part of Springer Nature. All rights reserved.
Lgr5-KOControl Mpc1
Contro
l0
50
100
150
Org
anoi
d nu
mbe
r ***
Lgr5
-KO
Mpc1
Co
ntr
ol
MP
C1
KO
e
Contro
l
Mpc1Lg
r5-K
O0.0
0.5
1.0
1.5
H3K
4/To
tal H
3 *
Contro
l
Mpc1Lg
r5-K
O0.0
0.5
1.0
1.5
H3K
9/To
tal H
3
0.1178
a b
d
Contro
l
Mpc1L
gr5-K
O0.0
0.5
1.0
1.5
H3K
27/T
otal
H3 ***
3.002.001.000.00-1.00-2.00-3.00
Contro
l
MPC1Lg
r5-K
O
Ctnnb1ChgAProm1Mpc1Cdx2Nrf1Notch1MycCcnd1Tcf7l2Fabp2Vil1Krt20Atoh1Lef1TfamAscl2Hes1Muc2Ephb2Lgr5Lrig1Mmp7Lyz1Mpc2Cd44Sox9Axin2
c
MPC1
MPC2
Phospho PDH (S293)
Total PDH
Citrate Synthase
Contro
l 1
Contro
l 2
Contro
l 3
Non-specific Band
Mpc
1Lg
r5-K
O 1
Mpc
1Lg
r5-K
O 2
Mpc
1Lg
r5-K
O 3
M (kDa)
50
15
10
50
15
50
37
Contro
l
Mpc1L
gr5-K
O0
200
400
600
800
1000Glucose
Rel
ativ
e M
etab
olite
Abun
danc
e
0.0631
Contro
l
Mpc1L
gr5-K
O0
500
1000
1500
2000Palmitic Acid
Rel
ativ
e M
etab
olite
Abun
danc
e
Contro
l
Mpc1L
gr5-K
O0
50
100
150Aspartic Acid
Met
abol
ite A
bund
ance *
Contro
l
Mpc1L
gr5-K
O0
5
10
15
20Malic Acid
Rel
ativ
e M
etab
olite
Abun
danc
e
**
Contro
l
Mpc1L
gr5-K
O0.0
0.5
1.0
1.52-Ketoglutarate
Rel
ativ
e M
etab
olite
Abun
danc
e
***
Contro
l
Mpc1L
gr5-K
O0
10
20
30
40
50
Rel
ativ
e M
etab
olite
Abun
danc
e
Alanine
*
Contro
l
Mpc1L
gr5-K
O0
10
20
30 L-Glutamic Acid
Rel
ativ
e M
etab
olite
Abun
danc
e
**
Contro
l
Mpc1L
gr5-K
O0
20
40
60
80 Glutamine
Rel
ativ
e M
etab
olite
Abun
danc
e
*
f
Supplemental Figure 4
Supplementary Figure 4 Additional characterization of in vito Mpc1 Lgr5-KO a, Flow cytometry profile for organoids from control and MPC1 knockout cultures showing GFP positivity. b, Long-term cultures retain increased growth ability throughout extended passaging (over ~2 months) (n = 15 control and knockout, scale bar = 200 um) c, Control and MPC1 knockout organoid western blots for MPC1 and MPC2 and pyruvate dehydrogenase (phospho 293 and total). d, Transcript abundance of MPC1 knockout
organoids showing stem and differentiation marks (n = 3). e, Quantification of specific Acetyl Histone H3 marks in control and knockout organoids (paired control set to 1.0) (n = 8 organoids). f, Steady state metabolite abundance for control and MPC1 knockout organoids (n = 6 control and knockout). Data are mean ± s.e.m. *P < 0.05, **P < 0.01, ***P < 0.001. All p values were calculated using Student’s t-test. Unprocessed western blots are provided in Supplementary Figure 7.
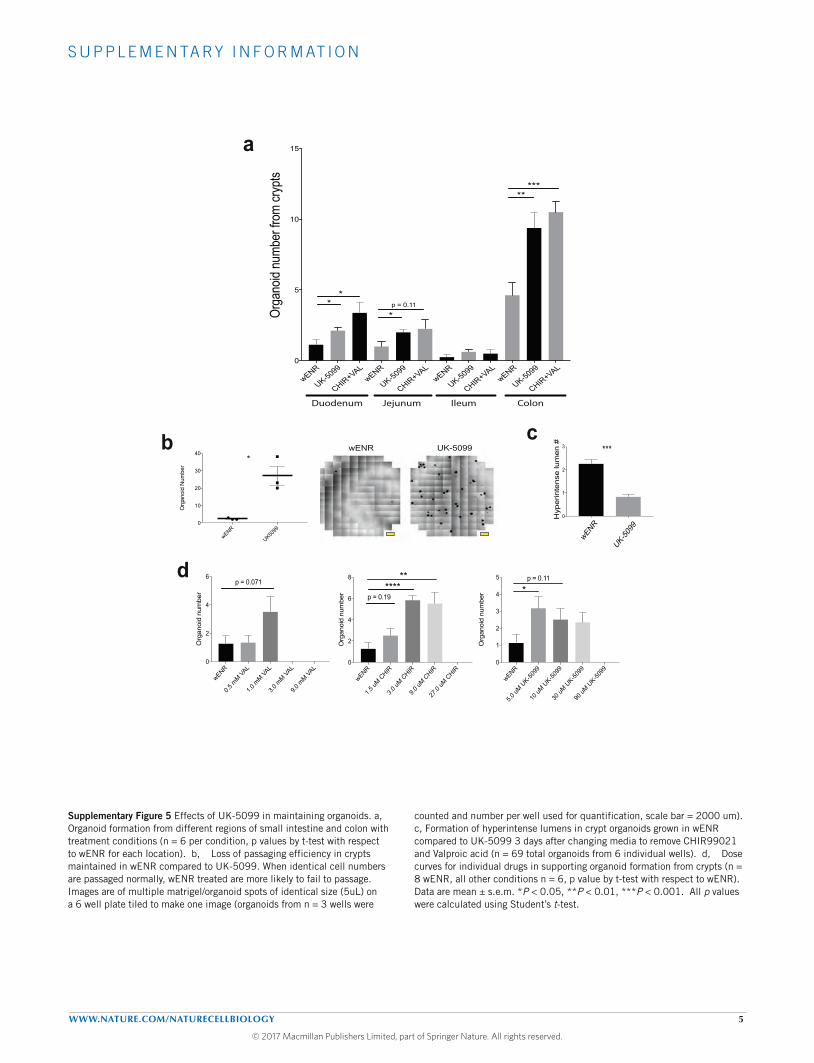
S U P P L E M E N TA RY I N F O R M AT I O N
WWW.NATURE.COM/NATURECELLBIOLOGY 5
© 2017 Macmillan Publishers Limited, part of Springer Nature. All rights reserved.
wENR
UK-509
9 0
1
2
3
Hyp
erin
tens
e lu
men
#
***b cwENR UK-5099
wENR
0.5 m
M VAL
1.0 m
M VAL
3.0 m
M VAL
9.0 m
M VAL
0
2
4
6
Org
anoi
d nu
mbe
r
p = 0.071
wENR
1.5 uM
CHIR
3.0 uM
CHIR
9.0 uM
CHIR
27.0
uM C
HIR0
2
4
6
8
Org
anoi
d nu
mbe
r
******
p = 0.19
wENR
5.0 uM
UK-50
99
10 uM
UK-50
99
30 uM
UK-50
99
90 uM
UK-50
990
1
2
3
4
5
Org
anoi
d nu
mbe
r *p = 0.11
wENR
UK-5099
CHIR+VALwENR
UK-5099
CHIR+VALwENR
UK-5099
CHIR+VALwENR
UK-5099
CHIR+VAL0
5
10
15
Orga
noid
num
ber f
rom
cryp
ts
*****
*p = 0.11*
*
Duodenum Jejunum Ileum Colon
a
d
Supplemental Figure 5
wENR
UK5099
0
10
20
30
40
Org
anoi
d N
umbe
r
*
Supplementary Figure 5 Effects of UK-5099 in maintaining organoids. a, Organoid formation from different regions of small intestine and colon with treatment conditions (n = 6 per condition, p values by t-test with respect to wENR for each location). b, Loss of passaging efficiency in crypts maintained in wENR compared to UK-5099. When identical cell numbers are passaged normally, wENR treated are more likely to fail to passage. Images are of multiple matrigel/organoid spots of identical size (5uL) on a 6 well plate tiled to make one image (organoids from n = 3 wells were
counted and number per well used for quantification, scale bar = 2000 um). c, Formation of hyperintense lumens in crypt organoids grown in wENR compared to UK-5099 3 days after changing media to remove CHIR99021 and Valproic acid (n = 69 total organoids from 6 individual wells). d, Dose curves for individual drugs in supporting organoid formation from crypts (n = 8 wENR, all other conditions n = 6, p value by t-test with respect to wENR). Data are mean ± s.e.m. *P < 0.05, **P < 0.01, ***P < 0.001. All p values were calculated using Student’s t-test.
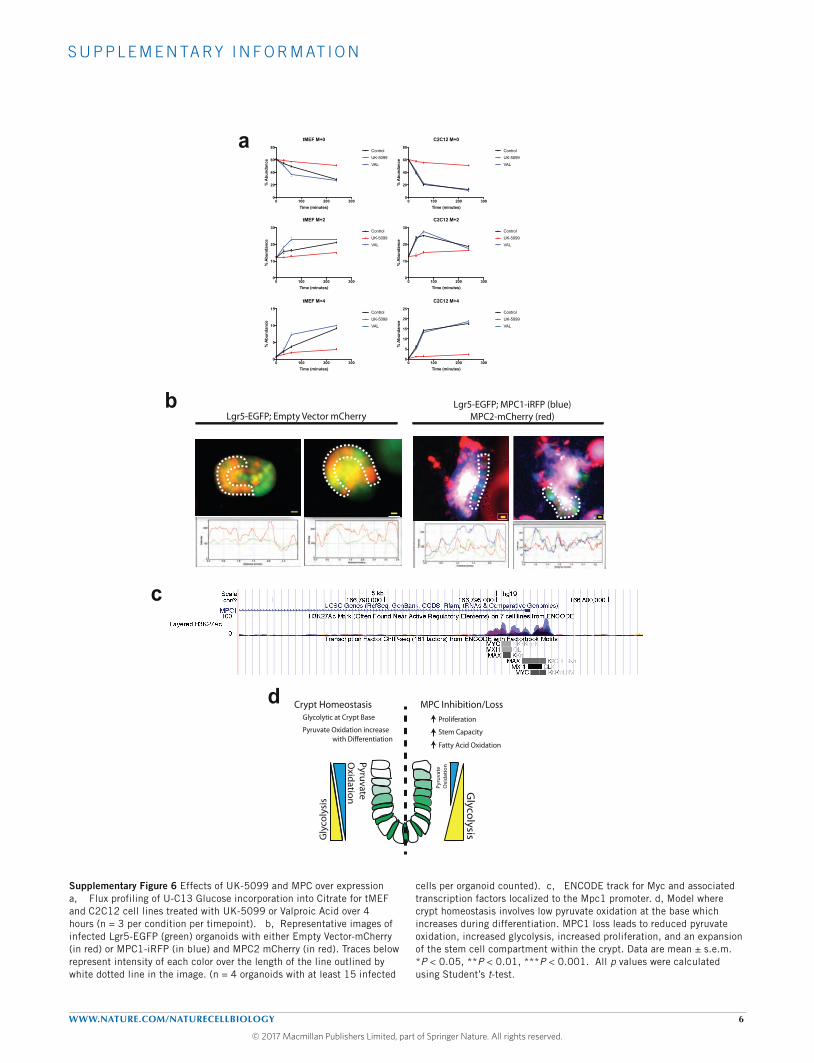
S U P P L E M E N TA RY I N F O R M AT I O N
WWW.NATURE.COM/NATURECELLBIOLOGY 6
© 2017 Macmillan Publishers Limited, part of Springer Nature. All rights reserved.
a
b
c
Lgr5-EGFP; Empty Vector mCherryLgr5-EGFP; MPC1-iRFP (blue)
MPC2-mCherry (red)
0 100 200 3000
20
40
60
80
Time (minutes)
% A
bund
ance
C2C12 M+0
ControlUK-5099VAL
0 100 200 3000
10
20
30
C2C12 M+2
Time (minutes)
% A
bund
ance
ControlUK-5099VAL
0 100 200 3000
5
10
15
20
25
C2C12 M+4
Time (minutes)
% A
bund
ance
ControlUK-5099VAL
0 100 200 3000
20
40
60
80
tMEF M+0
Time (minutes)
% A
bund
ance
ControlUK-5099VAL
0 100 200 3000
10
20
30
tMEF M+2
Time (minutes)
% A
bund
ance
ControlUK-5099VAL
0 100 200 3000
5
10
15
tMEF M+4
Time (minutes)
% A
bund
ance
ControlUK-5099VAL
MPC Inhibition/Loss
Gly
coly
sis
Glycolysis
PyruvateO
xidation
Pyru
vate
Oxi
datio
n
Proliferation
Stem Capacity
Fatty Acid Oxidation
Crypt HomeostasisGlycolytic at Crypt Base
Pyruvate Oxidation increase with Di�erentiation
d
Supplemental Figure 6
Supplementary Figure 6 Effects of UK-5099 and MPC over expression a, Flux profiling of U-C13 Glucose incorporation into Citrate for tMEF and C2C12 cell lines treated with UK-5099 or Valproic Acid over 4 hours (n = 3 per condition per timepoint). b, Representative images of infected Lgr5-EGFP (green) organoids with either Empty Vector-mCherry (in red) or MPC1-iRFP (in blue) and MPC2 mCherry (in red). Traces below represent intensity of each color over the length of the line outlined by white dotted line in the image. (n = 4 organoids with at least 15 infected
cells per organoid counted). c, ENCODE track for Myc and associated transcription factors localized to the Mpc1 promoter. d, Model where crypt homeostasis involves low pyruvate oxidation at the base which increases during differentiation. MPC1 loss leads to reduced pyruvate oxidation, increased glycolysis, increased proliferation, and an expansion of the stem cell compartment within the crypt. Data are mean ± s.e.m. *P < 0.05, **P < 0.01, ***P < 0.001. All p values were calculated using Student’s t-test.
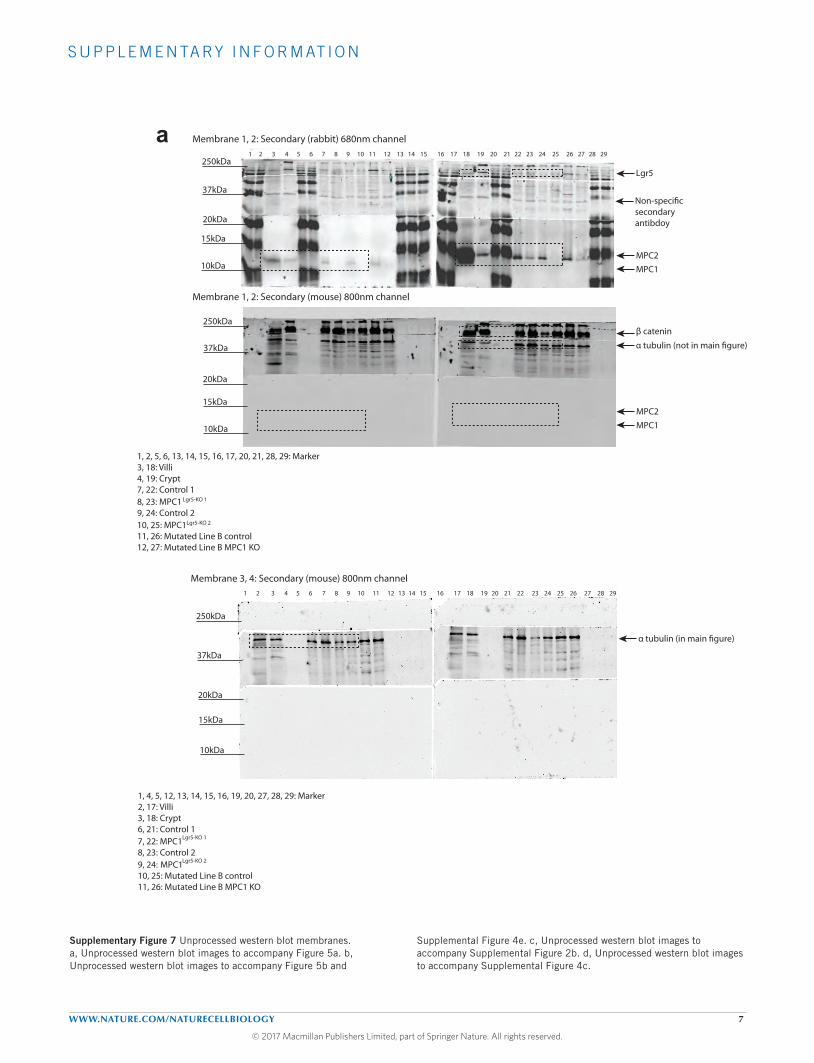
S U P P L E M E N TA RY I N F O R M AT I O N
WWW.NATURE.COM/NATURECELLBIOLOGY 7
© 2017 Macmillan Publishers Limited, part of Springer Nature. All rights reserved.
Supplemental Figure 7: Unprocessed Westerns
10kDa
15kDa
20kDa
37kDa
250kDa
10kDa
15kDa
20kDa
37kDa
250kDa
1 2 3 4 5 6 7 8 9 10 11 12 13 14 15 16 17 18 19 20 21 22 23 24 25 26 27 28 29
MPC1MPC2
Lgr5
β catenin
1, 2, 5, 6, 13, 14, 15, 16, 17, 20, 21, 28, 29: Marker3, 18: Villi4, 19: Crypt7, 22: Control 18, 23: MPC1 Lgr5-KO 1
9, 24: Control 210, 25: MPC1Lgr5-KO 2
11, 26: Mutated Line B control12, 27: Mutated Line B MPC1 KO
secondaryantibdoy
MPC1MPC2
Membrane 1, 2: Secondary (rabbit) 680nm channel
Membrane 1, 2: Secondary (mouse) 800nm channel
a
Membrane 3, 4: Secondary (mouse) 800nm channel1 2 3 4 5 6 7 8 9 10 11 12 13 14 15 16 17 18 19 20 21 22 23 24 25 26 27 28 29
10kDa
15kDa
20kDa
37kDa
250kDa
1, 4, 5, 12, 13, 14, 15, 16, 19, 20, 27, 28, 29: Marker2, 17: Villi3, 18: Crypt6, 21: Control 17, 22: MPC18, 23: Control 29, 24: MPC110, 25: Mutated Line B control11, 26: Mutated Line B MPC1 KO
Lgr5-KO 1
Lgr5-KO 2
Supplementary Figure 7 Unprocessed western blot membranes. a, Unprocessed western blot images to accompany Figure 5a. b, Unprocessed western blot images to accompany Figure 5b and
Supplemental Figure 4e. c, Unprocessed western blot images to accompany Supplemental Figure 2b. d, Unprocessed western blot images to accompany Supplemental Figure 4c.
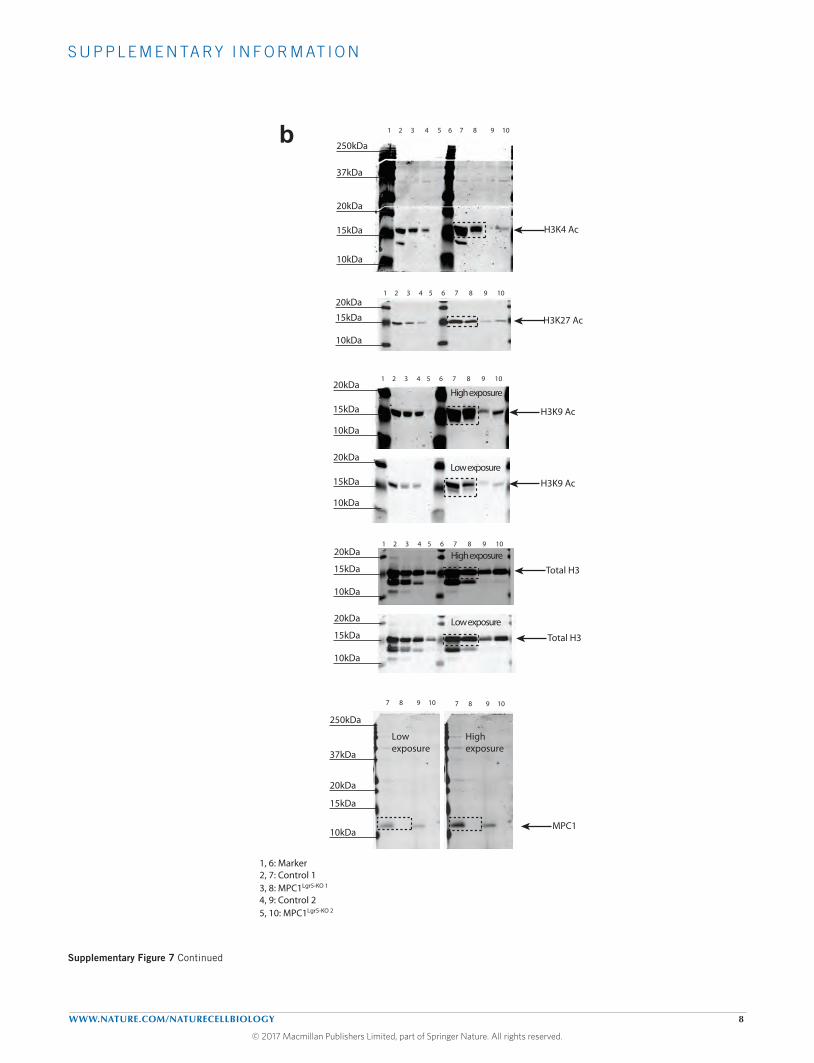
S U P P L E M E N TA RY I N F O R M AT I O N
WWW.NATURE.COM/NATURECELLBIOLOGY 8
© 2017 Macmillan Publishers Limited, part of Springer Nature. All rights reserved.
10kDa
15kDa
20kDa
37kDa
250kDa
10kDa
15kDa
20kDa
1 2 3 4 5 6 7 8 9 10
1 2 3 4 5 6 7 8 9 10
H3K4 Ac
H3K9 Ac
1, 6: Marker2, 7: Control 13, 8: MPC1Lgr5-KO 1
4, 9: Control 25, 10: MPC1Lgr5-KO 2
1 2 3 4 5 6 7 8 9 10
10kDa
15kDa
20kDa
H3K27 Ac
1 2 3 4 5 6 7 8 9 10
10kDa
15kDa
20kDa
Total H3
7 8 9 10
10kDa
15kDa
20kDa
37kDa
250kDa
MPC1
b
Low exposure
Highexposure
7 8 9 10
10kDa
15kDa
20kDa
Total H3
High exposure
Low exposure
10kDa
15kDa
20kDa
H3K9 Ac
High exposure
Low exposure
Supplementary Figure 7 Continued
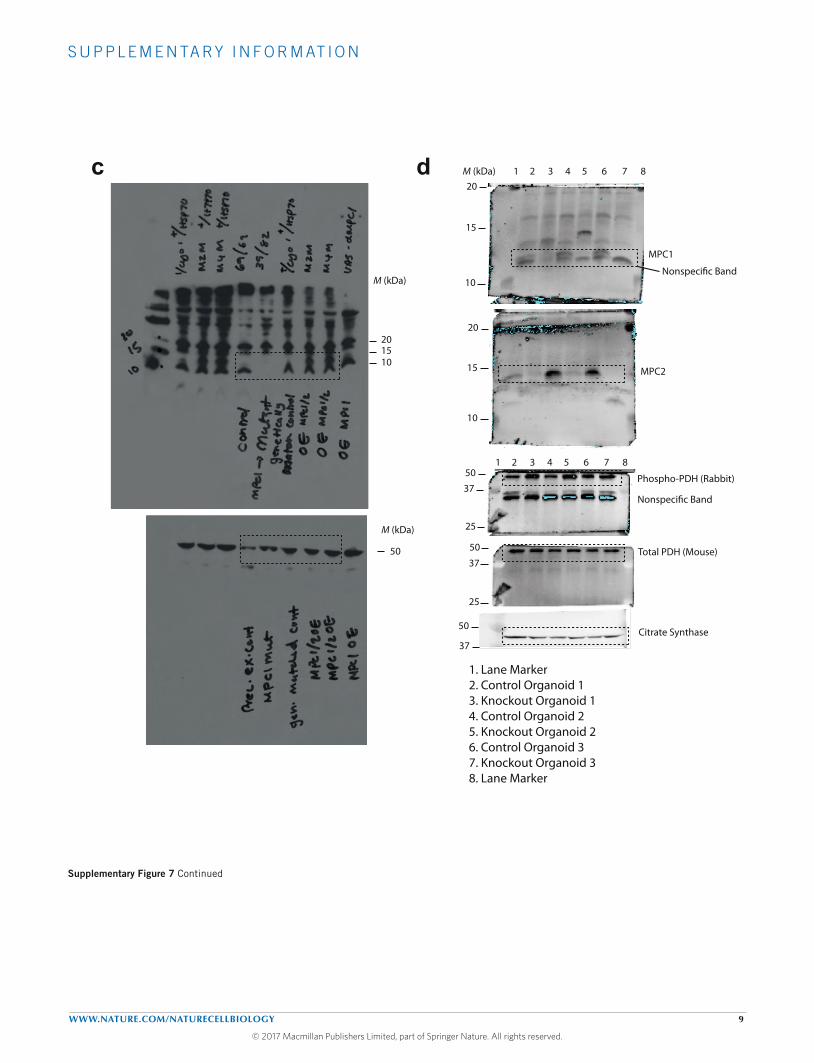
S U P P L E M E N TA RY I N F O R M AT I O N
WWW.NATURE.COM/NATURECELLBIOLOGY 9
© 2017 Macmillan Publishers Limited, part of Springer Nature. All rights reserved.
c d
Citrate Synthase
MPC2
MPC1
Phospho-PDH (Rabbit)
Total PDH (Mouse)
M (kDa)
15
10
20
10
15
20
37
25
37
25
50
50
Nonspeci�c Band
1 2 3 4 5 6 7 8
1 2 3 4 5 6 7 8
50
37
1. Lane Marker2. Control Organoid 13. Knockout Organoid 14. Control Organoid 25. Knockout Organoid 26. Control Organoid 37. Knockout Organoid 38. Lane Marker
Nonspeci�c Band
M (kDa)
101520
M (kDa)
50
Supplementary Figure 7 Continued
S U P P L E M E N TA RY I N F O R M AT I O N
WWW.NATURE.COM/NATURECELLBIOLOGY 10
© 2017 Macmillan Publishers Limited, part of Springer Nature. All rights reserved.
Supplementary Table Legends
Supplementary Table 1 Single cell sort based on EGFP low, mid, and high z-scores for heat map in Figure 1b.
Supplementary Table 2 Transcript z-scores for organoids grown in EN, ENR, and ENR +Wnt3a used to generate heatmap in Figure 1d.
Supplementary Table 3 Transcript z-scores for Lgr5-EGFP Control vs. MPC1-KO organoids used to generate heat map in Supplemental Figure 4d.
Supplementary Table 4 Transcript z-scores for organoids grown in wENR or UK-5099 used to generate the heat map in Figure 6j.
Supplementary Table 5 Information on antibodies used in this work and probe sequences for in situ hybridization.
Supplementary Table 6 Nanostring primer design information.
Supplementary Table 7 Statistics Source Data
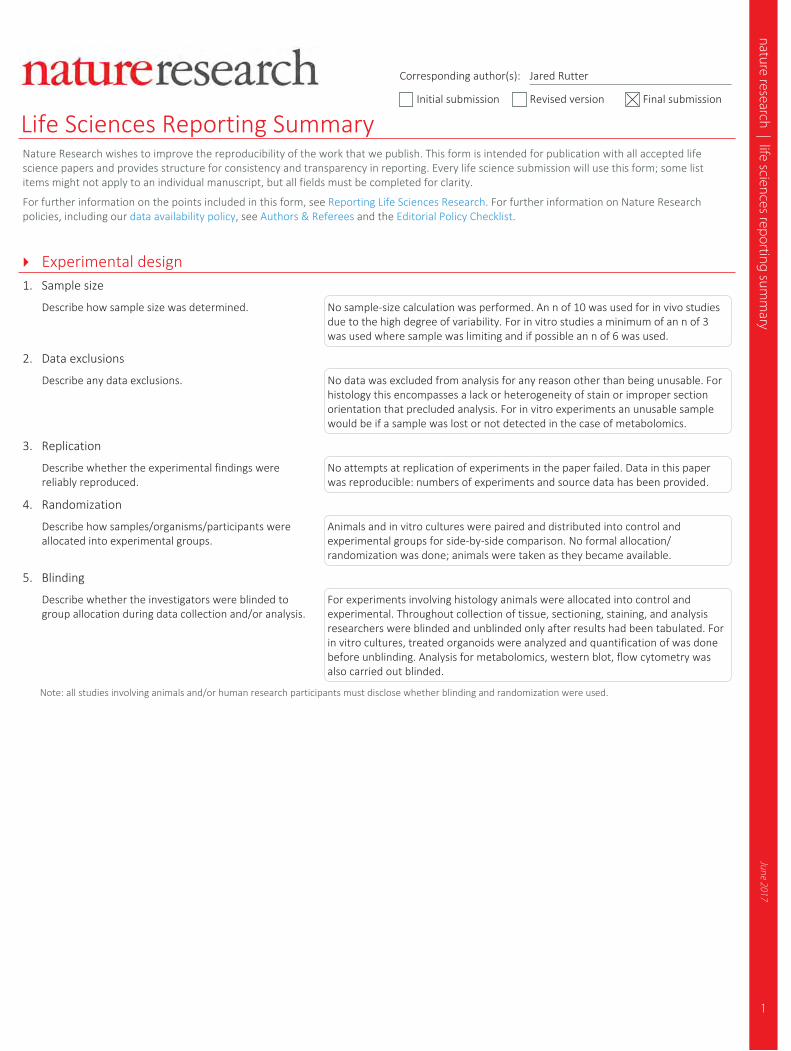
1
nature research | life sciences reporting summ
aryJune 2017
Corresponding author(s): Jared Rutter
Initial submission Revised version Final submission
Life Sciences Reporting SummaryNature Research wishes to improve the reproducibility of the work that we publish. This form is intended for publication with all accepted life science papers and provides structure for consistency and transparency in reporting. Every life science submission will use this form; some list items might not apply to an individual manuscript, but all fields must be completed for clarity.
For further information on the points included in this form, see Reporting Life Sciences Research. For further information on Nature Research policies, including our data availability policy, see Authors & Referees and the Editorial Policy Checklist.
Experimental design1. Sample size
Describe how sample size was determined. No sample-size calculation was performed. An n of 10 was used for in vivo studies due to the high degree of variability. For in vitro studies a minimum of an n of 3 was used where sample was limiting and if possible an n of 6 was used.
2. Data exclusions
Describe any data exclusions. No data was excluded from analysis for any reason other than being unusable. For histology this encompasses a lack or heterogeneity of stain or improper section orientation that precluded analysis. For in vitro experiments an unusable sample would be if a sample was lost or not detected in the case of metabolomics.
3. Replication
Describe whether the experimental findings were reliably reproduced.
No attempts at replication of experiments in the paper failed. Data in this paper was reproducible: numbers of experiments and source data has been provided.
4. Randomization
Describe how samples/organisms/participants were allocated into experimental groups.
Animals and in vitro cultures were paired and distributed into control and experimental groups for side-by-side comparison. No formal allocation/randomization was done; animals were taken as they became available.
5. Blinding
Describe whether the investigators were blinded to group allocation during data collection and/or analysis.
For experiments involving histology animals were allocated into control and experimental. Throughout collection of tissue, sectioning, staining, and analysis researchers were blinded and unblinded only after results had been tabulated. For in vitro cultures, treated organoids were analyzed and quantification of was done before unblinding. Analysis for metabolomics, western blot, flow cytometry was also carried out blinded.
Note: all studies involving animals and/or human research participants must disclose whether blinding and randomization were used.
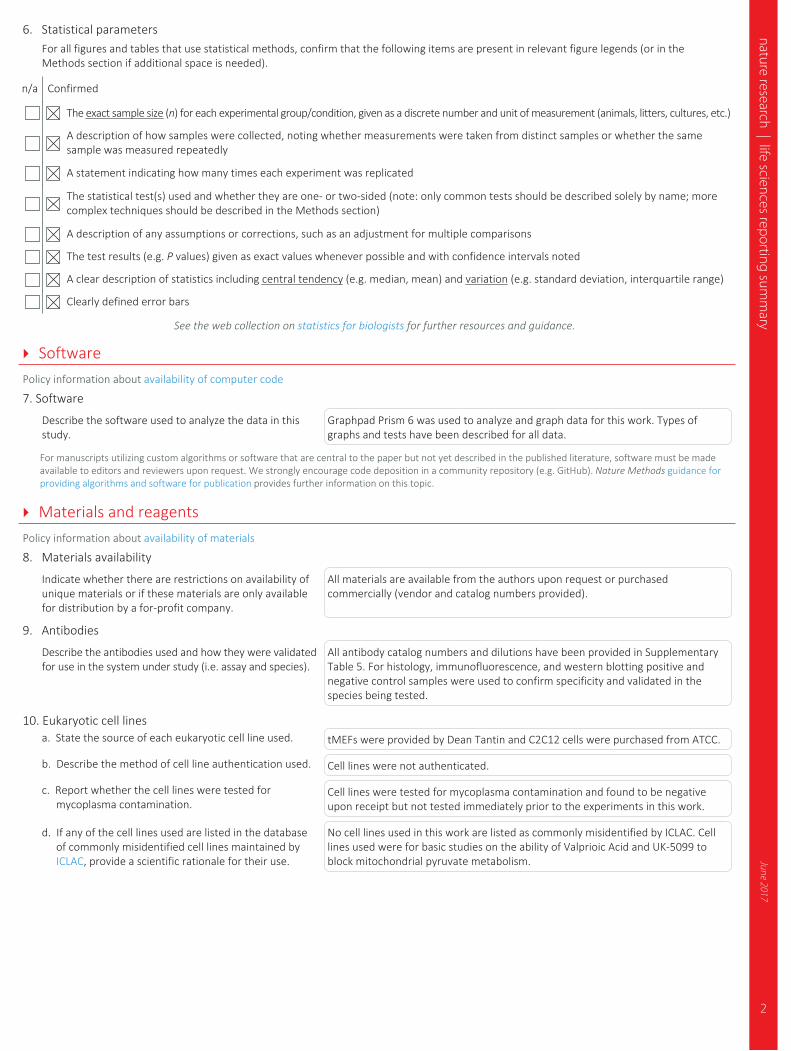
2
nature research | life sciences reporting summ
aryJune 2017
6. Statistical parameters For all figures and tables that use statistical methods, confirm that the following items are present in relevant figure legends (or in the Methods section if additional space is needed).
n/a Confirmed
The exact sample size (n) for each experimental group/condition, given as a discrete number and unit of measurement (animals, litters, cultures, etc.)
A description of how samples were collected, noting whether measurements were taken from distinct samples or whether the same sample was measured repeatedly
A statement indicating how many times each experiment was replicated
The statistical test(s) used and whether they are one- or two-sided (note: only common tests should be described solely by name; more complex techniques should be described in the Methods section)
A description of any assumptions or corrections, such as an adjustment for multiple comparisons
The test results (e.g. P values) given as exact values whenever possible and with confidence intervals noted
A clear description of statistics including central tendency (e.g. median, mean) and variation (e.g. standard deviation, interquartile range)
Clearly defined error bars
See the web collection on statistics for biologists for further resources and guidance.
SoftwarePolicy information about availability of computer code
7. Software
Describe the software used to analyze the data in this study.
Graphpad Prism 6 was used to analyze and graph data for this work. Types of graphs and tests have been described for all data.
For manuscripts utilizing custom algorithms or software that are central to the paper but not yet described in the published literature, software must be made available to editors and reviewers upon request. We strongly encourage code deposition in a community repository (e.g. GitHub). Nature Methods guidance for providing algorithms and software for publication provides further information on this topic.
Materials and reagentsPolicy information about availability of materials
8. Materials availability
Indicate whether there are restrictions on availability of unique materials or if these materials are only available for distribution by a for-profit company.
All materials are available from the authors upon request or purchased commercially (vendor and catalog numbers provided).
9. Antibodies
Describe the antibodies used and how they were validated for use in the system under study (i.e. assay and species).
All antibody catalog numbers and dilutions have been provided in Supplementary Table 5. For histology, immunofluorescence, and western blotting positive and negative control samples were used to confirm specificity and validated in the species being tested.
10. Eukaryotic cell linesa. State the source of each eukaryotic cell line used. tMEFs were provided by Dean Tantin and C2C12 cells were purchased from ATCC.
b. Describe the method of cell line authentication used. Cell lines were not authenticated.
c. Report whether the cell lines were tested for mycoplasma contamination.
Cell lines were tested for mycoplasma contamination and found to be negative upon receipt but not tested immediately prior to the experiments in this work.
d. If any of the cell lines used are listed in the database of commonly misidentified cell lines maintained by ICLAC, provide a scientific rationale for their use.
No cell lines used in this work are listed as commonly misidentified by ICLAC. Cell lines used were for basic studies on the ability of Valprioic Acid and UK-5099 to block mitochondrial pyruvate metabolism.
3
nature research | life sciences reporting summ
aryJune 2017
Animals and human research participantsPolicy information about studies involving animals; when reporting animal research, follow the ARRIVE guidelines
11. Description of research animalsProvide details on animals and/or animal-derived materials used in the study.
Mice used in this study were purchased from Jackson Labs (Lgr5-EGFP) or generated from ES cells as previously published (Mpc1 fl/fl). For in vivo knockout experiments 6- to 8-week-old mice were used. No formal randomization was performed for animal studies, animals were used as they came available, paired with littermate controls where possible, there was no preference for male or female animals, both genders were included in each analysis. For Drosophila studies, mutant dMPC11 and dMPC12 flies have been previously described (reference 70); RNAi transgenic stocks are as follows: UAS-dMPC1 RNAi and UAS-dMPC2-RNAi, UAS-PDH-E1 (VDRC101856), UAS-PDH-E2 (VDRC 102893), and UAS-Notch-RNAi. All Drosophila studies were done following standard ethical guidelines for working with this organism. As is standard in studies of Drosophila intestinal stem cells, all experiments were performed in females, which have a higher rate of basal stem cell proliferation than males. Experiments were conducted in adults aged four days to three weeks after eclosion.
Policy information about studies involving human research participants
12. Description of human research participantsDescribe the covariate-relevant population characteristics of the human research participants.
During colonoscopy a biopsy or tissue was collected from the Ascending Colon. This was used to liberate crypts as previously described for in vitro growth assays in different drug treatment conditions. Biopsies were collected from healthy female patients undergoing routine colonscopy between the ages of 51-60.
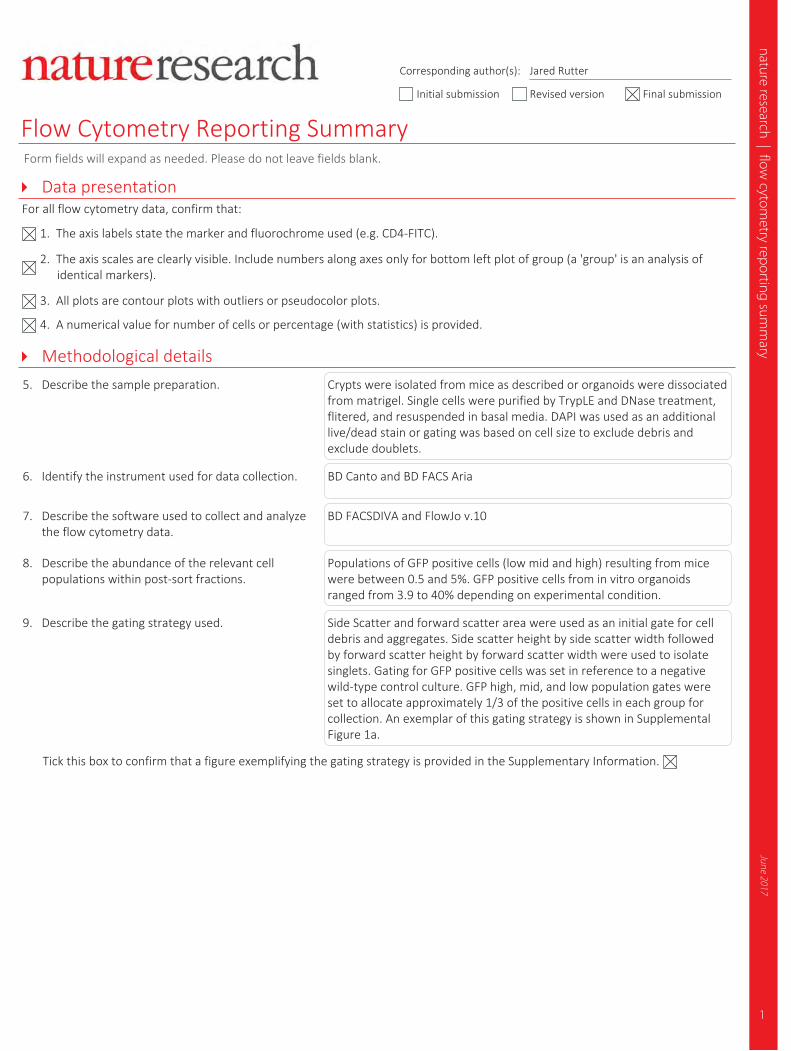
nature research | flow cytom
etry reporting summ
aryJune 2017
1
Corresponding author(s): Jared Rutter
Initial submission Revised version Final submission
Flow Cytometry Reporting Summary Form fields will expand as needed. Please do not leave fields blank.
Data presentationFor all flow cytometry data, confirm that:
1. The axis labels state the marker and fluorochrome used (e.g. CD4-FITC).
2. The axis scales are clearly visible. Include numbers along axes only for bottom left plot of group (a 'group' is an analysis of identical markers).
3. All plots are contour plots with outliers or pseudocolor plots.
4. A numerical value for number of cells or percentage (with statistics) is provided.
Methodological details5. Describe the sample preparation. Crypts were isolated from mice as described or organoids were dissociated
from matrigel. Single cells were purified by TrypLE and DNase treatment, flitered, and resuspended in basal media. DAPI was used as an additional live/dead stain or gating was based on cell size to exclude debris and exclude doublets.
6. Identify the instrument used for data collection. BD Canto and BD FACS Aria
7. Describe the software used to collect and analyze the flow cytometry data.
BD FACSDIVA and FlowJo v.10
8. Describe the abundance of the relevant cell populations within post-sort fractions.
Populations of GFP positive cells (low mid and high) resulting from mice were between 0.5 and 5%. GFP positive cells from in vitro organoids ranged from 3.9 to 40% depending on experimental condition.
9. Describe the gating strategy used. Side Scatter and forward scatter area were used as an initial gate for cell debris and aggregates. Side scatter height by side scatter width followed by forward scatter height by forward scatter width were used to isolate singlets. Gating for GFP positive cells was set in reference to a negative wild-type control culture. GFP high, mid, and low population gates were set to allocate approximately 1/3 of the positive cells in each group for collection. An exemplar of this gating strategy is shown in Supplemental Figure 1a.
Tick this box to confirm that a figure exemplifying the gating strategy is provided in the Supplementary Information.