control valve fault detection by acoustic emission: data ... · detecting tool wear in turning...
TRANSCRIPT

Control Valve Fault Detection by Acoustic
Emission: Data Collection Method
Juwita Mad Juhani Universiti Pendidikan Sultan Idris, Tanjung Malim, Perak, Malaysia
Email: [email protected]
Rosdiazli Ibrahim and Intan Najiha Mohd Shukri Universiti Teknologi Petronas, Tronoh, Perak, Malaysia
Email: [email protected], [email protected]
Abstract—Control valves are essential components in
process control industry. They are the final control elements
that play an important role to regulate flow rate. The
condition of control valves affect the whole cycle of process.
Therefore, information about their health would be useful to
plant personnel during maintenance. This project proposes
acoustic emission (AE) technique for control valve fault
detection. This paper discusses two methods used for data
collection. Data acquisition system (DAQ) was used for
retrieving data in time domain while spectrum analyzer was
used for frequency domain data.
Index Terms—acoustic emission, control valve, fault
detection
I. INTRODUCTION
Control valve is a power operated device which
regulates the fluid flow rate in a process control system.
Basically, it consists of a plug and stem. The stem is
manipulated by air pressure and the plug alters the orifice
area in the flow path. The change of valve position is in
response to a signal from the controlling system.
There are two actions of pneumatic control valve; air
to open and air to close. Air to open means the control
valve opening gets larger linear to air supply. If air supply
fails, this type of control valve will be in fully close. The
concept is opposite in air to close type, where air is
supplied to close the valve. During air failure, the control
valve will be in fully open. The suitable action is chosen
based on the safety requirement of the process.
Number of plugs also differentiates control valves.
Control valve would be either single-seated or double-
seated. Single seated control valve has one plug while
double seated has two plugs. Normally, single seated
control valve is used in application that needs the control
valve to be closed tightly. Whereas if the process does not
expect fully closed condition, double seated valve is
recommended. Fig. 1 shows the difference of single-
seated and double-seated control valve.
The last feature that classifies control valves is flow
characteristics. It gives the relationship between stem
Manuscript received March 6, 2015; revised June 2, 2015.
movements with flow rate. Three types of control valve
commonly found are quick opening, linear and equal
percentage. These characteristics can be identified by
plug shapes. This is shown in Fig. 2. However, these flow
characteristics are true only when the pressure drop
across control valve is constant.
Figure 1. Single seated control valve (b) Double seated control valve
Figure 2. Control valve characteristics
A. Acoustic Emission
Acoustic emission (AE) is a nondestructive testing
(NDT) method used in a wide area of applications. This
method was well accepted and commonly found in
industries for the reason that it is simple and easy to use.
Acoustic emission is an energy emitted in the form of
transient elastic wave or sound wave within material. The
signal is obtained using AE equipment after the sound
wave has been detected and processed electrically.
Examples of current application of AE technology are
detecting tool wear in turning process, detecting defects
Journal of Automation and Control Engineering Vol. 4, No. 3, June 2016
©2016 Journal of Automation and Control Engineering 194doi: 10.18178/joace.4.3.194-198

such as pitting and crack in gears and bearings [1],
assessing surface integrity of rail-track, detecting
cavitations and determining Best Efficiency Pump (BEP)
in centrifugal pump [2]. It was also applied on gear fault
detection and bridge inspection in civil infrastructure
study [3]. AE is also widely used for locating leaking of
liquids or gases in pressurized or evacuated components
or systems as a result of pressure differential [4].
Using AE, the entire structure to be monitored can be
covered in a single inspection. Compared to other non-
destructive techniques, the initial cost for AE is similar.
However, the operational cost of AE is much cheaper.
Moreover, AE can implement online monitoring for the
entire structure or any part of it [5].
The elastic waves heard by AE were produced by a
sudden redistribution of stress in a material. For example,
when a structure experience cracks, energy is released in
the form of stress waves, which propagate to the surface
and are recorded by sensors.
AE sources are from macroscopic, microscopic and
pseudo sources. Examples of macroscopic source are
deformation and fracture while microscopic AE sources
are commonly found in civil engineering such as
beginning and spreading of cracks, formation of bubbles,
dislocation motion, and slip formation. Pseudo sources do
not release the AE directly within the material, but from
external mechanisms, such as friction from rotating
bearing and leakage of gas or liquid. For defects in
equipments, AE can be detected from leaks, cavitations,
friction in rotating equipments, and growth or alignment
of magnetic domains [5], [6], [7].
In this project, fluid leakage in control valve is a type
of pseudo source. AE detects leak by hearing the “noise”
when a medium flows through leak orifice. This noise is
the turbulent flow that leaks through a small orifice [8],
[9]. The turbulence energy represents AE activity.
Commonly, AE is found at high frequency. Tamutus and
Ternowchek [10] stated that turbulence that cause AE at
over 100 kHz while Hellier [11] believe AE frequencies
are between 150 kHz and 300kHz.
II. EXPERIMENTAL SETUP
Common instruments needed in collection of AE data
are AE sensor, amplifiers and signal processing
instrument that could collect the data. This project has
done two methods for data collection, one AE data in
time domain using DAQ and another in frequency
domain using spectrum analyzer.
AE sensor used has frequency range of 100-1000 kHz
and resonance frequency from 100-800kHz. The sensor’s
task is to measure the peak amplitude is utilized to
capture the AE signal that emitted from the control valve.
The sensor was attached at control valve body using
adhesive tape and it was connected to the preamplifier.
The signal was amplified using 60/40/20 dB AE
Preamplifier. It was accompanied by PAC AE5A post
amplifier which is a high performance AE system that
amplifies and filters incoming AE signals. Then, the
amplified signal was connected to either a DAQ or
spectrum analyzer. All data were collected when the
control valve was in fully closed condition.
A. Data Acquisition System (DAQ)
The output of AE analog signal output was interfaced
to computer using the Measurement Computing Data
Acquisition System (DAQ MCC USB-1208FS). InstaCal
software was use to configure the DAQ. When the DAQ
software is successfully installed into the computer
system, the transmitted signals will be analyzed using
MATLAB software.
Several experiments were carried out on two control
valves, healthy and unhealthy globe type control valve
available in the laboratory. Fig. 3 shows the experimental
setup for data collection using DAQ. This method
collected data in time domain.
Figure 3. Experimental setup with DAQ
B. Spectrum Analyzer
In this method DAQ was replaced with R3131A
spectrum analyzer. The specification states that it could
show signal from 9 kHz up to 3GHz. It was used to
sample the data and display the signal spectrum in
frequency domain. Fig. 4 shows the experimental setup of
the system.
Experiments were done on one globe before and after
damage. The control valve plug was damaged
intentionally to obtain leakage fault. Frequency domain
data were obtained from spectrum analyzer in the form of
data logging. Saved data were transferred into computer
for further analysis.
Figure 4. Experimental setup with spectrum analyzer
III. RESULTS
Some data has been collected at healthy and unhealthy
control valves. The raw data from both methods will be
discussed.
A. Data Acquisition System (DAQ)
The time domain and frequency domain data are plot
using Matlab to see basis of the signal behaviour. Fig. 5
and Fig. 6 show the time domain signal for healthy and
unhealthy control valves.
Journal of Automation and Control Engineering Vol. 4, No. 3, June 2016
©2016 Journal of Automation and Control Engineering 195
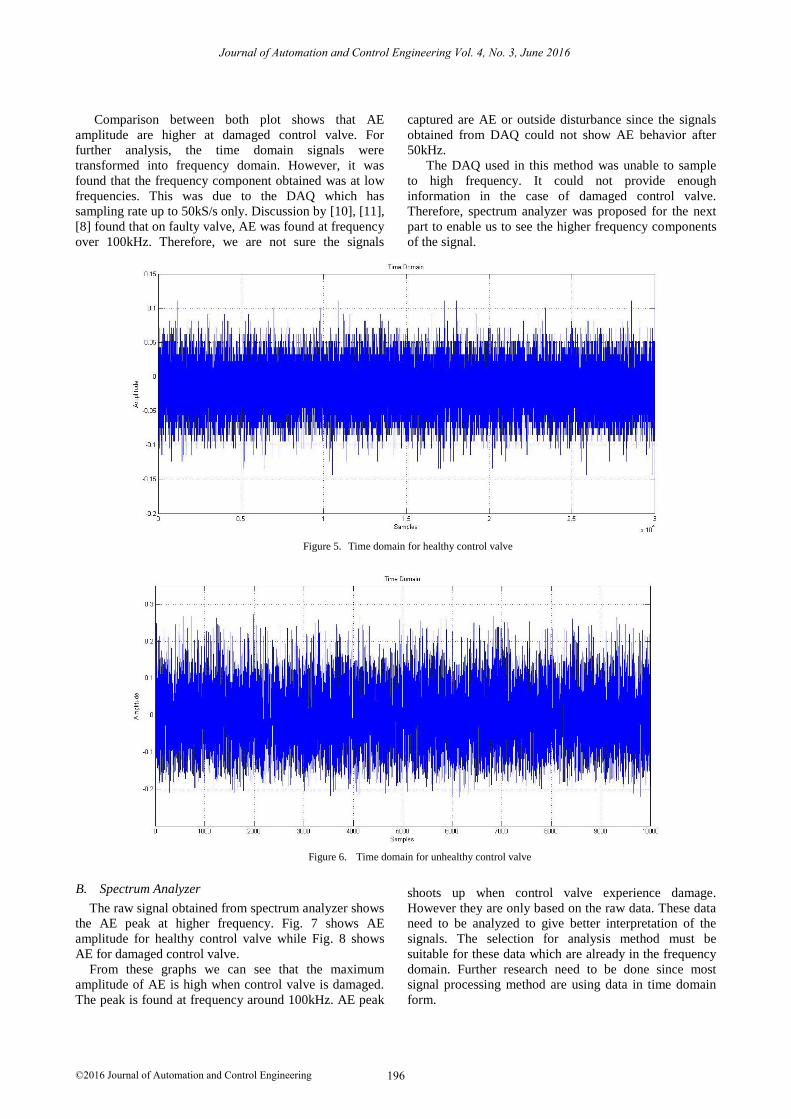
Comparison between both plot shows that AE
amplitude are higher at damaged control valve. For
further analysis, the time domain signals were
transformed into frequency domain. However, it was
found that the frequency component obtained was at low
frequencies. This was due to the DAQ which has
sampling rate up to 50kS/s only. Discussion by [10], [11],
[8] found that on faulty valve, AE was found at frequency
over 100kHz. Therefore, we are not sure the signals
captured are AE or outside disturbance since the signals
obtained from DAQ could not show AE behavior after
50kHz.
The DAQ used in this method was unable to sample
to high frequency. It could not provide enough
information in the case of damaged control valve.
Therefore, spectrum analyzer was proposed for the next
part to enable us to see the higher frequency components
of the signal.
Figure 5.
Time domain
for healthy control valve
Figure 6.
Time domain
for unhealthy control valve
B.
Spectrum Analyzer
The raw signal obtained from spectrum analyzer shows
the AE peak at higher frequency. Fig.
7 shows AE
amplitude for healthy control valve while Fig. 8 shows
AE for damaged control valve.
From these graphs we can see that the maximum
amplitude of AE is high when control valve is damaged.
The peak is found at frequency around 100kHz. AE peak
shoots up when control valve experience damage.
However they are only based on the raw data. These data
need to be analyzed to give better interpretation of the
signals. The selection for analysis method must be
suitable for these data which are already in the frequency
domain. Further research need to be done since most
signal processing method are using data in time domain
form.
Journal of Automation and Control Engineering Vol. 4, No. 3, June 2016
©2016 Journal of Automation and Control Engineering 196

Figure 7. Frequency spectrum of healthy control valve
Figure 8. Frequency spectrum of damaged control valve
IV. SUMMARY
This paper discuss about two methods done for
collecting AE data from control valve which is in good
condition and damaged control valve. It is found that the
DAQ used for this purpose was not suitable because the
specifications limit data to be sampled up to 50 kHz only.
DAQ with higher ability of sampling rate would be better
for future work. On the contrary, spectrum analyzer helps
us to view AE signal behaviour directly in frequency
domain even at high frequencies. However, the signal
shown was only raw data which need further analysis.
Frequency domain type of data is unfamiliar to renowned
signal processing method such as Fourier Transform and
Wavelet. The pro and con of these methods could be
taken into account for future work.
ACKNOWLEDGMENT
The authors wish to thank the ministry of higher
education and Universiti Pendidikan Sultan Idris for
funding the study. Special thanks to Electrical &
Electronic Department, Universiti Teknologi Petronas
staff for their guidance and cooperation.
REFERENCES
[1] N. Tandon and S. Mata, “Detection of defects in gears by acoustic
emission measurements,” J. Acoust. Emiss., vol. 17, no. 1-2, pp. 23-27, 1999.
[2] S. Husin, A. Addali, and D. MBA, “Acoustic emission for monitoring two-phase flow,” in Proc. 29th European Conference
on Acoustic Emission Testing, 2010.
[3] D. R. Hay, J. A. Cavaco, and V. A. S. I. L. Mustafa, “Monitoring the civil infrastructure with acoustic emission: Bridge case
studies,” J. Acoust. Emiss., vol. 27, pp. 1-10, 2009.
[4] A. Anastasopoulos, D. Kourousis, and K. Bollas, “Acoustic emission leak detection of liquid filled buried pipeline,” J. Acoust.
Emiss., vol. 27, pp. 27–39, 2009.
[5] P. Kalyanasundaram, C. K. Mukhopadhyay, and S. V. S. Rao, Practical Acoustic Emission, Alpha Science International Ltd.,
2007, p. 120.
[6] D. Mba, “Prognostic opportunities offered by acoustic emission for monitoring bearings and gearboxes,” in Proc. the 12th
International Congress on Sound and Vibration, 2005.
[7] R. K. Miller and P. McIntire, Nondestructive Testing Handbook, Acoustic Emission Testing, 2nd ed., vol. 5, no. 2. American
Society for Nondestructive Testing, Inc, 1987, p. 541.
[8] W. Kaewwaewnoi, A. Prateepasen, and P. Kaewtrakulpong, “Measurement of valve leakage rate using acoustic emission,” in
Proc. the 2nd International Conference on Electrical
Engineering/Electronics, Computer, Telecommunications and Information Technology, 2005, pp. 3-6.
Journal of Automation and Control Engineering Vol. 4, No. 3, June 2016
©2016 Journal of Automation and Control Engineering 197

[9] S. Husin, A. Addali, and D. MBA, “Acoustic emission for monitoring two-phase flow,” in Proc. 29th Eur. Conf. Acoust.
Emiss. Test., 2010, pp. 1–7.
[10] T. Tamutus and S. J. Ternowchek, “Valve leak quantification with acoustic emission,” NDT Tech., vol. 9, no. 2, pp. 1–5, 2010.
[11] C. J. Hellier, Handbook of Nondestructive Evaluation. McGraw-
Hill, 2003, p. 533.
Juwita Mad Juhani received her B. Eng. degree (Honours) in Electrical Engineering (Instrumentation and Control) and her M. Eng.
degree in Electrical Engineering (Mechatronics and Automatic Control)
from Universiti Teknologi Malaysia in 2009 and 2011, respectively. Currently, she is pursuing her PhD at Universiti Teknologi Petronas,
Malaysia.
Rosdiazli Ibrahim received his B. Eng. Degree (Honours) in
Electric/Computer from Universiti Pertanian Malaysia. His master was in Automation and Control from University of Newcaslte and PhD in
Electrical and Electronic Engineering from University of Glasgow. Currently he is an Associate Professor and Head of Electrical And
Electronic Department in Universiti Teknologi Petronas.
Intan Najiha Mohd Shukri received her B. Eng. Degree in Electric
and Electrical Engineering from Universiti Tun Hussein Onn, Malaysia. Currently she is pursuing her Master degree in Electric and Electronic
Engineering in Universiti Teknologi Petronas.
Journal of Automation and Control Engineering Vol. 4, No. 3, June 2016
©2016 Journal of Automation and Control Engineering 198