controlled release of isothiazoline biocides from industrial minerals
TRANSCRIPT

THE UNIVERSITY OF BIRMINGHAM
CONTROLLED RELEASE OF ISOTHIAZOLINE
BIOCIDES FROM INDUSTRIAL MINERALS
By
YAO KANGA
A thesis submitted to the
University of Birmingham
For the degree of
ENGINEERING DOCTORATE
School of Chemical Engineering College of Engineering University of Birmingham September 2010

University of Birmingham Research Archive
e-theses repository This unpublished thesis/dissertation is copyright of the author and/or third parties. The intellectual property rights of the author or third parties in respect of this work are as defined by The Copyright Designs and Patents Act 1988 or as modified by any successor legislation. Any use made of information contained in this thesis/dissertation must be in accordance with that legislation and must be properly acknowledged. Further distribution or reproduction in any format is prohibited without the permission of the copyright holder.

ABSTRACT
This project investigated how various minerals of different surface areas and morphologies
can be used to adsorb isothiazoline biocides for controlled-release and antimicrobial
purposes.
The absorption of the biocides on the mineral powders was achieved by way of using a bench
high shear mill (dry process), or combining them to hydrated minerals (wet process). The
characterisation of the minerals was achieved by XRF (chemical composition), XRD (crystal
composition), SEM (morphology), B.E.T nitrogen (surface area), and Light Scattering
(particle size distribution). HPLC was used to determine the concentration of the biocide in
solution, and the Flow Microcalorimeter used to measure the bond strength between the
biocide molecules and the minerals. The minerals were added to an exterior paint made
according to an Imerys in-house formulation. Various modifications of this initial coating
formulation were made in order to compare the biocide 2-Octyl-4-isothiazolin-3-one (OIT)
release profiles from impregnated and non-impregnated minerals.
Montmorillonite clay was the best performing mineral in all experiments (adsorption and
desorption both from the minerals and paints films, strength of bond analysis, and bioassay).
All other minerals tested carried the biocide with varying degree of success. Optical and
mechanical tests performed on paint films containing various minerals suggested there were
no significant differences between the films. Rheology tests demonstrated that newly
developed formulations were easy to apply to a surface.

ACKNOWLEDGEMENTS
I would like to thank my Lord Jesus Christ for all he has done for me during my time at
Imerys, in my numerous journeys around the country and elsewhere, and keeping my family
safe during all the years I was absent.
I want to express my gratitude to Dr. Richard Greenwood, Dr. Neil Rowson (School of
Chemical Engineering, University of Birmingham), to Dr. David Skuse, Mr. Jarrod Hart
(Imerys Minerals), to Dr. Maneesh Singh (DNV, Norway), and to Dr. Cesar Agra-Guittierez
for their enthusiasm, dedication and patient supervision.
Special acknowledgement is made to my wife Gill and my daughter Adjouah for their
encouragement, love and understanding during the years I was absent from home
I would like to thank EPSRC for the funding they provided for this project. Special thanks
also to all laboratory friends and colleagues and other EngD students for sharing important
intellectual discussions. Last but not least to Dr. Roy Goodman for his help with the sodium
silicate work, Isobelle Oulton for her help on the HPLC and the setting up of the
Microbiology experiments, Michele Henry and all those in the paint laboratory who help
with all aspects of the paint work.
Yao Kanga Watford,Hertfordshire, September 2010

i
LIST OF CONTENTS
ABSTRACT ................................................................................................................... 2
ACKNOWLEDGEMENTS ........................................................................................... 3
LIST OF CONTENTS ................................................................................................... I
FIGURE INDEX .......................................................................................................... IV
LIST OF TABLES .................................................................................................... VIII
LIST OF TERMS ......................................................................................................... IX
1 CHAPTER ONE – INTRODUCTION .................................................................. 1
1.1 Imerys Minerals ............................................................................................. 2 1.1.1 History and Development .................................................................................... 2 1.1.2 Group development from 2000 to 2010 .............................................................. 3 1.1.3 Group development by activity ........................................................................... 3
1.2 Company market size ..................................................................................... 6 1.2.1 Minerals for Ceramics, Refractories, Abrasives & Foundry .................................. 7 1.2.2 Performance & Filtration Minerals ...................................................................... 7 1.2.3 Pigments for Paper .............................................................................................. 8 1.2.4 Materials & Monolithics ....................................................................................... 9
1.3 Overview of clay processing technologies at Imerys .................................. 10 1.3.1 Steps in hydrous process flow at Sandersville, Georgia, USA ............................ 11 1.3.2 Steps in calcined process flow at Sandersville, Georgia, USA ............................ 13
1.4 Overview and objectives of the project ....................................................... 14
2 CHAPTER TWO – LITERATURE SURVEY .................................................... 23
2.1 Introduction .................................................................................................. 24 2.1.1 Overview of controlled release technologies .................................................... 24 2.1.2 Overview of drug release mechanisms from polymeric devices ........................ 26 2.1.3 Diffusion controlled release from non-‐degradable systems .............................. 26 2.1.4 Solvent activation controlled release ................................................................. 29 2.1.5 Biodegradable systems ...................................................................................... 30 2.1.6 Empirical equation for describing drug release ................................................. 33
2.2 Introduction to mechanisms involved in bacterial colonisation (fouling) of surfaces in the paint industry ....................................................................... 33 2.3 Biocides in the coating industry ................................................................... 35 2.4 Roles of Minerals ......................................................................................... 38 2.5 Biocides and minerals in antifouling coatings ............................................. 38

ii
3 CHAPTER THREE – MINERAL CHARACTERISATION .............................. 43
3.1 Introduction .................................................................................................. 44 3.2 Minerals used and characterisation methods ............................................... 44
3.2.1 Crystallography analysis by XRD method ........................................................... 46 3.2.2 Chemical composition analysis by X-‐ray fluorescence method ......................... 47 3.2.3 Powders’ morphology detection by Scanning Electron Microscopy (SEM) ....... 48 3.2.4 Particle size analysis by Light Scattering (using the Malvern Mastersizer) ........ 50 3.2.5 Surface area measurement by B.E.T. (Brunauer Emmett and Teller) 52
3.3 Biocide selection and measurement ............................................................. 55 3.3.1 Biocide selection ................................................................................................ 55 3.3.2 Degradation of isothiazolines ............................................................................ 57 3.3.3 Concentration measurement by HPLC ............................................................... 59 3.3.4 Concentration measurement by UV-‐Vis ............................................................ 61
3.4 Strength of biocide adsorption onto minerals .............................................. 67 3.4.1 General principles of Flow Microcalorimetry (FMC) .......................................... 67 3.4.2 Possible FMC results .......................................................................................... 68
4 CHAPTER FOUR – RESULTS OF MINERAL CHARACTERISATION ........ 69
4.1 Mineral characterisation studies .................................................................. 70 4.2 Mineral size distribution analysis by the Mastersizer .................................. 70
4.2.1 Materials and Methods ...................................................................................... 74 4.2.2 Results ................................................................................................................ 75
4.3 Mineral characterisation by X-ray Fluorescence (XRF) .............................. 79 4.3.1 Materials and Method ....................................................................................... 79 4.3.2 Results ................................................................................................................ 80
4.4 Material characterisation by X-ray Diffraction (XRD) ............................... 84 4.4.1 Material and method ......................................................................................... 84 4.4.2 Results ................................................................................................................ 84
4.5 Morphology assessment by Scanning Electron Microscopy (SEM) ........... 86 4.5.1 Material and method ......................................................................................... 87 4.5.2 Results ................................................................................................................ 88
4.6 Discussion .................................................................................................... 90
5 CHAPTER FIVE – ADSORPTION ISOTHERM STUDIES ............................. 95
5.1 Flow Microcalorimetry (FMC) .................................................................... 96 5.1.1 Materials and Methods ...................................................................................... 96 5.1.2 Results ................................................................................................................ 98
5.2 Adsorption Isotherms ................................................................................. 103 5.2.1 Material and Method ....................................................................................... 103 5.2.2 HPLC settings ................................................................................................... 104 5.2.3 Methods of adsorption .................................................................................... 105 5.2.4 Adsorption isotherm studies ............................................................................ 106 5.2.5 Results for OIT Adsorption on the selected minerals ...................................... 109 5.2.6 Adsorption of CIT/MIT on carriers ................................................................... 113
5.3 Discussion .................................................................................................. 120

iii
6 CHAPTER SIX – OIT DESORPTION STUDIES ............................................ 123
6.1 Materials and Methods ............................................................................... 124 6.1.1 Typical paint formulation ................................................................................. 125 6.1.2 Method of desorption measurement .............................................................. 126
6.2 Results of the desorption experiments ....................................................... 128 6.3 Discussion .................................................................................................. 135
7 CHAPTER SEVEN – BIOASSAY STUDIES .................................................. 139
7.1 Materials and Methods ............................................................................... 140 7.1.1 Biocide adsorption onto the minerals .............................................................. 140 7.1.2 Paint preparation ............................................................................................. 142 7.1.3 “Renault”, or paint ageing test ........................................................................ 142 7.1.4 Bioassay (OIT potency test) .............................................................................. 143 7.1.5 Determination of OIT loading of paint films .................................................... 146
7.2 Results ........................................................................................................ 146 7.3 Discussion .................................................................................................. 159
8 CHAPTER EIGHT – INDUSTRIAL PERCEPTIVE OF THE PROJECT ....... 162
8.1 Industrial aims of the project ..................................................................... 163 8.2 Technology used ........................................................................................ 164
8.2.1 Mineral “impregnation” of biocide .................................................................. 164 8.2.2 Paint making and ageing test ........................................................................... 166 8.2.3 Bioassay measurements .................................................................................. 166
8.3 Paint mechanical and optical test measurements ....................................... 167 8.3.1 Colour measurement (The CIE “Lab” and XYZ Colour Space) .......................... 167 8.3.2 Gloss Measurement ......................................................................................... 171 8.3.3 Contrast Ratio (Opacity) Measurement ........................................................... 175 8.3.4 Scrub Resistance .............................................................................................. 178 8.3.5 Stain Resistance ............................................................................................... 181 8.3.6 Rheology tests .................................................................................................. 183
8.4 Conclusion ................................................................................................. 188
9 CHAPTER NINE – CONCLUSION AND FUTURE WORK .......................... 190
10 REFERENCES .................................................................................................. 197
11 APPENDICES ................................................................................................... 205
12 CONFERENCES ATTENDED AND PAPERS PUBLISHED ........................ 223

iv
FIGURE INDEX
Figure 1.1: 2009 sales by business group (in Billions of Euro) ................................................. 9
Figure 1.2: Hydrous process flow at Imerys Georgia, USA (courtesy of Imerys Minerals) ... 11
Figure 1.3: Calcined process flow (paper grade) at Imerys Georgia, USA (courtesy of Imerys Minerals) .......................................................................................................................... 13
Figure 1.4: Some extenders used in the Coating Market (courtesy of Imerys Minerals) ........ 16
Figure 1.5: Percentages of extenders used in the coating industry in Western Europe (Adapted from Kline: 2003, Western Europe - All Coatings) ......................................................... 17
Figure 1.6: Current levels of biocide loading in coatings. ....................................................... 21
Figure 2.1: Drug release from a reservoir device (nanocapsule) ............................................. 27
Figure 2.2: Examples of heavily fouled hulls [48] .................................................................. 35
Figure 2.4: Biocides used in this study: OIT in A, and the blend of MIT and CIT, respectively in B and C (with a methyl CH3 attached to the nitrogen on B and C) ............................. 38
Figure 2.5: Functional groups present on the surface of porous, amorphous silica [86] ......... 40
Figure 2.6: Representation of porous silica, with possible pathway for biocide release ......... 40
Figure 2.7: Representation of a Halloysite mineral with pathway of intercalated biocides .... 41
Figure 2.8: Possible pathway for the release of the isothiazoline biocides in the platy minerals, with (A) small and (B) larger particle size ....................................................... 41
Figure 3.1: Particle size measurement as used in Malvern instruments [87] ........................... 51
Figure 3.2: Typical particle size distribution curve [88] .......................................................... 52
Figure 3.3: Biocides used in this study: (OIT), (CIT) and (MIT) respectively in A, B and C (with a methyl CH3 attached to the nitrogen on B and C) ............................................... 55
Figure 3.4: Thiol degradation of isothiazoline biocides [89]. ................................................. 58

v
Figure 3.5: Sites of action of isothiazoline biocides in the Krebs cycle [89] .......................... 59
Figure 3.8: Schematic of a double beam UV-Vis Spectrometer equipment [91] .................... 63
Figure 3.9: CIT/MIT calibration curve obtained from the UV-Vis spectrometer ................... 65
Figure 3.10: OIT calibration curve obtained from the UV-Vis spectrometer .......................... 66
Figure 4.1: Frequency diagram for a broad and narrow particle size distribution [courtesy of Imerys]. 71
Figure 4.2: Cumulative (integrated) version of Figure 4.1, showing the % passing (i.e. below) any particular diameter. In this form the “narrow” distribution is called “steep” [courtesy of Imerys]. 72
Figure 4.3: The diameter of a circle with the same area as a 2-D projection of a particle may be a useful estimate of its size 73
Figure 4.4: Volume distribution of the platy minerals 75
Figure 4.5: Volume distribution of the non-platy minerals 76
Figure 4.6: Structure of a kaolinite layer [93] 83
Figure 9.7: Proposed intercalation of compounds into a platy clay (done here via an anion exchange [82]. 196
Figure 5.1: Schematic of FMC with Polytetrafluoroethylene (PTFE) fluid path [61] ............. 97
Figure 5.2: Energies of adsorption and desorption of OIT per gram of minerals used in the FMC under flow conditions. ............................................................................................ 99
Figure 5.3: Amount of OIT adsorbed and desorbed per gram of minerals used in the FMC under flow conditions .................................................................................................... 100
Figure 5.4: Calibration curve of OIT biocide of known concentrations obtained from the HPLC ............................................................................................................................. 105
Figure 5.5: Langmuir system of isotherm classification [96-97]. .......................................... 108
Figure 5. 6: OIT adsorption of the 4 platy clays used in the experiment: Infilm 939, Suprex, MCBP and NPD ............................................................................................................. 110

vi
Figure 5.7: New Zealand halloysite adsorption of OIT ......................................................... 111
Figure 5.8: Silica - Carplex CS-5 adsorption of OIT ............................................................. 112
Figure 5. 9: CIT/MIT adsorption of the 4 platy clays used in this experiment: Infilm 939, Suprex, MCBP, and NPD 16-A ..................................................................................... 114
Figure 5.10: New Zealand halloysite adsorption of CIT/MIT ............................................... 116
Figure 5.11: Silica - Carplex CS-5 adsorption of CIT/MIT ................................................... 116
Figure 6.1: OIT release profile from adsorbed (◊) and non-adsorbed (�) OIT to Calcium Silicate T-38 ................................................................................................................... 129
Figure 6.2: OIT release from adsorbed (◊) and non-adsorbed (�) OIT to diatomaceous earth celtix ............................................................................................................................... 130
Figure 6.3: OIT release profile from adsorbed (◊) and non-adsorbed (Δ) OIT to the silica carplex ............................................................................................................................ 131
Figure 6.4: OIT release profiles from adsorbed (◊) and non-adsorbed (Δ) OIT to the kaolin clay supreme .................................................................................................................. 132
Figure 6.5: OIT desorption profiles from paint films with adsorbed (◊) and non-adsorbed OIT (Δ) to montmorillonite clay MCBP ............................................................................... 133
Figure 7.1: A typical bacteria growth curve. The lag phase can be longer for different organisms [98] ............................................................................................................... 144
Figure 7.2: Pseudomonas Aeruginosa growth curve, as observed in laboratory experiments ........................................................................................................................................ 146
Figure 7.3: Cetrimide agar plate showing pseudomonas aeruginosa colony forming units (in green) after 48 hours incubation period ......................................................................... 147
Figure 7.4: OIT calibration to determine the volume of biocide needed to inhibit or limit the growth of the organism .................................................................................................. 148
Figure 7.5: Pseudomonas colonies formation on paint films containing the kaolin, and subjected to artificial degradation in the QUV over a 1500 hours period ..................... 149
Figure 7.6: Pseudomonas colonies formation on paint films with silica carplex, subjected to

vii
artificial degradation in the QUV over a 1500 hours period ......................................... 151
Figure 7.7: Pseudomonas colonies formation on paint films with montmorillonite MCBP, subjected to artificial degradation in the QUV over a 1500 hours period ..................... 152
Figure 7.8: Percentage of OIT left in the paint films containing kaolin supreme throughout the ageing process .......................................................................................................... 155
Figure 7.9: Percentage of OIT left in the paint films containing silica carplex throughout the ageing process ................................................................................................................ 156
Figure 7.10: Percentage of OIT left in the paint films containing montmorillonite MCBP throughout the ageing process ....................................................................................... 157
Figure 8.1: Yxy chromaticities in the CIE colour space [99] ................................................ 169
Figure 8.2: L*a*b* colour space [100] .................................................................................. 170
Figure 8.3: 45 and 20 degrees gloss measurements by the Gardner Gloss meter [101] ........ 175
Figure 8.4: A Morest black and white chart .......................................................................... 176

viii
LIST OF TABLES
Table 3.1: General characteristics of minerals used in this study ............................................ 45
Table 3.1: Environmental input parameters of isothiazoline biocides and TBT (Source, World Health Organisation, 1990) .............................................................................................. 57
Table 4.1: Size distribution and steepness factors of the minerals used. ................................. 77
Table 4.2: XRF data detailing the percentage of the chemical composition of the nine minerals used ................................................................................................................... 81
Table 4.3: XRD data showing percentage of various crystals present in each of the nine minerals used in this study ............................................................................................... 85
Table 4.5: Major differences between a 1:1 and a 2:1 clay ..................................................... 93
Table 5.1: Summary of the ratios of heat of sorption (with molar heat of interaction) and amounts of OIT after the FMC run ................................................................................ 101
Table 5.2: Saturation levels and molecular footprints of the biocides on the minerals biocides used. This saturation level of CIT/MIT on this mineral is listed in Table 5-2, together with the corresponding molecular footprints of the biocide onto the Silica. ................. 117
biocides used. This saturation level of CIT/MIT on this mineral is listed in Table 5-2, together with the corresponding molecular footprints of the biocide onto the Silica. ... 118
Table 6.1: Amount of OIT in dried films on Leneta discs ..................................................... 127
Table 6.2: Percentages of biocide still remaining in the paint films after the desorption experiment (MCBP / OIT) still retained more than 40% of its biocide content after seven days. ............................................................................................................................... 134
(MCBP / OIT) still retained more than 40% of its biocide content after seven days. ........... 135
Table 7.1: Composition of powder-OIT preparation for use in the paint film. ..................... 141
Table 7.2: Number of pseudomonas colony forming units (x 105) recorded after paint ageing test in the QUV (at specific times) ................................................................................. 153
Table 7.3: Percentage of OIT left in the paint films after 1500 hours ageing test ................. 158
Table 8.1: Summary of L*A*B*, Gloss and Opacity data of the paint films made .............. 177
Table 8.2: Weight loss after 200 scrub cycles ....................................................................... 180
Table 8.3: Stain resistance of the paints made ....................................................................... 182
Table 8.4: Viscosity data of the paint (Viscosity readings in Poise) ..................................... 185

ix
Table 8.5: Viscosity measurement data of the paints made, using the Stormer Krebs, the Roto-Thinner and the Sheen and Cone viscometers (Viscosity readings in Poise) ....... 188
LIST OF TERMS
Å Angstrom
Al2O3 Aluminium Oxide
APS Aminopropyltrimethoxysilane
ATP Adenosine Triphosphate
B.E.T Brunauer – Emmett - Teller
BS British Standard
C.I.E Commission Internationale d’Eclairage
CaCO3 Calcium Carbonate
CaO Calcium Oxide
CFU Colony Forming Unit
CH3 Methyl
CIT 5-Chloro-2-methyl-4-isothiazolin-3-one
DETA Diaethylenetriamine
dF Ferret Diameter
ESD Equivalent Spherical Diameter
EU European Union
FAD Flavin Adenine Dinucleotide
Fc Flow rate
Fe2O3 Iron Oxide
FMC Flow Microcalorimetry

x
GC Gas Chromatography
GCC Ground Calcium Carbonate
HPLC High Performance Liquid Chromatogaphy
ID Internal diameter
IMO International Maritime Organisation
K2O Potassium Oxide
Kd Distribution coefficient
KJ Kilojoules
Kvolts Kilovolts
LOI Loss of Ignition
MCBP Mineral Colloid BP
MEPC Maritime Environmental Protection Committee
Mg2+ Magnesium
MgO Magnesium Oxide
MHI Molar Heat of Interaction
MIC Minimum Inhibitory Concentration
MIT 2-Methyl-4-isothiazolin-3-one
Mpa Mega Pascal
Mwt Molecular Weight
Na2O Sodium Oxide
Na2SO3 Sodium Sulfite
NAD Nicotinamide Adenine Dinucleotide
Ne/He Neon / Helium
NPD New Product Development
NZH New Zealand Halloysite
oC Degree Celcius

xi
OIT 2-Octyl-4-isothiazolin-3-one
PCC Precipitated Calcium Carbonate
PMGI Performance Minerals Growth Initiative
Po Initial Light Power
Ps Source Light Power
PSD Particle Size Distribution
PTFE Polytetrafluoethylene
Rpm Revolution per minute
S.A Surface Area
SEM Scanning Electron Microscopy
SiO2 Silicon Dioxide
SL Saturation Level (of biocide)
Stdvev Standard Deviation
TBT Tributyltin
TBT-SPC Tributyltin Self-Polishing Copolymer
TiO2 Titanium Dioxide
Tr Retention time
UV-Vis Ultra Violet / Visible
V Volume
V/V Volume per Volume
Vr Retention volume
W/V Weight per Volume
Wt% Weight per cent
XRD X-ray Diffraction
XRF X-ray reflectance
ελ Molar Extension Coefficient

xii
θi Incident Ray
θr Reflected Ray
λ Wavelength
ρf Density of fuid
ρp Density of particle

CHAPTER ONE
INTRODUCTION
1 Chapter One – Introduction
Chapter 1 Introduction
2
1.1 Imerys Minerals
1.1.1 History and Development
Established in 1880, the Imerys group had its origin in mining and metallurgy, with its core
business in the extraction and processing of non-ferrous metals. In 1974, under the name of
Imetal, the group acquired the French company Huguenot Fenal, hence getting an entry into
the clay roof tile market. A year later, the group acquired Copperweld (USA), a company
specialising in steel production and metal processing, followed in 1985 by Damrec (France),
marking a significant investment in refractories and ceramics. The group’s business was then
structured around three sectors: Building Materials, Industrial Minerals and Metals
Processing.
From 1990 onwards, the Group focused its development on Industrial Minerals and
implemented an ambitious acquisitions policy. Imetal established strong positions in white
pigments, first in kaolins (Dry Branch Kaolin Company, United States) then in calcium
carbonates (Georgia Marble, United States). It then entered the graphite market (Timcal,
Switzerland; Stratmin Graphite, Canada). The Group also expanded through acquisitions in
refractories (C-E Minerals, United States; Plibrico, Luxembourg), clays (Cératéra, France),
ceramic bodies (KPCL, France) and technical ceramics (Refral, France; Lomba and
Cedonosa, Spain).
Between 1994 and 1998, Imetal doubled in size, one-third by organic growth and two-thirds
by external growth. In 1998, the business was structured around two sectors (Minerals

Chapter 1 Introduction
3
Processing, Metals Processing) with an operating division-based organisation. The
acquisition, in 1999, of English China Clay (ECC), one of the world’s foremost specialists in
industrial minerals, helped the company to become a global leader in this sector and focussed
exclusively on Minerals Processing. Imetal then divested its Metals Processing activity,
comprised of the North American companies Copperweld and Copperweld Canada (world
leader in bimetallic wires, American leader in specialty tubing), and changed its name to
Imerys on September 22, 1999, to reflect that development.
1.1.2 Group development from 2000 to 2010
The Group completed the refocusing process by withdrawing from activities that no longer
corresponded to its core business, including dimension stones (Georgia, USA) and trading.
The specialty chemicals distribution business (CDM AB, Sweden) was divested in 2004,
followed in 2005 by trading in mainly basic refractories (American Minerals, Inc, USA) and
roofing products distribution (Larivière, France).
Since 2000, the Group has developed by leveraging its unique know-how. From a varied
portfolio of rare resources, Imerys turns industrial minerals into specialties with high added
value for its customers. Organised into business groups that correspond to its main markets,
the Group is constantly broadening its product range, extending its geographic network into
high-growth zones and taking up positions on new markets.
1.1.3 Group development by activity
The Minerals for Refractories activity expanded its offering for the refractory and
sanitaryware markets and enhanced its global geographic network with the acquisition of

Chapter 1 Introduction
4
AGS (2006 – France) and Vatutinsky (2007 – Ukraine), both companies specializing in
calcined clays. The purchase of a 65% stake in Yilong (Xinjiang) in April 2007 gave Imerys
access to an excellent quality andalusite reserve developed to serve the Chinese refractories
market.
The Minerals for Abrasives activity was created in 2000 with the takeover of the world’s
leading producer of corundum (fused alumina and bauxite), the Treibacher Schleifmittel
group (Austria). A succession of corundum acquisitions were made in the Czech Republic,
Germany (2001), Brazil (2002) and China, where a third joint venture was created in 2007
with ZAF, a producer of brown corundum for the Asian abrasives market. In 2007, Imerys
added zircon to its portfolio. The Group became the world leader in this mineral - used in the
refractories, technical ceramics and automotive sectors - with the successive acquisitions of
UCM Group PLC (Great Britain), and Astron China (completed on February 5th, 2008). The
Minerals for Abrasives division was renamed Fused Minerals.
Minerals for Filtration joined the Group in 2005 with the acquisition of the world leader in
the sector, World Minerals (United States). This acquisition contributed new minerals
(diatomite and perlite), while following a model that is consistent with Imerys’ business and
skills. Perlite capacities were bolstered in South America in 2007 with the consolidation of
Perfiltra (Argentina). With the acquisition in April 2007 of 65% of Xinlong (Xinjiang),
China’s leading vermiculite producer, Imerys is now the world number two in vermiculite.
New Minerals for Ceramics were added to the portfolio, particularly halloysite (New
Zealand China Clays, New Zealand - 2000) and fine ceramic clays and feldspar (K-T, United

Chapter 1 Introduction
5
States and Mexico – 2001; Denain-Anzin Minéraux, Europe - 2005). The Group increased its
Asian market presence for applications that mainly serve the sanitaryware industry (MRD-
ECC and MRD, Thailand – 2002). In 2007 it developed its reserves of feldspar, an essential
component in ceramics manufacturing alongside clays and kaolins, in India (Jumbo Mining),
the United States (The Feldspar Corporation) and Turkey.
Performance Minerals developed with the extension of calcium carbonate capacities in
Central and South America (Quimbarra, chiefly Brazil – 2000), Asia (Honaik, mainly in
Malaysia – 2000) and France (AGS-BMP’s carbonates activities – 2000). The Group
strengthened its positions in Southern Europe (Gran Bianco Carrara, Italy and Blancs
Minéraux de Tunisie, Tunisia – 2005) and Turkey (70% stake in Mikro Mineral – 2006).
In Pigments for Paper, development focused on ground (GCC) and precipitated (PCC)
calcium carbonates, which now account for more than half the Group’s sales to the paper
industry. Six new production units have been built since 2004, mainly in the Asia-Pacific
zone to support the development of local activities, extensive reserves of high quality white
marble (GCC) have been acquired in China in recent years. In parallel, an important
restructuring plan of its kaolin for paper production announced at mid-2006, enables the
Group to have the most competitive platform for both coating and filler kaolins for the paper
industry
The Group’s Building Materials was strengthened in bricks in France with the acquisition of
Marcel Rivereau (2004) and, in 2007, a development plan launched in clay bricks to meet
high market demand. Clay roof tiles and bricks activities in Spain and Portugal were divested
Chapter 1 Introduction
6
in 2007.
In Refractory Solutions, the acquisition of Lafarge Refractories (2005) made Imerys the
European leader in the sector and gave it a foothold in Asia. The merger of this activity with
Imerys’ existing businesses in the sector (Plibrico) led to the creation of a new entity,
Calderys. ACE, the Indian leader in monolithic refractories, joined the Group in 2007, giving
it a new dimension in this fast-growing country and consolidating Imerys’ world leadership
in monolithic refractories. In 2007, Calderys also developed in South Africa with the
acquisition of B&B, a refractory product fitter for the local steel industry. Moreover, Imerys
has gained leadership in refractory Kiln Furniture in both Asia (Siam Refractory Industry Co,
Ltd, Thailand – 2002) and Europe (Burton Apta, Hungary – 2004).
The diversity and geographical scope of Imerys’ business have led the company to adopt a
decentralised operating management system. Since February 13, 2008, Imerys has
reorganised its activities into four business groups.
• Minerals for Ceramics, Refractories, Abrasives and Foundry
• Performance Minerals and Filtration
• Pigments for Paper
• Materials and Monolithics
1.2 Company market size
Active in 47 countries with more than 260 locations, Imerys is the world leader in adding
value to minerals. It achieved €2.774 billion in annual sales in 2009. The company’s global
market size is arranged according to the four business groups detailed in the 4 subsections

Chapter 1 Introduction
7
below (from 1.2.1 to 1.2.4).
1.2.1 Minerals for Ceramics, Refractories, Abrasives & Foundry
This business group has a wide range of extensive, high-quality mineral reserves thanks to its
four activities. With expertise in all the techniques needed for transformation, it also offers a
diverse range of products that meet the specific requirements of the industries it serves,
especially in terms of chemical composition, mechanical properties, thermal and chemical
resistance.
Market positions (as of 2010):
• European number 1 in raw materials and ceramic bodies for porcelain
• World number 1 in fused Zirconia
• World number 1 in minerals for refractory applications
• World number 1 in minerals for abrasives
• World number 1 in high performance graphite powders
1.2.2 Performance & Filtration Minerals
The group is made up of the Performance Minerals and Filtration Minerals Group's activities.
The Performance Minerals activity provides customers with tailor-made solutions in a highly
technical field, based on the processing of kaolins, carbonates, feldspar, mica and ball clays.
The development of partnerships with customers is essential within the value-added markets
of performance minerals comprising plastics, rubber, coatings, adhesives, caulks and sealants,

Chapter 1 Introduction
8
health, beauty & nutrition and building & construction materials.
The Filtration Minerals activity is the world's leading supplier of diatomite and expanded
perlite-based products for filtration. Vermiculite has been complementing the Filtration
Minerals portfolio in 2006. The activity has also been strengthened during 2007 with the
acquisitions of Perfiltra (perlite) and Xinlong (Vermiculite), both mentioned in section 1.1.3.
Market positions (as of 2010):
• World number 1 in minerals for breathable polymer films
• World number 1 in Mica for engineered plastics and high performance coatings
• World number 1 in perlite-based products for filtration
1.2.3 Pigments for Paper
This comprised the Group's activities in kaolin and calcium carbonates (natural and
precipitated) for the paper industry. Its structure is designed to serve the needs of the
changing global paper market. Pigments for Paper supply more than 350 paper mills, 26% of
which are in North America, 45% in Europe and 29% in the rest of the world, mainly Asia-
Pacific, the region driving growth in the paper industry.
Market positions (as of 2010):
• World number 1 in kaolin for paper
• World number 2 in ground calcium carbonate (GCC) for paper
• World number 3 in precipitated calcium carbonate (PCC) for paper

Chapter 1 Introduction
9
1.2.4 Materials & Monolithics
The group gathers the Building Materials and Refractory Solutions Group's activities. It has
strong market positions that it continues to develop through substantial capital expenditure
and an active innovation policy.
Market positions (as of 2010):
• French number 1 in clay roof tiles, bricks, chimney blocks and natural slates
• World number 1 in alumino-silicate monolithic refractories
• World number 1 in kiln furniture for ceramic applications
Imerys’ total sales for the year 2009 were 2.774 billion Euros, with contributions from the
four main business groups (this is detailed in Figure 1.1 below).
Figure 1.1: 2009 sales by business group (in Billions of Euro)
0.78
0.860.50
0.64
Materials andMonolithics
Minerals for Ceramics,Refractories, Abrasivesand Foundry
Pigment for Paper
Performance andFiltration Minerals

Chapter 1 Introduction
10
1.3 Overview of clay processing technologies at Imerys
From Mining to the finished products (according to customer specifications), the company
utilises two main processing routes in order to refine its clays: hydrous and calcined process
flow. There are many steps involved with each of these processes and they are detailed in
Figures 1.2 and 1.3.

Chapter 1 Introduction
11
1.3.1 Steps in hydrous process flow at Sandersville, Georgia, USA
Figure 1.2: Hydrous process flow at Imerys Georgia, USA (courtesy of Imerys Minerals)
In the hydrous process, the clay is first mixed with water and chemical dispersant. This is
then followed by the beneficiation process, consisting of:

Chapter 1 Introduction
12
• The degritting, to remove most impurities from the clay
• The selective flocculation (particles aggregating and settling/flocculating) and
ozonisation (water treatment to destroy micro-organisms), to increase the brightness
of the clay by further removing more impurities from the mineral
• The centrifugation process, designed to separate the fine particles from the coarse
ones (coarse particles are ground in the sand grinder to delaminate them)
• Magnetic separation, which removes magnetic iron and paramagnetic titania from
the clay (this will increase the optical property of the final product)
• The leaching process, aimed at chemically reducing the remaining iron into a water
soluble and non-discolouring form
• The filtration, which raises the solid level by dewatering the sample, and removing
processing salts and water soluble iron
• The spray drying, which produces the dry powder

Chapter 1 Introduction
13
1.3.2 Steps in calcined process flow at Sandersville, Georgia, USA
Figure 1.3: Calcined process flow (paper grade) at Imerys Georgia, USA (courtesy of Imerys
Minerals)
In the calcined process, the clay is first mixed with water and chemical dispersant. This is

Chapter 1 Introduction
14
followed by the beneficiation process, consisting of:
• The degriting, to remove most impurities from the clay
• A two-stage centrifugation process, using Bird and Merco industrial centrifuges, to
separate the fine particles from the coarse ones
• Spray drying, which produces the dry powder
• Calcination process, where the clay is heated to 1093oC. This process will eliminate
all (or most) impurities That remained in the clay and produce large aggregates
• The milling process, where the large aggregates are reduced to smaller desirable size
in the ball mill, ready for use
1.4 Overview and objectives of the project
As stated previously, Imerys possess large reserves of various clays and calcium carbonate.
Those minerals, when processed, are mostly used in the paper, paint, plastic and rubber
industries as functional fillers and rheology enhancers. The Performance Minerals Growth
Initiative (PMGI) group was created in 2003 as part of the Speciality Minerals Division, and
symbolised the company’s eagerness to develop new products in order to maximise its
growth.
This project aims to explore ways by which minerals produced by the company can be used
to adsorb and release some biocides in a controlled way in paint films. There are currently
high levels of biocide loaded and released from applications such as paints and antimicrobial
packaging (see Figure 1.4), and this adds to manufacturing costs, is damaging to non-target
organisms in the environment in which these biocides are released. Biocides are also used in

Chapter 1 Introduction
15
clay slurry tanks by Imerys to control the growth of micro-organisms. It is hoped that the
proposed method to control the release of biocides from minerals could help Imerys develop
and sell a new generation of minerals suitable for this purpose, and ultimately reduce the
amounts of biocide in usage.
Some of the minerals chosen for this work represented a generation of extenders, sold by
Imerys, and used in paints. Generally, most extenders will be mineral compounds:
• having a relatively low refractive index (1.4 - 1.7)
• that are insoluble in the paint media
Typical cost of these extenders varies between €60 to €800 per tonne (this compared with
Titania at €2200 a tonne). A few of those extenders are shown in Figure 1.4.
Chapter 1 Introduction
16
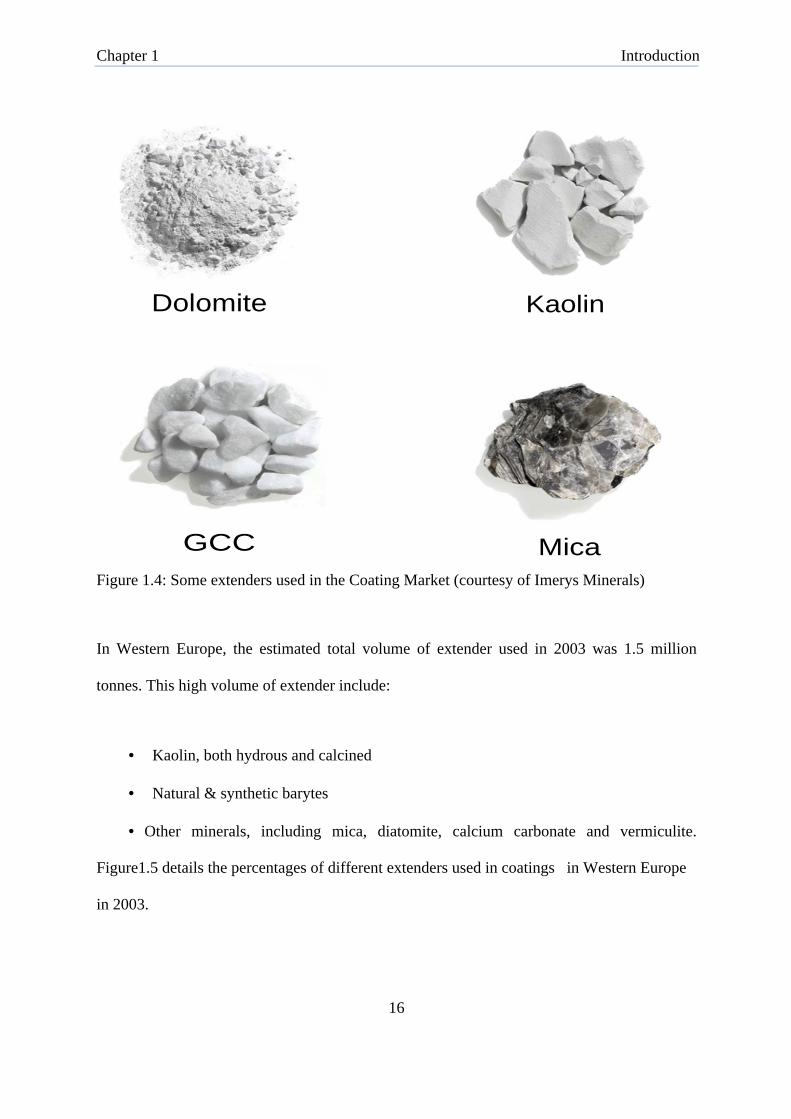
Figure 1.4: Some extenders used in the Coating Market (courtesy of Imerys Minerals)
In Western Europe, the estimated total volume of extender used in 2003 was 1.5 million
tonnes. This high volume of extender include:
• Kaolin, both hydrous and calcined
• Natural & synthetic barytes
• Other minerals, including mica, diatomite, calcium carbonate and vermiculite.
Figure1.5 details the percentages of different extenders used in coatings in Western Europe
in 2003.
Dolomite
Kaolin
GCC
Mica

Chapter 1 Introduction
17
Processes Calcium
Carbonate5.2%
Others2.1%
Talc10.5%
Barytes6.8%
Kaolin11.3%
Calcium Carbonate
64.1%
Figure 1.5: Percentages of extenders used in the coating industry in Western Europe (Adapted
from Kline: 2003, Western Europe - All Coatings)
Imerys Minerals is already present in this market with a large variety of mineral extenders
sold to the paint and paper industries. Ground and precipitated calcium carbonates and kaolin
account for 80% of the total extenders used in Western Europe, and the company is hoping to
develop new products in order to maintain and build their global market position.
Nine minerals were initially chosen for this work, and they were:
• Four Kaolins (Infilm 939, Supreme, Suprex, and NPD-16A). These minerals were
chosen because they are relatively inexpensive, produced by Imerys, and generally
used in the paper and paint industries as functional fillers

Chapter 1 Introduction
18
• A montmorillonite (MCBP), used because it is expandable upon hydration, thus
opening up the plates and increasing the available surface area for biocide
adsorption.
• A halloysite (New Zealand Halloysite). The halloysite was used because of its
tubular shape, which has already been tried by Imerys New Zealand in controlled
release experiments.[1-2]
• A calcium silicate (T-38) produced and sold by World Minerals, a subsidiary of
Imerys Minerals, and used for filtration.
• A diatomaceous earth mineral (Celtix), also produced by World Minerals and used
for filtration.
• An amorphous silica (Carplex CS-5) from Degusa, Japan. This mineral was chosen
due to its high porosity, and is already used as a chelator agent in breweries, to
remove unwanted compounds in beer filtration.
In addition to the industrial functions mentioned, these minerals were selected because of
differences in their surface areas, chemical compositions, crystal arrangements, and shapes
(described in Table 3-1). It was believed those differences could be exploited for controlled
release purposes.
In order to investigate the controlled release potentials of these minerals, it was decided to
impregnate them with two biocides of interest, 2-Octyl-4-isothiazolin-3-one (OIT) and the
blend of 2-Methyl-4-isothiazolin-3-one (MIT) and 5-Chloro-2-methyl-4-isothiazolin-3-one
(CIT), and release the biocide molecules either directly from the minerals, or from paints
films, in both static and dynamic environments. The isothiazoline biocides used were chosen
because they offer many performance advantages over other biocides. These advantages

Chapter 1 Introduction
19
include the following:
• They have a broad-spectrum antimicrobial activity and can control the growth of
both Gram-negative and Gram-positive bacteria, and fungi (molds and yeasts).
• They are economical. The required dosage concentrations are more cost- effective
than other commercial preservatives.
• These biocides are formaldehyde-free, and do not contain or generate formaldehyde
(formaldehyde is very toxic when inhaled or present in the food chain, and
carcinogenic).
• They offer low use levels (excellent microbe control at low Minimum Inhibitory
Concentrations). Typical MIC levels are 6-15 part per million of the combined active
components (0.04-0.10% of the product as supplied, volume/volume; see Figure
1.6).
• They have low toxicity, with lower half-lives than other biocides (see Table 3.5).
• Excellent compatibility with common formulation ingredients.
• Excellent stability over a wide pH range (2 to 8.5).
• They are easy to formulate and are supplied as an easy-to-use aqueous solution.
• No side effects: the biocides will not adversely affect a product’s physical properties
or performance.
• They are environmentally friendly and do not persist in the environment; their
breakdown products are essentially benign.
In order to achieve the main aim of the project, the following steps were taken:
• The surface area of each of the nine minerals used was determined by B.E.T.

Chapter 1 Introduction
20
nitrogen.
• The particle size distribution (PSD) of the minerals was determined using light
scattering techniques.
• The minerals used were characterised to determine their chemical compositions
using X-ray Fluorescence), crystal structures by X-ray Diffraction, and
morphologies by Scanning Electron Microscopy.
• A protocol was developed to adsorb the isothiazoline biocides molecules to the clays
(using a bench high shear mill for dry adsorption, and wet adsorption in water, by
first making a paste of the minerals).
• The biocide molecules were desorbed in a beaker with water under constant stirring
over time, and High Performance Liquid Chromatography (HPLC) was used to
measure their concentrations.
• The adsorption and desorption experiments were repeated under flow condition in
the Flow Microcalorimeter (FMC), and the various heats produced during the
sorption processes were measured to estimate the strengths of the bonds between the
biocides and the minerals. This process then gave an indication of the types of
adsorption taking place (chemisorption, physisorption), and used to eliminate the
less performing minerals.
• The biocide-loaded minerals were added to an external paint formulation. The
biocide content of the paint films obtained was first desorbed in water to determine
the differences in desorption profiles between the minerals used. Following on this,
the paints films were aged over a 1500 hours period, and their potency to destroy
pseudomonas aeruginosa micro-organisms was investigated throughout that time
period.

Chapter 1 Introduction
21
• Finally, optical, mechanical and rheology properties of the paints were investigated.
0 1 2 3 4 5 6 7 8 9 10
Time (arbitrary unit, preferably in months)
Con
cent
rati
on U
nit a
t sur
face
Waste area
Uncontrolled release
MIC line
Figure 1.6: Current levels of biocide loading in coatings.
The MIC line (minimum inhibitory concentration, as shown in Figure 1.6), which represents
the maximum concentration of biocide required to kill all organisms in a particular system, is
a zero order release. The area between the uncontrolled release and MIC lines represents
waste and has detrimental environmental and economic effects on the ecosystem and
companies respectively.
There are currently several worldwide research groups working on biocide release from paint
films, e.g the European Union “Ambio” project [3], and Poseidon in the USA. These research

Chapter 1 Introduction
22
groups are primarily trying to address issues associated with the toxic nature of the biocides,
and the amounts currently being added to the paints, by developing non-biocidal solutions for
the problem of marine biofouling. Some of the nine minerals used will be selected for the
paint application and the bioassay work if:
• The biocide reasonably strongly adsorbs to the mineral
• The amount of biocide adsorbed is reasonably high
• The biocide desorbs from the mineral over period of time (if it is not permanently
attached to the clay)
• The mineral-biocide complex is compatible with the existing paint system (pH and
viscosity of the paints of the new formulations must not differ with those of the
control)
• The new formulations must be able to kill micro-organisms growing on a paint
surface
In the remainder of this thesis, Chapter Two will review the use of controlled release
technologies, with specific reference to biocides. Chapter Three outlines the characterisation
techniques used for the various materials, with the results of these characterisations detailed
in Chapter Four. Chapter Five and Six will respectively outline the adsorption and desorption
characteristics of some chosen minerals, while Chapter Seven will discuss the potency of the
desorbed OIT biocide in bioassay measurements. In Chapter Eight, the industrial perspective
of the project will be discussed, while in Chapter Nine, the various findings of the project will
be summarised.

CHAPTER TWO
LITERATURE SURVEY
2 Chapter Two – Literature Survey

Chapter 2 Literature Survey
24
2.1 Introduction
In this chapter, the literature on various aspects of controlled release technologies is
reviewed. Particular attention is paid to the various technologies available, the drug (or
compound) release mechanisms, the role minerals can and do play, and some of the various
biocides found in coatings. Some aspects of controlled release systems in the field of
medicine and pharmaceuticals will be explored, as this area has a world-leading advance on
any other field, due to the need to minimise or eliminate the side effects of many drugs.
Chapter 7 discusses the biocide potency to the organism pseudomonas aeruginosa (found on
most contaminated surfaces), and it is believed that understanding controlled release
mechanisms in the field of modern Medicine could lead the way to creating very good
controlled release systems in industries such as paint, agriculture, and food packaging.
2.1.1 Overview of controlled release technologies
Controlled release technologies are becoming more and more important, especially in the
field of modern medication and pharmaceuticals [4]. Controlled release is the use of
formulation components and devices to release a therapeutic at a predictable rate in vivo
when administered by an injected or non-injected route. An example of controlled release
formulation is the transdermal patch containing fentanyl. The rate of drug release from the
system is device-led and in theory, the resulting drug plasma levels reach a constant amount
per unit time (zero order kinetics).
Another example is the six-month implant of biodegradable microspheres of the peptide,

Chapter 2 Literature Survey
25
leuprolide, for treatment of prostate cancer. These formulations avoid the plasma peak and
troughs of traditional injections, thus avoiding side effects and making the medicine more
effective and acceptable to patients. More recently, controlled release has had to encompass
the skills of pharmacology and physiology since the release rates of a drug from a polymer in
vitro is not the same as what occurs in vivo. In addition, researchers in controlled release need
to know how drugs cross biological membranes, how they interact with immune cells and
how they distribute to different organs. Gene delivery, DNA vaccines, cancer chemotherapy
and brain delivery of drugs require drug delivery scientists to get involved in understanding
antigen presentation, compartmentalisation within cells, how to target drugs to cancer cells
and how to take advantage of receptor-mediated uptake into the brain and other organs.
While some of these major medical needs are only beginning to be addressed, there have
been significant advances, for example, in conjugating anti-cancer agents to new polymers to
give targeted formulations with better pharmacokinetics.
Controlled drug release of drugs in the body at a desired rate has many advantages over
conventional forms of dosage and these include the followings [4,5]:
• Minimising deleterious side effects
• Prolonging efficiency time
• Heightening drug bioavailability
• Improving patient compliance
• Protecting sensitive drugs from enzymatic or acidic degradation in the body
• Masking peculiar odours [6]
• Maintaining the patient blood level

Chapter 2 Literature Survey
26
One common way of controlling drug delivery is to incorporate the drug into a polymer
matrix system [7-10]. The dissolution and diffusion of the drug though the polymer [11, 12],
or the swelling and erosion of the matrix [13], are important phenomena in controlling the
release characteristics of the formulation. Hydrogel polymers have attracted a great deal of
attention over the years because of their valuable applications in controlled and site-specific
delivery of drug [14-17], cell encapsulation and tissue engineering [18-20]. Hydrogels have
the ability to swell in the presence of water or biological fluids in order to regulate the release
of the encapsulated drugs. By controlling the degree of swelling due to crosslinking makes
them potential carriers of drugs for controlled release applications [22-24].
2.1.2 Overview of drug release mechanisms from polymeric devices
Drug release from a controlled release system can be achieved by several mechanisms, such
as diffusion through a rate-controlling membrane, by osmosis, ion exchange or by
degradation of the matrix [25-28]
2.1.3 Diffusion controlled release from non-degradable systems
Diffusion controlled systems can be divided into non-degradable reservoirs and monolithic
devices [26, 29]. Reservoir systems provide constant release of a drug over a substantial
period. In this system, a core of drug is surrounded by a polymer film that serves as diffusion
barrier through which the release of the drug occurs (Figure 2.1). As long as the drug
concentration inside the film stays constant, the drug release obeys zero order kinetics.

Chapter 2 Literature Survey
27
Figure 2.1: Drug release from a reservoir device (nanocapsule)
In monolithic devices of various shapes, the active agent is either dispersed or dissolved in
the polymer matrix. In both cases drug diffusion through the polymer matrix is the rate
limiting step and the release rates are determined by the choice of the polymer and its
consequent effect on the diffusion and partition coefficient of the drug [30].
Mathematical treatment of diffusion depends on whether the drug is dissolved or dispersed in
the polymer. In a matrix system, where the drug is dissolved in the polymer matrix, the
release follows Fick´s law. The following equation describes drug release from a slab-shaped
device:
[ ] 2/124
hDt
MoMt
π= Equation 2.1
where:
Mt/M0 is the fractional released amount of drug (mol/m2.s)
D is the diffusion coefficient of a drug in the matrix (m2s-1)
h is the thickness of the slab device (m)
t is time (s).
Drug molecule
Matrix

Chapter 2 Literature Survey
28
This equation is valid for the release of the first 60 percent of the drug total (early time
approximation). Thereafter the release kinetics follows first order kinetics (late time
approximation). The reason for a decrease in the release rate is an increase in the diffusional
path length [26, 29, 31]. This problem can be avoided by using special geometry that
provides increasing surface areas over time [31].
Higuchi developed an equation for the release of solid drugs dispersed in matrix dosage
systems, from which the drug diffuses through non-porous polymer [30]. Drug release is
affected, apart from the geometry of the device, also by the concentration of drug. Drug
release follows square root of time kinetics until the concentration in the matrix falls below
the saturation value (Co > Cs).
( ) 2/122 t
DCsCoAdt
dMt = Equation 2.2
In this equation, dMt/dt is the release rate of drug, A is the total area of the slab (both sides),
D is the diffusion coefficient of the drug in the matrix, Cs is the solubility of the drug in a
polymeric matrix, Co is the total amount of drug (both dissolved and dispersed) in unit
volume of the matrix and t is time (hours). In monolithic systems where excess drug is
dispersed, the drug release rate increases with increasing drug concentration. The Higuchi
expression is a good predictor of release rates from systems containing 5 to 10 volume per
cent of active agent.
At higher drug concentrations, drug particles are in contact with each other and the drug is
released by diffusion through the water filled pores [29, 30]. A second form of the Higuchi

Chapter 2 Literature Survey
29
equation describes the diffusion of drug from a porous matrix.
( )[ ] 2/12 CstCsCoQ D ετε −= Equation 2.3
In this case the amount of drug released per unit area of the matrix, Q, depends on the
diffusion coefficient of the drug in the matrix (D), its solubility in the polymeric matrix (Cs),
the total amount of the drug (dissolved and dispersed) in unit volume of the matrix (Co), the
porosity factor (ε) and the tortuosity factor (τ) of the matrix and time (t) [30, 31].
2.1.4 Solvent activation controlled release
In a solvent activation controlled system, the active agent is dissolved or dispersed within a
polymeric matrix or is surrounded by a polymer and is generally not able to diffuse through
the matrix. Permeation of the moving dissolution medium through the polymer controls the
release behaviour of drugs from these systems [30, 32, 33]. Solvent controlled systems can be
divided in two types; osmotic and swelling controlled systems. Drug release from the
swelling polymer follows Fick´s law, when penetration of water into the polymer is rapid as
compared to drug diffusion, whereas non-Fickian diffusion is achieved when drug diffusion
and the solvent induced relaxations in the polymer are within the same range. When drug
diffusion is rapid compared to the constant rate of solvent induced relaxation and swelling in
the polymer, zero-order drug release is achieved and drug release is referred to as Case II
transport [30]. An osmotic system is constructed by enclosing a drug in a semi-permeable
membrane equipped with an orifice. The release rate of drug is governed by the nature of the
membrane and the osmotic activity of the drug core. A constant release is maintained as long
as the drug core remains saturated [33].

Chapter 2 Literature Survey
30
2.1.5 Biodegradable systems
The mechanism of biodegradation and drug release from biodegradable controlled release
systems can be described in terms of three basic parameters. Firstly, the type of the
hydrolytically unstable linkage in the polymer affects the design of the system and next, the
position of the labile group in the polymer is important. Secondly the way the biodegradable
polymer degrades, either at the surface or uniformly throughout the matrix, affects the device
performance substantially. The third significant factor is the device design. The active agent
may be covalently attached to the polymer backbone and is released as the bond between
drug and polymer cleaves. The active agent may also be dispersed or dissolved into a
biodegradable polymer matrix in the same way it is in a monolithic system made from non-
biodegradable polymer and the release is controlled by:
• Diffusion
• A combination of diffusion and erosion
• Solely by biodegradation of the matrix [30, 34]
Biodegradable polymers are divided in homogenous (bulk) and heterogeneous (surface
eroding) degrading polymers. These mechanisms are the extreme cases and most
biodegradable polymer systems constitute a combination of the two types of mechanisms [30,
34]. Degradation is the process of polymer scission by the cleavage of bonds in the polymer
backbone. Degradation leads to size reduction of the polymer chains. Erosion is the mass loss
of the polymer matrix [34-35].
Homogenous (bulk) degradation appears to be the most common polymer degradation
mechanism, where the polymer degrades homogeneously throughout the matrix. The
Chapter 2 Literature Survey
31
hydrolysis of bulk degrading polymers usually proceeds by losing molecular weight at first,
followed by loss of mass in the second stage when the molecular weight has decreased to 15
000 g/mol or less [36]. The biodegradation rate can be altered by changing the composition
(but not the size or the shape) of the polymer [37-38].
Drug release from a matrix undergoing homogenous degradation may be governed by the
equations derived from simple diffusion-controlled systems if the drug diffuses rapidly from
the device before degradation of the matrix begins. However, bulk degradation causes
difficulties in the control of drug release, because the release rate may change as the polymer
degrades. As the polymer begins to lose mass, the release rate accelerates because it is
determined by a combination of diffusion and simultaneous polymer erosion [39-40]. The
bulk degrading polymers most extensively studied are poly(esters), such as copolymers of
poly(lactic acid) and poly(glycolic acid).
Surface eroding systems (heterogeneous erosion) lose material from the surface and the
erosion rate is dependent on the surface area and the geometry of the device, i.e. the radius to
thickness ratio controls the matrix erosion time, rather than the volume of the polymer matrix
[36, 41-42]. The molecular weight of the polymer generally does not change significantly as a
function of time [30]. Achieving surface erosion, however, requires that the degradation rate
of the polymer matrix surface be much faster than the rate of water penetration into the
matrix [25].
Zero order drug release is obtained with surface erosion controlled systems such as
poly(anhydrides) or poly(orthoesters). The surface eroding system device design is made

Chapter 2 Literature Survey
32
easier due to the fact that release rates can be controlled by changes in system thickness and
total drug content. In 1976, Hopfenberg and co-workers [43] developed a general
mathematical equation for drug release from surface degrading slabs, spheres and infinite
cylinders. This model, described in equation 2.4, assumes that the actual erosion process is
the rate-limiting step and that the drug release occurs from the primary surface area of the
device without seepage from the matrix.
( ) nCoakot
MMt −−=∞ 11 Equation 2.4
Mt/M∞ is the fractional released amount of drug, Co is the initial concentration of the drug in
the matrix (mole/dm3), a is the initial radius for a sphere or cylinder, k0 is the zero order rate
constant for surface erosion and n is the shape factor. A shape factor that was defined in the
equation by Hopfenberg, has in subsequent studies been applied to other geometrical forms,
such as squares and half-spheres [44]. Katzhendler stated that the erosion rates are different
in the radial and axial directions [41]. Drug release from a surface-eroding polymer may be
controlled solely by erosion of the polymer matrix and the release of drug is constant
provided that the surface area of the matrix and the drug concentration remain constant
during the drug release period [31]. However, the surface area decreases as the implant is
eroded, with a consequent decrease in the release of drug. Consequently, a geometry that
does not change its surface area as a function of time is required to attain more uniform and
zero order release [26].
True surface erosion where matrix mass loss is equal to the drug release rate is difficult to
achieve and often diffusion of the drug molecules may still be rate limiting. For highly water-
Chapter 2 Literature Survey
33
soluble drugs especially, the release rate is controlled mainly by diffusion through the matrix,
whereas the erosion process controls the release rate of low water-soluble drugs. Thus, the
release rate may be a combination of erosion control (zero-order) and diffusion control
(square root of time kinetics) [45].
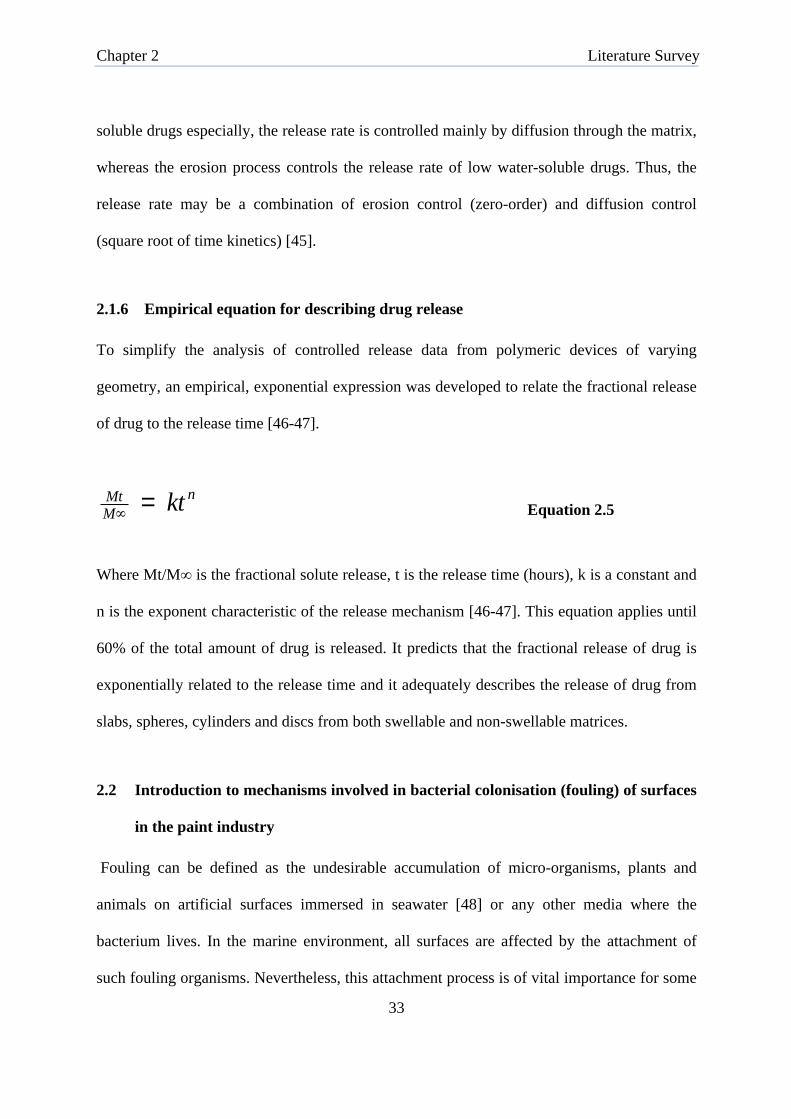
2.1.6 Empirical equation for describing drug release
To simplify the analysis of controlled release data from polymeric devices of varying
geometry, an empirical, exponential expression was developed to relate the fractional release
of drug to the release time [46-47].
nMMt kt=∞ Equation 2.5
Where Mt/M∞ is the fractional solute release, t is the release time (hours), k is a constant and
n is the exponent characteristic of the release mechanism [46-47]. This equation applies until
60% of the total amount of drug is released. It predicts that the fractional release of drug is
exponentially related to the release time and it adequately describes the release of drug from
slabs, spheres, cylinders and discs from both swellable and non-swellable matrices.
2.2 Introduction to mechanisms involved in bacterial colonisation (fouling) of surfaces
in the paint industry
Fouling can be defined as the undesirable accumulation of micro-organisms, plants and
animals on artificial surfaces immersed in seawater [48] or any other media where the
bacterium lives. In the marine environment, all surfaces are affected by the attachment of
such fouling organisms. Nevertheless, this attachment process is of vital importance for some

Chapter 2 Literature Survey
34
marine life: larvae of invertebrates and spores of algae need to quickly find and bind to a
surface in order to complete their life history [49]. Barnacle larvae swim around freely in the
water column but in order to complete the transition to adult life, the cyprid larvae (Balanus
Amphitrite) must attach to a hard surface [49]. Traditionally, the fouling process has been
considered to consist of four general stages, [50]:
• Biochemical conditioning: within minutes of its immersion, a clean surface adsorbs
dissolved organic molecules such as polysaccharides, proteins and proteoglycans (and
possibly inorganic compounds). This adsorption causes the formation of a
conditioning film and is essentially governed by physical forces such as Brownian
motion, electrostatic interaction and van der Waals forces [51, 52].
• Bacterial colonisation: bacteria and single cell diatoms rapidly settle on this modified
surface, again mainly by a physical process [52, 53]. This process takes between 1 to
24 hours
• Unicellular eukaryotic settlement: the transition from a microbial biofilm to a more
complex community comprising primary producers, grazers and decomposers (algal
spores, marine fungi and protozoa, etc) [48]
• Settlement and growth of larger marine invertebrates together with the growth of
macroalgae (seaweeds) [54].
Those phases do not necessary occur sequentially during the fouling process [55] and depend
on conditions in the environment such as levels of salinity, temperature and diversity of
species. However, adverse effects caused by this biological settlement, in the case of ships,
are well known (Figure 2.2). Fouling organisms such as barnacles, mussels and algae are a
problem for many boat owners. These organisms attach to the hull, increasing the friction of

Chapter 2 Literature Survey
35
the boat in the water. This, in turn, lowers speed, impairs manoeuvrability and ultimately
increases fuel consumption [56]. It is estimated that fuel consumption increases 6% for every
100 µm increase in the average hull roughness caused by fouling organisms [57-60]. This
microbial spoilage costs around 25 billion Euros (£18 bn) annually to the European Union
[61]. In order to prevent the attachment of fouling organisms, paints containing bioactive
molecules (biocides) are used to protect pleasure, commercial and military boats.
Figure 2.2: Examples of heavily fouled hulls [48]
2.3 Biocides in the coating industry
Mariners from ancient times were aware of the problems resulting from fouling organisms.
The ancient Phoenicians and Carthaginians were said to have used pitch and possibly copper
sheathing on their ship’s bottoms, while wax, tar and asphaltum were used by other ancient
cultures [62, 63]. The Greeks and Romans both used lead sheathing, which the Romans
secured by copper nails. Copper has been in general use by the British Navy since 1780 [18].

Chapter 2 Literature Survey
36
From these early beginnings, antifouling paints incorporating copper salts developed. Copper
binds to sulphur containing cell constituents, leading to a variety of responses associated with
heavy metal toxicity [49]. The introduction of iron ships in 18th century lead to the
withdrawal of copper sheathing in antifouling coatings [64].
Figure 2.3: Schematic illustration of the behaviour of a biocide-based antifouling system
exposed to seawater [48]
In the 1800s, a variety of paints were developed based on the idea of dispersing a toxicant in
a polymeric vehicle. Copper oxide, arsenic, and mercury oxide were popular antifoulants.
Solvents included turpentine oil, naphtha, and benzene. Linseed oil, shellac varnish, tar, and
various kinds of resin were used as binders [62, 63]. But it was not until the mid 1950s that
Van de Kerk and co-workers reported on the possibilities of the broad-spectrum high-toxicity
Tributyltin (TBT) in antifoulant coatings [65]. By the early 1960s, the excellent antifoulant

Chapter 2 Literature Survey
37
properties of TBT were discovered and commercialised. A wide range of other compounds is
used as biocides in antifouling coatings today, including cuprous oxide, Irganol 1051, diuron,
SeaNine 211 and Dichlofluanid. The release of these biocides from the paints is markedly
affected by seawater conditions such as temperature and salinity [66].
Throughout the history of navigation, Tributyltin self-polishing copolymer paints (TBT-SPC)
have been the most successful in combating biofouling on ships. Around 70% of the world
fleet use these paints [67, 68], and this has lead to important economic benefits [69, 70]. TBT
saves the US Navy an estimated $US 150 million annually [71]. Nevertheless, biocides are
essentially toxic to the environment and affect non-target organisms [56]. Studies have shown
that Irganol and Diuron persist in the environment [72, 73]. These 2 compounds, together
with TBT and copper, have had damaging effects on the reproduction and growth of various
marine life forms [74, 75] and can pass through the food chain. These studies have lead the
Marine Environmental Protection Committee (MEPC) of the IMO (International Maritime
Organisation) to recommend a global ban on the use of TBT and the withdrawal of other
toxic compounds for use in marine coatings [76].
A new generation of generic substances, based on the isothiazolinone structure, are being
developed and introduced by paint manufacturers. These biocides are said to be
electrophilically active and readily react with their surrounding environment, thus facilitating
their catabolism [77]. Two of those isothiazoline biocides were used in this study, and they
were: 2-Octyl-4-isothiazolin-3-one (OIT), and the blend of 2-Methyl-4-isothiazolin-3-one
(MIT) and 5-Chloro-2-Methyl- 4-isothiazolin-3-one (CIT), referred to as CIT/MIT (see
Figure 2.4).

Chapter 2 Literature Survey
38
N-C8H17
S
O
2-Octyl-4-isothiazolin-3-one (OIT)
N-
S
O
Cl
5-Chloro-2-methyl-4-isothiazolin-3-one (CIT)
N-
S
O
2-Methyl-4-isothiazolin-3-one (MIT)
Figure 2.4: Biocides used in this study: OIT in A, and the blend of MIT and CIT, respectively
in B and C (with a methyl CH3 attached to the nitrogen on B and C)
2.4 Roles of Minerals
The impregnation of powders by active compounds (often using spray drying or fluidised bed
agglomeration) has also become a very attractive process in the past few years. It has been
shown to be appropriate for food ingredients as well as for chemicals, drugs and cosmetics
[78]. It is important, using this technique, to build a barrier between the components in the
particle and the environment for protection against oxygen, light, and water. The efficiency of
protection and controlled release depends on the composition and structure of the wall and
operating conditions (temperature, humidity, pH and pressure) during the production of the
particle [78].
2.5 Biocides and minerals in antifouling coatings
Minerals could be used to carry biocides in order to limit the bioavaibility of these
A B C

Chapter 2 Literature Survey
39
compounds in seawater and shield them from the ill effects of environmental exposure.
Montmorillonite has been used to carry the herbicides Hexazinone [79] and Sulfentrazone
[80] for slow release in soil. Clay-liposomes have also been used to carry herbicides and
reduce their leakage in groundwater [81]. Hydrotalcite-like anionic clays have been
intercalated with anti-inflammatory agents for controlled-release formulations [82]. The
isothiazolinone-based biocides mentioned above have been encapsulated within a protective
framework (silica and zeolites used as carriers), and their release has been controlled by way
of varying the pore size of these carriers [79]. The silica carrier has many functional groups
involved in the interaction with the biocide. Broadly speaking silica is considered to be a
polymer of silicic acid consisting of inter-linked SiO4 tetraheda. This construction terminates
by the formation of siloxane bridges (Si–O–Si) or silanol groups (SiOH, in Figure 2.5). The
surface chemistry of silica is dominated by the nature, distribution and accessibility of these
structures [83–85]. Siloxane sites may also be differentiated as: (–SiO–)2, (–SiO–)3, (–SiO–
)5, or (–SiO–)6 rings. Silanol sites may be distinguished as: isolated (single or free) silanols;
vicinal (or bridged) silanols, which are characterised by their ability to hydrogen bond; and
geminal silanols, which consist of two hydroxyls attached to the same silicon atom and as
such are too close to mutually hydrogen bond. These functional groups are believed to be
involved in the interaction between the mineral and the biocide.

Chapter 2 Literature Survey
40
Figure 2.5: Functional groups present on the surface of porous, amorphous silica [86]
The highly porous silica can be “filled” with the biocides in its core, with the release being
controlled by the pore size of the mineral (see Figure 2.6). This technique can work with both
the amorphous and the irregular shape silica.
Figure 2.6: Representation of porous silica, with possible pathway for biocide release
Rod-shape minerals such as halloysite are normally hollow cylinders containing air [78]. This
air can be removed under vacuum, and replaced with the biocide for slow release, with the
length of the cylinder slowing down this release (see figure 2.7).
Biocide molecule
Pores (size can be determining step in biocide release)

Chapter 2 Literature Survey
41
Figure 2.7: Representation of a Halloysite mineral with pathway of intercalated biocides
The biocide can equally be inserted within the plates of platy clays such as Kaolin and
Montmorillonite (see figure 2.7). The tortuosity of the space between the plates could slow
down the release of the encapsulated biocides.
Figure 2.8: Possible pathway for the release of the isothiazoline biocides in the platy
minerals, with (A) small and (B) larger particle size
Despite these advances in research on coatings, there is an ongoing trend to find the next
generation of biocide-free coatings (both antifoulant and other domestic coatings). The US
paint giant Poseidon is currently developing compounds such as Frescalin and Menthridan
(mostly from seaweeds) that employ a repellent, rather a toxic mechanism, in their
(A) (B)
Biocide molecules
10 µm
3 µm

Chapter 2 Literature Survey
42
antifouling coatings (these substances are believe to interact with calcium channels on the
organism’s cilia to prevent its attachment). These compounds are still at the early stage of
development and more time is needed to assess their effectiveness.
In Chapter 3, the methods of characterisation of the minerals used in this project are
presented, together with the biocides selected (and the reasons for the choice of these
biocides). The advantages (and some of the disadvantages) of these methods are also
discussed.
The scientific literature reviewed suggested there was little work done in the area of
controlled release of drugs or other compounds using minerals as carriers, especially platy
clays with low surface area (ranging from 10 to 40 m2g-1). Controlled drug delivery using
minerals could, however, have advantages in many fields if a reliable release system is found,
and these could include:
• No rejection by the body of the mineral carrier used, as no antibody will be made
against it.
• Drugs “sequestered” within a mineral framework can still be protected from
enzymatic or acidic degradation in the body (depending on the shape of the mineral
used).
• In a paint, the mineral will act both as a rheology enhancer and a carrier of the
compound of interest.
• The compounds of interest can be released at a desired rate, thus reducing wastage
linked to environmental pollution and increased costs to manufacturer.

CHAPTER THREE
MATERIAL CHARACTERISATION
3 Chapter Three – Mineral Characterisation

Chapter 4 Results of Mineral Characterisation
44
3.1 Introduction
Nine different minerals and two isothiazoline biocides were used in this study. These
materials were characterised by a variety of techniques. The surface areas of the minerals
were measured by the B.E.T. nitrogen method; the crystallography, chemical composition
and morphology of the same mineral powders were obtained by XRD, XRF and SEM
methods respectively. The minerals’particle size analysis was obtained using Light
Scattering. The adsorption of the isothiazoline biocides onto the minerals was studied by
measuring the adsorption isotherms using High Performance Liquid Chromatography (and
sometimes by UV-Vis), while Flow Microcalorimetry was used to determine the strength of
adsorption of the biocide on the surfaces of the mineral powders.
3.2 Minerals used and characterisation methods
The minerals used in this study are shown in Table 3-1.

Chapter 4 Results of Mineral Characterisation
45
Table 3.1: General characteristics of minerals used in this study
Trade name Mineral General composition
Surface area m2/g
Shape
Infilm 939 Kaolin Al2O3. 2SiO2. 2H2O (*) 22 Platy
Supreme Kaolin Al2O3. 2SiO2. 2H2O 17 Platy
NPD 16A Kaolin Al2O3. 2SiO2. 2H2O 23 Platy
Suprex Kaolin Al2O3. 2SiO2. 2H2O 25 Platy
MCBP Montmorillonite Na0.2Ca0.1Al2Si4O10(OH)2
(H2O)10
39 (**) &
800 (***) Platy
T-38 Calcium Silicate Ca2SiO4 122 Irregular
Celtix Diatomaceous
Earth SiO2 (mostly) 24 Irregular
Carplex
CS-5
Amorphous
Silica SiO2 150 Amorphous
NZ
Halloysite Halloysite Si2Al2O5(OH)4.2H2O 50 Tubular
(*): General formula of Kaolin, with its principal component, Kaolinite, having the formula Al2Si2O5(OH)4
(**) and (***): surface area of Montmorillonite as a dry and wet powder respectively.
The first four platy clays in Table 3.1 (with the exception of infilm 939, which was obtained
from Imerys Georgia, USA) were produced and processed by Imerys in Cornwall, England,
and are regularly used in the paper and paint industries as rheology modifiers. T-38 (calcium
silicate) and Celtix (diatomaceous earth) were obtained from World Minerals, a subsidiary of
Imerys, based in California, USA. The halloysite was received from Imerys New Zealand.
Carplex CS-5 is produced by Degussa, Japan. MCBP (montmorillonite) was obtained from
Southern Clay Products in the USA. These minerals were selected because of differences in
their surface areas, chemical compositions and shapes, as described in Table 3-1. In addition

Chapter 4 Results of Mineral Characterisation
46
to those differences, their industrial functions also made them candidates of interest in this
study:
• Carplex is sold by Degussa primarily as a chelator agent in breweries, to remove
unwanted compounds in beer filtration.
• Celtix and T-38 are both sold by World Minerals and are used in filtration.
• New Zealand halloysite is said to have controlled release characteristics because of
its tubular shape [1,2].
• Suprex was processed without the use of a chemical dispersant.
3.2.1 Crystallography analysis by XRD method
At Imerys, the XRD equipment used was a Philips PW1710, and is generally used in
conjunction with XRF. It is a powerful non-destructive technique for characterizing
crystalline materials and provides a mineralogical breakdown of substances such as mica,
feldspar and kaolinite. Samples are analyzed as powders with grains in random orientations
and the technique can provide information on structures, phases, crystal orientations and
other structural parameters such as average grain size, crystallinity, strain and crystal defects.
XRD peaks are produced by constructive interference of monochromatic beam scattered from
each set of lattice planes at specific angles. The peak intensities are determined by the atomic
decoration within the lattice planes. Consequently, a X-ray diffraction pattern is the
fingerprint of the periodic atomic arrangements in a given material. An on-line search of a
standard database for X-ray powder diffraction pattern enables quick phase identification for
a large variety of crystalline samples. Advantages associated with X-ray diffraction include:

Chapter 4 Results of Mineral Characterisation
47
• Very quick identification of materials
• Minimum or no sample preparation
• Large library of crystalline structures
• Computer-aided material identification
• Technique is completely non-destructive and analysis performed at ambient
conditions
The limitations associated with XRD include the difficulty to characterise a sample if more
than one phase in present, and difficulty in orientation if no crystals are present.
3.2.2 Chemical composition analysis by X-ray fluorescence method
XRF is one of the most widely used instrumental methods at Imerys for the determination of
the chemical composition of various minerals, and is based on fluorescence effect (XRF
equipment used at Imerys is the Panalytical Magix Pro). Samples to be analysed are
compressed powder pellets or fused glass discs and exposed to x-ray radiation (generally
between 10 and 100 kVolts), leading to the ionisation of their component atoms. The
ionisation consists of the ejection of one or more electrons from the atom and occurs if the
atom is exposed to radiation with energy greater than its ionisation potential. This ionisation
creates “vacancies” or “holes” in the inner electron shells of the sample atoms and renders the
electronic structure of the atom unstable. These vacancies are filled with electrons from
higher energy levels. The de-excitation processes that follows (with atoms returning to the
ground state) lead to the emission of X-rays, which are characteristic for the emitting
element. Using this technique, one can determine the atomic composition of a given sample.
The term fluorescence is applied to phenomena in which the absorption of higher-energy

Chapter 4 Results of Mineral Characterisation
48
radiation results in the re-emission of lower-energy radiation. Advantages associated with
XRF include:
• XRF is ideal for the measurement of most elements (major and minor), and is thus a
preferred technique for whole rock characterisation.
• The fusion technique minimises particle size effects that could otherwise cause
problems with the measurement process.
• Numerous trace elements can also be determined from the same fused disc, e.g. Y,
Nb, Zr. The discs themselves can be stored indefinitely.
XRF nevertheless present some limitations, including:
• Fluorescent X-rays can be easily absorbed by the sample itself (self-absorption). It is
therefore important that the sample matrix matches as closely as possible to that of
the calibration standards. If this is not possible, then empirical correction factors
must be applied.
• Lighter elements are not easily determined by XRF as they have inherently less
sensitivity. The lower energy XRF emission from these elements means that they
have less penetrating power and hence less sensitivity.
• Sample fusion enhances the XRF measurement technique by minimising particle
size effects but, sometimes, refractory minerals dissolve slowly and do not give
satisfactory fusion.
3.2.3 Powders’ morphology detection by Scanning Electron Microscopy (SEM)
Electron Microscopes were developed due to the limitations of Light Microscopes, which are

Chapter 4 Results of Mineral Characterisation
49
limited by the physics of light to 500x or 1000x magnification and a resolution of 0.2
micrometers. They function exactly as their optical counterparts except that they use a
focused beam of electrons instead of light to create an image of the specimen and gain
information as to its structure and composition. The SEM equipment used at Imerys is the
Jeol 6700F Field Emission Scanning Electron Microscope. The basic steps involved in all
electron microscopes are:
• A stream of electrons is formed by the electron source and accelerated toward the
specimen using a positive electrical potential
• This stream is then confined and focused, using metal apertures and magnetic lenses,
into a narrow, focused, monochromatic beam.
• This beam is focused onto the sample using a magnetic lens
• Interactions occur inside the irradiated sample, affecting the electron beam
These interactions and effects are detected and transformed into an image.
An electron microscope can help the user determine the following information:
• Topography - The surface features of an object or "how it looks", its texture; direct
relation between these features and materials properties (hardness, reflectivity...etc.)
• Morphology - The shape and size of the particles making up the object; direct
relation between these structures and materials properties (ductility, strength,
reactivity...etc.)
Electron microscopes are nevertheless expensive to buy and maintain. They are dynamic
rather than static in their operation: requiring extremely stable high voltage supplies,
extremely stable currents to each electromagnetic coil/lens, continuously-pumped high/ultra-

Chapter 4 Results of Mineral Characterisation
50
high vacuum systems and a cooling water supply circulation through the lenses and pumps.
Sample preparation time is also a lengthy process and there is a possibility of sample damage
during the preparation. Samples also need to be viewed in vacuum to avoid scattering
electrons by air molecules. The main advantage of SEM over light microscopy is the
increased depth of field. Small object and particles that would normally escape the field of
view of light microscope can be imaged on the SEM.
3.2.4 Particle size analysis by Light Scattering (using the Malvern Mastersizer)
Extenders (like clay minerals) are manufactured in a wide range of finenesses and are used in
the paint industry to fulfill specific requirements in very different coating systems. To cover
the requirements of paint manufacturers, many different qualities are manufactured in order
to accommodate some or all of the most important properties of coatings listed below:
• Rheology • Opacity
• Suspension properties • Packing density
• Storage stability • Hold out / Leveling
• Density • Sanding properties
• Gloss • Wet scrub resistance
• Surface smoothness • Corrosion resistance
• Brightness • Exterior durability
The paint chemist can influence these properties by correctly selecting extenders with the
appropriate granulometry. The granulometry or particle size distribution of an extender is

Chapter 4 Results of Mineral Characterisation
51
characterised in general by the particle size distribution curve illustrated in Figure 3.2. Using
the Malvern Mastersizer ATM13 at Imerys, one can determine the weight mean particle size
of various minerals in solution. This instrument uses the principles of Mie scattering with a
low powered Ne/He laser. The suspension (containing the particles) is illuminated using a
parallel beam of light (see Figure 3.1). The scattered light is collected and focused onto a
detector at the focal point of the lens. The distribution of scattered light can then be
converted, mathematically, into a particle volume distribution. [21, 35]
Figure 3.1: Particle size measurement as used in Malvern instruments [87]
The particle diameters are calculated from the measured volume of the particle, found by
assuming a spherical shape. This is disadvantageous with kaolin, as particles are usually flat
platelets and so the size recorded for a particle is dependent on the angle at which the beam of
light hits each particle [87].
The most important points are: The “Top Cut” (d98) which gives the diameter of extender

Chapter 4 Results of Mineral Characterisation
52
particle so that at least 98 % of the particles by weight are finer i.e. in principle the coarsest
particle present. The “Mean Particle Size” (d50) representing the size of particle so that 50 %
of the particles by weight are coarser or finer (see Figure 3.2).
Figure 3.2: Typical particle size distribution curve [88]
The scattered light technique provides a fast response time, which is advantageous in many
situations. Problems are encountered with kaolin suspensions at high solid volume fractions.
These fractions are so opaque they must be diluted in order to allow the scattered light to pass
through them. Studies have shown that a minimum of 5 to 10% of the laser light needs to
pass through the sample in order to obtain reliable results.
3.2.5 Surface area measurement by B.E.T. (Brunauer Emmett and Teller)
Gas adsorption is the most widely used and accurate technique for total surface area
measurements. Gas molecules of known sizes are condensed onto the unknown sample
surface. By completely covering the surface and opening the pores of each particle with a

Chapter 4 Results of Mineral Characterisation
53
condensed gas the surface area analyser can characterise the surface, including irregularities
and pore interiors down to an atomic level. Nitrogen is often the gas used as its molecular
size is well established, it is inert and is available in high purity at a reasonable cost. The
“outgassed” sample under high vacuum in its sample tube is immersed in a coolant bath of
liquid nitrogen at –195°C. At this stage the sample is ready to attract gas molecules onto it
when they are admitted to the sample tube.
At Imerys, the specific surface area of powders is measured using the Tristar equipment
manufactured by Micrometrics, Georgia, USA. This area is determined using measurements
made at three partial pressures. Nitrogen is used as the adsorbate in conjuction with helium as
the carrier. All samples are out-gassed at 180 °C before testing. The specific surface area is
determined by measuring the quantity of nitrogen gas that is adsorbed as a monomolecular
layer on the test sample. The adsorption is carried out at temperatures close to the boiling
point of the adsorbate. This is achieved by immersing the test sample in a Dewar flask
containing liquid nitrogen. Under these specific conditions the area covered by a molecule of
gas is accurately known. Thus, the area of the test material may be determined by measuring
the number of molecules adsorbed. A sensitive pressure transducer measures the change in
pressure occurring in the sample chamber and thereby quantifies the volume adsorbed. At
Imerys, samples to be analysed are prepared by the Analytical department as follow:
• If the sample is a powder, between 5 and 10 g are transfered to the oven and dried.
• If the sample is a slurry, ensure that it is thoroughly mixed either by stirring it with the
bench stirrer, mixing it on the rotating rollers or by shaking its container vigorously.

Chapter 4 Results of Mineral Characterisation
54
• If the sample is a deflocculated slurry, pour sufficient to give about 10 g dry weight
equivalent into a small dish and place it in the oven.
• If the sample is a flocculated slurry, filter sufficient to give between 5 g and 10 g dry
weight equivalent through a fine hardened filter paper. (At this stage sample weight is
not critical). Place the cake in the oven and dry it.
After this drying period, the sample is remove from the oven and dispersed adequately by
crushing it with a pestle and mortar. 1.5 g of this test material is then weighed and placed
into the sample tube, which is in turn placed into the heating element of the Tristar (set at
180oC). Nitrogen and hellium cylinders are then turned on at pressure of approximatly 1
bar. At the end of this heating period, the sample tube and its content are transferred to
the “cool” zone of the FlowPrep equipment to allow the tube to cool to a touch. After this
cooling period, the filler is gently placed into the sample tube, ensuring that the Dewar
flask if filled with liquid nitrogen. The flask is then placed on the intrument’s platform,
and measuremnet can start. At the end of the measurement, the specific surface area is
expressed as m2/g and shown on the printout of the computer attached to the equipment.
The test is ISO9001 compliant, and its precision is ± 3 % of the value of the test material.

Chapter 4 Results of Mineral Characterisation
55
3.3 Biocide selection and measurement
The biocides used in this study were obtained from Clariant, UK, and were: 2-octyl-4-
isothiazolin-3-one (OIT) and the blend of 5-chloro-2-methyl-4-isothiazolin-3-one, and 2-
methyl-4-isothiazolin-3-one (CIT/MIT). The blend of CIT/MIT was in a ratio of 3 to 1 by
volume. These biocides represent a new generation of generic substances based on the
isothiazoline chemistry, and are being developed and introduced by major paint
manufacturers. They are being used in paints to replace the more traditional biocides such as
silver, mercury, tributyltin (TBT), irganol, diuron and copper, which have had damaging
effects on the environment and on the reproduction and growth of various marine life forms.
N-C8H17
S
O
2-Octyl-4-isothiazolin-3-one (OIT)
N-
S
O
Cl
5-Chloro-2-methyl-4-isothiazolin-3-one (CIT)
N-
S
O
2-Methyl-4-isothiazolin-3-one (MIT)
Figure 3.3: Biocides used in this study: (OIT), (CIT) and (MIT) respectively in A, B and C
(with a methyl CH3 attached to the nitrogen on B and C)
3.3.1 Biocide selection
The isothiazoline biocides used were chosen because they offer many performance
advantages over other biocides. These advantages include the following:
A B C

Chapter 4 Results of Mineral Characterisation
56
• They have a broad-spectrum antimicrobial activity and can control the growth of
Gram-negative and Gram-positive bacteria, and fungi (molds and yeasts).
• They are economical. The required concentrations generally are more cost- effective
than other commercial preservatives.
• They are formaldehyde-free, and do not contain or generate formaldehyde
(formaldehyde is very toxic when inhaled or present in the food chain, and
carcinogenic).
• They offer low use levels (excellent microbe control at low concentrations). Typical
use levels are 6-15 part per million of the combined active components (0.04-0.10%
of the product as supplied, volume/volume).
• They have low toxicity as their half-lives are lower than other biocides (see Table
3.1).
• Excellent compatibility with common formulation ingredients.
• Excellent stability over a wide pH range (2 to 8.5).
• They are easy to formulate and are supplied as an easy-to-use aqueous solution.
• No side effects: the biocides will not adversely affect a product’s physical properties
or performance.
• They are environmentally friendly and do not persist in the environment; their
breakdown products are essentially benign.

Chapter 4 Results of Mineral Characterisation
57
Table 3.1: Environmental input parameters of isothiazoline biocides and TBT (Source, World
Health Organisation, 1990)
Parameters Isothiazolines Tributyltin (TBT) Half life (sea water) 1 day 9 days
Half life (sediment) 0.04 day 162 days
Bio-concentration factor (*) 14 10,000
Adsorption coefficient (**) 1666 8,000
(*): Concentration of a chemical in a tissue per concentration in water; accumulation of pollutants through chemical partitioning from aqueous phase to organic phase
(**): Mass of adsorbed substance per unit mass of adsorbent / concentration of substance in solution
3.3.2 Degradation of isothiazolines
Isothiazoline biocides are electrophilically active and readily react with their surrounding
environment to facilitate their degradation. The isothiazolone molecule interacts with thiol
groups in enzyme proteins (co-enzymes or redox cofactors, see Figure 3.4) in the cell,
prohibiting the normal interaction of the enzyme (by inhibition of the active site of the
enzymes). These enzymes are important in the biochemical cycles through which the cell
obtains its energy. Therefore the cell slows and eventually dies (see Figure 3.4). The by-
products of their degradation consist mainly of urea and carbonic acid, which are harmless to
the environment.
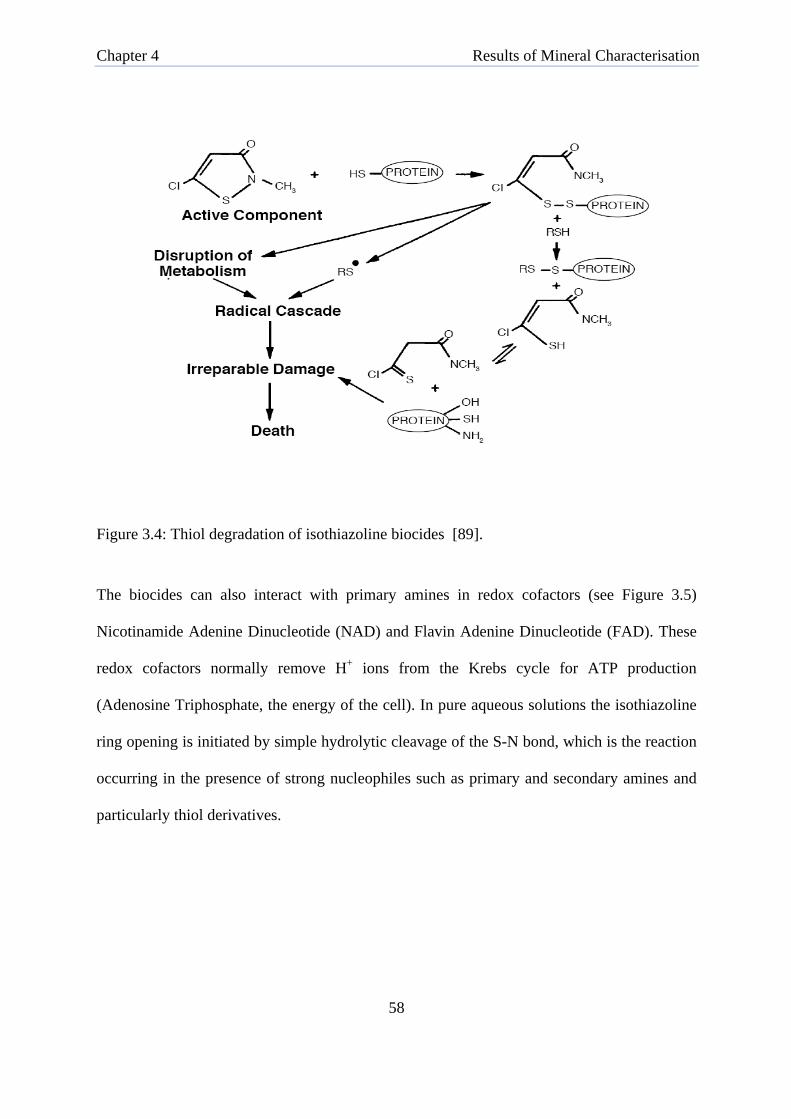
Chapter 4 Results of Mineral Characterisation
58
Figure 3.4: Thiol degradation of isothiazoline biocides [89].
The biocides can also interact with primary amines in redox cofactors (see Figure 3.5)
Nicotinamide Adenine Dinucleotide (NAD) and Flavin Adenine Dinucleotide (FAD). These
redox cofactors normally remove H+ ions from the Krebs cycle for ATP production
(Adenosine Triphosphate, the energy of the cell). In pure aqueous solutions the isothiazoline
ring opening is initiated by simple hydrolytic cleavage of the S-N bond, which is the reaction
occurring in the presence of strong nucleophiles such as primary and secondary amines and
particularly thiol derivatives.

Chapter 4 Results of Mineral Characterisation
59
Figure 3.5: Sites of action of isothiazoline biocides in the Krebs cycle [89]
3.3.3 Concentration measurement by HPLC
High performance liquid chromatography (HPLC) is a form of column chromatography
commonly used in biochemistry and analytical chemistry research laboratories. It is often
referred to as high-pressure liquid chromatography and is used to separate components of a
mixture by using a variety of chemical interactions between the substance being analyzed
(analyte) and the chromatography column.

Chapter 4 Results of Mineral Characterisation
60
3.3.3.1 Principles of HPLC system
The basis of all forms of chromatography is the partition or distribution coefficient (Kd),
which is the way in which a compound distributes itself between two immiscible phases. For
two immiscible phases A and B, the value of Kd is a constant at a given temperature and is
given by the expression:
dK=B phasein ion ConcentratA phasein ion Concentrat Equation 3.1
All chromatographic systems consist of:
• A stationary phase, which may be a solid, gel, liquid or a solid/liquid mixture that is
immobilised
• A mobile phase, which may be liquid or gaseous and which flows over or through
the stationary phase
In isocratic HPLC (one solvent system), the analyte is forced through a column of the
stationary phase by pumping a liquid (mobile phase) at high pressure through the column.
The analyte is introduced in a small volume to the stream of mobile phase (between 10 and
30 µl), and is retarded by specific chemical or physical interactions with the stationary phase
as it traverses the length of the column. The amount of retardation depends on the nature of
the analyte, stationary phase and mobile phase composition. The time at which a specific
analyte elutes (comes out of the end of the column) is called the retention time (tR, in min)
and is considered a unique identifying characteristic of a given analyte. The retention volume
(VR, in ml) is the volume of mobile phase required to elute the analyte. These 2 parameters

Chapter 4 Results of Mineral Characterisation
61
are related by the flow rate, FC (ml/min), of the mobile phase through the column:
CRR FtV = Equation 3.2
The use of pressure increases the linear velocity giving the components less time to diffuse
within the column, leading to improved resolution in the resulting chromatogram. Common
solvents used include any miscible combinations of water or various organic liquids (most
commons are methanol and acetonitrile). Water may contain buffers or salts to assist in the
separation of the analyte components, or compounds such as trifluoroacetic acid, which acts
as an ion-pairing agent. In this study, the HPLC was used to quantify the biocide molecules in
solutions after the adsorption/desorption processes (Chapters 5, 6 and 7).
3.3.4 Concentration measurement by UV-Vis
Ultraviolet (UV) and Visible (VIS) light can cause electronic transitions. When a molecule
absorbs UV-VIS radiation, the absorbed energy excites an electron into an empty, higher
energy orbital. The absorbance of energy can be plotted against the wavelength to yield a
UV-VIS spectrum. Ultraviolet radiation has wavelengths in the range of 200-400 nm. Visible
light has wavelengths in the range of 400-800 nm. Any species with an extended system of
alternating double and single bonds will absorb UV light, and anything with colour absorbs
visible light, making UV-VIS spectroscopy applicable to a wide range of samples.
UV-Vis spectroscopy has many uses including detection of eluting components in high
performance liquid chromatography (HPLC), determination of the oxidation state of a metal
centre of a cofactor (such as haeme in haemoglobin), or determination of the maximum

Chapter 4 Results of Mineral Characterisation
62
absorbance of a compound prior to a photochemical reaction. Most organic compounds that
absorb UV-VIS radiation contain conjugated pi-bonds. Both the shape of the peak(s) and the
wavelength of maximum absorbance can give information about the structure of the
compound.
In analytical applications it is advantageous to measure the concentration of an analyte
independent of the effects of reflection, solvent absorption, or other interference [Ref]. The
Beer-Lambert law (also called the Beer-Lambert-Bouguer law) describes the linear
relationship between absorbance and concentration of an absorber of electromagnetic
radiation. The general Beer-Lambert law is usually written as:
clA λε= Equation 3.3
where A is the absorbance, ελ is the molar extinction coefficient for the absorber at
wavelength λ (in nm), c is the concentration of the absorbing solution in mol.dm-3, and l is
the path length through the solution (or thickness, in cm). Experimental measurements are
usually made in terms of transmittance (T), which is defined as:
0PPT = Equation 3.4
where P is the power of light after it passes through the sample and Po is the initial light
power. A 100% value for T represents a totally transparent substance, with no radiation being
absorbed, whereas a zero value for T represents a totally opaque substance, or complete
absorption. The relation between A and T is:

Chapter 4 Results of Mineral Characterisation
63
( ) ⎟⎠⎞
⎜⎝⎛−=−=
0loglog P
PTA Equation 3.5
3.3.4.1 UV-VIS at Imerys
The UV-Vis spectrometer at Imerys is a double beam equipment capable of identifying the
two transmittance measurements that are necessary to determine the concentration of an
analyte in solution, and is shown schematically in Figure 3.8.
Figure 3.6: Schematic of a double beam UV-Vis Spectrometer equipment [91]
The top branch of Figure 3.8 (to the reference cell) is for solvent only and the bottom branch
is for an absorbing sample in the same solvent. In this example, Ps is the source light power
that is incident on a sample, P is the measured light power after passing through the analyte,
solvent, and sample holder, and Po is the measured light power after passing through only the
Ps

Chapter 4 Results of Mineral Characterisation
64
solvent and sample holder. The measured transmittance in this case is attributed to the analyte
only. The reference measurement is made simultaneously with the sample measurement.
These two values are then loaded onto the computer to generate the full spectrum (reference
value is subtracted from the reference value). Modern absorption instruments can usually
display the data as transmittance, percentage-transmittance, or absorbance. An unknown
concentration of an analyte can be determined by measuring the amount of light that a sample
absorbs and applying Beer's law. If the absorptivity coefficient is not known, the unknown
concentration can be determined using a working curve of absorbance versus concentration
derived from standards. In this case, one sample of OIT and one of CIT/MIT were separately
measured on the UV-VIS at wavelengths between 190 and 700 nm to determine the
wavelengths at which optimum absorbances were obtained (280 nm for OIT and 277 nm for
CIT/MIT). Samples of the biocides of known concentrations were made and measured at
these wavelengths in order to obtain a working calibration curve for the remainder of the
samples (see Figures 3.9 and 3.10).

Chapter 4 Results of Mineral Characterisation
65
Figure 3.7: CIT/MIT calibration curve obtained from the UV-Vis spectrometer

Chapter 4 Results of Mineral Characterisation
66
y = 0.0119x + 0.0042 R! = 0.99911
0
0.5
1
1.5
2
2.5
3
0 50 100 150 200 250
Abs
orba
nce
(at 2
77nm
)
Concentration (ppm)
Figure 3.8: OIT calibration curve obtained from the UV-Vis spectrometer
3.3.4.2 Advantages and limitations of the UV-VIS in relation to Beer-Lambert law
The UV-VIS spectrometer offers the advantage of being a very rapid method of determining
the concentration of various compounds in samples. The technique is also simple to use and
not labour intensive. Samples can be measured over a very wide range of wavelengths in
order to determine the maximum absorbance of the particle(s) being analysed.
The linearity of the Beer-Lambert law can be limited by chemical and instrumental factors.
The causes of nonlinearity include [90]:
• deviations in absorptivity coefficients at high concentrations (above 0.01 Molar) due
to electrostatic interactions between molecules in close proximity

Chapter 4 Results of Mineral Characterisation
67
• scattering of light due to particulates in the sample
• fluorescence or phosphorescence of the sample
• changes in refractive index at high analyte concentration
• shifts in chemical equilibrium as a function of concentration
• non-monochromatic radiation, deviations can be minimized by using a relatively flat
part of the absorption spectrum such as the maximum of an absorption band
• stray light
3.4 Strength of biocide adsorption onto minerals
The ability of organic as well as inorganic materials to participate in adsorption, adhesion and
catalysis is facilitated by their surface geometry and bulk porosity. The method of Flow
Microcalorimetry (FMC) has been used to study the association of these particulates with
probes having known acid-base characteristics.
3.4.1 General principles of Flow Microcalorimetry (FMC)
To assist in the selection of appropriate carriers (see Table 3-1), Flow Microcalorimetry was
used to better understand the nature of the interactions between the biocide and active sites on
those carriers. The Flow Microcalorimeter (FMC) is able to measure heat exchanged as a
result of adsorption/desorption occurring under flow conditions [86]. A differential
Refractometer, downstream to the calorimeter, allows quantification of an adsorbate (the
biocide, in this case). The amount of solute adsorbed on the solid is calculated from the
comparison of parallel experiments conducted with the solid and a non-adsorbing probe. The
difference between the refractometer signals of the two experiments permits the calculation
of the amount of adsorption. In aqueous solutions, heat flux into or out of the sample almost

Chapter 4 Results of Mineral Characterisation
68
always happens on reaction. These reactions may involve a wide variety of situations, e.g.,
the interaction of two molecules (such as an isothiazoline biocide and its guest), changes in
the conformation of complex macromolecules (such as proteins or DNA), or even in the
structure of very complex multimolecular colloidal drug delivery systems (such as
liposomes). Microcalorimetry uses a suite of techniques and appropriate calibrations to
directly measure enthalpies associated with adsorption and desorption, and heat capacity
changes that arise when chemical reactions occur.
3.4.2 Possible FMC results
Calorimetric and concentration measurements obtained from the FMC can uncover the nature
of interactions between the substrates (carriers) and the biocide (either it is a physisorption or
a chemisorption effect). These interactions can take the following forms:
• Total adsorption – no desorption
• Total adsorption – partial desorption
• Total adsorption – total desorption
• Partial adsorption – no desorption
• Partial adsorption – partial desorption
• Partial adsorption – total desorption
• No adsorption
The ideal solution would be for the minerals used to adsord a fairly large amount of the
biocide, and release it over a long period of time (Total adsorption and total desorption
over time, preferably months, or even years). In Chapter 4, the results of the minerals
characterisation are presented and discussed.

Chapter 4 Results of Mineral Characterisation
69
CHAPTER FOUR
RESULTS OF MINERAL CHARACTERISATION
4 Chapter Four – Results of Mineral Characterisation

Chapter 4 Results of Mineral Characterisation
70
4.1 Mineral characterisation studies
In this chapter, the results of the characterisation of the nine minerals in Table 3-1
(crystallography, crystal structure, particle size and morphology) are presented. An attempt is
made to relate these structural factors to the potential for controlled release of the
isothiazoline biocides (OIT and CIT/MIT). It is expected that in order to be a suitable
substrate for sorption and bioassay studies, a mineral must:
• Have almost little or no structural water in its core (as the amount of water affects
the purity of the mineral and can inhibit the adsorption of the biocides)
• Have a high degree of purity (in this case, the FeO content of the mineral must be
minimal, as it affects the optical property of the paint formulations containing the
mineral)
• Have small particle size following the milling process, as this will increase the
available surface area of the mineral per gram, potentially leading to larger amounts
of biocide being adsorbed
4.2 Mineral size distribution analysis by the Mastersizer
Industrial minerals are often sold in the form of aggregates, powders or slurries. The form is
often dictated by the eventual application: dry or damp aggregates for concrete, powders as
additives to plastics, while water based paint and paper coatings may require well dispersed
suspensions.
The size of the particles in each system is influential in the behaviour of the final material;

Chapter 4 Results of Mineral Characterisation
71
the smoothness (gloss) of a paint film, the strength of a ceramic article, the appearance of
concrete. For this reason the industry has evolved standard measures of the particle size
distribution.
The term distribution is important because the particles are rarely all the same size; instead
they are many sizes and the statistical term “distribution” is used to describe the range of
particle sizes present. A powder with both very small and very large particles is said to have a
wide distribution, whereas a powder in which all the particles have similar sizes is called a
narrow (or steep) distribution. These terms are born from the graphical representations used
to describe distributions, which are called frequency diagrams or histograms. This type of
graph shows the fraction (most often mass, but sometimes volume or number) of particles in
each size range, as in Figure 4.1.
0
50
100
0.1 1 10 100particle diameter (microns)
rela
tive
popu
latio
n
Narrow Distribution Broad Distribution
Figure 4.1: Frequency diagram for a broad and narrow particle size distribution [courtesy of
Imerys].

Chapter 4 Results of Mineral Characterisation
72
Note that a logarithmic scale is often used, as particle size distributions often have a
lognormal character
Distributions are however often shown in their integrated (cumulative) form as in Figure 4.2.
The cumulative form allows direct reading of the “% passing”, “i.e. smaller than a specified
size” (see Figure 4.1). This is widely considered a more intuitive way to describe a size
distribution. It also has the key advantage that several distributions may be plotted on the
same graph allowing easy comparison.
0
25
50
75
100
0.10 1.00 10.00 100.00
particle diameter (microns)
mas
s % b
elow
50% of particles <5 microns
90% of particles <18 microns
Figure 4.2: Cumulative (integrated) version of Figure 4.1, showing the % passing (i.e. below)
any particular diameter. In this form the “narrow” distribution is called “steep” [courtesy of
Imerys].
The d50 and d90 refers to 50% and 90% respectively of particles present below a particular
diameter (can be read off the X-axis). As opposed to a population of particles that are all the
same size (monodisperse), most powders have particles that are of several sizes

Chapter 4 Results of Mineral Characterisation
73
(polydisperse), forming a distribution. Most modern systems can calculate the distribution
with no a priori assumptions, meaning that irregular distributions, such as those with two
peaks (bimodal) or more, can be measured.
The particle’s diameter (the hydrodynamic diameter) is calculated from the measured volume
of the particle, found by assuming a spherical shape. This can be disadvantageous with the
minerals used, as the particles are often non spherical (e.g. Kaolin) and so the sizes recorded
were dependent on the angle at which light hits each particle [61].
diameterdA
diameterdA
diameterdA
Figure 4.3: The diameter of a circle with the same area as a 2-D projection of a particle may
be a useful estimate of its size
The equivalent sphere diameters can be obtained in several ways:
• Diameter of the sphere with the equal volume dv. This can be calculated from the
volume using:
3/16
⎟⎠
⎞⎜⎝
⎛=πVdv Equation 4.1

Chapter 4 Results of Mineral Characterisation
74
where V is the volume of the particle. The volume may be measured, for example, with 3-D
imaging systems.
• Diameter of the sphere with equal surface area ds.
2/1
4⎟⎠
⎞⎜⎝
⎛=πAds Equation 4.2
where A is the surface area of the particle (in m2/g). The surface area may be measured with
techniques such as Nitrogen BET.
4.2.1 Materials and Methods
A 5 g sample of mineral powder was mixed in a beaker with 5 ml of deionised water (a
dispersant solution containing 1% w/v sodium carbonate and 0.5% w/v sodium
hexametaphosphate may be added for a better dispersion). Droplets of this suspension were
then transferred to the Mastersizer’s own water tank for analysis (particles were illuminated
using a parallel beam of light, usually from a low-power He/Ne laser). Laser diffraction
particle size analysis is based on the scientific phenomenon that particles in a laser beam
scatter laser light at angles that are inversely proportional to the size of the particles. Large
particles scatter at small forward angles while small particles scatter light at wider angles. By
the use of Fourier and Reverse Fourier optics, this scattering is imaged to an array of
detectors at the focal plane of the optics. There is a direct relationship between the
distribution of the scattered light energy on these detectors and the particle size distribution
which gives rise to it. The Mastersizer software uses Mie theory to obtain an optimal analysis
of this light energy distribution to arrive at the size distribution of the particles.
Data obtained were logged into an Excel spreadsheet to plot a cumulative “mass percent finer

Chapter 4 Results of Mineral Characterisation
75
than” distribution, both as a curve and table. More comprehensive results, including a
particle number distribution, can also be obtained.
4.2.2 Results
0
25
50
75
100
0.1110100
Particle Size (microns)
Und
er-S
ize
(% b
y w
eigh
t fi
ner
than
)
Suprex Infilm 939
NPD-16A MCBP
Supreme
Figure 4.4: Volume distribution of the platy minerals
The volume distributions shown on Figure 4.4 indicated that the particle sizes for all the platy
minerals used ranged from 0.1 to around 98 microns. The shapes of the curves were flatter
rather than steeper for all the six minerals. These observations confirmed that the particles
were polydispersed, with a broad distribution range. It appeared from the distribution range

Chapter 4 Results of Mineral Characterisation
76
that there were more particles below 10 µm size than above for all the minerals.
Figure 4.5: Volume distribution of the non-platy minerals
The volume distributions shown on Figure 4.5 indicated that the particle sizes for all the
irregular and rod-shaped minerals used ranged from 0.1 to around 98 microns. The shapes of
the curves were flat for the New Zealand halloysite, and steep for the amorphous silica-based
minerals (calcium silicate T-38, diatomaceous earth Celtix and silica Carplex CS-5). These
observations confirmed that all the particles were polydispersed, with both a broad and
narrow distribution range for halloysite and the amorphous minerals respectively. It appeared
from the distribution range that there were more particles below 10 microns size than above
for all the minerals (except for T-38 and Celtix).
0
25
50
75
100
0.1110100
Particle Size (microns)
Und
er-S
ize
(% b
y w
eigh
t fin
er th
an)
Halloysite Celtix
T-38 Carplex CS-5

Chapter 4 Results of Mineral Characterisation
77
The steepness, d30, d50, d70 and d98 values of the minerals are presented in Table 4.1
Table 4.1: Size distribution and steepness factors of the minerals used.
Minerals d30 d50 d70 d98 (top
cut) Steepness (d70 / d30)
Kaolin-Infilm
939 4.3 8.7 16.2 46.1 3.8
Kaolin-Suprex 3.1 6.5 13.3 47.5 4.3
New Zealand
Halloysite 1.4 4.3 10.5 39.1 7.4
Kaolin-Supreme 1.6 3.1 5 18.3 3.1
Kaolin-NPD-
16A 3.6 6 10 40.1 2.8
Silica-Carplex 4.5 6 7.7 16.2 1.7
Calcium silicate-
T-38 12.3 16.7 21.5 41.1 1.7
Diatomaceous
Earth-Celtix 8.2 12.6 18 49.8 2.2
Montmorillonite-
MCBP 1.56 2.5 4.6 25.1 2.9
(All values, except the steepness ratios, are in µm)
As previously stated, if a d50 value of a particular mineral is X, this meant that 50 per cent by
weight of the particles present is below X (and 50% above it). Within the mineral processing
industries, this value is considered important in evaluating the particle size of various
minerals. The d50 values in Table 4-1 indicated that montmorillonite MCBP was the finest
mineral, closely followed by kaolin supreme, New Zealand halloysite, carplex, NPD-16A,
kaolins suprex and infilm 939, diatomaceous earth celtix and calcium silicate T-38

Chapter 4 Results of Mineral Characterisation
78
respectively.
The “Top Cut” d98 values showed that the silica (Carplex), the kaolinite (supreme) and the
montmorillonite (MCBP) were the finest three clays of the group of minerals studied. The
kaolin Supreme is an Imerys mineral, readily available, with a relatively small surface area
(17 m2g-1), but the best d98, and the second best d50 and d70 of all the minerals in Table 4-1.
Those attributes have made this mineral an ideal candidate for use in the remainder of all
experiments carried out in this project.
The terms d50 and d98 are of particular importance when considering fine particles. An
additional property is the steepness of the particle size distribution curve (see Table 4.1).
Various definitions are used in the mineral processing industry to describe this property.
Imerys prefers to use the term “steepness factor”. This steepness factor is the quotient of the
d70 and the d30 values. A curve with the steepness factor ≥ 2 is described as “flat” and those
with the factor of < 2 as “steep”. In other words, a fine extender (mineral used in the paint
and/or paper industries) with a flat particle distribution curve contains a wide range of
different size particles e.g. from under 0.1 µm to 3 µm. An extender with a steep particle size
distribution curve contains particles within a narrow size range. Ideally such an extender
would be isodiametric (all particles would be of the same size). Particle size is very important
in the paper and coating industries. In the coating industry, an extender with a high
isodiametric particle content offers the following advantages:
• Increased opacity in heavily filled interior emulsion paints
• Easy dispersion in oil-based, synthetic binders

Chapter 4 Results of Mineral Characterisation
79
• Excellent gloss and the best gloss retention in very glossy systems
• Shortening of the drying time of water-reducible coatings through the capillary
effect
• Spacing extender with optimal particle size distribution for the partial replacement of
titanium dioxide (very expensive)
The silica Carplex and the calcium silicate T-38 were the only two minerals with steep
distribution curves, having a steepness factor of 1.7. The various percentage values still
showed Carplex was finer (smaller particle sizes) than T-38 (large particles size with narrow
distribution). Diatomaceous Earth Celtix, the kaolins NPD 16A, Supreme, Infilm 939,
Suprex, the Montmorillonite MCBP, and New Zealand Halloysite all had very flat
distribution curves, with the Halloysite’s curve being the broadest (see Figure 4.5), possibly
due to its tubular shape.
4.3 Mineral characterisation by X-ray Fluorescence (XRF)
The chemical composition of all the minerals used in this study, arising from their general
composition detailed in Table 3.1 of Chapter 3, was determined by XRF. This technique was
ideal for the measurement of most elements (major and minor), and was thus a preferred
technique for whole rock characterisation.
4.3.1 Materials and Method
The minerals (10 g of material is generally used) were prepared as compressed powder pellets
or fused glass disc and excited with x-ray radiation, normally generated by an x-ray tube
operating at a potential of 32 kVolts. The tests were performed at high temperature (1000oC)
in order to eliminate any volatile compounds such as structural “combined water” trapped
Chapter 4 Results of Mineral Characterisation
80
within the samples (hydrates or hydroxy-compounds). The elimination of this trapped water
lead to the structure of the minerals alone to be characterised. The amount of water present
was determined from a Loss On Ignition (LOI) test, where samples were ignited in a suitable
container (platinum, unglazed porcelain or vitreous silica) at 1000°C for about 1 hour, and
the weight loss determined. This method may also be used to determine the levels of carbon
dioxide present in carbonate based minerals. The level of purity of two minerals of similar
structures can be determined by this method (the amount of impurity liberated).
4.3.2 Results
Results obtained from the XRF analysis of the minerals are in table 4.2, with major and minor
trace elements recorded.

Chapter 4 Results of Mineral Characterisation
81
Table 4.2: XRF data detailing the percentage of the chemical composition of the nine
minerals used
Total 99.91
99.96
99.99
99.89
99.98
99.39
100
100
100

Chapter 4 Results of Mineral Characterisation
82
Table 4-2 shows the various chemical components of the minerals used in this study. The
Loss On Ignition (LOI) values showed that, with the exception of the silica, all the minerals
had some structural water trapped within them. The percentages of water liberated from
infilm 939, supreme, suprex and NPD-16A were very similar, as these minerals had the same
kaolinite structure and almost the same processing route. Suprex, with a LOI of 19.96%, had
the most structural water in its core. This indicated that, of all the minerals tested, it was the
least pure mineral before this initial test. The test also indicated that the silica obtained from
Degussa was very pure, with almost no LOI value. This is due to its chemical structure, SiO2,
with no bound water.
Kaolinite (the main constituent of most clays) has the formula Al2Si2O5(OH)4. Its structure
arises from the combination of silica (SiO2) and aluminium oxide (Al2O3) layers into a
hexagonal sheet (see Figure 4.6). Hydrogen bonding between the alternating oxygen and
hydroxyl surfaces causes these platelets to stack together, sometimes resulting in stacks up to
100 µm in length which consist of hundreds of thousands of layers [92]. The presence of this
structure in all the minerals used (with the exception of silica-Carplex, calcium silicate T-38,
and diatomaceous earth-Celtix) was shown using this XRF. It was hoped the hydrogen bonds
between the oxygen and hydroxyl surface could be broken, upon hydration of the minerals, to
allow the biocide to be intercalated.

Chapter 4 Results of Mineral Characterisation
83
Figure 4.6: Structure of a kaolinite layer [93]
Table 4-2 also showed that the silica Carplex CS-5 was the highest grade of the three SiO2
based minerals used, with the silicon dioxide comprising 99.88% of the minerals. The
diatomaceous earth Celtix had 91.7% of SiO2, with minor traces of Al2O3, Fe2O3, CaO, MgO
and Na2O also detected. The calcium silicate T-38 (formed by the reaction of calcium oxide
and silica) contained 46.29% of SiO2 and 30.86% of CaO. Nevertheless, minor traces of
Al2O3, Fe2O3, MgO and Na2O, K2O and CaCO3 were also detected in this analysis.
The presence of iron oxide (Fe2O3), also known as hematite, could affect the optical property
(whiteness and yellowness) of these minerals in industrial paint applications. Great care is
generally taken during the beneficiation process (explained in Chapter 1) of these minerals to
remove this element by means of magnetic separation and/or bleaching. The montmorillonite
MCBP seemed to have the highest percentage of Fe2O3, at 3.73%. The effect of these ions on
the paint’s mechanical and optical properties is fully discussed in Chapter 8.

Chapter 4 Results of Mineral Characterisation
84
4.4 Material characterisation by X-ray Diffraction (XRD)
In this study, the XRD method was used to obtain information on the nature of the crystals
present in the minerals used.
4.4.1 Material and method
Samples were analysed as powders (10 g) with grains in random orientations. The samples
were placed in an intense beam of X-rays of a single wavelength (monochromatic X-rays),
producing the regular pattern of reflections. As the crystal was gradually rotated, previous
reflections disappeared and new ones appeared; the intensity of every spot was recorded at
every orientation of the crystal. Multiple data sets were collected, with each set covering
slightly more than half a full rotation of the crystal and typically containing tens of thousands
of reflection intensities. Data collected were combined computationally with complementary
chemical information to produce and refine a model of the arrangement of atoms within the
crystal. The final, refined model of the atomic arrangement (crystal structure) can then be
stored in a computer database. Consequently, X-ray diffraction pattern is the fingerprint of
the periodic atomic arrangements in a given material.
4.4.2 Results
XRD data for the minerals used are summarised in Table 4.3.

Chapter 4 Results of Mineral Characterisation
85
Table 4.3: XRD data showing percentage of various crystals present in each of the nine
minerals used in this study
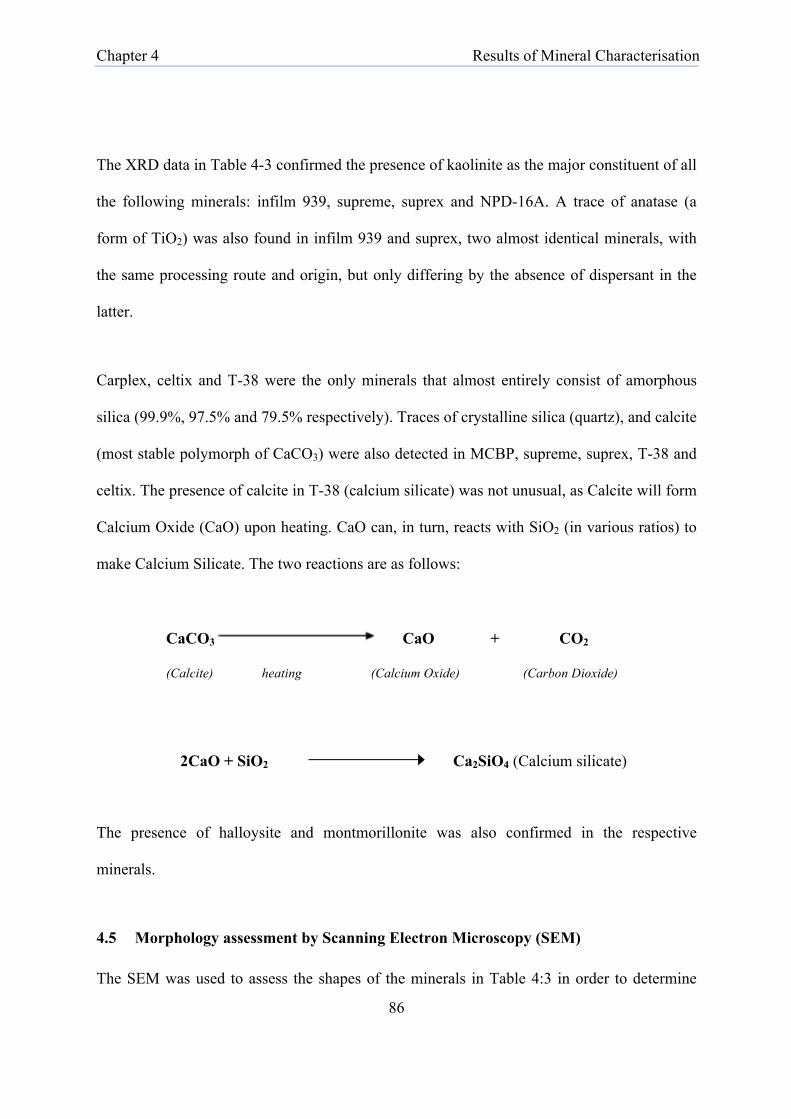
Chapter 4 Results of Mineral Characterisation
86
The XRD data in Table 4-3 confirmed the presence of kaolinite as the major constituent of all
the following minerals: infilm 939, supreme, suprex and NPD-16A. A trace of anatase (a
form of TiO2) was also found in infilm 939 and suprex, two almost identical minerals, with
the same processing route and origin, but only differing by the absence of dispersant in the
latter.
Carplex, celtix and T-38 were the only minerals that almost entirely consist of amorphous
silica (99.9%, 97.5% and 79.5% respectively). Traces of crystalline silica (quartz), and calcite
(most stable polymorph of CaCO3) were also detected in MCBP, supreme, suprex, T-38 and
celtix. The presence of calcite in T-38 (calcium silicate) was not unusual, as Calcite will form
Calcium Oxide (CaO) upon heating. CaO can, in turn, reacts with SiO2 (in various ratios) to
make Calcium Silicate. The two reactions are as follows:
The presence of halloysite and montmorillonite was also confirmed in the respective
minerals.
4.5 Morphology assessment by Scanning Electron Microscopy (SEM)
The SEM was used to assess the shapes of the minerals in Table 4:3 in order to determine
CaCO3 CaO + CO2
(Calcite) heating (Calcium Oxide) (Carbon Dioxide)
2CaO + SiO2 Ca2SiO4 (Calcium silicate)

Chapter 4 Results of Mineral Characterisation
87
how these minerals could perform as controlled release media. The principles underpinning
this technique were explained in section 3.1.3 of Chapter 3.
4.5.1 Material and method
Samples of dried powder (5 g) were coated in a thin film of gold to prevent charge build-up
in the microscope and erosion, which could lead to image distortion. Coating was performed
in a sputter coater. The sample was placed on conductive carbon film on an earthed SEM stub
in an inert argon atmosphere. A cathode ray tube was then used to coat the sample. The
cathode is made of gold, and as a very high voltage was applied to the tube, the argon in the
sputter coater ionised. Bombardment of the gold in the cathode by ionised argon atoms
sputtered off gold atoms from the cathode onto the earthed sample, effectively scanning its
surface.

Chapter 4 Results of Mineral Characterisation
88
4.5.2 Results
Table 4.4: Electron micrographs of different minerals
Platy mineral - Kaolin (Infilm 939)
Rod-shaped mineral - New Zealand
Halloysite
Amorphous mineral – Silica
(Carplex CS-5)
Irregular-shaped mineral diatomaceous
Earth (Celtix)

Chapter 4 Results of Mineral Characterisation
89
The SEM revealed four different shapes materials, and it was hoped each of these could be
exploited for controlled release purposes. The platy minerals (the Kaolins Infilm 939,
Supreme, Suprex, NPD-16A and Montmorillonite MCBP) showed a more hexagonal shape
under the microscope, due to the presence of kaolinite detected by XRD. Several of these
hexagonal layers stack together to give the platy character of these clays, and it was hoped to
use the interlayer spaces as media to carry the biocide.
The halloysite was shown to have a tubular shape under the microscope. Halloysite is an
aluminosilicate clay mined from natural deposits in countries such as America, Brazil, China,
France, Japan, South Korea and Turkey. It is chemically similar to kaolin, but differs in
having a hollow microtubular rather than a stacked plate-like structure [94]. Halloysite
typically is formed by hydrothermal alteration of aluminosilicate minerals. A mismatch in the
two-layered alignment of the tetrahedral sheet of silica bonded to the octahedral or gibbsite
sheet of alumina causes the wall to curve into the cylindrical shape [95]. The mineral can also
occur intermixed with Dickite, Kaolin, Montmorillonite and other clay minerals. It was
hoped to utilize the hollow tube to store the biocide and provide a slow release mechanism of
the correct quantity.
The amorphous silica and the irregular “mushroom-like shape” calcium silicate T-38 and
diatomaceous earth Celtix minerals were also shown under the SEM. Although T-38 and
Celtix were shown to have a large amount of amorphous material, they also contained some
quartz and calcium carbonate (calcite), possibly conferring them the irregular shape observed
(see Table 4-3 for crystal composition). These minerals are normally used on the market for
filtration purpose because of their porous structure and ability to carry considerable amount
of material in their core. It was hoped, in this project, to use these sponge-like minerals for

Chapter 4 Results of Mineral Characterisation
90
controlled release of the OIT biocide.
4.6 Discussion
It was necessary to characterise the minerals used in this study in order to understand how
best they could be used for the controlled release of the biocides OIT and CIT/MIT. The
characteristics of importance were the chemical compositions, crystal structures,
morphologies and particle size distributions.
In order to determine the particle size distributions of the nine minerals used, it was
preferable to measure them whilst they are in a wet dispersion. The use of dry measurement
techniques could have lead to inaccurate results due to the agglomerates in the particles.
These minerals are most often used as a suspension in water during the manufacturing
processes, and so a particle size measurement in this state was thought more useful, allowing
the behaviour of the clay in suspension to be determined and characterised. However, Mie
theory holds good for all particulate materials in all transparent media – liquids or gases or
even transparent solids and thus a new Mastersizer equipment is able to measure suspensions,
emulsions, spray droplets, smokes, vapours or even dry powders, giving the user unparalleled
versatility of measurement capability. The Mastersizer Side-angle and backscatter detectors
allow the extension of the dynamic range with no sacrifice in resolution.
The particle size calculations using the Malvern Mastersizer required that the particles were
well dispersed and disaggregated, and were sufficiently diluted in the fluid so that adjacent
particles did not interfere with one another. This does not work particularly well for particles
below 100 nm due to the effects of Brownian motion. The method was also somewhat

Chapter 4 Results of Mineral Characterisation
91
dependent on consistent particle density, as denser particles will settle faster. The
hydrodynamic ESD is an important measure and is extensively used in the mineral processing
industries, and is particularly useful because the Stokes settling principle is widely used to
dewater or classify particles into different size fractions. For regularly shaped particles, such
as spheres or cubes, the correlations works reasonably well and have been developed and
refined over many years. The models still work reasonably well for slightly irregular
particles; this accounts for perhaps the majority of particles, but care needs to be taken for
some particular circumstances. Hollow or porous particles, acicular or filamentary particles,
lamellar or platy particles can all give misleading output from the light-scattering models, and
the results therefore need to be treated with caution. The “Top Cut” d98 values showed that
the silica (Carplex), the kaolinite (Supreme) and the montmorillonite (MCBP) were the finest
three clays of the group of minerals studied. Most of Imerys’ minerals are used in the paper
and coating industries, and it was necessary to determine how fine each of the nine minerals
was. This property was important as a fine mineral can influence the rheology, density, scrub
and corrosion resistance, and packing density of the paint formulation in which it is (even if a
mineral was found to be a very good controlled release medium, it may still have to be
reasonably fine for use in paints or paper). Carplex (the silica), MCBP (the montmorillonite)
and supreme (the kaolin) were selected for the paint and bioassay work described in see
Chapter 7 for this reason.
The XRD experiments described the crystal nature of the nine minerals used. The presence of
kaolinite, halloysite and montmorillonite in the phyllosilicate minerals (halloysite, suprex,
supreme, MCBP, NPD-16A and infilm 939) was confirmed, with infilm 939 appearing to be
the “purest” of all the kaolinite at 98%. The technique was also able to show the amorphous

Chapter 4 Results of Mineral Characterisation
92
nature of the three silicate minerals (carplex, T-38 and celtix). Quartz was also present in
many other minerals. Oxygen is the most abundant element in the earth's crust, and Silicon is
the second most abundant. Due to such abundance, the formation of silica (SiO2) in nature is
very common. This explained why traces of silica were found in all but two of the minerals
examined. The chemical compositions of these crystals were analysed by the XRF.
Using the XRF technique, it was possible to eliminate the structural “combined water”
trapped within the samples by Loss On Ignition (LOI) test. LOI values showed that, with the
exception of the silica, all other minerals had trapped water within their cores. Major
elements found included silicon dioxide (in all minerals), aluminium oxide (in all but the
amorphous silica), and calcium oxide (only found in the calcium silicate T-38). The presence
of oxygen and silicon in all the minerals was expected. The presence of aluminium oxide
(Al2O3), an amphoteric oxide of aluminium produced by the Bayer process from bauxite, can
confer an abrasive nature to the minerals in which it is a constituent, due to its hardness.
The kaolinite-based minerals used in this study (supreme, suprex, MCBP, infilm 939, NPD-
16A, New Zealand halloysite) are part of the phyllosilicates (from the Greek phyllon, leaf), or
sheet silicates. They form parallel sheets of silicates tetrahedral with Si2O5, and are
sometimes referred to as 1:1 or 2:1 clay. A 2:1 clay consists of an octahedral sheet
sandwiched between two tetrahedral sheets (montmorillonite), whereas a 1:1 clay would
consist of one tetrahedral sheet and one octahedral sheet (suprex, supreme, infilm 939, NPD-
16A and New Zealand halloysite). These sheets are linked through oxygen atoms [72], and it
was hoped to intercalate them with the biocides in these controlled release experiments. The
main differences between these two clays are summarised in Table 4.5.

Chapter 4 Results of Mineral Characterisation
93
Table 4.5: Major differences between a 1:1 and a 2:1 clay
Characteristic Kaolinite Montmorillonite Layer type 1:1 2:1
Typical chemical formula [Si4] Al4O10(OH)8 Mx[Si8]Al3.2Fe0.2Mg0.6O20
(OH)
Particle size (µm) 0.5 – 5.0 0.01 – 1.0
Specific Surface area
(m2/g) 7 – 30 600 - 800
Shrink/swell potential Non-expansive Highly expansive
Interlayer space None (very small) Very large
Cation Exchange Capacity
(cmolc/kg soil) 2 - 15 80 - 150
The three silica-based minerals used (carplex CS-5, T-38 and celtix) are thought to interact
with the isothiazoline biocides in a different way (see section 2.6 of Chapter 2).
Scanning Electron Microscopy (SEM) was used to examine the shapes of the minerals used
because it was more useful for looking at morphological changes than other types of
microscopy methods. Using this technique, four different shape minerals were revealed:
• Platy for the four kaolins and the montmorillonite (suprex, supreme, NPD-16A, infilm
939 and MCBP)
• Rod-shape for the New Zealand halloysite
• Amorphous for the silica (Carplex CS-5)
• Irregular for the diatomaceous earth and calcium silicate (celtix and T-38)

Chapter 4 Results of Mineral Characterisation
94
It was hoped that the morphologies described above could help entrap and slowly release
the isothiazoline biocides.
The characterisation experiments uncovered the shapes, chemical compositions, crystal
structures, and particle size distributions of the nine minerals used. In the next Chapter, an
attempt will be made to discover how these characteristics of the minerals could be used
to adsorb the isothiazoline biocides in both static and dynamic environments. Flow
Microcalorimetry will be used to estimate the sorption energies (and amounts of biocide),
and HPLC will measure the concentration of biocide in solution after the adsorption in the
high shear mill.

CHAPTER FIVE
ADSORPTION ISOTHERM STUDIES
5 Chapter Five – Adsorption Isotherm Studies

Chapter 5 Adsorption Isotherm Studies
96
In this chapter, data from the Flow Microcalorimeter (FMC) and adsorption isotherms of the
isothiazoline biocides (OIT and CIT/MIT) onto the minerals are presented and discussed. The
molecular footprints of the biocides on selected mineral surfaces were also determined. These
measurements were made in order to assess the suitability of the minerals for controlled
release of biocides in paint films (described in chapter 7).
5.1 Flow Microcalorimetry (FMC)
The biocide used in this experiment was OIT. It was the only one of the two isothiazolines
that could be obtained in its pure form (100%). Running the pure biocide on the FMC was
necessary to assess the true amount of the adsorbent on the minerals’ surface and the energies
gained or liberated as a result of the interaction processes.
5.1.1 Materials and Methods
The FMC used was a Microscal 3V upgraded to an all-PTFE fluid path (see Figure 5.1). The
instrument was linked to a Microscal thermistor bridge control unit that was connected to one
channel of a Perkin–Elmer 970 series data station. The FMC cell outlet was connected to a
Waters 410 differential refractometer; the electrical output of the latter was connected to the
second channel of the 970 series data station. Energy calibration of the FMC was achieved
via passage of 3 x 10⁻⁴ W electric power for 300 seconds through a filament integrated into
the cell outlet connector. Calibration of the differential refractometer was achieved using a 20
µl loop, i.e. a 20 µl OIT solution of known concentration. The 970 series interfaces were
linked to a PC for data manipulation using Perkin–Elmer Total Chrom version 6.3.1 software.
The FMC studies were conducted using a cell temperature of 27 °C (±1 °C) and a probe

Chapter 5 Adsorption Isotherm Studies
97
concentration of 0.3% w/v. The solvent flow rate was 4 ml h−1. The mineral powders were
weighed into a graduated tube such that the tapped volume of the sample was 0.15 cm3.
Figure 5.1: Schematic of FMC with Polytetrafluoroethylene (PTFE) fluid path [61]
The experimental error of the FMC measurements was in the order of ±2.5%, obtained by
averaging over multiple replicates. Decahydronaphthalene was used as the non-adsorbing
probe, and cyclohexane (HPLC grade dried over 4Å molecular sieve) as the solvent for the
isothiazolinone. The probe and the solvent were both obtained from Sigma-Aldrich. OIT
(100% pure) was obtained from Thor Chemicals in Germany. All nine minerals detailed in
Table 4-1 were used. The amount of probe adsorbed was determined by subtraction of the
non-adsorbing probe trace from the adsorbing probe trace, once limiting deflection had been
obtained. The area of the resulting peak is proportional to the amount adsorbed or desorbed.
The thermal and differential refractometer responses were calibrated using 2 and 7 calibration
peaks, respectively.

Chapter 5 Adsorption Isotherm Studies
98
Within the FMC cell the adsorbent (volume 0.15 cm3; 350–800 mg) was equilibrated, with
cyclohexane, for 18 h before measurements commenced. This conditioning period was
necessary to remove the vast majority of loosely bound surface water from the substrates.
Initially the adsorbate in cyclohexane was passed through the cell containing the adsorbents
(each in turn), and after adsorption had taken place cyclohexane was passed through the cell
to facilitate desorption. For both adsorption and desorption measurements, the data reported
are that for the average result between two runs.
The ratio of the adsorption energy (per unit area or unit mass of the substrate) to the
desorption energy can be considered to be a measure of how strongly the probe was retained
on the surface of the clays. A zero desorption energy means that the probe was irreversibly
(very strongly) adsorbed under the conditions used. If the adsorption energy is equal to the
desorption energy, adsorption of the probe is completely reversible and the biocide can be
considered weakly adsorbed.
5.1.2 Results
The results of the FMC work are presented in Figures 5.2 (heat), 5.3 (amount), and
summarised in Table 5.1

Chapter 5 Adsorption Isotherm Studies
99
Figure 5.2: Energies of adsorption and desorption of OIT per gram of minerals used in the
FMC under flow conditions.

Chapter 5 Adsorption Isotherm Studies
100
17.25 14.79
87.78
19.38
105.13
15.1
53.94
21.59
6.24
23.44
5.106.46 7.04 4.3211.06
35.72
3.595.47
0
20
40
60
80
100
120
Kao
lin -
Infil
m 9
39
Kao
lin -
Supr
ex
Silic
a - C
arpl
exC
S-5
New
Zea
land
Hal
loys
ite
Mon
tmor
illon
ite -
MC
BP
Kao
lin -
NPD
-16A
Kao
lin -
Supr
eme
Cal
cium
Sili
cate
-T-
38
Dia
tom
aceo
usEa
rth -
Cel
tix
Minerals used
Am
ount
[mg/
g]
Adsorption
Desorption
Figure 5.3: Amount of OIT adsorbed and desorbed per gram of minerals used in the FMC
under flow conditions

Chapter 5 Adsorption Isotherm Studies
101
Table 5.1: Summary of the ratios of heat of sorption (with molar heat of interaction) and
amounts of OIT after the FMC run
Surface area (m2/g)
Energy ratios (Adsorption/ Desorption)
Amount ratios (Adsorption/ Desorption)
Molar Heat of Interaction
(kJ/mole OIT) (M.h.i*)
Kaolin (Infilm
939) 22 1.87 2.67 0.06
Kaolin (Suprex) 25 4.05 2.1 0.05
Silica (Carplex
CS-5) 150 3.35 3.74 0.05
NZ Halloysite 50 2.34 3.8 0.06
Montmorillonite
(MCBP) 39 or 800 (**) 2.08 2.94 0.07
Kaolin (NPD
16-A) 23 1.85 1.14 0.12
Kaolin
(Supreme) 17 2.53 3.49 0.05
Calcium
Silicate (T-38) 122 2.67 4.88 0.06
Diatomaceous
Earth (Celtix) 24 11.66 6.01 0.07
The molar heat of interaction was calculated using equations 5.1 and 5.2
OIT adsorbed (mole) = amount adsorbed (g) / 213 (1 mole OIT) Equation 5.1
M.h.i = Heat of adsorption (kJ) / OIT adsorbed (mole) Equation 5.2
(**) When MCBP is dry or wet, respectively

Chapter 5 Adsorption Isotherm Studies
102
Figure 5.2 showed that the heat of adsorption energies were greater than the desorption
energies for all the minerals used. Energy ratio values in Table 5-1 were all over 1, indicating
that some (or most) of the OIT molecules remained on the minerals’ surface after desorption
had taken place. However, differences in the values of adsorption energies could be due to
variations in accessible surface areas of the minerals (and the strength of the biocide’s bond
onto the surfaces). Figures 5.2 and 5.3 show that the highest surface area minerals, the
montmorillonite MCBP, the silica carplex CS-5 and the calcium silicate T-38 strongly
adsorbed the OIT molecule, possibly due to their high surface area and level of porosity
respectively. The sorption energies and the amounts of OIT on all the kaolins and halloysite
minerals were very low, possibly reflecting their lower surface areas. Porous and irregular
shaped minerals (carplex, celtix and T-38) showed the highest sorption ratios of OIT
(amount), contrary to the tubular New Zealand halloysite. This indicated that porous minerals
carried more biocide molecules. The heat of desorption for all the probes indicated significant
irreversible adsorption. The diatomaceous earth celtix and the kaolin suprex, with ratios of
11.6 and 4.05 respectively, appeared to almost irreversibly holding on to OIT, indicating that
they would be poor controlled release substrates within the timeframe of the experiment. On
the contrary, the attachment of OIT to the kaolin NPD-16A could be said to be totally
reversible (amount ratio of 1.14), perhaps also indicating that this mineral could not be used
in controlled release experiments, as the biocides would be released too quickly. The molar
heat of interaction was similar for all the minerals, with the exception of NPD-16A (0.13
kJ/mole OIT). These primary adsorption results indicated that the New Zealand halloysite,
the diatomaceous earth celtix and the kaolin suprex could be ruled out as good candidates for
controlled release purposes.

Chapter 5 Adsorption Isotherm Studies
103
5.2 Adsorption Isotherms
The isotherm experimental protocol used in this study was taken from an Ineos Silica patent
(US patent number 6905698) and modified before used (minerals used and amounts were
different from those in the patent, together with the way the biocide was inserted into the
Halloysite tubes). In the adsorption experiments, it was assumed that the amount of biocide
not present in water had adsorbed to the surface of the carriers. The adsorption capacity of six
of the minerals in Table 5-1(the kaolins infilm 939, suprex, NPD-16A, the New Zealand
halloysite, the silica carplex and the montmorillonite MCBP) was determined experimentally
by measuring the adsorption equilibrium isotherms (static environment). In order to achieve
this, High Performance Liquid Chromatography (HPLC) was used to measure the
concentration of the desorbed biocide molecules in solution. The adsorption isotherms of
celtix, supreme and T-38 were not determined as these minerals were unavailable at the time
and only the FMC measurements previously described were used to determine their
suitability for controlled release.
5.2.1 Material and Method
The isothiazoline biocides used in this study (OIT and CIT/MIT) were obtained from Clariant
UK. The CIT/MIT in solution had a concentration of 1.59 wt %, and in a ratio of 3:1 with a
molecular weight of 137.5 Dalton. OIT was also supplied as a solution with a concentration
of 45.7 wt %, and a molecular weight of 213 Dalton. Six carriers (Infilm 939, Suprex, New
Zealand halloysite, and NPD-16A, carplex CS-5 and mineral colloid BP) were selected for
use in this study. Due to the lack of a controlled-release mineral on the market, the silica
carplex CS-5 was used as a control. This mineral:

Chapter 5 Adsorption Isotherm Studies
104
• Possesses a high degree of porosity, which is useful in sorption isotherm studies
• Has the ability (and is currently used in industry) to carry unwanted compounds
present in beer production
• Has a high surface area
5.2.2 HPLC settings
The HPLC used was an isocratic system from Hitachi. It is composed of a pump, a UV
detector, a column oven, an autosampler, an organiser for eluents and washing solutions, and
a computer with appropriate software (EZCHROM elite) for data analysis. The mobile phases
(eluents) used for analysing the two biocides in this study were composed of:
• For CIT/MIT: 12% acetonitrile, 1% glacial acetic acid and 87% deionised water
• For OIT: 25% deionised water and 75% acetonitrile.
These solvents were degassed prior to use (by stirring gently until all air bubbles have
disappeared. A second degassing also takes place in the HPLC, before the eluent flows
through the column). The HPLC works as follows:
• The solvent was delivered by the pump (via its own degasser)
• The sample was then injected by the autosampler
• The injected sample was separated in the column, whose temperature was kept
constant at 30oC by the column oven
• The separated sample was thereafter detected in the form of a signal by the detector
and peaks were observed on a graph at the time the separated sample exit the
column.

Chapter 5 Adsorption Isotherm Studies
105
The flow rate of the mobile phase was 1 ml/min and the autosampler was programmed to
inject 30 µl per sample in the column. Running time for each sample was 9 and 20 minutes
for OIT and CIT/MIT respectively.
Samples of known concentration of biocides were prepared in order to obtain calibration
curves used to determine the concentration of biocide in the aliquots (see Figure 5.4).
Figure 5.4: Calibration curve of OIT biocide of known concentrations obtained from the
HPLC
5.2.3 Methods of adsorption
With the exception of New Zealand halloysite, the carriers (minerals) were impregnated with
the biocides using a high shear mill (mixing the biocide and carrier for 1 minute). Varying
volumes of biocides were used in the adsorption process (25, 50, 75, 100, 200, 300, 500, and

Chapter 5 Adsorption Isotherm Studies
106
800 µl). Due to density differences between the powders, varying amounts of mineral were
used (in the mill) in this process and they were:
• 10 g for each of the two kaolins Infilm 939 and suprex, and also of the
montmorillonite MCBP
• 5 g for the kaolin NPD-16A
• 2.5 g for the silica carplex CS-5
The impregnation of the halloysite tubes was achieved by mixing, in a beaker, 5 g of the
mineral in solution of biocide prepared using the biocide volumes stated above. The biocide-
Halloysite solutions were then placed in a vacuum oven (under vacuum) for two hours in
order to:
• Displace air trapped within the Halloysite tubes
• Allow the biocides to penetrate the tubes
5.2.4 Adsorption isotherm studies
After the adsorption process, the impregnated carriers were then charged to deionised water
(making a total volume of 1 litre) and allowed to equilibrate under constant stirring, for 180
minutes (using a magnetic stirrer). This process was performed separately for each of the
carriers, with the exception of New Zealand halloysite. Aliquots of the suspension were taken
at time interval, between 1 minute and 3 hours, and filtered using 0.4µm Millipore filters.
Aliquots were also taken after encapsulating the biocides in the Halloysite tubes under
vacuum in order to estimate the amount of the molecules that remains in solutions.

Chapter 5 Adsorption Isotherm Studies
107
In order to assess the amount of the biocide that had eluted into solution and produce an
adsorption isotherm for each of the minerals and biocides used, samples of known biocide
concentrations were made and calibration graphs were produced (see Figure 5.4). All samples
and aliquots were run on the HPLC. The shapes of the isotherms obtained were analysed
according Langmuir’s classification of isotherms. Langmuir developed a theoretical basis for
the classification of adsorption isotherms for solutes in dilute solution, which relates their
characteristic shapes to parameters of the solvent and any second solute. This approach was
based on four main assumptions:
• Maximum monolayer coverage (θ)
• No interaction between adsorbate atoms / molecules
• Coverage is independent of binding energy
• There is a thermodynamic equilibrium of adsorption (ka) and desorption (kd) rate,
(d θ / dt) being equal
Three of the four main classes (S, L, H) developed by Langmuir (see Figure 5.5) are
accounted for by differences in relative magnitude of the activation energies of desorption of
solutes and solvent. The S-shaped isotherm is also accounted for by an additional
concentration-dependence of this parameter, implying cooperative adsorption. The linear (C)
class is explained by penetration of the substrate’s micropores by the solute, with or without
the solvent, whereby new adsorption sites are opened up; the theory predicts the
experimentally found sharp inflection to a plateau in the C-curves. Curves of the other classes
can also in some cases show a linear branch above the turning point, representing conditions
like those for C-curves.

Chapter 5 Adsorption Isotherm Studies
108
Figure 5.5: Langmuir system of isotherm classification [96-97].
The 2c subgroup indicates microporosity in the substrate, and in the C-class, the second
branch of the curve in the subgroup 2 may be horizontal, or have a less steep (Ci) or a steeper
(Cii) slope than the main portion, according to the nature of the system. Though only
subgroups progressing from I through 4 are shown these obviously can be extended to 5 or
beyond if further rises and steps occur [96-97].

Chapter 5 Adsorption Isotherm Studies
109
5.2.5 Results for OIT Adsorption on the selected minerals
Adsorption isotherms of OIT were carried out to determine the biocide loading capacities of
the minerals. The molecular footprints of the biocide on the minerals (the area each molecule
occupies on the surface) were calculated using this set of equations:
SL1 (mmol m-2) = SL0 (mg m-2) / Mwt Equation 5.3
SL2 (molecule m-2) = SL1 x 0.001 x AV Equation 5.4
Molecular footprint (Å2 / molecule) = 1020 / SL2 Equation 5.5
where SL is the biocide saturation level, Mwt its molecular weight, and AV the Avogadro
number (6.02 x 10²³). The areas occupied by the biocide molecule on the surface of the
minerals could also be obtained by calculating the bond lengths within the OIT molecule
(both vertically and horizontally). This could give an indication of the geometrical position of
the molecule on the surfaces of the minerals.

Chapter 5 Adsorption Isotherm Studies
110
Figure 5. 6: OIT adsorption of the 4 platy clays used in the experiment: Infilm 939, Suprex,
MCBP and NPD
iu
iu
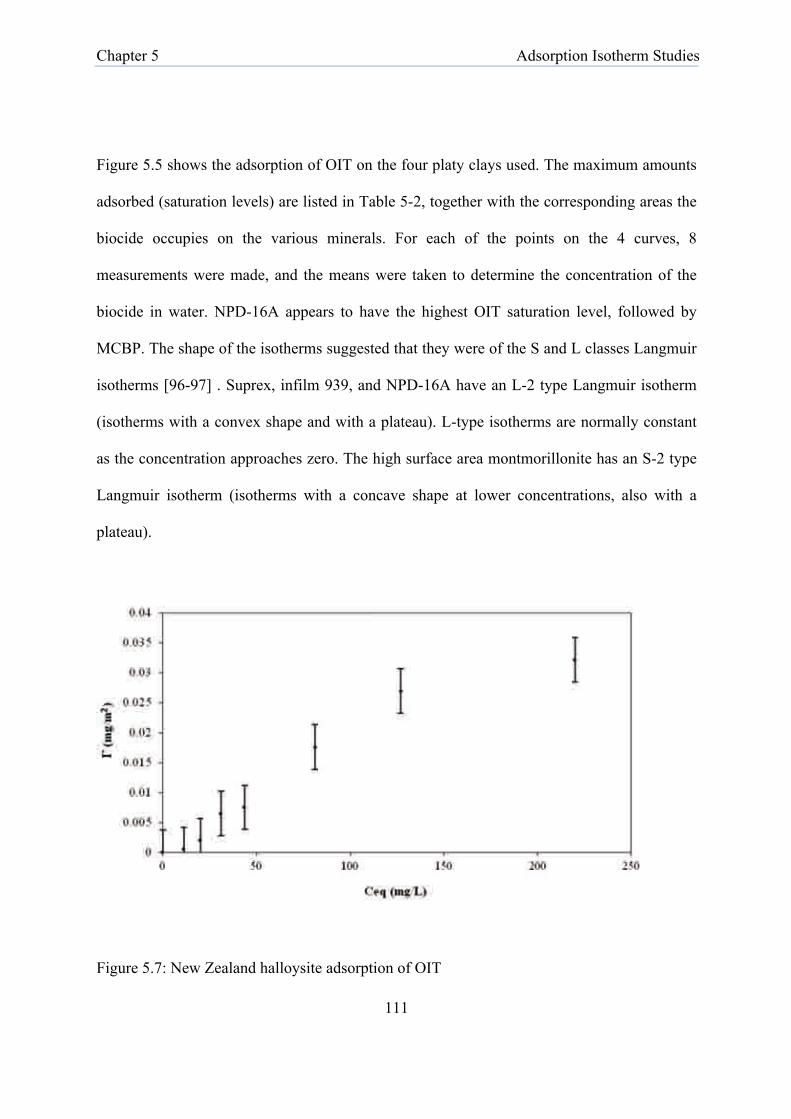
Chapter 5 Adsorption Isotherm Studies
111
Figure 5.5 shows the adsorption of OIT on the four platy clays used. The maximum amounts
adsorbed (saturation levels) are listed in Table 5-2, together with the corresponding areas the
biocide occupies on the various minerals. For each of the points on the 4 curves, 8
measurements were made, and the means were taken to determine the concentration of the
biocide in water. NPD-16A appears to have the highest OIT saturation level, followed by
MCBP. The shape of the isotherms suggested that they were of the S and L classes Langmuir
isotherms [96-97] . Suprex, infilm 939, and NPD-16A have an L-2 type Langmuir isotherm
(isotherms with a convex shape and with a plateau). L-type isotherms are normally constant
as the concentration approaches zero. The high surface area montmorillonite has an S-2 type
Langmuir isotherm (isotherms with a concave shape at lower concentrations, also with a
plateau).
Figure 5.7: New Zealand halloysite adsorption of OIT
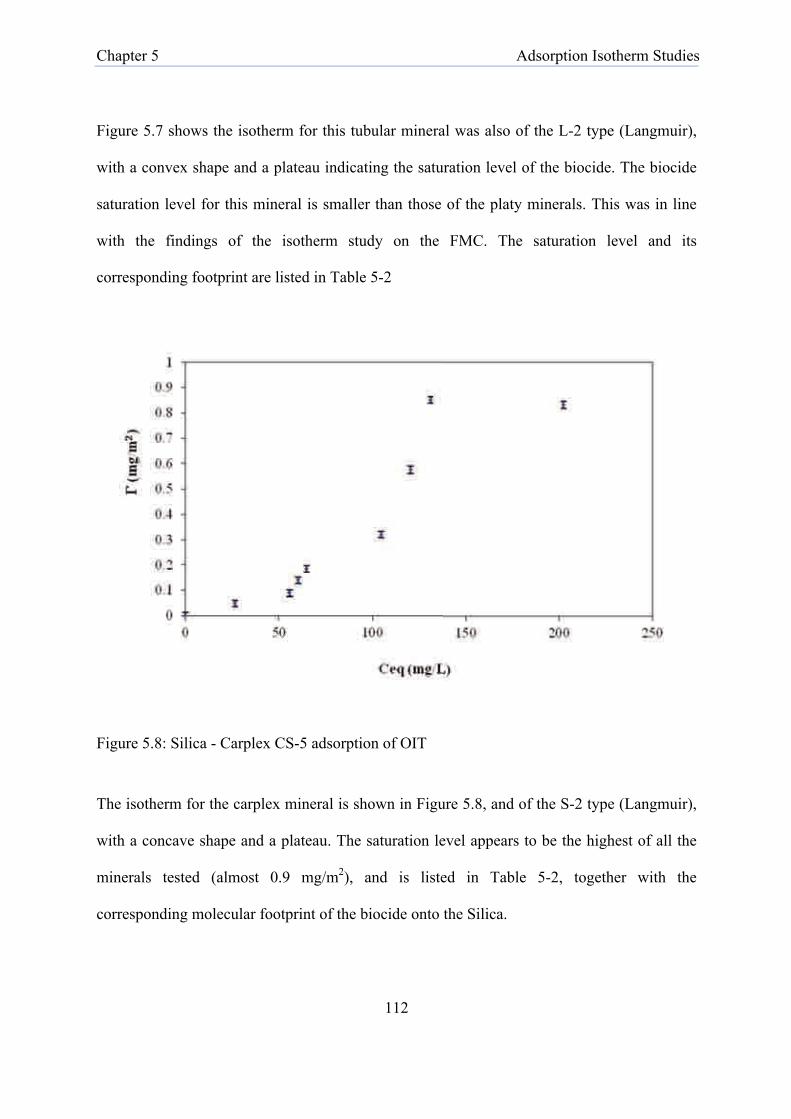
Chapter 5 Adsorption Isotherm Studies
112
Figure 5.7 shows the isotherm for this tubular mineral was also of the L-2 type (Langmuir),
with a convex shape and a plateau indicating the saturation level of the biocide. The biocide
saturation level for this mineral is smaller than those of the platy minerals. This was in line
with the findings of the isotherm study on the FMC. The saturation level and its
corresponding footprint are listed in Table 5-2
Figure 5.8: Silica - Carplex CS-5 adsorption of OIT
The isotherm for the carplex mineral is shown in Figure 5.8, and of the S-2 type (Langmuir),
with a concave shape and a plateau. The saturation level appears to be the highest of all the
minerals tested (almost 0.9 mg/m2), and is listed in Table 5-2, together with the
corresponding molecular footprint of the biocide onto the Silica.

Chapter 5 Adsorption Isotherm Studies
113
5.2.6 Adsorption of CIT/MIT on carriers
Adsorption isotherms of CIT/MIT were also carried out on the same six minerals mentioned
in section 5.2.1 in order to estimate their loading capacities.

Chapter 5 Adsorption Isotherm Studies
114
Figure 5. 9: CIT/MIT adsorption of the 4 platy clays used in this experiment: Infilm 939,
Suprex, MCBP, and NPD 16-A

Chapter 5 Adsorption Isotherm Studies
115
Figure 5.9 shows the adsorption of CIT/MIT on the same four platy clays as in Figure 5.8.
The biocide’s saturation levels are listed in Table 5-2, together with the corresponding areas
it occupies on the various minerals. For each of the points on the 4 curves, 8 measurements
were made, and the means were taken to determine the concentration of the biocide in water.
Infilm 939 appears to have the highest saturation level for CIT/MIT, followed by NPD-16A,
with MCBP having the lowest level of adsorbed biocide. This was almost the reverse of the
previous experiment where Infilm had the lowest level for OIT, and could be due in part to
the different functional groups of the two biocides (C8H17 on OIT and CH3 on CIT/MIT)
adsorbing differently to the surface of the minerals. The shapes of the isotherms were very
similar to those of CIT/MIT. Suprex, infilm 939, and NPD-16A have an L-2 type Langmuir
isotherm (isotherms with a convex shape and with a plateau, constant as concentration
approaches zero). The high surface area Montmorillonite has an S-2 type Langmuir isotherm
(isotherms with a concave shape at lower concentrations, also with a plateau).

Chapter 5 Adsorption Isotherm Studies
116
Figure 5.10: New Zealand halloysite adsorption of CIT/MIT
The isotherm for the tubular halloysite shown in Figure 5.10 was also of the L-2 type
(Langmuir), with a convex shape and a plateau indicating the saturation level of the biocide.
The biocide saturation level for this mineral was smaller than those of the platy minerals,
possibly due to its shape and very small pore diameter. The saturation level and its
corresponding footprint are listed in Table 5-2
Figure 5.11: Silica - Carplex CS-5 adsorption of CIT/MIT
Figure 5.11 shows the adsorption isotherm for carplex mineral. The isotherm for this
amorphous and highly porous mineral was of the L-2 type (Langmuir), with a convex shape
and a plateau indicating the saturation level of the biocide. This isotherm was of the S type
when OIT was adsorbed to the mineral, but changed to the L type when CIT/MIT was
adsorbed, and may be due to the difference in the chemistry of the functional groups of the

Chapter 5 Adsorption Isotherm Studies
117
Table 5.2: Saturation levels and molecular footprints of the biocides on the minerals

Chapter 5 Adsorption Isotherm Studies
118
biocides used. This saturation level of CIT/MIT on this mineral is listed in Table 5-2,
together with the corresponding molecular footprints of the biocide onto the Silica.
The areas occupied by OIT on the minerals were calculated from the corresponding
saturation level values of the biocide on the isotherm curves (see Table 5:2). These areas
indicated that:
• The area occupied by one molecule of OIT adsorbing on Carplex CS-5 was 43 Å2,
with the biocide’s footprint on this mineral being 2, 3.2, 6.4, 9.6 and 26 times lower
than those of NPD-16A, MCBP, suprex, infilm 939 and New Zealand halloysite
respectively. This silica was the best performing mineral in term of space occupied
by the OIT molecules.
• Of the three kaolins used, NPD-16A can carry 5.4 times more OIT than suprex and
8.2 more than infilm 939, although these minerals have similar surface areas (22.8,
25 and 22 m2/g respectively). This is probably due to differences in their surface
chemistries and crystal arrangement, effects of chemical and/or mechanical surface
treatment.
• OIT occupies 3.2 times more space on MCBP than on carplex CS-5 (surface areas
are 800 and 150 m2/g respectively). This is primarily due to differences in the basic
structures of the minerals, with MCBP being a platy 3 layer 2:1 clay, and carplex an
amorphous silica, and also to the ways these minerals adsorb the biocide (see
Figure 5.6 and 5.8 for MCBP and carplex adsorption respectively).
• There was no surface area effect as thought prior to the experiments (where the
highest surface area minerals will adsorb more biocides molecules than the lower

Chapter 5 Adsorption Isotherm Studies
119
surface area kaolin), as NPD-16A (20.8 m2g-1) outperformed MCBP (800 m2g-1).
• The standard deviations for the points on all the isotherms were very low, varying
between 0.001 and 0.108 mg/m2, suggesting the data points were closely clustered
around the mean values.
For CIT/MIT biocide, the molecular footprints indicated that:
• The mineral that adsorbs the most biocide was Infilm 939. The footprint of the
biocide on this mineral was 1.6, 2.6, 3.2, 5.3 and 16 times lower than those of NPD-
16A, carplex CS-5, suprex, MCBP, and New Zealand halloysite respectively.
• The dispersant-free kaolin (suprex) seemed less favourable to the biocide absorption
and could adsorb 3.2 times less CIT/MIT than Infilm 939, although both minerals
possess similar surface areas. This was probably due to the lack of chemical surface
treatment of suprex causing most of the clay’s layers to stick together, and
consequently reducing the available surface area for biocide adsorption
• Kaolin NPD-16A can carry 10 times more CIT/MIT than the halloysite despite the
latter having more than twice the surface area of the former. This is probably due to
the morphologies of the clays, with the platy kaolin NPD 16A more likely to expose
the areas between its plates to the biocide than the tubular halloysite (which required
air trapped in the tubes to be pumped out under vacuum, and replaced by the
biocide)
• Of the three kaolins examined, NPD-16A can also carry twice as much biocide than
suprex, but 1.6 times less than infilm 939. This is probably due to the effects of
different chemical and/or mechanical surface treatments of the minerals
• The silica carplex CS-5 could carry twice as much CIT/MIT than the

Chapter 5 Adsorption Isotherm Studies
120
montmorillonite MCBP, although the surface area of the montmorillonite is 5.3
times higher (in the wet form) than that of the silica. However, it was found that the
lower surface area kaolin NPD-16A (22.8 m2/g) performed much better than both
silica and MCBP. This is an indication that, like with the OIT molecules, there was
no surface area effect
5.3 Discussion
Carplex CS-5, a silica from Degussa, Japan, was used in this study as a control because it
showed, in previous studies, the potential to absorb more biocides than silica of higher
surface areas tested.
The biocide adsorption process showed that low surface area minerals were able to carry the
isothiazoline biocides, contrary to previous studies stating otherwise [86]. The ratios in Table
5:2 were those of the footprint data between the two biocide molecules. They indicated that
all the minerals used in the adsorption process favour OIT (with OIT occupying less space on
the minerals). This could be due to the orientation of the biocide molecules as they adsorb
onto the minerals, with the more hydrophobic octyl side chain on OIT away from the
minerals’ surfaces, whereas the hydrophilic Methyl on CIT/MIT was participating in the
adsorption process. From the footprint ratio values, infilm 939 seemed to be more efficient at
carrying the two biocides, albeit in small quantities. It appeared that with an appropriate
surface treatment (use of an appropriate surfactant with a strong affinity to the biocide, or
milling the clay in order to increase the surface area available for the biocide), this mineral
could be efficient at carrying greater quantities of both OIT and CIT/MIT. The silica’s high
ratio value suggested that the mineral’s structure favoured the OIT molecule.

Chapter 5 Adsorption Isotherm Studies
121
The shape of the isotherms gave an indication of the way the biocide molecules covered the
surface of the carriers. Langmuir isotherms implied that:
• There was a co-operative adsorption between the absorbates (biocides) and the
substrates (minerals)
• There was monolayer coverage of the minerals’ surfaces by the biocide molecules.
The HPLC used was very sensitive and accurate (as described in section 3.2.3.3), detecting
biocide concentrations between 1 and 2000 parts per million. Most of the data obtained were
repeated, using a UV-Vis spectrophotometer, albeit not at concentrations below 5 and above
100 parts per million.
The Flow Microcalorimetry technique used offered the opportunity to understand the strength
of the bonds existing between the biocide and the minerals after the adsorption process.
These bonds were thought to arise as a result of weak Van der Waals forces or electrostatic
interactions. Heat and concentration measurements from the FMC were made under flow
condition (dynamic), unlike the adsorption isotherm performed in a static condition. These
data confirmed one of the finding of the isotherms, which was that low surface area minerals
(less than 50 m2g-1) were able to adsorb the isothiazoline biocide. Nevertheless, the
desorption energies indicated that the minerals held to the biocide with differing levels of
strength (from almost irreversible adsorption with the diatomaceous earth celtix to
completely reversible with the kaolin NPD-16A).
The isotherms and FMC results indicated that montmorillonite MCBP and silica carplex CS-5
were the best OIT adsorbing minerals in both static and dynamic environments. The
Chapter 5 Adsorption Isotherm Studies
122
calculated values of the adsorbed biocide were:
• For MCBP: 105 and 205 mg/g for the FMC and isotherm respectively
• For Carplex: 88 and 125 mg/g for the FMC and isotherm respectively
The differences in values between the two methods were probably partly due to the different
adsorption processes used (dry adsorption in the high shear mill for the isotherms, and wet
adsorption in cyclohexane for the FMC, both causing different amounts of OIT to adsorb to
the minerals), and also in part because in the static environment, the adsorbed values included
loosely bound biocide molecules. These loosely bound biocide molecules were flushed away
in the FMC under flow condition. The two methods also showed that New Zealand
Halloysite, NPD-16A, Infilm 939 and Suprex were the worst performing minerals (for
biocide adsorption), and consequently were not selected for the bioassay experiment.
The isotherms and FMC results indicated that varying amounts of the isothiazoline biocides
adsorbed to the surface of the minerals used. The FMC data also showed the strengths of
these attachments. However, the length of time these biocides molecules could remain on the
surface of the minerals (hence the minerals controlled release potentials) could not be
determined this way, and a desorption experiment was set up to assess this (and is described
in chapter six).

CHAPTER SIX
OIT DESORPTION STUDIES
6 Chapter Six – OIT Desorption Studies

Chapter 6 OIT Desorption Studies
124
The objective of this chapter is to study the desorption profiles of the minerals that showed
the highest adsorption potentials from the FMC work (see Chapter 5), namely MCBP
(montmorillonite), Carplex (silica), T-38 (calcium silicate) and Celtix (diatomaceous earth).
Supreme clay (the kaolin) was added to this list, as this clay is used in the paint industry as
functional filler. The kaolins infilm 939, suprex, NPD-16A and New Zealand halloysite were
discarded from this experiment as they showed, from the FMC experiment, the lowest OIT
adsorption potential. The experiments were carried out to assess and compare the desorption
profiles of OIT-mineral complexes in paint films, and also OIT and minerals freely added to
paint films. The CIT/MIT biocide was dropped for the remainder of the study because:
• The adsorption experiment in Chapter 5 showed that the area occupied by this
biocide on any of the minerals used was far greater than that of OIT
• CIT/MIT could not be obtained in its pure form (100%), hence it was not also
possible to use it for the sorption experiments on the FMC
• OIT is the biocide of interest for paint applications such as interior and domestic
coatings
6.1 Materials and Methods
The method of OIT adsorption onto the carriers was discussed in section 5.2.3 of the previous
chapter. Upon adsorption of the OIT, the biocide-loaded minerals were added to an exterior
paint formulation. However, two paint formulations per mineral used were made:

Chapter 6 OIT Desorption Studies
125
• The first formulation method contained the mineral loaded with the biocide (biocide
adsorbed to the mineral prior to use; this is denoted as “mineral / OIT”).
• The second formulation method contained the mineral, together with the independently
added biocide (biocide not adsorbed to the mineral prior to use; this is denoted as
“mineral + OIT), and considered the standard in this experiment.
These treatments were made in order to compare the two desorption profiles of the biocide.
Paint drawbacks were made on Leneta paint charts obtained from Leneta, New Jersey, USA.
The painted Leneta sheets (2 per mineral) were then dried at a temperature of 230C (within
20C) and a relative humidity of 50% (within 5%) for 24 hours. One disc from each sheet was
cut out using the hole punch, and weighed. A disc was also cut out of a clean (non painted)
Leneta chart, weighed, and its mass subtracted from that of the dried painted sheet. This was
done to obtain the mass of the paint on the Leneta sheets, and hence the exact concentration
of OIT available for use in the desorption experiment.
6.1.1 Typical paint formulation
The paint made was an exterior coating, according to a formulation that is covered by a
secrecy agreement. Various modifications of the initial formulation were made to account for
those detailed in section 6.1, but cannot be discussed in this thesis.
Ten paint films were made in total, two for each of the minerals used (MCBP
(montmorillonite), Carplex (silica), T-38 (calcium silicate) and Celtix (diatomaceous earth).
Supreme clay (the kaolin). The first formulation was used as a control, where both the
biocide and mineral were added independently to the paint. The second formulation,
containing the mineral-biocide complex, was compared to the first. The in-can biocide,

Chapter 6 OIT Desorption Studies
126
generally designed to protect any paint film from microbial degradation, was removed from
the formulations made in order to prevent competition between that biocide and OIT for
attachment to the minerals’ surfaces. OIT was added to the formulations at the saturation
level determined from an experiment aimed at finding the concentration needed to kill the
micro-organisms (described in Chapter 7).
Each of the 10 paints needed for the desorption study was made according to a standard paint
making procedure:
• The dry components of the paint formulation (all the powders used) were weighed
out in a dish
• The wet components (solvents) were also weighed out into a paint tin
• The dry components were then added to the wet component in the paint tin, and
mixed at 1500 rpm for 5 minutes using a Dispermat high shear mixer
• The mixer was stopped after that time, the impeller cleaned, and the components
mixed again at 4000 rpm for 15 minutes
• After that time, the mixer was turned down to 2000 rpm, the remaining components
were weighed and added to the solution. Some of these components were added very
slowly to the paint in order to avoid a pH shock and to provide a physical
crosslinking in the film, as the hydroyl groups on the partially hydrolysed titanate
interact by H-bonds to the functional groups on the polymer particles.
6.1.2 Method of desorption measurement
The concentration of OIT in the dried paint was then calculated using this equation:

Chapter 6 OIT Desorption Studies
127
Equation 6.1
The total active OIT in the paint made was 0.9 ml (45% of 2 ml used), and the total weight of
the paint made for each of the minerals was 400 g. The exact amounts of active OIT in the
painted Leneta discs were tabulated, and are shown in Table 6.1
Table 6.1: Amount of OIT in dried films on Leneta discs
Total Weight of paint on
disc (mg)
OIT concentration in the dried paint (ml/g)
MCBP / OIT (*) 46.3 0.104
MCBP + OIT (**) 52.8 0.119
Carplex / OIT 58.4 0.131
Carplex + OIT 52.6 0.118
Supreme / OIT 45.9 0.103
Supreme + OIT 52.3 0.118
T-38 / OIT 47.2 0.106
T-38 + OIT 45.2 0.102
Celtix / OIT 46.4 0.104
Celtix + OIT 47.4 0.107
(*): Biocide adsorbed to the mineral, and the complex added to the paint
(**): Biocide and mineral independently added to the paint, with no prior adsorption
The discs obtained from the Leneta sheets (see section 6.1) were added to 200 ml of
deionised water in plastic beakers, and the beakers were placed on a laboratory rotator /
shaker (Electrolab Rocking Shaker) operating at a constant speed of 10 rpm. The painted
discs were submerged in order to simulate wet atmospheric conditions affecting painted

Chapter 6 OIT Desorption Studies
128
outdoor surfaces, resulting in the loss of biocide from the paint films. The work was
undertaken in a static environment, and care was taken to select the amount of water
necessary to:
• Submerge the painted Leneta sheets
• Potentially dissolve all the biocide present in the paint film before the water becomes
saturated with the biocide.
During the desorption process, aliquots were taken at time interval (30 seconds, 5, 10 and 30
minutes, 1, 2, 4, and 6 hours, 1, 2, 3, 5, 6 and 7 days). The concentrations of OIT in these
aliquots were determined experimentally using HPLC. The settings of the HPLC, together
with the concentration of acetonitrile (HPLC mobile phase) used for OIT were described in
section 3.2.3.1 of Chapter 3.
6.2 Results of the desorption experiments
As there were two treatments per minerals (OIT adsorbed onto the minerals, and OIT
independently added to the paint films), the data for each mineral were plotted on a graph,
and discussed in order to compare the desorption profiles of the two treatments. The initial
OIT concentrations in the dried paint films (see Table 6.1) were converted to percentages
(100%, as they were the starting biocide concentrations in the films), together with the
amounts of OIT in the aliquots collected. In all the following graphs, mineral / OIT denotes
mineral to which OIT is attached, and mineral + OIT denotes mineral free of OIT, prior to its
addition to the paint films.

Chapter 6 OIT Desorption Studies
129
0
25
50
75
100
0.0001 0.001 0.01 0.1 1 10
Time (days)
% O
IT in
pai
nt
Calcium Silicate /OITCalcium Silicate +OIT
Figure 6.1: OIT release profile from adsorbed (◊) and non-adsorbed (�) OIT to Calcium
Silicate T-38
The respective release times of OIT were put on a log scale in order to fully understand the
trends from the start of the desorption process up to the end of the first day. Figure 6.1 shows
that the release profile of OIT from the calcium silicate T-38 was almost identical for the 2
treatments. It could be seen that half the biocide content of the paint films had already eluted
in water just after 30 minutes. The paint films appeared to be totally depleted of their OIT
content after just 4 hours of their submersion into the water, indicating the mineral’s poor
retention of the biocide from paint films. This finding was in sharp contradiction with the
results from the experiment on the FMC (see Figure 5.3 of Chapter 5), which indicated that
54 mg/g of OIT adsorbed onto T-38 surface, and 11 mg/g desorbed from the surface under
flow condition (20%, over a 3 hour period). This was probably due to components in the

Chapter 6 OIT Desorption Studies
130
paint films preventing the biocide from fully adsorbing to the surface of the mineral
(mineral/OIT), or displacing the biocide from the mineral’s surface (mineral + OIT), and
hence accelerating its desorption.
0
25
50
75
100
0.0001 0.001 0.01 0.1 1 10
Time (days)
% O
IT in
pai
nt
Diatomous Earth /OITDiatomous Earth +OIT
Figure 6.2: OIT release from adsorbed (◊) and non-adsorbed (�) OIT to diatomaceous earth
celtix
Figure 6.2 shows that the release profile of OIT was similar for both paint films containing
the diatomaceous earth celtix for the first 10 minutes. However, the film with the
independently added biocide (celtix + OIT) lost all its biocide content after 2 hours (the
biocide molecules will migrate quickly to the surface of the paint films as there was almost
no inhibition from the mineral), whereas the second film appeared to be depleted of its
content only after 3 days (some degree of interference from the mineral). The experiment on

Chapter 6 OIT Desorption Studies
131
the FMC showed that 21.6 mg/g of OIT adsorbed onto this mineral (Figure 5.3), and 3.91
mg/g desorbed under flow condition (18%). Like with the calcium silicate T-38, this was
probably due to components in the paint films preventing the biocide from completely
adsorbing to the surface of the mineral (or removing it), and hence accelerating its desorption.
0
25
50
75
100
0.0001 0.001 0.01 0.1 1 10
Time (days)
% O
IT in
pai
nt
Silica / OIT
Silica + OIT
Figure 6.3: OIT release profile from adsorbed (◊) and non-adsorbed (Δ) OIT to the silica
carplex
Figure 6.3 shows the desorption of OIT from paint films containing the silica carplex. The
profile appeared to suggest that the silica retained the biocide for a longer period of time than
both the calcium silicate and the diatomaceous earth minerals. The biocide release profiles for
the 2 paint films were identical for the first 30 minutes (87.5% and 87% of OIT left in the
films, respectively for carlex/OIT and carplex+OIT). The paint film containing the

Chapter 6 OIT Desorption Studies
132
independently added mineral and biocide was totally depleted of its biocide content after 6
days, whereas the second film still retained almost 12% of its OIT content after the same time
period, and 10.5% at the end of the experiment.
0
25
50
75
100
0.0001 0.001 0.01 0.1 1 10
Time (days)
% O
IT in
pai
nt
Kaolin / OIT
Kaolin + OIT
Figure 6.4: OIT release profiles from adsorbed (◊) and non-adsorbed (Δ) OIT to the kaolin
clay supreme
Figure 6.4 shows OIT release profile from the supreme kaolin material. The data suggested
that all the biocide eluted out of the paint film containing the freely added mineral and OIT
within 5 days, whereas the other film still retained 13.6% of its OIT content after the same
period, only decreasing to 13.2% after 7 days. The data also suggested there was significant
OIT lost within the first 24 hours of the start of the experiments (more than 60%), possibly
due in part to loosely bound OIT molecules (those that physisorbed onto the surface of the

Chapter 6 OIT Desorption Studies
133
mineral) being removed by the water.
0
25
50
75
100
0.0001 0.001 0.01 0.1 1 10
Time (days)
% O
IT in
pai
nt Monmorillonite /OITMontmorillonite +OIT
Figure 6.5: OIT desorption profiles from paint films with adsorbed (◊) and non-adsorbed OIT
(Δ) to montmorillonite clay MCBP
Finally, Figure 6.5 shows the release profile of OIT from the montmorillonite MCBP. This
mineral shows the best OIT desorption profiles of all the minerals used in this study. The
profiles of the two paint films were similar up to the first half hour of the start of the
desorption experiment. After the first day of the experiment, almost 60% of OIT still
remained in the paint film containing the biocide-Impregnated Montmorillonite, whereas the
second film (MCBP + OIT) only still held on to just over 17% of its OIT content. This latter
film was eventually depleted of its biocide content after six days, whereas the former film

Chapter 6 OIT Desorption Studies
134
Table 6.2: Percentages of biocide still remaining in the paint films after the desorption
experiment

Chapter 6 OIT Desorption Studies
135
(MCBP / OIT) still retained more than 40% of its biocide content after seven days.
6.3 Discussion
The experiments described in this chapter were carried out to obtain and compare the
desorption profiles of OIT adsorbed (and non-adsorbed) to minerals added to an external
paint formulation. The existing paint “in can biocide” was not added to the formulations
made in order to prevent competition between that biocide and OIT for attachment to the
surfaces of the minerals. The removal of the “in can biocide” did not compromise the
integrity of the paints, as there was no bacterial colonisation, possibly due to the presence of
OIT (for this study, and the subsequent longer Bioassay work, see in Chapter 7). All the
paints were made under the same standard conditions of temperature, humidity, and drying
time, and the paint films on the Leneta plates had the same thickness. As desorption was
carried out in a static environment (unlike with the Flow Macrocalorimeter under flow
condition), a significant amount of water was used (200 ml) in order to submerge the plate
and to allow the biocide to elute from the surface area available.
The experiment showed that the paint film with the biocide adsorbed to the kaolin supreme
held on to 13.2% of its biocide content after seven days of desorption. The second film, with
supreme and OIT freely added, was depleted of its entire OIT content after 5 days of the
desorption experiment. This 1:1 platy clay has 13% of structural water, and is believed to
entrap the biocide between its alumina and silica plates during the adsorption process. The
biocide elutes by way of using the tortuous paths between the plates. There was, however, not
a significant difference in the desorption of OIT between the 2 paint films, and a paint
manufacturer may not want to go through the intercalation process, as this will add time and

Chapter 6 OIT Desorption Studies
136
some extra costs to the process.
Calcium silicate (T-38) was the worst performing mineral for the desorption of OIT. Both
films (independently added and pre-mixed OIT-mineral) were depleted of their entire biocide
content after just six hours. This was possibly due to the structure of the mineral, as XRF data
in Table 4-2 showed that it was mainly made of 46.3% silica, 30.9% calcium oxide and
19.2% of structural water. This significant amount of entrapped water molecule could be
interfering with the adsorption of OIT. The second worst performing mineral was the
diatomaceous earth (Celtix). The first paint film (with independently added OIT) was
depleted of its biocide content after 2 hours, whereas the second film still held on to 2.3% of
its biocide content after 7 days. The desorption profiles of this mineral showed a slight
difference between the two treatments, and a net improvement to T-38. Celtix is composed of
91% silica and had less structural water molecules than T-38 (at just 4.2%), and this could
have been a contributing factor in the improved profile compared with T-38. although both
minerals performed better in the FMC desorption experiments, their performance could not
be reproduced using paint films. Although both irregular shape minerals are currently used
for filtration, they could not be used in controlled release systems in paints on the basis of the
data presented, unless significant mineral surface modifications were carried out to improve
the OIT adsorption. They were therefore discarded for the subsequent Bioassay experiment.
Carplex is a pure silica (99.88% SiO2), with no structural water within its core. The film with
the OIT-adsorbed mineral retained 10.5% of its biocide content after 7 days, whereas the
second film was completely depleted after 6 days of experiment. The data for this amorphous
mineral were, however, very similar to those of the platy supreme clay. As the pores’ size of

Chapter 6 OIT Desorption Studies
137
the mineral is the only factor affecting the release of the biocide, it is anticipated that their
slight narrowing could significantly increase this release time (and amount).
The montmorillonite MCBP was by far the best performing mineral in this desorption study.
The paint film with biocide adsorbed to the mineral still retained 42.3% of its OIT content,
whereas the second film was completely depleted of its biocide content after 6 days. This clay
has shown in all experiments that it was more efficient at adsorbing the biocide than any
other mineral used, possibly due to its 2:1 structure. It consists of an octahedral sheet of
silicate sandwiched between two tetrahedral sheets, and has a formula
Na0.2Ca0.1Al2Si4O10(OH)2(H2O)10), and large surface area of 800 m2g-1 when the clay is
hydrated. This clay will expand upon hydration, allowing almost all biocide present to move
within its plates, where it is believed the various cations present strongly participate in the
adsorption process. The data suggested that this mineral could be used as a controlled release
clay in paint formulations in order to release the biocide over a longer period of time. As the
mineral expands, the amount used in the paint needs to be kept very low in order to preserve
the structural integrity of the paint.
All the data showed a prolong release of the OIT when it was adsorbed to the minerals used
(with the exception of the calcium silicate T-38). This was due to the fact that the biocide had
to navigate within or between the structures of the minerals before being release into the
water. It should be noted that these paints are not intended to protect structures that are
constantly under water (ship hulls), but are more likely to find uses as paints for damp rooms
such as kitchens and bathrooms, where mould growth is a particular problem. The best three
performing minerals were chosen for the Bioassay experiment: supreme (kaolin), carplex CS-

Chapter 6 OIT Desorption Studies
138
5 (silica) and MCBP (montmorillonite).

CHAPTER SEVEN
BIOASSAY STUDIES
7 Chapter Seven – Bioassay Studies

Chapter 7 Bioassay Studies
140
This chapter describes the work was carried out to determine the potency of a paint
formulation to which biocide-loaded montmorillonite MCBP, silica carplex CS-5 and kaolin
supreme carriers were added, in particular the ability of the paint film to significantly lower
the level of micro-organisms or inhibit their growth. The time taken by the OIT molecules to
elute out of the paint formulation was also estimated. Accelerated weather testing was
initially used to simulate the damage caused by UV exposure, atmospheric moisture and
precipitation on paint films. This artificial weathering was particularly useful for determining
the effectiveness of the OIT controlled release potential of the carriers used. The paint
formulation used in this experiment was the same as that in the desorption work described in
Chapter 6, and is covered by a secrecy agreement. The three minerals were chosen because:
• They have a reasonably good adsorption potential in the adsorption experiment
described in Chapter 5
• They displayed a slower desorption profile (see Chapter 6)
7.1 Materials and Methods
In this section, the materials used and the methods of analysis were described separately.
Details of the paint formulation used (various components, quantities used, equipment, time,
humidity) cannot be revealed as they are covered by a secrecy agreement.
7.1.1 Biocide adsorption onto the minerals
In this part of the bioassay process, water was first added to each of the dry powders and
mixed well in order to form a paste (this process caused the montmorillonite to expand, but
not the kaolin and the silica). Secondly, OIT was added to each of the pastes obtained, and

Chapter 7 Bioassay Studies
141
mixed again. The pastes were finally oven-dried at 30oC in order to release the water
molecules and entrap the biocide between the carriers’ core / plates. The carrier-biocide
complexes were then added to the paint formulation. A control experiment was conducted,
where identical pastes were made, but with no OIT added to them. The OIT was later freely
added to the paint formulation. The amount of each component of the pastes is described in
Table 7-1.
Table 7.1: Composition of powder-OIT preparation for use in the paint film.
Amount used (g)
OIT added (ml)
Water (ml)
Total wet
powder (g)
Drying time (at 30oC)
Weight lost (g)
Total dried
powder (g)
Kaolin Supreme 20 2 40 62 2 hours 40 22
Silca Carplex 2 2 15 19 2 hours 15 4
Montmorillonite
MCBP 2 2 60 64 3 days 60 4
Carplex and MCBP were used in smaller quantity in their respective formulations than
supreme because:
• There is a density difference between the 3 clays (a higher quantity would make the
formulations more viscous and consequently not useable later)
• The Silica and Montmorillonite based formulations still needed some amount of
Supreme in order to maintain the rheology of the paint formulation
The differences in the amount of water used and the time taken to dry the material reflected

Chapter 7 Bioassay Studies
142
the nature of the clays used. MCBP is 2:1 platy and needed more water to fully expand,
whereas carplex is amorphous in nature and readily formed a paste with limited amount of
water. 40 ml of water were used in the kaolin because of the volume of clay used in the
experiment. OIT was used to replace the traditional dry film biocide used in this formulation,
because it degrades easily in the environment. The amount of conventional biocide normally
used in the paint formulation was 0.6% w/v, exactly 2.4 ml per 400g of paint, and generally
corresponds to industry standard. 2 ml of OIT was used in all formulations mentioned in this
Chapter, as this was the volume needed to eliminate all organisms in the calibration
experiment (Figure 7.1).
7.1.2 Paint preparation
After the paint films were made, a bench paint applicator was used to coat flat hydrophobic
Leneta test sheets (300 µm thickness). These coated sheets were allowed to dry in a
controlled room environment (where humidity and temperature were kept constant) for two
days, and cut in circles of 7 cm diameter using a hole punch. These coated circular sheets
were sent to the paint test laboratory for further testing.
7.1.3 “Renault”, or paint ageing test
The “Renault” test consisted of placing the Laneta sheets in a QUV Weatherometer, where
they were subjected to constant bombardment by UV light and water. The conditions inside
the Weatherometer therefore mimicked the exterior atmospheric conditions that a painted
wall can be exposed to. This test is extensively used by the motoring industry to monitor the
durability of the paint used on their vehicles, and to assess their level of corrosion. The test
consisted of the following steps:

Chapter 7 Bioassay Studies
143
• The circular sheets mentioned above were immobilised on panel holders and placed
inside the QUV
• The paint films on the panels were then exposed to a 3500 Watts xenon light for 102
minutes at 700C
• This was followed by exposure of the same surfaces to sprinkling water for 18
minutes, in the dark (to simulate a night time paint exposure)
• The cycle was repeated until the experiment was stopped at 1500 hours. Some
panels were removed at time interval (24, 48, 72, 96, 120, 180, 312, 336, 600, 720,
840, 960, 1200 and 1500 hours) for microbiological assessment (biocide potency
test). The relative humidity within the QUV was 52% (+/- 5%) outside of sprinkling
period.
Data obtained from the ageing “Renault” test can be interpreted as follows: every 100 hours
the paint film was aged in the QUV corresponded to 1 month in real time (where a painted
wall can be subjected to the same atmospheric conditions outside). The total QUV run time
of 1500 hours, therefore represented 15 months in real time.
7.1.4 Bioassay (OIT potency test)
Culti-Loops containing viable micro-organisms (Pseudomonas Aeruginosa) known to affect
coated surfaces were purchased from OXOID Microbiology, together with ready-made
pseudomonas cetrimide agar plates, tryptone soya broth solution in glass bottles (pH 7.3 ±
0.2) and a maximum recovery buffer (peptone sodium chloride, pH 7). The bacterium used is
Gram negative (it does not retain crystal violet in gram staining, due to the nature of its cell
membrane), rod-shaped and aerobic in nature. Before use, the microbial loop was diluted:

Chapter 7 Bioassay Studies
144
• The loop containing the organisms was cut, put in a 1 ml tryptone soya broth and
incubated at 32oC for 5 minutes. This allowed the activation and dispersion of the
organisms in the solution.
• 100 µl of this solution were added to 900 µl of the recovery buffer to obtain a 1 in 10
dilution of the original organisms. Subsequent additions of this latter solution
generated a useable solution of 1 in 100,000 dilutions of the original organisms in
the soya solution. This high dilution was made in order to facilitate the reading of the
cetrimide agar plates after incubation and growth of the organism
The growth of this organism followed a typical bacterial growth curve, except for a longer lag
phase (24 hours) observed during incubation at 32oC.
Figure 7.1: A typical bacteria growth curve. The lag phase can be longer for different
organisms [98]

Chapter 7 Bioassay Studies
145
Events occurring during the phases of bacterial growth are summarised below:
• Lag phase: production of new enzymes needed for growth
• Log phase: maximum growth of the organism
• Stationary phase: growth equals death; nutrients (limited) or waste products
(increased) limiting growth
• Death phase: death greater than growth; lack of nutrients or accumulation of waste
products killing cells
The cetrimide agar plates were seeded with the diluted pseudomonas Aeruginosa solution.
The Leneta sheets containing the paint films were then placed face down on the seeded agar
plates, which were in turn put in the fridge for 24 h to allow OIT to diffuse out of the paint
films. After 24 h, the sheets were removed, and the cetrimide agars were incubated at 320C
for 48 h (24 h to allow for the lag phase of the organisms and a further 24 h for growth). After
that period, the numbers of microbial colony forming units present on the cetrimide agar
plates (if any) were counted using a laboratory bench cell counter (see Figures 7.5, 7.6 and
7.7). Three controls were made for each test carried out and they were:
• A seeded cetrimide agar plate (to determine the maximum number of colony forming
unit that can be seen after the dilution described above)
• A second seeded agar plate incubated with a circular Leneta sheet with no paint film
on it (to determine if the presence of the sheet alone was impeding the growth of the
organisms)
• A third seeded agar plate with a panel as described above, with paint film containing
no biocide on the panel (to determine if any other component of the paint was killing

Chapter 7 Bioassay Studies
146
the organisms)
7.1.5 Determination of OIT loading of paint films
In order to assess the volume of OIT needed to eliminate or reduce to a minimum the
presence of micro-organisms in the paint films, an experiment was run where varying
amounts of the biocide (0.5, 075, 1, 2.5 and 3 ml) were added to seeded agar plates (see
Figure 7.4). Three control plates were made (same as those described in section 7.1.4). This
experiment was also important for assessing the potential commercial and environmental
benefits of this controlled release technology. It was anticipated that the amount of biocide
primarily added to paint films in uncontrolled systems could be considerably lowered,
leading to a decrease in the environmental discharge of OIT.
7.2 Results
Pseudomonas Aeruginosa growth curve
0.0E+00
5.0E+05
1.0E+06
1.5E+06
2.0E+06
2.5E+06
3.0E+06
0 20 40 60 80
Time (hours)
Nu
mb
er o
f b
acte
ria
(Log
)
Lag Phase
Log Phase
Stationary Phase
Death Phase
24E+5
0.5E+51E+5
Figure 7.2: Pseudomonas Aeruginosa growth curve, as observed in laboratory experiments

Chapter 7 Bioassay Studies
147
Figure 7.2 shows the complete growth curve of pseudomonas aeruginosa as observed in the
laboratory. The figure also showed that the lag phase of this organism was 24 hours, which
was longer than that of most common organisms. This may be due to the length of time it
took the organism to make the enzymes needed for its growth.
Figure 7.3: Cetrimide agar plate showing pseudomonas aeruginosa colony forming units (in
green) after 48 hours incubation period
Figure 7.3 shows an agar plate with 5 bacterial colonies formed after 600 hours weathering
test in the QUV. The colonies here (green colour) are emerging due to the original paint on
the Leneta disc being depleted of its biocide content during the weathering test.

Chapter 7 Bioassay Studies
148
0.0050.0050.005
4
10
16
25
292929
0
5
10
15
20
25
30
35
Standard Standardwith disc
Paint withno OIT
0.5 0.75 1 1.5 2 2.5 3
Volume of OIT used (ml)
Pseu
dom
onas
Col
ony
Form
ing
Uni
t (x1
05 )
Figure 7.4: OIT calibration to determine the volume of biocide needed to inhibit or limit the
growth of the organism
Figure 7.4 demonstrated that the addition of OIT to the paint films decreased or/and inhibited
the growth of pseudomonas aeruginosa. This finding illustrated the fact that the biocide was
inhibiting the normal metabolic pathways of the organism by binding to the enzyme cofactors
Nicotinamide Adenine Dinucleotide (NAD) and Flavin Adenine Dinucleotide (FAD). It
could be seen that a volume of OIT higher than 2 ml (considered to be the saturation point)
did not alter the level of organism in the paint. This level (2 ml) was therefore used to load
the paint films for the remainder of the bioassay work. The number of microbial Colony
Forming Unit (CFU) at 2 ml OIT, (500), is very negligible in paint.
The number of microbial colony forming units in all three controls remained the same. Each

Chapter 7 Bioassay Studies
149
of these controls showed that there was no inhibition to the growth of the organism. This
demonstrated that:
• Neither the panel on which the paints were applied, nor the other components of the
paint films were affecting the growth of the organisms
• Only OIT was therefore having a detrimental effect on microbial levels
Figure 7.5: Pseudomonas colonies formation on paint films containing the kaolin, and
subjected to artificial degradation in the QUV over a 1500 hours period
Figure 7.5 shows the formation of bacterial colonies on paint films containing kaolin supreme
clay and OIT over a 1500-hour period. It can be seen that there was practically no difference
between the 2 paint films for the first 200 hours. The only significant differences between the

Chapter 7 Bioassay Studies
150
2 paint films were:
• At 840 hours, the bacterial colonies were 12 and 8 (x 105) respectively for the freely
added and the adsorbed OIT
• At 1200 hours, the number of colonies was 20 and 16 (x 105) for the same paint
films
The controls with the disc with no paint, and the paint with no OIT confirmed that neither the
Leneta discs, nor the other components in the paints were killing the organisms, as the
numbers of colonies were the same as those of the agar plate. The numbers of colonies at
1500 hours were almost the same at 22 and 21 (x 105) respectively for the 2 paints films, and
were approaching the controls (24 x 105, represented by the lines at the top of the graph).
This was an indication that the films were being depleted of their biocide content, leading to
an increase in the number of bacterial colonies.

Chapter 7 Bioassay Studies
151
Figure 7.6: Pseudomonas colonies formation on paint films with silica carplex, subjected to
artificial degradation in the QUV over a 1500 hours period
Figure 7.6 shows the formation of bacterial colonies on paint films containing silica carplex,
over a 1500-hour period. The profiles of the 2 bacterial colony formations were almost
identical, with the difference for both the adsorbed and non-adsorbed carplex being very
negligible. Bacterial colonies at 1500 hours were 18 and 19 (x 105) for the encapsulated and
independently added Carplex respectively, lower than those of the supreme clay.

Chapter 7 Bioassay Studies
152
Figure 7.7: Pseudomonas colonies formation on paint films with montmorillonite MCBP,
subjected to artificial degradation in the QUV over a 1500 hours period
Figure 7.7 shows the formation of bacterial colonies on paint films containing
montmorillonite MCBP, over a 1500-hour period. The profiles for the 2 paint films suggest
that bacterial growth on the paint film containing the encapsulated MCBP was at a lower rate
that that of the film with freely added mineral and biocide. This was due to the fact that the
OIT molecules has been shown to desorb slower from this mineral (see Chapter 6 on
desorption experiment), and will need to thereafter migrate onto the surface of the film in
order to impede on the growth of the organisms. This could also be due to the fact that only
lower amount of the biocide was released from the montmorillonite at time, but in enough
concentration to impede the growth of the organism. The number of bacterial colonies was 12
and 15 (x 105) for the adsorbed and freely added OIT to mineral respectively, significantly

Chapter 7 Bioassay Studies
153
lower than those of the silica and the kaolin. All values are presented in Table 7.2
Table 7.2: Number of pseudomonas colony forming units (x 105) recorded after paint ageing
test in the QUV (at specific times)
Time (hours)
Treatment 24 312 600 1200 1500
% of growth at 1500 hours
Supreme / OIT
1 5 7 16 21 87.5
Supreme + OIT
1 6 8 20 22 91.6
Carplex / OIT
0 4 7 14 18 75
Carplex + OIT
1 5 6 16 19 79.2
MCBP / OIT
0 3 4 7 12 50
MCBP + OIT
0 4 5 9 15 62.5
Control 24 24 24 24 24 100
Paint with no OIT
24 24 24 24 24 100
Disk with no Paint
24 24 24 24 24 100
(Percentages of growth were ratios of values at 1500 hours compared to control values)
The data in Table 7-1 indicated that there was a maximum growth of the organisms in all the
3 controls used, confirming that only the presence of the biocide in the paint films inhibited
that growth. There was also a difference in bacterial growth profile between the three
minerals, with the montmorillonite (MCBP) performing better than the others (with the silica

Chapter 7 Bioassay Studies
154
in second and the kaolin coming last, and was confirmed by the bacterial percentages of
growth in Figures 7.8, 7.9 and 7.10). This finding was consistent with that of the biocide
desorption profiles in Chapter 6, which also showed that MCBP performed better than any
other mineral used. However, the growth profiles also indicated that, with time, the number
of colony forming units on all the paint films was approaching the control. This was an
indication that the OIT contents of the films were decreasing. Every 100 hours a painted
panel spent in the weatherometer was equivalent to 1 month spent in “real” environment
outside. The experiment was therefore run (and data collected) for a period of 15 months
(1500 hours). New controls were made for each time indicated in the Table because the
organism has a short life span (see Figure 7.2 for its growth curve). The controls’ data
indicated that only OIT was affecting the growth phase (Log) of the organism.
The biocide content of the paint films throughout the ageing period, together with the total
ageing time, were calculated using the information provided above (600 hours in the QUV
corresponded to 6 months in real time). The control (24x105 CFU) contained no OIT and
therefore represented a 0% biocide in this calculation, whereas the paint exposure time at 0
hour represented 100% OIT, since no paint degradation or loss had taken place. This
calculation was performed in order to relate the biocide content of the paint films to the
bacteria’s growth throughout the ageing process. Data obtained were plotted on 3 different
curves and analysed.

Chapter 7 Bioassay Studies
155
Figure 7.8: Percentage of OIT left in the paint films containing kaolin supreme throughout
the ageing process
Figure 7.8 shows a decrease in the films biocide levels as the ageing in the QUV progressed.
This finding was in line with the increase in the number of bacterial colonies observed during
the same period of time (Figure 7.5), and indicated that the biocide molecules were migrating
to the surface of the paint films where:
• They degraded under intense UV light in the QUV (during its first cycle)
• They were washed away during the sprinkling period of the second cycle of the
QUV
The amount of OIT left in the 2 films after the ageing process was minimal and fast
approaching the zero line, and probably due to the mineral’s inability to retain the biocide for

Chapter 7 Bioassay Studies
156
a longer period of time (possibly due to its morphology and surface area, as observed in
Chapter 6 of the desorption studies).
Figure 7.9: Percentage of OIT left in the paint films containing silica carplex throughout the
ageing process
Figure 7.9 also shows a decrease in the films biocide levels for the silica carplex system as
the ageing in the QUV progressed. This finding was inversely proportional to the increase in
the number of bacterial colonies observed during the same period of time (Figure 7.6). It
appears from Figure 7.9 that the two films would have been completely depleted of their
biocide content in the ageing process proceeded to 2000 hours (20 months period in real time
application)

Chapter 7 Bioassay Studies
157
Figure 7.10: Percentage of OIT left in the paint films containing montmorillonite MCBP
throughout the ageing process
Like Figure 7.8 and 7.9, Figure 7.10 also shows a decrease in the films biocide levels as the
ageing in the QUV progressed. This finding was also inversely proportional to the increase in
the number of bacterial colonies observed during the same period of time (Figure 7.7). It
appears from the graph that there was a consistent difference between the 2 films, with
MCBP appearing to retain a lot more biocide (when OIT is adsorbed to the mineral) than
when the mineral and the biocide are freely added to the formulation. All findings were
summarised in Table 7.3

Chapter 7 Bioassay Studies
158
Table 7.3: Percentage of OIT left in the paint films after 1500 hours ageing test
Mineral Adsorbed OIT Added OIT Montmorillonite MCBP 50 38
Silica Carplex CS-5 25 22
Kaolin Supreme 13 8
Table 7-3 shows the percentages of OIT remaining in the paint films after the ageing process
in the weatherometer. The adsorbed biocide on all minerals was released slower than the
freely added OIT. This was probably as a result of the structure of the minerals used, with
the adsorbed biocide being trapped between the layers and structure of the platy and
amorphous minerals respectively. The tortuosity of OIT’s path through the platy minerals,
and the pore size restriction of the silica, contributed to the delayed release of the biocide,
whereas the freely added OIT could elute out of the films with minimum inhibition.
The montmorillonite MCBP was the best performing mineral used, followed by the silica and
the kaolin respectively. This was probably due to the different energies of desorption of OIT
from the minerals (see chapter 5 on FMC, Figure 5.1). OIT needed to migrate to the surface
of the films in order to kill the organisms (in the bioassay tests) or be broken down during the
ageing tests. The energies of desorption obtained from the FMC work were 16, 5.9 and 1.5
mJ/g for the montmorillonite, silica and kaolin respectively, and they indicated that the
montmorillonite was twice and four time more efficient at retaining the biocide than the silica
and the kaolin respectively.

Chapter 7 Bioassay Studies
159
7.3 Discussion
This bioassay work was carried out using an external paint formulation. Supreme clay was
used in this experiment because it displayed a very good OIT desorption profile (see Chapter
6). MCBP and carplex were used because they showed the highest adsorption potential in
previous studies (see FMC work in Chapter 5), and also possess the highest surface areas of
all the minerals used in this study.
The wet adsorption process used allowed the entrapment of OIT within the structures of the
minerals. The paint formulations containing the freely added OIT were also made to compare
their release profiles with those of the entrapped biocide. It was hoped that a significant
difference in these release profiles could lead to future commercial and environmental
benefits.
The dilution of the original microbial broth (with a 1 in 105 dilution factor) was made in order
to obtain a more accurate reading of the agar plates after incubation. The cell counter used to
evaluate the total number of microbial forming units was a semi quantitative method, and a
lower dilution factor would have lead to an over population of the agar plates, rendering them
impossible to read. The cetrimide plates used were specifically made for pseudomonas
aeruginosa, as they contained the right nutrients for its growth.
The bacterial growth data showed the organism had a longer lag phase, possibly due to the
time it took to produce the enzymes required for its growth. The three controls used in both
the calibration and degradation studies did not inhibit the growth of the bacteria, as they did
not contain any biocide. The release profiles of the biocide also showed that as the minerals

Chapter 7 Bioassay Studies
160
were being depleted of their OIT content, more bacterial growth occurred on the plates. These
findings lead to the conclusion that no other constituent of the paint film participated in the
inhibition process. The molecular basis for the inhibition of the bacteria’s growth was due to
OIT binding to Nicotinamide Adenine Dinucleotide (NAD) and Flavin Adenine Dinucleotide
(FAD), two key enzyme cofactors in the organism Krebs cycle, preventing the bacteria from
producing Adenosine Triphosphate (ATP), effectively killing it.
The bioassay data showed that the biocide was not permanently trapped within the structures
of the minerals used, and thus confirmed the results obtained from the Flow Microcalorimeter
(see Chapter 5). The released of the biocide from paint films containing montmorillonite
MCBP was twice and four times slower than the films containing the silica carplex CS-5 and
the kaolin supreme respectively for both treatments. This was possibly due to the higher
energy needed to remove it from the montmorillonite clay as a result of stronger bonds
between OIT and the mineral. MCBP expands upon hydration (all 2:1 clays do), unlike the
other 2 minerals used (supreme is a 1:1 clay, and the silica is amorphous). This property of
the MCBP is thought to be very useful in the biocide entrapment process, with the biocide
being entrapped into the core upon drying, and released at a lower rate. The freely added
biocide was released faster in all the minerals used, compared to the “adsorbed” biocide. As
OIT was not physically attached to the minerals, it could therefore move freely between and
around the plates of the montmorillonite and the kaolin, and was also not inhibited by the
pore size effect of the Silica.
The entrapment of OIT into the minerals produced very good release profiles, compared with
the profiles of the more traditional technique of adding the biocide to the paint films. But

Chapter 7 Bioassay Studies
161
there was almost no benefit in impregnating the kaolin with OIT, because the profiles of the 2
films were very similar throughout the ageing process. Paint manufacturers may consider
using montmorillonite as a controlled release mineral in their systems, as this clay has
displayed a better release profile than the other two minerals tested in this study.

CHAPTER EIGHT
INDUSTRIAL PERSPECTIVE OF THE PROJECT
8 Chapter Eight – Industrial Perceptive of the Project

Chapter 8 Industrial Perspective of the Project
163
In this chapter, the importance of this project to Imerys Minerals was reviewed. As cost is an
important part of project management in any company, the viability of any technology used
in this controlled release work is also assessed. The project aim, the biocide sorption
technologies used, together with the importance of the results obtained were also discussed.
The paint characterisation data (optical and mechanical properties) were also presented in
order to assess how they differ to those of the standard paint formulation.
8.1 Industrial aims of the project
According to the Biocides Directives (98/8/EU), “biocidal products are those that are
intended to destroy, render harmless, prevent the action of, or otherwise exert a controlling
effect on any harmful organism by chemical or biological means”. As such, biocides have
been used for years to control the growth of micro-organisms in many different applications.
In the Food industry, iron is used as an antimicrobial agent to extend the shelf life of many
products, and in the paint industry, lead, copper, mercury and others have been extensively
used in decorative paints, and to protect marine vessels from biofouling. In recent years,
many countries have introduced legislation to either reduce the amount of biocide released in
the environment, or to replace the traditional transition metals-based biocides by more
environmentally “friendly” ones. This legislation was brought in as a result of:
• The toxic nature of these biocides (the traditional biocides can destroy both the
target and non-target organisms and plants)
• Their impact on the environment (heavy metals like Hg, Cu2+, Zn2+ stay in the
environment for a long time)

Chapter 8 Industrial Perspective of the Project
164
• The cost to the paint manufacturer (as the release is not controlled, a lot more
biocide is loaded into paints than is actually needed, causing the costs to soar).
Imerys supplies various grades Kaolin and Calcium Carbonate to paper and paint
manufacturers aroud the world. This project was set up to examine ways by which some of
these minerals could be used as carriers of the biocides. The main focus was primarily to
adsorb isothiazoline biocides onto minerals of diverse morphologies and surface areas. These
biocides were selected because they are subject to degradation by micro-organisms, and as
such do not stay in the environment for long. It was hoped that the success of this project
could
• Help the company provide a new generation of minerals for controlled release
purposes
• Reduce the cost of biocide to the paint companies
• Reduce the environmental damage associated biocides release
8.2 Technology used
The technologies used for the various parts of this work are assessed in this chapter in order
to predict their potential costings to either Imerys or any interested paint manufacturer.
Companies are always looking at ways to reduce their manufacturing costs and improve their
products, and any new technology will need to be aligned with this philosophy in order to be
accepted and introduced in the company’s portfolio.
8.2.1 Mineral “impregnation” of biocide
As discussed in Chapters 3 and 4, the minerals used for this work were of different surface

Chapter 8 Industrial Perspective of the Project
165
areas and morphologies. The initial hypothesis was to exploit the different morphologies and
surface areas of the clays for the adsorption and controlled delivery of the biocide. Section
5.2.3 explained that the initial adsorption of the biocides unto the clays was achieved by
using a laboratory bench high shear mill (with the exception of New Zealand halloysite).
Milling causes platy minerals to delaminate, thus offering a way to intercalate them with
different compounds. The 1:1 clays used have one of each sheet of silica tetrahedron and
aluminium octahedron, whereas 2:1 clays have two tetrahedral sheets on either side of an
aluminum octahedron sheet. These tetrahedral and octahedral sheets are variously arranged
and modified during mineral formation to create several types of clay minerals.
The amorphous silica, irregular shape calcium silicate T-38, and diatomaceous earth celtix
were impregnated in the same way. The technique of milling is extensively used in the
mineral industry, and has the advantage of breaking down large particles into small one, thus
increasing their surface area per gram of mineral. Adsorption of the biocides onto the
minerals in this way therefore does not add to the manufacturing costs because of the
widespread use of milling technology in the mineral processing industry.
The impregnation of the halloysite tubes was achieved by mixing, in a beaker, the mineral in
a dilute solution of the biocide. The biocide-halloysite solutions were then placed in a
vacuum over for two hours in order to displace air trapped within the halloysite tubes and
allow the biocides to penetrate the tubes. The technique is time consuming, and could add
some extra manufacturing costs to the process due to the use of the vacuum oven.

Chapter 8 Industrial Perspective of the Project
166
8.2.2 Paint making and ageing test
The paints made in this work followed a protocol that is covered by a secrecy agreement. In
this work, only three minor modifications of this protocol were made, namely:
• The use of the silica and the montmorillonite clays in separate paint films
• The adsorption of the biocide to the minerals before use in some of the paint
formulations.
• The removal of the in-can biocide, to prevent competitive adsorption between that
biocide and the OIT used
The paint-ageing test used is an industry standard test to study the effects of environmental
factors such as ultra violet light and moisture on the degradation of paint films (see Chapter
7).
The paint making and ageing tests are industry standard and have been tried and tested. They
do not add any further cost to the paint manufacturers or the Minerals processing industries.
8.2.3 Bioassay measurements
The bioassay tests carried out (assessment of the potency of the biocide in the paint films,
using pseudomonas aeruginosa as target micro-organisms) was a standard microbiological
assessment for paint films. Micro-organisms naturally grow on minerals, clay slurries, and on
painted surfaces. This test was a useful tool to determine how that growth was affected by the
biocides used.

Chapter 8 Industrial Perspective of the Project
167
8.3 Paint mechanical and optical test measurements
Kaolin supreme, silica carplex and montmorillonite MCBP were used in this study due to
their potential to adsorb substantial amounts of OIT biocide (see section 4.2 on the Flow
Microcalorimeter), and, as seen in Chapter 7, they have displayed a slower desorption of the
biocide from the paint ageing tests. In order to obtain a full understanding of the effectiveness
of the kaolin, silica and the montmorillonite in the paint, optical and mechanical tests were
carried out on the paint films containing the three minerals (with 2 different treatments per
mineral, as described in Chapter 7), and the results compared.
8.3.1 Colour measurement (The CIE “Lab” and XYZ Colour Space)
Whiteness/brightness values are very important for kaolin and other minerals, as their
possible usage in paint formulations is highly dependent on these values. How a colour is
described makes a big difference in the ability to gauge how a consumer will perceive it.
Some standard colour spaces, such as the RGB description, are good for specifying how a
camera should detect a colour but provide no insight into how a human will perceive it. The
Commission Internationale d’Eclairage (CIE) (Vienna, Austria) created a set of colour spaces
that specify colour in terms of human perception. It then developed algorithms to derive
three imaginary primary constituents of colour (X, Y, and Z) that can be combined at
different levels to produce the entire colour range that the human eye can perceive. The
resulting colour model, CIEXYZ, and other CIE colour models, form the basis for all colour
management systems. The goal of this standard is for a given CIE-based colour specification
to produce consistent results on different devices, up to the limitations of each device [99].

Chapter 8 Industrial Perspective of the Project
168
8.3.1.1 XYZ space
There are several CIE-based colour spaces, but all are derived from the fundamental XYZ
space. The XYZ space allows colours to be expressed as a mixture of the three tristimulus
values X, Y, and Z. The term tristimulus is derived from the fact that colour perception
results from a retinal response to three types of stimuli. After experimentation, the CIE set up
a hypothetical set of primaries, XYZ, that correspond to the way the retina behaves [99].
The CIE defined these primaries so that all visible light maps into a positive mixture of X, Y,
and Z, and so that Y correlates approximately to the apparent lightness of a colour. Generally,
the mixtures of X, Y, and Z components used to describe a colour are expressed as
percentages ranging from 0 percent up to, in some cases, 100 percent [99].
Yxy space expresses the XYZ values in terms of x and y chromaticity co-ordinates using the
following set of equations:
Z)Y(X
Y y
Z)Y(XX x
YY
++=
++=
=
Equation 8.1
The Z tristimulus value is incorporated into the new co-ordinates and does not appear by
itself. This allows colour variation in Yxy space to be plotted on a two-dimensional diagram.
Figure 8.1 shows the layout of colours in the x and y plane of Yxy space [99].

Chapter 8 Industrial Perspective of the Project
169
Figure 8.1: Yxy chromaticities in the CIE colour space [99]
One problem with representing colours using the XYZ and Yxy colour spaces is that they are
perceptually non-linear. It is not possible to accurately evaluate the perceptual closeness of
colours based on their relative positions in XYZ or Yxy space. Colours that are close
together in Yxy space may seem very different to observers, and colours that seem very
similar to observers may be widely separated in Yxy space [99].
8.3.1.2 L*a*b* space
L*a*b* space (Figure 8.2) is a non-linear transformation of the XYZ tristimulus space.
These spaces are designed to have a more uniform correspondence between geometric
distances and perceptual distances between colours that are seen under the same reference
illuminant [99]. The values are worked out using the following set of equations:

Chapter 8 Industrial Perspective of the Project
170
⎥⎥⎦
⎤
⎢⎢⎣
⎡⋅⎟⎟⎠
⎞⎜⎜⎝
⎛−⋅⎟⎟
⎠
⎞⎜⎜⎝
⎛=
⎥⎥⎦
⎤
⎢⎢⎣
⎡⋅⎟⎟⎠
⎞⎜⎜⎝
⎛−⋅⎟⎟
⎠
⎞⎜⎜⎝
⎛=
−⋅⎟⎟⎠
⎞⎜⎜⎝
⎛⋅=
31
ZZ
31
YY200b*
31
YY
31
XX500a*
1631
YY116L*
00
00
0
L* Equation 8.2
Where X,Y and Z are tristimulus values and X0, Y0 and Z0 are tristimulus values for a perfect
diffuser for the illuminant used [100]
Figure 8.2: L*a*b* colour space [100]
The a* value from the L*a*b* results show how red/green the sample is. A positive a* value
means a red colouration of the sample (and a probable iron contamination in the mineral
samples), whilst a negative a* value indicates a green colouring of the sample. The L* value
is the grey-scale. The closer the value for the sample is to 100, the whiter the substance will
be. A positive b* value means the sample colour is slightly yellow, while a negative b* value
indicates a blue colouring of the sample. However, when a* or b* is zero, the colour of the

Chapter 8 Industrial Perspective of the Project
171
sample is on the grey scale.
8.3.1.3 Materials and Methods
100 µm film of the paints made were drawn down on labelled Melanex (clear plastic) sheets
pre-cleaned with acetone, using the automatic paint applicator. Samples were stirred prior to
application and a clean bar used each time. The painted Melanex sheets were then dried at a
temperature of 230C (within 20C) and a relative humidity of 50% (within 5%) for 24 hours. 5
discs from each sheet were cut out using the hole punch. L*a*b* measurements were carried
out using the Minolta spectrophotometer CM-3610d, which was linked to a computer for data
acquisition. The Minolta was calibrated using the zero calibration metal, consisting of a black
Minolta tube with open end. Then, a white Minolta calibration plate was also placed under
the analyser, and measured. The five discs were stacked on top of each other under the
analyser and measured by changing over the top one each time. The final results were saved
as a SpectraMagic (.wsv) file, which was in turn saved as a spreadsheet (.txt) file. From
Excel, this file was finally saved as an Excel file for future analysis.
8.3.2 Gloss Measurement
Paints come in a variety of finish gloss levels, which correspond to different levels of
specular reflection. These are not standardised, but normally run: Flat, matt, eggshell, satin,
semi gloss and high gloss. Specular reflection is the mirror like reflection of light (or other
kinds of wave) from a surface, in which light from a single incoming direction (a ray) is
reflected into a single outgoing direction. Such behaviour is described by the law of
reflection, which states that the direction of incoming light (the incident ray), and the
direction of outgoing light reflected (the reflected ray) make the same angle with respect to

Chapter 8 Industrial Perspective of the Project
172
the surface normal, thus the angle of incidence (θi) equals the angle of reflection (θr).
This is in contrast to diffusion reflection, where incoming light is reflected in a broad range
of directions. The most familiar example of the distinction between specular and diffuse
reflection would be glossy and matt paints. While both exhibit a combination of specular and
diffuse reflection, matt paints have a higher proportion of diffuse reflection and glossy paints
have a greater proportion of specular reflection.
ISO 2813 (1994) defines specular gloss as 'the ratio of luminous flux reflected from an object
in a specular direction for a specified source and receptor angle, to the luminous flux
reflected from glass with a refractive index of 1.567 in a specular direction'. Thus, a measure
of the glossiness of a surface is the quantity of light reflected from a test surface at a specified
angle, compared with that of a standard surface, which is a black glass. The specified angle is
that measured from the normal to the test surface. It is important to specify this angle, since
the gloss may vary greatly as the viewing angle is changed. For example, a sheet of paper on
a desk appears to have a matt finish, but the same sheet of paper looks shiny when held up to
the light and viewed from a very low angle.
The three main geometries are 20, 60 and 85 degrees, with two more specialist angles of 45
and 75 degrees. Therefore, depending on the material, surface texture and gloss levels
required, different angles are specified for different materials. For example, a 20 degrees
angle, which gives the best resolution, is applicable to high gloss paint finishes such as cars,
plastics, varnishes and polished metals. A 60 degrees angle is probably the most universal,
and is usually specified for normal paints and varnishes. The 85 degrees angle is applicable to

Chapter 8 Industrial Perspective of the Project
173
low gloss finishes such as matt paints, plastic car interior parts or even textiles. Of the
specialist angles, the 45 degrees angle is sometimes used for measuring the gloss of plastic
films and some types of ceramics, while the 75 degrees is specific to the paper industry.
Different manufacturers group these reflection levels differently, and some consider flat and
matt to be synonymous. Manufacturers describe finish by percent gloss, where 0% gloss is a
dull unreflective surface and 100% gloss is mirror-like. Values for percent gloss vary, as do
the terms. One manufacturer measures gloss as percentages (at an unspecified angle) and
gives:
• Flat (1 to 9% gloss)
• Matt (10 to 25% gloss)
• Eggshell (26 to 40% gloss)
• Semi Gloss (41to 69% gloss)
• Gloss (70 to 89% gloss)
Another manufacturer interprets these values as such:
• Relative durability of finishes: Since the material they use to create gloss is dense
and glassy, gloss paints will be more resistant to damage than flat paints.
• Ease of cleaning: Glossy surfaces do not trap dirt like flat finishes, and generally are
easier to clean. High-gloss paint is also more resistant to staining.
• Ease of repair/touchup: Flat can be touched up locally without repainting the entire
surface.
Other considerations may include the preparation time for high gloss surfaces, which is

Chapter 8 Industrial Perspective of the Project
174
considerably more than for flat. The gloss finish will also reveal surface imperfections such
as sanding marks and fingerprints. In the automotive and marine industry, this is a major
consideration. In traditional household interiors, walls are usually painted in flat or eggshell
gloss, wooden trim (including doors and window sash) in high gloss, and ceilings almost
invariably in flat. Similarly, exterior trim is usually painted with gloss paint, while the body
of the house is painted in a lower gloss.
8.3.2.1 Materials and Methods
100 µm films of the paints made were drawn down manually on labelled glass sheets pre-
cleaned with acetone using the applicator. Samples were stirred prior to application and a
clean bar used each time. The samples were then dried at a temperature of 230C (within 20C)
and a relative humidity of 50% (within 5%) for 24 hours. Gloss measurements were carried
out using the Gardner Haze-Gloss meter (see Figure 8.3), which was calibrated using the
BYK Gardner High-Gloss standard and the BYK Gardner Haze-Gloss standard respectively.
The paint drawdowns were not stacked prior to measuring as this could affect the results.
Three measurements along the film were taken at two different angles of incidence, 600 and
850, and the average readings were taken.

Chapter 8 Industrial Perspective of the Project
175
Figure 8.3: 45 and 20 degrees gloss measurements by the Gardner Gloss meter [101]
8.3.3 Contrast Ratio (Opacity) Measurement
Opacity / Contrast ratio is the measure of impenetrability to electromagnetic or other kinds of
radiation, especially visible light. It is a measure of a display system, defined as the ratio of
the luminance of the brightest colour (white) to that of the darkest colour (black) that the
system is capable of producing. A high contrast ratio is a desired aspect of any display, but
with the various methods of measurement for a system or its part, remarkably different
measured values can sometimes produce similar results.
8.3.3.1 Materials and Methods
100 µm films of the paints made were drawn on labelled Morest charts (with black and white
bands) not pre-cleaned with acetone. For side-by-side Drawdowns, half of the drawdown was
of standard sample, the other of the test sample. Samples were stirred prior to application and
a clean bar used each time. Samples were dried at a temperature of 230C (within 20C) and a
relative humidity of 50% (within 5%) for 24 hours.

Chapter 8 Industrial Perspective of the Project
176
Measurements were carried out using the Minolta spectrophotometer CM-3610d, linked to a
computer for data acquisition. The spectrophotometer was calibrated as follow:
• A “zero calibration” black Minolta tube with open end upwards, and the label facing
the user, was placed under the analyser and the measurement was taken
• A white Minolta calibration plate was thereafter also placed under the analyser and
measurement was also taken
In order to measure the samples, the “Opacity/Reflectivity” option was selected on the
Minolta first. Then the black area of an unused Morest chart (see Figure 8.4) was measured at
three different points, followed by the white Morest chart (also at three different points). The
“% Opacity” results obtained were recorded, and the remaining painted Morest charts were
also measured. Data obtained were saved as an Excel file. During measurements, each Morest
chart was supported to ensure that it was flat and up against the base of the instrument.
Figure 8.4: A Morest black and white chart

Chapter 8 Industrial Perspective of the Project
177
8.3.3.2 Results of all optical measurements
Table 8.1: Summary of L*A*B*, Gloss and Opacity data of the paint films made
L*A*B* tests
Gloss on glass (Accurate method)
% Opacity
L* A* B* Ry 60o Stdvev 85o Stdvev N
Supreme 96.0938 -
0.4706 2.4848 90.23 3.9 0.3 12.5 0 3 95.92
Carplex 96.1206 -
0.4726 2.4987 90.3 3.9 0.2 11 0.2 3 95.84
MCBP 96.0122 -
0.4562 2.592 90.04 4.2 0.4 12.3 0 3 95.73
The high L* values for the three paints (very close to 100) indicated that these paints were
white on this grey scale. The values of a* (redness and greenness), and b* (yellowness and
blueness), were negative and positive respectively for all samples and very close to zero, also
indicating the colour on these scales were closer to the grey scale (see Figure 8.2). This was
confirmed by the very high Ry values of more than 90% for all samples. The Ry value is an
overall indicator of luminescence reflectance used for white and neutral colours, and is equal
to Y brightness. The L*A*B* and Ry values for the three minerals were very similar,
indicating there was practically no loss of brightness when supreme was replace with carplex
and MCBP
The low percentages of gloss at 600 angle (3.9% for both the silica and the kaolin, and 4.2%
for the montmorillonite) suggested that the paints were “flat”, whereas the values at 850 angle
(12.5%, 11% and 12.3% for the kaolin, silica and montmorillonite respectively) were

Chapter 8 Industrial Perspective of the Project
178
synonymous of “matt” paints. Both “flat” and “matt” paints displayed a higher proportion of
diffuse reflection than of specular reflection, and are considered by many to be synonymous
in the paint industry. They do not tend to reveal surface imperfections, and require little
preparation time.
The very high percentage opacity of the paints (95.92%, 95.84% and 95.73% for the kaolin,
silica and montmorillonite respectively) denoted the level of light transmitted by these fluids.
An opaque object is neither transparent (allowing all light to pass through) nor translucent
(allowing some light to pass through). When light strikes an interface between two
substances, in general some may be reflected, absorbed, or scattered, and the rest transmitted.
An opaque substance transmits very little light, and therefore reflects, scatters, or absorbs
most of it. The paints containing silica carplex and montmorillonite MCBP displayed slightly
higher contrast ratios than the paint with kaolin supreme. This may be due to the fact that the
silica and MCBP contain slightly less iron than the kaolin.
8.3.4 Scrub Resistance
Scrub resistance is the ability of the surface of a composite material to resist being worn away
or to maintain its original appearance when rubbed with a brush, sponge or cloth and an
abrasive soap. Paints often become soiled, especially near doorways, windows, and in work
and play areas. The test method described here covers the determination of the relative
resistance of different paints to erosion when repeatedly scrubbed during the life of the paint.
8.3.4.1 Materials and Methods
400 µm films of the paints made were drawn down on a labelled black Leneta sheet not pre-
cleaned with acetone, using the automatic applicator. The paints were stirred prior to

Chapter 8 Industrial Perspective of the Project
179
application, and a clean bar used each time. The painted Leneta sheets were dried at a
temperature of 230C (within 20C) and a relative humidity of 50% (within 5%) for 7 days prior
to use. Two DIN (German ISO standard) brushes were soaked in a metal dish of 0.25wt%
caflon NAS-25 solution overnight prior to measurement, ensuring that they were labelled “A”
and “B”, both of these having a scrub factor of 0.82. The double brush holder was attached
between the two scrub wires, each on the bottom of the screw thread on the brush holder (so
the wires are horizontal which avoids a rocking motion). Each black Leneta sheet was cut
into 3 equal widths of film, ensuring each was appropriately labelled. For loss-in-weight
measurements after 200 DIN cycles (British Standard), the films were wiped with a dry
Kimwipe and each film secured with a paper clip, and weighed to 4 decimal places (with the
weight of the paper clip tared). Weighing was carried out just before testing as the coalescing
solvent evaporates very slowly and continually affects the film weight as a result.
With the matt surface of the glass sheet uppermost, the first two sheets of Leneta were placed
onto the glass sheet side-by-side. They were then held in position using the left hand clamp
only. The brushes were rinsed and dried (by shaking them). Each brush was placed into the
brush holder with the words “DIN 53 778” facing the user. Each of the two pump reservoirs
was filled with 0.25wt% caflon NAS-25 and switched on, ensuring that each one drips onto
the centre of each brush path at 1 cm3min-1. The scrub machine was then switched on, and the
number of cycles recorded (200 cycles in total, at 37 cycles a 1 minute).

Chapter 8 Industrial Perspective of the Project
180
8.3.4.2 Results
Table 8.2: Weight loss after 200 scrub cycles
Drying Time
(Days) BS (*) cycles
Initial weight
(g)
Final weight
(g)
Weight difference
(g)
Weight loss
(mgcm-
2) (**)
Average
Kaolin
7 200
19.9926 19.9134 0.0792 0.56
0.58 17.8918 17.8092 0.0826 0.58
17.2921 17.2070 0.0851 0.60
Silica
7 200
18.5857 18.5010 0.0847 0.60
0.55 19.4606 19.3848 0.0758 0.53
16.6112 16.5352 0.0760 0.53
Montmorillonite 7 200
18.4463 18.3467 0.0996 0.70
0.65
18.5430 18.4438 0.0992 0.70
17.4630 17.3825 0.0805 0.57
(*): British Standard
(**): Weight lost (mgcm-2) = [weight difference (g) x 1000] / 142.35 cm2 (surface area of
the Laneta sheet)
Table 8.2 shows the weights of the paint films before and after scrubbing. The average
weight loss values indicated that:
• 5% less paint was lost from the paint containing the silica (Carplex) than from the
kaolin (Supreme) containing paint
• 12% more paint was lost from the paint containing the montmorillonite (MCBP)
than from the same Supreme paint

Chapter 8 Industrial Perspective of the Project
181
The data suggested that the silica-based paint offered an improved scrub resistance to both
the kaolin and the montmorillonite-based paints. Montmorillonite is a 2:1 clay and has been
shown in previous studies to be very abrasive when used in polymer nanocomposites, hence
paints loaded with this clay will be more prone to erosion when repeatedly scrubbed during
the life of the paint.
8.3.5 Stain Resistance
Stain resistance is the capability of a painted surface to resist retention of household or
commercial dirt and stains. These stain resistant paints make it possible for most types of
stains, dirt and grime to be simply washed off with soap and water. These paints may provide
the benefits of a flat paint (the ability to hide surface imperfections and give walls a smooth
rich-looking finish), as well as the durability and ease of cleaning typically found in semi-
gloss paints.
8.3.5.1 Materials and Methods
200 µm films of the paints made were drawn on labelled glass sheets pre-cleaned with
acetone using the applicator (mechanical drawdown). Samples were dried at 230C (within
20C) and a relative humidity of 50% (within 5%) for 24 hours, and stirred prior to application.
A clean bar was used each time during the application process.
The staining of each sheet was carried out under the fume hood using 10% gilsonite, which
was regularly stirred to dissolve any sediment (gilsonite is a form of natural asphalt found
only in the Uintah basin, Utah, USA, and primarily used in dark-coloured printing ink). Each
film was brushed down and left to stand in an upright position for exactly 1 minute. Enough
stain was applied so that it does not start to dry out within that period. The stained sheets

Chapter 8 Industrial Perspective of the Project
182
were then washed, as quickly as possible, in the upright position using a “push-down pump”
wash bottle of white spirit, left for exactly 1 further minute after washing, and then washed
again as before. After the second wash, they were placed onto kimwipe and the surplus white
spirit wiped off, and left to dry for approximately 2 hours before starting the stain
measurements.
Stain resistance sheets can be stacked prior to measurement. The unstained/stained results
(Ry values) were measured three times along each film sheet, using the Elrepho Data Colour
spectrophotometer set on filter 10, and the average data calculated. Ry (often used as Ry
luminous factor) is expressed as a ratio, and primarily used for white or neutral colours as an
overall indicator of reflectance. The stain resistance was determined using the following
equation:
100Result Unstained
Result Stained (%) ResistanceStain ×= Equation 8.3
8.3.5.2 Results
Stain resistance data obtained from the tests are summarised in Table 8.3
Table 8.3: Stain resistance of the paints made
Paint containing Mean stained “Ry” values
Mean unstained “Ry” values
Stain Resistance (%)
Supreme 86.19 86.19 100
Carplex 85.89 86.47 99.32
MCBP 85.89 86.21 99.62

Chapter 8 Industrial Perspective of the Project
183
The unstained data showed that the both the silica and the montmorillonite-based paints had a
better colour reflectance than the supreme-based paint. Nevertheless, the stain resistance data
in Table 8.3 showed the supreme-based paint did not retain any of the stain applied,
compared with the Silica and montmorillonite based paints. The level of stain retention by the
latter two paints was, however, very negligible, hence their high percentages of reflectance.
8.3.6 Rheology tests
For high solids paints, flow control is vital because it determines important properties like
sagging and leveling. The rheology of the uncured paint is determined by interactions of all
the solid particles (pigment, extender, matting agent, rheology modifiers) with the binders
and solvents in the system. Understanding these relationships is required if control of the
properties is to be achieved. Standard test methods for the rheological properties of this Non-
Newtonian fluid were carried out to determine its apparent viscosity, shear thinning, and/or
thixotropic properties at various shear rates. The distinction between a thixotropic fluid and a
shear thinning fluid is as follow:
• A thixotropic fluid displays a decrease in viscosity over time at a constant shear rate.
• A shear thinning fluid displays decreasing viscosity with increasing shear rate.
A classic example of a thixotropic material is the non-drip paint. This is due to flocculated
particles being sheared apart and then re aggregating.
8.3.6.1 Viscosity measurements by the Digital Brookfield Viscometer
In this test, the non-Newtonian properties of the paints were investigated. The paints were
stored at 230C (within 20C) for 24 hours prior to testing, and the rotational (Brookfield)

Chapter 8 Industrial Perspective of the Project
184
Viscometer ASTM D2196 was used, in the shear rate range 0.1 to 30 s-1. The Brookfield
viscometer is standard equipment at Imerys for the measurement of paint viscosity. The
experiment was set up as follow:
• The Brookfield Viscometer was warmed up for approximately 10 minutes before
use.
• The viscometer was then zeroed at 10 rpm without a spindle. Spindle 6 was then
inserted, lowered down into the side of the paint tin and slide across to the centre of
the tin, and finally left for exactly 1 minute.
• A shear rate of 0.3 s-1 was then selected (at 1 rpm) for exactly 1 minute, and the
viscosity recorded (times by 100 for Spindle 6). This was repeated at 10 rpm (3 s-1)
then 100 rpm (30 s-1) (times by 10 then 1 respectively for Spindle 6).
The speed was always reduced after final reading at 100 rpm to 1 rpm for the next sample.
This was carried out whilst the motor was running to prevent gear damage. The spindle was
washed by removing it (unscrewing). The process was repeated for all paints made.
8.3.6.2 Results of the rheology measurements of the paints made by the Brookfield
viscometer
The results of the viscosity measurements of the non-Newtonian paints made are presented in
Table 8.4.

Chapter 8 Industrial Perspective of the Project
185
Table 8.4: Viscosity data of the paint (Viscosity readings in Poise)
Shear rate (s-1) Paint containing 0.3 3 30 Kaolin Supreme 770 128 27
Silica Carplex 930 148 32
Montmorillonite
MCBP 900 132 26
The data in Table 8.4 showed a decreasing viscosity as the shear rate increased,
demonstrating that the paints were all shear thinning. The kaolin, silica and montmorillonite-
based paints have all displayed a similar shear thinning behaviour.
The Brookfield viscometer is generally not considered the most reliable equipment for the
measurement of fluid viscosity; therefore three other measurements were made to confirm its
findings.
8.3.6.3 Viscosity measurements by the Sheen 480 Stormer Krebs Viscometer
Viscometers are used to define the viscous properties of a fluid at ambient or defined
temperatures. This viscometer employs a paddle to measure the viscosity of a non-Newtonian
fluid (most paints) based on the resistance to flow while stirring. The experiment was set up
as follow:
• The viscometer was set to stir the paints at 200 rpm (60 s-1)
• The spindle was lowered fully using the lever and started

Chapter 8 Industrial Perspective of the Project
186
• The final reading appeared after approximately 1 minute.
After taking the reading, the spindle was washed by raising a tin of warm water underneath,
brushed and then wiped dry. These steps were repeated for each of the paints measured.
8.3.6.4 Viscosity measurements by Sheen Roto-Thinner Viscometer (150 s-1)
The Rotothinner instrument uses a disc or ball shaped rotor to determine the viscosity of the
sample under test at 150 s-1 shear rate. The results are displayed on the LCD screen in Poise
(P) units (1 P = 1 g.cm-1.s-1, or 1 P = 0.1 Pa.s). The experiment was set up as follow:
• The viscometer’s spindle was fully lowered into the paint tin, and then removed.
This was done a couple of times to prevent it sticking.
• The spindle was fully lowered again, and then left to stir for exactly 1 minute, and
the reading was recorded.
After the experiment, the spindle was washed by lowering it into a tin of warm water. The
experiment was repeated for each of the paint made.
8.3.6.5 Viscosity measurements by Sheen Cone and Plate Viscometer (10,000 s-1)
This Cone/Plate viscometer/rheometer is a sophisticated instrument for routinely determining
absolute viscosity of fluids in small sample volumes. Its cone and plate geometry provides
the precision necessary for development of complete rheological data. This viscometer has a
precise torque meter that can be driven at discrete rotational speeds. The torque measuring
system, which consists of a calibrated beryllium-copper spring connecting the drive
mechanism to a rotating cone, senses the resistance to rotation caused by the presence of
sample fluid between the cone and a stationary flat plate. The resistance to the rotation of the

Chapter 8 Industrial Perspective of the Project
187
cone produces a torque that is proportional to the shear stress in the fluid. The amount of
torque is indicated on a digital display. This reading can easily be converted to absolute
centipoise units (mPa·s) from pre-calculated range charts. The instrument was operated as
follow:
• The Cone & Plate viscometer was calibrated using the standard oil “Dow Corning
200/100cs” (silicone oil).
• A small blob of stirred sample was placed onto the plate using a spatula (the plate
must not be tapped with the spatula, as this is likely to cause damage).
• The handle was lowered in order to lower the cone onto the plate, and left for exactly
40 seconds to allow the temperature of the cone and plate to stabilise.
• The “Read” button was pressed until it bleeps and the cone started to spin. After
approximately 10 seconds a viscosity reading was displayed temporarily (the
standard oil should be 1.1) and the cone stopped spinning. The handle was lifted to
raise the cone and the sample was wiped off from the cone and plate using Kimwipe.
This step was repeated using clean kimwipe and acetone. The underneath and sides
of the cone and plate were thoroughly checked for cleanliness.
• The temperature was kept at 25oC, the spead of the cone at 750 rpm, and the
viscosity at 10 Poise. A repeat run was performed for each of the paint samples

Chapter 8 Industrial Perspective of the Project
188
8.3.6.6 Results of the Shear-thinning properties of the paints made
Table 8.5: Viscosity measurement data of the paints made, using the Stormer Krebs, the
Roto-Thinner and the Sheen and Cone viscometers (Viscosity readings in Poise)
Shear rate (s-1) Paint containing 60 150 10,000 Kaolin Supreme 101 6.1 0.9
Silica Carplex 105 6.8 1.0
Montmorillonite
MCBP 99.4 5.8 1.1
The data in Table 8-5 showed a decrease in viscosity of the paints with an increase in shear
rate, a typical characteristic of shear thinning non-Newtonian fluids. The data nonetheless
confirm the findings of the Brookfield, as all 3 paints were remarkably similar in their shear
thinning ability
8.4 Conclusion
The industrial importance of this project was explored in this chapter. The project fitted in
with the company’s philosophy of giving its products increased (or new) functionality, in
order to maximise the company’s revenues.
As milling is already extensively used by Imerys, the impregnation of minerals by the
biocides using the bench high shear mill does not add to the manufacturing costs. In the paint
optical test, the L*A*B* and Ry values for the three minerals were very similar, indicating
there was practically no loss of brightness when the kaolin, the silica or the montmorillonite

Chapter 8 Industrial Perspective of the Project
189
was used in the paint formulation. The gloss and opacity characteristics of the paints made
were very similar for the three minerals used. These paints were characterised as “flat” (due
to their low percentages of gloss at 600 angle) and “matt” (because of the high gloss
percentages at 800 angle). The very high percentage opacity of these paints suggested they
transmitted a lot of light. The paints containing montmorillonite MCBP and the silica carplex
displayed slightly higher contrast ratios than the kaolin supreme paint. This may be due to the
fact that the carplex and MCBP contain slightly less iron than the kaolin.
The scrub resistance data indicated that the Silica-based paint was less prone to erosion than
both the kaolin and the MCBP-based paints, probably due to the fact that the platy clays are
in general more abrasive than the amorphous silica. The staining data indicated that the silica
and the MCBP-based paints had a better colour reflectance than the supreme-based paint.
Nevertheless, the supreme-based paint did not retain any of the stain applied, compared with
the silica and MCBP based paints. The level of stain retention by the latter two paints was,
however, very negligible, and did not affect their colour reflectance. The rheology
measurements confirmed that all the paints made were very similar in their shear thinning
ability.

CHAPTER NINE
CONCLUSION AND FUTURE WORK
9 Chapter Nine – Conclusion and Future Work

Chapter 9 Conclusion
191
Nine minerals were initially chosen for this controlled release study, based on differences of
their surface area and morphology. The silica (Carplex) was chosen as the initial control
mineral because it has a very high adsorption potential, being already used in the brewing
industry to remove unwanted chemicals from beer purification. The New Zealand halloysite,
calcium silicate (T-38), diatomaceous earth (Celtix), and the montmorillonite (MCBP) were
all selected because they have been used in controlled release experiments with varying
degree of success. The four kaolins, NPD-16A, infilm 939, suprex and supreme were chosen
because they are produced by Imerys, and could offer an alternative to the silica and
montmorillonite in a controlled release system.
Two different biocides, OIT and CIT/MIT, based on the isothiazoline chemistry, were
chosen because they were both biodegradable when release and cause very minimal
environmental damage.
These nine minerals were then carefully characterised to identify their individual surface area
(B.E.T nitrogen analysis), chemical compositions (XRF), crystal structures (XRD),
morphologies (SEM) and particle size distributions (Malvern Mastersizer). The particle size
distribution using the Malvern Mastersizer revealed that the silica (Carplex), the kaolinite
(Supreme) and the montmorillonite (MCBP) were the finest three clays of the group of
minerals studied, with a better size distribution and “Top Cut” d98 values. This constituted
one of the reasons these clays were selected for the paint and bioassay work. Scanning
Electron Microscopy uncovered the shapes of the minerals used. Using this technique, it was
possible to establish the platy nature of the kaolins and montmorillonite (suprex, supreme,
NPD-16A, infilm 939 and MCBP), the rod-shape of the halloysite, the amorphous nature of

Chapter 9 Conclusion
192
the silica (Carplex CS-5), and the irregular shape of the diatomaceous earth and the calcium
silicate (T-38 and Celtix). These morphologies helped to identify methods to entrap the
biocide (using vacuum pump for Halloysite, and wet and/or dry method for the other
minerals).
It was important to know how much biocide could be adsorbed onto these minerals. Initial
experiments were therefore set up to determine the adsorption isotherms using Flow
Microcalorimetry (FMC) and High Performance Liquid Chromatography (HPLC) techniques
to calculate the optimum biocide loading of the minerals, so that a system could be developed
that could deliver a level of biocide above the minimum inhibitory concentration of the
biocide. The adsorption isotherms (in both static and dynamic environments) identified how
much biocide was adsorbed, and how strongly it adsorbed/desorbed to and from the minerals.
The low surface area minerals were able to carry the isothiazoline biocides, contrary to what
was stated in the open literature [86]. The ratios of the footprint data between the two biocide
molecules indicated that the thermodynamics favour OIT in the adsorption process of
minerals. This could be due to the orientation of the biocide molecules as they adsorb onto
the minerals, with the more hydrophobic octyl side chain on OIT away from the minerals’
surfaces, whereas the hydrophilic methyl on CIT/MIT was participating in the adsorption
process. The Flow Microcalorimetry data confirmed OIT was adsorbed to all the minerals,
but the desorption energies indicated that these minerals held to the biocide with differing
levels of strength (from almost irreversible adsorption with the diatomaceous earth celtix to
completely reversible with the kaolin NPD-16A). The isotherms and FMC results indicated
that:

Chapter 9 Conclusion
193
• Montmorillonite MCBP and silica carplex CS-5 were the best OIT adsorbing
minerals in both static and dynamic environments.
• New Zealand halloysite, the kaolins NPD-16A, infilm 939 and suprex were the worst
performing minerals (for biocide adsorption), and consequently were not selected for
the bioassay experiment.
The montmorillonite MCBP used is a 2:1 clay mineral with larger interlayer spaces, giving
it the capacity to hold biocide molecules and a variety of cations. The larger interlayer
spaces allow the clay to shrink/swell. This clay was reported to look like a sponge in
previous analysis [102], just like the silica used. This property made MCBP and the silica
the ideal minerals for use in adsorption experiments.
The amount of biocide that actually desorbs from a paint film containing the minerals and the
biocide was investigated using the FMC and HPLC. From the results it was clear that the
calcium silicate T-38 and the diatomaceous earth celtix were unsuitable for future controlled
release experiments because they were both depleted of their biocide content after four hours
(Celtix) and 7 days (T-38). Both irregular shape minerals could therefore not be used in the
paint formulation and were discarded.
The montmorillonite (MCBP), the silica (Carplex) and the kaolin (Supreme) were, however,
promising candidates because they held on to the biocide for a longer period of time. The
montmorillonite has shown in all experiments that it was more efficient at adsorbing the
biocide than any other mineral used, possibly due to its 2:1 structure. The data suggested that
this mineral could be used in a paint formulation to release the biocide over a longer period of
time. As the mineral expands upon hydration, the amount used in the paint needs to be kept

Chapter 9 Conclusion
194
very low in order to preserve the structural integrity of the paint.
The desorption experiments also uncovered a prolong release of the OIT when it was
encapsulated within the minerals used (with the exception of the calcium silicate T-38). This
was probably due to the fact that the biocide had to navigate within or between the structures
of the minerals to the surface of the paint films before being release into the water.
Next, bioassay experiments were carried out using the best performing minerals in the
adsorption and desorption work, the montmorillonite, silica and kaolin. The work was done,
after extensive paint ageing tests, to confirm that the biocide desorbed from the paint film and
inhibited the growth of the bacteria. Data obtained first showed the organism had a longer lag
phase, possibly due to the time it took to produce the enzymes required for its growth. The
bioassay also confirmed that the biocide was not permanently trapped within the structures of
the minerals and the paints (absence of bacteria colonies on the agar plates in the first 24
hours), and thus confirming the OIT desorption results. All three minerals used showed
depletion in their biocide content as the ageing test progressed (with the appearance of
bacterial colonies). Nevertheless, the montmorillonite MCBP was again the best performing
mineral with half its initial biocide concentration still in the paint after 1500 hours
experiment, followed by the silica and the kaolin.
Further tests were carried out to ensure that the properties of the montmorillonite, silica, and
kaolin did not affect the paint rheology, colour, gloss, opacity, stain and scrub resistance. The
rheology tests showed that all the paints made were shear thinning. Data obtained from the
scrub resistance suggested that the Silica-based paint offered an improved scrub resistance to

Chapter 9 Conclusion
195
both the kaolin and the montmorillonite-based paints. Montmorillonite has been shown in
previous studies to be very abrasive when used in polymer nanocomposites, hence paints
loaded with this clay will be more prone to erosion when repeatedly scrubbed during the life
of the paint. The stain resistance data of the paints were almost identical for the three
minerals. The gloss, opacity and colour measurements of the paints were also very similar,
and the use of the Kaolin, the Silica and the Montmorillonite in the paint formulation did not
alter the optical property of the paints made.
There is a recommendation for future work that could expand upon the findings of this work
for industrial application. In order to increase the release time of the biocide from the paint
films, the biocide impregnated minerals may be encapsulated within a secondary carrier (a
protective framework, like a sphere). This secondary carrier should be chosen so as it does
not compromise the structural integrity of the paint (no interference with the paint mechanical
and optical properties). This carrier could then be a rate-limiting step for the release of the
biocide used.
A second aspect of the future work would be to undertake a surface treatment of the minerals
used before their impregnation with the biocide and consequent addition to the paint films.
This can take the shape of adding carboxyl (COOH) groups to the surface of the minerals.
These groups are known to have a strong affinity to hydroxyl groups (OH) present on the
biocides, and can help entrap the biocide onto the surface of the carriers. However, the
strengths of these attachments and the conditions under which the biocide molecules will
desorb from the minerals will need to be investigated.

Chapter 9 Conclusion
196
A third and final aspect of the future work could involve ion exchange within the mineral
framework. The minor elements (mainly cations like Mg2+, Na+, K2+, and Fe2+) found during
the XRF analysis of the minerals, are thought to participate in the biocide impregnation
process of the minerals via ion exchange processes[82]. An example is shown in Figure 9.1,
where chlorine ions are replaced by a different compound.
Figure 9.7: Proposed intercalation of compounds into a platy clay (done here via an anion
exchange [82].
In order for the ion exchange process to be successful, care needs to be taken regarding the
choice of biocides used. These biocides need to have a strong affinity to the mineral in order
to dislodge the cations present on its surface. This form of attachment of the biocide to the
mineral needs not be permanent, as the biocide will still need to migrate out of the mineral’s
plates to be an effective antimicrobial agent.

REFERENCES
10 References

198
1. Levis S.R., Deasy P.B. Use of coated microtubular halloysite for the sustained release of diltiazem hydrochloride and propranolol hydrochloride, International Journal of Pharmaceutics 253 (2003) 145–157
2. Kelly H.M., Deasy P.B., Ziaka E., Claffey N. Formulation and preliminary in vivo dog studies of a novel drug delivery system for the treatment of periodontitis, International Journal of Pharmaceutics 274 (2004) 167–183
3. Advanced Nanostructured Surfaces for Control of Biofouling, www.ambio.bham.ac.uk
4. Qu, F., Zhu, G., Lin, H., Zhang, W., Sun, J., and Qiu, S., A controlled release of ibuprofen by systematically tailoring the morphology of mesoporous silica materials, Journal of Solid State Chemistry 179 (2006) 2027-2035
5. Uhrich, K.E., Cannizzaro, S.M., Langer, R.S., and Shakesheff, K.M., Chem. Rev. 99 (1999) 3181.
6. Qiu, X.P., Leporatti, S., Donath, E., H. Mohwald, and Langmuir 17 (2001) 5375.
7. Borquist, P., Korner, A., Piculell, L., Larsson, A., and Axelsson, A., A model for the drug release from a polymer matrix tablet – effects of swelling and dissolution, Journal of Controlled Release 113 (2006) 216-225
8. Langer, R., and Peppas, N.A., Chemical and physical structure of polymers as carriers for controlled release of bioactive agents: A review, J. Macromol. Sci., Rev. Macromol. Chem. C23 (1) (1983) 61–126.
9. Narasimhan, B., Mallapragada, S.K., and Peppas, N.A., in: E. Mathiowitz (Ed.), Encyclopedia of Controlled Drug Delivery, John Wiley and Sons, New York, 1999, pp. 921–935
10. Langer, R., Polymeric delivery systems for controlled drug release, Chem. Eng. Commun. 6 (1980) 1–48.
11. Higuchi, T., Mechanism of sustained-action medication—theoretical analysis of rate of release of solid drugs dispersed in solid matrices, J. Pharm. Sci. 52 (12) (1963) 1145–1149
12. Higuchi, T., Rate of release of medicaments from ointment bases containing drugs in suspension, J. Pharm. Sci. 50 (10) (1961) 874–875.
13. Gandhi, R., Kaul, C.L., Panchagnula, R., 1999. Extrusion and spheronization in the development of oral controlled-release dosage forms. Pharm. Sci. Technol. Today 2, 160–170.

199
14. Peppas, N.A., Hydrogels in Medicine, CRS Press, Boca Raton, FL, 1986.
15. Alhaique, F., Santucci, E., Carafa, M., Coviello, T., Murtas, E., Riccieri, F.M., and Gellan in sustained release formulations: preparation of gel capsules and release studies, Biomaterials 17 (1996) 1981–1986.
16. Risbud, M.V., and Bhonde, R.R., Polyacrylamide-chitosan hydrogels: in vitro biocompatibility and sustained antibiotic release studies, Drug Deliv. 7 (2000) 69-75.
17. Soppimath, K.S., Aminabhavi, T.M., Dave A.M., Kumbar S.G., and Rudzinski W.E. , Stimulus-responsive smart hydrogels as novel drug delivery systems, Drug Dev. Ind. Pharm. 28 (2002) 957–974.
18. Chen G., and Hoffman, A.S., Graft copolymers that exhibit temperature-induced phase transitions over a wide range of pH, Nature 373 (1995) 49–52.
19. Jeong, B., Bae, Y.H., Lee, D.S., and Kim, S.W., Biodegradable block copolymeras injectable drug-delivery systems, Nature 388 (1997) 860–862.
20. Jeong, B., and Gutowska, A., Lessons from nature: stimuli-responsive polymers and their biomedical applications, Trends Biotechnol. 20 (2002) 305–311.
21. Durand, D., and Hourdet, Synthesis and thermoassociative properties in aqueous solution of graft copolymers containing poly(N-isopropylacrylamide) side chains, Polymer 40 (1999) 4941–4951
22. Lin, H.H., and Cheng, Y.L., In situ thermoreversible gelation of block and star copolymers of poly(ethylene glycol) and poly(N-isopropylacrylamide) of varying architectures, Macromolecules 34 (2001) 3710–3715.
23. Rassing, J., and Attwood, D., Ultrasound velocity and light scattering studies on the polyoxyethylene–polyoxypropylene copolymer Pluronic F127 in aqueous solution, Int. J. Pharm. 13 (1983) 47–55.
24. Fuchs, M., Turchiuli, C., Bohin, M., Cuvelier, M.E., Ordonnaud, C. Peyrat-Maillard, M.N., and Dumoulin, E. Encapsulation of oil in powder using spray drying and fluidised bed agglomeration, Journal of Food Engineering 75 (2006) 27-35
25. Langer, R., 1990. New methods of drug delivery. Science, 24, 1527-1533.
26. Park, K., Shalaby, W. S. W. and Park, H., 1993, Biodegradable hydrogels for drug delivery,Technomic Publishing company Inc., Lancaster, USA.
27. Nitsch, M. J. and Banakar, U. V., 1994. Implantable drug delivery. J. Biomater. Appl.,8, 247-284.
28. Göpferich, A. and Langer, R. S., 1995. Predicting drug release from cylindric polyanhydride matrix discs. Eur. J. Pharmacol., 41, 81-87.

200
29. Baker, R. W. and Lonsdale, H. K., 1974. In Controlled release of biologically active agents (Eds, Tanquary, A. C. and Lacey, R. C.). Plenum Press, New York, pp. 15-71.
30. Baker, R., 1987. Controlled release of biologically active agents, Wiley Interscience Publications, New York.
31. Langer, R., 1980. Polymeric delivery systems for controlled drug release. Chem. Eng. Commun., 6, 1-48.
32. Langer, R. S. and Peppas, N. A., 1981. Present and future applications of biomaterials in controlled drug delivery systems. Biomaterials, 2, 201-214.
33. Leong, K. W. and Langer, R., 1987. Polymeric controlled drug delivery. Adv. Drug Del. Rev., 1, 199- 233.
34. Siepmann, J. and Göpferich, A., 2001. Mathematical modeling of bioerodible polymeric drug delivery systems. Adv. Drug. Del. Rev., 48, 229-247.
35. Göpferich, A., 1997. In Handbook of biodegradable polymers (Eds, A., D., Kost, J. and Wiseman, D.) Harwood Academic Publishers, pp. 458-460.
36. Pitt, G., Gratzl, G. L., Kimmel, G. L., Surles, J. and Schindler, A., 1981. Aliphatic polyesters II: The degradation of poly(DL-lactide), poly(ε-caprolactone), and their copolymers in vivo. Biomaterials, 2, 215-220.
37. Tamada, J. A. and Langer, R., 1993. Erosion kinetics of hydrolytically degradable polymers. Proc. Natl. Acad. Sci. USA, 90, 552-556.
38. Grizzi, I., Garreau, H., Li, S. and Vert, M., 1995. Hydrolytic degradation of devices based on poly(DL- lactic acid) size-dependence. Biomaterials, 16, 305-311.
39. Heller, J. 1997. In Handbook of biodegradable polymers (Eds, Domb, A. J., Kost, J. and Wiseman, D. M.). Harwood academic publishers, Amsterdam, The Netherlands, pp. 99-118.
40. Ahola, M., Rich, J., Kortesuo, P., Kiesvaara, J., Seppälä, J. and Yli-Urpo, A., 1999b. In vitro evaluation of biodegradable ε -caprolactone-co-D,L-lactide/silica xerogel composites containing toremifene citrate. Int. J. Pharm., 181, 191-191.
41. Rich, J., Kortesuo, P., Ahola, M., Yli-Urpo, A., Kiesvaara, J. and Seppälä, J., 2000. Effect of the molecular weight of poly(e-caprolactone-co-DL-lactide) on toremifene citrate release from copolymer/silica xerogel composites. Int. J. Pharm., 212, 121-130.
42. Katzhendler, I., Hoffmann, A., Goldberger, A. and Friedman, M., 1997. Modeling of drug release from erodible matrices. J. Pharm. Sci., 86, 110-115.
43. Akbari, H., D'Emanuele, A. and Attwood, D., 1998. Effect of geometry on the erosion characteristics of polyanhydride matrices. Int. J. Pharm., 160, 83-89.
201
44. Hopfenberg, H. B., 1976. In Controlled release polymeric formulations (Eds, Paul, D. R. and Harris, F. N.). ACS Symposium Series 33, Washington, DC, pp. 33-52.
45. Karasulu, H. Y., Ertan, G. and Köse, T., 2000. Modeling of theophylline release from different geometrical erodible tablets. Eur. J. Pharm. Biopharm., 49, 177-182.
46. Urtti, A., 1985. Deliverial and pharmacokinetic aspects of ocular pilocarpine administration. Doctoral Thesis, University of Kuopio, Finland.
47. Ritger, P. and Peppas, N., 1987a. A simple equation for description of solute release. II. Fickian and anomalous release from swellable devices. J. Control. Release, 5, 37-42.
48. Yebra, D.M., Kiil, S., and Dam-Johansen, K., Antifouling technology-past, present and future steps towards efficient and environmentally friendly antifouling coatings, Progress in Organic Coatings 50 (2004) 75-104
49. Callow, M.E., Callow, J.A., Marine biofouling: a sticky problem, Biologist 49 (1) (2002)
50. Wahl, M., Marine epibiosis. I. Fouling: some basic aspects, Marine Ecology progress Series 58 (1989) 175-189
51. Callow, M.E., Fletcher, R.L., Int. Biodeter. Biodeg. 34 (1994) 333-348
52. Abarzua, S., Jakubowsky, S., Mar. Ecol. Prog. Ser. 123 (1995) 301-312
53. Clare, A.S., Rittschof, D., Gerhart, D.J., Maki, J,S., Invertebrate Reproduction Dev. 22 (1-3) (1992) 67-76
54. Davies, A., NERC News (1995)
55. Bentley, M.G., Clare, A,S., Marine invertebrate chemical signals, Biological Sciences Review 13 (2001) 7-9
56. Karlsson, J., and Eklund, B., New biocide-free antifouling paints are toxic, Marine Pollution Bulletin 49 (2004) 456-464
57. Townsin, R.L., Development in the calculation of rough underwater surface power penalties. Celena 25th anniversary Symposium, Genoa (1987)
58. Liu, D., Maguire, R.J., Lau, Y.l., Pacepavicius, G.J., Okamura, H., Aoyama, I., Transformation of the new antifouling compound Irganol 1051 by phanerochaete chrysosporium, Wat. Res. 31 (1997) 2363-2369
59. Haak, P.W., Antifouling systems, current status and developments. In: The Present Status of TBT-copolymer Antifouling paint. Proceedings of the International Symposium on Antifouling paints for Ocean-going Vessels, The Hague, Feb. 21 (1996)

202
60. Reincke, H., Krinitz, J., Stachel, B., wwww.arge-elbe.de (1999)
61. Edge, M., Allen, N.S., Turner, D., Robinson, J., and Seal, K., The enhanced performance of biocidal additives in paints and coatings, Progress in Organic Coatings 43 (2001) 10-17
62. Woods Hole Oceanographic Institution (WHOI), US Naval Institute, Annapolis, Iselin, COD, 1952
63. Callow, M., Chem. Ind. 5 (1990) 123-127
64. Lunn, I., Antifouling: A brief Introduction to the Origins and Development of the marine antifouling industry, BCA Publications, Thame, UK (1974)
65. Gitlitz, M.H., Journal of Coating Technology 53 (678) (1981) 46-52
66. Kiil, S., Weinell, C.E., Pedersen, M.S., Dam-Johansen, K., Arias-Codolar , S., Journal of Coating Technology 74 (932) (2002)45-54
67. Gerigk, U., Scheider, U., Stewen, U., Prepr. Ext. Abstr. ACS Natl. Meet. 38 (1) (1998) 91-94
68. Champ, M.A., Published in the proceedings of 24th UJNR (US/Japan) Marine Facilities Panel Meeting in Hawai, November 7-8 (2001)
69. Champ, M.A., Sci. Total Envir. 258 (2000) 21-71
70. Abbot, A., Abel, P.D., Arnold, D.W., Milne, A., Sci. Total Envir. 258 (2000) 5-19
71. De Mora, S.J., Tributyltin: Case study of an environmental contaminant. Cambridge University Press, Cambridge (1996)
72. Thomas, K.V., The environmental behaviour of antifouling paint booster biocides: a review, Biofouling 17 (2001) 73-86
73. Thomas, K.V., McHugh, M., Waldock, M., Antifouling paints booster biocides in UK coastal waters: inputs, occurrence and environmental fate, Science of the Total Environment 293 (1-3) (2002) 117-127
74. Andersson, S., Kaustsky, L., Copper effects on reproductive stages of Baltic Sea Fucus vesiculosus, Marine Biology 125 (1996) 171-176
75. Andersson, S., The influence of salinity and antifouling agents on Baltic Sea Fucus vesiculosus with emphasis on reproduction, PhD thesis in Marine Ecotoxicology, Stockholm University, Sweden (1996)
76. Christen, K., IMO will ban the use of a popular biocide, Environ. Sci. Technol. 33 (1999) A11
77. Gillatt, J., Polym. Paint Colour J., 12 (1993) 183

203
78. Seidel, U., Koch, M., Brunner, E., Staudte, B., and Pfeifer, H., NMR and IR studies on the adsorption of methane and trimethylgallium on zeolite HY, Microporous and Mesoporous Materials 35-36 (2000) 341-347
79. Celis, R., Hermosin, M.C., Carrizosa, M.J., Cornejo, J., Inorganic and organic clays as carriers for controlled release of the herbicide hexazinone, J Agric. Food Chem. 50 (8) (Apr10 2002) 2324-2330
80. Polubesova, T., Nir, S., Rabinivitz, O., Borisover, M., Rubin, B., Sulfentrazone adsorbed on micelle-montmorillonite complexes for slow release in soil, J Agric. Food Chem. 51 (11) (May21 200) 3410-3414
81. Undabeytia, T., Mishael, Y.G., Nir, S., Papahadjopoulos-Sternberg, B., Rubin, B, Morillo, E., Maqueda, C., A novel system for reducing leaching from formulations of anionic herbicides: clay-liposomes, Envron. Sci Technol. 37 (19) (Oct 1 2003) 4475-4480
82. Ambrogi, V., Fardella, G., Grandolini, G., Perioli, L., Tiralti, M.C., Intercalation compounds of hydrotalcite-like anionic clays with ant-inflammatory agents, II: Uptake of Diclofenac for a controlled release formulation, AAPS PharmSciTech 3 (3), article 26 (2002)
83. R.K. Iler, The Chemistry of Silica, Wiley, New York, 1979.
84. L.T. Zhuravlev, Pure Appl. Chem. 61 (1989) 1969.
85. L.T. Zhuravlev, Langmuir 3 (1987) 316.
86. M. Edge a,∗ , N.S. Allen a , D. Turner a , J. Robinson a , Ken Seal b., The enhanced performance of biocidal additives in paints and coatings, Progress in Organic Coatings 43 (2001) 10–17.
87. Seville JPK, Tűzűn U and Clift R, Processing of Particulate solids, Powder Technology Series, Blakcie Academic and Professional, London, 1997, Chapter 1, pages 1 to 52.
88. Malvern Instruments Ltd, innovative solutions in materials characterisation, Process solutions, Technology focus, laser diffraction technology focus, accessed 10th January 2006, http://www.malvern.co.uk/ProcessEng/systems/laser_diffraction/technology/technology.htm
89. Arner, E.,C., Pratta, M.A., Freimark, B., Lischwe, M., Trzaskos, J.M., Magolda, R.L., Wright, S.W., Isothiazolinones interfere with normal metrix metalloproteinase activation and inhibit cartillage proteoglycan degradation, Biochem. J. (1996) 319, 417-424
90. http://www.chem.vt.edu/chem-ed/spec/beerslaw.html (accessed 17th July 2007)

204
91. http://www.cem.msu.edu/resch/VirtualText/Spectrpy/UV-Vis/spectrum.htm (accessed 4th April 2007)
92. Grim, R.E., Clay Mineralogy Second Edition, Chapter 4, pages 51 to 125, Mcgraw-Hill Book Company, America, 1968
93. US Geology Survey – US Department of the Interior, maintained by Eastern Publications Group, last modified 10th October 2001, assessed 7th December 2995, http://pubs.usgs.gov/of01-041/htmldocs/clays, modified from Grim, 1962
94. Price, R., Gaber, B.P., and Lvov, Y., In-vitro characteristics of tetracycline HCL, khelin and nicotinamide adenine dinucleotide from halloysite; a cylindrical mineral, Microencapsulation, 2002, vol 18 (6) 713-722
95. Bates, T.F., Hildebrand, F.A., and Swinford, A., Morphology and structure of endellite and halloysite, American Mineralogist, 1950 (35) 463-484
96. Giles, C.H., Smith, D., A general Treatment and Classification of the Solute Adorption Isotherm, I. Theoretical, Journal of Colloid and Interface Science, Vol. 47, No. 3, June 1974
97. Giles, C.H., D’silva, A.P., Easton, I.A., A general Treatment and Classification of the Solute Adorption Isotherm, Part II. Experimental Interpretation, Journal of Colloid and Interface Science, Vol. 47, No. 3, June 1974
98. http://microvet.arizona.edu/courses/Mic205/exams/05exams/06-14_BacteriaGrowth_1.jpg, accessed 7th March 2008
99. Apple Developer connection, Device-Independent Color Spaces, accessed 10th May 2006, http://developer.apple.com/documentation/GraphicsImaging/Conceptual/csintro/csintro_colorspace/chapter_3_section_5.html.
100. Technidyne corporation, technical information, optical properties, L*a*b* poster, accessed 11th May 2006 http://www.technidyne.com/frameset.htm?Physical.HTM
101. www.coleparmer.ca/techinfo/techinfo.asp?htmlf, accessed 15th June 2010
102. Donga, Y., Feng, S.S., Poly(D,L-lactide-co-glycolide)/montmorillonite nanoparticles for oral delivery of an anticancer drug, Biomaterials 26 (2005) 6068-6076

205
APPENDICES 11 Appendices

206

207

208

209

210

211
APPENDIX 3
3.A Complete Particle Size Distribution (PSD) of platy, tubular and amorphous minerals
carplex suprex Infilm 939 Halloysite NPD-16A MCBP
10 2.91 1.36 1.64 0.62 1.66 0.90
20 3.74 2.16 2.83 0.95 2.60 1.22
30 4.46 3.15 4.27 1.42 3.56 1.56
50 5.93 6.51 8.71 4.34 5.94 2.50
70 7.69 13.30 16.22 10.46 10.00 4.60
80 8.95 18.81 21.64 14.87 13.80 6.93
90 11.10 28.04 29.89 22.14 21.41 11.67
98 16.21 47.51 46.11 39.08 40.07 25.15
7.722 4.192 19.306 1.060 6.628 1.953
1.763 1.085 0.282 4.721 0.990 4.151
st1 0.411 0.794 0.769 0.880 0.683 0.702
d70/d30 1.724 4.229 3.800 7.391 2.806 2.958
-1um 0.1 6.0 4.9 22.8 4.2 14.6
-2um 3.4 21.1 15.2 39.9 16.0 46.5

212

213
3.C: Complete PSD of irregular shape minerals
T-38 Celtix
10 5.82 3.40
20 9.67 5.93
30 12.31 8.16
50 16.65 12.56
70 21.46 17.95
80 24.89 21.93
90 30.19 29.19
98 41.07 49.80
19.306 16.571
0.664 0.551
st1 0.440 0.574
d70/d30 1.744 2.199
-1um 0.7 1.5
-2um 3.0 5.8

214

215

216

217

218
APPENDIX 5
5.A: Paints stain resistance data (for both stained and unstained paint films)
Parameters:
Target Status: CRBELL
Color Mode L*a*b*
Observer 10°
Primary Illuminant D65
Sample# Name Status Ry
TARGET Supreme stained
SCE/100 86.19 100
1 Supreme unstained
SCE/100 86.19
2 Carplex stained
SCE/100 85.89 99.3292
3 Carplex unstained
SCE/100 86.47
4 MCBP stained
SCE/100 85.89 99.6288
5 MCBP unstained
SCE/100 86.21

219
5.B: Paint opacity measurement data (5 measurements per minerals)
Parameters:Target Status: CRBELLColor Mode L*a*b*
Observer 10°Primary Illuminant D65
Sample# Name Status RyTARGET sup/1 Supreme
SCE/100 82.131 /2
SCE/100 82.052 /3
SCE/100 82.33 /4
SCE/100 82.794 /5
SCE/100 82.766 car/1 Carplex
SCE/100 81.197 /2
SCE/100 82.358 c/3
SCE/100 82.149 c/4
SCE/100 8210 c/5
SCE/100 76.1114 m/1 MCBP
SCE/100 83.3315 m/2
SCE/100 83.7316 m/3
SCE/100 83.3417 m/4
SCE/100 83.6818 m/5
SCE/100 83.4

220

221

222

Conferences Attended and Papers Published
12 Conferences Attended and Papers Published

224
• PARTEC conference in March 2007, Nuremberg, Germany (oral presentation, and a paper published as part of the conference proceedings)
• Mining Engineering conference in 2007 at Imperial College (Abstract)
• Particle Technology conference in Orlando, USA, in May 2008 (oral presentation, and an extended abstract produced as part of the conference proceedings)
• Yearly Engineering Doctorate conferences at Birmingham University (April 2006-2008, oral presentations)