cooperative extension agricultural issues center … · cooperative extension agricultural issues...
TRANSCRIPT
UNIVERSITY OF CALIFORNIA AGRICULTURE AND NATURAL RESOURCESCOOPERATIVE EXTENSION
AGRICULTURAL ISSUES CENTERUC DAVIS DEPARTMENT OF AGRICULTURAL AND RESOURCE ECONOMICS
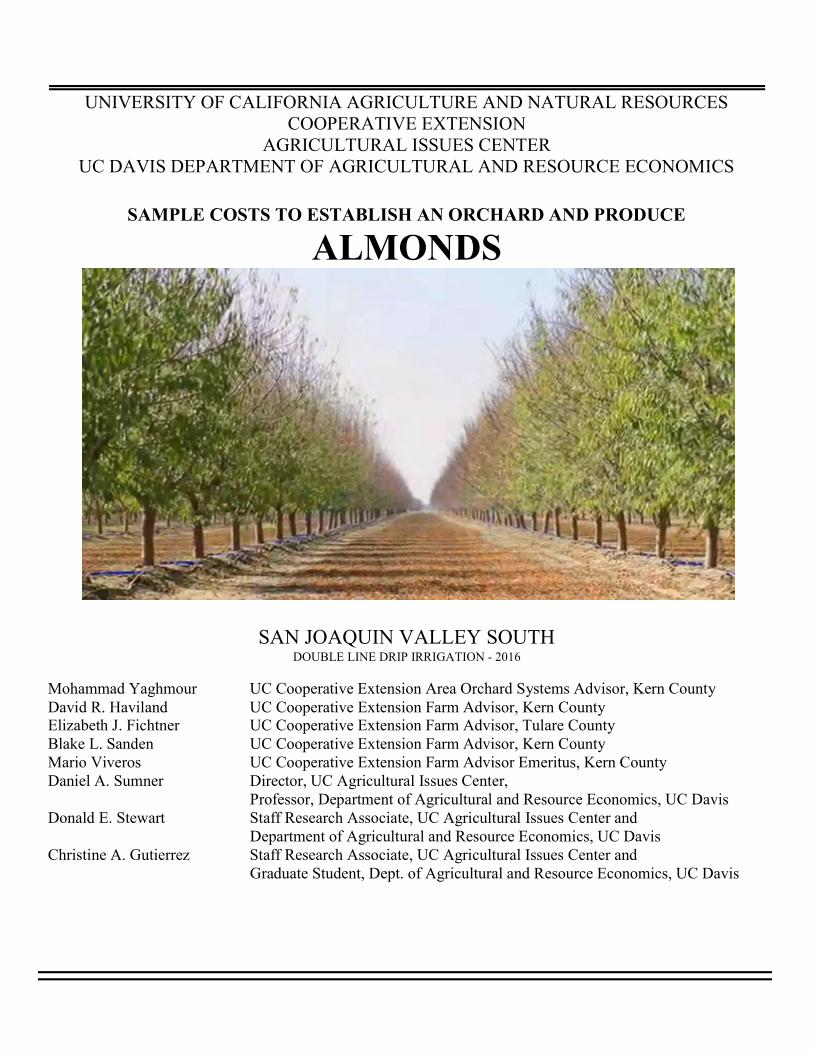
SAMPLE COSTS TO ESTABLISH AN ORCHARD AND PRODUCE
ALMONDS
SAN JOAQUIN VALLEY SOUTH DOUBLE LINE DRIP IRRIGATION - 2016
Mohammad Yaghmour UC Cooperative Extension Area Orchard Systems Advisor, Kern County David R. Haviland UC Cooperative Extension Farm Advisor, Kern County Elizabeth J. Fichtner UC Cooperative Extension Farm Advisor, Tulare County Blake L. Sanden UC Cooperative Extension Farm Advisor, Kern County Mario Viveros UC Cooperative Extension Farm Advisor Emeritus, Kern County Daniel A. Sumner Director, UC Agricultural Issues Center,
Professor, Department of Agricultural and Resource Economics, UC Davis Donald E. Stewart Staff Research Associate, UC Agricultural Issues Center and
Department of Agricultural and Resource Economics, UC Davis Christine A. Gutierrez Staff Research Associate, UC Agricultural Issues Center and
Graduate Student, Dept. of Agricultural and Resource Economics, UC Davis
UC AGRICULTURE AND NATURAL RESOURCESCOOPERATIVE EXTENSION
AGRICULTURAL ISSUES CENTERUC DAVIS DEPARTMENT OF AGRICULTURAL AND RESOURCE ECONOMICS
SAMPLE COST TO ESTABLISH AN ORCHARD AND PRODUCE ALMONDS San Joaquin Valley South - 2016
CONTENTS INTRODUCTION 2ASSUMPTIONS 3Establishment Cultural Practices and Material Inputs 3Production Cultural Practices and Material Inputs 7Labor, Equipment and Interest 9Cash Overhead 10Non-Cash Overhead 11REFERENCES 13Table 1. COSTS PER ACRE TO ESTABLISH AN ALMOND ORCHARD 14Table 2. COSTS PER ACRE TO PRODUCE ALMONDS 16Table 3. COSTS AND RETURNS PER ACRE TO PRODUCE ALMONDS 18Table 4. MONTHLY CASH COSTS – ALMONDS 20Table 5. RANGING ANALYSIS 21Table 6. WHOLE FARM EQUIPMENT, INVESTMENT, & BUSINESS OVERHEAD 22Table 7. HOURLY EQUIPMENT COSTS 23Table 8. OPERATIONS WITH EQUIPMENT & MATERIALS 24
Acknowledgements. Appreciation is expressed to the UC Cooperative Extension, growers, packers, input suppliers, and other industry representatives who provided information, assistance, and expertise for this study.
INTRODUCTION
Sample costs to establish an almond orchard and produce almonds under double-line drip irrigation in the southern San Joaquin Valley are presented in this study. This study is intended as a guide only. It can be used to guide production decisions, estimate potential returns, prepare budgets and evaluate production loans. Sample costs given for labor, materials, equipment and contract services are based on mid-2016 figures. Practices described are based on production practices considered typical for the crop and area, but will not apply to every situation. A blank column titled Your Costs is provided in Tables 1 and 2 to enter your estimated costs.
For an explanation of calculations used in the study refer to the section titled Assumptions. For more information contact Christine Gutierrez; University of California Agriculture and Natural Resources, Agricultural Issues Center, Department of Agricultural and Resource Economics, at 530-752-1520 or [email protected]. The local extension office can be contacted at 661-868-6200 (Kern County) or 559-684-3300 (Tulare County).
Sample Cost of Production studies for many commodities are available and can be downloaded from the website, http://coststudies.ucdavis.edu. Archived studies are also available on the website.
The University is an affirmative action/equal opportunity employer.
2016 Almonds Costs & Returns Study San Joaquin Valley - South UCCE, UC-AIC, UC DAVIS-ARE 2
ASSUMPTIONS
The assumptions refer to Tables 1 to 8 and pertain to sample costs to establish an almond orchard and produce almonds under double-line drip irrigation in the southern San Joaquin Valley. Cultural practices and costs for almond production vary considerably among growers within the region; therefore, many of the costs, practices, and materials in this study will not be applicable to every farm. The practices and inputs used in this cost study serve as a guide only. The use of trade names and cultural practices in this report does not constitute an endorsement or recommendation by the University of California nor is any criticism implied by omission of other similar products or cultural practices.
Land. The hypothetical farm consists of 105 contiguous acres farmed by the owner. Almonds are being established on 100 acres. Roads, a water reservoir, shop buildings and equipment storage occupy an additional five acres. Smaller farms acres may be subject to minimum charges for custom farming services and non-contiguous parcels may have additional costs for travel time and equipment re-calibration.
Establishment Cultural Practices and Material Inputs
Site Preparation. This 100-acre orchard is established on land previously planted to an orchard. The land is assumed to be well drained and either a class I or II soil. The existing well, main lines and sub-main lines stay in place, while the lateral lines and emitters are removed and replaced as part of the new above-ground double line drip irrigation system.
Orchard Removal. Fifty percent of the cost to remove the old orchard is charged to this crop. A custom operator uses a dozer to push over the trees. A front-end loader with a clamp grabs the trees and hauls them to the horizontal grinder to mulch the wood. The chips are pushed to the edge of the orchard. The tree-row is ripped 3 to 4-feet deep to break up underlying hardpan and pull up any remaining old roots. The orchard site is disked and rolled twice to break up clods, fumigated in the fall and then left unattended over the winter. A custom operator fumigates the tree-row area with Chloropicrin and Telone® C35. Fall operations that prepare the orchard for planting are done the year prior to planting; however, the costs are reflected in the first establishment year.
Land Preparation. Prior to planting in January, a custom operator using GPS makes berms and marks the planting sites. Composite soil samples from the various depths, soil types and soil layers are taken at that time to determine major salinity (sodium, chloride, boron) concerns. In this study, the grower collects two soil samples at three different depths per 50 acres. An appropriate soil amendment and leaching requirements can then be determined. The irrigation system is installed and the row middles are floated/smoothed.
Trees. No specific almond variety is planted in this study, but cultural practices are based on mid-season varieties. Almond orchards will include a self-compatible cultivar or two or more varieties in which pollen shedding and bloom periods overlap to insure good pollination. Cultivars that may be planted in this region include mid-blooming Nonpareil and Monterey. Planting densities may range from 75 to 180 trees per acre. In the high-density or closer plantings, more intensive management may be needed to prevent excessive insect and disease problems. In this study, 124 trees per acre are planted on a 16’ X 22’ spacing (tree x row). The life of the orchard at the time of planting is estimated to be 23 years. Contact the local UCCE advisor or a commercial nursery for varieties and rootstocks that are available.
Planting. In this study, potted trees are planted and staked by hand, resulting in higher planting costs. A commercial planting crew plants and trims the trees, places a tree guard or carton around the trunk and applies 3-5 gallons of water to each tree. The tree guard protects against above ground rodents, herbicide sprays, and sunburn.
2016 Almonds Costs & Returns Study San Joaquin Valley - South UCCE, UC-AIC, UC DAVIS-ARE 3

Train/Prune. Training, including suckering and light trimming for shape, is done in February or March during the first three years. Prunings in the first two years are placed in the row middles and shredded with the regular mowing. The young trees are pruned late to avoid bacterial canker. In the fourth and following years, pruning is done in November or December removing limbs for equipment access and safety. Starting in the third year, the prunings are stacked in the row middles and shredded by a custom operator. Tree tying is done late (November/December) in the second year and again early (January/February) in the fourth year. The tie (small rope) is made around the tree about one-third of the way from the top of the tree. In the fourth year there are two ties per tree.
Fertilizer. Fertilizer rates shown in Table A below reflect typical nutrient requirements, but do not take into account soil and water nutrients. In the first and second year, N is applied monthly from April to August through the irrigation system using CAN-17® for the first two applications (50 percent of the nitrogen budget) and UAN 32 thereafter. In year three and the following years, UAN 32 is applied monthly from March – July. Half of the potassium allotment (as K2O equivalent) is banded along the tree row in December or January in all years using potassium sulfate (K2SO4). The remainder is fertigated with the nitrogen applications using potassium thiosulfate (KTS). Phosphorous (P2O5 equivalent) is fertigated as urea ammonium phosphate (10-34-0) in February, April and June.
Table A. Applied Fertilizer (lbs./acre) Table B. Total Applied Water Table C. Annual Yields/Acre
Year N K2O P2O5 Year Acre Inches/Year (*) Year Kernel (meat) Lbs.
1 15 30 30 1 5 3 600
2 30 30 30 2 16 4 1200
3 60 30 30 3 26 5 2400
4 100 50 30 4 47 6 2600
5 180 100 30 P 52 7 2800 P 200+ 200+ 40 * Includes in-season rainfall. Add 3 P 3000
to 10 ac. in/year, depending on irrigation water quality for leaching salts below 4 foot depth.
Sampling. Beginning in the third year, leaf samples are taken 40 days after bloom (early April) and again in July for nutrient analysis and the fertilizers are applied according to analytical recommendations. Leaf samples in this study are calculated at five per 100 acres. The samples are collected by the PCA and the cost is for the lab analysis. Hull samples for boron analysis are taken immediately prior to harvest at a rate of two samples per 100 acres. Many orchards on the east side of the San Joaquin Valley are boron deficient and an application of boron may be required.
In addition, soil samples are taken every other year. Samples are taken at a rate of four samples per 100 acres to determine salinity, pH and nutrient levels. The samples are taken at three depths (0-1ft, 1-3ft and 3-5ft), to allow for a complete soil profile, from multiple areas in the orchard with specified depths pooled for analysis. The grower uses an ATV to collect the samples, which is assumed to take one hour.
Fall Defoliation. Beginning in the 3rd year, zinc chelate (10 percent) is applied at a rate of 1 quart per acre in mid-November to defoliate the trees to reduce the amount of rust and shot hole inoculum. This practice allows for early pruning and also serves as secondary control for some diseases.
Irrigation. Water is pumped from a well to a reservoir (common in Kern county) and then through a filtration system into the above ground double line sprinkler system. The double line irrigation system and micro-sprinkler system are the prevalent systems in the region. A double line irrigation system reduces evaporation losses compared to micro sprinklers and; therefore, provides some water savings. Fertilizer use efficiency may also benefit from this more targeted application to the tree roots. This economic study assumes 100 percent application
2016 Almonds Costs & Returns Study San Joaquin Valley - South UCCE, UC-AIC, UC DAVIS-ARE 4
efficiency for all years. Water costs will vary considerably depending upon the irrigation district and, when pumped, upon the pumping level, energy costs and type of irrigation system. Water costs may also change depending on availability and ground water regulation. This study assumed 100 percent ground water usage and availability. An estimated cost of $22 per acre inch ($264 per acre foot) is used in this study. Irrigation labor is listed as a separate line item.
Water is applied to the orchard approximately once to twice a week from mid-March through mid-October. The amount of water applied each year in this study is shown in Table B. Effective rainfall has not been considered in this study, because it is too variable; therefore, it is assumed that the season begins with a full soil profile following a winter watering for salt leaching (see “Soil Salinity Management” below). This study does not include irrigation costs for frost protection, as protection may not be needed every year and the amount of water applied for protection will vary. An annual water analysis to determine nitrate availability and to maintain regulatory records is included in this study.
Soil Salinity Management. Almond trees are relatively sensitive to sodium, chloride, and boron. If the salt levels within the soil are high, they must be leached from the soil. This process is typically done with either an application of a leaching fraction in-season or applications of water during the dormant season, when evapotranspiration rates are low. In this study, 10 acre inches are added in early January each year to leach salt and to refill the soil profile.
Pollination. A commercial beekeeper sets out one-half hive per acre in the third year, one hive per acre in the fourth and two hives thereafter. The hives are placed in the orchard in early February, prior to bloom. Bee colony strength should be a standard 8 frames per hive and the cost ranges from $150-$225 per hive. For this study, a charge of $200 per hive is assumed.
Pest Management. The pesticides and rates mentioned in this cost study are listed in UC Integrated Pest Management Guidelines, Almonds. For information on other pesticides available, pest identification, monitoring, and management visit the UC IPM website at www.ipm.ucdavis.edu. Pesticides mentioned in this study are not recommendations, but those commonly used in the region. For information regarding pesticide use permits, contact the local county agricultural commissioner's office. Pesticides with different active ingredients, mode of action, and sites of action should be rotated as needed to combat species shift and resistance. Adjuvants are recommended for use with many pesticides for effective control, but the adjuvants and their costs are not included in this study.
Pest Control Advisor (PCA). Written recommendations are required for many pesticides and are available from licensed pest control advisors. The PCA will monitor the field for agronomic problems including irrigation and nutrition. Growers may hire a private PCA or receive the service as part of a service agreement with an agricultural chemical and fertilizer company. For this study, the PCA charge is $20 per acre during the establishment years and $35 per acre during the production years.
Application Methods. Pesticide and fertilizer applications are made by either chemigation (pesticides and/or fertilizers applied through the irrigation water), by ATV mounted ground or spot sprayer or foliar-broadcast by tractor pulled air-blast sprayer. Check individual pesticide labels for compatibility, mixing and usage.
Bees: Bees are sensitive to pesticides and timing of applications must coordinate with bee pollinating activity. See the individual pesticide labels, environmental hazards section, for these requirements in the following publication: Oregon State University, “How to Reduce Bee Poisonings from Pesticides”: https://catalog.extension.oregonstate.edu/pnw591
2016 Almonds Costs & Returns Study San Joaquin Valley - South UCCE, UC-AIC, UC DAVIS-ARE 5
Weeds. In the first year, Gramoxone® and Prowl® are applied to the tree row (strip spray) in February soon after planting. In the second year, a pre-emergent herbicide (Chateau®) is applied to the tree row during the dormant season (early January) and a delayed dormant spot spray of Gramoxone® is applied in late January. Beginning in the third year, a dormant strip spray of Matrix® and Gramoxone® is applied to the tree row in the fall (November). Each year, the row middles are mowed in March and August (before harvest) plus a chemical mow using Roundup® in April.
Insects. Each year in May, mites are controlled with an Agri-Mek® (20fl oz. /acre) and 415 oil application (1 gal/acre). Treatment for peach twig borer includes a dormant spray of Asana® in December of the first and second year. Starting in the 3rd year, a second miticide application is made at hull-split (July) using Zeal®
(3oz/acre). Beginning in the third year, ant bait (Clinch®, 1lb/acre) is broadcast for ant control in July. Also starting in the third year, the trees are treated for navel orangeworm (NOW) with Intrepid® (1pt/acre) at hull split (late June), followed by a second spray in mid-July using Altacor® (4fl oz./acre). Additional insecticide sprays for leaf-footed bug, stink bug and San Jose scale may be necessary in some areas, but this cost is not included in this study.
Disease. Treatment for rust starts in the first year and continues thereafter. The trees are treated with an application of Quash® in March (3.5fl oz. /acre). Wettable sulfur may be added to increase fungicide efficacy, but is not included in this study. The following list of applications commences in the 3rd year: Scab is treated with a delayed dormant liquid copper spray (2fl oz./acre) in January followed by a second spray around five weeks after petal fall (late March to April) using Bravo WeatherStik® (4pt/acre). An application of Vangard®WG (10oz/acre) is made at late bloom (late February) for brown rot. Around two weeks after petal fall (Mid-March), Pristine®
(14.5fl oz. /acre) is applied to the trees for shot hole. As treatment for alternaria, this study uses an application of Luna® Sensation in May (7.6 fl. oz. /acre) and Ph-D® WDG in June (6.2 oz./acre). Finally, to prevent hull rot, an application of Quash® (3.5oz/acre) is made at hull-split (late June).
Vertebrate Pest. Poison bait is applied in the spring (March) by a mechanical applicator for gopher control. Ground squirrels are controlled by the use of anti-coagulant baits with above ground bait stations in the spring. Late winter fumigation for squirrels can be done when soil moisture is adequate; this cost is not included in this study.
Winter Sanitation. Winter sanitation destroys overwintering sites for navel orangeworm and should be done before bud swell. In January of the third year, the trees are hand poled by a custom operator. Starting in the fourth year and subsequent years, the mummy nuts are shaken from the trees and swept into the row middles by a custom operator. After the mechanical shaking, a crew hand poles the remaining mummy nuts off the trees. The mummy nuts are shredded by the grower using a flail mower.
Harvest. Mechanical harvesting and pickup by the grower begins in the third year. The nuts are removed from the trees by shaking, followed by a custom labor crew that hand poles the remaining nuts from the trees. Next, the nuts are swept into windrows by a sweeping machine. The grower provides hand labor to rake any missed nuts into the windrows. Next, a harvesting machine picks up the nuts and places them in a nut cart. Once filled, a tractor pulls the nut cart to the edge of the orchard. Using a conveyor, the nuts are loaded into trucks and hauled to the hulling and shelling facility. At the time of this study, the hulling and shelling facility charges for the processing, including the transport of nuts from the orchard to the processing facility. Some growers engage custom operators to conduct the entire harvesting process.
2016 Almonds Costs & Returns Study San Joaquin Valley - South UCCE, UC-AIC, UC DAVIS-ARE 6
Yield/Returns. Almonds begin bearing an economic crop in the third year after planting. Typical annual yields for almonds are measured in meat (kernel) pounds per acre. Yields and returns are further discussed in the section below and estimated yields by year of production are shown in Table C.
Production Cultural Practices and Material Inputs
Pruning. Maintenance hand pruning for safety and equipment access is done in November in this study, but can be done anytime from harvest through the dormant period. Prunings are stacked in the row middles and shredded by a custom operator. Some growers elect to continue tying and roping up until year eight depending on previous training, variety and tree spacing, albeit this cost is not included in this study. Starting in the 8th year, the trees in every other row are trimmed via mechanical hedging (alternating rows each year). Some growers choose to top the trees starting the 18th year.
Fertilization. In the production years, UAN 32 is fertigated monthly from March – July. 10-34-0 is fertigated in February, April and June. K2SO4 is banded along the tree row in the winter in all years (50 percent of the potassium budget) and KTS is applied through the irrigation system with the nitrogen application. Fertilizer rates in this study are typical nutrient requirements, but do not take into account soil and water nutrients.
Zinc Nutrition/Fall Defoliation. Zinc chelate (10 percent) is applied at a rate of 1 quart per acre in mid-November to early December defoliate the tree to reduce the amount of inoculum for rust and shot hole and provide for foliar uptake to prevent zinc deficiency. This also allows for early pruning and provides secondary control for some diseases.
Sampling. Leaf samples are taken in April and July for nutrient analysis and the fertilizers are applied according to analysis recommendations. Leaf samples in this study are calculated at five per 100 acres. Hull samples for boron analysis are taken immediately prior to harvest at a rate of 2 samples per 100 acres. The samples are collected by the PCA and the cost is for the lab analysis.
In addition, soil samples are taken every other year, as such, 50 percent of the cost is reflected. Samples are taken a rate of four samples per 100 acres to determine salinity, pH and nutrient levels. The samples are taken at three depths (0-1ft, 1-3ft and 3-5ft), to allow for a complete soil profile, from multiple areas in the orchard with specified depths pooled for analysis. The grower uses an ATV to collect the samples, which is assumed to take one hour.
Irrigation. Irrigation costs include water pumping and labor costs, with irrigation labor provided as a separate line item. Water is pumped from a well to a reservoir and then through a filtration system into the double line drip system at a cost of $22 per acre inch ($264 per acre foot) for this study. A total of fifty-two acre-inches of water is applied to the orchard based on a 100 percent application efficiency from March to October. An application efficiency/uniformity assumption of 100 percent is often used as the scheduling criteria for most micro systems in the San Joaquin Valley. This assumption includes additional significant water allocations for salinity management. In this study, 10 acre inches are applied in early January to leach salt and refill the soil profile. No assumption is made about effective rainfall, evaporation, and runoff. Cost for frost protection is not included in this study.
Pollination. Two hives (8+ frames/hive) per acre are contracted for pollination and set in the orchard in February by the beekeeper prior to bloom. For this study, $200 per hive is charged.
2016 Almonds Costs & Returns Study San Joaquin Valley - South UCCE, UC-AIC, UC DAVIS-ARE 7
Pest Management. See Pest Management in the previous section.
Weeds. Beginning in the third year, a dormant strip spray of Matrix® and Gramoxone® is applied to the tree row in the fall (November). Each year, the row middles are mowed in March and August (before harvest) plus a chemical mow using Roundup® in April.
Insects. Each year in May, mites are controlled with an Agri-Mek® and 415 oil application with a second miticide application made at hull-split (July) using Zeal®. Ant bait (Clinch®) is broadcast for ant control in July. The trees are treated for navel orangeworm (NOW) with Intrepid® at hull split (late June), followed by a second spray in mid-July using Altacor®.
Disease. The trees are treated for rust with an application of Quash® in March. Scab is treated with a delayed dormant copper spray in January followed by a second spray around five weeks after petal fall (late March to April) using Bravo WeatherStik®. An application of Vangard®WG is made at late bloom (late February) for brown rot. Around two weeks after petal fall (Mid-March), Pristine® is applied to the trees for shot hole. As treatment for Alternaria, this study uses an application of Luna® Sensation in May and Ph-D® WDG in June. Finally, to prevent hull rot, an application of Quash® is made at hull-split (late June).
Vertebrate Pest. Poison bait is applied in the spring (March) by a mechanical applicator for gopher control. Ground squirrels are controlled by the use of anti-coagulant baits with above ground bait stations in the spring. Late winter fumigation for squirrels can be done when soil moisture is adequate; this cost is not included in this study.
Winter Sanitation. Winter sanitation destroys over wintering sites for navel orangeworm and should be done before bud swell. In this study, winter sanitation is completed in January. The mummy nuts are shaken from the trees and swept into the row middles. The remaining mummy nuts are hand poled off the trees at a cost of $200 per acre. All mummy nuts are shredded with a flail mower. Winter sanitation operations except for the shredding are custom hired.
Harvest. In this study, the grower mechanically harvests the almond crop. The grower shakes the nuts from the trees. A custom labor crew hand poles the remaining nuts from the tree. The grower sweeps the nuts into a windrow and provides hand labor to rake any missed nuts into the windrow. A pick-up machine picks up the nuts and places them into a nut cart, which is then pulled to the edge of the orchard. The nuts are loaded and hauled to the huller/sheller for processing. Harvest begins in August for the early maturing varieties and continues into October for late maturing varieties.
Yields. Typical annual yields for almonds are measured in meat (kernel) pounds per acre and are shown in Table C. Yields will vary by location, grower, year, and age of orchard. For this study, it is assumed the orchard will average 3,000 pounds per acre over the production years of the orchard. A ranging analysis provided in Table 5 shows returns at yields ranging from 2,000lbs/acre to 3,900lbs/acre.
Returns. An estimated price of a $2.25 per meat pound is assumed based on reported current returns. Prices will vary depending on market condition, almond variety and quality, among other factors. Table 5 has a range of prices used for calculating returns per acre at different yields, with prices ranging from $1.00 to $4.00.
Almond Hulls and By-Products. Almond by-products include hulls, shells, almond hash, huller dust, and press cakes, which all can be used as livestock feed. Wood from tree removal used for firewood or for composting could be another source of income. These potential sources of income are not included in this study.
2016 Almonds Costs & Returns Study San Joaquin Valley - South UCCE, UC-AIC, UC DAVIS-ARE 8
Assessment. The Almond Board of California (ABC) assesses all almonds commercially grown in the state to pay for almond promotions and research. The mandatory assessment is paid by processors and is not reflected in grower costs.
Pickup/ATV. The study assumes business use mileage of 100 minutes per acre per year for the pickup. The ATV is charged at 50 minutes per acre per year. The ATV is used for spot spraying, pest management and monitoring the orchard/irrigation systems. Each vehicle is shown as a separate line item.
Labor, Equipment, and Interest
Labor. Hourly wages for workers are $16.00 for machine operators and $11.00 per hour non-machine labor. Adding 40 percent for the employer’s share of federal and state payroll taxes, workers compensation insurance, for nut crops (0045) and other possible benefits gives the labor rates shown of $22.40 and $15.40 per hour for machine labor and non-machine labor, respectively. Workers’ compensation costs will vary among growers, but for this study the cost is based upon the average industry final rate as of January 1, 2016. Labor for operations involving machinery are 20 percent higher than the operation time to account for the extra labor involved in equipment set up, moving, maintenance, work breaks, and field repair.
Equipment Operating Costs. Repair costs are based on purchase price, annual hours of use, total hours of life, and repair coefficients formulated by American Society of Agricultural and Biological Engineers (ASABE). Fuel and lubrication costs are also determined by ASABE equations based on maximum power takeoff (PTO) horsepower, and fuel type. Average prices for on-farm delivery of diesel and gasoline based on 2016 data from the Energy Information Administration are $2.84 and $2.76 per gallon, respectively. The cost includes a 9.25 percent sales tax, a $0.13/gal excise tax on diesel fuel, an 8 percent sales tax, and a $0.30/gal excise tax on gasoline. It is noted that federal and state excise taxes are refundable for on-farm use when filing the farm income tax return. The fuel, lube, and repair cost per acre for each operation is determined by multiplying the total hourly operating cost for each piece of equipment used for the selected operation by the hours per acre. Tractor time is 10 percent higher than implement time for a given operation to account for setup, travel and down time.
Interest on Operating Capital. Interest on operating capital is based on cash operating costs and is calculated monthly until harvest at a nominal rate of 4.75 percent per year. Interest charge is the cost of your money that is tied up in the production of a crop. It reflects the amount of money you pay on borrowed money (Line of Credit) or that amount you could have earned had you invested your own resources in alternative uses. The interest cost of post-harvest operations is discounted back to the last harvest month using a negative interest charge. The interest rate will vary depending upon various factors. The rate in this study is considered a typical lending rate by a farm lending agency as of August 2016.
Risk. The risks associated with crop production should not be minimized. While this study makes every effort to model a production system based on typical, real world practices, it cannot fully represent financial, agronomic and market risks, which affect profitability and economic viability of almond production. Because of so many potential risk factors, effective risk management must combine specific tactics in a detailed manner, in various combinations for a sustainable operation. Moreover, Table 5 of this study reflects a ranging analysis of returns based on various assumptions which is therefore hypothetical in nature. It is important to realize that actual results may differ from the returns contained in this study. Any returns above total costs are considered returns on risk and investment to management, (or owners).
2016 Almonds Costs & Returns Study San Joaquin Valley - South UCCE, UC-AIC, UC DAVIS-ARE 9
Cash Overhead Costs
Cash overhead consists of various cash expenses paid out during the year that are assigned to the whole farm and not to a particular operation.
Property Taxes. Counties charge a base property tax rate of 1 percent on the assessed value of the property. In some counties special assessment districts exist and charge additional taxes on property including equipment, buildings, and improvements. For this study, county taxes are calculated as 1 percent of the average value of the property.
Insurance. Insurance for farm investments varies depending on the assets included and the amount of coverage.
Property Insurance. This provides coverage for property loss and is charged at 0.843 percent of the average value of the assets over their useful life.
Liability Insurance. A standard farm liability insurance policy will help cover the expenses for which you become legally obligated to pay for bodily injury claims on your property and damages to another person’s property as a result of a covered accident. Common liability expenses covered under your policy include attorney fees and court costs, medical expenses for people injured on your property, injury or damage to another’s property. In this study, $792 is charged and covers the entire farm.
Crop Insurance. This is available to almond growers for any unavoidable loss of production, damage or poor quality resulting from adverse weather conditions such as cool wet weather, freeze, frost, hail, heat, rain, wind and damage from birds, drought, earthquakes and fire. Coverage levels are from 50-85 percent of the approved average yield as established by verifiable production records from the orchard. Actual insurance coverage is by unit, not by acre. A significant number of growers purchase crop insurance in this region. Due to variability in coverages no level is specified in this study.
Office Expense. Office and business expenses are estimated at $60 per acre. These expenses include office supplies, telephones, bookkeeping, accounting, utilities, and miscellaneous administrative charges.
Environmental/Regulatory Costs. Various environmental fees are collected by the county and state. The fees will vary by county. For example, there are fees assessed by the Air Resources Board (state agency) regulating air pollution, a Water Coalition Fee (local coalition) for water discharges, and a hazardous material storage fee (local coalition). The grower must also provide safety training, safety equipment and maintain training records. For this study, a cost of $10 per acre is assumed.
Sanitation Services. Sanitation services provide trailer mounted, double portable toilets and washbasins for the orchard and cost the farm $200 per month for four months. The cost includes delivery and weekly service.
Management Salaries. The grower farms the orchard; therefore, no salaries are included for management. Returns above costs are considered a return to management.
Investment Repairs. Annual maintenance is calculated as two percent of the purchase price. The average tree replacement cost over the life of the orchard is assumed to be 0.50 percent of the establishment cost or $4,036 (~$40 per acre) per year.
2016 Almonds Costs & Returns Study San Joaquin Valley - South UCCE, UC-AIC, UC DAVIS-ARE 10
Non-Cash Overhead Costs
Non-cash overhead is calculated as the capital recovery cost for equipment and other farm investments.
Capital Recovery Costs. Capital recovery cost is the annual depreciation and interest costs for a capital investment. It is the amount of money required each year to recover the difference between the purchase prices and salvage values (unrecovered capital). It is equivalent to the annual payment on a loan for the investment with the down payment equal to the discounted salvage value. This is a more complex method of calculating ownership costs than straight-line depreciation and opportunity costs, but more accurately represents the annual costs of ownership because it takes the time value of money into account (Boehlje and Eidman). The formula for the calculation of the annual capital recovery costs is ((Purchase Price – Salvage Value) x (Capital Recovery Factor)) + (Salvage Value x Interest Rate).
Salvage Value. Salvage value is an estimate of the remaining value of an investment at the end of its useful life. For farm machinery (tractors and implements) the remaining value is a percentage of the new cost of the investment (Boehlje and Eidman). The percent remaining value is calculated from equations developed by the American Society of Agricultural Engineers (ASAE) based on equipment type and years of life. The life in years is estimated by dividing the wear out life, as given by ASAE by the annual hours of use in this operation. For other investments including irrigation systems, buildings, and miscellaneous equipment, the value at the end of its useful life is zero. The salvage value for land is the purchase price because land does not depreciate. The purchase price and salvage value for equipment and investments are shown in the tables below.
Capital Recovery Factor. Capital recovery factor is the amortization factor or annual payment whose present value at compound interest is 1. The amortization factor is a table value that corresponds to the interest rate used and the life of the machine.
Interest Rate. The interest rate of 3.75 percent is used to calculate capital recovery. The rate will vary depending upon size of loan and other lending agency conditions, but is a suggested rate by a farm lending agency in August 2016.
Irrigation System. The pump and well cost is based on one 125 horsepower pump lifting from a water level depth of 400 feet into a reservoir. The reservoir, the pump and a 1,000-foot deep well already existed on the site. The cost of the irrigation system includes a 40 horsepower pump to pump from the reservoir into the double line drip system, the cost of installation of the lateral lines and emitters.
The life of the irrigation system is estimated to be 25 years. The irrigation system is considered an improvement and is shown in the non-cash overhead sections and the investment portion of the tables. A bi- annual pump test is performed in December or January to monitor pumping level and efficiency (gallons/minute) at a cost of $200 for the test. In this study, the cost of the pump test is applied at a 50 percent rate to the total acreage of the orchard during the production years.
Land. Cropland with irrigation availability previously planted to almonds is valued at $25,000 per acre. Established almond orchards range in value from $30,000 to $40,000 per acre in this region, which varies by irrigation availability, age of trees, average yields, soil quality and various other factors. For this study, the cost of producing acreage of a three year old established orchard is estimated at $33,000 per acre. It is the crop land value plus the Establishment Cost for a three years of an almond orchard in the southern San Joaquin Valley, ($25,000 + ~8,000 = $33,000).
2016 Almonds Costs & Returns Study San Joaquin Valley - South UCCE, UC-AIC, UC DAVIS-ARE 11
Establishment Cost. Establishment cost is the sum of the costs for land preparation, planting, trees, cash overhead and production expenses for growing the trees through the first three years minus any returns from production. Costs to establish the orchard are included in non-cash overhead expenses and capital recovery costs for the production years. For this study, the total accumulated net cash cost for through the third year represents the establishment cost and is estimated at $8,072 per planted acre. The cost is amortized over the remaining 20 years of orchard production to estimate the annual capital recovery cost.
Equipment. Farm equipment is purchased new or used, but the study shows the current purchase price for new equipment. The new purchase price is adjusted to 60 percent to indicate a mix of new and used equipment. Annual ownership costs for equipment and other investments are shown in the Whole Farm Annual Equipment, Investment, and Business Overhead Costs table. Equipment costs are composed of three parts: non-cash overhead, cash overhead, and operating costs. Both of the overhead factors have been discussed in previous sections. The operating costs consist of repairs, fuel, and lubrication and are discussed under operating costs.
Tree Replacement. One or more trees per acre may die each year and are replaced in late winter. Costs in this study are basic costs that will vary with each orchard and type of tree loss. Tree replacement is included in investment repairs under Cash Overhead.
Pole Barn. A 1,500 sf shop and pole barn is used for equipment and tool storage. The building is located on the grower owned land.
Tools. This includes shop tools and equipment, hand tools, and miscellaneous field tools.
Fuel Tanks. Two 500-gallon fuel tanks using gravity feed are on metal stands. The tanks are setup in a cement containment pad that meets federal, state, and county regulations.
Table Values. Due to rounding, the totals may be slightly different from the sum of the components.
2016 Almonds Costs & Returns Study San Joaquin Valley - South UCCE, UC-AIC, UC DAVIS-ARE 12
REFERENCES
American Society of Agricultural and Biological Engineers (ASABE). 2013 ASABE Standards Book with 2015 Standards Supplement. St. Joseph, MI: Curran Associates, Inc., 2015.
Boehlje, Michael D., and Vernon R. Eidman. Farm Management. New York: John Wiley and Sons, 1984.
California Chapter of the American Society of Farm Managers and Rural Appraisers. Trends in Agricultural Land & Lease Values. Woodbridge, CA: American Society of Farm Managers and Rural Appraisers, 2016. http://www.calasfmra.com
"Cost and Return Studies.” University of California Davis Agricultural and Resource Economics. http://coststudies.ucdavis.edu/.
Duncan, Roger A. Brent A. Holtz., David A. Doll, Karen Klonsky, Daniel A. Sumner, Christine A. Gutierrez and Donald Stewart.2016. Sample Cost to Establish an Almond Orchard and Produce Almonds, Northern San Joaquin Valley. University of California Cooperative Extension. Department of Agricultural and Resource Economics. Davis, CA.
"Economic Research Service - Publications." United States Department of Agriculture. www.ers.usda.gov/data-products.aspx.
Freeman, Mark A., Mario A Viveros, Karen M. Klonsky, and Richard L. De Moura. Sample Costs to Establish an Almond Orchard and Produce Almonds, San Joaquin Valley South. 2008. University of California Cooperative Extension. Department of Agricultural and resource Economics. Davis, CA.
“How to Reduce Bee Poisonings from Pesticides.” Oregon State University. https://catalog.extension.oregonstate.edu/pnw591.
"National Agricultural Statistics Service." United States Department of Agriculture. www.nass.usda.gov/Quick_Stats/.
"Tax Rates for Motor Vehicle and Diesel Fuels." California State Board of Equalization. Last modified May 2015. http://www.boe.ca.gov/pdf/l413.pdf.
"UC IPM Pest Management Guidelines- Almond”. University of California Agriculture and Natural Resources Publication 3431. http://ipm.ucanr.edu/PMG/selectnewpest.almonds.html.
“University of California Integrated Pest Management for Almonds.” Second edition. University of California Agriculture and Natural Resources 3308. http://anrcatalog.ucanr.edu/
"U.S. Gasoline and Diesel Retail Prices." U.S. Energy Information Administration (EIA). https://www.eia.gov/dnav/pet/pet_pri_gnd_dcus_nus_m.htm.
"Workers' Compensation Rate Comparison." California Department of Insurance. http://www.insurance.ca.gov/01-consumers/105-type/9-compare-prem/wc-rate/index.cfm
2016 Almonds Costs & Returns Study San Joaquin Valley - South UCCE, UC-AIC, UC DAVIS-ARE 13
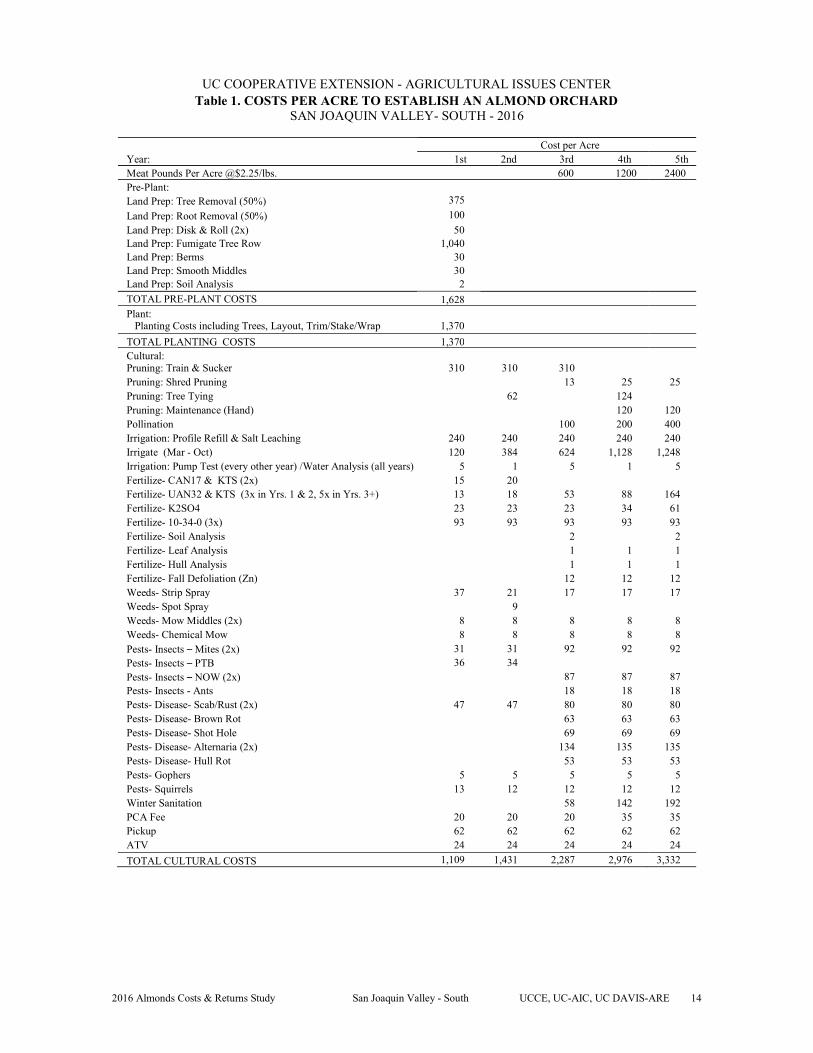
UC COOPERATIVE EXTENSION - AGRICULTURAL ISSUES CENTER Table 1. COSTS PER ACRE TO ESTABLISH AN ALMOND ORCHARD
SAN JOAQUIN VALLEY- SOUTH - 2016
Cost per Acre Year: 1st 2nd 3rd 4th 5th Meat Pounds Per Acre @$2.25/lbs. 600 1200 2400 Pre-Plant: Land Prep: Tree Removal (50%) 375
Land Prep: Root Removal (50%) 100
Land Prep: Disk & Roll (2x) 50 Land Prep: Fumigate Tree Row 1,040 Land Prep: Berms 30 Land Prep: Smooth Middles 30 Land Prep: Soil Analysis 2
TOTAL PRE-PLANT COSTS 1,628 Plant:
Planting Costs including Trees, Layout, Trim/Stake/Wrap 1,370
TOTAL PLANTING COSTS 1,370 Cultural: Pruning: Train & Sucker 310 310 310 Pruning: Shred Pruning 13 25 25 Pruning: Tree Tying 62 124 Pruning: Maintenance (Hand) 120 120 Pollination 100 200 400 Irrigation: Profile Refill & Salt Leaching 240 240 240 240 240 Irrigate (Mar - Oct) 120 384 624 1,128 1,248 Irrigation: Pump Test (every other year) /Water Analysis (all years) 5 1 5 1 5 Fertilize- CAN17 & KTS (2x) 15 20 Fertilize- UAN32 & KTS (3x in Yrs. 1 & 2, 5x in Yrs. 3+) 13 18 53 88 164 Fertilize- K2SO4 23 23 23 34 61 Fertilize- 10-34-0 (3x) 93 93 93 93 93 Fertilize- Soil Analysis 2 2 Fertilize- Leaf Analysis 1 1 1 Fertilize- Hull Analysis 1 1 1 Fertilize- Fall Defoliation (Zn) 12 12 12 Weeds- Strip Spray 37 21 17 17 17 Weeds- Spot Spray 9 Weeds- Mow Middles (2x) 8 8 8 8 8 Weeds- Chemical Mow 8 8 8 8 8 Pests- Insects – Mites (2x) 31 31 92 92 92 Pests- Insects – PTB 36 34 Pests- Insects – NOW (2x) 87 87 87 Pests- Insects - Ants 18 18 18 Pests- Disease- Scab/Rust (2x) 47 47 80 80 80 Pests- Disease- Brown Rot 63 63 63 Pests- Disease- Shot Hole 69 69 69 Pests- Disease- Alternaria (2x) 134 135 135 Pests- Disease- Hull Rot 53 53 53 Pests- Gophers 5 5 5 5 5 Pests- Squirrels 13 12 12 12 12 Winter Sanitation 58 142 192 PCA Fee 20 20 20 35 35 Pickup 62 62 62 62 62 ATV 24 24 24 24 24
TOTAL CULTURAL COSTS 1,109 1,431 2,287 2,976 3,332
2016 Almonds Costs & Returns Study San Joaquin Valley - South UCCE, UC-AIC, UC DAVIS-ARE 14
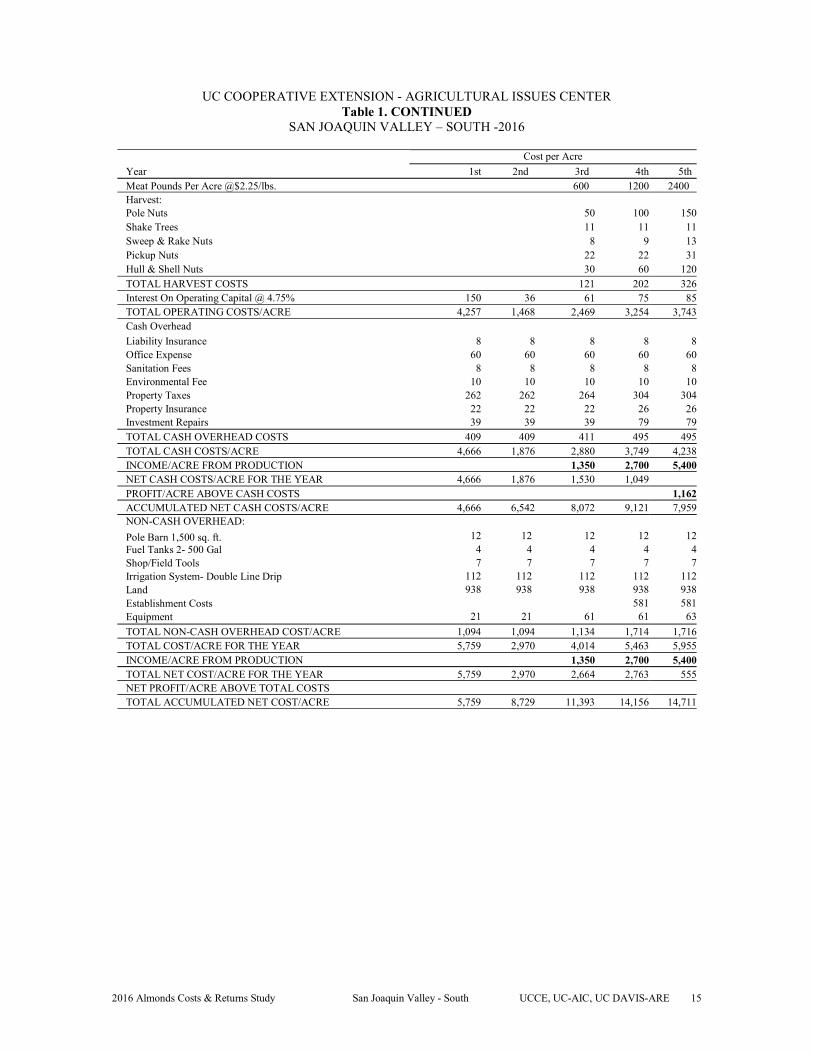
UC COOPERATIVE EXTENSION - AGRICULTURAL ISSUES CENTER Table 1. CONTINUED
SAN JOAQUIN VALLEY – SOUTH -2016
Cost per Acre
Year 1st 2nd 3rd 4th 5th Meat Pounds Per Acre @$2.25/lbs. 600 1200 2400 Harvest: Pole Nuts 50 100 150 Shake Trees 11 11 11 Sweep & Rake Nuts 8 9 13 Pickup Nuts 22 22 31 Hull & Shell Nuts 30 60 120 TOTAL HARVEST COSTS 121 202 326 Interest On Operating Capital @ 4.75% 150 36 61 75 85 TOTAL OPERATING COSTS/ACRE 4,257 1,468 2,469 3,254 3,743 Cash Overhead
Liability Insurance 8 8 8 8 8 Office Expense 60 60 60 60 60 Sanitation Fees 8 8 8 8 8 Environmental Fee 10 10 10 10 10 Property Taxes 262 262 264 304 304 Property Insurance 22 22 22 26 26 Investment Repairs 39 39 39 79 79 TOTAL CASH OVERHEAD COSTS 409 409 411 495 495 TOTAL CASH COSTS/ACRE 4,666 1,876 2,880 3,749 4,238 INCOME/ACRE FROM PRODUCTION 1,350 2,700 5,400 NET CASH COSTS/ACRE FOR THE YEAR 4,666 1,876 1,530 1,049 PROFIT/ACRE ABOVE CASH COSTS 1,162 ACCUMULATED NET CASH COSTS/ACRE 4,666 6,542 8,072 9,121 7,959 NON-CASH OVERHEAD:
Pole Barn 1,500 sq. ft. 12 12 12 12 12 Fuel Tanks 2- 500 Gal 4 4 4 4 4 Shop/Field Tools 7 7 7 7 7 Irrigation System- Double Line Drip 112 112 112 112 112 Land 938 938 938 938 938 Establishment Costs 581 581 Equipment 21 21 61 61 63
TOTAL NON-CASH OVERHEAD COST/ACRE 1,094 1,094 1,134 1,714 1,716 TOTAL COST/ACRE FOR THE YEAR 5,759 2,970 4,014 5,463 5,955 INCOME/ACRE FROM PRODUCTION 1,350 2,700 5,400 TOTAL NET COST/ACRE FOR THE YEAR 5,759 2,970 2,664 2,763 555 NET PROFIT/ACRE ABOVE TOTAL COSTS TOTAL ACCUMULATED NET COST/ACRE 5,759 8,729 11,393 14,156 14,711
2016 Almonds Costs & Returns Study San Joaquin Valley - South UCCE, UC-AIC, UC DAVIS-ARE 15
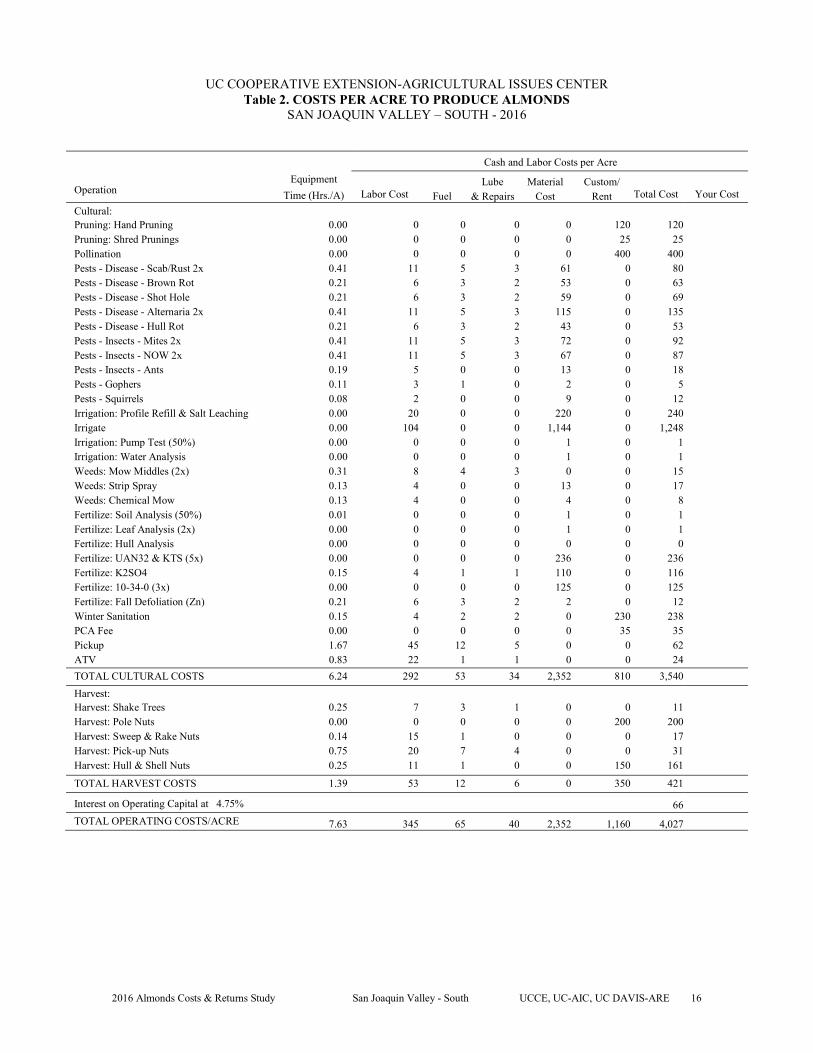
UC COOPERATIVE EXTENSION-AGRICULTURAL ISSUES CENTER Table 2. COSTS PER ACRE TO PRODUCE ALMONDS
SAN JOAQUIN VALLEY – SOUTH - 2016
Cash and Labor Costs per Acre
Operation Equipment
Time (Hrs./A) Labor Cost Fuel Lube
& Repairs Material
Cost Custom/
Rent Total Cost Your Cost
Cultural: Pruning: Hand Pruning 0.00 0 0 0 0 120 120 Pruning: Shred Prunings 0.00 0 0 0 0 25 25 Pollination 0.00 0 0 0 0 400 400 Pests - Disease - Scab/Rust 2x 0.41 11 5 3 61 0 80 Pests - Disease - Brown Rot 0.21 6 3 2 53 0 63 Pests - Disease - Shot Hole 0.21 6 3 2 59 0 69 Pests - Disease - Alternaria 2x 0.41 11 5 3 115 0 135 Pests - Disease - Hull Rot 0.21 6 3 2 43 0 53 Pests - Insects - Mites 2x 0.41 11 5 3 72 0 92 Pests - Insects - NOW 2x 0.41 11 5 3 67 0 87 Pests - Insects - Ants 0.19 5 0 0 13 0 18 Pests - Gophers 0.11 3 1 0 2 0 5 Pests - Squirrels 0.08 2 0 0 9 0 12 Irrigation: Profile Refill & Salt Leaching 0.00 20 0 0 220 0 240 Irrigate 0.00 104 0 0 1,144 0 1,248 Irrigation: Pump Test (50%) 0.00 0 0 0 1 0 1 Irrigation: Water Analysis 0.00 0 0 0 1 0 1 Weeds: Mow Middles (2x) 0.31 8 4 3 0 0 15 Weeds: Strip Spray 0.13 4 0 0 13 0 17 Weeds: Chemical Mow 0.13 4 0 0 4 0 8 Fertilize: Soil Analysis (50%) 0.01 0 0 0 1 0 1 Fertilize: Leaf Analysis (2x) 0.00 0 0 0 1 0 1 Fertilize: Hull Analysis 0.00 0 0 0 0 0 0 Fertilize: UAN32 & KTS (5x) 0.00 0 0 0 236 0 236 Fertilize: K2SO4 0.15 4 1 1 110 0 116 Fertilize: 10-34-0 (3x) 0.00 0 0 0 125 0 125 Fertilize: Fall Defoliation (Zn) 0.21 6 3 2 2 0 12 Winter Sanitation 0.15 4 2 2 0 230 238 PCA Fee 0.00 0 0 0 0 35 35 Pickup 1.67 45 12 5 0 0 62 ATV 0.83 22 1 1 0 0 24
TOTAL CULTURAL COSTS 6.24 292 53 34 2,352 810 3,540
Harvest: Harvest: Shake Trees 0.25 7 3 1 0 0 11 Harvest: Pole Nuts 0.00 0 0 0 0 200 200 Harvest: Sweep & Rake Nuts 0.14 15 1 0 0 0 17 Harvest: Pick-up Nuts 0.75 20 7 4 0 0 31 Harvest: Hull & Shell Nuts 0.25 11 1 0 0 150 161
TOTAL HARVEST COSTS 1.39 53 12 6 0 350 421
Interest on Operating Capital at 4.75% 66
TOTAL OPERATING COSTS/ACRE 7.63 345 65 40 2,352 1,160 4,027
2016 Almonds Costs & Returns Study San Joaquin Valley - South UCCE, UC-AIC, UC DAVIS-ARE 16
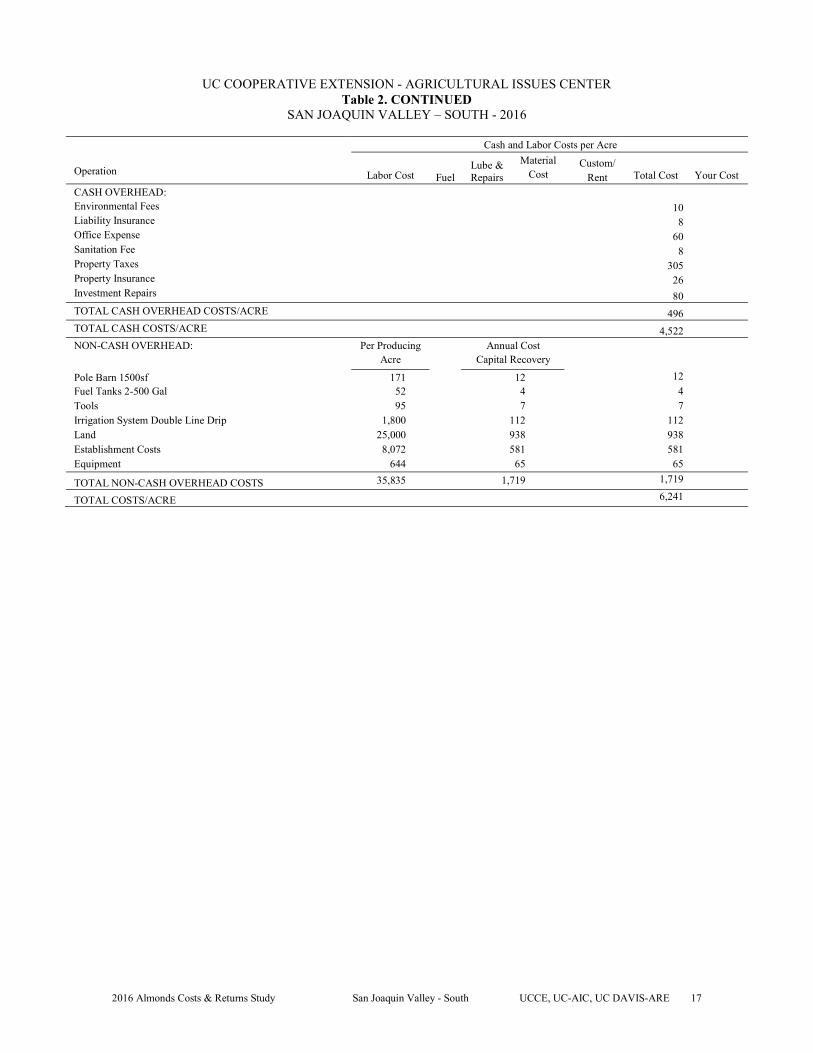
UC COOPERATIVE EXTENSION - AGRICULTURAL ISSUES CENTER Table 2. CONTINUED
SAN JOAQUIN VALLEY – SOUTH - 2016
Cash and Labor Costs per Acre
Operation Labor Cost Fuel Lube & Repairs
Material Cost
Custom/ Rent Total Cost Your Cost
CASH OVERHEAD: Environmental Fees 10 Liability Insurance 8 Office Expense 60 Sanitation Fee 8 Property Taxes 305 Property Insurance 26 Investment Repairs 80 TOTAL CASH OVERHEAD COSTS/ACRE 496 TOTAL CASH COSTS/ACRE 4,522 NON-CASH OVERHEAD: Per Producing Annual Cost
Acre Capital Recovery
Pole Barn 1500sf 171 12 12
Fuel Tanks 2-500 Gal 52 4 4 Tools 95 7 7 Irrigation System Double Line Drip 1,800 112 112 Land 25,000 938 938 Establishment Costs 8,072 581 581 Equipment 644 65 65
TOTAL NON-CASH OVERHEAD COSTS 35,835 1,719 1,719
TOTAL COSTS/ACRE 6,241
2016 Almonds Costs & Returns Study San Joaquin Valley - South UCCE, UC-AIC, UC DAVIS-ARE 17
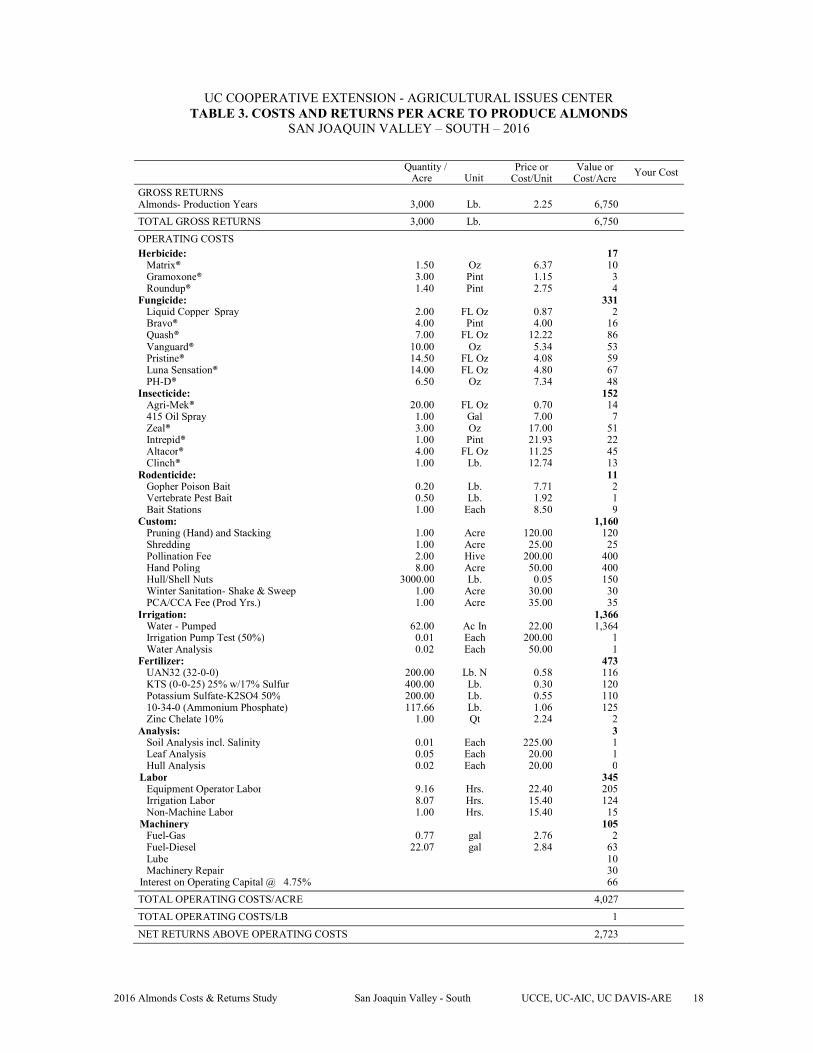
UC COOPERATIVE EXTENSION - AGRICULTURAL ISSUES CENTER TABLE 3. COSTS AND RETURNS PER ACRE TO PRODUCE ALMONDS
SAN JOAQUIN VALLEY – SOUTH – 2016
Quantity / Acre Unit
Price or Cost/Unit
Value or Cost/Acre
Your Cost
GROSS RETURNS Almonds- Production Years 3,000 Lb. 2.25 6,750
TOTAL GROSS RETURNS 3,000 Lb. 6,750
OPERATING COSTS Herbicide: 17
Matrix® 1.50 Oz 6.37 10 Gramoxone® 3.00 Pint 1.15 3 Roundup® 1.40 Pint 2.75 4 Fungicide: 331
Liquid Copper Spray 2.00 FL Oz 0.87 2 Bravo® 4.00 Pint 4.00 16 Quash® 7.00 FL Oz 12.22 86 Vanguard® 10.00 Oz 5.34 53 Pristine® 14.50 FL Oz 4.08 59 Luna Sensation® 14.00 FL Oz 4.80 67 PH-D® 6.50 Oz 7.34 48 Insecticide: 152
Agri-Mek® 20.00 FL Oz 0.70 14 415 Oil Spray 1.00 Gal 7.00 7 Zeal® 3.00 Oz 17.00 51 Intrepid® 1.00 Pint 21.93 22 Altacor® 4.00 FL Oz 11.25 45 Clinch® 1.00 Lb. 12.74 13 Rodenticide: 11
Gopher Poison Bait 0.20 Lb. 7.71 2 Vertebrate Pest Bait 0.50 Lb. 1.92 1 Bait Stations 1.00 Each 8.50 9 Custom: 1,160
Pruning (Hand) and Stacking 1.00 Acre 120.00 120 Shredding 1.00 Acre 25.00 25 Pollination Fee 2.00 Hive 200.00 400 Hand Poling 8.00 Acre 50.00 400 Hull/Shell Nuts 3000.00 Lb. 0.05 150 Winter Sanitation- Shake & Sweep 1.00 Acre 30.00 30 PCA/CCA Fee (Prod Yrs.) 1.00 Acre 35.00 35 Irrigation: 1,366
Water - Pumped 62.00 Ac In 22.00 1,364 Irrigation Pump Test (50%) 0.01 Each 200.00 1 Water Analysis 0.02 Each 50.00 1 Fertilizer: 473
UAN32 (32-0-0) 200.00 Lb. N 0.58 116 KTS (0-0-25) 25% w/17% Sulfur 400.00 Lb. 0.30 120 Potassium Sulfate-K2SO4 50% 200.00 Lb. 0.55 110 10-34-0 (Ammonium Phosphate) 117.66 Lb. 1.06 125 Zinc Chelate 10% 1.00 Qt 2.24 2 Analysis: 3
Soil Analysis incl. Salinity 0.01 Each 225.00 1 Leaf Analysis 0.05 Each 20.00 1 Hull Analysis 0.02 Each 20.00 0 Labor 345
Equipment Operator Labor 9.16 Hrs. 22.40 205 Irrigation Labor 8.07 Hrs. 15.40 124 Non-Machine Labor 1.00 Hrs. 15.40 15 Machinery 105
Fuel-Gas 0.77 gal 2.76 2 Fuel-Diesel 22.07 gal 2.84 63 Lube 10 Machinery Repair 30
Interest on Operating Capital @ 4.75% 66
TOTAL OPERATING COSTS/ACRE 4,027
TOTAL OPERATING COSTS/LB 1
NET RETURNS ABOVE OPERATING COSTS 2,723
2016 Almonds Costs & Returns Study San Joaquin Valley - South UCCE, UC-AIC, UC DAVIS-ARE 18
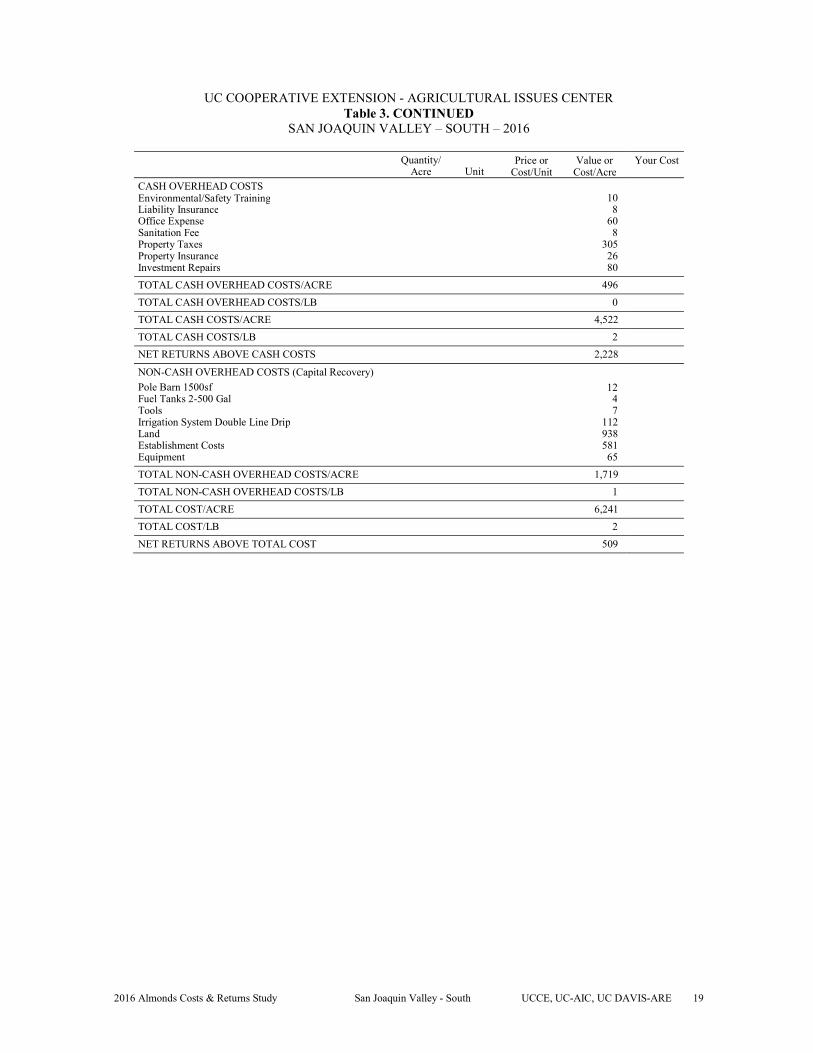
UC COOPERATIVE EXTENSION - AGRICULTURAL ISSUES CENTER Table 3. CONTINUED
SAN JOAQUIN VALLEY – SOUTH – 2016
Quantity/ Price or Value or Your Cost Acre Unit Cost/Unit Cost/Acre
CASH OVERHEAD COSTS Environmental/Safety Training 10 Liability Insurance 8 Office Expense 60 Sanitation Fee 8 Property Taxes 305 Property Insurance 26 Investment Repairs 80
TOTAL CASH OVERHEAD COSTS/ACRE 496
TOTAL CASH OVERHEAD COSTS/LB 0
TOTAL CASH COSTS/ACRE 4,522
TOTAL CASH COSTS/LB 2
NET RETURNS ABOVE CASH COSTS 2,228
NON-CASH OVERHEAD COSTS (Capital Recovery)
Pole Barn 1500sf 12 Fuel Tanks 2-500 Gal 4 Tools 7 Irrigation System Double Line Drip 112 Land 938 Establishment Costs 581 Equipment 65
TOTAL NON-CASH OVERHEAD COSTS/ACRE 1,719
TOTAL NON-CASH OVERHEAD COSTS/LB 1
TOTAL COST/ACRE 6,241
TOTAL COST/LB 2
NET RETURNS ABOVE TOTAL COST 509
2016 Almonds Costs & Returns Study San Joaquin Valley - South UCCE, UC-AIC, UC DAVIS-ARE 19
11 11
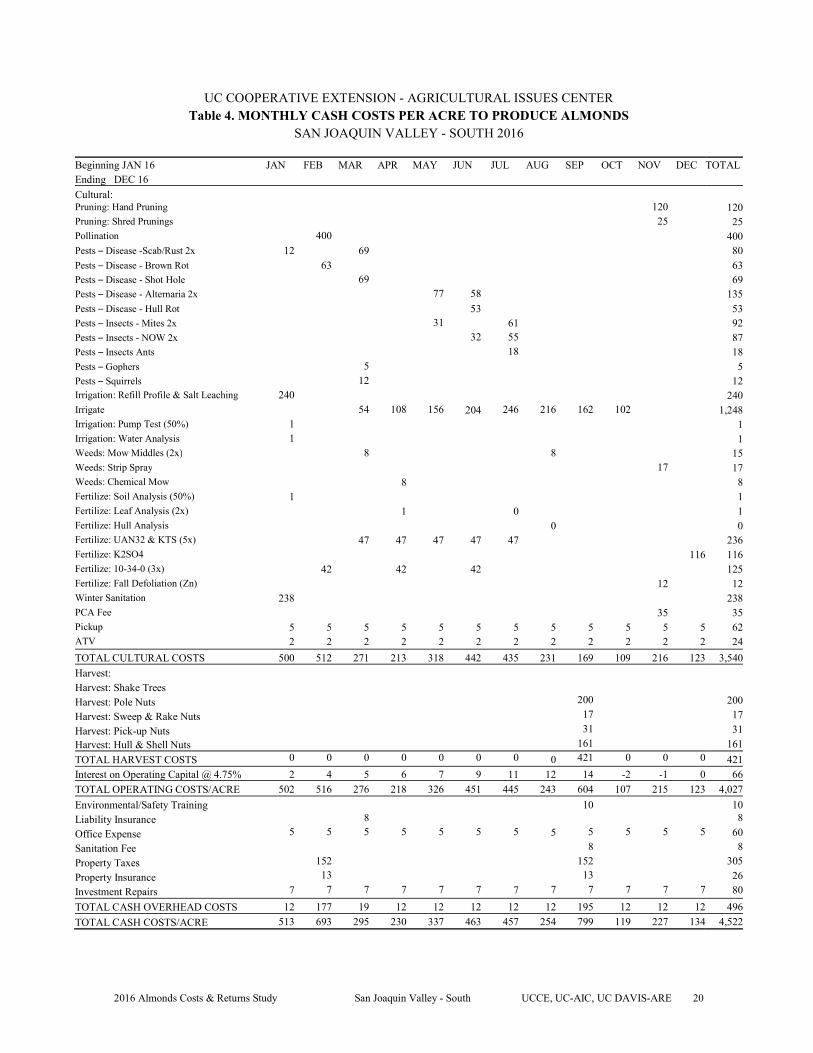
UC COOPERATIVE EXTENSION - AGRICULTURAL ISSUES CENTER Table 4. MONTHLY CASH COSTS PER ACRE TO PRODUCE ALMONDS
SAN JOAQUIN VALLEY - SOUTH 2016
Beginning JAN 16 JAN FEB MAR APR MAY JUN JUL AUG SEP OCT NOV DEC TOTAL Ending DEC 16
Cultural: Pruning: Hand Pruning 120 120 Pruning: Shred Prunings 25 25 Pollination 400 400 Pests – Disease -Scab/Rust 2x 12 69 80 Pests – Disease - Brown Rot 63 63 Pests – Disease - Shot Hole 69 69 Pests – Disease - Alternaria 2x 77 58 135 Pests – Disease - Hull Rot 53 53 Pests – Insects - Mites 2x 31 61 92 Pests – Insects - NOW 2x 32 55 87 Pests – Insects Ants 18 18 Pests – Gophers 5 5 Pests – Squirrels 12 12 Irrigation: Refill Profile & Salt Leaching 240 240 Irrigate 54 108 156 204 246 216 162 102 1,248 Irrigation: Pump Test (50%) 1 1 Irrigation: Water Analysis 1 1 Weeds: Mow Middles (2x) 8 8 15 Weeds: Strip Spray 17 17 Weeds: Chemical Mow 8 8 Fertilize: Soil Analysis (50%) 1 1 Fertilize: Leaf Analysis (2x) 1 0 1 Fertilize: Hull Analysis 0 0 Fertilize: UAN32 & KTS (5x) 47 47 47 47 47 236 Fertilize: K2SO4 116 116 Fertilize: 10-34-0 (3x) 42 42 42 125 Fertilize: Fall Defoliation (Zn) 12 12 Winter Sanitation 238 238 PCA Fee 35 35 Pickup 5 5 5 5 5 5 5 5 5 5 5 5 62 ATV 2 2 2 2 2 2 2 2 2 2 2 2 24
TOTAL CULTURAL COSTS 500 512 271 213 318 442 435 231 169 109 216 123 3,540
Harvest: Harvest: Shake Trees Harvest: Pole Nuts 200 200
Harvest: Sweep & Rake Nuts 17 17
Harvest: Pick-up Nuts 31 31
Harvest: Hull & Shell Nuts 161 161
TOTAL HARVEST COSTS 0 0 0 0 0 0 0 0 421 0 0 0 421
Interest on Operating Capital @ 4.75% 2 4 5 6 7 9 11 12 14 -2 -1 0 66
TOTAL OPERATING COSTS/ACRE 502 516 276 218 326 451 445 243 604 107 215 123 4,027
Environmental/Safety Training 10 10 Liability Insurance 8 8
Office Expense 5 5 5 5 5 5 5 5 5 5 5 5 60
Sanitation Fee 8 8
Property Taxes 152 152 305
Property Insurance 13 13 26
Investment Repairs 7 7 7 7 7 7 7 7 7 7 7 7 80
TOTAL CASH OVERHEAD COSTS 12 177 19 12 12 12 12 12 195 12 12 12 496
TOTAL CASH COSTS/ACRE 513 693 295 230 337 463 457 254 799 119 227 134 4,522
2016 Almonds Costs & Returns Study San Joaquin Valley - South UCCE, UC-AIC, UC DAVIS-ARE 20
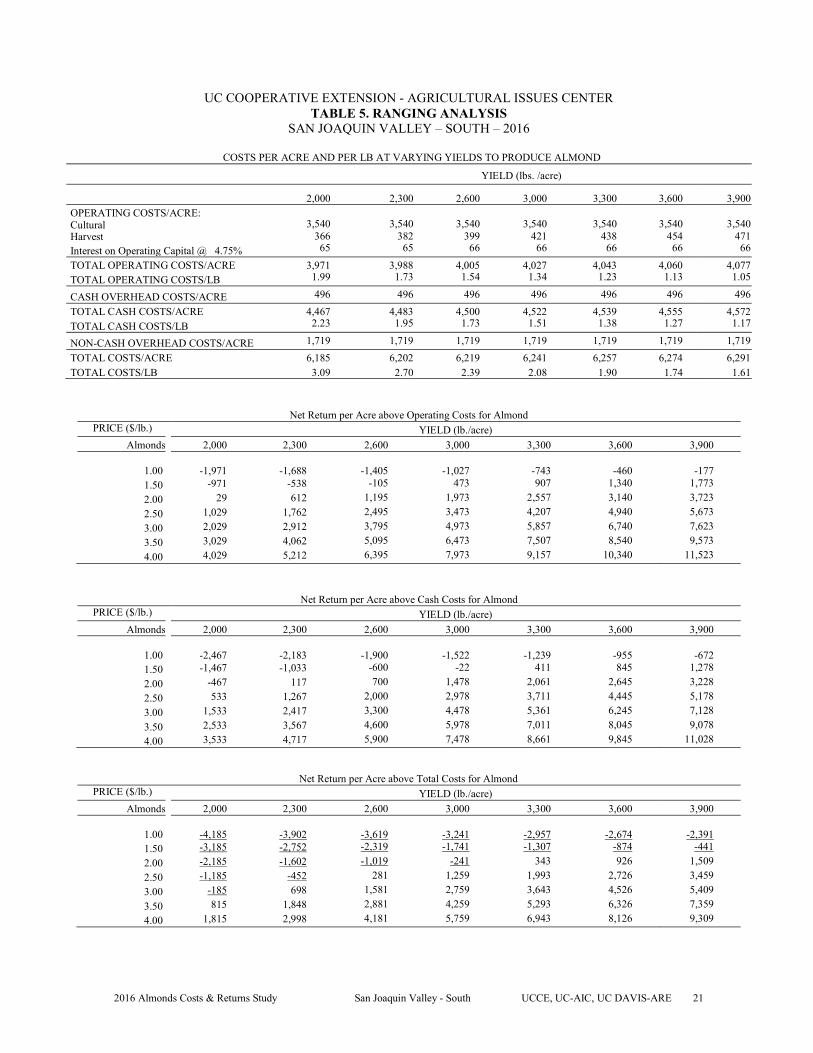
UC COOPERATIVE EXTENSION - AGRICULTURAL ISSUES CENTER TABLE 5. RANGING ANALYSIS
SAN JOAQUIN VALLEY – SOUTH – 2016
COSTS PER ACRE AND PER LB AT VARYING YIELDS TO PRODUCE ALMOND
YIELD (lbs. /acre)
2,000 2,300 2,600 3,000 3,300 3,600 3,900 OPERATING COSTS/ACRE: Cultural 3,540 3,540 3,540 3,540 3,540 3,540 3,540 Harvest 366 382 399 421 438 454 471 Interest on Operating Capital @ 4.75% 65 65 66 66 66 66 66
TOTAL OPERATING COSTS/ACRE 3,971 3,988 4,005 4,027 4,043 4,060 4,077 TOTAL OPERATING COSTS/LB 1.99 1.73 1.54 1.34 1.23 1.13 1.05
CASH OVERHEAD COSTS/ACRE 496 496 496 496 496 496 496
TOTAL CASH COSTS/ACRE 4,467 4,483 4,500 4,522 4,539 4,555 4,572 TOTAL CASH COSTS/LB 2.23 1.95 1.73 1.51 1.38 1.27 1.17
NON-CASH OVERHEAD COSTS/ACRE 1,719 1,719 1,719 1,719 1,719 1,719 1,719
TOTAL COSTS/ACRE 6,185 6,202 6,219 6,241 6,257 6,274 6,291 TOTAL COSTS/LB 3.09 2.70 2.39 2.08 1.90 1.74 1.61
Net Return per Acre above Operating Costs for Almond PRICE ($/lb.) YIELD (lb./acre)
Almonds 2,000 2,300 2,600 3,000 3,300 3,600 3,900
1.00 -1,971 -1,688 -1,405 -1,027 -743 -460 -177 1.50 -971 -538 -105 473 907 1,340 1,773
2.00 29 612 1,195 1,973 2,557 3,140 3,723
2.50 1,029 1,762 2,495 3,473 4,207 4,940 5,673
3.00 2,029 2,912 3,795 4,973 5,857 6,740 7,623
3.50 3,029 4,062 5,095 6,473 7,507 8,540 9,573
4.00 4,029 5,212 6,395 7,973 9,157 10,340 11,523
Net Return per Acre above Cash Costs for Almond PRICE ($/lb.) YIELD (lb./acre)
Almonds 2,000 2,300 2,600 3,000 3,300 3,600 3,900
1.00 -2,467 -2,183 -1,900 -1,522 -1,239 -955 -672 1.50 -1,467 -1,033 -600 -22 411 845 1,278
2.00 -467 117 700 1,478 2,061 2,645 3,228
2.50 533 1,267 2,000 2,978 3,711 4,445 5,178
3.00 1,533 2,417 3,300 4,478 5,361 6,245 7,128
3.50 2,533 3,567 4,600 5,978 7,011 8,045 9,078
4.00 3,533 4,717 5,900 7,478 8,661 9,845 11,028
Net Return per Acre above Total Costs for Almond PRICE ($/lb.) YIELD (lb./acre)
Almonds 2,000 2,300 2,600 3,000 3,300 3,600 3,900
1.00 -4,185 -3,902 -3,619 -3,241 -2,957 -2,674 -2,391 1.50 -3,185 -2,752 -2,319 -1,741 -1,307 -874 -441
2.00 -2,185 -1,602 -1,019 -241 343 926 1,509
2.50 -1,185 -452 281 1,259 1,993 2,726 3,459
3.00 -185 698 1,581 2,759 3,643 4,526 5,409
3.50 815 1,848 2,881 4,259 5,293 6,326 7,359
4.00 1,815 2,998 4,181 5,759 6,943 8,126 9,309
2016 Almonds Costs & Returns Study San Joaquin Valley - South UCCE, UC-AIC, UC DAVIS-ARE 21
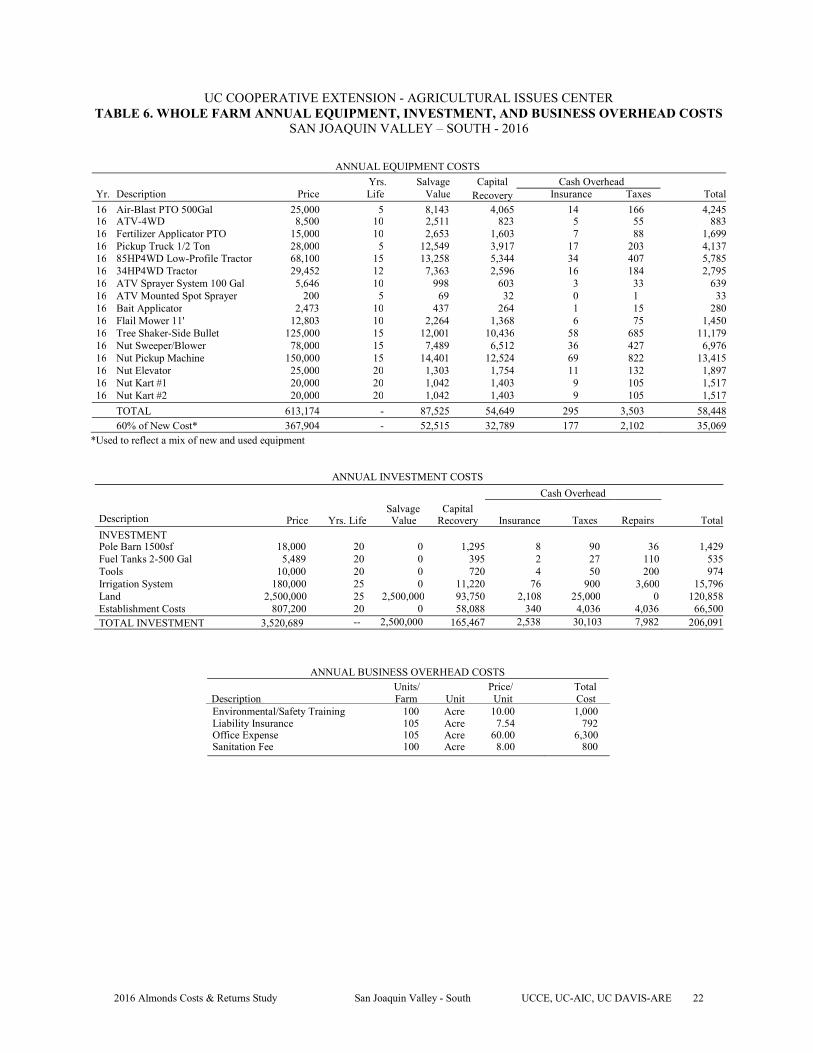
UC COOPERATIVE EXTENSION - AGRICULTURAL ISSUES CENTER TABLE 6. WHOLE FARM ANNUAL EQUIPMENT, INVESTMENT, AND BUSINESS OVERHEAD COSTS
SAN JOAQUIN VALLEY – SOUTH - 2016
ANNUAL EQUIPMENT COSTSYrs. Salvage Capital Cash Overhead
Yr. Description Price Life Value Recovery Insurance Taxes Total
16 Air-Blast PTO 500Gal 25,000 5 8,143 4,065 14 166 4,245 16 ATV-4WD 8,500 10 2,511 823 5 55 883 16 Fertilizer Applicator PTO 15,000 10 2,653 1,603 7 88 1,699 16 Pickup Truck 1/2 Ton 28,000 5 12,549 3,917 17 203 4,137 16 85HP4WD Low-Profile Tractor 68,100 15 13,258 5,344 34 407 5,785 16 34HP4WD Tractor 29,452 12 7,363 2,596 16 184 2,795 16 ATV Sprayer System 100 Gal 5,646 10 998 603 3 33 639 16 ATV Mounted Spot Sprayer 200 5 69 32 0 1 33 16 Bait Applicator 2,473 10 437 264 1 15 280 16 Flail Mower 11' 12,803 10 2,264 1,368 6 75 1,450 16 Tree Shaker-Side Bullet 125,000 15 12,001 10,436 58 685 11,179 16 Nut Sweeper/Blower 78,000 15 7,489 6,512 36 427 6,976 16 Nut Pickup Machine 150,000 15 14,401 12,524 69 822 13,415 16 Nut Elevator 25,000 20 1,303 1,754 11 132 1,897 16 Nut Kart #1 20,000 20 1,042 1,403 9 105 1,517 16 Nut Kart #2 20,000 20 1,042 1,403 9 105 1,517
TOTAL 613,174 - 87,525 54,649 295 3,503 58,448 60% of New Cost* 367,904 - 52,515 32,789 177 2,102 35,069
*Used to reflect a mix of new and used equipment
ANNUAL INVESTMENT COSTS
Description Price Yrs. Life Salvage Value
Capital Recovery I
Cash Overhead
nsurance Taxes Repairs Total INVESTMENT Pole Barn 1500sf 18,000 20 0 1,295 8 90 36 1,429 Fuel Tanks 2-500 Gal 5,489 20 0 395 2 27 110 535 Tools 10,000 20 0 720 4 50 200 974 Irrigation System 180,000 25 0 11,220 76 900 3,600 15,796 Land 2,500,000 25 2,500,000 93,750 2,108 25,000 0 120,858 Establishment Costs 807,200 20 0 58,088 340 4,036 4,036 66,500 TOTAL INVESTMENT 3,520,689 -- 2,500,000 165,467 2,538 30,103 7,982 206,091
ANNUAL BUSINESS OVERHEAD COSTS Units/ Price/ Total
Description Farm Unit Unit Cost Environmental/Safety Training 100 Acre 10.00 1,000 Liability Insurance 105 Acre 7.54 792 Office Expense 105 Acre 60.00 6,300 Sanitation Fee 100 Acre 8.00 800
2016 Almonds Costs & Returns Study San Joaquin Valley - South UCCE, UC-AIC, UC DAVIS-ARE 22
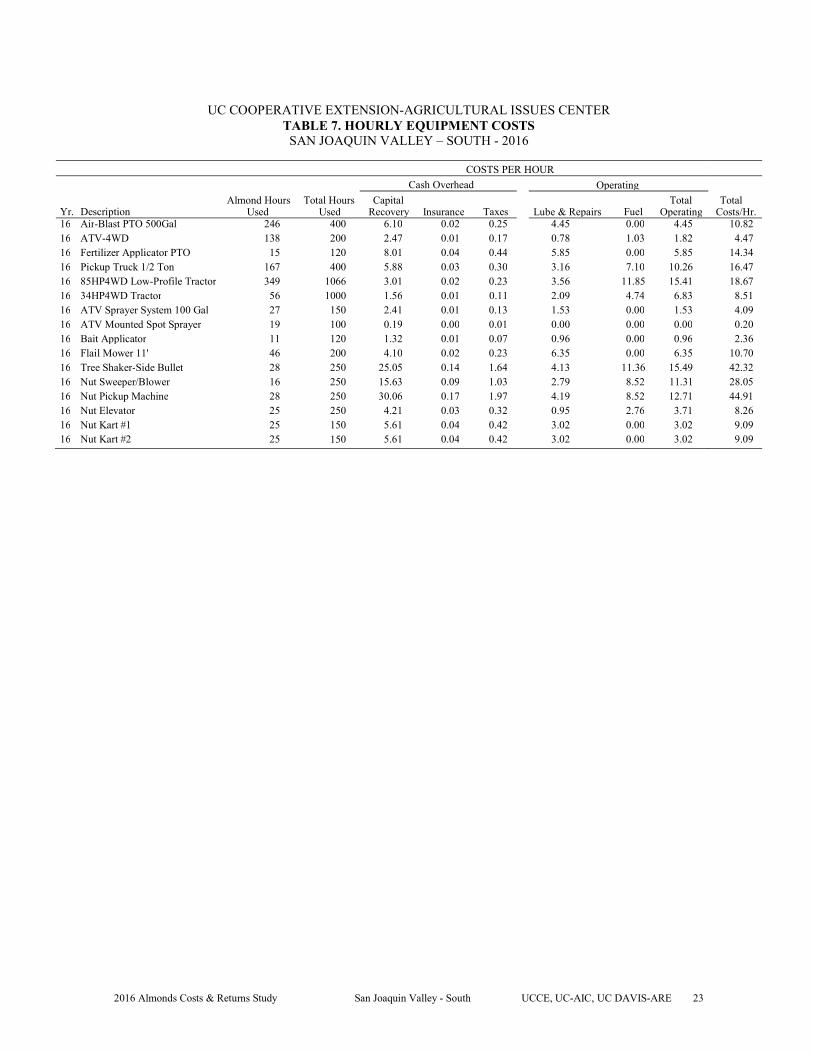
UC COOPERATIVE EXTENSION-AGRICULTURAL ISSUES CENTER TABLE 7. HOURLY EQUIPMENT COSTS SAN JOAQUIN VALLEY – SOUTH - 2016
COSTS PER HOUR
Cash Overhead Operating
Almond Hours Total Hours Capital Total Total Yr. Description Used Used Recovery Insurance Taxes Lube & Repairs Fuel Operating Costs/Hr. 16 Air-Blast PTO 500Gal 246 400 6.10 0.02 0.25 4.45 0.00 4.45 10.82 16 ATV-4WD 138 200 2.47 0.01 0.17 0.78 1.03 1.82 4.47 16 Fertilizer Applicator PTO 15 120 8.01 0.04 0.44 5.85 0.00 5.85 14.34 16 Pickup Truck 1/2 Ton 167 400 5.88 0.03 0.30 3.16 7.10 10.26 16.47 16 85HP4WD Low-Profile Tractor 349 1066 3.01 0.02 0.23 3.56 11.85 15.41 18.67 16 34HP4WD Tractor 56 1000 1.56 0.01 0.11 2.09 4.74 6.83 8.51 16 ATV Sprayer System 100 Gal 27 150 2.41 0.01 0.13 1.53 0.00 1.53 4.09 16 ATV Mounted Spot Sprayer 19 100 0.19 0.00 0.01 0.00 0.00 0.00 0.20 16 Bait Applicator 11 120 1.32 0.01 0.07 0.96 0.00 0.96 2.36 16 Flail Mower 11' 46 200 4.10 0.02 0.23 6.35 0.00 6.35 10.70 16 Tree Shaker-Side Bullet 28 250 25.05 0.14 1.64 4.13 11.36 15.49 42.32 16 Nut Sweeper/Blower 16 250 15.63 0.09 1.03 2.79 8.52 11.31 28.05 16 Nut Pickup Machine 28 250 30.06 0.17 1.97 4.19 8.52 12.71 44.91 16 Nut Elevator 25 250 4.21 0.03 0.32 0.95 2.76 3.71 8.26 16 Nut Kart #1 25 150 5.61 0.04 0.42 3.02 0.00 3.02 9.09 16 Nut Kart #2 25 150 5.61 0.04 0.42 3.02 0.00 3.02 9.09
2016 Almonds Costs & Returns Study San Joaquin Valley - South UCCE, UC-AIC, UC DAVIS-ARE 23
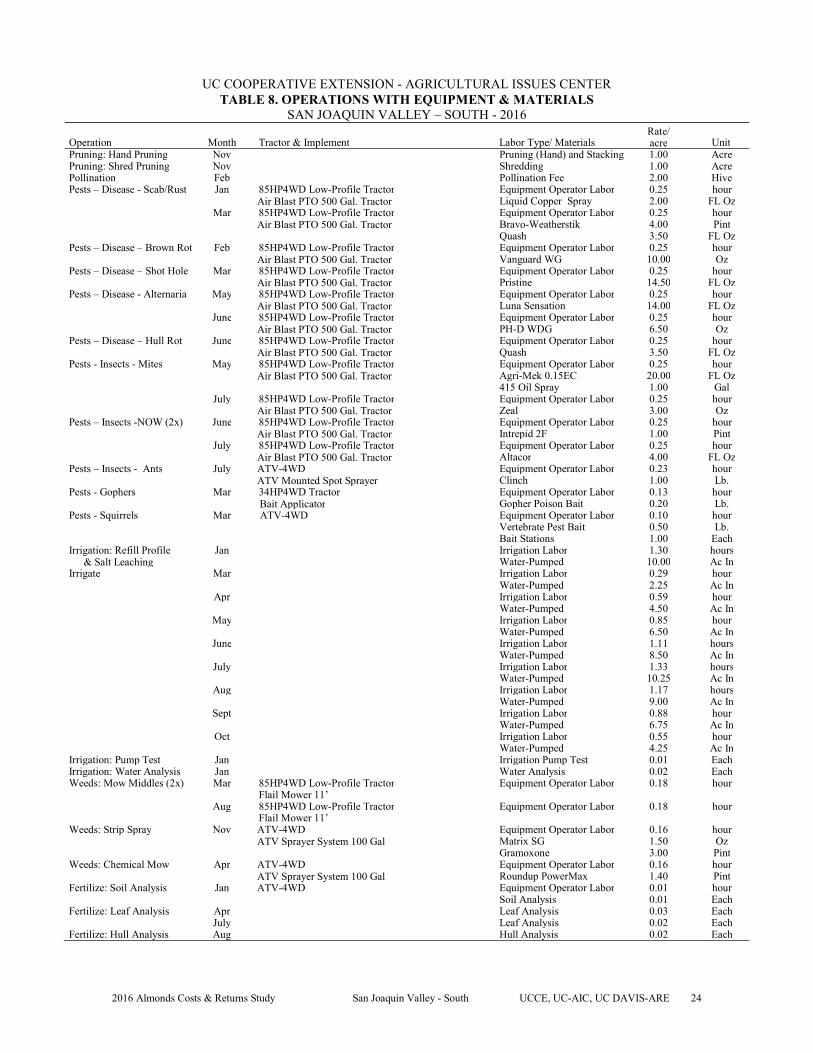
UC COOPERATIVE EXTENSION - AGRICULTURAL ISSUES CENTER TABLE 8. OPERATIONS WITH EQUIPMENT & MATERIALS
SAN JOAQUIN VALLEY – SOUTH - 2016 Rate/
Operation Month Tractor & Implement Labor Type/ Materials acre Unit Pruning: Hand Pruning Nov Pruning (Hand) and Stacking 1.00 Acre Pruning: Shred Pruning Nov Shredding 1.00 Acre Pollination Feb Pollination Fee 2.00 Hive Pests – Disease - Scab/Rust Jan 85HP4WD Low-Profile Tractor Equipment Operator Labor 0.25 hour
Air Blast PTO 500 Gal. Tractor Liquid Copper Spray 2.00 FL Oz Mar 85HP4WD Low-Profile Tractor Equipment Operator Labor 0.25 hour
Air Blast PTO 500 Gal. Tractor Bravo-Weatherstik 4.00 Pint Quash 3.50 FL Oz
Pests – Disease – Brown Rot Feb 85HP4WD Low-Profile Tractor Equipment Operator Labor 0.25 hour Air Blast PTO 500 Gal. Tractor Vanguard WG 10.00 Oz
Pests – Disease – Shot Hole Mar 85HP4WD Low-Profile Tractor Equipment Operator Labor 0.25 hour Air Blast PTO 500 Gal. Tractor Pristine 14.50 FL Oz
Pests – Disease - Alternaria May 85HP4WD Low-Profile Tractor Equipment Operator Labor 0.25 hour Air Blast PTO 500 Gal. Tractor Luna Sensation 14.00 FL Oz
June 85HP4WD Low-Profile Tractor Equipment Operator Labor 0.25 hour Air Blast PTO 500 Gal. Tractor PH-D WDG 6.50 Oz
Pests – Disease – Hull Rot June 85HP4WD Low-Profile Tractor Equipment Operator Labor 0.25 hour Air Blast PTO 500 Gal. Tractor Quash 3.50 FL Oz
Pests - Insects - Mites May 85HP4WD Low-Profile Tractor Equipment Operator Labor 0.25 hour Air Blast PTO 500 Gal. Tractor Agri-Mek 0.15EC 20.00 FL Oz
415 Oil Spray 1.00 Gal July 85HP4WD Low-Profile Tractor Equipment Operator Labor 0.25 hour
Air Blast PTO 500 Gal. Tractor Zeal 3.00 Oz Pests – Insects -NOW (2x) June 85HP4WD Low-Profile Tractor Equipment Operator Labor 0.25 hour
Air Blast PTO 500 Gal. Tractor Intrepid 2F 1.00 Pint July 85HP4WD Low-Profile Tractor Equipment Operator Labor 0.25 hour
Air Blast PTO 500 Gal. Tractor Altacor 4.00 FL Oz Pests – Insects - Ants July ATV-4WD Equipment Operator Labor 0.23 hour
ATV Mounted Spot Sprayer Clinch 1.00 Lb. Pests - Gophers Mar 34HP4WD Tractor Equipment Operator Labor 0.13 hour
Bait Applicator Gopher Poison Bait 0.20 Lb. Pests - Squirrels Mar ATV-4WD Equipment Operator Labor 0.10 hour
Vertebrate Pest Bait 0.50 Lb. Bait Stations 1.00 Each
Irrigation: Refill Profile Jan Irrigation Labor 1.30 hours & Salt Leaching Water-Pumped 10.00 Ac In
Irrigate Mar Irrigation Labor 0.29 hour Water-Pumped 2.25 Ac In
Apr Irrigation Labor 0.59 hour Water-Pumped 4.50 Ac In
May Irrigation Labor 0.85 hour Water-Pumped 6.50 Ac In
June Irrigation Labor 1.11 hours Water-Pumped 8.50 Ac In
July Irrigation Labor 1.33 hours Water-Pumped 10.25 Ac In
Aug Irrigation Labor 1.17 hours Water-Pumped 9.00 Ac In
Sept Irrigation Labor 0.88 hour Water-Pumped 6.75 Ac In
Oct Irrigation Labor 0.55 hour Water-Pumped 4.25 Ac In
Irrigation: Pump Test Jan Irrigation Pump Test 0.01 Each Irrigation: Water Analysis Jan Water Analysis 0.02 Each Weeds: Mow Middles (2x) Mar 85HP4WD Low-Profile Tractor Equipment Operator Labor 0.18 hour
Flail Mower 11’ Aug 85HP4WD Low-Profile Tractor Equipment Operator Labor 0.18 hour
Flail Mower 11’ Weeds: Strip Spray Nov ATV-4WD Equipment Operator Labor 0.16 hour
ATV Sprayer System 100 Gal Matrix SG 1.50 Oz Gramoxone 3.00 Pint
Weeds: Chemical Mow Apr ATV-4WD Equipment Operator Labor 0.16 hour ATV Sprayer System 100 Gal Roundup PowerMax 1.40 Pint
Fertilize: Soil Analysis Jan ATV-4WD Equipment Operator Labor 0.01 hour Soil Analysis 0.01 Each
Fertilize: Leaf Analysis Apr Leaf Analysis 0.03 Each July Leaf Analysis 0.02 Each
Fertilize: Hull Analysis Aug Hull Analysis 0.02 Each
2016 Almonds Costs & Returns Study San Joaquin Valley - South UCCE, UC-AIC, UC DAVIS-ARE 24
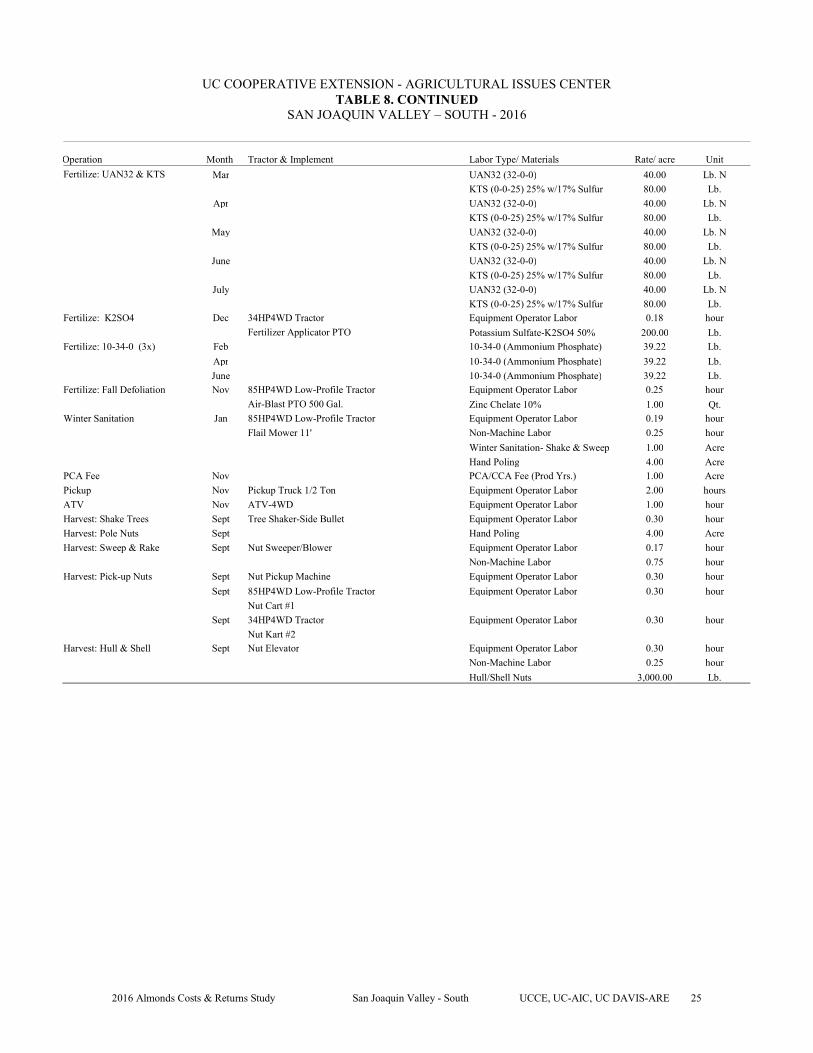
UC COOPERATIVE EXTENSION - AGRICULTURAL ISSUES CENTER TABLE 8. CONTINUED
SAN JOAQUIN VALLEY – SOUTH - 2016
Operation Month Tractor & Implement Labor Type/ Materials Rate/ acre Unit
Fertilize: UAN32 & KTS Mar UAN32 (32-0-0) 40.00 Lb. N
KTS (0-0-25) 25% w/17% Sulfur 80.00 Lb.
Apr UAN32 (32-0-0) 40.00 Lb. N
KTS (0-0-25) 25% w/17% Sulfur 80.00 Lb.
May UAN32 (32-0-0) 40.00 Lb. N
KTS (0-0-25) 25% w/17% Sulfur 80.00 Lb.
June UAN32 (32-0-0) 40.00 Lb. N
KTS (0-0-25) 25% w/17% Sulfur 80.00 Lb.
July UAN32 (32-0-0) 40.00 Lb. N
KTS (0-0-25) 25% w/17% Sulfur 80.00 Lb. Fertilize: K2SO4 Dec 34HP4WD Tractor Equipment Operator Labor 0.18 hour
Fertilizer Applicator PTO Potassium Sulfate-K2SO4 50% 200.00 Lb. Fertilize: 10-34-0 (3x) Feb 10-34-0 (Ammonium Phosphate) 39.22 Lb.
Apr 10-34-0 (Ammonium Phosphate) 39.22 Lb.
June 10-34-0 (Ammonium Phosphate) 39.22 Lb. Fertilize: Fall Defoliation Nov 85HP4WD Low-Profile Tractor Equipment Operator Labor 0.25 hour
Air-Blast PTO 500 Gal. Zinc Chelate 10% 1.00 Qt. Winter Sanitation Jan 85HP4WD Low-Profile Tractor Equipment Operator Labor 0.19 hour
Flail Mower 11' Non-Machine Labor 0.25 hour
Winter Sanitation- Shake & Sweep 1.00 Acre
Hand Poling 4.00 Acre PCA Fee Nov PCA/CCA Fee (Prod Yrs.) 1.00 Acre
Pickup Nov Pickup Truck 1/2 Ton Equipment Operator Labor 2.00 hours
ATV Nov ATV-4WD Equipment Operator Labor 1.00 hour
Harvest: Shake Trees Sept Tree Shaker-Side Bullet Equipment Operator Labor 0.30 hour
Harvest: Pole Nuts Sept Hand Poling 4.00 Acre
Harvest: Sweep & Rake Sept Nut Sweeper/Blower Equipment Operator Labor 0.17 hour
Non-Machine Labor 0.75 hour
Harvest: Pick-up Nuts Sept Nut Pickup Machine Equipment Operator Labor 0.30 hour
Sept 85HP4WD Low-Profile Tractor Equipment Operator Labor 0.30 hour
Nut Cart #1
Sept 34HP4WD Tractor Equipment Operator Labor 0.30 hour
Nut Kart #2 Harvest: Hull & Shell Sept Nut Elevator Equipment Operator Labor 0.30 hour
Non-Machine Labor 0.25 hour
Hull/Shell Nuts 3,000.00 Lb.
2016 Almonds Costs & Returns Study San Joaquin Valley - South UCCE, UC-AIC, UC DAVIS-ARE 25