copyright © 2017 ghana statistical service
TRANSCRIPT
i
Copyright © 2017 Ghana Statistical Service
Prepared by: Anthony Krakah (National Project Coordinator), Dominic Odoom, Isaac Dadson
(Deputy Project Coordinator), Johnson Owusu Kagya, Ebenezer Ocran, Bernice Ofsu-Baadu;
Andani Iddrisu Abdulai and Alex Anyetei
Contributors: Abena Osei-Akoto, Jacqueline Anum, Samilia Mintah, Ernest Enyan, Yaw
Misefa, Appiah-Kusi Boateng Rochester, George Agbenyo, Alfred Tsatsu, Justina Yeboah and
Vivian Asantey
Edited by: Sylvester Gyamfi and Araba Forson
Reviewed by: Anthony Amuzu (Deputy Government Statistician, Operations)
Chief Editor: Baah Wadieh (Acting Government Statistician)
ii
PREFACE AND ACKNOWLEDGEMENT
The Integrated Business Establishment Survey (IBES) is an economic census cutting across all
the three major sectors of the Ghanaian economy. The IBES is structured in two phases IBES I
and II. The second Phase of IBES II started in earnest after the completion of the first when the
sampling frame of establishments became available. While IBES I focused on collecting and
collating basic but detailed data on establishments’ location, employment, and other
characteristics, the second phase IBES II focused on collecting and producing statistics on the
operations of the non-household businesses in the country. Compared to the previous industrial
censuses conducted in 1962, 1978, 1987 and 2003 which focused only on the industry sector,
IBES is the first non-household economic census covering all sectors of the economy,
institutional agriculture, industry and service. In addition to producing the requisite data for
rebasing the country’s Gross Domestic Product, IBES II collected relevant data which are
published in this summary report and other reports.to inform business and other policy decisions.
This report summarizes the findings of IBES II which was conducted in 2015, with 2013 being
the reference period for the data collected. The report presents findings at the sector and sub-
sector levels in all the relevant subject matter areas including employment, compensation of
employees, receipts and revenues of businesses in Ghana, as well as cost incurred by firms
during the production of goods and services. Aside the public and private sector policy makers
who will need this report for their policy decisions, researchers, students, and the international
community, may use of the IBES II summary report as a reliable source of information on non-
household establishments in Ghana.
The Ghana Statistical Service (GSS) expresses its appreciation to the Government of Ghana, the
Dutch Government, UK-DFID and the World Bank for providing the financial assistance for
IBES. We also wish to thank the Ministry of Trade and Industry for providing both technical and
financial support. We appreciate the technical assistance provided by the following organizations
during the execution of the project: namely, National Board for Small Scale Industries (NBSSI);
United Nations Development Programme (UNDP); United Nations Industrial Development
Organization (UNIDO); Ministry of Roads and Transport; Ghana Employers Association (GEA);
Association of Ghana Industries (AGI); Ghana National Chamber of Commerce and Industry

iii
(GNCCI); National Insurance Commission (NIC); Private Enterprise Federation (PEF);
Minerals Commission; Ghana Tourist Board (GTB); National Communications Authority
(NCA); Ministry of Employment and Labour Relations (MELR); and the Institute of Statistical,
Social and Economic Research (ISSER), Legon.
We appreciate all the sampled establishments that provided the required data which has made it
possible to complete IBES II. Also, the GSS acknowledges the efforts of all officers and field
staff who worked tirelessly to ensure that IBES II was successful.
BAAH WADIEH
AG. GOVERNMENT STATISTICIAN
AND NATIONAL PROJECT DIRECTOR

iv
CONTENTS
PREFACE AND ACKNOWLEDGEMENT .............................................................................. ii
TABLES ......................................................................................................................................... v
FIGURES ..................................................................................................................................... xii
LIST OF ACRONYMS ............................................................................................................. xiii
EXECUTIVE SUMMARY ........................................................................................................ xv
CHAPTER ONE: BACKGROUND ........................................................................................... 1
1.1 Introduction ...................................................................................................................... 1
1.2 Economic censuses and surveys in Ghana ....................................................................... 1
1.3 Objectives of the census ................................................................................................... 2
1.4 Scope and coverage .......................................................................................................... 2
1.5 Reference year .................................................................................................................. 2
1.6 Legislation and Confidentiality ........................................................................................ 2
1.7 Institutional Arrangements ............................................................................................... 3
1.8 Funding............................................................................................................................. 3
1.9 Organization of the Report ............................................................................................... 3
CHAPTER TWO: METHODOLOGY ...................................................................................... 4 2.1 Introduction ...................................................................................................................... 4
2.2 Phase II methodology ....................................................................................................... 4
CHAPTER THREE: SURVEY RESULTS ............................................................................. 10 3.1 Introduction .................................................................................................................... 10
3.2 Trading account of businesses ....................................................................................... 10
3.3 Operating Cost of production of goods and services ..................................................... 15
3.4 Receipts of Businesses ................................................................................................... 19
3.5 Capital formation............................................................................................................ 26
3.6 Inventories/stocks ........................................................................................................... 39
3.7 Employment and compensation of employees ............................................................... 47
CHAPTER FOUR: COMPARATIVE ANALYSIS OF A DECADE (2003 - 2013) OF
INDUSTRY SECTOR PERFORMANCE ............................................ 56
CHAPTER FIVE: CONCLUSIONS AND RECOMMENDATION .................................... 64 4.1 Introduction .................................................................................................................... 64
4.2 Conclusions .................................................................................................................... 64
4.3 Recommendation ............................................................................................................ 66
CHAPTER SIX: GLOSSARY .................................................................................................. 67
APPENDICES ............................................................................................................................. 72

v
TABLES
Table 3.1: Distribution of revenue, cost of goods sold and gross profit by Sector.................. 11
Table 3.2: Distribution of revenue, cost of goods sold and gross profit by subsector ............. 13
Table 3.3: Distribution of revenue, cost of goods sold and gross profit by region.................. 14
Table 3.4: Distribution of revenue, cost of goods sold and gross profit by size...................... 15
Table 3.5: Cost of production by sector and type of cost of production (million GH¢) .......... 16
Table 3.6: Distribution of sources of cost of production and services by sector and
sub-sector (million GH¢) ....................................................................................... 17
Table 3.7: Cost of production of goods and services by region and type of production
cost (million GH₵) ................................................................................................ 18
Table 3.8: Purchases and other operating cost by sector and size .......................................... 19
Table 3.9: Distribution of sources of receipts in the Agriculture sector by subsector
(GH¢ million)......................................................................................................... 20
Table 3.10: Distribution of sources of receipts in the Agriculture sector by region................. 21
Table 3.11: Distribution of sources of receipts in the Agriculture sector by size ..................... 21
Table 3.12: Distribution of sources of receipts in the Industry sector by subsector ................. 23
Table 3.13: Distribution of sources of receipts in the Industry sector by region ...................... 24
Table 3.14: Distribution of sources of receipts in the Industry sector by Size ......................... 24
Table 3.15: Distribution of sources of receipts in the Service sector by subsector .................. 25
Table 3.16: Distribution of sources of receipts in the Service sector by region ....................... 26
Table 3.17: Distribution of sources of receipts in Service sector by size ................................. 26
Table 3.18: Additions to fixed assets ........................................................................................ 27
Table 3.19: Additions to fixed assets by sector ........................................................................ 28
Table 3.20: Additions to fixed assets by sector and establishment size ................................... 29
Table 3.21: Additions to fixed assets by region ........................................................................ 29
Table 3.22: Total fixed assets by sector .................................................................................... 32
Table 3.23: Total assets by region ............................................................................................ 33
Table 3.24: Fixed assets by sector and establishment size ....................................................... 33
Table 3.25: Disposal of fixed assets by region ......................................................................... 35
Table 3.26: Depreciation of fixed assets by size ...................................................................... 39
Table 3.27: Value of stocks in Ghana Cedis at end of year by sector ...................................... 40
Table 3.28: Value of stocks in the Agriculture sector by sub-sector and type of stock ........... 41
Table 3.29: Value of stocks in the Industry sector by sub-sector and type of stock ................. 42
Table 3.30: Value of stocks in the Service sector by sub-sector and type of stock .................. 44
Table 3.31: Value of stocks by region and by sector ................................................................ 46
Table 3.32: Persons engaged and employees by sector ............................................................ 48
Table 3.33: Persons engaged and employees by establishment size and sector ....................... 49
Table 3.34: Persons engaged and employees by region ........................................................... 50

vi
Table 3.35: Compensation of employees by sector and type of compensation ........................ 53
Table 3.36: Compensation of employees by sector, establishment size and type
of compensation ..................................................................................................... 54
Table 3.37: Compensation of employees by region and type of compensation ....................... 55
Table 4.1: Number of establishments and persons engaged by industry sub-sectors
in 2003 and 2013 .................................................................................................... 58
Table 4.2: Wages and salaries and number of employees by industry in 2003 and 2013 ...... 58
Table 4.3: Purchases by industry in 2003 and 2013 ............................................................... 60
Table 4.4: Receipts in Industry in 2003 and 2013 .................................................................. 61
Table 4.5: Depreciation of Fixed Asset by industry in 2003 and 2013 .................................. 63
Table 4.6: Gross Additions to Fixed Asset by Industry in 2003 and 2013 ............................. 63
Table A.1: Purchases and other operating cost by sectors ....................................................... 72
Table A.2: Purchases and other operating cost by sector and size of establishment ............... 73
Table A.3: Purchases and other operating cost by sector and region ...................................... 74
Table A.4: Purchases and other operating cost by sector and region ...................................... 75
Table A.5: Purchases and other operating cost by sector and region ...................................... 76
Table A.6: Purchases and other operating cost by sector and region ...................................... 77
Table A.7: Purchases and other operating cost by sector and region ...................................... 78
Table A.8: Purchases and other operating cost by sector and region ...................................... 79
Table A.9: Purchases and other operating cost by sector and region ...................................... 80
Table A.10: Purchases and other operating cost by sector and region ...................................... 81
Table A.11: Purchases and other operating cost by sector and region ...................................... 82
Table A.12: Purchases and other operating cost by sector and region ...................................... 83
Table B.1: Trading account of businesses by sector ............................................................... 84
Table B.2: Trading account of businesses by sector and size of establishment ...................... 85
Table B.3: Trading account of businesses by sector and region ............................................. 86
Table B.4: Trading account of businesses by sector and region ............................................. 87
Table B.5: Trading account of businesses by sector and region ............................................. 88
Table B.6: Trading account of businesses by sector and region ............................................. 89
Table B.7: Trading account of businesses by sector and region ............................................. 90
Table B.8: Trading account of businesses by sector and region ............................................. 91
Table B.9: Trading account of businesses by sector and region ............................................. 92
Table B.10: Trading account of businesses by sector and region ............................................. 93
Table B.11: Trading account of businesses by sector and region ............................................. 94
Table B.12: Trading account of businesses by sector and region ............................................. 95
Table C.1: Compensation of employees by sector .................................................................. 96
Table C.2: Compensation of employees by sector and size of establishment ......................... 97
Table C.3: Compensation of employees by sector and region ................................................ 98
Table C.4: Compensation of employees by sector and region ................................................ 99
Table C.5: Compensation of employees by sector and region .............................................. 100
Table C.6: Compensation of employees by sector and region .............................................. 101

vii
Table C.7: Compensation of employees by sector and region .............................................. 102
Table C.8: Compensation of employees by sector and region .............................................. 103
Table C.9: Compensation of employees by sector and region .............................................. 104
Table C.10: Compensation of employees by sector and region ............................................... 105
Table C.11: Compensation of employees by sector and region ............................................... 106
Table C.12: Compensation of employees by sector and region ............................................... 107
Table D.1: Depreciation of fixed asset by sector .................................................................... 108
Table D.2: Depreciation of fixed asset by sector and size of establishment .......................... 109
Table E.1: Value of fixed asset at the end of year by sector .................................................. 110
Table E.2: Value of fixed asset at the end of year by sector and size of establishment ......... 111
Table E.3: Value of fixed asset at the end of year by sector and region ................................ 112
Table E.4: Value of fixed asset at the end of year by sector and region ................................ 113
Table E.5: Value of fixed asset at the end of year by sector and region ................................ 114
Table E.6: Value of fixed asset at the end of year by sector and region ................................ 115
Table E.7: Value of fixed asset at the end of year by sector and region ................................ 116
Table E.8: Value of fixed asset at the end of year by sector and region ................................ 117
Table E.9: Value of fixed asset at the end of year by sector and region ................................ 118
Table E.10: Value of fixed asset at the end of year by sector and region ................................ 119
Table E.11: Value of fixed asset at the end of year by sector and region ................................ 120
Table E.12: Value of fixed asset at the end of year by sector and region ................................ 121
Table F.1: Disposal of fixed asset by sector .......................................................................... 122
Table F.2: Disposal of fixed asset by sector and size of establishment ................................. 123
Table F.3: Disposal of fixed asset by sector and region ........................................................ 124
Table F.4: Disposal of fixed asset by sector and region ........................................................ 125
Table F.5: Disposal of fixed asset by sector and region ........................................................ 126
Table F.6: Disposal of fixed asset by sector and region ........................................................ 127
Table F.7: Disposal of fixed asset by sector and region ........................................................ 128
Table F.8: Disposal of fixed asset by sector and region ........................................................ 129
Table F.9: Disposal of fixed asset by sector and region ........................................................ 130
Table F.10: Disposal of fixed asset by sector and region ........................................................ 131
Table F.11: Disposal of fixed asset by sector and region ........................................................ 132
Table F.12: Disposal of fixed asset by sector and region ........................................................ 133
Table G.1: Value of stocks at end of year by sub-sector in industry sector ........................... 134
Table G.2: Value of stocks at end of year in industry sector by size of establishment .......... 134
Table G.3: Value of stocks at end of year by sub-sector in industry sector and region ......... 135
Table G.4: Value of stocks at end of year by sub-sector in industry sector and region ......... 135
Table G.5: Value of stocks at end of year by sub-sector in industry sector and region ......... 136
Table G.5: Value of stocks at end of year by sub-sector in industry sector ........................... 136
Table G.6: Value of stocks at end of year by sub-sector in industry sector and region ......... 137
Table G.8: Value of stocks at end of year by sub-sector in industry sector and region ......... 138

viii
Table G.9: Value of stocks at end of year by sub-sector in industry sector and region ......... 138
Table G.10: Value of stocks at end of year by sub-sector in industry sector and region.......... 139
Table G.11: Value of stocks at end of year by sub-sector in industry sector and region.......... 139
Table H.1: Value of stocks at beginning of year by sub-sector in industry sector ................. 140
Table H.2: Value of stocks at beginning of year by sub-sector in industry sector and
size of establishment ............................................................................................. 140
Table H.3: Value of stocks at beginning of year by sub-sector in industry sector
and region…………………………………………………………………... 141
Table H.4: Value of stocks at beginning of year by sub-sector in industry sector
and region………………………………………………………………............ 141
Table H.5: Value of stocks at beginning of year by sub-sector in industry sector
and region………………………………………………………………………. 142
Table H.6: Value of stocks at beginning of year by sub-sector in industry sector
and region…………………………………………………………………......... 142
Table H.7: Value of stocks at beginning of year by sub-sector in industry sector
and region………………………………………………………………….…… 143
Table H.8: Value of stocks at beginning of year by sub-sector in industry sector
and region………………………………………………………………………. 143
Table H.9: Value of stocks at beginning of year by sub-sector in industry sector
and region…..…………………………………………………………………... 144
Table H.10: Value of stocks at beginning of year by sub-sector in industry sector
and region………………………………………………………………………. 144
Table H.11: Value of stocks at beginning of year by sub-sector in industry sector
and region……………………………………………………………………..... 145
Table H.12: Value of stocks at beginning of year by sub-sector in industry sector
and region…………………………………………………………………….… 145
Table I.1: Value of stocks at end of year by agricultural sector and size ............................. 146
Table I.2: Value of stocks at end of year by Sub-sector in agricultural sector
and size of establishment ...................................................................................... 146
Table I.3: Value of stocks at end of year by sub-sector in agriculture sector and region ..... 147
Table J.1: Value of stocks at end of year by sub-sector in service sector ............................. 148
Table J.2: Value of stocks at end of year by sub-sector in service sector and
size of establishment ............................................................................................. 148
Table J.3: Value of stocks at end of year by sub-sector in service sector and region ........... 149
Table J.4: Value of stocks at end of year by sub-sector in service sector and region ........... 149
Table J.5: Value of stocks at end of year by sub-sector in service sector and region ........... 150
Table J.6: Value of stocks at end of year by sub-sector in service sector and region ........... 151
Table J.7: Value of stocks at end of year by sub-sector in service sector and region ........... 152
Table J.8: Value of stocks at end of year by sub-sector in service sector and region ........... 153
Table J.9: Value of stocks at end of year by sub-sector in service sector and region ........... 154
Table J.10: Value of stocks at end of year by sub-sector in service sector and region ........... 155
Table J.11: Value of stocks at end of year by sub-sector in service sector and region ........... 156

ix
Table J.12: Value of stocks at end of year by sub-sector in service sector and region ........... 157
Table K.1: Value of stocks at beginning of year by sub-sector in service sector ................... 158
Table K.2: Value of stocks at beginning of year by size of businesses in the service
sector ..................................................................................................................... 159
Table K.3: Value of stocks at beginning of year by sub-sector in service setor and
region .................................................................................................................... 159
Table K.4: Value of stocks at beginning of year by sub-sector in service sector and
region .................................................................................................................... 160
Table K.5: Value of stocks at beginning of year by sub-sector in service sector and
region .................................................................................................................... 161
Table K.6: Value of stocks at beginning of year by sub-sector in service sector and
region .................................................................................................................... 162
Table K.7: Value of stocks at beginning of year by sub-sector in service
sector and region ................................................................................................... 163
Table K.8: Value of stocks at beginning of year by sub-sector in service sector and
region .................................................................................................................... 164
Table K.9: Value of stocks at beginning of year by sub-sector in service sector and
region………………………………………………………………………….... 165
Table K.10: Value of stocks at beginning of year by sub-sector in service sector and
region…………………………………………………………………………… 166
Table K.11: Value of stocks at beginning of year by sub-sector in service sector and
region …………………………………………………………………………...167
Table K.12: Value of stocks at beginning of year by sub-sector in service sector and
region .................................................................................................................... 168
Table L.1: Receipts by sub-sector in industry sector ............................................................. 169
Table L.2: Receipts by firm sizes in the industry sector ........................................................ 169
Table L.3: Receipts by sub-sector in industry sector and region ........................................... 170
Table L.4: Receipts by subsector in industry sector ............................................................... 170
Table L.5: Receipts by sub-sector in industry sector and region ........................................... 171
Table L.6: Receipts by sub-sector in industry sector and region ........................................... 171
Table L.7: Receipts by sub-sector in industry sector and region ........................................... 172
Table L.8: Receipts by sub-sector in industry sector and region ........................................... 172
Table L.9: Receipts by sub-sector in industry sector and region ........................................... 173
Table L.10: Receipts by sub-sector in industry sector and region ........................................... 173
Table L.11: Receipts by sub-sector in industry sector and region ........................................... 174
Table L.12: Receipts by sub-sector in industry sector and region ........................................... 174
Table M.1: Receipts by sub-sector in agriculture sector and size of establishment ................ 175
Table M.2: Receipts in agriculture sector and region ............................................................. 176
Table M.3: Receipts by sub-sector in service sector ............................................................... 177
Table M.4: Receipts by size of business in service sector ...................................................... 178
Table M.5: Receipts by sub-sector in service sector and region ............................................. 178
Table M.6: Receipts by sub-sector in service sector and region ............................................. 179

x
Table M.7: Receipts by sub-sector in service sector and region ............................................. 180
Table M.8: Receipts by sub-sector in service sector and region ............................................. 181
Table M.9: Receipts by sub-sector in service sector and region ............................................. 182
Table M.10: Receipts by sub-sector in service sector and region ............................................. 183
Table M.11: Receipts by sub-sector in service sector and region ............................................. 184
Table M.12: Receipts by sub-sector in service sector and region ............................................. 185
Table M.13: Receipts by sub-sector in service sector and region ............................................. 186
Table M.14: Receipts by sub-sector in service sector and region ............................................. 187
Table N.1: Value of fixed asset at the end of year by sub-sector in all the sectors ................ 188
Table N.2: Value of fixed asset at the end of year by size of businesses in all the sectors .... 189
Table N.3: Value of fixed asset at the end of year by sub-sector in all the sectors and
region ……………………………………………………………………………190
Table N.4: Value of fixed asset at the end of year by sub-sector in all the sectors and
region ……………………………………………………………………………191
Table N.5: Value of fixed asset at the end of year by sub-sector in all the sectors and
region ……………………………………………………………………………192
Table N.6: Value of fixed asset at the end of year by sub-sector in all the sectors and
region ……………………………………………………………………………193
Table N.7: Value of fixed asset at the end of year by sub-sector in all the sectors and
region …………………………………………………………………………....194
Table N.8: Value of fixed asset at the end of year by sub-sector in all the sectors and
region ……………………………………………………………………………195
Table N.9: Value of fixed asset at the end of year by sub-sector in all the sectors and
region ……………………………………………………………………………196
Table N.10: Value of fixed asset at the end of year by sub-sector in all the sectors and
region…………………………………………………………………………….197
Table N.11: Value of fixed asset at the end of year by sub-sector in all the sectors and
region …………………………………………………………………………...198
Table N.12: Value of fixed asset at the end of year by sub-sector in all the sectors and
region …………………………………………………………………………....199
Table O.1: Disposal of fixed asset by sub-sector in all the sectors ........................................ 200
Table O.2: Disposal of fixed asset by size of businesses in all the sectors ............................ 201
Table O.3: Disposal of fixed asset by sub-sector in all the sectors and region ...................... 202
Table O.4: Disposal of fixed asset by sub-sector in all the sectors and region ...................... 203
Table O.5: Disposal of fixed asset by sub-sector in all the sectors and region ...................... 204
Table O.6: Disposal of fixed asset by sub-sector in all the sectors and region ...................... 205
Table O.7: Disposal of fixed asset by sub-sector in all the sectors and region ...................... 206
Table O.8: Disposal of fixed asset by sub-sector in all the sectors and region ...................... 207
Table O.9: Disposal of fixed asset by sub-sector in all the Sectors and Region .................... 208
Table O.10: Disposal of fixed asset by sub-sector in all the sectors and region ....................... 209
Table O.11: Disposal of fixed asset by sub-sector in all the sectors and region ....................... 210
Table O.12: Disposal of fixed asset by sub-sector in all the sectors and region ....................... 211

xi
Table P.1: Depreciation of fixed asset by sub-sector in all the sectors .................................. 212
Table P.2: Depreciation of fixed asset by size of businesses in all the sectors ...................... 213
Table Q.1: Gross additions to fixed asset (purchases of fixed assets) by sub-sector
in all the sectors .................................................................................................... 214
Table Q.2: Gross additions (purchases) to fixed asset by size of businesses in all the
sectors …………………………………………………………………………...215
Table Q.3: Gross additions (purchases) to fixed asset by sub-sector in all the sectors
and region.............................................................................................................. 216
Table Q.4: Gross additions (purchases) to fixed asset by sub-sector in all the sectors
and region.............................................................................................................. 217
Table Q.5: Gross additions (purchases) to fixed asset by sub-sector in all the sectors
and region.............................................................................................................. 218
Table Q.6: Gross additions (purchases) to fixed asset by sub-sector in all the sectors
and region.............................................................................................................. 219
Table Q.7: Gross additions (purchases) to fixed asset by sub-sector in all the sectors
and region.............................................................................................................. 220
Table Q.8: Gross additions (purchases) to fixed asset by sub-sector in all the sectors
and region.............................................................................................................. 221
Table Q.9: Gross additions (purchases) to fixed asset by sub-sector in all the sectors
and region.............................................................................................................. 222
Table Q.10: Gross additions (purchases) to fixed asset by sub-sector in all the sectors
and region.............................................................................................................. 223
Table Q.11: Gross additions (purchases) to fixed asset by sub-sector in all the sectors
and region............................................................................................................. 224
Table Q.12: Gross additions (purchases) to fixed asset by sub-sector in all the sectors
and region.............................................................................................................. 225

xii
FIGURES
Figure 3.1: Revenue by sector ................................................................................................... 12
Figure 3.2: Distribution of Receipts by Sector (%) ................................................................... 20
Figure 3.3: Distribution of major sources of receipts in the Service sector ............................... 25
Figure 3.4: Type of asset purchased (GH¢’000) ......................................................................... 30
Figure 3.5: Value of fixed assets (GH¢) .................................................................................... 31
Figure 3.6: Type of asset (GH¢’000) ......................................................................................... 31
Figure 3.7: Disposal of assets .................................................................................................... 34
Figure 3.8: Type of assets disposed ........................................................................................... 35
Figure 3.9: Distribution of depreciation by type of fixed asset ................................................. 36
Figure 3.10: Distribution of depreciation by type of fixed asset in the Agriculture sector ......... 37
Figure 3.11: Distribution of depreciation by type of fixed asset in the Industry sector .............. 37
Figure 3.12: Distribution of depreciation by type of fixed asset in the Service sector ................ 38
Figure 3.13: Persons engaged in establishments by sector .......................................................... 47
Figure 3.14: Compensation (GH¢’000) of employees by type of compensation ........................ 51
Figure 3.15: Compensation (GH¢’000) of employees by sector and type of
compensation ........................................................................................................... 52
Figure 4.1: Establishments, employees and persons engaged by all industry for
2003 and 2013 .......................................................................................................... 57
Figure 4.2: Wages and salaries for all industry in 2003 and 2013 ............................................. 57

xiii
LIST OF ACRONYMS
AGI Association of Ghana Industries
CPC Central Product Code
CSPro Census and Survey Processing System
UK-DFID United Kingdom Department for International Development
GDP Gross Domestic Product
GEA Ghana Employers Association
GNCCI Ghana National Chamber of Commerce and Industry
GO Gross Output
GSDP Ghana Statistical Development Programme
GSS Ghana Statistical Service
GTB Ghana Tourist Board
GVA Gross Value Added
IBES Integrated Business Establishment Survey
ISIC International Standard Industrial Classification
ISSER Institute of Statistical, Social and Economic Research
MoF Ministry of Finance
MoTI Ministry of Trade and Industry
MWRWH Ministry of Water Resources, Works and Housing
NBSSI National Board for Small Scale Industries
NCA National Communications Authority
NDPC National Development Planning Commission
NIC National Insurance Commission
NSC National Steering Committee
PEF Private Enterprise Federation
PIT Project Implementation Team

xiv
PNDC Provisional National Defense Council
PPP Public-Private Partnership
RS Regional Statistician
SDGs Sustainable Development Goals
TAC Technical Advisory Committee
TPE Total Persons Engaged

xv
EXECUTIVE SUMMARY
Background
The Integrated Business Establishment Survey (IBES) is an economic census conducted on the
full set of economic units across all sectors of the Ghanaian economy. It was conducted to
provide reliable, timely and relevant economic statistics to support the formulation and
implementation of policies and strategies that can stimulate the growth of all sectors of the
economy. The IBES is the first economic census in Ghana which provides information on the
structure and performance of all the sectors of the economy in addition to regional comparisons.
The report summarizes the findings of the second phase of the IBES (IBES II) which was
conducted in 2015 with 2013 as the reference period.
Response rate
IBES II recorded a response rate of 78.2 percent. This implies that, out of the total sample of
31,152 establishments that was surveyed, as many as 24,400 agreed to be part of the survey.
Revenue, cost of production of goods and services, and gross profit of businesses
The total amount of revenue generated by the three sectors is GH¢457 billion. Much of the
revenue (GH¢318.4 billion representing 69.7 percent) was generated by the Services sector. The
Industry sector generated GH¢133.1 billion which is 29.1 percent of total revenue while revenue
from Institutional Agriculture is GH¢5.4 billion, representing 1.2 percent. The services sector
accounts for 70 percent of the total gross profit generated by non-household businesses in the
country. However, gross profit margin among the three sectors is relatively close ranging
between 62 and 66.
With respect to size, 32.1 percent of the total revenue (GH¢146.6 billion) was earned by the
small-sized establishments and more than one-quarter (29%) of the total revenue, amounting to
GH¢132.4 billion was generated by the large-sized establishments. The least revenue (GH¢80.9
billion) was earned by the micro-sized establishments.
The total annual production cost of goods and services for all sectors amounted to GH¢167.5
billion. Out of this, 58.3 percent was for materials and supplies, 25.4 percent for other operating
expenses, 8.0 percent for goods purchased for resale and 6.0 percent for fuel purchased. The
remaining 2.1 percent was for electricity, water and other purchases made.
The Service sector incurred the highest costs of production, accounting for a little over three-
quarters (GH¢127.1 billion) of the total cost followed by the Industry sector which incurred
about one-fifth (22.6%) of the total cost.
The production cost of large-sized establishments was the highest: this accounted 27.5 percent of
the total cost.
Capital formation
The data generated from the survey suggest that the estimated stock of assets as at the end of the
reference period was GH¢172.9 billion. The Industry sector’s total asset is GH¢107.8 billion,
which constitutes 62 percent of the total assets. In terms of regional contribution to total assets,

xvi
establishments located in the Greater Accra region held majority of the assets amounting to
GH¢140.3 billion, which translates to 81.1 percent of the total assets.
There was a total of GH¢30.1 billion addition of assets to already existing assets, 99 percent of
which are tangible assets, whereas a total of GH¢20.2 billion worth of assets were disposed. The
Greater Accra region’s additions to fixed assets was 88.7 percent of total additions as compared
to the other regions. Most assets that were purchased by establishments were machinery and
equipment (GH¢16.8 billion) out of the total of GH¢30.1 billion purchased assets.
Inventories/stocks
Total value of inventory for all establishments is GH¢37.4 billion of which GH¢18.7 billion,
representing 49.9 percent was in the Services sector. About GH¢18.6 billion, representing 49.7
percent, is found in the Industry sector and the remaining GH¢118.1 million, representing less
than one percent is in the Agriculture sector (Institutional Agriculture).
The Industry sectors reported on all the types of stock while the Agriculture and the Service
sectors did not keep stocks for fuel, finished goods and work in progress. The Service sector had
more than half of its stocks as raw materials and supplies (GH¢12.9 billion), representing 56
percent of all the stocks while industry accounts for 44 percent.
Employment and compensation of employees
A total of 3,102,917 persons were engaged by establishments of which 74.6 percent (2,314,309
persons) were engaged by the Services sector, 23.7 percent (734,341 persons) by Industry and
1.7 percent (54,267 persons) by Institutional Agriculture sector. Of the total persons engaged,
58.8 percent (1,823,070 persons) were employees.
A vast majority (94.3%) of the Institutional Agricultural workers (54,267 persons) were engaged
by the Crop and animal production, hunting and related service activities sub-sector. Also, 77.7
percent (570,327 persons) of persons engaged by the Industry sector worked in the
Manufacturing sub-sector. Within the Services sector, about one-third (33.6%) of persons
engaged, were found in the wholesale and retail trade sub-sector.
Small-sized and micro-sized establishments together, engaged 71.4 percent of the total
workforce while the large-sized establishments engaged 16.6 percent. Generally, relatively high
proportions of employees worked in large-sized establishments. Of the 3,102,917 persons
engaged, 1,115,768 representing 36 percent worked in establishments located in the Greater
Accra region, 16.9 percent in the Ashanti region while 10.3 percent worked in establishments
located in the Western region.
Total compensation paid to employees amounted to GH¢30.4 billion. Wages and salaries paid to
employees was about GH¢28.7 billion, representing 94.4 percent of total compensation to
employees. Overall, about GH¢1.0 billion was paid by employers to their employees as social
security contributions, which formed 3.4 percent of the total compensation to employees. Other
supplements to wages such as end of year bonuses, personal insurance, medical schemes, etc.
amounted to about GH¢666.6 million which is 2.2 percent of the total compensation to
employees.

xvii
As much as GH¢17.1 billion, representing 60.1 percent of total wages and salaries was paid to
employees in the Services sector and about two-fifth (39.3%) of total wages and salaries, was
paid to those who worked in the Industry sector. More than 60 percent of total wages and salaries
were received by employees who worked in large-sized establishments.
As much as 45.9 percent of all wages and salaries was paid to employees in the Greater Accra
region, 37.1 percent paid to employees in the Western region, while only 6.2 percent (GH¢1.8
billion) was paid to employees in the Ashanti region.
Comparative Analysis of a Decade of Industry Sector Performance
Over the last decade, the total number of establishments in the sector more than quadrupled and
this growth was largely driven by the manufacturing sub-sector. While the total number of
persons engaged more than tripled, there was not a corresponding growth in the number of
employees in the sector over the 10-year period. This brings to question the quality of growth in
the number of establishments in the Industry sector that was recorded during the period. Thus,
many of the new establishments in the sector may not be employing many people either because
they are micro or small-sized firms.
Wages and salaries on the other hand grew by 1886 percent in dollar terms. However, total
turnover grew by 838.6 percent while direct material cost of production grew by 951.7 percent.
The relative increase in wages, accompanied by hikes in operational cost of production over the
ten years, juxtaposed with relatively moderate growth in turnover, could explain the stagnating
performance of the Industry sector over the ten-year period.

1
CHAPTER ONE
BACKGROUND
1.1 Introduction
The Integrated Business Establishment Survey (IBES) is an economic census conducted on the
full set of economic units across all sectors of the Ghanaian economy. It is structured into two
phases. Phase I provided the framework for the implementation of the second phase which
involved the collection of detailed information on the operations of business establishments.
Since 1962, a number of nationwide firm-level censuses have been conducted to provide some
intuition into the performance of the industry sector in the country. These surveys, however,
have not provided information on changes in the structure of the entire economy but only the
industry sector over time. The IBES which is the first economic census in Ghana provides
information on the structure and performance of all sectors of the economy. Such economic data
and other data sources are required to monitor the achievements of Ghana’s Shared Growth and
Development Agenda (GSGDA), the AU Agenda 2063 and the Sustainable Development Goals
(SDGs). This report summarizes the findings of IBES II which was conducted in 2015. The
reference period for the survey is 2013.The report presents findings at the sector and sub-sector
levels, in all the relevant subject matter areas including employment, compensation of
employees, receipts and revenues of businesses in Ghana, as well as cost incurred by firms
during the production of goods and services. The report also provides critical economic
indicators to inform the size of the economy. The contribution of each of the regions and
businesses, categorized by size, to the economy and other critical variables have also been
examined to bring to the fore the role of the different actors in the determination of value
addition to the economy.
1.2 Economic censuses and surveys in Ghana
The first Industrial Census in Ghana was conducted in 1962 by the Central Bureau of Statistics,
now the Ghana Statistical Service. The census was an enumeration of all establishments in the
Mining and Quarrying, Manufacturing, Construction, Electricity and Distributive Trade sub-
sectors. In 1964, annual and quarterly surveys of establishments engaging 30 or more persons
were introduced.
The second Industrial Census was carried out in 1987 and was implemented in two phases: the
first phase covered the period November-December 1987 and the second took place in October-
December 1988, with 1987 as the reference year. The first phase of the census aimed at obtaining
basic information on the establishments engaged in Mining and Quarrying, Manufacturing and
the Production and Distribution of Electricity and Water, while the second phase covered all in-
scope establishments engaging 10 or more persons.
The third Industrial Census, which was conducted in 2003, was also in two phases: the first
phase was held from October to November, 2003 and the second covered the period November
2004-March 2005, with 2003 as the reference year. The first phase of the census collected basic
information on the establishments engaged in Mining and Quarrying, Manufacturing,
Construction and the Production and Distribution of Electricity, Gas and Water. The second

2
phase covered a certainty sample of 4,900 establishments comprising of all Manufacturing
establishments engaging more than 10 persons, all establishments engaged in Mining and
Quarrying, Electricity and Water and Construction, and an uncertainty sample of 1,120
establishments which was a 5 percent sample of Manufacturing establishments engaging less
than 10 persons.
A total of 31,152 establishments were sampled for phase II of Integrated Business Establishment
Survey (IBES), with 6,014 establishments sampled with certainty for all the sectors.
1.3 Objectives of the census
The overall objective of the IBES was to provide reliable, timely and relevant economic statistics
to support the formulation and implementation of policies and strategies to stimulate growth in
all sectors of the economy. The specific objectives were to:
Obtain data on production as a basis for government and business analysis and decision-
making;
Measure the contribution of each sector and region to Ghana’s production;
Provide benchmark data for rebasing, revising and updating the GDP, GSS annual
surveys of Industry and other economic series; and
Provide the critical data needed to estimate and re-base the gross value added for all
sectors in the Ghanaian economy.
1.4 Scope and coverage
Phase II of IBES covered a representative sample of establishments covering the different
economic sectors namely Agriculture, Industry and Services at both national and regional
levels. All establishments engaging 50 or more persons were included in the sample with
certainty. However, for establishments engaging less than 50 persons a representative
sample was drawn to be included in the sample.
The target population in this survey was all non-household establishments, irrespective of
size and sector of activity. These are establishments that are engaged in economic activities
across all the sectors of the economy. They were sampled from the sampling frame
produced from IBES I.
1.5 Reference year
The reference year was the calendar year 2013. However, reporting on a fiscal year was
accepted provided the fiscal year included at least six months of the 2013 calendar year.
1.6 Legislation and Confidentiality
The census was conducted under the Statistical Service Law, 1985 (PNDC Law 135), which
empowers the Government Statistician to conduct the economic census and allows entry into
premises of businesses to ask questions. All census information were kept confidential in
accordance with the law and all census officers took an oath of secrecy prior to data collection.
3
1.7 Institutional Arrangements
The GSS was the lead implementing institution. To ensure wider participation and collaboration
of relevant stakeholders with rich and varied experiences, a number of national committees were
set up to facilitate the smooth implementation of the IBES. A National Steering Committee
(NSC) was formed and was chaired by the Minister of Trade and Industry. Other members were
the Government Statistician and two other senior officers from Ghana Statistical Service (GSS),
the Minister for Finance, Minister for Food and Agriculture, representatives of the National
Board for Small Scale Industries (NBSSI), Association of Ghana Industries (AGI), Development
Partners, Ministry of Finance (MoF), the Institute of Statistical, Social and Economic Research
(ISSER) and the National Development Planning Commission (NDPC).
A Technical Advisory Committee (TAC), chaired by the Government Statistician was also set up
with membership from the Ministry of Trade and Industry (MoTI), the Ministry of Water
Resources, Works and Housing (MWRWH), Ministry of Road Transport, Ministry of Food and
Agriculture, Ghana Employers Association (GEA), Ghana National Chamber of Commerce and
Industry (GNCCI), Association of Ghana Industries (AGI), National Insurance Commission
(NIC), Private Enterprise Federation (PEF), Minerals Commission, Ghana Tourist Board (GTB),
National Communications Authority (NCA) as well as a Representative of Development
Partners.
Finally, a Project Implementation Team (PIT) was set up in GSS and was responsible for the
technical preparation and execution of the census, with a Project Secretariat that provided
logistical support to the three national committees.
1.8 Funding
IBES II was jointly funded by the Government of Ghana and the Ghana Statistics Development
Project (GSDP), the funds of which were provided by the Governments of Ghana, United
Kingdom and the Netherlands, and managed by the World Bank.
1.9 Organization of the Report
The report is organized into five chapters. Chapter one, the introduction, provides a background
to the project. In chapter two, the survey methodology is outlined including the survey design,
sampling techniques and procedures. Chapter three discusses key findings of the survey and
provides analysis for key economic indicators while chapters four and five provide the
conclusions and recommendations, respectively.

4
CHAPTER TWO
METHODOLOGY
2.1 Introduction
This chapter discusses the major steps in conducting Phase II of the Integrated Business
Establishment Survey (IBES II). It introduces the source material or list from which respondents
of the target population was drawn, the number of establishments surveyed, how they were
contacted, and the method of data collection for this nationally representative sample survey.
2.2 Phase II methodology
2.2.1 Planning and preparation
Since this is the first time an economic census has been conducted in Ghana, the planning and
preparatory activities started with a conceptualization of the process, and undertaking of
advocacy among the stakeholders to solicit ideas and build support for the project. The
conceptualization of IBES started in 2011, while preparatory activities for the implementation of
IBES Phase II started in 2015.
The preparatory activities started with the setting up of three major committees to oversee the
implementation of the project. These committees were: the National Steering Committee, the
Technical Advisory Committee and the Project Implementation Committee.
During the launch of the IBES Phase I reports in Accra in June, 2015, stakeholders and the
business community were sensitized on the data collection requirements. This was necessary to
enable respondents give enumerators the required cooperation during fieldwork. This
cooperation is critical to the success of the IBES Phase II.
2.2.2 Principal survey documents
Survey questionnaire
IBES Phase II questionnaire design began in 2014. It was based on the structure of the 2003
Industrial Census Phase II questionnaire with some modifications to cater for establishments in
agriculture and service sectors other than industry. Survey instruments were drafted and a review
workshop was organized to finalize the survey instruments to pave way for the field work. The
data items covered by the final questionnaire comprised:
Name of the establishment;
Physical location;
Contact information (postal address, email address, website address, phone
number);
Form of organization;
Type of legal organization;
Type of ownership;
5
Employment and Earnings;
Wages and salaries;
Supplements to wages and salaries;
Stocks;
Value of fixed assets;
Quantity and cost of principal materials purchased;
Fuel purchased;
Purchases of inputs and material supplies;
Other operating costs;
Sales and other receipts; and
Other income.
Enumerator’s manual
A field instruction manual for field personnel was prepared alongside the questionnaires. The
manual which provided instructions on the administration of the questionnaires aimed at
ensuring consistent application of concepts and procedures throughout the IBES.
Tabulation Plan
Table summaries of data needs were prepared alongside the questionnaire design. Dummy tables
were then generated based on the tabulation plan.
2.2.3 Sampling design
The sampling frame for IBES Phase II was derived from the economic census conducted during
IBES Phase I, which provided the Business Register of all non-household establishments. The
Business Register database contained a total of 638,480 non-household business establishments
in all economic sectors. A sample of 31,152 establishments was selected from the business
register representing about five percent of the total number of business establishments. This
included 6,014 establishments with 50 or more persons engaged which were selected with
certainty.
One of the most important aspects of the sample design for IBES II is the stratification of the
sampling frame by economic activities and size. Generally, stratification was done along the
activity groups and size classification. For some establishments, the smallest size category was 1
to 4 persons engaged. However, since about one-third of the establishments had only one person
engaged, and such establishments have a smaller average contribution to the total economic
activities, it was decided to treat this category as a separate stratum. Activities of extraterritorial
organizations and bodies were excluded since these establishments are funded by other countries
and obtaining financial information was going to be difficult. One hundred and one (101)
important economic activity domains were identified, which were mostly defined at the two-digit
ISIC level, and in a few cases at the 3-digit ISIC level. There were only 14 establishments in the
Phase I frame which had activities relating to households as employers of domestic personnel
6
and undifferentiated goods-producing activities of private houses. These establishments were
combined with the economic activity domain “Other personal services activities”.
2.2.4 Strategy for determining the sample size and allocation by stratum
The sample size for the IBES Phase II was determined by the accuracy required for the survey
estimates for each domain, as well as by resource and operational constraints. The accuracy of
the survey results depends on both the sampling error, which can be measured through variance
estimation, and the non-sampling error, which can only be reduced with appropriate operational
and quality control procedures. By ensuring an efficient stratification and strategic allocation of
the sample establishments by stratum, it was possible to obtain a sufficient level of precision by
domain with less than the maximum sample size of 40,000 establishments.
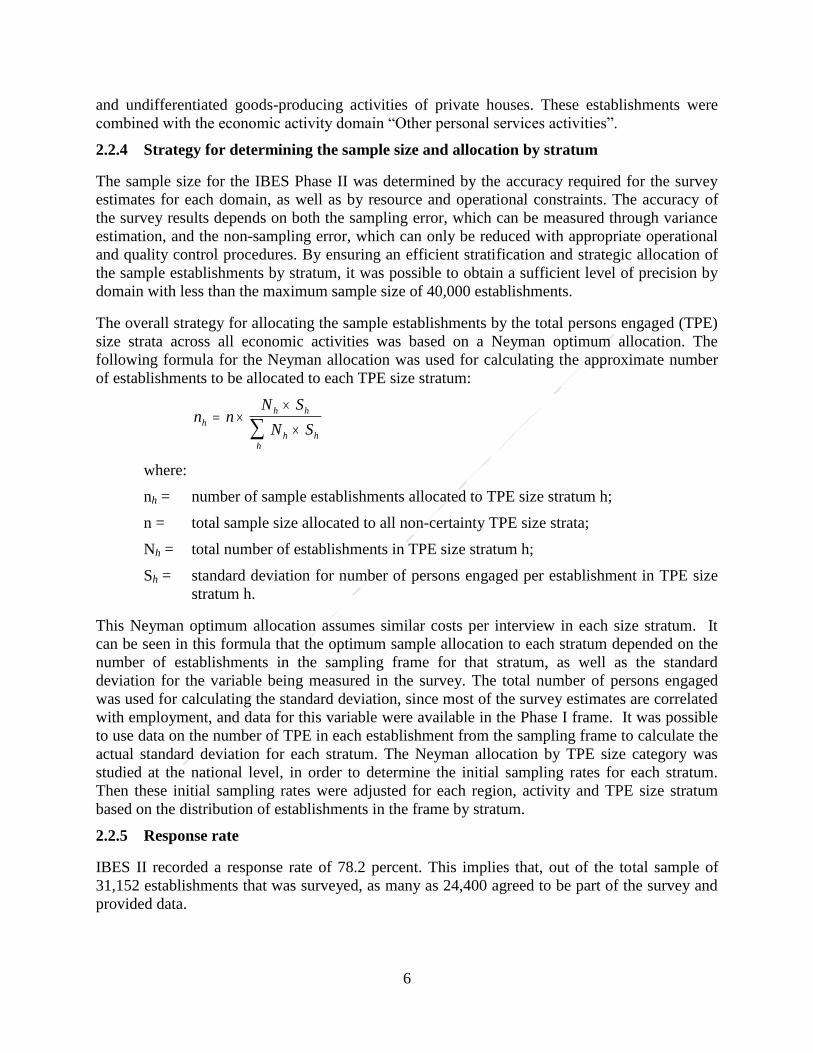
The overall strategy for allocating the sample establishments by the total persons engaged (TPE)
size strata across all economic activities was based on a Neyman optimum allocation. The
following formula for the Neyman allocation was used for calculating the approximate number
of establishments to be allocated to each TPE size stratum:
n nN S
N Sh
h h
h hh
where:
nh = number of sample establishments allocated to TPE size stratum h;
n = total sample size allocated to all non-certainty TPE size strata;
Nh = total number of establishments in TPE size stratum h;
Sh = standard deviation for number of persons engaged per establishment in TPE size
stratum h.
This Neyman optimum allocation assumes similar costs per interview in each size stratum. It
can be seen in this formula that the optimum sample allocation to each stratum depended on the
number of establishments in the sampling frame for that stratum, as well as the standard
deviation for the variable being measured in the survey. The total number of persons engaged
was used for calculating the standard deviation, since most of the survey estimates are correlated
with employment, and data for this variable were available in the Phase I frame. It was possible
to use data on the number of TPE in each establishment from the sampling frame to calculate the
actual standard deviation for each stratum. The Neyman allocation by TPE size category was
studied at the national level, in order to determine the initial sampling rates for each stratum.
Then these initial sampling rates were adjusted for each region, activity and TPE size stratum
based on the distribution of establishments in the frame by stratum.
2.2.5 Response rate
IBES II recorded a response rate of 78.2 percent. This implies that, out of the total sample of
31,152 establishments that was surveyed, as many as 24,400 agreed to be part of the survey and
provided data.

7
2.2.6 Pre-test
The survey instruments were pre-tested in the Central and Greater Accra regions in August,
2015. Based on the results of the pre-test, corrections were made to the IBES II questionnaires.
In addition, the completed questionnaires were edited, coded and sent to the data processing unit
of the GSS to test the data processing procedures.
2.2.7 Preparation for fieldwork
Recruitment
Advertisements were placed in both the print and electronic media for interested applicants to
apply to be recruited for the field work. An application form was also posted on the GSS website
for interested applicants to download and apply. Interviews were conducted in the regions, after
which about 2,000 field personnel were recruited for training for the fieldwork.
Training of Trainers
A Training of Trainers workshop was held in Winneba in September, 2015. A group of trainers
consisting of officers from the ten (10) regional offices of GSS and PIT members were trained.
The Trainers were trained on the nine (9) questionnaires and also assisted with the review of the
questionnaires.
Training
The main training for field personnel started from October 17 to November 8, 2015 in all the
regional capitals. Field personnel were trained on the survey instruments, the purpose and
background of the IBES to aid effective data collection. These survey instruments included the
nine questionnaires, interviewer’s manual and training guide. Lectures were supplemented with
practical sessions, demonstrations and participants’ involvement in mock interviews. Trainees
who passed the written exams, and who also performed satisfactorily during field practice were
selected to take part in the field data collection. Training of interviewers and supervisors was
carried out by the Project Implementation Team (PIT) members and other GSS staff. The PIT
members were mainly economist and statisticians, with substantial experience and knowledge in
survey and censuses, as well as business accounting concepts.
Publicity
In order to inform the public and the selected establishments about the IBES Phase II, a publicity
programme was drawn up. A 60-second audio clip, was produced and aired in five Ghanaian
languages on radio stations. In addition to the use of radio and TV, T-shirts were provided to
field personnel to serve a two-fold purpose: first, to publicise the IBES and second, to serve as a
form of identification for the field staff.
2.2.8 Field operations
Field data collection
Fieldwork for the IBES Phase II started on November 11, 2015 and ended on April 28, 2016.
About 1,800 field workers made up of enumerators, supervisors, zonal coordinators, regional
monitors (Regional Statisticians), and other field support staff were deployed to implement the
data collection from all the sampled establishments throughout the country. The work of the
8
enumerators was closely supervised by field supervisors and zonal coordinators. The reference
period for data collection was 2013.
As part of efforts to achieve the desired objectives of the IBES Phase II and for purposes of data
quality assurance, a nationwide monitoring of the data collection exercise was carried out. The
Project Implementation Team (PIT) was deployed to visit field staff to find out whether they
were completing the questionnaires correctly based on the training provided and to ascertain the
quality of the data being collected. The field monitors also used the opportunity to interact with
the field teams and the RSs to resolve any issues they had regarding the administration of any of
the survey instruments. Problems that were identified in one region were addressed during the
monitoring exercise where necessary, collated and passed on to the other regions for their
guidance.
Additionally, a critical assignment of the monitoring team was to solve all outstanding
challenges regarding respondents’ refusals to participate in the survey and this facilitated smooth
data collection. These, collectively, resulted in the high response rate recorded in the exercise.
Field editing
Editing is an essential feature of fieldwork. Supervisors edited the completed questionnaires,
correcting any errors that were detected. Supervisors also checked the completed questionnaires
for completeness, consistency as well as accuracy before they were sent to the zonal
coordinators. The zonal coordinators rechecked and sent the completed questionnaires to the
regional offices.
2.2.9 Data processing
Data processing involved data capture, verification, editing, and coding of completed
questionnaires and generation of tables.
Office editing coding
The purpose of the office editing was to check the questionnaires for completeness, accuracy,
and consistency before the data were captured. Editors checked the correctness of an
establishment’s information and principal activity to ensure that the "Persons Engaged" data
were accurate. They also assigned codes to products and principal activities, checked employees
and wage and salaries data, output and input values, stocks and delivery cost.
Challenges were mostly associated with coding of products and materials where the items were
described incorrectly, and the computation of depreciation of fixed assets and inconsistent data
on stock. Other challenges included the fact that some employees had no corresponding wages
and salaries or vice versa; value of inputs being greater than output value, output values too high
compared to inputs and total delivered cost given without quantity and average unit prices; and
no stock for some of the micro and small establishments. Respondents were contacted for
clarification and the questionnaires subsequently corrected before data entry.

9
Data capturing and verification
Data were captured by data entry personnel in the Head office. The Census and Survey
Processing System (CSPro) software version 6.2 was used to capture the data, after editing teams
had checked for consistency of questionnaires. An error-checking program was run through data
capturing to correct data entry errors. Establishment data was verified by double data entry, after
which the files were listed for checking. Verification was done, and records with errors were
amended and listed again for further checking.
Data cleaning
Cleaning of the data is important since errors can occur during data collection, data entry, or editing.
For this reason, there was the need to clean the errors which were likely events. When errors were
statistically identified, the cleaning team referred the questionnaires involved for verification, after
which calls were made to the establishments, if necessary for clarification and if possible correction.
In very rare cases, imputations were done when it became obvious that there is an error, but the two
processes adduced above failed.
Cleaning of the data was done independently for each of the nine questionnaires since the
instruments had different structures. However, the same principles were applied to all the
instruments. Cleaning was done at both micro and macro levels, with a team from the Norwegian
Statistical Office providing technical support. The micro level cleaning which involved cleaning at
the establishment level preceded the macro level cleaning that involved cleaning based on
consistencies in the aggregated data, which were mostly in the tables.
During the micro level cleaning statistical tools such as confidence intervals, ratios, mean, and
median among others were employed to avoid bias based on judgement. This was done to ensure that
the data were to a large extent consistent with statistics within the stratum in which the
establishments belonged, as each establishment was stratified during the cleaning into homogenous
groupings based on the size of the establishment, the region, and the activity classified by ISIC.
While at the macro level cleaning, inconsistencies in the tables generated led to a re-visit of the micro
data to verify the error, and possibly employ the necessary procedures as spelt out above, to correct
them.
Tabulation and publication
Stata software Version 12 was used to produce the working tables for tabulation review after the data files were merged. For the review, averages of variables as well as key ratios were calculated
and listed for each of the sectors and sub-sectors. Establishments with outliers were singled out for
further review. The errors detected were corrected. The correction involved adjusting values of some
establishments or field referrals for further investigation.
Original establishment weights were adjusted using information on the status of record for
each establishment covered. The adjusted weights were appended to the establishment records and
final tables prepared for report writing and publication.
The IBES establishment list output tables were reviewed to ensure that majority of the large
establishments were covered. The review process took longer than planned due to late responses from some establishments. The tables were reviewed to check for coherence and consistency.
After the data processing and queries as well as inconsistencies had been resolved, the data were
released for analysis and publication.

10
CHAPTER THREE
SURVEY RESULTS
3.1 Introduction
The economy of Ghana, typically made up of three broad sectors namely, agriculture, industry,
and services, has undergone several structural and policy changes since independence. From
independence in 1957, the country experienced about two decades of political instability
characterized by military coups and counter-coups, the last of which occurred in 1981. During
this period, there was a general decline in the economy which was quite buoyant at the time of
independence. Major exports from Ghana are gold, diamonds and other metals, cocoa and wood
products, along with the export of non-traditional goods. The foreign exchange earned from the
export of these primary commodities could not offset imports leading to negative trade balance
for the country. However, since 2010, the country’s trade balance has improved with the
discovery of crude oil. The major imports, on the other hand, include transport and equipment,
machinery and equipment, and electrical and electronic equipment.
Following a rebasing of the economy in 2010, the Gross Domestic Product (GDP) of Ghana in
2006 was estimated at GH¢18,705 million with a per capita GDP of GH¢855.05. In 2011, Ghana
started exporting oil and the economy grew substantially, recording a high growth rate of about
15 percent. This growth was however not sustained as the growth of the economy declined to 7.3
percent in 2013. The 2013 real GDP amounted to GH¢32,332 million, which was slightly higher
than the 2012 real GDP outturn of GH¢30,099 million. The Agriculture Sector grew by 3.4
percent in 2013, compared with 9.1 percent growth of the Industry Sector and 9.2 percent for the
Service sector. The economy recorded an average growth rate of 9.6 percent between 2010 and
2013 (2010 GDP Bulletin, GSS).
Until 2010, Agriculture was considered the most important sector of the economy with regard to
its contribution to GDP and the share of the country’s labour force. Prior to the rebasing of the
economy, Agriculture employed about 65 percent of the labour force and contributed 48.8
percent to the GDP. After the rebasing in 2010, the Service sector overtook the Agriculture
sector regarding the contribution to GDP, but the latter still maintained the lead viz-a-viz its
share of the labour force it employs.
Results from the IBES II further confirms the structural dynamics of the Ghanaian economy as
the Service sector still dominates in many facets. The results as captured under the sections that
follow depict an economy with a buoyant Service sector, followed by the Industry sector.
3.2 Trading account of businesses
3.2.1 Introduction
This section examines trading accounts of businesses in the country for the 2013 financial year.
The accounts provide detailed information on revenue, cost of goods sold and gross profit of
businesses. Revenue in this survey varies from sector to sector depending on the activity level. In
large and medium-sized firms within Industry, receipts from the sale of goods purchased in same
condition were not included in the revenue but for every other firm it was included. Basically,

11
revenue is mainly made up of receipts from the main activity and other receipts as described in
Section 3.3.
Cost of goods sold in the accounts is made up of direct inputs or raw materials plus opening
stocks less closing stocks (change in stocks). The cost of goods sold does not include other
indirect expenses such as salaries, fuel, and electricity, among others. Thus, the total cost of
operation of businesses to a large extent may be higher than this.
In the accounts, gross profit is simply revenue less the cost of goods sold. This profit is important
because it reflects the core profitability of a firm before overhead costs, and illustrates the
financial success of a product or service.
3.2.2 Trading accounts of businesses by sector
Table 3.1 reveals that nationally, the Service sector has the highest gross profit (GH¢211,492.5
million) compared to the other two sectors combined (GH¢89,435.6 million). The gross profit
margin which is measured as gross profit divided by total revenue is relatively similar among the
three sectors ranging from 62 percent in the Agriculture sector to 66 percent in the Service
sector, with Industry recording 65 percent. Similar to the gross profit, the Service sector
(GH¢106,881.1million) had the highest cost of goods sold accounting for 68.5 percent of the
total cost of goods sold in the country.
Table 3.1: Distribution of revenue, cost of goods sold and gross profit by Sector
Sector
GH¢ million Gross profit
Margin by
sector (%) Revenue
Cost of goods
sold Gross Profit
All Sector 456,995.90 156,067.70 300,928.10 66
Agriculture (Institutional) 5,478.80 2,104.00 3,374.70 62
Industry 133,143.50 47,082.60 86,060.90 65
Services 318,373.60 106,881.10 211,492.50 66
3.2.2 Revenue from production of goods and services by Sector
Figure 3.1 shows the sectoral distribution of revenue from goods and services. The total amount
of revenue generated in the 2013 financial year for businesses in the country is GH¢457 billion.
A greater proportion of the revenue (GH¢318.4 billion representing 69.7 percent) was generated
by businesses in the Service sector. Businesses in the Industry sector generated GH¢133.1 billion
which is 29.1 percent of the total revenue while revenue generated by firms in the Institutional
Agriculture sector was GH¢5.48 billion, representing 1.2 percent.

12
Figure 3.1: Revenue by sector
Table 3.2 shows that a significant proportion of the revenue (GH¢5.4 billion, representing 94.2
percent) generated in Institutional Agriculture was from Crop and animal production, hunting
and related services activities. Out of the total revenue generated by the Industry sector, the
Construction sub-sector generated GH¢53.7 billion, representing 40.4 percent. About one-third
(33.8%) of Industry’s revenue came from the Manufacturing sub-sector. The Wholesale and
retail trade sub-sector was the major contributor to total revenue (GH¢175 billion, representing
55.0 %) for the Service sector followed by the Financial and insurance activities sub-sector
(28.5%).
In terms of cost of goods sold, out of the GH¢2,104 million spent in the production of
agricultural produce in the Agriculture sector, almost all (96.6%) was from Crop and animal
production, hunting and related services activities subsector. In the Industry sector however,
there is no dominant subsector as 54.2 percent and 35.6 percent could be attributed to
construction and manufacturing sub-sectors respectively. On the hand, as much as 87.9 percent
of total cost of goods sold in the Service sector was attributable to the Wholesale and retail trade
and repair of motor vehicles and motorcycles.
The share of gross profit among sub-sectors in the Agriculture and Industry sectors follow
similar patterns as for revenue and cost of goods sold. On the other hand, in the Service sector,
the Financial and insurance activities subsector whose share of total cost of goods sold is
relatively small (3.5%) compared to that of Wholesale and retail trade and repair of motor
vehicles and motorcycles, had the largest share (41.2%) of the total gross profit in the sector.
1.2%%
29.1%%
69.7%%
Agriculture
Industry
Services

13
Table 3.2: Distribution of revenue, cost of goods sold and gross profit by subsector
Sector
Revenue
(GH¢
million) Percent
Cost of
goods sold
(GH¢
million) Percent
Gross
profit
(GH¢
million) Percent
Agriculture (Institutional Agriculture) 5,479 100.0 2,104 100.0 3,375 100.0
Crop and animal production, hunting and
related service activities 5,163 94.2 2,038 96.9 3,124 92.6
Forestry and logging 9 0.2 3 0.1 6 0.2
Fishing and aquaculture 307 5.6 63 3.0 244 7.2
Industry 133,143 100 47,083 100 86,061 100
Mining and quarrying 26,588 20.0 3,069 6.5 23,519 27.3
Manufacturing 44,997 33.8 16,763 35.6 28,234 32.8
Electricity, gas, steam and air conditioning 6,651 5.0 1,623 3.4 5,029 5.8
Water supply; sewerage, waste management 1,131 0.8 116 0.2 1,016 1.2
Construction 53,776 40.4 25,512 54.2 28,264 32.8
Services 318,374 100.0 106,881 100.0 211,492 100.0
Wholesale and retail trade and repair of
motor vehicles and motorcycles 175,098 55.0 93,953 87.9 81,145 38.4
Transportation and storage 8,419 2.6 2,061 1.9 6,358 3.0
Accommodation and food service activities 8,017 2.5 2,387 2.2 5,630 2.7
Information and communication 9,129 2.9 431 0.4 8,698 4.1
Financial and insurance activities 90,796 28.5 3,739 3.5 87,058 41.2
Real estate activities 1,890 0.6 505 0.5 1,385 0.7
Professional, scientific and technical activities 2,354 0.7 383 0.4 1,971 0.9
Administrative and support service activities 1,416 0.4 158 0.1 1,258 0.6
Education 6,424 2.0 248 0.2 6,176 2.9
Human health and social work activities 6,033 1.9 1,423 1.3 4,611 2.2
Sports activities and amusement and recreation
activities 428 0.1 59 0.1 369 0.2
Other service activities 8,368 2.6 1,534 1.4 6,834 3.2
3.2.3 Regional distribution of revenue, cost of goods sold and gross profit
Table 3.3 shows the regional distribution of total revenue, cost of goods sold and gross profit.
Generally, the Greater Accra Region recorded the highest value than any other region. More than
two-thirds (68.3%) of the total revenue generated in all sectors was from the Greater Accra
region. Ashanti region recorded GH¢51.9 billion, representing 11.4 percent share of total
revenue from all sectors while Upper West region contributed the least (0.6%) to total revenue.
The three northern regions put together contributed less than 4 percent of total revenue generated
in the country.

14
Table 3.3: Distribution of revenue, cost of goods sold and gross profit by region
Region
Revenue
(GH¢ million) Percent
Cost of
goods sold
(GH¢ million) Percent
Gross profit
(GH¢ million) Percent
All Sectors 456,996 100.0 156,068 100.0 300,928 100.0 Western 33,873 7.4 9,985 6.4 23,889 7.9
Central 9,455 2.1 3,496 2.2 5,960 2.0
Greater Accra 311,965 68.3 98,248 63.0 213,716 71.0
Volta 5,477 1.2 2,678 1.7 2,799 0.9
Eastern 14,479 3.2 5,227 3.3 9,251 3.1
Ashanti 51,955 11.4 21,386 13.7 30,568 10.2
Brong Ahafo 11,839 2.6 5,568 3.6 6,271 2.1
Northern 10,557 2.3 6,516 4.2 4,041 1.3
Upper East 4,869 1.1 1,799 1.2 3,070 1.0
Upper West 2,527 0.6 1,165 0.7 1,362 0.5
3.2.4 Revenue, cost of goods sold and gross profit by size of establishment
With respect to size of establishment, 31.3 percent of the total revenue (GH¢146.5 billion) was
earned by the small-sized establishments while the micro-sized establishments generated the
least revenue (17.3 %).
An analysis of revenue generation within the sectors shows that the small-sized establishments
within Institutional agriculture contributed more than two-fifths (45.4%) of total revenue while
large-sized establishments contributed less than 10 percent. In the Industry sector, a total of
GH¢57.1 billion, representing 43.5 percent of total revenue was generated by the large-sized
establishments while GH¢43.6 billion, a about two-fifths (33.8%) of the revenue earned in this
sector was generated by the small-sized establishments. Within the Service sector, it is observed
that the micro and small-sized establishments contributed 24.2 percent and 31.1 percent
respectively, while the medium and large-sized establishments each contributed about one-fifth
of the sector’s revenue (Table 3.4).
With respect to cost of goods sold, the medium-sized Agricultural institutions account for close
to a half (49.7%) of the total in the sector. On the other hand, small sized establishments in the
Industry and Service sectors accounted for 41.9 percent and 41.6 percent of the total cost
respectively.
Over 60 percent of gross profit in the Agriculture sector is from small sized establishments while
close to half (46.0%) of gross profit in Industry is accounted for by large sized establishments. In
the Service sector, the distribution is fare across all the establishment size groups.

15
Table 3.4: Distribution of revenue, cost of goods sold and gross profit by size
Service sector
Revenue
(GH¢
million) Percent
Cost of
goods sold
(GH¢
million) Percent
Gross
profit
(GH¢
million) Percent
All Sectors 456,996 100.0 156,068 100.0 300,928 100.0
Agriculture (Institutional Agriculture) 5,479 100.0 2,104 100.0 3,375 100.0
Large-Sized 513 9.4 119 5.7 394 11.7
Medium-Sized 1,544 28.2 1,045 49.7 499 14.8
Small-Sized 2,486 45.4 436 20.7 2,050 60.7
Micro-Sized 937 17.1 504 23.9 433 12.8
Industry 133,143 100.0 47,083 100.0 86,061 100.0
Large-Sized 57,904 43.5 18,314 38.9 39,589 46.0
Medium-Sized 27,167 20.4 7,851 16.7 19,316 22.4
Small-Sized 45,062 33.8 19,748 41.9 25,315 29.4
Micro-Sized 3,010 2.3 1,170 2.5 1,841 2.1
Services 318,374 100.0 106,881 100.0 211,492 100.0
Large-Sized 73,984 23.2 11,956 11.2 62,028 29.3
Medium-Sized 68,475 21.5 25,148 23.5 43,326 20.5
Small-Sized 99,006 31.1 44,467 41.6 54,539 25.8
Micro-Sized 76,909 24.2 25,310 23.7 51,599 24.4
3.3 Operating Cost of production of goods and services
3.3.1 Introduction
This section reports on the costs incurred by the establishments directly involved in producing a
product or delivering a service. The costs include a variety of expenses incurred on raw
materials, consumable manufacturing supplies, general overhead and taxes. Estimates of the
costs associated with production of goods or delivering a service are used to guide and inform
operatives of new and existing agricultural, industrial and services sector activities of the
potential costs associated with the three economic sectors of engagement.
3.3.2 Operating Cost of production of goods and services by sector and subsector
Table 3.5 reports on the total costs of production of goods and services for all sectors by type of
cost. The annual production costs of goods and services of all sectors amounted to GH¢223.6
billion. Out of the total costs, 68.8 percent was for materials and supplies, 18.9 percent for other
operating expenses, 6.0 percent for goods purchased for resale and 4.6 percent for fuel
purchased. The remaining 1.6 percent was spent on water and other purchases.
The Service sector incurred the highest costs of production, accounting for a little over three-
quarters (GH¢160.1 billion) of the total cost while the Industry sector incurred second largest of
about 61.2 billion Ghana Cedis, accounting for a little over one-fifth (27%) of the total cost of
production of goods and services. Agriculture sector recorded the least (GH¢2.4 billion) or 1.1
percent of the total cost. Generally across all sectors, materials and supplies contribute
significantly to the total cost of production of goods and services (Table 3.5).

16
Table 3.5: Cost of production by sector and type of cost of production (million GH¢)
Sector
Total
GH¢
Material
and
Supplies
GH¢
Goods
Purchased
for Resale
GH¢
Fuel
purchased
GH¢
Electricity
purchased
GH¢
Water
purchased
GH¢
Other
Purchases
GH¢
Other
Operating
Costs
GH¢
ALL SECTORS -
National 167,504 97,660 13,417 10,363 2,964 240 384 42,475
Agriculture 2,506 2,161 62 109 7 2 2 163
Industry 37,901 23,814 2,182 4,155 867 81 207 6,595
Services 127,097 71,685 11,173 6,099 2,091 157 176 35,717
Table 3.6 presents the total cost of production of goods and services within the sub-sectors of
Agriculture, Industry and Service sectors. The Crop and animal production, hunting and related
service activities sub-sector incurred GH¢2.1 billion or 90.7 percent of the total cost of
production in the Agriculture sector. This is followed by the Fishing and aquaculture sub-sector
(GH¢227.3 million or 9.1%). The cost of materials and supplies in the Crop and animal
production, hunting and related service activities sub-sector alone was 97.6 percent of the total
cost of production in the Agriculture sector.
In the Industry sector, the proportion of production cost in the Manufacturing sub-sector (GH¢20
billion) was the largest, and constitutes almost half (49.4%) of the total cost in sector, while the
least cost of GH¢ 311 million was incurred in the water supply, sewerage, and waste
management sub-sector. The cost of materials and supplies in the Construction sub-sector was
the highest (GH¢25.3 billion) followed by Manufacturing with a cost of GH¢16.5 billion).
Within the Service sector, Wholesale and retail sub-sector (GH¢109.7 billion) was the principal
contributor to total cost, representing 63.9 percent of the total cost of production. The Financial
and insurance activities sub-sector was the second largest (GH¢32.8 billion), accounting for
about one-quarter (24.5%) of the total cost. The two sub-sectors together recorded 88.4 percent
of the sector’s total production cost. The cost of materials and supplies in the Wholesale and
retail sub-sector (GH¢91.8 billion) and other operating expenses in the Financial and insurance
activities sub-sector (GH¢27.3 billion) together contributed 71.3 percent of the total cost in the
Service’s sector. The Financial and insurance sub-sector’s costs were mainly in the form of
services provided by other IT firms and administrative support services which is captured in the
survey as other operating expenses. This accounts for the huge cost recorded under “other
operating expenses” (Table 3.6).

17
Table 3.6: Distribution of sources of cost of production and services by sector and
sub-sector (million GH¢)
Sector Total
Material
and
Supplies,
Goods
Purchased
for Resale
Fuel
purchased
Electricity
purchased
Water
purchased
Other
Purchases
Other
Operating
Costs
Agriculture (Institutional Agriculture) 2,392 2,047 62 109 7 2 2 163
Crop and animal production, hunting and related service activities 2,159.50 1,995.20 62.1 33 5.3 2 0.7 61.3
Forestry and logging 5.5 1.6 0.3 2.2 0.2 0 0.9 0.4
Fishing and aquaculture 227.3 50.4 0 74 1.1 0.1 0 101.6
Industry 61,176 47,089 2,182 4,155 867 81 207 6,595
Mining and quarrying 9424.4 2944 60 2739.3 449.9 2.9 190.3 3038.1
Manufacturing 20021.8 16539.8 991.1 402 306.2 63.1 15 1704.6
Electricity, gas, steam and air conditioning supply 4105.7 1830.3 1105.8 773.9 13.6 1.8 0 380.3
Water supply; sewerage, waste management 311 125.8 0.3 24.3 74.1 0.5 0 86.1
Construction 27312.9 25649.3 25 215.5 23 12.5 1.5 1386.2
Service 160,113 104,701 11,173 6,099 2,091 157 176 35,717
Wholesale and retail trade and repair of motor vehicles and
motorcycles 109,793 91,892 9,292 4,721 210 45 57 3,576
Transportation and storage 3,745 2,062 117 569 19 4 0 975
Accommodation and food service activities 3,278 2,354 266 163 105 32 6 352
Information and communication 3,722 446 1,159 172 125 11 5 1,803
Financial and insurance activities 32,897 3,729 21 219 1,484 23 93 27,327
Real estate activities 793 483 0 9 4 1 0 296
Professional, scientific and technical activities 819 385 14 22 16 4 4 374
Administrative and support service activities 400 190 18 30 7 1 0 154
Education 762 245 78 70 28 13 4 324
Human health and social work activities 1,758 1,397 85 25 39 5 4 203
Arts, entertainment and recreation 100 59 2 3 4 1 0 31
Other service activities 2,046 1,459 121 94 51 17 1 303

18
3.3.3 Operating Cost of production of goods and services by region
Table 3.7 reports on the cost of production of goods and services by region and type of
production cost. The cost of production of goods and services was largest (GH¢149.1 billion)
for establishments in Greater Accra region, accounting for more than two-thirds (66.7%) of
the total cost, followed by establishments in Ashanti region (GH¢24.1 billion or 10.8%). The
cost of production from the two regions account for more than three-quarters (77.5%) of the
total production cost. Establishments in the Upper East region recorded the least cost
(GH¢2.2 billion) representing less than one percent (0.9%) of the total cost. Greater Accra
region recorded the largest value in all the cost components.
Table 3.7: Cost of production of goods and services by region and type of production
cost (million GH₵)
Sector Total
Material
and
Supplies,
Goods
Purchased
for Resale
Fuel
purchased
Electricity
purchased
Water
purchased
Other
Purchases
Other
operating
Costs
All sectors 223,681 153,837 13,417 10,363 2,964 240 384 42,475
Western 14,286 9,963 905 679 245 12 196 2,287
Central 8,590 3,483 4,814 56 35 8 3 191
Grater Accra 149,178 96,447 5,303 8,780 2,149 176 170 36,152
Volta 3,128 2,659 216 43 45 5 1 160
Eastern 6,626 5,107 98 314 184 6 1 915
Ashanti 24,119 21,394 1,420 251 213 15 3 823
Brong Ahafo 6,132 5,579 78 170 41 8 5 252
Northern 7,110 6,297 245 40 27 5 2 493
Upper East 2,201 1,774 328 19 17 2 3 58
Upper West 2,312 1,135 10 13 8 2 0 1,143
3.3.4 Operating Cost by establishment size
In terms of establishment size, Table A1a shows that the micro and small-sized
establishments contributed GH¢83.3 billion which was more than half (54.0%) of the total
cost while the medium and large-sized establishments accounted for 49.4 percent (GH¢120.5
billion). Generally, the cost of materials and supplies was the highest, irrespective of
establishment size. However, this type of cost is relatively higher (more than 60 percent) for
the micro, small- and medium-sized establishments.
In the Institutional Agriculture sector, more than two-fifths (45.0%) of the cost of production
(GH¢1.1 billion) was incurred by the medium-sized establishments, while about one-quarter
(26.0%) was incurred in the micro-sized establishments. Within the Industry sector, 47
percent of the cost of production (GH¢21.7 billion) was incurred by the large-sized
establishments, while about 20 percent, equivalent to GH¢7.6 billion was incurred by the
medium-sized establishments. In the Service sector, an amount of GH¢73 billion was
incurred by the micro and small-sized establishments combined, representing 58 percent of
the total cost, while less than one-fifth (19%) or GH¢24 billion of the total cost was incurred
by large-sized establishments (Table 8).

19
Table 3.8: Purchases and other operating cost by sector and size
Sector Total GH¢ Percent
Agriculture (Institutional Agriculture) 2,506,425,357 100.0
Large-Sized Businesses 270,093,055 11.0
Medium-Sized Businesses 1,118,954,077 45.0
Small-Sized Businesses 462,574,446 18.0
Micro-Sized Businesses 654,803,780 26.0
Industry 37,900,642,460 100.0
Large-Sized Businesses 21,778,029,449 57.0
Medium-Sized Businesses 7,637,190,005 20.0
Small-Sized Businesses 7,159,512,587 19.0
Micro-Sized Businesses 1,325,910,419 3.0
Services 127,097,240,179 100.0
Large-Sized Businesses 24,060,018,985 19.0
Medium-Sized Businesses 29,352,008,631 23.0
Small-Sized Businesses 36,967,324,226 29.0
Micro-Sized Businesses 36,717,888,337 29.0
3.4 Receipts of Businesses
3.4.1 Introduction
Receipts refer to cash receipts that establishments received for undertaking their activities. It
is the amount of cash that they collected during the 2013 financial period. These receipts are
both cash sales, as well as money received on a customer's account. However, since
businesses within sectors are expected to have some level of homogeneity in terms of their
modus operandi, the structure of their receipts is deemed sector specific in the survey. Thus,
the receipts are categorized for businesses by sector.
In the Institutional Agricultural sector, four different receipts are examined, and these include
receipts from sale of agricultural products, non-agriculture products, goods sold in the same
condition as purchased, subsidies, and other receipts. In the Industry sector, six categories are
examined, and these are made up of receipts from the sale of main industrial products or
activities, non-industrial activities, contract work done by industrial firms, repair and
installation services, other industrial services that are not the main activity of the industrial
firms, and sale of goods in the same condition as purchased. The Services sector on the other
hand, has mainly three categories namely, receipts from main services of the service sector
firm, sale of goods in the same condition as purchased, and other income, which includes
subsidies.
The total value of receipts by all firms in the country was GH¢304.9 billion during the 2013
financial period. Out of these total receipts, the establishments in the Service sector
accounted for almost three-quarters (74.0%). Firms in the Industry sector received close to
one-quarter of the total receipts, while the firms in the Agriculture sector received just two
percent. This is an indication of the buoyancy of business in the Service sector (Figure 3.2).

20
Figure 3.2: Distribution of Receipts by Sector (%)
3.4.2 Receipts in the Agriculture Sector
In the Agriculture sector, close to nine out of ten (89.2%) of all receipts by firms in the sector
emanated from the sale of their main agriculture products, while a little above ten percent
(10.8) of the receipts by businesses in this sector emanated from trading. This is an indication
that most firms in the sector, were involved in their core business and mandates. Also, out of
the total receipts of GH¢5,728.10 million in the sector, as much as GH¢4,744.80 million was
contributed by firms in the Crop and animal production, hunting and related service activities
(Table 9).
Table 3.9: Distribution of sources of receipts in the Agriculture sector by subsector
(GH¢ million)
Sub-Sector Total
Agriculture
Products
Non-
agriculture
activities
Goods
Purchased
for resale Subsidies Other
Agriculture, forestry and fishing 5,728.10 5,061.00 39.3 619.4 5.9 2.5
Percent 100 88.4 0.7 10.8 0.1 0.04
Crop and animal production,
hunting and related service
activities 5,406.70 4,744.80 34.2 619.3 5.9 2.5
Forestry 10 9.3 0.7 0 0 0
Fishing and aquaculture 311.4 307 4.4 0 0 0
Regarding the sources of receipts of firms in the Agriculture sector within each region, it is
observed that apart from the Western and Upper West regions, all the other regions had their
main source of receipts from the sale of agriculture products. In the Western region, firms in
the sector engaged in a lot of trading, as 40.4 percent of the total receipts by firms in the
sector in the region is from trading while in the Upper West region about half (50.5%) of the
receipts of firms in the sector are from non-agricultural activities (Table 10).
Agriculture
2%
Industry
24%
Services
74%
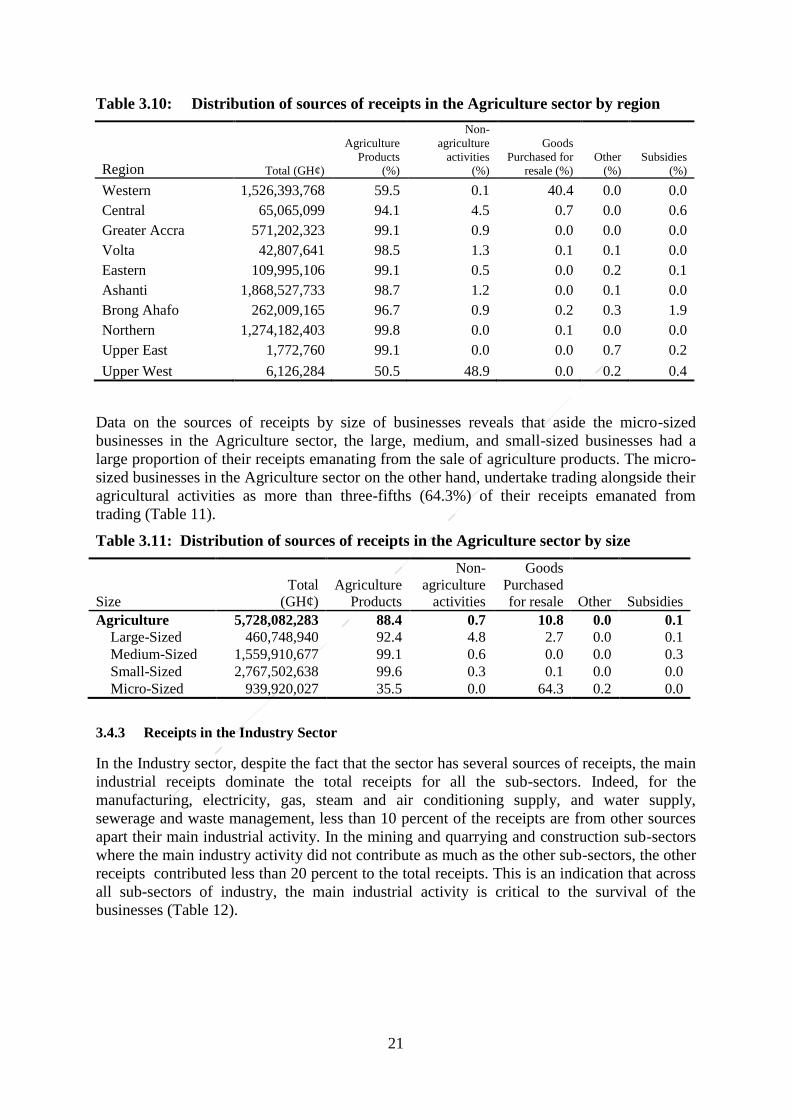
21
Table 3.10: Distribution of sources of receipts in the Agriculture sector by region
Region Total (GH¢)
Agriculture
Products
(%)
Non-
agriculture
activities
(%)
Goods
Purchased for
resale (%)
Other
(%)
Subsidies
(%)
Western 1,526,393,768 59.5 0.1 40.4 0.0 0.0
Central 65,065,099 94.1 4.5 0.7 0.0 0.6
Greater Accra 571,202,323 99.1 0.9 0.0 0.0 0.0
Volta 42,807,641 98.5 1.3 0.1 0.1 0.0
Eastern 109,995,106 99.1 0.5 0.0 0.2 0.1
Ashanti 1,868,527,733 98.7 1.2 0.0 0.1 0.0
Brong Ahafo 262,009,165 96.7 0.9 0.2 0.3 1.9
Northern 1,274,182,403 99.8 0.0 0.1 0.0 0.0
Upper East 1,772,760 99.1 0.0 0.0 0.7 0.2
Upper West 6,126,284 50.5 48.9 0.0 0.2 0.4
Data on the sources of receipts by size of businesses reveals that aside the micro-sized
businesses in the Agriculture sector, the large, medium, and small-sized businesses had a
large proportion of their receipts emanating from the sale of agriculture products. The micro-
sized businesses in the Agriculture sector on the other hand, undertake trading alongside their
agricultural activities as more than three-fifths (64.3%) of their receipts emanated from
trading (Table 11).
Table 3.11: Distribution of sources of receipts in the Agriculture sector by size
Size
Total
(GH¢)
Agriculture
Products
Non-
agriculture
activities
Goods
Purchased
for resale Other Subsidies
Agriculture 5,728,082,283 88.4 0.7 10.8 0.0 0.1
Large-Sized 460,748,940 92.4 4.8 2.7 0.0 0.1
Medium-Sized 1,559,910,677 99.1 0.6 0.0 0.0 0.3
Small-Sized 2,767,502,638 99.6 0.3 0.1 0.0 0.0
Micro-Sized 939,920,027 35.5 0.0 64.3 0.2 0.0
3.4.3 Receipts in the Industry Sector
In the Industry sector, despite the fact that the sector has several sources of receipts, the main
industrial receipts dominate the total receipts for all the sub-sectors. Indeed, for the
manufacturing, electricity, gas, steam and air conditioning supply, and water supply,
sewerage and waste management, less than 10 percent of the receipts are from other sources
apart their main industrial activity. In the mining and quarrying and construction sub-sectors
where the main industry activity did not contribute as much as the other sub-sectors, the other
receipts contributed less than 20 percent to the total receipts. This is an indication that across
all sub-sectors of industry, the main industrial activity is critical to the survival of the
businesses (Table 12).

22
Across the regions, apart from Western, Upper West, and Upper East regions where singular
other sources account for between 10 and 15 percent to total receipts, each of the singular
sources within the other regions did not contribute much to the receipts within the region.
This attribute of the businesses in the Industry sector is revealing since it exhibits confidence
of the businesses in the major activities of the sector despite the numerous challenges that
may have bedeviled the sector (Table 13).
Table 14 also reveals that size matters when considering the sources of receipts of businesses
in the Industry sector. The data suggests that large and medium sized firms in Industry have
almost all their receipts coming from their main industrial activity. Micro and small
businesses in the sector, receive receipts from other sources such as from contract work done,
to complement their main sources of receipts from the industrial activities.

23
Table 3.12: Distribution of sources of receipts in the Industry sector by subsector
Sector/Sub-sector
Total
(GH¢)
Industrial
activity
(%)
Contract
work
done
(%)
Repair and
installation
services
(%)
Other
industrial
services
(%)
Non-
industrial
services
(%)
Goods
sold in
same
condition
(%)
Industry 81,157,141,226 91.9 1.7 0.9 1.1 4.0 0.5
Mining and quarrying 20,000,296,655 82.5 1.1 0.0 3.5 12.9 0.0
Manufacturing 42,071,603,730 97.4 1.7 0.0 0.1 0.3 0.6
Electricity, gas, steam and air conditioning supply 6,572,630,355 93.3 1.4 0.9 1.4 1.9 1.1
Water supply; sewerage, waste management 1,138,525,673 97.1 0.4 0.1 0.3 2.1 0.0
Construction 11,374,084,817 86.9 3.0 5.6 0.5 3.4 0.6
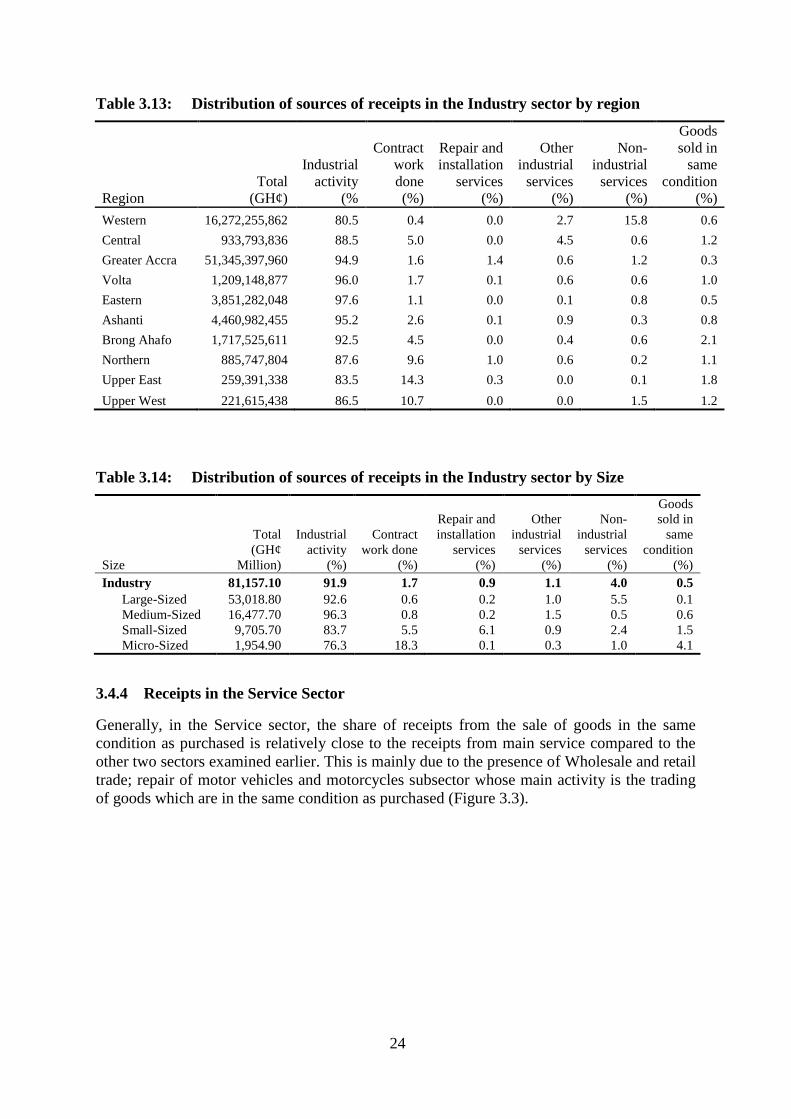
24
Table 3.13: Distribution of sources of receipts in the Industry sector by region
Region
Total
(GH¢)
Industrial
activity
(%
Contract
work
done
(%)
Repair and
installation
services
(%)
Other
industrial
services
(%)
Non-
industrial
services
(%)
Goods
sold in
same
condition
(%)
Western 16,272,255,862 80.5 0.4 0.0 2.7 15.8 0.6
Central 933,793,836 88.5 5.0 0.0 4.5 0.6 1.2
Greater Accra 51,345,397,960 94.9 1.6 1.4 0.6 1.2 0.3
Volta 1,209,148,877 96.0 1.7 0.1 0.6 0.6 1.0
Eastern 3,851,282,048 97.6 1.1 0.0 0.1 0.8 0.5
Ashanti 4,460,982,455 95.2 2.6 0.1 0.9 0.3 0.8
Brong Ahafo 1,717,525,611 92.5 4.5 0.0 0.4 0.6 2.1
Northern 885,747,804 87.6 9.6 1.0 0.6 0.2 1.1
Upper East 259,391,338 83.5 14.3 0.3 0.0 0.1 1.8
Upper West 221,615,438 86.5 10.7 0.0 0.0 1.5 1.2
Table 3.14: Distribution of sources of receipts in the Industry sector by Size
Size
Total
(GH¢
Million)
Industrial
activity
(%)
Contract
work done
(%)
Repair and
installation
services
(%)
Other
industrial
services
(%)
Non-
industrial
services
(%)
Goods
sold in
same
condition
(%)
Industry 81,157.10 91.9 1.7 0.9 1.1 4.0 0.5
Large-Sized 53,018.80 92.6 0.6 0.2 1.0 5.5 0.1
Medium-Sized 16,477.70 96.3 0.8 0.2 1.5 0.5 0.6
Small-Sized 9,705.70 83.7 5.5 6.1 0.9 2.4 1.5
Micro-Sized 1,954.90 76.3 18.3 0.1 0.3 1.0 4.1
3.4.4 Receipts in the Service Sector
Generally, in the Service sector, the share of receipts from the sale of goods in the same
condition as purchased is relatively close to the receipts from main service compared to the
other two sectors examined earlier. This is mainly due to the presence of Wholesale and retail
trade; repair of motor vehicles and motorcycles subsector whose main activity is the trading
of goods which are in the same condition as purchased (Figure 3.3).

25
Figure 3.3: Distribution of major sources of receipts in the Service sector
Table 15 presents the sources of receipts of firms in the service sub-sectors. It shows that
with the exception of wholesale and retail trade, nearly all the receipts for all the other sub-
sectors come from services. Receipts from services accounted for 55.2 percent of the Service
sector receipts while that from the sale of goods in the same condition as purchased
accounted for two-fifths (41.1%). All the other sub-sectors apart from wholesale and retail
trade have more than 80 percent of their receipts coming from receipts for services. Sales of
goods in the same condition as purchased accounts for 82 percent of the receipts for the
Wholesale and retail trade sub-sector. Also, firms in the other services sub-sector undertake
some trading together with the services they provide as about 14 percent of their receipts
were from sales of goods sold in the same condition as purchased.
Table 3.15: Distribution of sources of receipts in the Service sector by subsector
Sector/Subsector Total
Receipts
for
Services
(%)
Sales of
Goods in
same
condition
(%)
Other
Income
(%)
Service 224,640,204,738 55.2 41.1 3.7
Wholesale and retail trade; repair of motor vehicles
and motorcycles 111,678,150,308 16.2 82.0 1.9
Transportation and storage 3,575,598,025 90.7 4.4 4.9
Accommodation and food service activities 4,793,771,020 96.0 2.4 1.6
Information and communication 8,487,955,147 99.1 0.4 0.5
Financial and insurance activities 82,942,926,917 93.4 0.1 6.5
Real estate activities 782,585,058 95.8 1.7 2.5
Professional, scientific and technical activities 1,185,362,872 93.1 0.6 6.3
Administrative and support service activities 847,397,392 93.5 0.8 5.7
Education 6,185,644,507 97.4 1.0 1.6
Human health and social work activities 1,816,660,573 91.2 1.7 7.1
Arts, entertainment and recreation 225,397,989 97.3 1.5 1.2
Other service activities 2,118,754,930 80.1 13.8 6.1
Receipts for
Services
55%
Sales of Goods in
same condition
41%
Other Income
4%

26
Table 16 shows the sources of receipts of firms in the Service sector within each region. With
the exception of Greater Accra which has about two-thirds of receipts from services (66.3%),
all the other regions have sales of goods sold in the same condition as the main source of
receipts. Northern, Brong Ahafo and Upper East regions have more than 80 percent of their
receipts from sales of goods in the same condition as purchased.
Table 3.16: Distribution of sources of receipts in the Service sector by region
Region
Total
(GH¢ Million)
Receipts for
Services
(%)
Sales of Goods
in same
condition
(%)
Other
Income
(%)
Western 7,505 20.4 72.8 6.9
Central 3,648 24.0 68.0 8.0
Greater Accra 170,053 66.3 29.7 4.0
Volta 2,233 22.7 75.2 2.1
Eastern 3,574 24.3 73.6 2.1
Ashanti 22,534 22.2 77.2 0.6
Brong Ahafo 6,917 13.5 83.4 3.1
Northern 4,743 14.2 84.7 1.1
Upper East 1,761 14.0 81.9 4.0
Upper West 1,673 39.5 60.1 0.5
Table 17 indicates the distribution of sources of receipts in the Service sector by
establishment size. More than four-fifths (80.1%) of receipts by large establishments and 60.7
percent of receipts by medium-sized establishment are from services provided. On the other
hand, 61.8 percent of receipts by micro-sized establishments and more than half of receipts
by small-sized establishment are from goods sold in the same condition as purchased.
Table 3.17: Distribution of sources of receipts in Service sector by size
Size
Total (GH¢
Million)
Receipts
for
Services
(%)
Sales of
Goods in
same
condition
(%)
Other
Income
(%)
Services 224,640.20 55.2 41.1 3.7
Large-Sized 61,168.00 81.3 13.9 4.7
Medium-Sized 56,881.10 60.7 37.5 1.8
Small-Sized 51,617.70 41.1 55.2 3.7
Micro-Sized 54,973.30 33.7 61.8 4.5
3.5 Capital formation
3.5.1 Introduction
The survey collected information on the purchases of fixed assets by establishments, whether
for use by the establishment or to be rented to other establishments. This section discusses the
value of fixed assets owned and used by establishments, those purchased or disposed of by
establishments and the value of depreciation during the use of these assets for providing
goods and services during the reference period. The information on fixed assets gives an
indication of the level of and additions to investments by the establishments within the
period. Consideration is given to assets purchased by the establishment, value at full cost
incurred (at delivered cost), plus the cost of installation, including any fees and taxes but
excluding financial costs and assets.
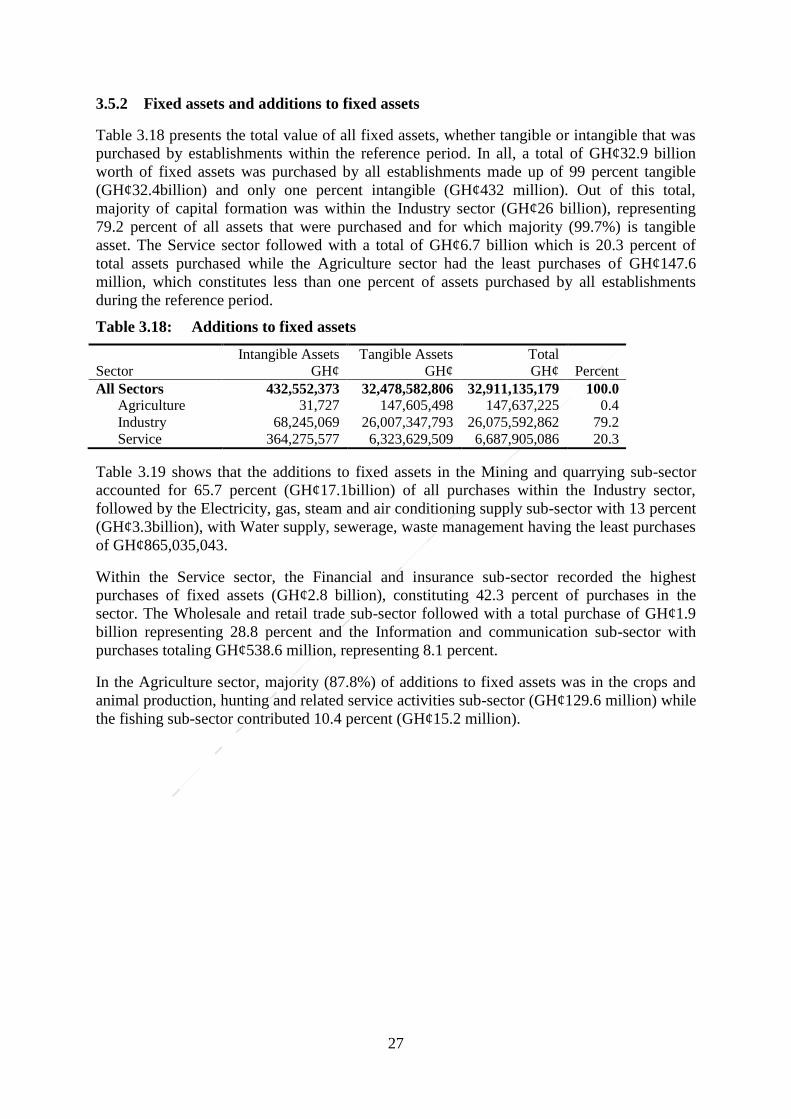
27
3.5.2 Fixed assets and additions to fixed assets
Table 3.18 presents the total value of all fixed assets, whether tangible or intangible that was
purchased by establishments within the reference period. In all, a total of GH¢32.9 billion
worth of fixed assets was purchased by all establishments made up of 99 percent tangible
(GH¢32.4billion) and only one percent intangible (GH¢432 million). Out of this total,
majority of capital formation was within the Industry sector (GH¢26 billion), representing
79.2 percent of all assets that were purchased and for which majority (99.7%) is tangible
asset. The Service sector followed with a total of GH¢6.7 billion which is 20.3 percent of
total assets purchased while the Agriculture sector had the least purchases of GH¢147.6
million, which constitutes less than one percent of assets purchased by all establishments
during the reference period.
Table 3.18: Additions to fixed assets
Sector
Intangible Assets
GH¢
Tangible Assets
GH¢
Total
GH¢ Percent
All Sectors 432,552,373 32,478,582,806 32,911,135,179 100.0
Agriculture 31,727 147,605,498 147,637,225 0.4
Industry 68,245,069 26,007,347,793 26,075,592,862 79.2
Service 364,275,577 6,323,629,509 6,687,905,086 20.3
Table 3.19 shows that the additions to fixed assets in the Mining and quarrying sub-sector
accounted for 65.7 percent (GH¢17.1billion) of all purchases within the Industry sector,
followed by the Electricity, gas, steam and air conditioning supply sub-sector with 13 percent
(GH¢3.3billion), with Water supply, sewerage, waste management having the least purchases
of GH¢865,035,043.
Within the Service sector, the Financial and insurance sub-sector recorded the highest
purchases of fixed assets (GH¢2.8 billion), constituting 42.3 percent of purchases in the
sector. The Wholesale and retail trade sub-sector followed with a total purchase of GH¢1.9
billion representing 28.8 percent and the Information and communication sub-sector with
purchases totaling GH¢538.6 million, representing 8.1 percent.
In the Agriculture sector, majority (87.8%) of additions to fixed assets was in the crops and
animal production, hunting and related service activities sub-sector (GH¢129.6 million) while
the fishing sub-sector contributed 10.4 percent (GH¢15.2 million).

28
Table 3.19: Additions to fixed assets by sector
Sector Value (GH¢) Percent
All Sectors 32,911,135,179 100.0
Agriculture 147,637,226 100.0
Crop and animal production, hunting and related service
activities 129,642,005 87.8
Forestry and logging 2,695,452 1.8
Fishing and aquaculture 15,299,769 10.4
Industry 26,075,592,862 100.0
Mining and quarrying 17,132,074,472 65.7
Manufacturing 3,103,801,128 11.9
Electricity, gas, steam and air conditioning supply 3,387,210,448 13.0
Water supply; sewerage, waste management 865,035,043 3.3
Construction 1,587,471,771 6.1
Service 6,687,905,086 100.0
Wholesale and retail trade and repair of motor vehicles and
motorcycles 1,926,457,550 28.8
Transportation and storage 167,563,780 2.5
Accommodation and food service activities 505,537,681 7.6
Information and communication 538,775,319 8.1
Financial and insurance activities 2,830,955,841 42.3
Real estate activities 69,254,870 1.0
Professional, scientific and technical activities 78,284,076 1.2
Administrative and support service activities 178,897,992 2.7
Education 119,829,141 1.8
Human health and social work activities 83,421,013 1.2
Arts, entertainment and recreation 16,477,661 0.2
Other service activities 172,450,162 2.6
3.5.3 Fixed assets by establishment size
Table 3.20 shows additions to fixed assets by sectors and establishment size. Nationally,
medium-sized and large-sized establishments contributed 55.5 percent and 32 percent
respectively, purchases of fixed assets. The Industry sector, which recorded the highest
additions to fixed assets compared to the other sectors had most (65.7%) of its additions to
fixed assets in medium-sized establishments (GH¢17.1 billion) and 30.9 percent (GH¢8
billion) in large-sized establishments. The Service sector, unlike the Industry sector, had
significant additions to fixed assets across all the establishment size categories with 35.1
percent and 20.9 percent of addition going to large-sized and micro-sized establishments,
respectively. The Agriculture sector had majority (85.9%) of its additions to fixed assets
going to large-sized establishments followed by small-sized establishments with a
contribution of 8.9 percent.

29
Table 3.20: Additions to fixed assets by sector and establishment size
Sector/Size Value (GH¢) Percent
All Sectors 32,911,135,179 100.0
Large-Sized 10,529,247,077 32.0
Medium-Sized 18,254,273,078 55.5
Small-Sized 2,222,808,961 6.8
Micro-Sized 1,904,806,062 5.8
Agriculture 147,637,225 100.0
Large-Sized 126,766,345 85.9
Medium-Sized 5,836,763 4.0
Small-Sized 13,171,458 8.9
Micro-Sized 1,862,659 1.3
Industry 26,075,592,864 100.0
Large-Sized 8,055,280,471 30.9
Medium-Sized 17,139,376,908 65.7
Small-Sized 812,142,902 3.1
Micro-Sized 68,792,584 0.3
Services 6,687,905,090 100.0
Large-Sized 2,347,200,261 35.1
Medium-Sized 1,109,059,407 16.6
Small-Sized 1,397,494,601 20.9
Micro-Sized 1,834,150,819 27.4
3.5.4 Fixed assets by region
As shown in Table 3.21, Greater Accra region contributed 77.2 percent (GH¢25.4 billion) to
purchases or additions to total fixed assets followed by the Western (GH¢4.7 billion) and
Ashanti (GH¢1.2 billion) regions with 14.4 percent and 3.6 percent respectively. The
remaining regions together contributed 4.8 percent to the total additions, each region with the
exception of Brong Ahafo (1.7%) and Central (1.0%), contributing less than one percent.
Table 3.21: Additions to fixed assets by region
Sector
Value
GH¢ Percent
All Sectors 32,911,135,179 100.0
Western 4,750,648,618 14.4
Central 331,671,329 1.0
Greater Accra 25,395,688,598 77.2
Volta 173,953,290 0.5
Eastern 309,225,071 0.9
Ashanti 1,182,909,264 3.6
Brong Ahafo 555,282,169 1.7
Northern 114,815,320 0.3
Upper East 46,678,460 0.1
Upper West 50,263,058 0.2

30
Figure 3.4 shows the type of assets purchased by establishments. Of the total assets
purchased, GH¢16.8 billion, representing 55.1 percent was spent on machinery and other
equipment. Other tangible assets followed, recording GH¢4.3 billion which represents 14.1
percent of total fixed assets purchased. Transport and equipment purchased was valued at
GH¢3.3 billion, constituting 11.0 percent of additions to fixed assets.
Figure 3.4: Type of asset purchased (GH¢’000)
3.5.5 Total fixed assets
Total fixed assets owned by the establishments across all sectors is presented in Figure 3.5.
The total value of assets in all sectors stood at GH¢180.3 billion. The Industry sector’s total
asset was valued at GH¢123.9 billion, representing 69 percent of the total assets. The Service
sector follows with GH¢46.6 billion worth of assets (27%), and Agriculture adding GH¢9.8
billion worth of assets.
432,896
379,218
1,338,642
2,180,730
3,346,914
16,819,352
1,710,309
4,299,053
0 5,000,000 10,000,000 15,000,000 20,000,000
Intangible assets
Land
Other construction and land improvements
Building
Transport and equipment
Machinery and other equipment
Furniture and fittings
Other tangible assets
Value (GH¢’000)

31
Figure 3.5: Value of fixed assets (GH¢)
Figure 3.6 presents the type of fixed assets held by establishments. Over 50 percent of assets
held is machinery and other equipment valued at GH¢95.8 billion. Buildings account for 14.5
percent (GH¢26.1 billion) while transport and equipment make up 14 percent (GH¢25.2
billion) of the total assets.
Figure 3.6: Type of asset (GH¢’000)
Out of the GH¢9.8 billion total assets held by the Agriculture sector, the Fishing and
aquaculture sub-sector had GH¢9.3 billion, representing 95.6 percent of the total assets in the
sector. The other sub-sectors within the sector contributed 4.4 percent to total assets (Table
3.18).
In the Industry sector, the Mining and quarrying sub-sector had total assets of GH¢69.8
billion which constitutes 56.3 percent of all assets held by the Industry sector. The
Manufacturing subsector followed with a contribution of 29.7 percent to assets within the
sector. The Service sector had a total of GH¢46.6 billion worth of assets of which the
Agriculture
5%
Industry
69%
Services
26%
1,340
18,065
7,591
26,101
25,277
95,858
3,896
2,243
- 20,000 40,000 60,000 80,000 100,000 120,000
Intangible Assets
Land
Other Construction and land Improvements
Buildings
Transport and Equipments
Machinery and Other Equipments
Furniture and Fittings
Other Tangible Assets
Value (GH¢ million)
Typ
e o
f A
sset

32
Financial and insurance activities sub-sector’s contribution is 18.1 percent (GH¢8.4 billion),
followed by the Accommodation and food sub-sector (17.3%) and Wholesale and retail trade
(15.3%).
Table 3.22: Total fixed assets by sector
Sectors/Subsector Value (GH¢) Percent
All Sectors 180,371,029,617 100.0
Agriculture (Institutional Agriculture) 9,811,563,237 100.0
.Crop and animal production, hunting and related service
activities 420,787,851 4.3
Forestry and logging 7,999,157 0.1
Fishing and aquaculture 9,382,776,230 95.6
Industry 123,936,233,925 100.0
Mining and quarrying 69,830,194,713 56.3
Manufacturing 36,852,053,433 29.7
Electricity, gas, steam and air conditioning 11,722,236,204 9.5
Water supply; sewerage, waste management 2,038,299,492 1.6
Construction 3,493,450,084 2.8
Services 46,623,232,456 100.0
Wholesale and retail trade and repair of motor vehicles
and motorcycles 7,150,572,404 15.3
Transportation and storage 2,477,313,352 5.3
Accommodation and food service activities 8,073,910,933 17.3
Information and communication 2,894,213,037 6.2
Financial and insurance activities 8,439,105,250 18.1
Real estate activities 471,252,769 1.0
Professional, scientific and technical activities 380,385,854 0.8
Administrative and support service activities 3,859,674,612 8.3
Education 6,695,984,397 14.4
Human health and social work activities 1,699,757,944 3.6
Sports activities and amusement and recreation activities 1,010,015,038 2.2
Other service activities 3,471,046,867 7.4
In terms of regional contribution to total assets, establishments located in the Greater Accra
region held majority of the assets amounting to GH¢120.3 billion, which translates to 66.7
percent of the total assets. Establishments in the Ashanti region had about GH¢19.7 billion
worth of assets representing 10.9 percent, with establishments in the three northern regions
together having a share of 1.4 percent (GH¢2.4 billion) of the total assets (Table 3.19).

33
Table 3.23: Total assets by region
Region Value (GH¢) Percent
All sectors 180,371,029,617 100.0
Western 16,516,256,686 9.2
Central 7,458,546,244 4.1
Greater Accra 120,352,825,494 66.7
Volta 2,431,262,341 1.3
Eastern 9,150,046,993 5.1
Ashanti 19,701,652,541 10.9
Brong Ahafo 2,335,778,066 1.3
Northern 1,033,484,051 0.6
Upper East 271,755,448 0.2
Upper West 1,119,421,755 0.6
Table 3.20 presents the distribution of assets by sector and establishment size. Medium-sized
establishments held assets worth GH¢93.3 billion representing 51.8 percent of the stock of
assets followed by the large-sized establishments with GH¢41.4 billion, which constitutes 23
percent. In the Agriculture sector, a significant proportion of 97.5 percent of the assets is held
by the large-sized establishments with small-sized establishments contributing 1.3 percent to
the value of assets. Of the total assets held by the Industry sector (GH¢80.2 billion), 64.7
percent was owned by medium-sized establishments while the large-sized establishments had
16.4 percent (GH¢20.3 billion). Unlike the Agriculture and Industry sectors, all the size
categories within the Service sector contributed substantially to the assets. Almost 32 percent
of assets in the sector is held by small-sized establishments while medium-sized and large-
sized establishments have 28.1 percent and 24.9 percent respectively (Table 3.20).
Table 3.24: Fixed assets by sector and establishment size
Size Value (GH¢) Percent
All Sectors 180,371,029,617 100.0
Large-Sized 41,475,375,907 23.0
Medium-Sized 93,393,049,462 51.8
Small-Sized 37,735,372,999 20.9
Micro-Sized 7,767,231,251 4.3
Agriculture 9,811,563,237 100.0
Large-Sized 9,564,797,944 97.5
Medium-Sized 82,015,528 0.8
Small-Sized 127,552,363 1.3
Micro-Sized 37,197,403 0.4
Industry 123,936,233,925 100.0
Large-Sized 20,321,481,195 16.4
Medium-Sized 80,216,995,484 64.7
Small-Sized 22,912,490,094 18.5
Micro-Sized 485,267,153 0.4
Services 46,623,232,456 100.0
Large-Sized 11,589,096,768 24.9
Medium-Sized 13,094,038,450 28.1
Small-Sized 14,695,330,542 31.5
Micro-Sized 7,244,766,695 15.5

34
3.5.6 Assets disposal
Figure 3.7 illustrates information on the disposal of assets by establishments. A total of
GH¢20,302,508,034 worth of assets were disposed off during the reference period. The
Figure shows that a very high percentage (95.8%) of the value of assets in the Industry sector,
equivalent to GH¢19.4 billion was disposed off. The service sector disposed of GH¢842.6
million (4.2%) worth of assets while the Agriculture sector disposed of assets worth GH¢15.6
million.
Figure 3.7: Disposal of assets
Out of the total disposed assets, 90.9 percent (GH¢18.4 billion) were machinery and other
equipment. Transport and equipment disposed off amounted to GH¢683 million, representing
3.3 percent. Other construction and land improvements recorded the least disposals with a
value of GH¢81 million which constitutes only 0.3 percent (Figure 3.8).
15.6
19,444.3
842.6
-
5,000.0
10,000.0
15,000.0
20,000.0
25,000.0
Agriculture Industry Services
GH
¢ m
illio
n
Sector

35
Figure 3.8: Type of assets disposed
Table 3.21 indicates the share of regions in the disposal of fixed assets by establishments. As
high as 95.9 percent of the value of assets (GH¢19.5 billion) disposed off was by
establishments located in the Greater Accra region. All the other regions together contributed
three percent (4.11%) to the total value of assets disposed.
Table 3.25: Disposal of fixed assets by region
Region Value Percent
National 20,302,371,509 100.0
Western 589,900,760 2.9
Central 5,856,073 0.0
Greater Accra 19,467,223,130 95.9
Volta 5,485,451 0.0
Eastern 9,425,254 0.0
Ashanti 214,559,532 1.1
Brong Ahafo 2,399,715 0.0
Northern 5,917,799 0.0
Upper East 296,820 0.0
Upper West 1,306,975 0.0
3.5.7 Depreciation of fixed assets
Depreciation is the value of wear and tear of fixed assets in the course of the financial year.
It is the value allowed at current replacement cost of assets used up during the year through
normal wear and tear, foreseen obsolescence and the normal rate of accidental damage.
53
242
81
58
683
18,471
177
- 2,000 4,000 6,000 8,000 10,000 12,000 14,000 16,000 18,000 20,000
Intangible Assets
Land
Other Construction and land Improvements
Buildings
Transport and Equipments
Machinary and Other Equipments
Furniture and Fittings
Value (GH¢ million)
Typ
e o
f as
set
dis
po
sed
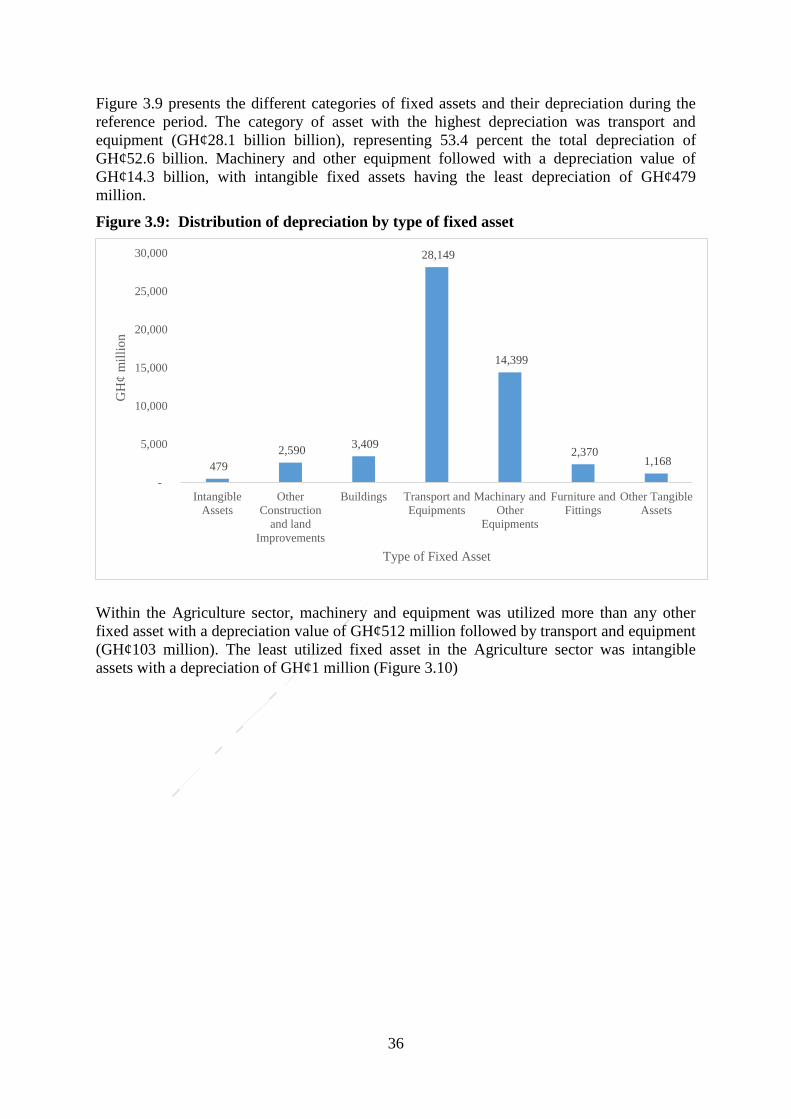
36
Figure 3.9 presents the different categories of fixed assets and their depreciation during the
reference period. The category of asset with the highest depreciation was transport and
equipment (GH¢28.1 billion billion), representing 53.4 percent the total depreciation of
GH¢52.6 billion. Machinery and other equipment followed with a depreciation value of
GH¢14.3 billion, with intangible fixed assets having the least depreciation of GH¢479
million.
Figure 3.9: Distribution of depreciation by type of fixed asset
Within the Agriculture sector, machinery and equipment was utilized more than any other
fixed asset with a depreciation value of GH¢512 million followed by transport and equipment
(GH¢103 million). The least utilized fixed asset in the Agriculture sector was intangible
assets with a depreciation of GH¢1 million (Figure 3.10)
479
2,590 3,409
28,149
14,399
2,370 1,168
-
5,000
10,000
15,000
20,000
25,000
30,000
Intangible
Assets
Other
Construction
and land
Improvements
Buildings Transport and
Equipments
Machinary and
Other
Equipments
Furniture and
Fittings
Other Tangible
Assets
GH
¢ m
illi
on
Type of Fixed Asset

37
Figure 3.10: Distribution of depreciation by type of fixed asset in the Agriculture sector
Figure 3.11 indicates that in the Industry sector, machinery and other transport equipment
recorded a depreciation of GH¢13.0 billion, and transport and equipment, GH¢3.7 billion
depreciation. The depreciation for other construction and land improvement for the sector
was GH¢2.4 billion.
Figure 3.11: Distribution of depreciation by type of fixed asset in the Industry sector
1 20 10
103
512
2 22
0
100
200
300
400
500
600
GH
¢ m
illi
on
Type of Fixed Asset
109
2,407
732
3,774
13,020
1,104 458
-
2,000
4,000
6,000
8,000
10,000
12,000
14,000
GH
¢ m
illi
on
Type of Fixed Asset

38
Unlike the Agriculture and Industry sectors, the Service sector had the highest depreciation for
transport and equipment (GH¢24.2 billion) followed by buildings (GH¢2.6 billion). There was a
higher value of depreciation of intangible assets (GH¢368 million) in the Service sector
compared to the Agriculture (GH¢1 million) and Industry (GH¢109 million) sectors.
Figure 3.12: Distribution of depreciation by type of fixed asset in the Service sector
Table 3.22 shows the depreciation of fixed assets by the size of establishment across all the three
sectors. Almost all depreciation in the Agriculture sector was in the large sized establishments,
GH¢6.2 billion representing 94 percent of all assets. The value of depreciation of assets in small
sized Agriculture businesses was GH¢24.4 million, representing 3.6 percent of total
depreciation within the sector.
More than half (54.6%) of total depreciation in the Industry sector was among the medium-
sized establishments (GH¢11.7 billion) while micro-sized businesses recorded the least
depreciation of GH¢39 million, equivalent to 0.2 percent.
About 70 percent of depreciation of fixed assets in the Service sector was among small-sized
businesses. Large-sized businesses in the sector had a total depreciation of GH¢3.4 billion
with medium and micro-sized establishments together having a depreciation of about GH¢3.4
billion
368 163 2,667
24,272
867 1,264 689
-
5,000
10,000
15,000
20,000
25,000
30,000
GH
¢ m
illio
n
Type of Fixed Asset
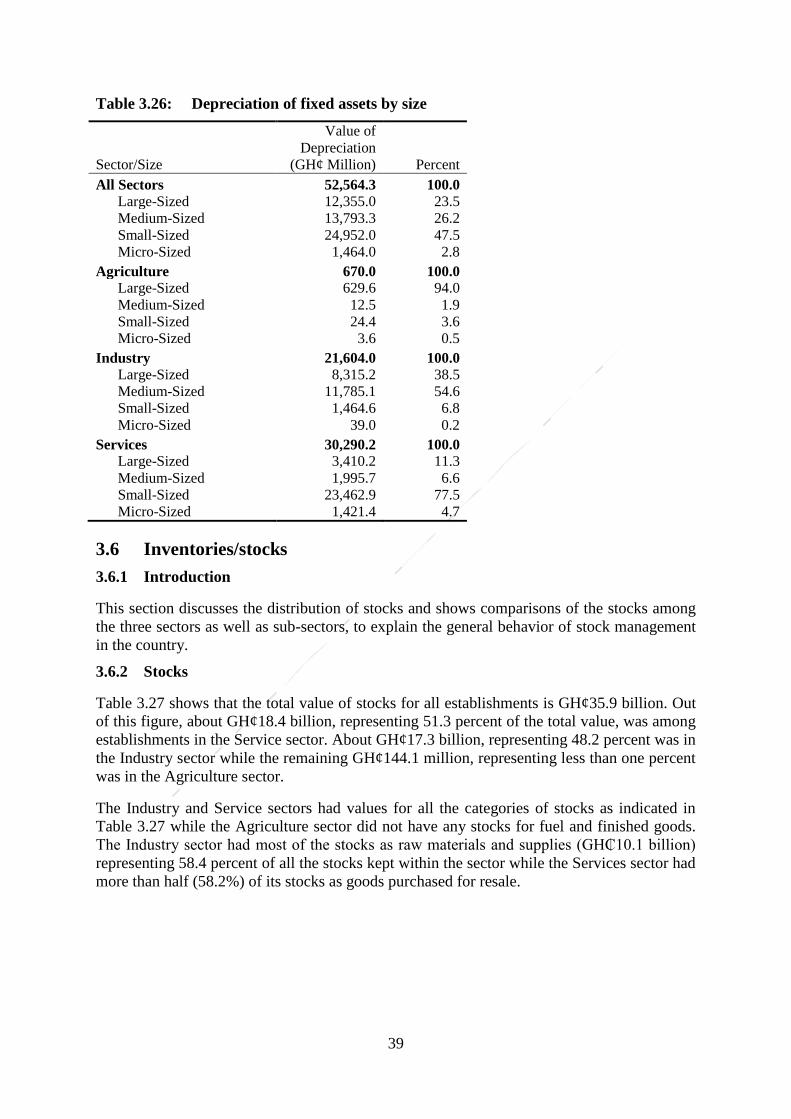
39
Table 3.26: Depreciation of fixed assets by size
Sector/Size
Value of
Depreciation
(GH¢ Million) Percent
All Sectors 52,564.3 100.0
Large-Sized 12,355.0 23.5
Medium-Sized 13,793.3 26.2
Small-Sized 24,952.0 47.5
Micro-Sized 1,464.0 2.8
Agriculture 670.0 100.0
Large-Sized 629.6 94.0
Medium-Sized 12.5 1.9
Small-Sized 24.4 3.6
Micro-Sized 3.6 0.5
Industry 21,604.0 100.0
Large-Sized 8,315.2 38.5
Medium-Sized 11,785.1 54.6
Small-Sized 1,464.6 6.8
Micro-Sized 39.0 0.2
Services 30,290.2 100.0
Large-Sized 3,410.2 11.3
Medium-Sized 1,995.7 6.6
Small-Sized 23,462.9 77.5
Micro-Sized 1,421.4 4.7
3.6 Inventories/stocks
3.6.1 Introduction
This section discusses the distribution of stocks and shows comparisons of the stocks among
the three sectors as well as sub-sectors, to explain the general behavior of stock management
in the country.
3.6.2 Stocks
Table 3.27 shows that the total value of stocks for all establishments is GH¢35.9 billion. Out
of this figure, about GH¢18.4 billion, representing 51.3 percent of the total value, was among
establishments in the Service sector. About GH¢17.3 billion, representing 48.2 percent was in
the Industry sector while the remaining GH¢144.1 million, representing less than one percent
was in the Agriculture sector.
The Industry and Service sectors had values for all the categories of stocks as indicated in
Table 3.27 while the Agriculture sector did not have any stocks for fuel and finished goods.
The Industry sector had most of the stocks as raw materials and supplies (GH₵10.1 billion)
representing 58.4 percent of all the stocks kept within the sector while the Services sector had
more than half (58.2%) of its stocks as goods purchased for resale.

40
Table 3.27: Value of stocks in Ghana Cedis at end of year by sector
Sector Total
Raw materials
and supplies
Work in
progress Fuel
Finished
goods
Goods for
resale Others stocks
All Sectors 37,384,449,157 23,062,125,731 4,279,176,676 149,088,562 1,107,440,818 3,828,347,429 4,958,269,941
Agriculture 118,166,909 58,800,203
- - 35,324,802 24,041,904
Industry 18,593,750,595 10,096,074,473 4,279,176,676 149,088,562 1,107,440,818 774,293,713 2,187,676,353
Service 18,672,531,653 12,907,251,055 3,018,728,914 2,746,551,684

41
Table 3.28 presents the stocks in the various sub-sectors under the Agriculture sector. Crop
and animal production and hunting had the highest share of inventory (GH¢118 million) in
the Agriculture sector, representing about 81.9 percent of the total stocks in the sector.
Inventory in the Fishing and aquaculture sub-sector was valued at GH¢23.9 million (16.6%)
while Forestry and logging had GH¢1.2 million, representing less than one percent. Stocks in
the Crop and animal production and hunting was mostly in the form of goods for resale. In
the Fishing and aquaculture sub-sector, most of the stocks was in the form of raw materials
and supplies.
Table 3.28: Value of stocks in the Agriculture sector by sub-sector and type of stock
Sub-sector Total
Raw
materials
and
supplies
Work in
progress
Goods for
resale
Other
stocks
Agriculture 144,075,186 58,893,260 22,692,103 38,447,919 24,041,904
Agriculture, forestry and fishing 144,075,186 58,893,260 22,692,103 38,447,919 24,041,904
Crop and animal production,
hunting 118,827,529 34,762,028 21,655,509 38,389,708 24,020,284
Forestry and logging 1,279,912 1,196,341 62,371 500 20,700
Fishing and aquaculture 23,967,745 22,934,891 974,223 57,711 920
Table 3.29 shows that the total stock in the Industry sector was GH¢17.3 billion. Of this, the
Construction sub-sector accounted for 64.4 percent of the total stocks for the sector. Stocks in
Manufacturing constituted 19.7 percent, with the other sub-sectors each having less than 10
percent share. It is observed that with the exception of the Electricity, gas, steam and air
conditioning sub-sector which kept the highest stock as work in progress (GH¢658.1million),
all the other sub-sectors kept the highest levels of their stocks as raw materials and supplies.

42
Table 3.29: Value of stocks in the Industry sector by sub-sector and type of stock
Sub-sector Total
Raw materials
and supplies
Work in
progress Fuel
Finished
goods
Goods for
resale Other stocks
Industry 17,325,590,053 10,124,614,457 3,637,900,603 148,875,949 1,136,336,420 769,303,852 1,508,558,772
Mining and quarrying 1,005,081,528 482,668,206 125,067,273 58,778,263 138,574,397 48,917,823 151,075,566
Manufacturing 3,424,304,455 1,744,274,059 597,301,997 43,587,362 733,869,890 159,206,646 146,064,501
Electricity, gas, steam and air conditioning 1,702,963,129 14,642,476 658,072,722 104,916 162,251 403,740 1,029,577,024
Water supply; sewerage, waste
management 34,530,433 14,776,854 480,923 142,074 290,319 1,652,463 17,187,800
Construction 11,158,710,508 7,868,252,862 2,256,977,688 46,263,334 263,439,563 559,123,180 164,653,881

43
In the Service sector, the wholesale and retail trade sub-sector had about 79.5 percent
(GH¢14.5 billion) of the total value of stocks (Table 3.30). This is followed by the Financial
and insurance sub-sector with about 11.0 percent (GH¢2.1 billion). All the other sub-sectors
within the Service sector contributed less than 2 percent to the total stock in the sector.

44
Table 3.30: Value of stocks in the Service sector by sub-sector and type of stock
Establishments
Total
GH¢
Raw
Materials and
Supplies
GH¢
Work In
Progress
GH¢
Fuel
GH¢
Finished
Goods
GH¢
Goods for
Resale
GH¢
Other
Stocks
GH¢
Services 18,295,130,713 6,877,365,265 690,777 582,865 535,212 10,673,623,635 742,333,199
Wholesale and retail trade and repair of motor vehicles and
motorcycles 14,541,403,442 4,208,764,971 539,852 30,160 6,340 10,118,457,212 213,604,907
Transportation and storage 217,733,538 107,882,942 - - - 92,248,409 17,602,187
Accommodation and food service activity 292,908,868 152,211,785 - - - 117,101,853 23,595,230
Information and communication 335,793,403 196,049,699 4,760 70 5,250 133,040,276 6,693,348
Financial and insurance activities 2,054,841,066 1,654,345,589 - - - 21,640,703 378,854,774
Professional, scientific and technical activities 69,244,945 21,138,055 137,889 77,501 451,285 30,091,646 17,348,569
Administrative and support service activities 124,674,413 12,142,022 3,258 472,635 47,924 43,267,167 68,741,407
Education 57,904,569 40,364,400 - - - 14,713,326 2,826,843
Human health and social work activities 454,107,041 391,270,754 - 2,264 3,542 57,217,503 5,612,978
Arts, entertainment and recreation 2,221,901 1,438,927 4,053 - 6,868 591,780 180,273
Other service activities 144,297,479 91,756,073 917 187 13,955 45,253,712 7,272,635

45
Table 3.31 presents the regional distribution of stocks by sector. The Greater Accra region
recorded the highest share of stocks valued at GH¢26.9 billion (70.9%) in all the three
sectors, out of the national stockpile of GH¢38.0 billion. Ashanti region followed with
GH¢6.5 billion (17.0%) while the Eastern region had a total value of GH¢1.1 billion (2.8%).
The Upper West region recorded the least value of stocks, GH¢108.1 million (0.3%). It is
observed that establishments located in the Greater Accra region and engaged in industrial
(GH¢12.3 billion) and Service (GH¢14.6 billion) activities together accounted for 70.7
percent of the total stocks in the country.

46
Table 3.31: Value of stocks by region and by sector
Region
Total Agriculture Industry Service
GH¢ Percent GH¢ Percent GH¢ Percent GH¢ Percent
National 38,050,742,650 100.0
144,075,185 100.0
18,388,245,827 100.0
19,518,421,638 100.0
Western 731,750,180 2.0
5,700,061 4.0
64,204,973 0.0
661,845,146 3.0
Central 784,331,679 2.0
1,586,163 1.0
388,419,546 2.0
394,325,970 2.0
Greater Accra 26,962,490,440 71.0
58,445,667 41.0
12,289,858,007 67.0
14,614,186,766 75.0
Volta 265,631,215 1.0
5,780,382 4.0
125,718,127 1.0
134,132,706 1.0
Eastern 1,061,072,510 3.0
8,833,689 6.0
473,132,584 3.0
579,106,237 3.0
Ashanti 6,468,668,977 17.0
37,439,765 26.0
3,749,403,127 20.0
2,681,826,085 14.0
Brong Ahafo 791,620,982 2.0
22,520,492 16.0
400,780,322 2.0
368,320,168 2.0
Northern 475,188,041 1.0
3,149,268 2.0
179,921,732 1.0
292,117,041 2.0
Upper East 769,902,039 2.0
297,731 0.0
379,721,641 2.0
389,882,667 2.0
Upper West 108,090,372 0.0 321,967 0.0 43,244,407 0.0 64,523,998 0.0

47
3.7 Employment and compensation of employees
3.7.1 Introduction
This section presents information on key labour market indicators notably, the employed
population engaged by non-household establishments and compensation to labour. To a large
extent, this will help to identify sectors with the potential for employment opportunities
within the economy and also help policy makers to identify appropriate policies and actions
for fostering job growth.
3.7.2 Employment
The survey collected detailed information on persons engaged by the establishments. This
includes working owners, persons who were on the payroll of the establishments, unpaid
family members who help in the entrepreneurial activities and apprentices. However, all
National Service Personnel engaged by the establishments are excluded. Figure 3.13 shows
that 3,102,917 persons were engaged by establishments of which 74.6 percent (2,314,309
persons) were engaged by the Service sector, 23.7 percent (734,341 persons) by Industry
while 1.7 percent (54,267 persons) were engaged by the Agriculture sector. Of the total
persons engaged, 58.8 percent (1,823,070 persons) were employees. The Agriculture sector
recorded the highest proportion (81.7%) of employees while the Industry sector had the least
proportion (56.9%) of employees.
Figure 3.13: Persons engaged in establishments by sector
Table 3.32 shows that majority (94.3%) of the agricultural workers (54,267 persons) were
engaged by the Crop and animal production, hunting and related service activities sub-sector.
It is also observed that 570,327 (77.7%) of the persons engaged by the Industry sector
worked in the Manufacturing sub-sector while 71,567 persons (9.7%) were engaged by the
Construction sub-sector. Within the Service sector, about one-third (33.6%), representing
778,587 persons, were engaged by the Wholesale and retail trade sub-sector while 13.3
1,823,070
44,333
417,528
1,361,209
3,102,917
54,267
734,341
2,314,309
0 500,000 1,000,000 1,500,000 2,000,000 2,500,000 3,000,000 3,500,000
All sectors
Agriculture
Industry
Service
Persons engaged Employees

48
percent (308,944 persons) were engaged by the Education sub-sector. Altogether, the
Wholesale and retail trade, Manufacturing and Education sub-sectors engaged 53.4 percent of
the total persons engaged. Table 3.28 further shows that 60.6 percent of persons engaged by
four sub-sectors: Wholesale and retail trade; repair of motor vehicles and motorcycles;
Education; Manufacturing and Financial and insurance activities are employees.
Table 3.32: Persons engaged and employees by sector
Sectors/ Sub-sectors
Persons Engaged Employees
Number Percent Number Percent
All sectors 3,102,917 100.0
1,823,070 58.8
Agriculture 54,267 100.0
44,333 81.7
Crop and animal production, hunting and related
service activities 51,155 94.3
41,635 81.4
Forestry and logging 697 1.3
639 91.7
Fishing and aquaculture 2,415 4.4
2,059 85.3
Industry 734,341 100.0
417,528 56.9
Mining and quarrying 48,977 6.7
40,121 81.9
Manufacturing 570,327 77.7
271,862 47.7
Electricity, gas, steam and air conditioning supply 18,063 2.5
17,280 95.7
Water supply; sewerage, waste management 25,407 3.5
24,242 95.4
Construction 71,567 9.7
64,023 89.5
Service 2,314,309 100.0
1,361,209 58.8
Wholesale and retail trade; repair of motor vehicles
and motorcycles 778,587 33.6
342,511 44.0
Transportation and storage 41,292 1.8
35,316 85.5
Accommodation and food service activities 227,588 9.8
152,848 67.2
Information and communication 29,733 1.3
24,583 82.7
Financial and insurance activities 223,389 9.7
204,120 91.4
Real estate activities 7,408 0.3
6,908 93.3
Professional, scientific and technical activities 39,921 1.7
28,935 72.5
Administrative and support service activities 88,022 3.8
76,112 86.5
Education 308,944 13.3
286,011 92.6
Human health and social work activities 75,171 3.2
65,014 86.5
Arts, entertainment and recreation 16,385 0.7
11,697 71.4
Other service activities 477,868 20.6 127,153 26.6
It is further observed that about three-quarters (76.7%) of persons engaged by the Agriculture
sector (41,635 persons) were employees working in the Crop and animal production, hunting
and related service activities sub-sector. A little more than half (51.2%) of persons engaged
by the Industry sector are employees (376,006 persons) working in Manufacturing,
Construction and Mining and Quarrying sub-sectors. In the Service sector, 42.6 percent of all
persons engaged are employees working in the Wholesale and retail trade, Education,
Financial and insurance activities and Accommodation and food service activities sub-sectors
(Table 3.33).
In terms of size, the small-sized and micro-sized establishments together, engaged 71.4
percent of the total workforce while the large-sized establishments engaged 16.6 percent.
However, the proportions of employees in the small-sized (57.8%) and micro-sized (33.4%)
establishments are low. More than half (51.9%) of persons engaged by the Agriculture sector
worked in large-sized establishments and 26.9 percent worked in small-sized establishments.
With respect to workers in the Industry sector, less than one-quarter (24.3%) were engaged
by the large-sized establishments and about two-fifths (39.3%) worked in small-sized
establishments. Within the Service sector, 73.7 percent of the workforce were engaged by
small-sized and micro-sized establishments while 13.3 percent were engaged by the large-
sized establishments (Table 3.29).

49
Table 3.33: Persons engaged and employees by establishment size and sector
Sector/ Sub-sector
Persons Engaged Employees
Number Percent Number Percent
All sectors 3,102,917 100
1,823,070 58.8
Large 515,152 16.6
467,920 90.8
Medium 371,743 12.0
317,038 85.3
Small 1,219,792 39.3
705,406 57.8
Micro 996,230 32.1
332,706 33.4
Agriculture 54,267 100
44,333 81.7
Large 28,145 51.9
26,761 95.1
Medium 6,533 12.0
4,981 76.2
Small 14,615 26.9
10,191 69.7
Micro 4,975 9.2
2,400 48.2
Industry 734,341 100
417,528 56.9
Large 178,551 24.3
163,721 91.7
Medium 65,410 8.9
56,556 86.5
Small 288,618 39.3
135,214 46.8
Micro 201,762 27.5
62,037 30.7
Service 2,314,309 100
1,361,209 58.8
Large 308,456 13.3
277,439 89.9
Medium 299,800 13.0
255,500 85.2
Small 916,560 39.6
560,001 61.1
Micro 789,493 34.1 268,269 34.0
Generally, relatively higher proportions of employees worked in large-sized establishments.
Irrespective of the sector of employment, the proportion of employees increases with the size
of establishment. Whereas the micro-sized establishments recorded about one-third (33.4%)
of employees, large-sized establishments recorded 90.8 percent of employees. Similar trends
are seen in the various sectors with the Agriculture sector engaging the highest proportion
(95.1%) of employees in the large-sized establishments with the Industry sector engaging the
least proportion (30.7%) of employees in the micro-sized establishments (Table 3.29).
Table 3.34 shows the regional distribution of persons engaged and employees. Out of the
3,102,917 persons engaged by all establishments, 1,115,768 persons, representing 36 percent
worked in establishments located in the Greater Accra region, 16.9 percent worked in
establishments located in the Ashanti Region while 10.3 percent worked in establishments
located in the Western Region. The proportion of employees was highest in the Greater Accra
region (77.7%) and lowest in Upper West region (29.7%).

50
Table 3.34: Persons engaged and employees by region
Region
Persons engaged
Employees
Number Percent Number Percent
All sectors 3,102,917 100.0
1,823,070 58.8
Western 318,698 10.3
174,574 54.8
Central 205,913 6.6
97,820 47.5
Greater Accra 1,115,768 36.0
866,581 77.7
Volta 157,131 5.1
72,702 46.3
Eastern 221,835 7.1
115,202 51.9
Ashanti 523,308 16.9
267,631 51.1
Brong Ahafo 231,590 7.5
112,096 48.4
Northern 188,709 6.1
70,981 37.6
Upper East 89,551 2.9
30,494 34.1
Upper West 50,415 1.6 14,990 29.7
3.7.3 Compensation of employees
Compensation of employees is the total remuneration, in cash or in kind, payable by an
establishment to an employee in return for work done by the employee during the accounting
period. Compensation of employees has three main components:
i) Wages and salaries payable in cash or in kind;
ii) Value of social security contributions payable by the employer; and
iii) Other supplement to wages and salaries.
Figure 3.14 shows that total compensation paid to the 1,823,070 employees amounted to
GH¢30.4 billion. Wages and salaries paid to employees was about GH¢28.7 billion which
represents 94.4 percent of total compensation to employees. In total, about GH¢1.0 billion
was paid by employers on behalf of their employees as social security contributions, which
formed 3.4 percent of the total compensation to employees. Other supplement to wages such
as end of year bonuses, personal insurance, medical schemes, etc. was about GH¢666.6
million, representing 2.2 percent of the total compensation to employees.

51
Figure 3.14: Compensation (GH¢’000) of employees by type of compensation
Figure 3.15 indicates that as much as GH¢17.1 billion was paid as wages and salaries to those
who worked in the Service sector. This amount constitutes 60.1 percent of total wages and
salaries paid to employees. Within the Service sector however, the amount forms 76.6 percent
of total wages and salaries paid to employees who worked in the sector. About two-fifths
(39.3%) of total wages and salaries amounting to about GH¢11.5 billion was paid to those
who worked in the Industry sector. Employees who worked in the Agriculture sector received
less than one percent of total wages and salaries.
Social security and other supplement to wages and salaries paid to employees follow a similar
trend. About 64.8 percent of the total social security payments by employers and 60.1 percent
of total payments as other supplement to wages and salaries went to employees in the Service
sector. Employees who worked in the Industry sector received 34.6 percent of the total social
security payments and 39.3 percent of the total payments as other supplement to wages and
salaries. Employees in the Agriculture sector received less than one percent of total social
security payments and other supplement to wages and salaries (Figure 3.12).
28,727,528
1,044,347 666,599
0
5,000,000
10,000,000
15,000,000
20,000,000
25,000,000
30,000,000
35,000,000
Wages and salaries (cash and in-
kind)
Social security Other supplement to wages and
salaries
Am
ou
nt
GH
¢’0
00
)

52
Figure 3.15: Compensation (GH¢’000) of employees by sector and type of
compensation
Table 3.35 shows that employees in the Mining and quarrying and Financial and insurance
activities sub-sectors together received about GH¢17.1 billion (59.4%) of the total wages and
salaries paid to employees. Employees who worked in the Financial and insurance activities
sub-sector received 47.4 percent of the social security payments (GH¢494,828,685) and 38.4
percent of other supplement to wages and salaries (GH¢256,106,359).
Out of the total wages and salaries paid to employees within the Agriculture sector, 67.2
percent (GH¢97.1 million) was received by those in the Crop and animal production, hunting
and related service activities sub-sector; while 31.3 percent of the amount (GH¢45.2 million)
was received by those who worked in the Fishing and aquaculture sub-sector. More than
three-quarters (76.9%) of the total wages and salaries paid to employees within the Industry
sector, was received by those who worked in the Mining and Quarrying sub-sector.
Employees in the Financial and insurance activities and Education sub-sectors received 65.3
percent of the total wages and salaries paid to employees within the Service sector (Table
3.35).
About two-thirds (66.0%) of the total supplement to wages and salaries paid to employees
within the Industry sector were received by those who worked in the Electricity and Gas
supply and Mining and Quarrying sub-sectors. In the Service sector, 59.3 percent of the total
supplement to wages and salaries was paid to employees in the Financial and insurance
activities sub-sector. For those who worked in the Agriculture sector, 61.1 percent of the
amount was paid as supplement to wages to those who worked in the Crop and animal
production, hunting and related service activities sub-sector.
144,385 8,401 4,208
11,510,454
236,228 230,705
17,072,689
799,718 431,686
0
2,000,000
4,000,000
6,000,000
8,000,000
10,000,000
12,000,000
14,000,000
16,000,000
18,000,000
Wages and salaries (cash and in-
kind)
Social security Other supplement to wages and
salaries
Am
ou
nt
(GH
¢’0
00
)
Agriculture Industry Service

53
In the case of payments for social security, those who worked in the Mining and Quarrying
and Electricity and Gas supply sub-sectors received 60.4 percent of the payment to the
Industry sector while 61.9 percent of social security payments in the Service sector was
received by those who worked in the Financial and insurance activities sub-sector (Table
3.35).
Table 3.35: Compensation of employees by sector and type of compensation
Sectors/Sub-sectors
Wages and
salaries (Cash
and in-kind)
GH¢
Social
security
GH¢
Other
supplement
to wages
and salaries
GH¢
All sectors 28,727,528,284 1,044,346,659 666,599,065
Agriculture 144,384,622 8,400,790 4,208,197
Crop and animal production, hunting and related
service activities 97,080,321 5,219,712 2,570,214
Forestry and logging 2,111,791 152,164 3,415
Fishing and aquaculture 45,192,510 3,028,914 1,634,568
Industry 11,510,454,241 236,227,988 230,705,122
Mining and quarrying 8,855,455,213 75,377,113 70,011,597
Manufacturing 1,188,588,784 50,225,356 50,298,287
Electricity, gas and air conditions 807,455,034 67,386,080 82,314,744
Water supply; sewerage, waste management 127,834,115 13,943,286 18,812,306
Construction 531,121,095 29,296,153 9,268,189
Service 17,072,689,421 799,717,881 431,685,746
Wholesale and retail trade; repair of motor vehicles
and motorcycles 1,625,841,964 64,165,343 35,568,203
Transportation and storage 336,873,140 15,034,300 59,207,124
Accommodation and food service activities 636,953,775 36,354,608 14,251,000
Information and communication 335,704,427 27,033,597 10,832,646
Financial and insurance activities 8,213,312,645 494,828,685 256,106,359
Real estate activities 40,691,376 2,470,838 360,202
Professional, scientific and technical activities 358,959,459 16,564,072 5,444,463
Administrative and support service activities 1,380,611,499 12,995,308 5,744,060
Education 2,938,815,495 80,855,299 29,176,178
Human health and social work activities 624,017,128 32,713,669 6,622,959
Arts, entertainment and recreation 39,454,311 1,975,664 2,387,237
Other service activities 541,454,203 14,726,498 5,985,315
Table 3.36 shows that 63.6 percent of the total wages and salaries (GH¢18.3 billion) were
received by employees who worked in large-sized establishments. In the Industry sector, 89.1
percent of total wages and salaries (GH¢10.3 billion) was received by employees in large-
sized establishments. The proportions of total wages and salaries received by employees in
large-sized establishments within the Service (46.6%) and Agriculture (40.3%) sectors were
relatively smaller.
Table 3.36 shows the annual average compensations to employees. On average, GH¢15,758
was paid to each employee per annum as a wage. The average wage paid to employees in the
Industry sector (GH¢27,568) was higher than the average payments in the other sectors and
also higher than the national average. The average wage paid to employees in the Agriculture
sector (GH¢3,257) was the least. Large-sized establishments paid GH¢39,063 on average per
annum to their employees. Whereas large-sized establishments in Industry paid GH¢62,666
averagely per annum to their employees, those who worked in large-sized establishments in
the Agriculture sector received GH¢2,175 per annum on average.

54
Table 3.36: Compensation of employees by sector, establishment size and type
of compensation
Sector/ Sub-sector
Actual compensations
Annual average compensations
Wages and
Salaries (Cash
and in-kind)
GH¢
Social
Security
GH¢
Other
Supplement
to wages
and salaries
GH¢
Wages
and
Salaries
(Cash and
in-kind)
GH¢]
Social
Security
GH¢
Other
Supplement
to wages
and salaries
GH¢
All sectors 28,727,528,284 1,044,346,659 666,599,065
15,758 573 366
Large 18,278,503,406 703,797,358 452,428,312
39,063 1,504 967
Medium 2,958,189,212 164,353,117 75,206,957
9,331 518 237
Small 4,876,670,541 156,737,398 121,157,869
6,913 222 172
Micro 2,614,165,125 19,458,786 17,805,928
7,857 58 54
Agriculture 144,384,622 8,400,790 4,208,197
3,257 189 95
Large 58,194,773 2,933,155 1,938,337
2,175 110 72
Medium 44,320,418 3,815,808 572,680
8,898 766 115
Small 36,902,462 1,597,711 844,278
3,621 157 83
Micro 4,966,970 54,115 852,903
2,070 23 355
Industry 11,510,454,241 236,227,988 230,705,122
27,568 566 553
Large 10,259,699,644 188,315,373 200,236,346
62,666 1,150 1,223
Medium 432,618,772 24,785,680 21,127,003
7,649 438 374
Small 660,229,405 21,341,168 6,922,949
4,883 158 51
Micro 157,906,419 1,785,767 2,418,824
2,545 29 39
Service 17,072,689,421 799,717,881 431,685,746
12,542 588 317
Large 7,960,608,989 512,548,830 250,253,629
28,693 1,847 902
Medium 2,481,250,022 135,751,628 53,507,273
9,711 531 209
Small 4,179,538,674 133,798,519 113,390,642
7,463 239 202
Micro 2,451,291,736 17,618,904 14,534,201 9,137 66 54
Table 3.37 shows the regional distribution of compensations paid to employees. As high as
45.9 percent (GH¢13.2 billion) of all wages and salaries was paid to employees in
establishments located in the Greater Accra region while 37.1 percent (GH¢10.6 billion) was
paid to employees located in the Western region. Only 6.2 percent (GH¢1.8 billion) of wages
and salaries was paid to employees in the Ashanti region.

55
Table 3.37: Compensation of employees by region and type of compensation
Region
Wages and Salaries
(Cash and in-kind)
GH¢
Social Security
GH¢
Other Supplement to
wages and salaries
GH¢
Number Percent
Number Percent
Number Percent
All sectors 28,727,528,284 100.0 1,044,346,659 100.0 666,599,065 100.0
Western 10,647,812,918 37.1
74,757,902 7.2
67,439,511 10.1
Central 473,201,749 1.6
19,172,639 1.8
4,648,759 0.7
Greater Accra 13,196,310,136 45.9
783,088,636 75.0
525,558,980 78.8
Volta 294,578,518 1.0
9,816,186 0.9
1,938,768 0.3
Eastern 895,415,206 3.1
30,283,711 2.9
16,047,092 2.4
Ashanti 1,793,298,999 6.2
71,816,895 6.9
34,455,190 5.2
Brong Ahafo 673,998,041 2.3
23,278,494 2.2
9,176,310 1.4
Northern 394,653,838 1.4
24,930,257 2.4
5,423,722 0.8
Upper East 256,801,152 0.9
4,205,430 0.4
1,402,849 0.2
Upper West 101,457,727 0.4 2,996,511 0.3 507,884 0.1

56
CHAPTER FOUR
COMPARATIVE ANALYSIS OF A DECADE (2003 - 2013) OF
INDUSTRY SECTOR PERFORMANCE
In 2005, the 2003 National Industrial Census was conducted, and this was done in two
phases. The first phase, conducted in October 2003, listed and collected location and
organizational data on establishments engaged primarily in mining and quarrying,
manufacturing, construction and the production and distribution of electricity and water. The
second phase collected detailed information on industry from November 2004 to February
2005 with 2003 as the reference period.
Unlike the previous industrial censuses which focused only on the Industry sector, the 2013
economic census covered not only Industry but also, the Service and Agriculture sectors. In
both the 2003 and 2013 surveys, data collection was undertaken in two phases, with the first
phase providing the sampling frame, while the second phase collected detailed operational
data on the activities of the businesses. To a large extent, both surveys are similar except for
the scope, as they seek, among others, to provide the needed critical data for re-basing the
country’s GDP. In view of the similarity that exists between the two surveys, it is permissible
to compare the performance of the Industrial sector in 2003 to that in 2013. This chapter,
therefore, seeks to provide insight into possible changes in the Industry sector over the period
2003 to 2013. This would be done for indicators such as gross output, gross value added,
compensation of employees, material cost for production, and the workforce used in industry.
Figure 4.1 shows the number of establishments, number of employees and number of persons
engaged in the Industry sector in 2003 and 2013.The number of establishments in the sector
increased from 24,133 in 2003 to 102,916 in 2013 representing a growth of 326.5 percent.
The number of employees grew by 146.4 percent in 2013, an indication that, the number of
employees have over the decade increased from 143,467 in 2003 to 353,505 employees in
2013 o. Similarly, the number of persons engaged increased from 249,062 in 2003 to 662,774
in 2013, representing a growth in persons engaged over the decade in industry sector to be
166.1 percent.

57
Figure 4.1: Establishments, employees and persons engaged by all industry for
2003 and 2013
Source: Phase II of 2003 Industrial Census and 2013 Economic Census
Real wages measured in United Stated Dollars is examined for the industry sector in Figure 4.2. The
results indicates that over the decade, wages and salaries paid to labour in the sector have significantly
increased. . The total wages and salaries paid to labour increased from US$284 million in 2003 to
US$5,630.4 million in 2013, indicating a growth of 1,886 percent.. This increase far exceeds the
growth in number of the employees in the sector over the same period.
Figure 4.2: Wages and salaries for all industry in 2003 and 2013
Source: Phase II of 2003 Industrial Census and 2013 Economic Census
Table 4.1 indicates the number of establishments and persons engaged, that operated in the
three sub-sectors of Industry irrespective of size. The total number of establishments
increased from 24,133 in 2003 to 102,916 in 2013 representing a growth of 326.5 percent.
Manufacturing establishments grew by 327.7 percent, increasing from 23,797 in 2003 to
0
50,000
100,000
150,000
200,000
250,000
300,000
350,000
400,000
450,000
500,000
550,000
600,000
650,000
700,000
Number of
Establishments
Number of Employees Number of Persons
Engaged
24,133
143467
249,062
102,916
353505
662,774
2003
2013
0.0
1000.0
2000.0
3000.0
4000.0
5000.0
6000.0
2003 2013
283.5
5630.4
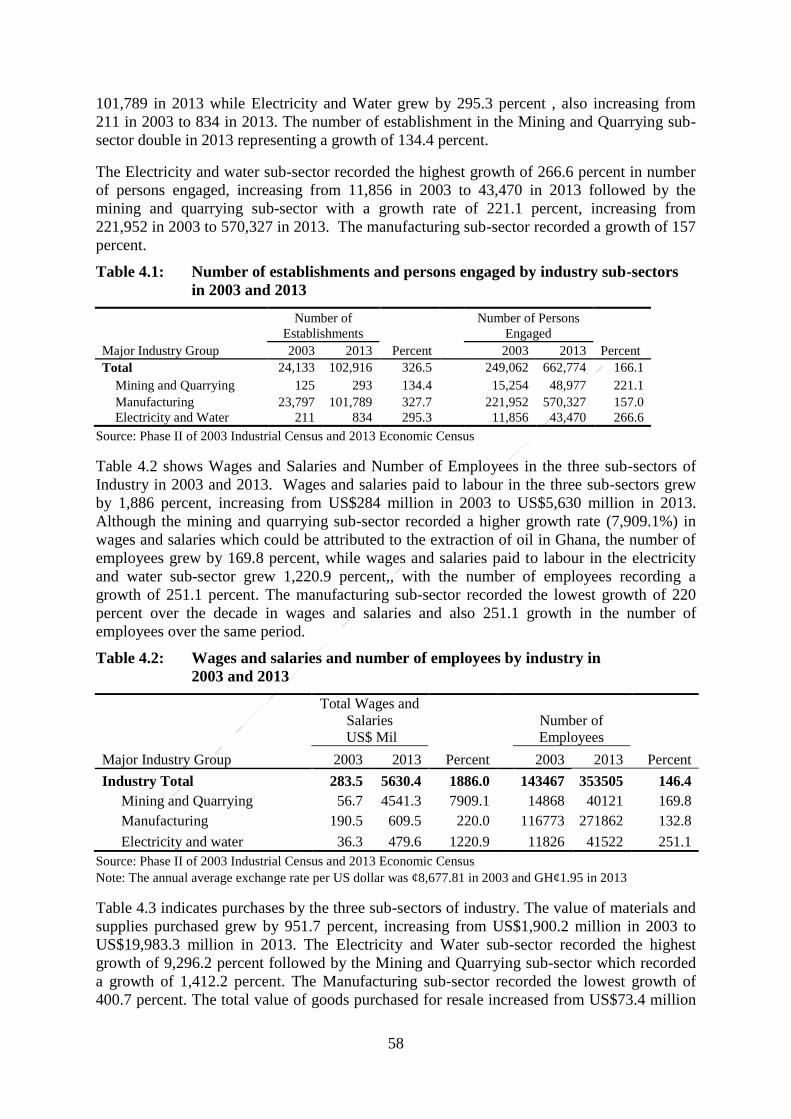
58
101,789 in 2013 while Electricity and Water grew by 295.3 percent , also increasing from
211 in 2003 to 834 in 2013. The number of establishment in the Mining and Quarrying sub-
sector double in 2013 representing a growth of 134.4 percent.
The Electricity and water sub-sector recorded the highest growth of 266.6 percent in number
of persons engaged, increasing from 11,856 in 2003 to 43,470 in 2013 followed by the
mining and quarrying sub-sector with a growth rate of 221.1 percent, increasing from
221,952 in 2003 to 570,327 in 2013. The manufacturing sub-sector recorded a growth of 157
percent.
Table 4.1: Number of establishments and persons engaged by industry sub-sectors
in 2003 and 2013
Major Industry Group
Number of
Establishments
Percent
Number of Persons
Engaged
Percent 2003 2013
2003 2013
Total 24,133 102,916 326.5
249,062 662,774 166.1
Mining and Quarrying 125 293 134.4
15,254 48,977 221.1
Manufacturing 23,797 101,789 327.7
221,952 570,327 157.0
Electricity and Water 211 834 295.3
11,856 43,470 266.6
Source: Phase II of 2003 Industrial Census and 2013 Economic Census
Table 4.2 shows Wages and Salaries and Number of Employees in the three sub-sectors of
Industry in 2003 and 2013. Wages and salaries paid to labour in the three sub-sectors grew
by 1,886 percent, increasing from US$284 million in 2003 to US$5,630 million in 2013.
Although the mining and quarrying sub-sector recorded a higher growth rate (7,909.1%) in
wages and salaries which could be attributed to the extraction of oil in Ghana, the number of
employees grew by 169.8 percent, while wages and salaries paid to labour in the electricity
and water sub-sector grew 1,220.9 percent,, with the number of employees recording a
growth of 251.1 percent. The manufacturing sub-sector recorded the lowest growth of 220
percent over the decade in wages and salaries and also 251.1 growth in the number of
employees over the same period.
Table 4.2: Wages and salaries and number of employees by industry in
2003 and 2013
Major Industry Group
Total Wages and
Salaries
US$ Mil
Percent
Number of
Employees
Percent 2003 2013 2003 2013
Industry Total 283.5 5630.4 1886.0 143467 353505 146.4
Mining and Quarrying 56.7 4541.3 7909.1 14868 40121 169.8
Manufacturing 190.5 609.5 220.0 116773 271862 132.8
Electricity and water 36.3 479.6 1220.9 11826 41522 251.1
Source: Phase II of 2003 Industrial Census and 2013 Economic Census
Note: The annual average exchange rate per US dollar was ¢8,677.81 in 2003 and GH¢1.95 in 2013
Table 4.3 indicates purchases by the three sub-sectors of industry. The value of materials and
supplies purchased grew by 951.7 percent, increasing from US$1,900.2 million in 2003 to
US$19,983.3 million in 2013. The Electricity and Water sub-sector recorded the highest
growth of 9,296.2 percent followed by the Mining and Quarrying sub-sector which recorded
a growth of 1,412.2 percent. The Manufacturing sub-sector recorded the lowest growth of
400.7 percent. The total value of goods purchased for resale increased from US$73.4 million

59
in 2003 to US$1,078.1 million in 2013 indicating a growth of 1,360.5 percent. In terms of
changes in the sub-sectors, the Mining and quarrying sub-sector recorded the highest growth
of 9,754.7 percent followed by the Manufacturing sub-sector with 591.5. There was no
growth recorded in the Electricity and Water sub-sector.
The value of purchased fuel grew by 4,372.8 percent, increasing from US$72 million in 2003
to US$3,221.9 million in 2013. The Electricity and Water sub-sector grew by 69,939.1
percent followed by the Mining and Quarrying sub-sector with 7,163.0 percent. The
Manufacturing sub-sector recorded the lowest growth of 309.3 percent. Electricity purchased
increased from US$446.1 million in 2003 to US$775 million in 2013. The Mining and
quarrying sub-sector recorded the highest growth of 567.3 percent which was more than three
times that of the Manufacturing sub-sector (178.6%).
A decade examination of Total Receipts, shows that in 2013 total receipts for industry was
$39,957.5million, and this was more than nine times that of 2003 ($4,257.0 million).
Examining this within the sub-sectors, the Mining and Quarrying sub-sector recorded the
highest growth (1,367.5%) in total receipts, increasing from US$608.5 million in 2003 to
US$8,930.3 million in 2013. The Manufacturing and Electricity and Water sub-sectors
recorded growths of 610.9 percent and 532.5 percent respectively (Table 4.4). Receipts from
sales from main industrial activity grew by 836.9 percent, increasing from US$4,083.6
million in 2003 to US$3,8257.6 million in 2013. The Mining and Quarrying sub-sector grew
by 1,292 percent followed by the Manufacturing sub-sector with 636.1 percent The
Electricity and Water sub-sector recorded the lowest growth of 498.4 percent.
Receipts from other industrial services grew by 1,505 percent with the Mining and
Quarrying sub-sector recording a significant growth of 67,919.8 percent followed by
electricity and water sub-sector with 7,806.6 percent . The Manufacturing sub-sector recorded
the lowest growth of 310.9 percent. Receipts from sales of goods sold in the same condition
grew by 146.3 percent, increasing from US$79.8 million in 2003 to US$196 million in 2013.
The Mining and Quarrying and Manufacturing sub-sectors recorded growths of 8621.2
percent and 52.1 percent respectively.

60
Table 4.3: Purchases by industry in 2003 and 2013
Major Industry Group
Material and
Supplies
US$ Mill
Percent
Goods
Purchased
for Resale
US$ Mill
Percent
Fuel purchased
US$ Mill
Percent
Electricity
purchased
US$ Mill
Percent 2003 2013 2003 2013 2003 2013 2003 2013
Industry Total 1900.2 19983 951.7 73.8 1078.1 1360.5
72 3221.9 4372.8
446.1 775.4 73.8
Mining and Quarrying 99.8 1509.7 1412.2 0.3 30.8 9754.7
19.3 1404.8 7163
34.6 230.7 567.3
Manufacturing 1694 8481.9 400.7 73.5 508.3 591.5
50.4 206.2 309.3
56.4 157 178.6
Electricity and Water 106.3 9991.7 9296.2 539 2.3 1610.9 69306.8 355.2 387.7 9.2
Source: Phase II of 2003 Industrial census and 2013 Economic Census
The annual average exchange rate per US dollar was ¢ 8,677.81 in 2003 and GH¢1.95 in 2013

61
Table 4.4: Receipts in Industry in 2003 and 2013
Major Industrial Group
Total
US$ Mil
Sales from main industrial
activity
US$ Mil
Receipts for other industrial
services
US$ Mil
Sale of goods sold in
same condition
US$ Mil
2003 2013 Percent 2003 2013 percent 2003 2013 Percent 2003 2013 Percent
Industry 4257.0 39957.5 838.6
4083.6 38257.6 836.9
93.7 1503.4 1505.0
79.8 196.5 146.3
Mining and quarrying 608.5 8930.3 1367.5
607.8 8460.6 1292.0
0.7 466.3 67919.8
- 3.3 8621.2
Manufacturing 3026.6 21516.6 610.9
2855.5 21020.0 636.1
91.3 375.3 310.9
79.7 121.3 52.1
Electricity and water 621.9 3877.6 523.5 620.2 3711.0 498.3 1.6 129.9 7806.6 - 36.8 -
Source: Phase II of 2003 Industrial Census and 2013 Economic Census
The annual average exchange rate per US dollar was ¢8,677.81 in 2003 and GH¢1.95 in 2013

62
Over the decade, the total depreciation of fixed assets in Industry grew by 1,554.2 percent
with the Mining and Quarrying sub-sector recording the highest growth of 5,591.7 percent
.The Manufacturing and Electricity and Water sub-sector grew by 712.7 percent and 835.7
percent respectively. Depreciation in Buildings, other construction and land improvement in
the Industry sector recorded a growth of 5,466.1 percent, increasing from US$28 million in
2003 to US$1,595 million in 2013. The Electricity and Water sub-sector recorded the highest
growth of 9,316.7 percent followed by the Mining and Quarrying sub-sector with 2,748.1
percent. The Manufacturing sub-sector recorded the lowest growth of 2,483.7 percent (Table
4.5).
The depreciation in Machinery and other equipment increased from US$516.4 million in
2003 to US$6,408.4 million in 2013 representing a growth of 1,141 percent over the ten-year
period. The Mining and Quarrying and Manufacturing sub-sectors grew by 4,985.1 percent
and 773.9 percent respectively. The Electricity and Water sub-sector recoded a growth of
421.1 percent.
The depreciation in Transport and Equipment grew by 3516.5 percent, increasing from
US$51.6 million in 2003 to US$1,866.3 million in 2013. The Mining and Quarrying sub-
sector recorded the highest growth of 11,609.1 percent followed by the Electricity and Water
sub-sector with 9,276.4 percent. The Manufacturing sub-sector again recorded the lowest
growth of 112.8 percent.
Table 4.6 indicates the value of gross additions to fixed assets in Industry in 2003 and 2013
over the period, 2003 to 2013. The total gross additions to fixed assets in Industry increased
from US$307.8 million in 2003 to US$12,106.6 million in 2013, indicating a growth of
3,833.3 percent. The total gross assets in the Mining and Quarrying sub-sector
(US$8,494.4million) is about six times that of the Manufacturing sub-sector (US$1,526.2
million) and four times that of the Electricity and Water sub-sector (US$2,086 million).
Gross additions to land grew by 1,250 percent, increasing from US$6.5 million in 2003 to
US$87.8 million in 2013. The value of assets in the Mining and Quarrying sub-sector shrank
by 65.8 percent while that of the Manufacturing sub-sector grew by 4,625.percent. Gross
additions to Buildings, Other construction and land improvement in industry recorded a
growth of 2649.1 percent with Manufacturing sub-sector recorded the highest growth of
4,529.8 percent followed by Electricity and Water sub-sector with 3,510.1 percent. Mining
and quarrying sub-sector recorded the lowest growth of 273 percent.
The gross additions to Machinery and other equipment increased from US$204.6 million in
2003 to US$9,132.1 million in 2013 over the ten-year period, representing a growth of 4363.4
percent. The Mining and Quarrying sub-sector accounts for 80 percent of the total value of
Machinery and other equipment in industry sector.
The gross additions to Transport and Equipment grew by 3229 percent, increasing from
US$38.9 million in 2003 to US$1,295 million in 2013. The Mining and Quarrying sub-sector
recorded the highest growth in the value of additions Transport and Equipment, recording
6,480.7 percent followed by the Electricity and Water sub-sector with 2,184.6 percent. The
Manufacturing sub-sector recorded the lowest growth of 392.9 percent (Table 4.6).

63
Table 4.5: Depreciation of Fixed Asset by industry in 2003 and 2013
Major Industry Group
Total
US$ Mil
Buildings, other
Construction and Land
Improvement
US$ Mil
Machinery and Other
Equipment
US$ Mil
Transport Equipment
US$ Mil
2003 2013 Percent 2003 2013 Percent 2003 2013 Percent 2003 2013 Percent
Industry Total 596.6 9,869.6 1554.2 28.7 1,595.00 5466.1
516.4 6,408.40 1141.0
51.6 1,866.3 3516.5
Mining and Quarrying 93.4 5,318.1 5591.7 7.4 209.7 2748.1
75 3,815.20 4985.1
11.0 1,293.2 11609.1
Manufacturing 127.5 1,035.9 712.7 9.1 234.3 2483.7
83.1 726.6 773.9
35.2 75.0 112.8
Electricity and Water 375.7 3,515.5 835.7 12.2 1,150.90 9316.7 358.2 1,866.60 421.1 5.3 498 9276.4
Source: Phase II of 2003 Industrial census and 2013 Economic Census
The annual average exchange rate per US dollar was ¢ 8,677.81 in 2003 and GH¢1.95 in 2013
Table 4.6: Gross Additions to Fixed Asset by Industry in 2003 and 2013
Major Industry Group
Total
$ mil
Land
US$ million
Buildings other
Construction and Land
Improvement
US$ million
Machinery and Other
Equipment
US$ million
Transport Equipment
US$ million
2003 2013 Percent 2003 2013 Percent 2003 2013 Percent 2003 2013 Percent 2003 2013 Percent
Industry Total 307.8 12106.6 3833.3
6.5 87.8 1250.8
57.9 1591.7 2649.1
204.6 9132.1 4363.4
38.9 1295.0 3229.0
Mining and Quarrying 64.8 8494.4 13008.6
6.1 2.1 -65.6
22.6 84.3 273
19.6 7315.5 37224
16.6 1092.4 6480.7
Manufacturing 123.1 1526.2 1139.8
0.4 18.9 4625
22.5 1041.7 4529.8
83.2 381.8 358.9
17.0 83.8 392.9
Electricity and Water 119.9 2086 1639.8 - 66.8 - 12.9 465.7 3510.1 101.8 1434.8 1309.4 5.2.0 118.8 2184.6
Source: Phase II of 2003 Industrial census and 2013 Economic Census
The annual average exchange rate per US dollar was ¢ 8,677.81 in 2003 and GH¢1.95 in 2013

64
CHAPTER FIVE
CONCLUSIONS AND RECOMMENDATION
4.1 Introduction
Chapter four presents the conclusions and recommendation based on the data and analysis so
done in this report. The recommendations are formulated bearing in mind business
development, improved economic growth and job creation.
4.2 Conclusions
Phase II of the Integrated Business Establishment Survey (IBES II) involved the collection of
detailed information on the operations of non-household establishments covering all the
sectors of the Ghanaian economy namely, Agriculture, Industry and Services. IBES II
covered only agricultural activities managed by establishments or institutions.
The aim of IBES II was to provide information on the structure and performance of all
sectors of the economy in addition to regional comparisons. Such economic data and other
data sources are required to monitor the achievements of the Ghana’s Shared Growth and
Development Agenda, the AU Agenda 2063 and the Sustainable Development Goals (SDGs).
With regard to employment, a total of 3,061,521 persons were engaged by establishments of
which 75.1 percent were engaged by the Service sector, 23.1 percent by Industry while 1.8
percent were engaged in the Agriculture sector. Out of the total persons engaged, 1,778,940,
representing 58.1 percent were employees. The proportion of employees was highest in the
Greater Accra region (77.7%) and lowest in the Upper West region (29.7%)
In relation to revenue, the total amount of revenue generated by the three sectors was
GH¢451.6 billion. A greater proportion of the revenue (GH¢317.7 billion, representing 70.4
percent) was generated by the Service sector. The Industry sector generated GH¢128.4 billion
which is 28.4 percent of the total revenue while revenue from Institutional Agriculture was
GH¢5.4 billion, representing 1.2 percent.
Over 70 percent of all revenues generated was from the Greater Accra region which does not
align well with the objective of decentralization. Considering the fact that a large proportion
of revenues were from the Greater Accra region, policies should target the setting up of
businesses across all regions to increase access to basic goods and services outside of the
Greater Accra region while creating employment in all regions to reduce migration to the
capital city.
Most of the assets owned, purchased and disposed of as at the end of the reference period was
by establishments in the Industry sector. This emphasizes the fact that the Industry sector is
more capital intensive compared to the other sectors of the economy. There is therefore, the
need for the formulation of policies policy that can lead to businesses building fixed capital to
be able to produce at full capacity using modern and efficient methods to foster economic
growth in the country.
With respect to size, 30.5 percent of the total revenue (GH¢144.5 billion) was earned by the
small-sized establishments and more than one-quarter (27.2%), amounting to GH¢128.9
billion was generated by the large-sized establishments. Among the different sizes, the least
revenue (GH¢97.8 billion) was earned by the medium-sized establishments.

65
The Service sector had a total revenue of GH¢45.9 billion of which the Financial and
insurance activities sub-sector’s contribution was 18.4 percent (GH¢8.6 billion), followed by
the Accommodation and food sub-sector (17.6%) and the Education sub-sector (14.6%). The
Health and Education sub-sector accounted for 3.7 percent and 14.6 percent respectively of
the total assets of the Service sector.
The value of fuels purchased grew by 43.7 percent, increasing from US$72 million in 2003 to
US$3,221.9 million in 2013 with the Electricity and Water sub-sector recording a growth of
693.1 followed by the Mining and Quarrying sub-sector with a 71.6 percent growth.
Total receipts in 2013 were more than nine times that of 2003 with the Manufacturing sub-
sector contributing about 54 percent. Majority (95%) of receipts were from sale of items from
main industry activity. The total gross additions to the fixed assets in Industry increased from
US$307.8 million in 2003 to US$12,106.6 in 2013 indicating a growth of 38.3 percent. The
total value of gross asset in the Mining and quarrying sub-sector (US$8494.4million) was
about six times that of the Manufacturing sub-sector (US$1,526.2 million) and four times that
of Electricity and Water sub-sector (US$2,086 million).
As the country thrives to move from subsistence agriculture to a more mechanized
agriculture, it is expected that the Agriculture sector would have substantial amount of fixed
assets in the form of agricultural machinery and equipment. Policy decisions should focus on
areas that will facilitate the mechanization of agriculture through the building of fixed capital
in the form of agricultural machinery and implements.
Good educational and health infrastructure is key to quality delivery of these services. The
stock of fixed assets and additions to fixed assets in these sectors is key to the provision of
quality education and health to the citizenry. As reflected in the results, capital formation in
these sectors needs to be improved. It is therefore, important that efforts are made through
policy interventions to improve upon capital formation in these sub-sectors which will
translate into the provision of quality education and improved healthcare delivery.
A high proportion of the persons were engaged by the Service sector, particularly the
Wholesale and retail trade sub-sector. This shows the extent and indication of the
pervasiveness of domestic trading activities, and low manufacturing base of the economy.
Every effort to promote manufacturing activities in the country should be embraced.
The concentration of persons engaged by non-household establishments in Greater Accra,
Ashanti and Western regions should be a concern. Expanding the creation of factories and
establishments/enterprises in the various parts of the country will be a useful venture.
Total payments by employers to their employees as social security contributions is far below
expectation. Even though the micro, small and medium-sized establishments engaged more
persons, those who worked in these establishments received lower remuneration. Employers
should be encouraged to pay social security contributions for their employees to improve on
their welfare during retirement.
With regard to the comparative analysis of industry performance between 2003 and 2013,
the Manufacturing sub-sector contributed about 86 percent of the number of establishments in
the three sub-sectors of Industry. Wages and salaries increased from US$284 million in 2003
to US$5,630.4 million to 2013 indicating a growth of 1886 percent with the Mining and
quarrying sub-sector contributing about 80.7 percent to the total wages and salaries.

66
4.3 Recommendation
The Service sector accounts for slightly over 70 percent of total revenue while the productive
sectors of the economy (Industry and Agriculture sectors), contribute less than 30 percent to
output. This gives an indication that the economy is driven by the Service sector. There is
therefore, the need for a concerted effort to support the productive sectors of the economy
through policy interventions in order to increase production and exports.
As the country thrives to move from subsistence agriculture to a more mechanized
agriculture, it is expected that the Agriculture sector would have substantial amount of fixed
assets in the form of agricultural machinery and equipment. Policy decisions should focus on
areas that will facilitate the mechanization of agriculture through the building of fixed capital
in the form of agricultural machinery and implements.
Good education and healthy infrastructure is key to quality delivery of these services. Stock
of fixed assets and additions to fixed assets in these sectors is key to the provision of quality
education and health to the citizenry. As reflected in the results, capital formation in these
sectors needs to be improved. It is therefore, important that efforts are made through policy
interventions to improve upon capital formation in these sub-sectors which will translate into
the provision of quality education and improved healthcare delivery.
The concentration of persons engaged by non-household establishments in Greater Accra,
Ashanti and Western regions should be a concern. Also, over 70 percent of all revenues
generated is from the Greater Accra region which does not align well with the objective of
decentralization. Expanding the creation of factories and establishments/enterprises in the
various parts of the country will be a useful venture. Thus, policy should target the setting up
of businesses across all regions to increase access to basic goods and services outside of the
Greater Accra region while creating employment in all regions to reduce migration to the
capital city.
A concerted effort should be made at creating free zone enclaves in all regions in the short to
medium term and in the districts in the long-term is worth considering to ensure the
development of an industry sector that would not only be concentrated in the three large cities
but spread throughout the country. This will bring about development to the benefit of all the
citizenry. The current one-district one-factory program of government is laudable and all
efforts should be made to make it successful and sustainable in the long-term.
67
CHAPTER SIX
GLOSSARY
The statistical unit
An establishment is the statistical unit recommended by the United Nations Statistical Office
for economic enquiries. This is defined as a unit of production engaged in a single kind of
activity under a single ownership at a single location. In practice, it was difficult to apply this
definition to some enterprises hence the concept of reporting unit was adopted. The reporting
unit was the smallest unit that could provide the information required by the census. With the
exception of the cases below, the reporting unit was the same for all establishments:
1. A unit, though under single ownership carrying out a single activity, may operate at
different locations but keep consolidated accounts, which does not readily yield data on
separate locations. This occurs in some larger establishments.
2. A number of establishments are engaged in two or more economic activities. Where
possible, a completed questionnaire was obtained in respect of each activity otherwise a
combined return for all activities was accepted.
Classification of industry
The International Standard Industrial Classification for all Economic Activities (ISIC) Rev.4
was adopted for classifying economic activities. The industry group (four-digit) level was
found to be sufficiently detailed for Ghana’s needs.
Classification of products and materials
The Central Product Code (CPC) Rev. 2 was adopted for classifying products. Classification
for products was done at the five-digit level. In some cases where the product could not be
easily classified based on the international codes, localize codes were created as extension to
take care of products only known in the Ghanaian industry.
Institutional agriculture
Institutional agriculture in IBES II covers all agricultural establishments owned by the private
and public-private partnership other than household agriculture. Non-household agriculture
includes all institutions (housed in a structure) engaged in agriculture-related activities,
usually called institutional agriculture. This report examines only on institutional agriculture.
LMSM establishments
LMSM is an abbreviation for large, medium, small micro establishments. Large-sized
establishments are those with more than 100 persons engaged in total. Medium-sized
establishments are those with 31-100 employees, while small-sized establishments have 6-30
persons engaged. Micro-sized establishments are those with a total of 1-5 persons engaged.
Privately owned establishments
A privately owned enterprise refers to a commercial enterprise that is owned by private
investors, shareholders or owners (usually collectively, but they can be owned by a single
individual), is in contrast to state institutions. Private enterprises make up the private sector of
the economy.

68
Public-private partnership establishments
A public-private partnership (PPP) is a government service or private business venture, which
is funded and operated through a partnership of government or one or more private sector
companies. In 2004, the government of Ghana published PPP policy guidelines, which
attempted to officially integrate the two sectors in the development process. The private
sector was described as Ghana’s “engine of growth” indicating its importance. The PPP law
gives government the legal backing to join with private firms to carry out projects in the
country.
Purchasers’ Prices
The delivered cost at the establishment including the purchase prices, charges for transport,
the cost of insurance, value of packaging materials charged for and all taxes and duties on
the goods less discounts and rebates allowed to the purchaser and the value of packaging
materials returned to the supplier.
Ex-factory price
The price establishment charged to the consumer including duties and taxes which fall on
the products when they leave the establishment excluding all subsidies.
Value of Stocks
The value of stocks of goods intended for sale and of materials, fuels and supplies for use by
the units should be that at the beginning and end of the enquiry period for goods intended for
sale, irrespective of where held, and of materials for use by the unit, that are owned by the
establishment if it is part of a single-unit enterprise or that are controlled by the
establishment and owned by its parent enterprise if it is part of a multi-unit enterprise. These
are goods for which the establishment has transferred the effective right to use to others with
a view to ultimate purchase by them is excluded.
Stocks of finished goods
Stocks of finished goods produced by the unit (industry) include all goods made by the
establishment that are ready for sale at the reference date. Finished goods held by another
establishment that were processed by that establishment from raw materials controlled by
the respondent establishment is included. Finished goods held elsewhere - at ancillary units,
in bonded or public warehouses, on consignment, in transit, and so on, is also be included.
Finished goods held by the respondent establishment that were made from materials owned
by others is not excluded.
Stocks of finished goods purchased for resale
Stocks of finished goods to be sold in the same condition as received covers the value of any
stocks of goods that the establishment has bought with the intention of reselling in the same
form, that is, without further processing.
Stocks of materials, fuels and supplies
Stocks of materials, fuels and supplies comprises all materials, components and the like that
enter into the product, fuels, and repair, maintenance, office and other consumable supplies.

69
Stocks of work in progress
Stocks of work in progress refers to the value of all materials that have been partially
processed by the establishment but that are not usually sold or turned over to other
establishments without further processing.
Work-in-progress
These are materials which have been partially processed by the establishment but which are not
usually sold without further processing.
Average Number of Persons Engaged
This refers to total number of persons who work in or for the establishment; the average number
of operatives plus the average number of other employees plus working proprietors and active
business partners plus learners (including unpaid apprentices) plus unpaid family workers.
Employees
This refers to all persons working for and paid by the establishment. They include persons
working full-time or part-time and employees on sick leave, paid vacations and holidays.
Wages and Salaries
All payments, whether in cash or in kind, made by the employer during the year to
employees, including wages and salaries, other cash payments, bonuses, cost of living
allowances, wages paid during vacation and sick leave, contributions payable by employees
and deducted by the employer such as Social Security and National Insurance Trust
contributions, taxes etc.
Supplements to wages and Salaries
It is the employer’s contribution on behalf of employees to the Social Security and National
Insurance Trust, private pension plan, provident fund and workmen’s accident compensations
plan, insurance premiums on hospital and medical plans, premium on accident and sickness
Insurance and life insurance premiums. It also includes all such schemes whether legally acquired,
initiated by the employer or established as a result of labour management bargaining contract.
Receipts for non- Industrial Services
This includes receipts from rents, commission receipts, revenue from the operation of employee
facilities, receipts for transport and warehousing services rendered to others other than delivery of
own products.
Receipt for Industrial Services
This includes receipts for contract and commission work done on other establishments’ materials
like processing, transforming and assembly of materials supplied by the units which order the
work, receipts for repair and installation work done for others and value of fixed assets produced
for own account.
Cost of industrial Services
This includes payments made to others for contract work done by others on the establishment’s
materials.

70
Cost of non- Industrial Services
This includes communications costs (telex, telephone, internet, postage costs, etc.), plus rental
payments for building and machinery plus advertising cost plus bank charges plus other such
costs.
Receipts in Industry Sector
This equals total sales of goods plus receipts for contract and commission work done for others
plus receipts for repair and installation work for others plus other receipt for industrial services
plus sales of goods bought and resold in same condition as purchased.
Receipts in Agriculture Sector
This equals total sales of agriculture products plus receipts from non-agriculture activities plus
sales of goods bought and resold in same condition as purchased plus own consumption.
Receipts in Service Sector
This equal to total receipts for services provided plus sales of goods resold in same condition as
purchased plus any other income.
Intermediate input/consumption:
This is a measure of the goods and services used up in a period in the production process. It is
estimated as expenditure on purchases of materials and supplies, and services used as inputs less
change in inventories of materials and supplies (inventories include work-in-progress).
That is, cost of materials and supplies (both domestic and imported) plus fuels purchased plus
electricity and water purchased plus both cost of industrial and non-industrial plus cost of goods
expressly bought to be sold in the same condition as purchased plus stock of materials, supplies,
and fuel at the beginning of the year less stock of materials, supplies and fuel at the end of the
year.
Value Added
The value of outcome when factors of production interact to avail goods and services. It is
intended to measure the value created by the process of production.
Gross Value Added
Gross value added is the value of receipts less the value of intermediate consumption; it is a
measure of the contribution to GDP made by an individual producer, industry or sector.
Gross Domestic Product
Gross Domestic Product (GDP) is an aggregate measure of production. It is the sum of the gross
value added of all resident establishments, plus any taxes, less subsidies, on products (if not
included in the value of their outputs).
Depreciation of Fixed Assets
Is the value of wear and tear of fixed assets in the course of the financial year? It is value
allowed at current replacement cost of assets used up during the year through normal wear and
tear, foreseen obsolescence and the normal rate of accidental damage.

71
The survey collected data on the book value of establishments’ fixed assets and depreciation.
Most of the large establishments had no difficulty in giving information on depreciation of their
fixed assets. A number of the small establishments, could not give any information on
depreciation, but provided the value of the assets at the time of purchase, and the year of the
purchase. This enabled estimation of depreciation using the straight line method.
Gross addition to fixed assets
This equals capital expenditure on new, secondhand, improvements and work done on own
account of fixed asset (Tangible and Intangible) for the year.
Tangible fixed assets include:
Land
Buildings
Other Construction and land improvement
Machinery and other equipment
Transport and Equipment
Furniture and fixtures
Other tangible assets
Intangible fixed assets include:
Computer software and databases;
Research and developments;
Entertainment, Literacy, and Artistic originals.
Other Intellectual Property
Sales or disposal of fixed asset
This is the act of selling an asset that has been depreciated over its useful life. The value of sale
of the fixed assets during the year.

72
APPENDICES
Table A.1: Purchases and other operating cost by sectors
Sector
No. of
Establish
ments
Total
GH¢
Material and
Supplies,
GH¢
Goods
Purchased for
Resale
GH¢
Fuel purchased
GH¢
Electricity
purchased
GH¢
Water
purchased
GH¢
Other
Purchases
GH¢
Other
Operating
Costs
GH¢
ALL SECTORS - National 535,337 167,504,307,996 97,659,974,533 13,417,327,297 10,363,410,055 2,964,376,965 240,170,587 383,779,170 42,475,269,389
Agriculture 3,033 2,506,425,357 2,161,333,785 62,391,541 109,228,474 6,588,296 2,039,548 1,559,684 163,284,029
Agriculture, forestry and fishing 3,033 2,506,425,357 2,161,333,785 62,391,541 109,228,474 6,588,296 2,039,548 1,559,684 163,284,029
Industry 106,330 37,900,642,460 23,813,944,876 2,182,130,610 4,155,028,052 866,738,473 80,826,914 206,714,198 6,595,259,337
Mining and quarrying 293 9,349,906,890 2,869,454,469 60,013,437 2,739,307,644 449,875,187 2,921,959 190,266,192 3,038,068,002
Manufacturing 101,789 18,532,953,962 15,050,947,990 991,107,497 402,025,489 306,174,093 63,134,215 14,965,862 1,704,598,816
Electricity, gas, steam and air conditioning
supply 327 4,018,047,727 1,742,654,746 1,105,762,051 773,911,091 13,585,501 1,829,398 0 380,304,940
Water supply; sewerage, waste
management 507 309,293,457 124,090,996 270,409 24,252,252 74,101,944 470,207 8,976 86,098,673
Construction 3,414 5,690,440,427 4,026,796,675 24,977,217 215,531,577 23,001,749 12,471,135 1,473,168 1,386,188,906
Services 425,974 127,097,240,179 71,684,695,872 11,172,805,146 6,099,153,529 2,091,050,196 157,304,125 175,505,288 35,716,726,023
Wholesale and retail trade and repair of
motor vehicles and motorcycles 236,523 81,214,751,855 63,313,997,664 9,291,902,951 4,721,424,277 209,957,563 45,166,466 56,719,082 3,575,583,852
Transportation and storage 2,303 2,257,325,720 573,716,536 116,529,138 568,943,074 18,737,270 4,364,808 96,862 974,938,032
Accommodation and food service activities 44,654 3,200,881,001 2,277,014,301 265,621,264 163,452,949 104,998,845 32,124,894 5,702,530 351,966,218
Information and communication 3,145 3,637,668,134 362,061,715 1,159,338,287 172,207,225 125,072,542 11,361,011 5,067,128 1,802,560,226
Financial and insurance activities 6,075 31,134,354,110 1,966,677,108 20,994,938 219,350,029 1,483,522,799 23,427,106 93,419,318 27,326,962,812
Real estate activities 413 696,014,199 385,762,938 391,875 9,030,641 3,661,908 550,406 204,779 296,411,652
Professional, scientific and technical
activities 4,598 775,779,414 342,032,050 14,266,872 21,918,962 15,543,247 4,000,194 4,499,345 373,518,744
Administrative and support service
activities 5,151 351,738,573 141,571,136 17,845,776 29,910,977 7,448,892 1,044,681 222,614 153,694,497
Education 16,567 738,593,809 222,052,514 77,717,344 69,998,671 27,978,535 12,911,521 4,392,873 323,542,351
Human health and social work activities 3,274 987,443,579 626,048,698 84,796,476 25,351,797 38,849,845 4,993,473 4,229,792 203,173,498
Arts, entertainment and recreation 4,657 99,628,385 58,376,938 2,018,318 3,423,545 4,082,681 503,941 47,807 31,175,155
Other service activities 98,614 2,003,061,400 1,415,384,275 121,381,907 94,141,381 51,196,069 16,855,623 903,158 303,198,987

73
Table A.2: Purchases and other operating cost by sector and size of establishment
Sector
No. of
Establishments
TOTAL
GH¢
Material and
Supplies,
GH¢
Goods
Purchased for
Resale
GH¢
Fuel purchased
GH¢
Electricity
purchased
GH¢
Water
purchased
GH¢
Other
Purchases
GH¢)
Other Operating
Costs
GH¢
ALL SECTORS - National 535,337 167,504,307,996 97,659,974,533 13,417,327,297 10,363,410,055 2,964,376,965 240,170,587 383,779,170 42,475,269,389
Agriculture 3,033 2,506,425,357 2,161,333,785 62,391,541 109,228,474 6,588,296 2,039,548 1,559,684 163,284,029
Large-Sized Businesses 140 270,093,055 107,545,197 2,350,000 70,702,696 2,224,169 203,225 632,534 86,435,234
Medium-Sized Businesses 127 1,118,954,077 1,016,697,824 32,255,461 24,101,934 1,459,635 97,064 2,300 44,339,859
Small-Sized Businesses 1,217 462,574,446 421,357,747 3,033,074 13,614,765 2,115,064 1,177,411 908,068 20,368,317
Micro-Sized Businesses 1,549 654,803,780 615,733,017 24,753,006 809,079 789,428 561,849 16,782 12,140,619
Industry 106,330 37,900,642,460 23,813,944,876 2,182,130,610 4,155,028,052 866,738,473 80,826,914 206,714,198 6,595,259,337
Large-Sized Businesses 403 21,778,029,449 13,534,788,730 1,195,486,991 1,995,441,537 663,881,663 50,309,214 200,998,643 4,137,122,671
Medium-Sized Businesses 1,302 7,637,190,005 3,792,485,511 20,986,758 1,990,062,739 71,443,221 12,088,262 5,550,436 1,744,573,078
Small-Sized Businesses 27,693 7,159,512,587 5,417,790,243 899,925,064 148,604,923 89,627,231 11,707,096 142,884 591,715,146
Micro-Sized Businesses 76,931 1,325,910,419 1,068,880,392 65,731,797 20,918,854 41,786,358 6,722,341 22,235 121,848,442
Services 425,974 127,097,240,179 71,684,695,872 11,172,805,146 6,099,153,529 2,091,050,196 157,304,125 175,505,288 35,716,726,023
Large-Sized Businesses 867 24,060,018,985 7,400,524,926 1,792,377,699 441,669,540 295,748,914 43,129,212 85,741,392 14,000,827,302
Medium-Sized Businesses 6,315 29,352,008,631 18,526,797,864 1,996,662,431 433,427,197 1,329,539,170 26,773,080 53,430,050 6,985,378,839
Small-Sized Businesses 82,472 36,967,324,226 23,208,977,896 6,261,235,531 717,631,369 214,018,300 52,294,959 27,442,173 6,485,723,998
Micro-Sized Businesses 336,320 36,717,888,337 22,548,395,186 1,122,529,485 4,506,425,422 251,743,813 35,106,873 8,891,673 8,244,795,885
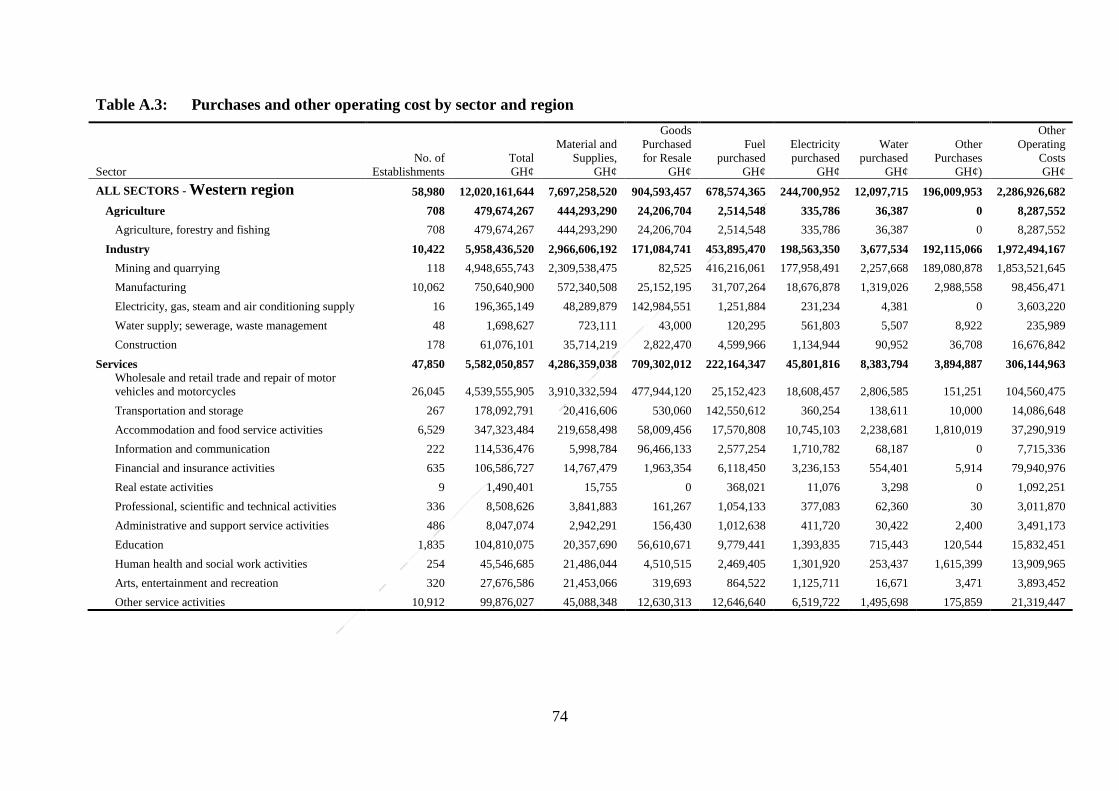
74
Table A.3: Purchases and other operating cost by sector and region
Sector
No. of
Establishments
Total
GH¢
Material and
Supplies,
GH¢
Goods
Purchased
for Resale
GH¢
Fuel
purchased
GH¢
Electricity
purchased
GH¢
Water
purchased
GH¢
Other
Purchases
GH¢)
Other
Operating
Costs
GH¢
ALL SECTORS - Western region 58,980 12,020,161,644 7,697,258,520 904,593,457 678,574,365 244,700,952 12,097,715 196,009,953 2,286,926,682
Agriculture 708 479,674,267 444,293,290 24,206,704 2,514,548 335,786 36,387 0 8,287,552
Agriculture, forestry and fishing 708 479,674,267 444,293,290 24,206,704 2,514,548 335,786 36,387 0 8,287,552
Industry 10,422 5,958,436,520 2,966,606,192 171,084,741 453,895,470 198,563,350 3,677,534 192,115,066 1,972,494,167
Mining and quarrying 118 4,948,655,743 2,309,538,475 82,525 416,216,061 177,958,491 2,257,668 189,080,878 1,853,521,645
Manufacturing 10,062 750,640,900 572,340,508 25,152,195 31,707,264 18,676,878 1,319,026 2,988,558 98,456,471
Electricity, gas, steam and air conditioning supply 16 196,365,149 48,289,879 142,984,551 1,251,884 231,234 4,381 0 3,603,220
Water supply; sewerage, waste management 48 1,698,627 723,111 43,000 120,295 561,803 5,507 8,922 235,989
Construction 178 61,076,101 35,714,219 2,822,470 4,599,966 1,134,944 90,952 36,708 16,676,842
Services 47,850 5,582,050,857 4,286,359,038 709,302,012 222,164,347 45,801,816 8,383,794 3,894,887 306,144,963
Wholesale and retail trade and repair of motor
vehicles and motorcycles 26,045 4,539,555,905 3,910,332,594 477,944,120 25,152,423 18,608,457 2,806,585 151,251 104,560,475
Transportation and storage 267 178,092,791 20,416,606 530,060 142,550,612 360,254 138,611 10,000 14,086,648
Accommodation and food service activities 6,529 347,323,484 219,658,498 58,009,456 17,570,808 10,745,103 2,238,681 1,810,019 37,290,919
Information and communication 222 114,536,476 5,998,784 96,466,133 2,577,254 1,710,782 68,187 0 7,715,336
Financial and insurance activities 635 106,586,727 14,767,479 1,963,354 6,118,450 3,236,153 554,401 5,914 79,940,976
Real estate activities 9 1,490,401 15,755 0 368,021 11,076 3,298 0 1,092,251
Professional, scientific and technical activities 336 8,508,626 3,841,883 161,267 1,054,133 377,083 62,360 30 3,011,870
Administrative and support service activities 486 8,047,074 2,942,291 156,430 1,012,638 411,720 30,422 2,400 3,491,173
Education 1,835 104,810,075 20,357,690 56,610,671 9,779,441 1,393,835 715,443 120,544 15,832,451
Human health and social work activities 254 45,546,685 21,486,044 4,510,515 2,469,405 1,301,920 253,437 1,615,399 13,909,965
Arts, entertainment and recreation 320 27,676,586 21,453,066 319,693 864,522 1,125,711 16,671 3,471 3,893,452
Other service activities 10,912 99,876,027 45,088,348 12,630,313 12,646,640 6,519,722 1,495,698 175,859 21,319,447

75
Table A.4: Purchases and other operating cost by sector and region
Sector
No. of
Establishments
Total
GH¢
Material and
Supplies,
GH¢
Goods
Purchased for
Resale
GH¢
Fuel
purchased
GH¢
Electricity
purchased
GH¢
Water
purchased
GH¢
Other
Purchases
GH¢)
Other
Operating
Costs
GH¢
ALL SECTORS - Central Regional 46,176 7,614,029,846 2,506,867,306 4,814,316,690 55,765,209 35,067,333 8,212,261 3,022,522 190,778,525
Agriculture 153 19,320,321 15,313,074 402,207 1,063,907 147,332 112,062 0 2,281,739
Agriculture, forestry and fishing 153 19,320,321 15,313,074 402,207 1,063,907 147,332 112,062 0 2,281,739
Industry 8,396 529,001,868 387971194 77140548 13265153 6623407 1041619 23611 42936336
Mining and quarrying 8 24,133,668 3,309,169 0 5,555,302 825,274 46,472 22,600 14,374,851
Manufacturing 8,218 385,691,695 344,046,576 5,771,646 5,403,696 5,118,082 861,428 1,011 24,489,256
Electricity, gas, steam and air conditioning supply 9 92,940,263 21,081,955 71,313,000 9,960 7,104 480 0 527,764
Water supply; sewerage, waste management 17 775,358 521,638 2,100 46,341 96,182 4,560 0 104,537
Construction 144 25,460,884 19,011,856 53,802 2,249,854 576,765 128,679 0 3,439,928
Services 37,627 7,065,707,657 2,103,583,038 4,736,773,935 41,436,149 28,296,594 7,058,580 2,998,911 145,560,450
Wholesale and retail trade and repair of motor vehicles
and motorcycles 19,832 6,232,006,333 1,461,182,362 4,700,620,987 18,801,815 10,048,035 1,923,542 404,694 39,024,898
Transportation and storage 43 10,835,166 2,661,374 200 3,759,429 50,579 14,124 0 4,349,460
Accommodation and food service activities 4,936 161,271,841 115,424,954 13,457,520 6,484,685 8,433,012 2,231,473 6,370 15,233,827
Information and communication 190 3,513,511 1,155,916 278,534 261,779 378,741 32,738 120 1,405,683
Financial and insurance activities 473 124,322,744 56,713,716 6,177,378 4,558,305 3,971,401 761,878 81 52,139,985
Real estate activities 17 5,346,371 3,694,976 0 54,704 36,172 12,040 0 1,548,479
Professional, scientific and technical activities 241 4,219,834 2,745,622 27,288 85,804 155,772 21,819 300 1,183,229
Administrative and support service activities 339 3,422,327 1,738,583 112,251 114,574 219,568 9,904 0 1,227,447
Education 1,581 26,566,886 10,776,363 1,153,216 2,995,053 995,887 745,223 1,094,168 8,806,976
Human health and social work activities 202 25,569,195 11,066,811 6,897,376 654,925 546,947 139,770 1,482,264 4,781,102
Arts, entertainment and recreation 450 2,330,238 1,111,349 35,705 127,507 154,536 29,696 0 871,445
Other service activities 9,323 466,303,211 435,311,012 8,013,480 3,537,569 3,305,944 1,136,373 10,914 14,987,919
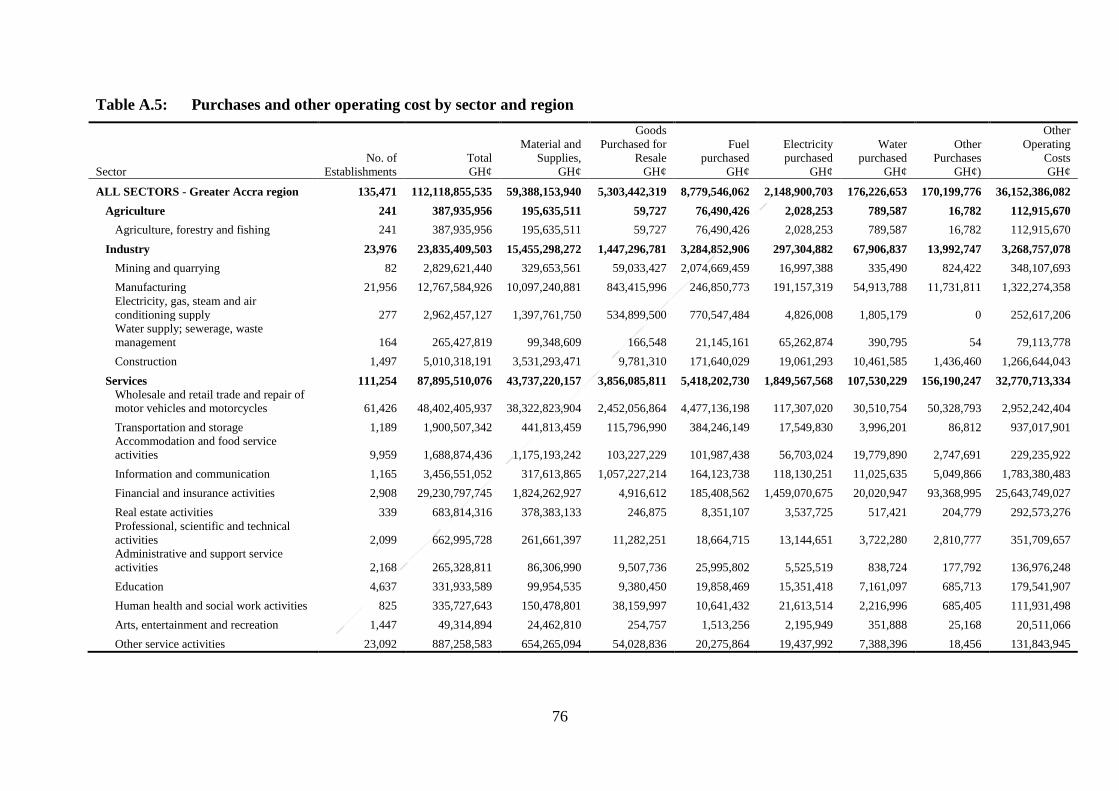
76
Table A.5: Purchases and other operating cost by sector and region
Sector
No. of
Establishments
Total
GH¢
Material and
Supplies,
GH¢
Goods
Purchased for
Resale
GH¢
Fuel
purchased
GH¢
Electricity
purchased
GH¢
Water
purchased
GH¢
Other
Purchases
GH¢)
Other
Operating
Costs
GH¢
ALL SECTORS - Greater Accra region 135,471 112,118,855,535 59,388,153,940 5,303,442,319 8,779,546,062 2,148,900,703 176,226,653 170,199,776 36,152,386,082
Agriculture 241 387,935,956 195,635,511 59,727 76,490,426 2,028,253 789,587 16,782 112,915,670
Agriculture, forestry and fishing 241 387,935,956 195,635,511 59,727 76,490,426 2,028,253 789,587 16,782 112,915,670
Industry 23,976 23,835,409,503 15,455,298,272 1,447,296,781 3,284,852,906 297,304,882 67,906,837 13,992,747 3,268,757,078
Mining and quarrying 82 2,829,621,440 329,653,561 59,033,427 2,074,669,459 16,997,388 335,490 824,422 348,107,693
Manufacturing 21,956 12,767,584,926 10,097,240,881 843,415,996 246,850,773 191,157,319 54,913,788 11,731,811 1,322,274,358
Electricity, gas, steam and air
conditioning supply 277 2,962,457,127 1,397,761,750 534,899,500 770,547,484 4,826,008 1,805,179 0 252,617,206
Water supply; sewerage, waste
management 164 265,427,819 99,348,609 166,548 21,145,161 65,262,874 390,795 54 79,113,778
Construction 1,497 5,010,318,191 3,531,293,471 9,781,310 171,640,029 19,061,293 10,461,585 1,436,460 1,266,644,043
Services 111,254 87,895,510,076 43,737,220,157 3,856,085,811 5,418,202,730 1,849,567,568 107,530,229 156,190,247 32,770,713,334
Wholesale and retail trade and repair of
motor vehicles and motorcycles 61,426 48,402,405,937 38,322,823,904 2,452,056,864 4,477,136,198 117,307,020 30,510,754 50,328,793 2,952,242,404
Transportation and storage 1,189 1,900,507,342 441,813,459 115,796,990 384,246,149 17,549,830 3,996,201 86,812 937,017,901
Accommodation and food service
activities 9,959 1,688,874,436 1,175,193,242 103,227,229 101,987,438 56,703,024 19,779,890 2,747,691 229,235,922
Information and communication 1,165 3,456,551,052 317,613,865 1,057,227,214 164,123,738 118,130,251 11,025,635 5,049,866 1,783,380,483
Financial and insurance activities 2,908 29,230,797,745 1,824,262,927 4,916,612 185,408,562 1,459,070,675 20,020,947 93,368,995 25,643,749,027
Real estate activities 339 683,814,316 378,383,133 246,875 8,351,107 3,537,725 517,421 204,779 292,573,276
Professional, scientific and technical
activities 2,099 662,995,728 261,661,397 11,282,251 18,664,715 13,144,651 3,722,280 2,810,777 351,709,657
Administrative and support service
activities 2,168 265,328,811 86,306,990 9,507,736 25,995,802 5,525,519 838,724 177,792 136,976,248
Education 4,637 331,933,589 99,954,535 9,380,450 19,858,469 15,351,418 7,161,097 685,713 179,541,907
Human health and social work activities 825 335,727,643 150,478,801 38,159,997 10,641,432 21,613,514 2,216,996 685,405 111,931,498
Arts, entertainment and recreation 1,447 49,314,894 24,462,810 254,757 1,513,256 2,195,949 351,888 25,168 20,511,066
Other service activities 23,092 887,258,583 654,265,094 54,028,836 20,275,864 19,437,992 7,388,396 18,456 131,843,945

77
Table A.6: Purchases and other operating cost by sector and region
Sector
No. of
Establishments
Total
GH¢
Material and
Supplies,
GH¢
Goods
Purchased
for Resale
GH¢
Fuel
purchased
GH¢
Electricity
purchased
GH¢
Water
purchased
GH¢
Other
Purchases
GH¢)
Other
Operating
Costs
GH¢
ALL SECTORS -Volta region 39,530 4,176,758,965 3,708,192,574 215,552,335 42,723,894 44,939,935 4,634,268 700,455 160,015,504
Agriculture 232 30,514,747 20,569,301 1,552,427 1,832,804 776,691 69,066 0 5,714,458
Agriculture, forestry and fishing 232 30,514,747 20,569,301 1,552,427 1,832,804 776,691 69,066 0 5,714,458
Industry 9,804 643,140,523 470981454 80392983 18471495 20147368 815569 2001 52329653
Mining and quarrying 7 1,373,446 19,317 0 356,804 15,439 2,435 0 979,451
Manufacturing 9,254 468,810,260 380,930,372 17,705,264 9,364,565 18,383,150 667,400 2,001 41,757,508
Electricity, gas, steam and air conditioning supply 5 76,993,860 17,564,020 59,427,500 1,800 0 0 0 540
Water supply; sewerage, waste management 52 2,107,224 305,621 7,650 97,082 1,169,171 5,064 0 522,636
Construction 486 93,855,733 72,162,124 3,252,569 8,651,244 579,608 140,670 0 9,069,518
Services 29,492 3,503,103,695 3,216,641,819 133,606,925 22,419,595 24,015,876 3,749,633 698,454 101,971,393
Wholesale and retail trade and repair of motor vehicles
and motorcycles 15,463 3,189,257,259 3,038,156,097 90,899,876 5,182,146 6,327,479 774,718 669,119 47,247,824
Transportation and storage 99 4,376,778 1,174,438 10,110 2,300,385 49,758 17,916 0 824,171
Accommodation and food service activities 4,192 146,831,598 110,377,991 14,880,634 5,765,838 4,340,717 1,168,445 17,500 10,280,473
Information and communication 115 19,662,997 16,039,377 1,925,611 318,648 575,254 20,208 0 783,899
Financial and insurance activities 255 13,837,889 1,565,207 342,472 1,277,825 670,777 137,749 0 9,843,859
Real estate activities 4 208,210 2,068 145,000 9,500 6,922 162 0 44,558
Professional, scientific and technical activities 199 6,657,606 3,791,922 595,471 115,299 168,292 17,062 0 1,969,560
Administrative and support service activities 283 2,664,103 1,337,214 46,299 146,803 213,012 10,265 0 910,510
Education 1,076 23,036,881 7,277,489 1,606,031 3,717,021 1,486,313 642,791 100 8,307,136
Human health and social work activities 284 34,991,889 12,846,220 6,638,172 1,260,504 7,543,783 169,910 0 6,533,300
Arts, entertainment and recreation 194 3,269,026 2,313,795 531,896 54,454 42,134 11,697 0 315,050
Other service activities 7,328 58,309,459 21,760,001 15,985,353 2,271,172 2,591,435 778,710 11,735 14,911,053

78
Table A.7: Purchases and other operating cost by sector and region
Sector
No. of
Establishments
Total
GH¢
Material and
Supplies,
GH¢
Goods
Purchased
for Resale
GH¢
Fuel
purchased
GH¢
Electricity
purchased
GH¢
Water
purchased
GH¢
Other
Purchases
GH¢)
Other
Operating
Costs
GH¢
ALL SECTORS -Eastern Region 49,220 6,187,185,005 4,668,235,041 98,497,807 313,731,326 184,447,952 6,206,844 840,477 915,225,558
Agriculture 325 60,077,955 35,488,935 3,567,281 15,375,369 772,854 160,957 2,800 4,709,759
Agriculture, forestry and fishing 325 60,077,955 35,488,935 3,567,281 15,375,369 772,854 160,957 2,800 4,709,759
Industry 10,022 3,237,360,972 2,127,629,339 17,394,115 224,101,199 157,524,974 890,581 120,984 709,699,780
Mining and quarrying 28 1,161,341,826 175,512,771 749,646 204,110,765 144,943,885 38,338 112,000 635,874,421
Manufacturing 9,826 2,018,080,512 1,914,161,490 16,430,036 16,689,495 12,254,673 814,034 8,984 57,721,800
Electricity, gas, steam and air conditioning supply 1 26,426,961 25,716,270 0 652,414 7,406 2,170 0 48,701
Water supply; sewerage, waste management 29 1,102,108 214,671 0 421,351 234,914 1,746 0 229,426
Construction 138 30,409,565 12,024,137 214,433 2,227,174 84,096 34,293 0 15,825,432
Services 38,871 2,889,746,078 2,505,116,767 77,536,411 74,254,758 26,150,124 5,155,306 716,693 200,816,019
Wholesale and retail trade and repair of motor
vehicles and motorcycles 21,210 2,452,178,538 2,275,382,582 45,016,580 56,014,355 11,406,478 1,840,135 50,400 62,468,008
Transportation and storage 268 18,077,683 17,258,226 124,000 160,395 221,308 600 50 313,104
Accommodation and food service activities 4,190 177,198,884 134,404,429 21,239,803 5,631,614 4,899,406 1,125,401 30,662 9,867,569
Information and communication 227 3,297,616 832,760 771,074 331,151 332,749 28,355 0 1,001,527
Financial and insurance activities 357 72,536,185 9,822,083 2,655,531 3,666,996 1,733,222 167,390 4,956 54,486,007
Real estate activities 5 459,974 211,795 0 38,672 13,214 8,731 0 187,562
Professional, scientific and technical activities 368 2,187,142 1,093,500 115,759 257,272 99,852 18,099 19,410 583,250
Administrative and support service activities 364 2,872,805 1,325,320 340,966 187,217 159,404 8,146 0 851,752
Education 1,788 41,180,009 14,655,935 1,568,028 3,303,618 1,546,832 556,545 26,725 19,522,326
Human health and social work activities 453 40,455,007 23,577,393 1,878,451 1,660,266 1,708,093 147,375 351,210 11,132,219
Arts, entertainment and recreation 216 844,223 190,374 279,887 64,804 46,058 3,332 4,200 255,568
Other service activities 9,425 78,458,012 26,362,370 3,546,332 2,938,398 3,983,508 1,251,197 229,080 40,147,127

79
Table A.8: Purchases and other operating cost by sector and region
Sector
No. of
Establishments
Total
GH¢
Material and
Supplies,
GH¢
Goods
Purchased
for Resale
GH¢
Fuel
purchased
GH¢
Electricity
purchased
GH¢
Water
purchased
GH¢
Other
Purchases
GH¢)
Other
Operating
Costs
GH¢
ALL SECTORS -Ashanti Region 98,842 11,734,593,522 9,009,484,344 1,419,705,592 251,431,189 212,671,102 15,128,475 2,871,782 823,301,038
Agriculture 549 402,386,624 378,250,501 677,845 5,538,894 1,472,805 511,767 1,516,859 14,417,953
Agriculture, forestry and fishing 549 402,386,624 378,250,501 677,845 5,538,894 1,472,805 511,767 1,516,859 14,417,953
Industry 20,948 2,130,809,320 1,320,088,282 322,706,086 57,801,550 140,806,869 3,048,409 346,735 286,011,389
Mining and quarrying 25 346,358,052 41,526,269 50,000 20,939,781 107,656,604 130,040 220,676 175,834,682
Manufacturing 20,447 1,210,753,575 1,032,433,600 25,059,632 31,561,686 32,260,781 2,576,117 126,059 86,735,700
Electricity, gas, steam and air conditioning supply 2 387,097,103 87,823,960 297,137,500 10,450 960 0 0 2,124,233
Water supply; sewerage, waste management 81 22,375,038 18,699,658 51,111 605,120 427,089 18,723 0 2,573,337
Construction 393 164,225,552 139,604,795 407,843 4,684,513 461,435 323,529 0 18,743,437
Services 77,345 9,201,397,578 7,311,145,561 1,096,321,661 188,090,745 70,391,428 11,568,299 1,008,188 522,871,696
Wholesale and retail trade and repair of motor
vehicles and motorcycles 44,862 7,709,830,334 6,376,735,013 1,021,895,193 93,880,635 25,712,129 2,646,684 477,013 188,483,667
Transportation and storage 211 113,609,197 68,838,021 44,978 28,713,808 357,144 154,417 0 15,500,829
Accommodation and food service activities 6,807 324,375,629 241,929,065 20,880,465 18,375,093 12,730,996 2,759,513 0 27,700,497
Information and communication 733 26,597,984 15,052,596 234,502 3,365,786 2,420,029 76,584 17,142 5,431,345
Financial and insurance activities 656 175,600,644 23,896,003 4,264,420 10,855,188 9,954,155 741,738 39,373 125,849,767
Real estate activities 29 4,590,177 3,439,932 0 186,157 53,420 7,204 0 903,464
Professional, scientific and technical activities 859 79,902,400 65,299,073 1,632,528 851,458 1,040,151 82,947 50 10,996,193
Administrative and support service activities 798 58,585,091 40,108,942 6,997,385 2,179,990 528,702 100,612 41,760 8,627,700
Education 2,536 122,389,732 31,335,457 5,045,209 13,940,646 4,614,632 1,624,788 89,582 65,739,418
Human health and social work activities 655 422,512,576 363,479,720 20,313,848 4,747,710 3,224,719 705,255 68,385 29,972,939
Arts, entertainment and recreation 1,526 9,890,319 4,457,235 576,241 495,090 354,981 44,794 8,319 3,953,659
Other service activities 17,673 153,513,495 76,574,504 14,436,892 10,499,184 9,400,370 2,623,763 266,564 39,712,218

80
Table A.9: Purchases and other operating cost by sector and region
Sector
No. of
Establishments
Total
GH¢
Material and
Supplies,
GH¢
Goods
Purchased
for Resale
GH¢
Fuel
purchased
GH¢
Electricity
purchased
GH¢
Water
purchased
GH¢
Other
Purchases
GH¢)
Other
Operating
Costs
GH¢
ALL SECTORS -Brong Ahafo Region 44,406 5,390,242,201 4,836,702,056 78,329,297 169,862,886 40,666,666 8,116,112 4,653,651 251,911,533
Agriculture 575 145,447,561 126,760,219 765,068 5,793,834 991,739 317,216 18,943 10,800,542
Agriculture, forestry and fishing 575 145,447,561 126,760,219 765,068 5,793,834 991,739 317,216 18,943 10,800,542
Industry 7,506 710,848,343 528,478,811 46,094,587 76,045,249 17,894,759 1,050,308 107,438 41,177,191
Mining and quarrying 5 26,668,598 7,887,863 0 16,697,065 631,800 55,214 0 1,396,656
Manufacturing 7,327 659,807,945 507,264,884 45,986,107 52,518,003 16,561,075 939,117 107,438 36,431,321
Electricity, gas, steam and air conditioning supply 1 142,800 0 0 124,800 600 480 0 16,920
Water supply; sewerage, waste management 40 1,967,406 420,872 0 383,118 637,239 7,076 0 519,101
Construction 133 22,261,594 12,905,192 108,480 6,322,263 64,045 48,421 0 2,813,193
Services 36,324 4,533,946,297 4,181,463,026 31,469,642 88,023,803 21,780,168 6,748,588 4,527,270 199,933,800
Wholesale and retail trade and repair of motor vehicles
and motorcycles 20,115 4,034,544,773 3,913,274,475 16,483,594 21,941,361 8,446,075 2,053,929 13,892 72,331,447
Transportation and storage 62 21,657,041 16,990,900 1,100 3,932,024 79,309 25,364 0 628,344
Accommodation and food service activities 3,432 143,014,976 120,765,933 3,985,672 2,954,862 3,107,285 890,971 511,980 10,798,273
Information and communication 297 6,720,983 3,400,335 42,760 793,127 838,914 79,711 0 1,566,136
Financial and insurance activities 430 86,952,612 19,475,115 255,770 4,879,790 2,477,205 694,454 0 59,170,278
Real estate activities 5 41,563 10,899 0 12,064 1,640 408 0 16,552
Professional, scientific and technical activities 260 5,882,582 1,972,842 192,850 225,737 249,359 28,419 1,662,777 1,550,598
Administrative and support service activities 279 5,223,017 4,301,320 19,571 65,247 174,068 24,301 186 638,324
Education 1,762 64,925,075 29,725,826 2,118,899 13,271,413 1,671,788 868,718 2,305,073 14,963,358
Human health and social work activities 193 46,642,517 26,177,712 2,599,827 1,604,315 1,447,379 1,112,398 1 13,700,885
Arts, entertainment and recreation 326 3,640,946 2,220,974 13,249 201,416 122,383 37,780 0 1,045,144
Other service activities 9,163 114,700,212 43,146,695 5,756,350 38,142,447 3,164,763 932,135 33,361 23,524,461

81
Table A.10: Purchases and other operating cost by sector and region
Sector
No. of
Establishments
Total
GH¢
Material and
Supplies,
GH¢
Goods
Purchased for
Resale
GH¢
Fuel
purchased
GH¢
Electricity
purchased
GH¢
Water
purchased
GH¢
Other
Purchases
GH¢)
Other
Operating
Costs
GH¢
ALL SECTORS - Northern Region 35,917 4,932,863,739 4,119,185,870 245,361,659 40,109,590 27,210,074 5,402,501 2,329,627 493,264,418
Agriculture 202 975,593,138 942,407,477 28,783,281 464,760 45,225 31,984 0 3,860,411
Agriculture, forestry and fishing 202 975,593,138 942,407,477 28,783,281 464,760 45,225 31,984 0 3,860,411
Industry 8,554 663,501,965 415,600,506 13,899,311 19,873,643 14,716,068 957,653 0 198,454,784
Mining and quarrying 1 10,530 480 0 0 1,200 0 0 8,850
Manufacturing 8,344 171,106,600 121,606,135 6,381,476 5,566,344 6,608,549 610,230 0 30,333,866
Electricity, gas, steam and air conditioning
supply 10 267,791,190 144,044,812 0 1,309,599 1,822,030 16,324 0 120,598,425
Water supply; sewerage, waste management 55 12,529,031 3,587,473 0 1,160,068 5,377,375 29,837 0 2,374,278
Construction 144 212,064,614 146,361,606 7,517,835 11,837,632 906,914 301,262 0 45,139,365
Services 27,160 332,590,026 81861694 26823078 8750091 6328838 2854011 15144 205957170
Wholesale and retail trade and repair of motor
vehicles and motorcycles 16,272 2,961,178,610 2,679,316,193 175,855,989 11,021,096 6,119,943 1,558,853 2,314,483 84,992,053
Transportation and storage 49 4,913,061 4,408,704 21,500 246,998 21,554 3,805 0 210,500
Accommodation and food service activities 2,115 93,472,300 58,330,972 21,146,915 2,182,643 2,093,384 1,408,620 0 8,309,766
Information and communication 126 5,352,042 1,487,743 2,312,423 329,855 392,940 22,037 0 807,044
Financial and insurance activities 196 178,957,606 838,806 85,473 1,439,550 932,360 298,486 0 175,362,931
Real estate activities 4 60,412 4,161 0 10,080 1,620 1,142 0 43,409
Professional, scientific and technical activities 142 2,631,445 1,223,168 142,730 208,219 121,605 25,911 6,000 903,812
Administrative and support service activities 214 2,744,439 1,810,401 150,208 77,174 94,009 11,927 0 600,720
Education 600 8,419,348 2,201,581 124,129 982,950 327,304 146,611 1,014 4,635,759
Human health and social work activities 153 10,650,592 4,388,174 1,051,361 813,861 639,573 141,592 1,530 3,614,501
Arts, entertainment and recreation 91 497,646 146,124 6,389 50,266 14,387 3,675 6,600 270,205
Other service activities 7,198 24,891,135 7,021,860 1,781,950 2,408,495 1,690,102 790,205 0 11,198,523

82
Table A.11: Purchases and other operating cost by sector and region
Sector
No. of
Establishments
Total
GH¢
Material
and
Supplies,
GH¢
Goods
Purchased
for Resale
GH¢
Fuel
purchased
GH¢
Electricity
purchased
GH¢
Water
purchased
GH¢
Other
Purchases
GH¢)
Other
Operating
Costs
GH¢
ALL SECTORS - Upper East Region 14,282 1,336,841,031 909,991,776 327,684,427 18,980,341 17,277,178 2,238,970 2,657,564 58,010,775
Agriculture 20 1,099,552 996,730 0 18,180 6,420 1,010 4,300 72,912
Agriculture, forestry and fishing 20 1,099,552 996,730 0 18,180 6,420 1,010 4,300 72,912
Industry 3,802 105,515,495 70,852,332 4,091,446 3,821,727 10,370,109 376,433 0 16,003,448
Mining and quarrying 15 10,744,762 1,967,964 97,839 593,937 719,659 48,017 0 7,317,346
Manufacturing 3,639 60,098,348 48,104,717 3,609,801 1,625,586 2,817,996 292,687 0 3,647,561
Electricity, gas, steam and air conditioning supply 6 7,831,795 372,100 0 2,700 6,689,679 384 0 766,932
Water supply; sewerage, waste management 11 860,456 201,304 0 252,380 105,412 6,595 0 294,765
Construction 131 25,980,134 20,206,247 383,806 1,347,124 37,363 28,750 0 3,976,844
Services 10,461 1,230,225,984 838,142,714 323,592,981 15,140,434 6,900,649 1,861,527 2,653,264 41,934,415
Wholesale and retail trade and repair of motor vehicles and
motorcycles 5,037 992,298,185 656,751,051 309,092,292 8,517,046 2,470,759 659,662 2,056,204 12,751,171
Transportation and storage 72 1,307,686 57,871 200 790,532 22,981 6,546 0 429,556
Accommodation and food service activities 1,496 76,730,924 64,418,334 6,423,430 1,822,569 1,324,287 359,911 576,327 1,806,066
Information and communication 39 849,956 299,786 76,717 94,793 102,920 5,095 0 270,645
Financial and insurance activities 115 16,564,229 998,042 331,700 539,307 1,038,546 34,931 0 13,621,703
Real estate activities 1 2,775 219 0 336 120 0 0 2,100
Professional, scientific and technical activities 67 1,149,021 306,124 112,728 204,601 125,083 9,015 0 391,470
Administrative and support service activities 137 2,228,534 1,313,275 499,698 115,470 79,270 4,986 476 215,359
Education 470 7,050,544 1,904,590 25,693 944,130 471,304 363,692 0 3,341,135
Human health and social work activities 161 16,469,870 7,732,683 2,698,430 887,970 485,501 82,646 4,493 4,578,147
Arts, entertainment and recreation 65 1,400,703 1,289,981 500 43,744 22,476 4,052 49 39,901
Other service activities 2,801 114,173,557 103,070,758 4,331,593 1,179,936 757,402 330,991 15,715 4,487,162
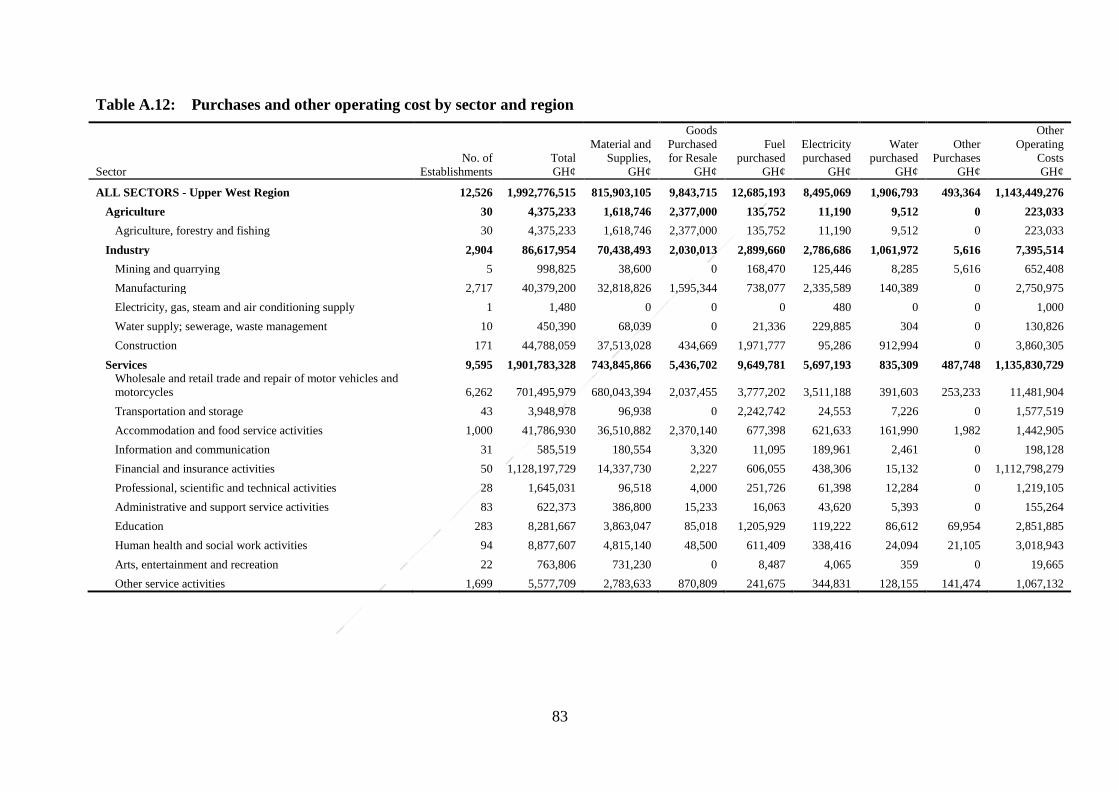
83
Table A.12: Purchases and other operating cost by sector and region
Sector
No. of
Establishments
Total
GH¢
Material and
Supplies,
GH¢
Goods
Purchased
for Resale
GH¢
Fuel
purchased
GH¢
Electricity
purchased
GH¢
Water
purchased
GH¢
Other
Purchases
GH¢
Other
Operating
Costs
GH¢
ALL SECTORS - Upper West Region 12,526 1,992,776,515 815,903,105 9,843,715 12,685,193 8,495,069 1,906,793 493,364 1,143,449,276
Agriculture 30 4,375,233 1,618,746 2,377,000 135,752 11,190 9,512 0 223,033
Agriculture, forestry and fishing 30 4,375,233 1,618,746 2,377,000 135,752 11,190 9,512 0 223,033
Industry 2,904 86,617,954 70,438,493 2,030,013 2,899,660 2,786,686 1,061,972 5,616 7,395,514
Mining and quarrying 5 998,825 38,600 0 168,470 125,446 8,285 5,616 652,408
Manufacturing 2,717 40,379,200 32,818,826 1,595,344 738,077 2,335,589 140,389 0 2,750,975
Electricity, gas, steam and air conditioning supply 1 1,480 0 0 0 480 0 0 1,000
Water supply; sewerage, waste management 10 450,390 68,039 0 21,336 229,885 304 0 130,826
Construction 171 44,788,059 37,513,028 434,669 1,971,777 95,286 912,994 0 3,860,305
Services 9,595 1,901,783,328 743,845,866 5,436,702 9,649,781 5,697,193 835,309 487,748 1,135,830,729
Wholesale and retail trade and repair of motor vehicles and
motorcycles 6,262 701,495,979 680,043,394 2,037,455 3,777,202 3,511,188 391,603 253,233 11,481,904
Transportation and storage 43 3,948,978 96,938 0 2,242,742 24,553 7,226 0 1,577,519
Accommodation and food service activities 1,000 41,786,930 36,510,882 2,370,140 677,398 621,633 161,990 1,982 1,442,905
Information and communication 31 585,519 180,554 3,320 11,095 189,961 2,461 0 198,128
Financial and insurance activities 50 1,128,197,729 14,337,730 2,227 606,055 438,306 15,132 0 1,112,798,279
Professional, scientific and technical activities 28 1,645,031 96,518 4,000 251,726 61,398 12,284 0 1,219,105
Administrative and support service activities 83 622,373 386,800 15,233 16,063 43,620 5,393 0 155,264
Education 283 8,281,667 3,863,047 85,018 1,205,929 119,222 86,612 69,954 2,851,885
Human health and social work activities 94 8,877,607 4,815,140 48,500 611,409 338,416 24,094 21,105 3,018,943
Arts, entertainment and recreation 22 763,806 731,230 0 8,487 4,065 359 0 19,665
Other service activities 1,699 5,577,709 2,783,633 870,809 241,675 344,831 128,155 141,474 1,067,132

84
Table B.1: Trading account of businesses by sector
Number of
Establishments
Number of
Persons
Engaged
Revenue
GH¢
Cost of Goods
Sold
Input Cost
GH¢
Gross Profit
GH¢
All Sectors -National 535,337 3,102,917 456,995,817,643 156,067,708,114 153,836,888,724 300,928,111,365
Agriculture 3,033 54,267 5,478,752,350 2,104,020,445 2,047,225,556 3,374,731,905
Agriculture, forestry and fishing 3,033 54,267 5,478,752,350 2,104,020,445 2,047,225,556 3,374,731,905
Industry 106,330 734,341 133,143,455,689 47,082,575,875 47,089,141,948 86,060,880,062
Mining and quarrying 293 48,977 26,587,745,050 3,069,202,475 2,943,976,208 23,518,542,615
Manufacturing 101,789 570,327 44,996,873,671 16,762,603,586 16,539,757,596 28,234,270,274
Electricity, gas, steam and air conditioning 327 18,063 6,651,300,697 1,622,763,778 1,830,332,687 5,028,536,944
Water supply; sewerage, waste management 507 25,407 1,131,153,296 115,611,944 125,801,435 1,015,541,326
Construction 3,414 71,567 53,776,382,976 25,512,394,092 25,649,274,023 28,263,988,904
Services 425,974 2,314,309 318,373,609,604 106,881,111,794 104,700,521,220 211,492,499,398
Wholesale and retail trade and repair of motor vehicles and
motorcycles 236,523 778,587 175,098,102,358 93,953,196,380 91,892,124,609 81,144,907,259
Transportation and storage 2,303 41,292 8,418,963,880 2,060,832,389 2,061,593,001 6,358,131,495
Accommodation and food service activities 44,654 227,588 8,016,746,590 2,386,820,743 2,354,058,581 5,629,926,169
Information and communication 3,145 29,733 9,129,162,501 430,799,773 446,151,127 8,698,362,717
Financial and insurance activities 6,075 223,389 90,796,340,643 3,738,779,864 3,729,351,554 87,057,560,320
Real estate activities 413 7,408 1,890,315,619 505,457,354 482,941,461 1,384,858,252
Professional, scientific and technical activities 4,598 39,921 2,354,192,944 382,704,138 384,778,495 1,971,488,798
Administrative and support service activities 5,151 88,022 1,416,097,902 157,921,235 189,708,538 1,258,176,672
Education 16,567 308,944 6,424,096,188 248,473,035 244,997,750 6,175,623,159
Human health and social work activities 3,274 75,171 6,033,432,138 1,422,660,017 1,396,984,178 4,610,772,297
Sports activities and amusement and recreation activities 4,657 16,385 428,364,120 59,228,950 59,106,869 369,135,161
Other service activities 98,614 477,868 8,367,794,722 1,534,237,918 1,458,725,057 6,833,557,099

85
Table B.2: Trading account of businesses by sector and size of establishment
Sectors
Number of
Establishments
Number of
Persons
Engaged
Revenue
GH¢
Cost of Goods
Sold
Input Cost
GH¢
Gross Profit
GH¢
All Sectors -LMSM 535,337 3,102,917 456,995,817,643 156,067,708,114 153,836,888,724 300,928,111,365
Agriculture 3,033 54,267 5,478,752,350 2,104,020,445 2,047,225,556 3,374,731,905
Large-Sized Businesses 140 28,145 512,820,760 119,164,162 107,545,202 393,656,602
Medium-Sized Businesses 127 6,533 1,543,545,199 1,044,844,249 1,016,697,824 498,700,949
Small-Sized Businesses 1,217 14,615 2,485,866,565 436,105,034 421,386,735 2,049,761,524
Micro-Sized Businesses 1,549 4,975 936,519,826 503,907,000 501,595,796 432,612,829
Industry 106,330 734,341 133,143,455,689 47,082,575,875 47,089,141,948 86,060,880,062
Large-Sized Businesses 403 178,551 57,903,529,988 18,314,033,548 18,345,439,830 39,589,496,606
Medium-Sized Businesses 1,302 65,410 27,167,138,527 7,851,336,726 7,848,135,978 19,315,801,746
Small-Sized Businesses 27,693 288,618 45,062,453,037 19,747,623,391 19,822,047,902 25,314,829,982
Micro-Sized Businesses 76,931 201,762 3,010,334,137 1,169,582,210 1,073,518,238 1,840,751,728
Services 425,974 2,314,309 318,373,609,604 106,881,111,794 104,700,521,220 211,492,499,398
Large-Sized Businesses 867 308,456 73,983,880,045 11,955,913,532 11,594,306,966 62,027,966,315
Medium-Sized Businesses 6,315 299,800 68,474,537,587 25,148,236,096 24,432,066,846 43,326,301,587
Small-Sized Businesses 82,472 916,560 99,005,846,493 44,466,996,505 44,044,732,953 54,538,850,051
Micro-Sized Businesses 336,320 789,493 76,909,345,478 25,309,965,662 24,629,414,455 51,599,381,445

86
Table B.3: Trading account of businesses by sector and region
Sectors
Number of
Establishments
Number of
Persons
Engaged
Revenue
GH¢
Cost of
Goods Sold
Input Cost
GH¢
Gross Profit
GH¢
All Sectors -Western Region 58,977 318,698 33,873,323,931 9,984,617,423 9,962,753,626 23,888,706,369
Agriculture 708 17,305 1,525,128,522 332,143,861 330,156,069 1,192,984,658
Agriculture, forestry and fishing 708 17,305 1,525,128,522 332,143,861 330,156,069 1,192,984,658
Industry 10,420 86,062 19,323,933,177 3,022,866,973 3,172,922,251 16,301,066,047
Mining and quarrying 118 30,120 16,421,107,701 2,323,598,022 2,309,549,475 14,097,509,708
Manufacturing 10,061 51,167 2,234,958,703 441,684,655 607,685,456 1,793,273,863
Electricity, gas, steam and air conditioning 16 1,007 246,468,516 57,113,021 57,375,417 189,355,492
Water supply; sewerage, waste management 48 953 4,320,141 795,599 723,111 3,524,542
Construction 178 2,815 417,078,117 199,675,676 197,588,793 217,402,443
Services 47,850 215,331 13,024,262,232 6,629,606,589 6,459,675,305 6,394,655,664
Wholesale and retail trade and repair of motor vehicles and
motorcycles 26,045 78,766 10,081,384,291 6,109,149,769 5,944,102,320 3,972,234,356
Transportation and storage 267 3,262 400,821,377 20,746,771 20,815,911 380,074,610
Accommodation and food service activities 6,529 27,145 905,904,557 249,609,842 245,081,601 656,294,914
Information and communication 222 1,700 245,888,252 39,778,069 45,032,370 206,110,187
Financial and insurance activities 635 7,527 385,639,065 33,719,777 32,749,600 351,919,288
Real estate activities 9 75 3,860,138 15,755 15,755 3,844,383
Professional, scientific and technical activities 336 2,787 61,673,557 20,687,835 19,057,802 40,985,721
Administrative and support service activities 486 7,445 29,602,248 3,066,466 3,091,121 26,535,783
Education 1,835 27,911 209,431,605 26,520,435 26,329,776 182,911,171
Human health and social work activities 254 5,566 249,605,899 51,521,443 50,737,959 198,084,454
Sports activities and amusement and recreation activities 320 1,282 149,804,656 21,473,747 21,461,856 128,330,909
Other service activities 10,912 51,864 300,646,589 53,316,682 51,199,234 247,329,888

87
Table B.4: Trading account of businesses by sector and region
Sectors
Number of
Establishments
Number of
Persons
Engaged
Revenue
GH¢
Cost of
Goods Sold
GH¢
Input Cost
GH¢
Gross Profit
GH¢
Central Region 46,177 205,913 9,455,445,587 3,495,791,934 3,482,569,169 5,959,654,124
Agriculture 153 3,154 60,741,626 15,222,270 15,313,074 45,519,363
Agriculture, forestry and fishing 153 3,154 60,741,626 15,222,270 15,313,074 45,519,363
Industry 8,396 42,316 1,663,210,611 496,284,090 494,554,904 1,166,926,506
Mining and quarrying 8 489 231,915,685 3,057,284 3,309,169 228,858,401
Manufacturing 8,218 39,696 1,091,302,761 353,377,655 353,986,442 737,925,096
Electricity, gas, steam and air conditioning 9 641 110,419,829 21,081,695 21,081,955 89,338,130
Water supply; sewerage, waste management 17 212 2,046,185 523,699 521,638 1,522,487
Construction 144 1,278 227,526,151 118,243,758 115,655,700 109,282,392
Services 37,628 160,444 7,731,493,349 2,984,285,574 2,972,701,191 4,747,208,255
Wholesale and retail trade and repair of motor vehicles and
motorcycles 19,832 58,240 3,814,393,101 2,323,210,391 2,313,257,767 1,491,183,149
Transportation and storage 43 842 12,258,561 2,661,408 2,661,374 9,597,154
Accommodation and food service activities 4,936 18,903 346,107,656 120,964,961 116,186,485 225,142,694
Information and communication 190 979 11,159,771 1,167,013 1,161,212 9,992,757
Financial and insurance activities 473 7,323 705,594,101 68,088,273 68,322,205 637,505,818
Real estate activities 17 220 19,013,354 4,354,715 7,544,262 14,658,640
Professional, scientific and technical activities 241 1,850 13,576,886 2,747,093 2,746,074 10,829,793
Administrative and support service activities 339 2,146 12,181,389 1,811,814 1,757,596 10,369,575
Education 1,581 28,543 110,821,022 11,225,433 10,860,520 99,595,589
Human health and social work activities 202 4,424 68,952,997 11,099,415 11,525,355 57,853,582
Sports activities and amusement and recreation activities 450 1,196 12,845,210 1,350,697 1,343,220 11,494,513
Other service activities 9,323 35,777 2,604,589,302 435,604,361 435,335,124 2,168,984,990

88
Table B.5: Trading account of businesses by sector and region
Sectors
Number of
Establishments
Number of
Persons
Engaged
Revenue
GH¢
Cost of Goods
Sold GH¢
Input Cost
GH¢
Gross Profit
GH¢
Greater Accra Region 135,470 1,115,768 311,964,817,457 98,248,369,740 96,447,260,172 213,716,448,155
Agriculture 241 6,036 555,748,814 209,196,008 195,635,511 346,552,811
Agriculture, forestry and fishing 241 6,036 555,748,814 209,196,008 195,635,511 346,552,811
Industry 23,976 238,580 86,566,109,747 34,775,924,622 34,881,191,498 51,790,185,220
Mining and quarrying 82 5,362 5,695,908,042 477,642,174 404,164,300 5,218,265,807
Manufacturing 21,956 162,569 29,759,723,093 11,667,171,515 11,400,000,680 18,092,551,689
Electricity, gas, steam and air conditioning 277 12,698 5,304,841,906 1,247,616,866 1,475,541,395 4,057,225,088
Water supply; sewerage, waste management 164 10,637 892,234,449 95,271,631 100,486,662 796,962,798
Construction 1,497 47,314 44,913,402,256 21,288,222,436 21,500,998,461 23,625,179,838
Services 111,254 871,153 224,842,958,896 63,263,249,111 61,370,433,163 161,579,710,123
Wholesale and retail trade and repair of motor vehicles and
motorcycles 61,426 246,620 103,192,869,202 54,299,814,816 52,471,395,792 48,893,055,196
Transportation and storage 1,189 29,269 7,620,696,290 1,927,579,568 1,928,393,151 5,693,116,720
Accommodation and food service activities 9,959 87,766 4,623,482,631 1,226,373,126 1,213,007,411 3,397,109,481
Information and communication 1,165 18,945 8,726,580,811 350,701,328 360,985,480 8,375,879,416
Financial and insurance activities 2,908 178,237 85,491,750,055 3,538,844,957 3,539,323,132 81,952,904,665
Real estate activities 339 6,493 1,858,558,571 497,719,728 471,710,609 1,360,838,830
Professional, scientific and technical activities 2,099 21,164 1,896,941,855 281,500,099 286,897,947 1,615,441,749
Administrative and support service activities 2,168 63,735 1,055,728,946 100,118,716 133,552,149 955,610,210
Education 4,637 88,445 5,081,577,870 110,194,419 109,758,361 4,971,383,449
Human health and social work activities 825 22,693 1,137,090,836 179,791,921 167,975,003 957,298,948
Sports activities and amusement and recreation activities 1,447 7,269 175,605,525 24,908,752 24,832,523 150,696,769
Other service activities 23,092 100,517 3,982,076,305 725,701,681 662,601,605 3,256,374,690

89
Table B.6: Trading account of businesses by sector and region
Sectors
Number of
Establishments
Number of
Persons
Engaged
Revenue
GH¢
Cost of Goods
Sold GH¢
Input Cost
GH¢
Gross Profit
GH¢
Greater Accra Region 135,470 1,115,768 311,964,817,457 98,248,369,740 96,447,260,172 213,716,448,155
Agriculture 241 6,036 555,748,814 209,196,008 195,635,511 346,552,811
Agriculture, forestry and fishing 241 6,036 555,748,814 209,196,008 195,635,511 346,552,811
Industry 23,976 238,580 86,566,109,747 34,775,924,622 34,881,191,498 51,790,185,220
Mining and quarrying 82 5,362 5,695,908,042 477,642,174 404,164,300 5,218,265,807
Manufacturing 21,956 162,569 29,759,723,093 11,667,171,515 11,400,000,680 18,092,551,689
Electricity, gas, steam and air conditioning 277 12,698 5,304,841,906 1,247,616,866 1,475,541,395 4,057,225,088
Water supply; sewerage, waste management 164 10,637 892,234,449 95,271,631 100,486,662 796,962,798
Construction 1,497 47,314 44,913,402,256 21,288,222,436 21,500,998,461 23,625,179,838
Services 111,254 871,153 224,842,958,896 63,263,249,111 61,370,433,163 161,579,710,123
Wholesale and retail trade and repair of motor vehicles and
motorcycles 61,426 246,620 103,192,869,202 54,299,814,816 52,471,395,792 48,893,055,196
Transportation and storage 1,189 29,269 7,620,696,290 1,927,579,568 1,928,393,151 5,693,116,720
Accommodation and food service activities 9,959 87,766 4,623,482,631 1,226,373,126 1,213,007,411 3,397,109,481
Information and communication 1,165 18,945 8,726,580,811 350,701,328 360,985,480 8,375,879,416
Financial and insurance activities 2,908 178,237 85,491,750,055 3,538,844,957 3,539,323,132 81,952,904,665
Real estate activities 339 6,493 1,858,558,571 497,719,728 471,710,609 1,360,838,830
Professional, scientific and technical activities 2,099 21,164 1,896,941,855 281,500,099 286,897,947 1,615,441,749
Administrative and support service activities 2,168 63,735 1,055,728,946 100,118,716 133,552,149 955,610,210
Education 4,637 88,445 5,081,577,870 110,194,419 109,758,361 4,971,383,449
Human health and social work activities 825 22,693 1,137,090,836 179,791,921 167,975,003 957,298,948
Sports activities and amusement and recreation activities 1,447 7,269 175,605,525 24,908,752 24,832,523 150,696,769
Other service activities 23,092 100,517 3,982,076,305 725,701,681 662,601,605 3,256,374,690

90
Table B.7: Trading account of businesses by sector and region
Sectors
Number of
Establishments
Number
of
Persons
Engaged
Revenue
GH¢
Cost of
Goods Sold
GH¢
Input Cost
GH¢
Gross Profit
GH¢
Eastern Region 49,217 221,835 14,478,794,798 5,227,334,002 5,106,969,540 9,251,461,041
Agriculture 325 5,818 108,700,476 35,689,089 35,488,935 73,011,389
Agriculture, forestry and fishing 325 5,818 108,700,476 35,689,089 35,488,935 73,011,389
Industry 10,022 51,954 8,799,454,338 2,177,255,846 2,183,473,971 6,622,198,679
Mining and quarrying 28 5,254 3,012,415,249 174,168,022 175,512,771 2,838,247,286
Manufacturing 9,826 43,166 5,489,985,425 1,930,888,005 1,935,030,454 3,559,097,549
Electricity, gas, steam and air conditioning 1 596 127,385,296 25,447,576 25,716,270 101,937,720
Water supply; sewerage, waste management 29 1,543 2,042,810 219,715 214,671 1,823,095
Construction 138 1,394 167,625,558 46,532,529 46,999,805 121,093,029
Services 38,870 164,063 5,570,639,984 3,014,389,067 2,888,006,634 2,556,250,974 Wholesale and retail trade and repair of motor vehicles and
motorcycles 21,210 64,574 4,453,266,359 2,763,373,099 2,650,554,278 1,689,893,282
Transportation and storage 268 823 24,575,629 17,326,612 17,258,662 7,249,017
Accommodation and food service activities 4,190 15,240 335,423,130 137,634,427 137,589,245 197,788,682
Information and communication 227 1,122 12,126,981 1,704,898 1,678,844 10,422,083
Financial and insurance activities 357 6,517 196,063,192 10,310,612 10,203,140 185,752,577
Real estate activities 5 97 1,114,937 211,795 211,795 903,142
Professional, scientific and technical activities 368 2,253 6,139,330 1,164,828 1,099,596 4,974,501
Administrative and support service activities 364 1,595 7,677,492 1,463,251 1,459,651 6,214,242
Education 1,788 28,401 139,009,059 15,196,671 14,661,645 123,812,388
Human health and social work activities 453 7,851 229,349,166 37,363,609 26,995,511 191,985,615
Sports activities and amusement and recreation activities 216 898 4,308,131 193,051 192,008 4,115,080
Other service activities 9,425 34,692 161,586,578 28,446,214 26,102,258 133,140,364

91
Table B.8: Trading account of businesses by sector and region
Sectors
Number of
Establishments
Number of
Persons
Engaged
Revenue
GH¢
Cost of
Goods Sold
GH¢
Input Cost
GH¢
Gross Profit
GH¢
Ashanti Region 98,839 523,308 51,954,733,866 21,386,291,729 21,393,642,894 30,568,442,139
Agriculture 549 10,549 1,657,080,704 391,751,133 378,250,507 1,265,329,550
Agriculture, forestry and fishing 549 10,549 1,657,080,704 391,751,133 378,250,507 1,265,329,550
Industry 20,948 135,261 7,545,820,913 2,549,374,765 2,408,807,169 4,996,446,164
Mining and quarrying 25 6,990 990,046,962 78,844,017 41,526,269 911,202,953
Manufacturing 20,447 119,997 3,243,056,996 1,134,652,816 1,057,221,782 2,108,404,203
Electricity, gas, steam and air conditioning 2 1,187 454,966,756 87,822,562 87,823,962 367,144,178
Water supply; sewerage, waste management 81 2,233 25,494,889 13,887,711 19,191,223 11,607,178
Construction 393 4,855 2,832,255,311 1,234,167,659 1,203,043,933 1,598,087,652
Services 77,343 377,497 42,751,832,248 18,445,165,831 18,606,585,218 24,306,666,424
Wholesale and retail trade and repair of motor vehicles and motorcycles 44,862 144,340 36,737,579,701 17,455,443,342 17,646,266,401 19,282,136,167
Transportation and storage 211 3,710 261,346,212 69,230,433 68,863,230 192,115,779
Accommodation and food service activities 6,807 30,259 735,290,088 255,966,967 248,014,609 479,323,121
Information and communication 733 3,253 61,808,320 15,118,436 15,098,159 46,689,935
Financial and insurance activities 656 9,597 2,626,091,673 35,714,411 26,701,133 2,590,377,262
Real estate activities 29 463 6,363,314 2,817,253 3,439,932 3,546,060
Professional, scientific and technical activities 859 7,412 312,381,229 66,210,948 65,806,963 246,170,281
Administrative and support service activities 798 9,283 256,721,045 41,682,600 40,234,871 215,038,467
Education 2,536 54,867 502,779,402 38,009,495 36,423,568 464,769,912
Human health and social work activities 655 15,813 584,434,566 376,427,806 373,186,776 208,006,760
Sports activities and amusement and recreation activities 1,526 2,938 48,321,500 4,559,472 4,570,685 43,762,023
Other service activities 17,673 95,562 618,715,198 83,984,668 77,978,892 534,730,657

92
Table B.9: Trading account of businesses by sector and region
Sector
Number of
Establishments
Number of
Persons
Engaged
Revenue
GH¢
Cost of
Goods Sold
GH¢
Input Cost
GH¢
Gross Profit
GH¢
Brong Ahafo Region 44,405 231,590 11,838,806,427 5,567,563,880 5,578,764,595 6,271,242,800
Agriculture 575 4,636 251,542,217 125,985,580 126,760,219 125,556,638
Agriculture, forestry and fishing 575 4,636 251,542,217 125,985,580 126,760,219 125,556,638
Industry 7,506 46,374 1,979,209,105 638,504,255 621,907,526 1,340,704,852
Mining and quarrying 5 312 214,308,479 9,006,671 7,887,863 205,301,811
Manufacturing 7,327 43,610 1,609,861,365 564,608,246 553,748,576 1,045,253,117
Electricity, gas, steam and air conditioning 1 31 7,440,000 1,000 0 7,439,000
Water supply; sewerage, waste management 40 902 6,027,544 422,824 420,872 5,604,720
Construction 133 1,520 141,571,717 64,465,514 59,850,215 77,106,205
Services 36,323 180,579 9,608,055,105 4,803,074,045 4,830,096,849 4,804,981,310
Wholesale and retail trade and repair of motor vehicles and
motorcycles 20,115 54,436 7,102,427,737 4,299,672,498 4,327,051,420 2,802,755,418
Transportation and storage 62 830 48,212,264 17,210,750 17,211,428 31,001,514
Accommodation and food service activities 3,432 12,903 368,774,349 123,074,587 122,076,822 245,699,762
Information and communication 297 1,527 16,364,254 3,553,611 3,400,335 12,810,643
Financial and insurance activities 430 6,436 243,566,574 20,885,457 20,788,431 222,681,116
Real estate activities 5 16 65,336 22,899 10,899 42,437
Professional, scientific and technical activities 260 1,622 11,416,021 2,036,291 1,997,527 9,379,731
Administrative and support service activities 279 906 25,898,612 4,368,443 4,301,320 21,530,169
Education 1,762 43,793 215,542,464 30,068,661 29,909,628 185,473,803
Human health and social work activities 193 6,546 1,281,429,984 256,412,549 257,406,415 1,025,017,486
Sports activities and amusement and recreation activities 326 1,510 19,969,268 2,246,023 2,222,174 17,723,245
Other service activities 9,163 50,054 274,388,242 43,522,277 43,720,449 230,865,985

93
Table B.10: Trading account of businesses by sector and region
Sector
Number of
Establishments
Number of
Persons
Engaged
Revenue
GH¢
Cost of
Goods Sold
GH¢
Input Cost
GH¢
Gross Profit
GH¢
Northern Region 35,917 188,709 10,556,820,135 6,515,796,381 6,296,690,129 4,041,023,809
Agriculture 202 2,228 1,273,067,897 971,088,754 942,436,465 301,979,148
Agriculture, forestry and fishing 202 2,228 1,273,067,897 971,088,754 942,436,465 301,979,148
Industry 8,554 52,321 3,620,310,661 1,828,317,924 1,755,744,523 1,791,992,854
Mining and quarrying 1 9 7,662 480 480 7,182
Manufacturing 8,344 44,922 408,545,230 172,440,380 145,547,945 236,104,968
Electricity, gas, steam and air conditioning 10 1,140 279,721,723 165,070,004 144,044,814 114,651,719
Water supply; sewerage, waste management 55 3,725 20,564,408 3,803,150 3,652,979 16,761,258
Construction 144 2,525 2,911,471,638 1,487,003,910 1,462,498,305 1,424,467,728
Services 27,161 134,159 5,663,441,577 3,716,389,704 3,598,509,141 1,947,051,806
Wholesale and retail trade and repair of motor vehicles and
motorcycles 16,272 58,070 4,958,341,119 3,631,064,220 3,514,352,635 1,327,276,788
Transportation and storage 49 402 20,409,264 4,096,049 4,408,704 16,313,215
Accommodation and food service activities 2,115 11,123 147,170,778 58,808,380 58,330,972 88,362,465
Information and communication 126 694 15,202,919 1,556,348 1,488,205 13,646,572
Financial and insurance activities 196 2,574 362,287,015 1,336,226 1,396,789 360,950,795
Real estate activities 4 21 686,960 154,161 4,161 532,799
Professional, scientific and technical activities 142 902 13,400,775 1,473,386 1,343,551 11,927,389
Administrative and support service activities 214 739 11,122,990 1,843,652 1,820,959 9,279,343
Education 600 10,763 38,156,727 3,705,216 3,585,582 34,451,511
Human health and social work activities 153 2,754 33,847,022 4,688,543 4,498,537 29,158,478
Sports activities and amusement and recreation activities 91 260 2,106,477 146,060 146,174 1,960,417
Other service activities 7,198 45,857 60,709,530 7,517,464 7,132,872 53,192,033

94
Table B.11: Trading account of businesses by sector and region
Sectors
Number of
Establishments
Number
of
Persons
Engaged
Revenue
GH¢
Cost of
Goods Sold
Input Cost
GH¢
Gross Profit
GH¢
Upper East Region 14,282 89,551 4,869,213,850 1,798,958,745 1,773,881,433 3,070,255,155
Agriculture 20 305 1,745,780 953,063 996,730 792,718
Agriculture, forestry and fishing 20 305 1,745,780 953,063 996,730 792,718
Industry 3,802 25,529 482,861,331 168,550,170 164,449,391 314,311,152
Mining and quarrying 15 297 11,563,371 1,705,735 1,967,964 9,857,636
Manufacturing 3,639 19,452 152,566,464 53,572,108 52,021,606 98,994,347
Electricity, gas, steam and air conditioning 6 198 29,009,826 1,045,842 1,184,854 27,963,984
Water supply; sewerage, waste management 11 4,160 56,746,460 270,075 215,738 56,476,386
Construction 131 1,422 232,975,210 111,956,410 109,059,229 121,018,799
Services 10,461 63,716 4,384,606,739 1,629,455,512 1,608,435,312 2,755,151,285 Wholesale and retail trade and repair of motor vehicles and
motorcycles 5,037 17,639 1,545,908,827 951,025,038 929,680,617 594,883,811
Transportation and storage 72 663 9,576,525 58,054 57,871 9,518,471
Accommodation and food service activities 1,496 5,993 162,214,620 64,004,279 64,418,334 98,210,340
Information and communication 39 449 10,741,356 307,052 299,786 10,434,303
Financial and insurance activities 115 1,589 42,935,695 1,771,723 1,774,323 41,163,972
Real estate activities 1 3 50,000 1,980 1,980 48,020
Professional, scientific and technical activities 67 468 3,896,820 393,346 379,376 3,503,474
Administrative and support service activities 137 608 4,876,993 1,354,919 1,338,627 3,522,074
Education 470 7,158 20,261,418 1,937,792 1,921,964 18,323,626
Human health and social work activities 161 3,023 2,351,011,835 484,459,761 484,640,972 1,866,552,108
Sports activities and amusement and recreation activities 65 193 4,571,381 1,299,881 1,289,981 3,271,500
Other service activities 2,801 25,931 228,561,269 122,841,688 122,631,482 105,719,585

95
Table B.12: Trading account of businesses by sector and region
Sectors
Number of
Establishments
Number
of
Persons
Engaged
Revenue
GH¢
Cost of
Goods Sold
GH¢
Input Cost
GH¢
Gross Profit
GH¢
Upper West Region 12,526 50,415 2,527,078,411 1,164,872,097 1,135,063,411 1,362,206,391
Agriculture 30 499 3,004,031 1,734,162 1,618,746 1,269,868
Agriculture, forestry and fishing 30 499 3,004,031 1,734,162 1,618,746 1,269,868
Industry 2,903 14,915 514,625,370 259,797,846 251,044,504 254,827,528
Mining and quarrying 5 88 2,935,230 1,164,560 38,600 1,770,670
Manufacturing 2,717 12,054 92,194,871 38,159,974 36,558,896 54,034,900
Electricity, gas, steam and air conditioning 1 7 55,000 1,450 0 53,550
Water supply; sewerage, waste management 10 107 974,248 90,286 68,039 883,963
Construction 171 2,659 418,466,020 220,381,575 214,378,969 198,084,445
Services 9,593 35,001 2,009,449,010 903,340,089 882,400,161 1,106,108,995 Wholesale and retail trade and repair of motor vehicles and
motorcycles 6,262 17,673 1,209,566,167 837,182,371 816,442,412 372,383,881
Transportation and storage 43 474 9,082,622 747,438 748,091 8,335,183
Accommodation and food service activities 1,000 3,407 104,148,942 36,490,528 36,510,882 67,658,414
Information and communication 31 387 1,713,065 185,573 184,353 1,527,491
Financial and insurance activities 50 673 615,326,313 14,930,923 14,819,748 600,395,380
Real estate activities 0 0 0 0 0 0
Professional, scientific and technical activities 28 294 3,277,209 131,241 132,681 3,145,968
Administrative and support service activities 83 471 2,153,848 372,725 386,250 1,781,122
Education 283 2,638 21,533,242 3,982,468 3,930,849 17,550,775
Human health and social work activities 94 1,875 28,675,789 5,652,776 5,643,190 23,023,013
Sports activities and amusement and recreation activities 22 72 1,020,923 731,678 731,230 289,245
Other service activities 1,699 7,036 12,950,892 2,932,367 2,870,474 10,018,523

96
Table C.1: Compensation of employees by sector
ISIC Group
Number of
Persons
Engaged
Number of
Employees
Wages and
Salaries (Cash
and In-Kind)
(GH¢)
Social
Security
(GH¢)
Other
Supplement
to wages
and salaries
(GH¢)
Number of
Establishments
ALL SECTORS - NATIONAL 3,102,917 1,823,070 28,727,528,284 1,044,346,659 666,599,065 535,337
Agriculture 54,267 44,333 144,384,622 8,400,790 4,208,197 3,033
Agriculture, forestry and fishing 54,267 44,333 144,384,622 8,400,790 4,208,197 3,033
Industry 734,341 417,528 11,510,454,241 236,227,988 230,705,122 106,330
Mining and quarrying 48,977 40,121 8,855,455,213 75,377,113 70,011,597 293
Manufacturing 570,327 271,862 1,188,588,784 50,225,356 50,298,287 101,789
Electricity, gas, steam and air conditioning supply 18,063 17,280 807,455,034 67,386,080 82,314,744 327
Water supply; sewerage, waste management 25,407 24,242 127,834,115 13,943,286 18,812,306 507
Construction 71,567 64,023 531,121,095 29,296,153 9,268,189 3,414
Services 2,314,309 1,361,209 17,072,689,421 799,717,881 431,685,746 425,974
Wholesale and retail trade; repair of motor vehicles and
motorcycles 778,587 342,511 1,625,841,964 64,165,343 35,568,203 236,523
Transportation and storage 41,292 35,316 336,873,140 15,034,300 59,207,124 2,303
Accommodation and food service activities 227,588 152,848 636,953,775 36,354,608 14,251,000 44,654
Information and communication 29,733 24,583 335,704,427 27,033,597 10,832,646 3,145
Financial and insurance activities 223,389 204,120 8,213,312,645 494,828,685 256,106,359 6,075
Real estate activities 7,408 6,908 40,691,376 2,470,838 360,202 413
Professional, scientific and technical activities 39,921 28,935 358,959,459 16,564,072 5,444,463 4,598
Administrative and support service activities 88,022 76,112 1,380,611,499 12,995,308 5,744,060 5,151
Education 308,944 286,011 2,938,815,495 80,855,299 29,176,178 16,567
Human health and social work activities 75,171 65,014 624,017,128 32,713,669 6,622,959 3,274
Arts, entertainment and recreation 16,385 11,697 39,454,311 1,975,664 2,387,237 4,657
Other service activities 477,868 127,153 541,454,203 14,726,498 5,985,315 98,614

97
Table C.2: Compensation of employees by sector and size of establishment
ISIC Group
Number
of Persons
Engaged
Number of
Employees
Wages and
Salaries (Cash
And In-Kind)
(GH¢)
Social Security
(GH¢)
Other
Supplement
to wages and
salaries
(GH¢)
Number of
Establishments
ALL SECTORS - National 3,102,917 1,823,070 28,727,528,284 1,044,346,659 666,599,065 535,337
Large-Sized Businesses 515,152 467,920 18,278,503,406 703,797,358 452,428,312 1,410
Medium-Sized Businesses 371,743 317,038 2,958,189,212 164,353,117 75,206,957 7,745
Small-Sized Businesses 1,219,792 705,406 4,876,670,541 156,737,398 121,157,869 111,382
Micro-Sized Businesses 996,230 332,706 2,614,165,125 19,458,786 17,805,928 414,800
Agriculture 54,267 44,333 144,384,622 8,400,790 4,208,197 3,033
Large-Sized Businesses 28,145 26,761 58,194,773 2,933,155 1,938,337 140
Medium-Sized Businesses 6,533 4,981 44,320,418 3,815,808 572,680 127
Small-Sized Businesses 14,615 10,191 36,902,462 1,597,711 844,278 1,217
Micro-Sized Businesses 4,975 2,400 4,966,970 54,115 852,903 1,549
Industry 734,341 417,528 11,510,454,241 236,227,988 230,705,122 106,330
Large-Sized Businesses 178,551 163,721 10,259,699,644 188,315,373 200,236,346 403
Medium-Sized Businesses 65,410 56,556 432,618,772 24,785,680 21,127,003 1,302
Small-Sized Businesses 288,618 135,214 660,229,405 21,341,168 6,922,949 27,693
Micro-Sized Businesses 201,762 62,037 157,906,419 1,785,767 2,418,824 76,931
Services 2,314,309 1,361,209 17,072,689,421 799,717,881 431,685,746 425,974
Large-Sized Businesses 308,456 277,439 7,960,608,989 512,548,830 250,253,629 867
Medium-Sized Businesses 299,800 255,500 2,481,250,022 135,751,628 53,507,273 6,315
Small-Sized Businesses 916,560 560,001 4,179,538,674 133,798,519 113,390,642 82,472
Micro-Sized Businesses 789,493 268,269 2,451,291,736 17,618,904 14,534,201 336,320

98
Table C.3: Compensation of employees by sector and region
ISIC Group
Number
of
Persons
Engaged
Number of
Employees
Wages and
Salaries (Cash
and In-Kind)
(GH¢)
Social
Security
(GH¢)
Other
Supplement to
wages and
salaries
(GH¢)
Number of
Establishments
ALL SECTORS - Western 318,698 174,574 10,647,812,918 74,757,902 67,439,511 58,977
Agriculture 17,305 16,683 19,892,759 1,020,778 722,833 708
Agriculture, forestry and fishing 17,305 16,683 19,892,759 1,020,778 722,833 708
Industry 86,062 51,084 8,304,701,052 51,794,257 57,518,363 10,420
Mining and quarrying 30,120 22,749 8,160,576,827 43,000,321 53,387,054 118
Manufacturing 51,167 23,980 99,936,801 4,519,142 2,831,076 10,061
Electricity, gas, steam and air conditioning supply 1,007 968 26,257,555 3,174,546 879,817 16
Water supply; sewerage, waste management 953 920 1,668,753 140,151 33,060 48
Construction 2,815 2,466 16,261,116 960,097 387,355 178
Services 215,331 106,806 2,323,219,107 21,942,867 9,198,315 47,850
Wholesale and retail trade; repair of motor vehicles and
motorcycles 78,766 33,378 105,021,990 2,253,847 3,476,975 26,045
Transportation and storage 3,262 2,802 14,532,179 772,620 260,830 267
Accommodation and food service activities 27,145 13,223 87,934,841 3,295,987 541,474 6,529
Information and communication 1,700 1,206 6,501,911 276,927 137,466 222
Financial and insurance activities 7,527 6,477 87,253,725 4,565,705 2,594,985 635
Real estate activities 75 65 484,658 8,722 8,400 9
Professional, scientific and technical activities 2,787 1,801 23,181,741 459,675 65,949 336
Administrative and support service activities 7,445 2,677 1,163,866,308 622,934 182,832 486
Education 27,911 25,546 703,998,552 7,259,290 874,904 1,835
Human health and social work activities 5,566 4,785 58,474,015 1,551,716 284,496 254
Arts, entertainment and recreation 1,282 950 2,408,430 219,057 4,580 320
Other service activities 51,864 13,895 69,560,758 656,388 765,423 10,912

99
Table C.4: Compensation of employees by sector and region
ISIC Group
Number
of
Persons
Engaged
Number of
Employees
Wages and
Salaries (Cash
and In-Kind)
(GH¢)
Social
Security
(GH¢)
Other
Supplement to
wages and
salaries
(GH¢)
Number of
Establishments
ALL SECTORS - Central 205,913 97,820 473,201,749 19,172,639 4,648,759 46,177
Agriculture 3,154 2,731 7,823,712 629,885 66,302 153
Agriculture, forestry and fishing 3,154 2,731 7,823,712 629,885 66,302 153
Industry 42,316 16,865 48,879,733 2,559,467 1,658,298 8,396
Mining and quarrying 489 448 7,449,981 112,978 3,500 8
Manufacturing 39,696 14,826 25,026,514 804,925 1,196,880 8,218
Electricity, gas, steam and air conditioning supply 641 624 12,224,503 1,519,658 424,258 9
Water supply; sewerage, waste management 212 171 280,026 9,598 1,850 17
Construction 1,278 797 3,898,709 112,308 31,810 144
Services 160,444 78,224 416,498,304 15,983,287 2,924,158 37,628
Wholesale and retail trade; repair of motor vehicles and
motorcycles 58,240 17,132 43,174,394 718,114 854,319 19,832
Transportation and storage 842 697 2,033,362 156,440 39,572 43
Accommodation and food service activities 18,903 10,660 24,415,246 1,086,961 498,569 4,936
Information and communication 979 605 1,706,505 124,634 14,039 190
Financial and insurance activities 7,323 6,112 42,073,401 4,208,684 422,421 473
Real estate activities 220 187 1,070,230 85,095 1,000 17
Professional, scientific and technical activities 1,850 1,396 23,587,992 82,816 18,028 241
Administrative and support service activities 2,146 1,690 1,739,859 75,387 14,740 339
Education 28,543 25,781 209,864,001 7,291,352 162,818 1,581
Human health and social work activities 4,424 3,893 29,188,355 1,638,980 232,160 202
Arts, entertainment and recreation 1,196 575 1,288,752 10,391 49,680 450
Other service activities 35,777 9,494 36,356,207 504,431 616,812 9,323

100
Table C.5: Compensation of employees by sector and region
ISIC Group
Number of
Persons
Engaged
Number of
Employees
Wages and
Salaries (Cash
and In-Kind)
(GH¢)
Social
Security
(GH¢)
Other
Supplement to
wages and
salaries
(GH¢)
Number of
Establishments
ALL SECTORS - Greater Accra 1,115,768 866,581 13,196,310,136 783,088,636 525,558,980 135,470
Agriculture 6,036 5,738 68,057,811 4,355,331 2,826,280 241
Agriculture, forestry and fishing 6,036 5,738 68,057,811 4,355,331 2,826,280 241
Industry 238,580 187,426 1,963,292,968 118,043,011 147,866,771 23,976
Mining and quarrying 5,362 4,373 176,260,443 7,874,274 3,368,280 82
Manufacturing 162,569 115,910 675,927,484 29,842,044 39,588,088 21,956
Electricity, gas, steam and air conditioning supply 12,698 12,184 582,564,020 44,180,842 78,392,709 277
Water supply; sewerage, waste management 10,637 10,082 107,573,425 12,681,031 18,365,033 164
Construction 47,314 44,877 420,967,596 23,464,820 8,152,661 1,497
Services 871,153 673,417 11,164,959,356 660,690,293 374,865,929 111,254
Wholesale and retail trade; repair of motor vehicles and
motorcycles 246,620 155,051 980,175,210 49,868,714 25,228,245 61,426
Transportation and storage 29,269 26,256 292,422,565 13,257,830 58,744,085 1,189
Accommodation and food service activities 87,766 74,135 395,496,794 28,233,650 11,753,235 9,959
Information and communication 18,945 17,189 301,927,196 25,763,888 10,607,509 1,165
Financial and insurance activities 178,237 164,379 7,790,376,409 467,794,902 223,982,671 2,908
Real estate activities 6,493 6,116 36,994,555 2,260,054 344,302 339
Professional, scientific and technical activities 21,164 16,852 233,334,491 13,484,783 4,695,347 2,099
Administrative and support service activities 63,735 61,222 196,473,046 11,492,363 5,300,937 2,168
Education 88,445 82,093 565,041,748 32,065,054 24,134,625 4,637
Human health and social work activities 22,693 20,127 178,606,168 10,254,300 4,290,565 825
Arts, entertainment and recreation 7,269 5,718 20,088,133 1,241,880 2,301,661 1,447
Other service activities 100,517 44,279 174,023,042 4,972,877 3,482,746 23,092

101
Table C.6: Compensation of employees by sector and region
ISIC Group
Number of
Persons
Engaged
Number of
Employees
Wages and Salaries
(Cash And In-Kind)
(GH¢)
Social Security
(GH¢)
Other Supplement
to wages and
salaries
(GH¢)
Number of
Establishments
ALL SECTORS - Volta 157,131 72,702 294,578,518 9,816,186 1,938,768 39,527
Agriculture 3,737 2,065 5,858,207 355,470 31,876 232
Agriculture, forestry and fishing 3,737 2,065 5,858,207 355,470 31,876 232
Industry 41,028 18,638 51,027,873 2,949,626 825,890 9,804
Mining and quarrying 56 52 957,572 17,735 1,715 7
Manufacturing 33,694 12,225 19,795,725 563,121 341,173 9,254
Electricity, gas, steam and air conditioning supply 559 546 10,185,054 1,269,082 353,549 6
Water supply; sewerage, waste management 936 717 1,731,084 108,540 15,240 52
Construction 5,783 5,098 18,358,438 991,149 114,213 486
Services 112,366 51,999 237,692,438 6,511,090 1,081,002 29,492
Wholesale and retail trade; repair of motor vehicles and motorcycles 38,229 12,860 25,549,955 528,046 250,206 15,463
Transportation and storage 1,016 928 3,588,398 266,393 44,434 99
Accommodation and food service activities 14,849 7,966 15,121,970 315,274 88,112 4,192
Information and communication 676 408 1,328,465 72,707 9,179 115
Financial and insurance activities 2,916 2,638 34,254,325 1,028,634 80,597 255
Real estate activities 19 15 36,497 1,170 0 4
Professional, scientific and technical activities 1,169 800 7,494,270 132,974 29,548 199
Administrative and support service activities 1,094 597 1,100,739 19,092 2,683 283
Education 16,426 14,722 102,551,368 2,176,353 233,917 1,076
Human health and social work activities 4,628 3,544 27,339,231 1,618,339 172,444 284
Arts, entertainment and recreation 766 560 1,307,255 27,472 4,800 194
Other service activities 30,577 6,961 18,019,964 324,636 165,082 7,328

102
Table C.7: Compensation of employees by sector and region
ISIC Group
Number
of
Persons
Engaged
Number of
Employees
Wages and
Salaries (Cash
and In-Kind)
(GH¢)
Social
Security
(GH¢)
Other
Supplement to
wages and
salaries
(GH¢)
Number of
Establishments
ALL SECTORS - Eastern 221,835 115,202 895,415,206 30,283,711 16,047,092 49,217
Agriculture 5,818 2,653 6,801,436 361,245 170,692 325
Agriculture, forestry and fishing 5,818 2,653 6,801,436 361,245 170,692 325
Industry 51,954 27,997 347,959,838 15,942,955 14,589,866 10,022
Mining and quarrying 5,254 5,027 255,408,899 11,022,536 12,622,669 28
Manufacturing 43,166 20,016 67,559,301 2,846,924 1,351,896 9,826
Electricity, gas, steam and air conditioning supply 596 578 14,183,475 1,772,934 494,968 1
Water supply; sewerage, waste management 1,543 1,512 2,479,154 80,277 1,000 29
Construction 1,394 864 8,329,009 220,285 119,334 138
Services 164,063 84,552 540,653,932 13,979,510 1,286,534 38,870
Wholesale and retail trade; repair of motor vehicles and
motorcycles 64,574 23,723 53,720,261 1,012,901 318,987 21,210
Transportation and storage 823 513 1,133,454 19,246 33,940 268
Accommodation and food service activities 15,240 8,401 22,038,417 235,581 33,228 4,190
Information and communication 1,122 735 2,531,414 215,364 2,800 227
Financial and insurance activities 6,517 5,962 63,688,729 3,407,702 317,584 357
Real estate activities 97 90 165,600 0 1,500 5
Professional, scientific and technical activities 2,253 1,285 11,891,218 70,880 76,675 368
Administrative and support service activities 1,595 1,152 2,277,475 30,794 5,647 364
Education 28,401 26,826 266,544,303 5,617,264 149,430 1,788
Human health and social work activities 7,851 6,203 60,387,368 2,922,265 266,176 453
Arts, entertainment and recreation 898 533 1,070,293 11,904 1,206 216
Other service activities 34,692 9,128 55,205,400 435,609 79,360 9,425

103
Table C.8: Compensation of employees by sector and region
ISIC Group
Number
of
Persons
Engaged
Number of
Employees
Wages and
Salaries (Cash
and In-Kind)
(GH¢)
Social
Security
(GH¢)
Other
Supplement to
wages and
salaries
(GH¢)
Number of
Establishments
ALL SECTORS - Ashanti 523,308 267,631 1,793,298,999 71,816,895 34,455,190 98,839
Agriculture 10,549 9,230 24,722,104 1,156,311 18,686 549
Agriculture, forestry and fishing 10,549 9,230 24,722,104 1,156,311 18,686 549
Industry 135,261 66,410 531,099,190 28,996,708 3,643,877 20,948
Mining and quarrying 6,990 6,878 247,016,392 12,563,296 594,658 25
Manufacturing 119,997 52,624 202,304,834 8,449,807 1,045,346 20,447
Electricity, gas, steam and air conditioning supply 1,187 1,124 50,702,268 6,331,909 1,767,742 2
Water supply; sewerage, waste management 2,233 2,101 3,124,924 261,138 1,500 81
Construction 4,855 3,682 27,950,772 1,390,558 234,631 393
Services 377,497 191,992 1,237,477,704 41,663,876 30,792,626 77,343
Wholesale and retail trade; repair of motor vehicles and
motorcycles 144,340 54,588 297,313,115 7,169,136 3,324,283 44,862
Transportation and storage 3,710 2,421 14,309,168 293,422 59,092 211
Accommodation and food service activities 30,259 20,458 55,612,806 2,782,903 664,904 6,807
Information and communication 3,253 2,403 8,099,534 348,315 5,429 733
Financial and insurance activities 9,597 8,848 94,564,965 6,982,944 24,028,494 656
Real estate activities 463 403 1,426,254 112,017 0 29
Professional, scientific and technical activities 7,412 4,537 41,390,474 1,947,475 513,321 859
Administrative and support service activities 9,283 7,333 12,407,252 642,170 201,124 798
Education 54,867 51,257 474,889,887 12,538,488 1,005,568 2,536
Human health and social work activities 15,813 14,092 116,836,285 5,354,742 448,844 655
Arts, entertainment and recreation 2,938 1,939 9,058,196 392,309 4,978 1,526
Other service activities 95,562 23,712 111,569,768 3,099,956 536,589 17,673

104
Table C.9: Compensation of employees by sector and region
ISIC Group
Number of
Persons
Engaged
Number of
Employees
Wages and
Salaries (Cash
and In-Kind)
(GH¢)
Social
Security
(GH¢)
Other
Supplement to
wages and
salaries
(GH¢)
Number of
Establishments
ALL SECTORS - Brong Ahafo 231,590 112,096 673,998,041 23,278,494 9,176,310 44,405
Agriculture 4,636 3,189 8,019,949 315,351 225,913 575
Agriculture, forestry and fishing 4,636 3,189 8,019,949 315,351 225,913 575
Industry 46,374 18,758 69,260,631 3,046,496 3,184,146 7,506
Mining and quarrying 312 311 2,852,292 315,320 0 5
Manufacturing 43,610 16,447 58,809,299 2,409,346 3,109,781 7,327
Electricity, gas, steam and air conditioning supply 31 31 193,000 22,875 0 1
Water supply; sewerage, waste management 902 864 1,224,760 95,983 4,771 40
Construction 1,520 1,105 6,181,281 202,971 69,594 133
Services 180,579 90,149 596,717,461 19,916,648 5,766,251 36,323
Wholesale and retail trade; repair of motor vehicles and
motorcycles 54,436 17,467 44,104,943 1,214,630 581,482 20,115
Transportation and storage 830 579 2,442,029 136,262 15,557 62
Accommodation and food service activities 12,903 6,950 14,230,498 140,091 136,950 3,432
Information and communication 1,527 967 2,272,833 146,693 25,836 297
Financial and insurance activities 6,436 5,415 50,982,886 4,086,964 2,579,481 430
Real estate activities 16 14 251,786 0 0 5
Professional, scientific and technical activities 1,622 1,100 9,029,365 91,330 12,124 260
Administrative and support service activities 906 482 1,088,757 49,762 10,947 279
Education 43,793 41,646 358,641,948 7,991,640 1,848,179 1,762
Human health and social work activities 6,546 5,550 83,310,692 5,210,742 516,069 193
Arts, entertainment and recreation 1,510 1,112 2,705,020 55,978 10,559 326
Other service activities 50,054 8,866 27,656,705 792,554 29,067 9,163

105
Table C.10: Compensation of employees by sector and region
ISIC Group
Number of
Persons
Engaged
Number of
Employees
Wages and
Salaries (Cash
and In-Kind)
(GH¢)
Social
Security
(GH¢)
Other
Supplement to
wages and
salaries
(GH¢)
Number of
Establishments
ALL SECTORS - Northern 188,709 70,981 394,653,838 24,930,257 5,423,722 35,917
Agriculture 2,228 1,643 2,565,764 174,126 107,533 202
Agriculture, forestry and fishing 2,228 1,643 2,565,764 174,126 107,533 202
Industry 52,321 18,034 140,026,769 11,287,725 1,198,316 8,554
Mining and quarrying 9 8 56,514 4,521 0 1
Manufacturing 44,922 11,294 22,064,647 714,776 662,082 8,344
Electricity, gas, steam and air conditioning supply 1,140 1,048 95,411,958 9,061,118 1,700 10
Water supply; sewerage, waste management 3,725 3,633 7,497,670 485,052 381,372 55
Construction 2,525 2,052 14,995,979 1,022,258 153,162 144
Services 134,159 51,304 252,061,306 13,468,406 4,117,874 27,161
Wholesale and retail trade; repair of motor vehicles and
motorcycles 58,070 19,775 58,858,383 1,060,821 1,263,587 16,272
Transportation and storage 402 265 472,519 19,286 9,614 49
Accommodation and food service activities 11,123 7,139 15,122,031 148,282 492,798 2,115
Information and communication 694 473 6,456,418 56,320 26,667 126
Financial and insurance activities 2,574 2,272 21,275,014 1,688,959 1,492,343 196
Real estate activities 21 15 38,690 3,780 5,000 4
Professional, scientific and technical activities 902 600 4,381,088 135,330 33,252 142
Administrative and support service activities 739 321 575,335 10,271 23,289 214
Education 10,763 9,787 79,214,319 4,479,819 400,113 600
Human health and social work activities 2,754 2,510 24,991,065 2,153,671 140,111 153
Arts, entertainment and recreation 260 171 566,422 13,605 9,772 91
Other service activities 45,857 7,977 40,110,022 3,698,263 221,326 7,198
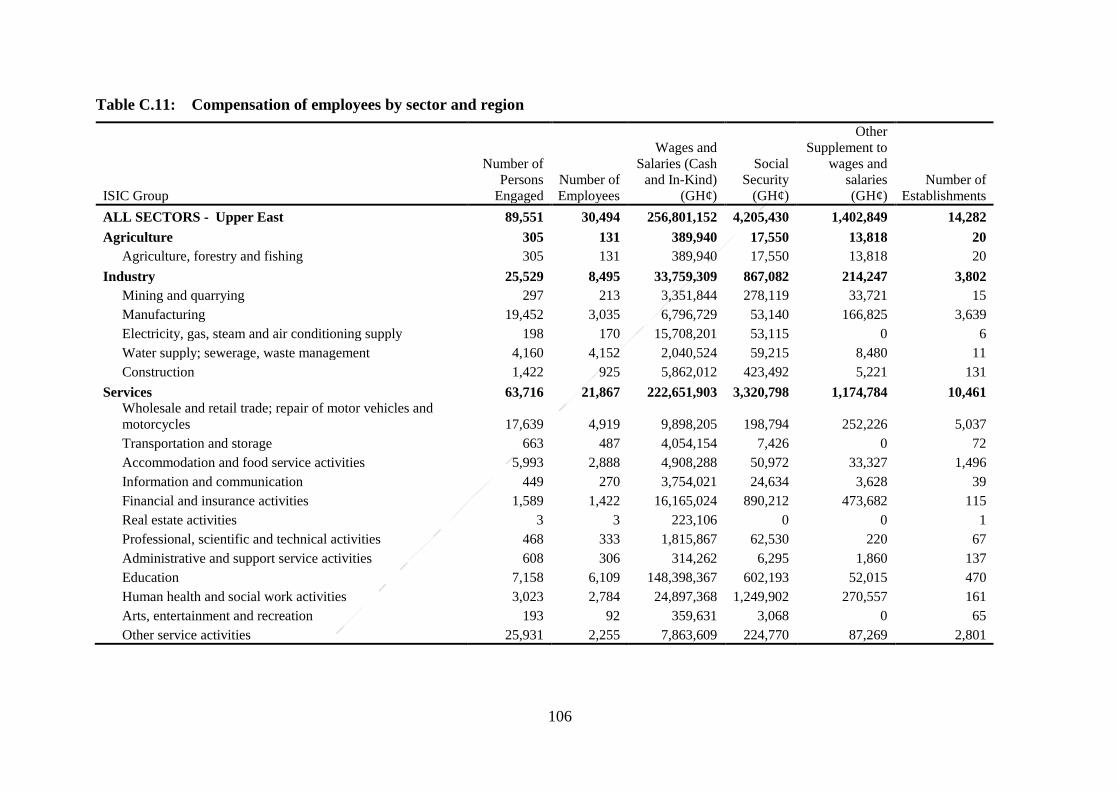
106
Table C.11: Compensation of employees by sector and region
ISIC Group
Number of
Persons
Engaged
Number of
Employees
Wages and
Salaries (Cash
and In-Kind)
(GH¢)
Social
Security
(GH¢)
Other
Supplement to
wages and
salaries
(GH¢)
Number of
Establishments
ALL SECTORS - Upper East 89,551 30,494 256,801,152 4,205,430 1,402,849 14,282
Agriculture 305 131 389,940 17,550 13,818 20
Agriculture, forestry and fishing 305 131 389,940 17,550 13,818 20
Industry 25,529 8,495 33,759,309 867,082 214,247 3,802
Mining and quarrying 297 213 3,351,844 278,119 33,721 15
Manufacturing 19,452 3,035 6,796,729 53,140 166,825 3,639
Electricity, gas, steam and air conditioning supply 198 170 15,708,201 53,115 0 6
Water supply; sewerage, waste management 4,160 4,152 2,040,524 59,215 8,480 11
Construction 1,422 925 5,862,012 423,492 5,221 131
Services 63,716 21,867 222,651,903 3,320,798 1,174,784 10,461
Wholesale and retail trade; repair of motor vehicles and
motorcycles 17,639 4,919 9,898,205 198,794 252,226 5,037
Transportation and storage 663 487 4,054,154 7,426 0 72
Accommodation and food service activities 5,993 2,888 4,908,288 50,972 33,327 1,496
Information and communication 449 270 3,754,021 24,634 3,628 39
Financial and insurance activities 1,589 1,422 16,165,024 890,212 473,682 115
Real estate activities 3 3 223,106 0 0 1
Professional, scientific and technical activities 468 333 1,815,867 62,530 220 67
Administrative and support service activities 608 306 314,262 6,295 1,860 137
Education 7,158 6,109 148,398,367 602,193 52,015 470
Human health and social work activities 3,023 2,784 24,897,368 1,249,902 270,557 161
Arts, entertainment and recreation 193 92 359,631 3,068 0 65
Other service activities 25,931 2,255 7,863,609 224,770 87,269 2,801

107
Table C.12: Compensation of employees by sector and region
ISIC Group
Number of
Persons
Engaged
Number of
Employees
Wages and
Salaries (Cash
and In-Kind)
(GH¢)
Social
Security
(GH¢)
Other
Supplement to
wages and
salaries
(GH¢)
Number of
Establishments
ALL SECTORS - Upper West 50,415 14,990 101,457,727 2,996,511 507,884 12,526
Agriculture 499 271 252,940 14,743 24,264 30
Agriculture, forestry and fishing 499 271 252,940 14,743 24,264 30
Industry 14,915 3,820 20,446,877 740,662 5,348 2,903
Mining and quarrying 88 61 1,524,448 188,013 0 5
Manufacturing 12,054 1,506 10,367,450 22,131 5,141 2,717
Electricity, gas, steam and air conditioning supply 7 7 25,000 0 0 1
Water supply; sewerage, waste management 107 90 213,795 22,302 0 10
Construction 2,659 2,156 8,316,184 508,216 206 171
Services 35,001 10,899 80,757,910 2,241,106 478,273 9,593
Wholesale and retail trade; repair of motor vehicles and
motorcycles 17,673 3,620 8,025,509 140,339 17,891 6,262
Transportation and storage 474 366 1,885,313 105,374 0 43
Accommodation and food service activities 3,407 1,028 2,072,885 64,907 8,404 1,000
Information and communication 387 327 1,126,131 4,116 92 31
Financial and insurance activities 673 595 12,678,167 173,979 134,101 50
Real estate activities 0 0 0 0 0 0
Professional, scientific and technical activities 294 231 2,852,952 96,279 0 28
Administrative and support service activities 471 331 768,466 46,241 0 83
Education 2,638 2,244 29,671,001 833,846 314,610 283
Human health and social work activities 1,875 1,525 19,986,580 759,012 1,536 94
Arts, entertainment and recreation 72 47 602,178 0 0 22
Other service activities 7,036 586 1,088,727 17,012 1,639 1,699

108
Table D.1: Depreciation of fixed asset by sector
ISIC Group
Intangible
Assets Land
Other
Construction
and land
Improvements Buildings
Transport and
Equipment
Machinery and
Other
Equipment
Furniture and
Fittings
Other Tangible
Assets
ALL SECTORS - National 478,677,784 0 2,589,872,892 496,512,719,275 128,149,400,391 14,291,416,723 2,369,999,406 2,732,310,119,279
Agriculture 993,162 0 20,305,550 100,010,057,875 100,103,388,395 511,909,768 1,824,742 200,021,556,633
Agriculture, forestry and fishing 993,162 0 20,305,550 100,010,057,875 100,103,388,395 511,909,768 1,824,742 200,021,556,633
Industry 109,472,368 0 2,407,023,617 393,835,279,891 3,774,039,187 12,912,737,549 1,104,108,993 2,531,599,287,845
Mining and quarrying 35,436,643 0 249,661,363 159,251,368 2,521,789,095 7,439,650,869 1,029,504,241 356,412,457
Manufacturing 10,353,887 0 226,737,644 393,333,721,098 146,296,045 1,416,821,168 45,198,396 2,531,172,669,091
Electricity, gas, steam and air condition 88,621 0 1,862,068,356 315,164,307 133,781,333 3,601,748,947 5,666,533 4,406,972
Water supply; sewerage, waste management 61,855,130 0 62,853,975 4,229,647 837,398,171 38,066,154 6,280,508 55,630,406
Construction 1,738,087 0 5,702,279 22,913,471 134,774,543 416,450,410 17,459,315 10,168,919
Services 368,212,254 0 162,543,725 2,667,381,509 24,271,972,809 866,769,407 1,264,065,670 689,274,801
Wholesale and retail trade; repair of motor vehicles and
motorcycles 7,989,975 0 14,898,221 139,615,300 291,666,939 231,332,653 62,094,545 86,768,177
Transportation and storage 2,257,466 0 5,323,925 80,247,585 469,509,474 51,199,155 9,970,871 79,271,935
Accommodation and food service activities 19,629,261 0 20,340,845 1,413,618,152 871,401,370 60,354,874 62,792,090 9,818,970
Information and communication 84,623,828 0 8,730,133 7,456,664 535,958,082 290,488,566 12,072,345 80,858,099
Financial and insurance activities 242,405,106 0 75,786,086 241,140,709 886,820,032 76,342,306 980,064,034 388,307,352
Real estate activities 273,343 0 5,268,199 19,915,277 5,332,085 53,749,878 2,845,878 592,592
Professional, scientific and technical activities 1,283,678 0 316,514 8,294,122 23,795,995 13,619,694 8,860,893 9,585,203
Administrative and support service activities 990,333 0 2,979,242 8,034,513 460,042,800 24,854,583 47,320,630 2,135,056
Education 1,648,488 0 5,114,508 286,586,862 88,954,542 11,842,248 36,306,154 17,955,847
Human health and social work activities 394,170 0 2,543,870 212,433,428 16,668,018 28,114,862 9,099,763 8,185,955
Arts, entertainment and recreation 238,463 0 43,842 3,964,051 101,030,996 6,228,360 8,747,320 1,893,935
Other service activities 6,478,143 0 21,198,340 246,074,846 20,520,792,477 18,642,227 23,891,147 3,901,679

109
Table D.2: Depreciation of fixed asset by sector and size of establishment
ISIC Group
Intangible
Assets land
Other
Construction
and land
Improvements Buildings
Transport and
Equipment
Machinery
and Other
Equipment
Furniture and
Fittings
Other Tangible
Assets
ALL SECTORS - National 478,677,784 0 2,589,872,892 496,512,719,275 128,149,400,391 14,291,416,723 2,369,999,406 2,732,310,119,279
Large-Sized Businesses 218,406,039 0 2,030,442,054 917,614,924 1,822,008,491 5,655,230,002 786,449,445 924,885,822
Medium-Sized Businesses 46,575,014 0 251,100,033 494,037,027,159 103,877,992,997 7,397,651,022 1,175,674,219 200,110,773,609
Small-Sized Businesses 116,539,116 0 293,940,940 1,349,454,761 21,626,925,878 1,184,448,029 251,017,449 2,531,164,049,838
Micro-Sized Businesses 97,157,615 0 14,389,864 208,622,431 822,473,025 54,087,670 156,858,293 110,410,010
AGRICULTURE 993,162 0 20,305,550 100,010,057,875 100,103,388,395 511,909,768 1,824,742 200,021,556,633
Large-Sized Businesses 165,371 0 19,085,844 5,243,695 84,976,852 501,169,803 1,179,994 17,732,967
Medium-Sized Businesses 814,686 0 751,952 100,001,876,958 100,001,452,275 6,069,966 188,587 200,001,320,664
Small-Sized Businesses 9,201 0 429,301 2,257,960 16,592,224 4,090,813 270,952 747,536
Micro-Sized Businesses 3,904 0 38,453 679,262 367,043 579,186 185,210 1,755,466
INDUSTRY 109,472,368 0 2,407,023,617 393,835,279,891 3,774,039,187 12,912,737,549 1,104,108,993 2,531,599,287,845
Large-Sized Businesses 16,229,014 0 1,946,232,846 483,091,859 475,942,721 4,751,463,447 115,806,900 526,518,825
Medium-Sized Businesses 5,716,580 0 231,263,580 393,308,824,988 3,180,453,497 7,166,530,971 972,631,229 23,163,197
Small-Sized Businesses 87,339,938 0 229,077,042 36,419,594 100,760,694 985,808,459 12,128,840 2,531,047,526,523
Micro-Sized Businesses 186,836 0 450,149 6,943,450 16,882,275 8,934,672 3,542,024 2,079,300
SERVICES 368,212,254 0 162,543,725 2,667,381,509 24,271,972,809 866,769,407 1,264,065,670 689,274,801
Large-Sized Businesses 202,011,654 0 65,123,365 429,279,370 1,261,088,918 402,596,751 669,462,552 380,634,029
Medium-Sized Businesses 40,043,748 0 19,084,502 726,325,213 696,087,224 225,050,085 202,854,403 86,289,749
Small-Sized Businesses 29,189,977 0 64,434,596 1,310,777,207 21,509,572,961 194,548,758 238,617,657 115,775,779
Micro-Sized Businesses 96,966,875 0 13,901,262 200,999,720 805,223,707 44,573,812 153,131,059 106,575,244

110
Table E.1: Value of fixed asset at the end of year by sector
ISIC Group
Intangible
Assets Land
Other
Construction
and land
Improvements Buildings
Transport and
Equipment
Machinery
and Other
Equipment
Furniture
and Fittings
Other
Tangible
Assets
All Sectors -National 1,340,061,518 18,064,742,020 7,591,234,933 26,101,058,860 25,277,005,328 95,857,872,954 3,895,882,794 2,243,171,210
Agriculture 2,226,247 48,542,330 12,591,004 188,593,417 340,582,381 9,132,328,530 14,238,510 72,460,818
Agriculture, forestry and fishing 2,226,247 48,542,330 12,591,004 188,593,417 340,582,381 9,132,328,530 14,238,510 72,460,818
Industry 599,382,863 16,067,653,205 6,443,072,876 5,180,301,771 10,811,717,766 83,424,368,217 850,118,252 559,618,975
Mining and quarrying 574,316,277 14,967,498,799 868,020,875 538,384,147 1,872,391,955 50,296,124,140 499,449,609 214,008,911
Manufacturing 11,603,301 234,456,161 3,500,390,558 1,930,724,528 7,660,805,355 23,136,831,978 118,834,487 258,407,065
Electricity, gas, steam and air conditioning 246,763 11,494,985 1,714,686,050 2,397,737,614 252,501,835 7,281,047,332 55,497,535 9,024,090
Water supply; sewerage, waste management 9,613,232 286,981,053 248,723,175 77,724,755 620,156,558 631,512,881 119,128,340 44,459,498
Construction 3,603,289 567,222,208 111,252,218 235,730,727 405,862,063 2,078,851,887 57,208,281 33,719,411
Services 738,452,408 1,948,546,485 1,135,571,053 20,732,163,673 14,124,705,181 3,301,176,207 3,031,526,032 1,611,091,417
Wholesale and retail trade and repair of motor vehicles
and motorcycles 14,254,557 714,882,395 439,497,701 2,347,019,092 1,729,124,151 1,399,027,906 212,204,037 294,562,565
Transportation and storage 8,917,952 54,085,418 42,451,255 608,545,708 1,571,613,014 136,895,512 22,865,310 31,939,183
Accommodation and food service activities 35,812,389 130,639,606 229,288,173 5,100,775,782 1,942,786,515 308,850,979 235,605,694 90,151,795
Information and communication 102,375,104 7,261,733 25,330,819 72,358,660 1,937,902,779 507,608,415 27,977,628 213,397,899
Financial and insurance activities 547,042,871 3,455,135 174,852,490 3,553,260,633 1,116,108,601 251,334,609 1,991,838,152 801,212,759
Real estate activities 2,034,053 164,984,328 49,779,094 201,693,487 18,212,592 14,980,248 8,902,142 10,666,825
Professional, scientific and technical activities 2,342,996 11,511,157 2,937,710 133,936,847 92,338,289 71,787,070 37,411,805 28,119,980
Administrative and support service activities 5,684,433 23,226,846 15,433,343 112,169,557 3,535,944,781 74,000,362 64,813,419 28,401,871
Education 3,552,927 68,961,947 31,098,830 5,370,534,382 966,090,021 58,849,465 158,983,150 37,913,675
Human health and social work activities 2,676,189 426,256,843 33,770,382 855,535,452 89,558,489 224,338,002 39,900,047 27,722,540
Sports activities and amusement and recreation
activities 1,030,982 11,300,396 345,343 36,224,953 904,231,093 40,465,008 11,134,011 5,283,252
Other service activities 12,727,953 331,980,682 90,785,914 2,340,109,118 220,794,857 213,038,631 219,890,639 41,719,073

111
Table E.2: Value of fixed asset at the end of year by sector and size of establishment
Sector/LMSM
Intangible
Assets Land
Other
Construction
and land
Improvements Buildings
Transport and
Equipment
Machinery
and Other
Equipment
Furniture
and Fittings
Other Tangible
Assets
All Sectors -National 1,340,061,518 18,064,742,020 7,591,234,933 26,101,058,860 25,277,005,328 95,857,872,954 3,895,882,794 2,243,171,210
Agriculture 2,226,247 48,542,330 12,591,004 188,593,417 340,582,381 9,132,328,530 14,238,510 72,460,818
Large-Sized Businesses 310,810 12,629,724 6,550,000 80,705,159 317,208,299 9,071,250,183 10,772,274 65,371,495
Medium-Sized Businesses 1,732,771 9,489,571 3,711,461 23,207,350 4,571,011 34,856,506 409,197 4,037,661
Small-Sized Businesses 110,199 23,073,042 2,202,831 61,419,224 16,689,890 21,552,616 1,368,445 1,136,116
Micro-Sized Businesses 72,468 3,349,992 126,712 23,261,684 2,113,182 4,669,226 1,688,594 1,915,545
Industry 599,382,863 16,067,653,205 6,443,072,876 5,180,301,771 10,811,717,766 83,424,368,217 850,118,252 559,618,975
Large-Sized Businesses 43,555,081 452,265,911 2,429,563,595 1,404,378,585 597,576,412 14,884,149,295 167,515,949 342,476,367
Medium-Sized Businesses 10,649,438 15,403,696,948 3,281,342,244 2,759,275,036 9,660,779,415 48,359,492,011 620,521,131 121,239,261
Small-Sized Businesses 540,971,061 189,163,858 728,225,400 760,355,847 486,212,157 20,070,034,519 46,498,404 91,028,848
Micro-Sized Businesses 4,207,283 22,526,488 3,941,637 256,292,303 67,149,782 110,692,393 15,582,768 4,874,499
Services 738,452,408 1,948,546,485 1,135,571,053 20,732,163,673 14,124,705,181 3,301,176,207 3,031,526,032 1,611,091,417
Large-Sized Businesses 368,358,283 250,010,601 408,267,764 2,485,670,410 5,422,053,879 879,189,265 1,277,798,333 497,748,233
Medium-Sized Businesses 122,976,629 303,512,519 153,049,712 8,474,141,355 2,632,589,020 634,112,472 300,107,679 473,549,064
Small-Sized Businesses 45,471,549 905,676,099 432,209,703 6,470,768,430 4,672,907,350 1,010,521,765 922,981,837 234,793,809
Micro-Sized Businesses 201,645,946 489,347,266 142,043,874 3,301,583,477 1,397,154,932 777,352,705 530,638,183 405,000,312

112
Table E.3: Value of fixed asset at the end of year by sector and region
Major Industry (2 Digit ISIC) by Region
Intangible
Assets Land
Other
Construction
and land
Improvements Buildings
Transport and
Equipment
Machinery
and Other
Equipment
Furniture
and Fittings
Other
Tangible
Assets
Western -All Sectors 44,361,549 95,077,695 150,022,510 671,324,811 2,085,840,300 13,159,548,915 133,719,739 176,361,167
Agriculture 67,668 6,591,624 73,800 2,786,761 454,444 6,972,098 164,002 47,800
Agriculture, forestry and fishing 67,668 6,591,624 73,800 2,786,761 454,444 6,972,098 164,002 47,800
Industry 36,434,206 22,626,960 95,302,407 246,057,845 194,417,834 13,002,879,350 54,630,441 141,782,875
Mining and quarrying 34,637,642 741,829 67,350,357 105,530,659 89,623,535 12,036,883,761 31,619,081 114,430,286
Manufacturing 1,743,844 17,592,685 26,251,919 78,814,446 52,170,093 182,902,300 21,842,250 26,823,117
Electricity, gas, steam and air conditioning 17,486 2,266,275 1,686,114 59,146,797 16,192,919 765,505,644 170,477 19,890
Water supply; sewerage, waste management 30,855 0 0 0 27,157,595 223,863 166,099 17,815
Construction 4,379 2,026,171 14,017 2,565,943 9,273,692 17,363,782 832,534 491,767
Services 7,859,675 65,859,111 54,646,303 422,480,205 1,890,968,023 149,697,467 78,925,296 34,530,492
Wholesale and retail trade and repair of motor vehicles and
motorcycles 1,165,075 28,546,281 5,688,591 91,215,663 103,055,123 48,636,251 19,167,485 6,954,283
Transportation and storage 3,422 2,231,937 515,255 28,802,786 1,061,213,497 1,127,957 443,400 2,459,154
Accommodation and food service activities 2,217,387 17,110,914 15,879,660 66,581,627 7,841,161 43,310,736 14,501,980 6,619,549
Information and communication 190,077 1,800,207 2,622,857 4,145,861 1,678,922 9,699,553 1,087,176 1,396,983
Financial and insurance activities 293,242 400,000 3,869 40,531,018 6,775,475 5,068,319 8,898,700 7,475,579
Real estate activities 1,758,690 1,700,000 0 0 496,340 51,099 20,744 19,257
Professional, scientific and technical activities 180,788 375,190 180,244 498,938 1,586,243 2,088,762 551,228 361,681
Administrative and support service activities 6,235 176,376 0 478,493 1,772,958 3,175,900 2,221,626 1,890,538
Education 265,020 716,538 16,638,793 59,324,509 685,512,004 755,475 11,768,572 2,933,096
Human health and social work activities 84,261 1,278,351 4,721,295 13,211,739 1,973,109 16,737,252 3,053,943 616,781
Sports activities and amusement and recreation activities 95,857 7,714 950 165,950 373,033 1,012,595 245,295 220,972
Other service activities 1,599,621 11,515,603 8,394,790 117,523,620 18,690,159 18,033,570 16,965,146 3,582,621

113
Table E.4: Value of fixed asset at the end of year by sector and region
Major Industry (2 Digit ISIC) by Region
Intangible
Assets Land
Other
Construction
and land
Improvements Buildings
Transport and
Equipment
Machinery
and Other
Equipment
Furniture
and
Fittings
Other
Tangible
Assets
Central - All Sectors 2,445,492 101,846,839 57,708,720 3,610,120,994 2,849,856,619 680,511,810 81,246,663 74,809,107
Agriculture 13,300 7,282,800 282,055 4,761,532 3,268,824 1,055,253 834,743 517,586
Agriculture, forestry and fishing 13,300 7,282,800 282,055 4,761,532 3,268,824 1,055,253 834,743 517,586
Industry 756,488 14,494,224 2,610,309 62,930,952 23,208,234 625,845,304 5,978,490 56,519,275
Mining and quarrying 0 357,500 0 1,240,900 8,153,053 17,707,107 94,299 55,245,020
Manufacturing 709,366 11,433,152 2,339,837 41,140,036 10,860,439 37,626,109 2,005,782 1,234,433
Electricity, gas, steam and air conditioning 0 0 0 12,356,010 120,000 316,907,711 3,423,384 6,720
Water supply; sewerage, waste management 22,000 2,200 0 495,520 198,140 351,029 11,289 600
Construction 25,121 2,701,372 270,471 7,698,486 3,876,602 253,253,348 443,736 32,502
Services 1,675,704 80,069,815 54,816,357 3,542,428,510 2,823,379,561 53,611,253 74,433,430 17,772,246
Wholesale and retail trade and repair of motor vehicles and
motorcycles 243,273 7,507,517 2,736,297 59,062,651 53,697,391 22,600,960 5,445,723 3,376,505
Transportation and storage 95 19,000 42,565 271,914 1,674,640 2,060 68,699 9,442
Accommodation and food service activities 206,323 8,252,120 37,127,925 2,879,812,230 1,805,058,401 10,975,644 21,822,070 2,334,788
Information and communication 13,408 97,688 1,089 909,352 900,169,270 2,251,026 465,526 581,737
Financial and insurance activities 627,674 26,000 1,382,550 24,823,103 3,891,024 2,619,578 3,596,018 2,140,453
Real estate activities 180 10,384,038 10,883 1,094,221 543,500 240,120 190,070 65,608
Professional, scientific and technical activities 400 0 0 284,318 350,457 574,936 211,222 3,010,185
Administrative and support service activities 19,686 10,000 0 528,978 1,215,127 744,743 978,643 842,393
Education 257,175 43,028,556 164,532 252,474,475 10,781,806 806,888 7,072,217 1,362,204
Human health and social work activities 14,393 383,230 373,906 22,004,546 1,033,145 3,688,658 2,552,872 339,217
Sports activities and amusement and recreation activities 92,641 1,515,200 7,800 582,468 160,739 135,945 137,332 536,113
Other service activities 200,456 8,846,466 12,968,809 300,580,253 44,804,062 8,970,695 31,893,037 3,173,601

114
Table E.5: Value of fixed asset at the end of year by sector and region
Major Industry (2 Digit ISIC) by Region
Intangible
Assets Land
Other
Construction
and land
Improvements Buildings
Transport and
Equipment
Machinery
and Other
Equipment
Furniture
and Fittings
Other
Tangible
Assets
Greater Accra - All Sectors 1,249,064,815 17,263,659,015 6,888,397,825 15,411,826,978 6,580,757,883 68,058,423,410 3,133,741,431 1,766,954,137
Agriculture 1,792,923 11,265,719 53,935 54,061,633 312,282,196 9,016,120,533 10,075,082 64,082,845
Agriculture, forestry and fishing 1,792,923 11,265,719 53,935 54,061,633 312,282,196 9,016,120,533 10,075,082 64,082,845
Industry 553,338,558 15,878,671,943 5,986,131,702 3,681,908,825 2,892,425,391 57,062,025,597 693,577,299 321,351,593
Mining and quarrying 535,623,415 14,856,329,900 578,296,665 87,406,843 1,652,517,556 37,637,446,089 440,668,188 24,774,288
Manufacturing 7,704,290 182,267,903 3,439,480,734 1,122,629,493 239,657,327 13,442,702,550 70,191,988 212,799,868
Electricity, gas, steam and air conditioning 226,225 5,747,400 1,712,999,936 2,209,795,919 204,490,352 3,781,365,057 16,993,285 8,988,329
Water supply; sewerage, waste management 8,127,570 285,593,216 222,844,002 72,289,524 568,735,787 579,087,395 113,515,700 43,076,015
Construction 1,657,059 548,733,524 32,510,365 189,787,047 227,024,368 1,621,424,505 52,208,137 31,713,094
Services 693,933,333 1,373,721,353 902,212,188 11,675,856,520 3,376,050,296 1,980,277,281 2,430,089,050 1,381,519,699
Wholesale and retail trade and repair of motor vehicles
and motorcycles 8,149,042 407,057,123 402,440,446 1,514,961,241 1,349,157,244 658,539,528 135,678,648 258,312,178
Transportation and storage 7,112,145 49,847,663 41,388,920 551,353,676 323,888,729 131,286,414 20,645,349 28,991,379
Accommodation and food service activities 20,447,302 97,813,459 160,499,664 1,306,260,346 87,602,198 179,985,971 119,386,474 40,206,174
Information and communication 101,612,822 4,321,384 22,305,034 57,065,100 124,298,956 421,633,343 22,385,813 200,384,494
Financial and insurance activities 542,754,418 564,330 164,256,492 3,103,702,618 1,002,758,186 181,730,918 1,871,350,992 752,125,464
Real estate activities 268,836 117,407,690 49,755,611 195,871,285 16,315,286 13,169,095 8,392,769 10,512,568
Professional, scientific and technical activities 2,000,137 10,976,601 1,505,946 99,316,861 65,501,020 56,212,518 33,776,527 21,682,458
Administrative and support service activities 5,393,409 21,307,812 15,286,507 102,084,974 127,991,239 51,493,344 49,371,338 19,360,945
Education 1,820,708 13,409,448 1,810,695 3,997,110,214 181,402,772 43,301,744 95,859,656 18,209,269
Human health and social work activities 1,386,305 423,755,421 17,525,494 437,090,904 63,293,143 107,104,315 16,810,763 13,567,565
Sports activities and amusement and recreation activities 765,078 7,049,586 53,826 7,966,933 2,074,453 35,722,075 9,387,129 2,379,024
Other service activities 2,223,132 220,210,837 25,383,554 303,072,368 31,767,071 100,098,017 47,043,590 15,788,182

115
Table E.6: Value of fixed asset at the end of year by sector and region
Major Industry (2 Digit ISIC) by Region
Intangible
Assets Land
Other
Construction
and land
Improvements Buildings
Transport
and
Equipment
Machinery
and Other
Equipment
Furniture
and Fittings
Other
Tangible
Assets
Volta - All Sectors 13,629,548 25,949,003 13,923,681 799,853,125 988,588,984 443,471,853 135,613,144 10,233,003
Agriculture 814 3,553,934 34,689 9,072,020 4,161,348 6,926,662 129,520 201,709
Agriculture, forestry and fishing 814 3,553,934 34,689 9,072,020 4,161,348 6,926,662 129,520 201,709
Industry 1,060,204 3,424,756 6,125,878 63,508,546 34,045,416 373,392,095 31,801,540 917,541
Mining and quarrying 0 35,660 83,310 733,531 1,328,008 2,077,087 51,246 2,684
Manufacturing 34,309 1,959,904 3,057,139 40,212,246 11,238,444 42,594,625 1,722,827 669,073
Electricity, gas, steam and air conditioning 0 0 0 14,480,750 8,096,319 316,990,000 25,647,750 0
Water supply; sewerage, waste management 1,023,608 13,020 5,874 1,331,849 4,723,602 759,651 3,520,927 12,647
Construction 2,287 1,416,173 2,979,555 6,750,169 8,659,042 10,970,732 858,790 233,136
Services 12,568,530 18,970,312 7,763,114 727,272,559 950,382,220 63,153,096 103,682,084 9,113,753
Wholesale and retail trade and repair of motor vehicles and
motorcycles 296,571 3,322,961 2,009,713 82,246,505 17,213,117 25,662,634 7,721,387 1,823,741
Transportation and storage 3,031 29,776 2,077 4,368,420 6,629,037 540,500 153,525 47,364
Accommodation and food service activities 11,121,562 1,540,340 3,695,565 93,385,291 4,516,925 7,145,406 11,337,214 1,133,233
Information and communication 53,727 40,683 6,973 1,209,623 218,878 2,232,205 381,103 416,994
Financial and insurance activities 400,167 19,180 0 6,547,550 1,982,115 2,401,845 1,774,409 2,096,832
Real estate activities 0 105,000 0 8,280 98,500 81,568 29,680 15,855
Professional, scientific and technical activities 378 2,209 13,276 478,496 286,455 1,008,072 192,660 220,289
Administrative and support service activities 498 496,730 13,961 896,127 292,542 1,072,365 509,126 964,280
Education 0 1,466,758 0 66,161,601 9,157,570 2,708,953 13,678,417 1,448,365
Human health and social work activities 95,250 2,400 0 43,959,345 1,885,192 10,003,157 900,018 268,178
Sports activities and amusement and recreation activities 3,571 92,845 85,656 896,816 900,068,852 285,257 93,141 126,829
Other service activities 593,776 11,851,430 1,935,895 427,114,505 8,033,037 10,011,132 66,911,403 551,793

116
Table E.7: Value of fixed asset at the end of year by sector and region
Major Industry (2 Digit ISIC) by Region
Intangible
Assets Land
Other
Construction
and land
Improvements Buildings
Transport and
Equipment
Machinery
and Other
Equipment
Furniture
and
Fittings
Other
Tangible
Assets
Eastern - All Sectors 3,709,084 60,665,516 53,934,486 760,804,633 7,416,170,043 769,459,213 61,776,461 23,527,557
Agriculture 1,700 5,852,293 3,986,569 7,433,198 3,474,959 7,689,099 215,199 309,646
Agriculture, forestry and fishing 1,700 5,852,293 3,986,569 7,433,198 3,474,959 7,689,099 215,199 309,646
Industry 565,455 5,886,880 34,746,695 157,021,565 7,286,900,826 679,919,458 9,789,860 5,621,299
Mining and quarrying 14,580 1,467,578 5,102,115 3,074,872 6,352,797 36,179,257 405,587 237,475
Manufacturing 517,954 1,096,407 3,575,657 137,627,042 7,261,269,309 257,981,654 6,316,482 5,146,929
Electricity, gas, steam and air conditioning 0 0 0 14,798,400 6,988,150 380,300,000 2,849,150 460
Water supply; sewerage, waste management 6,023 254,000 25,779,200 1,131,586 1,304,895 912,968 49,222 60,248
Construction 26,899 3,068,896 289,724 389,665 10,985,675 4,545,579 169,419 176,186
Services 3,141,929 48,926,342 15,201,222 596,349,869 125,794,258 81,850,656 51,771,401 17,596,612
Wholesale and retail trade and repair of motor vehicles and motorcycles 88,148 7,355,157 4,225,202 64,833,421 38,087,160 21,536,028 5,160,348 3,256,813
Transportation and storage 860 6,800 0 813,397 4,064,547 317,321 272,362 22,961
Accommodation and food service activities 476,321 219,260 3,454,314 171,522,891 1,668,136 30,890,484 15,457,990 2,745,677
Information and communication 214,228 61,391 291,774 594,900 4,688,308 3,020,655 348,219 1,447,517
Financial and insurance activities 58,045 485,159 1,559,544 14,130,306 4,575,230 2,698,889 5,175,374 3,576,022
Real estate activities 3,000 31,561,500 10,800 3,923,430 526,639 1,254,674 5,627 5,830
Professional, scientific and technical activities 30,827 0 0 362,387 1,012,612 583,716 215,894 349,228
Administrative and support service activities 3,822 26,196 0 545,180 784,514 957,485 1,002,798 934,724
Education 125,539 2,614,231 1,075,346 145,815,842 12,846,489 2,682,070 5,424,447 2,275,137
Human health and social work activities 3,600 0 455,100 28,206,609 1,512,716 7,055,041 2,897,392 410,940
Sports activities and amusement and recreation activities 5,809 20,125 29,798 1,479,132 71,402 190,313 102,882 173,425
Other service activities 2,131,731 6,576,523 4,099,344 164,122,374 55,956,504 10,663,979 15,708,068 2,398,339

117
Table E.8: Value of fixed asset at the end of year by sector and region
Major Industry (2 Digit ISIC) by Region
Intangible
Assets Land
Other
Construction
and land
Improvements Buildings
Transport and
Equipment
Machinery and
Other
Equipment
Furniture
and Fittings
Other
Tangible
Assets
Ashanti - All Sectors 18,244,527 309,048,213 378,734,942 2,996,221,773 3,954,278,495 11,745,592,337 180,655,237 118,877,017
Agriculture 54,626 6,788,829 6,766,657 79,531,163 10,110,603 85,093,624 2,403,094 5,452,705
Agriculture, forestry and fishing 54,626 6,788,829 6,766,657 79,531,163 10,110,603 85,093,624 2,403,094 5,452,705
Industry 4,768,816 14,793,453 309,153,683 812,920,419 210,646,452 11,312,019,017 46,686,931 16,513,019
Mining and quarrying 4,020,281 5,444,982 217,183,508 333,421,591 106,673,820 483,674,057 26,295,123 5,556,473
Manufacturing 726,948 8,133,318 17,132,231 407,725,950 63,404,901 9,034,729,223 10,729,703 9,702,487
Electricity, gas, steam and air conditioning 0 0 0 66,532,048 8,373,780 1,711,065,184 6,392,088 0
Water supply; sewerage, waste management 475 211,429 46,612 348,326 3,055,646 8,923,858 1,502,318 922,550
Construction 21,112 1,003,725 74,791,332 4,892,504 29,138,305 73,626,695 1,767,699 331,509
Services 13,421,085 287,465,930 62,814,602 2,103,770,191 3,733,521,440 348,479,695 131,565,212 96,911,293
Wholesale and retail trade and repair of motor vehicles and
motorcycles 3,203,823 236,609,070 9,636,595 335,118,458 66,867,969 132,290,581 24,123,147 17,843,802
Transportation and storage 1,795,445 1,571,349 501,355 18,889,164 145,391,764 3,449,387 1,077,515 323,379
Accommodation and food service activities 795,615 1,919,782 1,391,958 398,073,791 25,422,686 22,519,178 39,737,606 33,320,337
Information and communication 124,729 510,563 4,950 2,084,000 5,092,511 61,741,560 2,109,417 7,947,407
Financial and insurance activities 658,887 1,721,910 5,560,453 284,612,764 12,231,888 6,204,041 14,947,583 8,120,072
Real estate activities 3,000 3,555,300 0 668,561 143,427 119,553 255,221 31,347
Professional, scientific and technical activities 49,814 126,956 1,238,244 12,924,200 2,457,701 8,400,209 1,690,863 1,685,100
Administrative and support service activities 230,969 986,876 7,202 5,662,480 3,401,052,286 14,010,350 4,885,557 2,785,865
Education 756,093 5,822,283 9,614,821 553,531,073 22,738,639 4,463,442 14,079,464 4,966,822
Human health and social work activities 415,085 721,500 7,502,419 166,900,187 8,407,450 63,476,537 7,443,037 9,482,807
Sports activities and amusement and recreation activities 40,635 84,948 166,538 2,684,985 323,550 2,555,958 479,186 479,436
Other service activities 5,346,989 33,835,394 27,190,067 322,620,527 43,391,569 29,248,900 20,736,617 9,924,918

118
Table E.9: Value of fixed asset at the end of year by sector and region
Major Industry (2 Digit ISIC) by Region
Intangible
Assets Land
Other
Construction
and land
Improvements Buildings
Transport
and
Equipment
Machinery
and Other
Equipment
Furniture
and
Fittings
Other
Tangible
Assets
Brong Ahafo - All Sectors 3,621,325 151,818,284 25,002,786 1,123,422,851 160,086,411 746,554,903 76,089,483 49,182,023
Agriculture 9,230 6,613,060 1,358,195 28,353,442 5,695,434 4,536,933 299,624 85,898
Agriculture, forestry and fishing 9,230 6,613,060 1,358,195 28,353,442 5,695,434 4,536,933 299,624 85,898
Industry 138,981 112,412,325 240,660 82,362,664 25,310,196 198,666,583 4,565,257 15,736,295
Mining and quarrying 19,141 100,440,820 4,900 768,103 6,296,503 75,978,627 122,526 13,555,675
Manufacturing 42,394 11,739,288 204,521 79,208,800 14,792,317 113,413,664 4,054,703 1,681,248
Electricity, gas, steam and air conditioning 971 0 0 17,100 31,430 0 0 720
Water supply; sewerage, waste management 72,355 109,750 19,087 1,761,719 844,772 4,092,629 69,778 302,344
Construction 4,120 122,467 12,152 606,943 3,345,173 5,181,663 318,250 196,309
Services 3,473,114 32,792,899 23,403,931 1,012,706,745 129,080,781 543,351,387 71,224,602 33,359,830
Wholesale and retail trade and repair of motor vehicles and motorcycles 722,053 13,812,848 5,840,812 65,725,752 32,306,747 446,055,146 6,157,228 1,473,128
Transportation and storage 800 182,078 900 1,868,323 6,147,000 130,927 63,302 6,825
Accommodation and food service activities 269,189 1,559,857 4,354,244 97,419,152 2,334,444 7,053,993 7,210,046 2,631,681
Information and communication 129,392 215,154 14,185 4,291,135 443,156 4,411,711 705,063 548,276
Financial and insurance activities 928,727 139,512 935,568 27,776,136 15,251,082 44,299,695 29,945,815 15,444,576
Real estate activities 147 110,800 1,800 127,710 32,400 9,909 3,841 11,030
Professional, scientific and technical activities 80,032 0 0 1,108,438 19,805,144 1,486,929 361,232 520,865
Administrative and support service activities 5,159 78,260 110,970 1,112,827 2,207,463 1,293,925 291,667 718,747
Education 298,784 1,578,834 1,570,594 220,319,508 39,606,712 2,774,181 7,162,582 3,648,885
Human health and social work activities 673,974 57,000 2,125,960 52,178,652 3,315,199 6,724,622 3,772,666 2,420,765
Sports activities and amusement and recreation activities 21,317 2,520,779 450 22,085,214 776,764 411,477 597,828 1,262,622
Other service activities 343,541 12,537,777 8,448,447 518,693,897 6,854,670 28,698,872 14,953,333 4,672,430

119
Table E.10: Value of fixed asset at the end of year by sector and region
Major Industry (2 Digit ISIC) by Region
Intangible
Assets Land
Other
Construction
and land
Improvements Buildings
Transport
and
Equipment
Machinery
and Other
Equipment
Furniture
and
Fittings
Other
Tangible
Assets
Northern - All Sectors 3,922,679 44,779,278 9,914,033 473,838,528 251,898,957 159,897,284 72,888,295 16,344,997
Agriculture 280,782 186,620 17,100 1,598,338 879,859 3,154,796 95,398 1,747,911
Agriculture, forestry and fishing 280,782 186,620 17,100 1,598,338 879,859 3,154,796 95,398 1,747,911
Industry 1,897,218 12,000,237 531,277 45,055,837 118,203,826 113,544,021 1,707,004 489,112
Mining and quarrying 0 0 0 4,200 0 577 9,900 840
Manufacturing 11,948 91,945 204,877 11,522,493 3,317,074 15,649,687 1,112,480 139,845
Electricity, gas, steam and air conditioning 1,796 3,481,310 0 20,607,390 8,204,728 8,913,136 16,305 4,405
Water supply; sewerage, waste management 24,356 797,439 0 340,328 4,884,653 16,458,082 134,997 38,209
Construction 1,859,118 7,629,543 326,400 12,581,426 101,797,370 72,522,539 433,323 305,813
Services 1,744,679 32,592,421 9,365,656 427,184,353 132,815,273 43,198,467 71,085,892 14,107,974
Wholesale and retail trade and repair of motor vehicles and motorcycles 145,988 6,767,375 5,617,635 80,298,091 23,988,164 23,700,575 4,717,242 543,652
Transportation and storage 100 34,600 0 764,666 21,321,685 11,246 53,598 14,397
Accommodation and food service activities 59,054 1,636,506 2,125,679 47,726,423 5,120,299 4,401,081 3,946,495 456,150
Information and communication 4,641 206,663 15,757 1,560,189 723,977 1,361,754 317,201 453,381
Financial and insurance activities 1,292,733 51,162 66,497 37,211,551 66,850,587 5,204,596 55,152,530 9,501,034
Real estate activities 200 160,000 0 0 56,500 54,230 3,390 5,080
Professional, scientific and technical activities 620 14,100 0 5,376,669 652,413 415,669 75,811 100,896
Administrative and support service activities 23,650 111,683 1,117 214,122 339,152 594,799 337,686 375,502
Education 1,824 300,000 0 43,728,290 1,788,485 701,078 1,504,945 1,609,491
Human health and social work activities 0 16,917 0 72,635,418 5,311,787 2,811,828 1,220,771 206,986
Sports activities and amusement and recreation activities 5,625 8,000 0 214,911 281,514 93,623 70,006 97,610
Other service activities 210,244 23,285,415 1,538,971 137,454,023 6,380,711 3,847,987 3,686,217 743,795
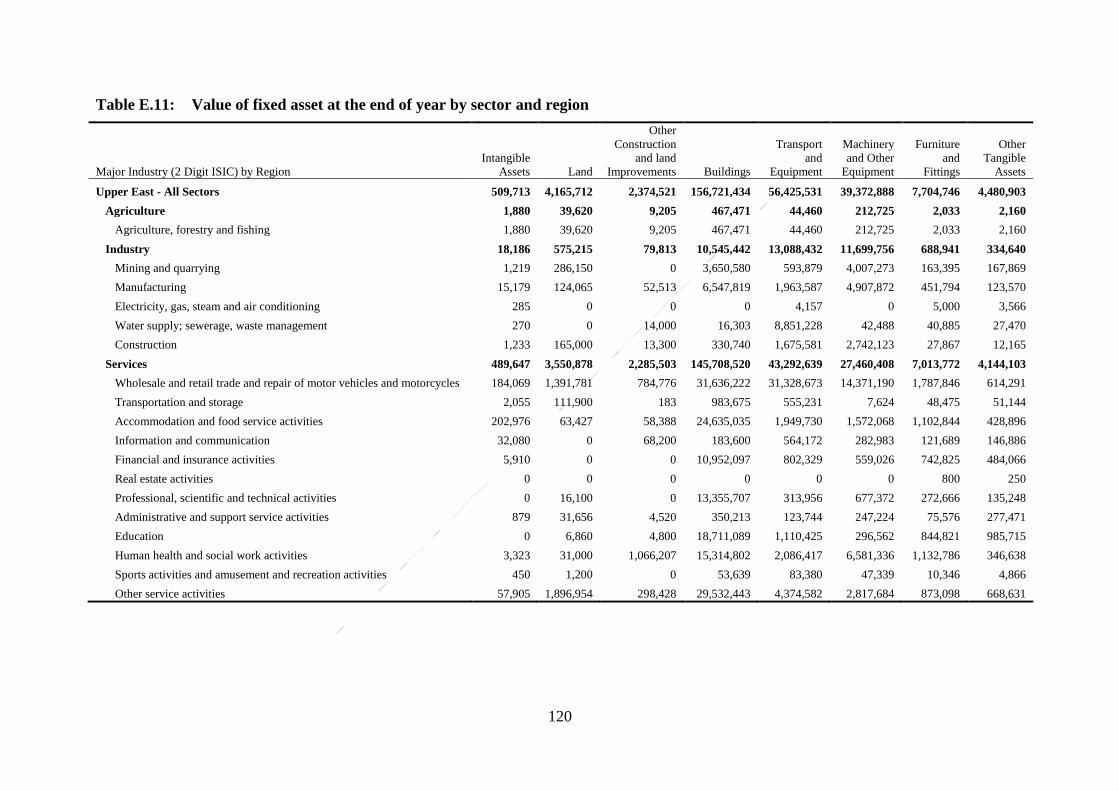
120
Table E.11: Value of fixed asset at the end of year by sector and region
Major Industry (2 Digit ISIC) by Region
Intangible
Assets Land
Other
Construction
and land
Improvements Buildings
Transport
and
Equipment
Machinery
and Other
Equipment
Furniture
and
Fittings
Other
Tangible
Assets
Upper East - All Sectors 509,713 4,165,712 2,374,521 156,721,434 56,425,531 39,372,888 7,704,746 4,480,903
Agriculture 1,880 39,620 9,205 467,471 44,460 212,725 2,033 2,160
Agriculture, forestry and fishing 1,880 39,620 9,205 467,471 44,460 212,725 2,033 2,160
Industry 18,186 575,215 79,813 10,545,442 13,088,432 11,699,756 688,941 334,640
Mining and quarrying 1,219 286,150 0 3,650,580 593,879 4,007,273 163,395 167,869
Manufacturing 15,179 124,065 52,513 6,547,819 1,963,587 4,907,872 451,794 123,570
Electricity, gas, steam and air conditioning 285 0 0 0 4,157 0 5,000 3,566
Water supply; sewerage, waste management 270 0 14,000 16,303 8,851,228 42,488 40,885 27,470
Construction 1,233 165,000 13,300 330,740 1,675,581 2,742,123 27,867 12,165
Services 489,647 3,550,878 2,285,503 145,708,520 43,292,639 27,460,408 7,013,772 4,144,103
Wholesale and retail trade and repair of motor vehicles and motorcycles 184,069 1,391,781 784,776 31,636,222 31,328,673 14,371,190 1,787,846 614,291
Transportation and storage 2,055 111,900 183 983,675 555,231 7,624 48,475 51,144
Accommodation and food service activities 202,976 63,427 58,388 24,635,035 1,949,730 1,572,068 1,102,844 428,896
Information and communication 32,080 0 68,200 183,600 564,172 282,983 121,689 146,886
Financial and insurance activities 5,910 0 0 10,952,097 802,329 559,026 742,825 484,066
Real estate activities 0 0 0 0 0 0 800 250
Professional, scientific and technical activities 0 16,100 0 13,355,707 313,956 677,372 272,666 135,248
Administrative and support service activities 879 31,656 4,520 350,213 123,744 247,224 75,576 277,471
Education 0 6,860 4,800 18,711,089 1,110,425 296,562 844,821 985,715
Human health and social work activities 3,323 31,000 1,066,207 15,314,802 2,086,417 6,581,336 1,132,786 346,638
Sports activities and amusement and recreation activities 450 1,200 0 53,639 83,380 47,339 10,346 4,866
Other service activities 57,905 1,896,954 298,428 29,532,443 4,374,582 2,817,684 873,098 668,631

121
Table E.12: Value of fixed asset at the end of year by sector and region
Major Industry (2 Digit ISIC) by Region
Intangible
Assets Land
Other
Construction
and land
Improvements Buildings
Transport and
Equipment
Machinery
and Other
Equipment
Furniture
and
Fittings
Other
Tangible
Assets
Upper West - All Sectors 552,786 7,732,466 11,221,428 96,923,734 933,102,104 55,040,341 12,447,597 2,401,299
Agriculture 3,325 367,830 8,800 527,859 210,254 566,809 19,814 12,557
Agriculture, forestry and fishing 3,325 367,830 8,800 527,859 210,254 566,809 19,814 12,557
Industry 404,749 2,767,213 8,150,452 17,989,674 13,471,160 44,377,036 692,489 353,325
Mining and quarrying 0 2,394,380 20 2,552,868 852,803 2,170,305 20,264 38,301
Manufacturing 97,069 17,495 8,091,129 5,296,203 2,131,864 4,324,292 406,476 86,495
Electricity, gas, steam and air conditioning 0 0 0 3,200 0 600 96 0
Water supply; sewerage, waste management 305,720 0 14,400 9,600 400,240 20,660,918 117,125 1,600
Construction 1,961 355,338 44,903 10,127,804 10,086,253 17,220,920 148,527 226,930
Services 144,712 4,597,424 3,062,177 78,406,201 919,420,690 10,096,497 11,735,294 2,035,417
Wholesale and retail trade and repair of motor vehicles and motorcycles 56,516 2,512,282 517,633 21,921,089 13,422,564 5,635,011 2,244,983 364,173
Transportation and storage 0 50,315 0 429,686 726,884 22,076 39,084 13,138
Accommodation and food service activities 16,660 523,941 700,776 15,358,996 1,272,535 996,418 1,102,974 275,310
Information and communication 0 8,000 0 314,900 900,024,630 973,625 56,420 74,223
Financial and insurance activities 23,069 47,881 1,087,517 2,973,489 990,687 547,703 253,906 248,662
Real estate activities 0 0 0 0 0 0 0 0
Professional, scientific and technical activities 0 0 0 230,834 372,288 338,888 63,702 54,029
Administrative and support service activities 126 1,256 9,067 296,163 165,757 410,228 5,139,403 251,406
Education 27,784 18,440 219,250 13,357,781 1,145,119 359,071 1,588,029 474,692
Human health and social work activities 0 11,025 0 4,033,251 740,330 155,255 115,799 62,662
Sports activities and amusement and recreation activities 0 0 325 94,904 17,405 10,426 10,865 2,356
Other service activities 20,557 1,424,284 527,608 19,395,108 542,491 647,795 1,120,128 214,765
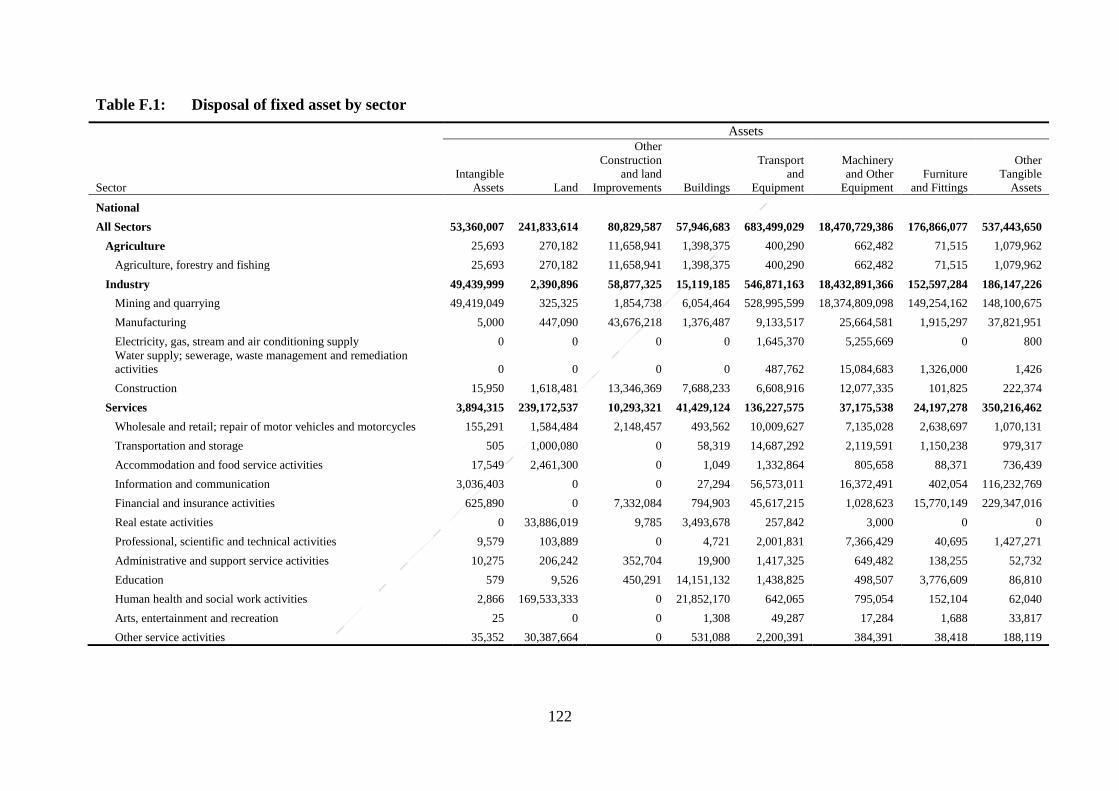
122
Table F.1: Disposal of fixed asset by sector
Sector
Assets
Intangible
Assets Land
Other
Construction
and land
Improvements Buildings
Transport
and
Equipment
Machinery
and Other
Equipment
Furniture
and Fittings
Other
Tangible
Assets
National
All Sectors 53,360,007 241,833,614 80,829,587 57,946,683 683,499,029 18,470,729,386 176,866,077 537,443,650
Agriculture 25,693 270,182 11,658,941 1,398,375 400,290 662,482 71,515 1,079,962
Agriculture, forestry and fishing 25,693 270,182 11,658,941 1,398,375 400,290 662,482 71,515 1,079,962
Industry 49,439,999 2,390,896 58,877,325 15,119,185 546,871,163 18,432,891,366 152,597,284 186,147,226
Mining and quarrying 49,419,049 325,325 1,854,738 6,054,464 528,995,599 18,374,809,098 149,254,162 148,100,675
Manufacturing 5,000 447,090 43,676,218 1,376,487 9,133,517 25,664,581 1,915,297 37,821,951
Electricity, gas, stream and air conditioning supply 0 0 0 0 1,645,370 5,255,669 0 800
Water supply; sewerage, waste management and remediation
activities 0 0 0 0 487,762 15,084,683 1,326,000 1,426
Construction 15,950 1,618,481 13,346,369 7,688,233 6,608,916 12,077,335 101,825 222,374
Services 3,894,315 239,172,537 10,293,321 41,429,124 136,227,575 37,175,538 24,197,278 350,216,462
Wholesale and retail; repair of motor vehicles and motorcycles 155,291 1,584,484 2,148,457 493,562 10,009,627 7,135,028 2,638,697 1,070,131
Transportation and storage 505 1,000,080 0 58,319 14,687,292 2,119,591 1,150,238 979,317
Accommodation and food service activities 17,549 2,461,300 0 1,049 1,332,864 805,658 88,371 736,439
Information and communication 3,036,403 0 0 27,294 56,573,011 16,372,491 402,054 116,232,769
Financial and insurance activities 625,890 0 7,332,084 794,903 45,617,215 1,028,623 15,770,149 229,347,016
Real estate activities 0 33,886,019 9,785 3,493,678 257,842 3,000 0 0
Professional, scientific and technical activities 9,579 103,889 0 4,721 2,001,831 7,366,429 40,695 1,427,271
Administrative and support service activities 10,275 206,242 352,704 19,900 1,417,325 649,482 138,255 52,732
Education 579 9,526 450,291 14,151,132 1,438,825 498,507 3,776,609 86,810
Human health and social work activities 2,866 169,533,333 0 21,852,170 642,065 795,054 152,104 62,040
Arts, entertainment and recreation 25 0 0 1,308 49,287 17,284 1,688 33,817
Other service activities 35,352 30,387,664 0 531,088 2,200,391 384,391 38,418 188,119

123
Table F.2: Disposal of fixed asset by sector and size of establishment
Sector/LMSM
Assets
Intangible
Assets Land
Other
Construction
and land
Improvements Buildings
Transport and
Equipment
Machinery
and Other
Equipment
Furniture
and Fittings
Other
Tangible
Assets
National
All Sectors 53,360,007 241,833,615 80,829,587 57,946,684 683,499,028 18,470,729,386 176,866,077 537,443,650
Agriculture 25,693 270,182 11,658,941 1,398,375 400,290 662,482 71,515 1,079,962
Large-Sized Businesses 25,693 0 11,658,941 1,398,375 161,871 660,125 69,365 1,079,962
Medium-Sized Businesses 0 0 0 0 48,804 0 0 0
Small-Sized Businesses 0 270,182 0 0 189,614 2,357 1,950 0
Micro-Sized Businesses 0 0 0 0 1 0 200 0
Industry 49,439,999 2,390,896 58,877,325 15,119,185 546,871,163 18,432,891,366 152,597,284 186,147,226
Large-Sized Businesses 49,419,048 614,825 3,424,675 9,774,915 72,063,632 361,154,447 4,732,723 184,991,125
Medium-Sized Businesses 0 730,900 46,499,963 2,274,122 470,189,186 18,039,640,843 147,517,231 846,250
Small-Sized Businesses 20,951 1,030,174 8,952,687 3,026,003 3,504,227 30,960,739 336,764 287,855
Micro-Sized Businesses 0 14,996 0 44,145 1,114,118 1,135,338 10,566 21,996
Services 3,894,315 239,172,537 10,293,321 41,429,124 136,227,575 37,175,538 24,197,278 350,216,462
Large-Sized Businesses 636,573 731,376 8,413,944 9,585,065 90,452,808 15,914,226 11,854,550 16,985,604
Medium-Sized Businesses 26,541 14,538,560 1,867,092 2,060,009 26,102,674 7,959,031 1,988,977 1,734,115
Small-Sized Businesses 3,180,475 188,909,924 12,285 28,955,863 17,178,670 11,220,412 9,290,118 111,663,280
Micro-Sized Businesses 50,726 34,992,677 0 828,187 2,493,424 2,081,869 1,063,634 219,833,463

124
Table F.3: Disposal of fixed asset by sector and region
Major Sectors/ Region
Assets
Intangible
Assets Land
Other
Construction
and land
Improvements Buildings
Transport
and
Equipment
Machinery and
Other Equipment
Furniture and
Fittings
Other
Tangible
Assets
Western Region
All sectors 49,421,446 48,100 1,569,882 16,050,680 35,946,027 331,944,226 7,467,928 147,588,990
Agriculture 0 0 0 0 1 0 200 0
Agriculture, forestry and fishing 0 0 0 0 1 0 200 0
Industry 49,419,048 3,756 1,569,882 6,260,229 35,053,208 331,886,563 3,755,673 147,451,094
Mining and quarrying 49,419,048 0 1,530,877 5,972,464 34,044,594 328,669,993 3,209,627 147,237,220
Manufacturing 0 3,756 39,005 287,765 1,008,614 2,842,544 546,046 213,874
Electricity, gas, steam and air condition 0 0 0 0 0 372,720 0 0
Water supply; sewerage, waste management 0 0 0 0 0 0 0 0
Construction 0 0 0 0 0 1,306 0 0
Services 2,398 44,344 0 9,790,451 892,817 57,663 3,712,055 137,896
Wholesale and retail trade; repair of motor vehicle 0 9,344 0 47 18,800 50,069 1,730 0
Transportation and storage 0 0 0 404 646,000 0 0 24
Accommodation and food service activities 0 15,000 0 0 12,000 0 0 0
Information and communication 2,198 0 0 0 9,751 0 808 1,400
Financial and insurance activities 0 0 0 0 35,595 0 0 105,329
Real estate activities 0 0 0 0 0 0 0 0
Professional, scientific and technical a 0 0 0 0 0 6,180 600 852
Administrative and support service activities 0 20,000 0 0 30,600 5 71,651 30,291
Education 200 0 0 9,790,000 7,456 0 3,634,800 0
Human health and social work activities 0 0 0 0 0 0 0 0
Arts, entertainment and recreation 0 0 0 0 0 884 0 0
Other service activities 0 0 0 0 132,615 525 2,466 0

125
Table F.4: Disposal of fixed asset by sector and region
Major Sectors/Region
Assets
Intangible
Assets Land
Other
Construction
and land
Improvements Buildings
Transport
and
Equipment
Machinery
and Other
Equipment
Furniture
and Fittings
Other
Tangible
Assets
Central Region
All sectors 10,683 3,050,000 0 668,182 876,121 1,003,875 224,437 22,775
Agriculture 0 0 0 0 0 0 0 0
Agriculture, forestry and fishing 0 0 0 0 0 0 0 0
Industry 0 0 0 668,182 177,307 964,519 218,987 17,522
Mining and quarrying 0 0 0 0 0 0 3,000 1,650
Manufacturing 0 0 0 0 174,422 809,219 215,987 15,872
Electricity, gas, steam and air condition 0 0 0 0 0 155,300 0 0
Water supply; sewerage, waste management 0 0 0 0 0 0 0 0
Construction 0 0 0 668,182 2,885 0 0 0
Services 10,683 3,050,000 0 0 698,815 39,356 5,450 5,253
Wholesale and retail trade; repair of motor vehicle 0 0 0 0 184,000 0 0 515
Transportation and storage 0 0 0 0 17,700 0 0 0
Accommodation and food service activities 0 0 0 0 0 0 0 2
Information and communication 0 0 0 0 0 2 0 0
Financial and insurance activities 0 0 0 0 0 0 0 0
Real estate activities 0 3,050,000 0 0 0 0 0 0
Professional, scientific and technical a 0 0 0 0 0 0 0 2,055
Administrative and support service activities 0 0 0 0 0 8,633 2,467 1,950
Education 0 0 0 0 360,640 0 0 0
Human health and social work activities 0 0 0 0 0 0 0 0
Arts, entertainment and recreation 0 0 0 0 0 268 0 731
Other service activities 10,683 0 0 0 136,475 30,453 2,983 0

126
Table F.5: Disposal of fixed asset by sector and region
Major Sectors/Region
Assets
Intangible
Assets Land
Other
Construction
and land
Improvements Buildings
Transport
and
Equipment
Machinery and
Other Equipment
Furniture and
Fittings
Other
Tangible
Assets
Greater Accra Region
All sectors 3,851,824 235,634,705 71,698,713 33,655,351 609,403,362 17,968,437,953 163,004,211 381,537,011
Agriculture 25,693 258,182 11,658,941 1,398,375 129,349 616,869 69,365 1,079,962
Agriculture, forestry and fishing 25,693 258,182 11,658,941 1,398,375 129,349 616,869 69,365 1,079,962
Industry 0 1,564,258 57,230,622 7,276,793 482,278,085 17,933,667,784 148,349,874 38,342,239
Mining and quarrying 0 325,325 323,861 82,000 468,098,305 17,898,942,073 146,039,003 861,805
Manufacturing 0 216,943 43,560,392 793,491 5,971,580 13,319,226 883,046 37,316,254
Electricity, gas, steam and air condition 0 0 0 0 1,604,340 3,547,369 0 800
Water supply; sewerage, waste management 0 0 0 0 233,850 15,074,486 1,326,000 0
Construction 0 1,021,990 13,346,369 6,401,302 6,370,010 2,784,630 101,825 163,380
Services 3,826,131 233,812,265 2,809,150 24,980,183 126,995,928 34,153,301 14,584,973 342,114,809
Wholesale and retail trade; repair of motor vehicle 155,251 748,487 2,146,957 89,024 6,160,785 6,353,278 2,369,398 1,041,352
Transportation and storage 500 943,830 0 57,915 13,272,534 2,119,591 1,150,237 924,912
Accommodation and food service activities 17,549 2,430,000 0 2 704,500 769,660 75,863 8,002
Information and communication 3,012,771 0 0 2,000 56,561,460 16,197,173 374,757 116,185,433
Financial and insurance activities 625,890 0 298,704 26,961 44,252,695 180,069 10,424,072 222,262,267
Real estate activities 0 29,820,019 9,785 3,493,678 257,842 3,000 0 0
Professional, scientific and technical a 9,579 0 0 0 1,800,269 7,333,209 38,906 1,401,206
Administrative and support service activities 1,000 182,242 352,704 0 1,265,036 429,502 12,278 1,980
Education 0 9,526 1,000 68,851 374,528 119,311 66,940 55,308
Human health and social work activities 2,866 169,533,333 0 21,241,654 557,031 466,385 72,072 56,299
Arts, entertainment and recreation 0 0 0 0 49,287 12,049 0 7,875
Other service activities 725 30,144,828 0 98 1,739,961 170,074 450 170,175

127
Table F.6: Disposal of fixed asset by sector and region
Major Sectors/Region
Assets
Intangible
Assets Land
Other
Construction
and land
Improvements Buildings
Transport
and
Equipment
Machinery
and Other
Equipment
Furniture
and
Fittings
Other
Tangible
Assets
Volta Region
All sectors 29,863 647,158 0 303,256 533,926 3,902,224 17,930 51,093
Agriculture 0 12,000 0 0 0 0 0 0
Agriculture, forestry and fishing 0 12,000 0 0 0 0 0 0
Industry 0 595,247 0 237,420 275,440 3,845,848 11,848 16,971
Mining and quarrying 0 0 0 0 0 0 0 0
Manufacturing 0 3,818 0 237,420 126,122 3,690,548 11,848 16,407
Electricity, gas, steam and air condition 0 0 0 0 0 155,300 0 0
Water supply; sewerage, waste management 0 0 0 0 0 0 0 0
Construction 0 591,429 0 0 149,318 0 0 564
Services 29,863 39,911 0 65,836 258,486 56,376 6,083 34,123
Wholesale and retail trade; repair of motor vehicle 0 26,111 0 0 10,882 6,643 270 1,271
Transportation and storage 0 0 0 0 20,001 0 0 0
Accommodation and food service activities 0 13,800 0 1,011 74,311 0 0 0
Information and communication 18,884 0 0 0 0 0 0 0
Financial and insurance activities 0 0 0 0 4,823 11,000 0 0
Real estate activities 0 0 0 0 0 0 0 0
Professional, scientific and technical a 0 0 0 0 138,700 0 0 14,700
Administrative and support service activities 0 0 0 0 0 7,894 5,400 0
Education 379 0 0 0 0 0 0 420
Human health and social work activities 0 0 0 0 0 0 5 0
Arts, entertainment and recreation 0 0 0 4 0 240 399 199
Other service activities 10,600 0 0 64,821 9,769 30,599 9 17,533
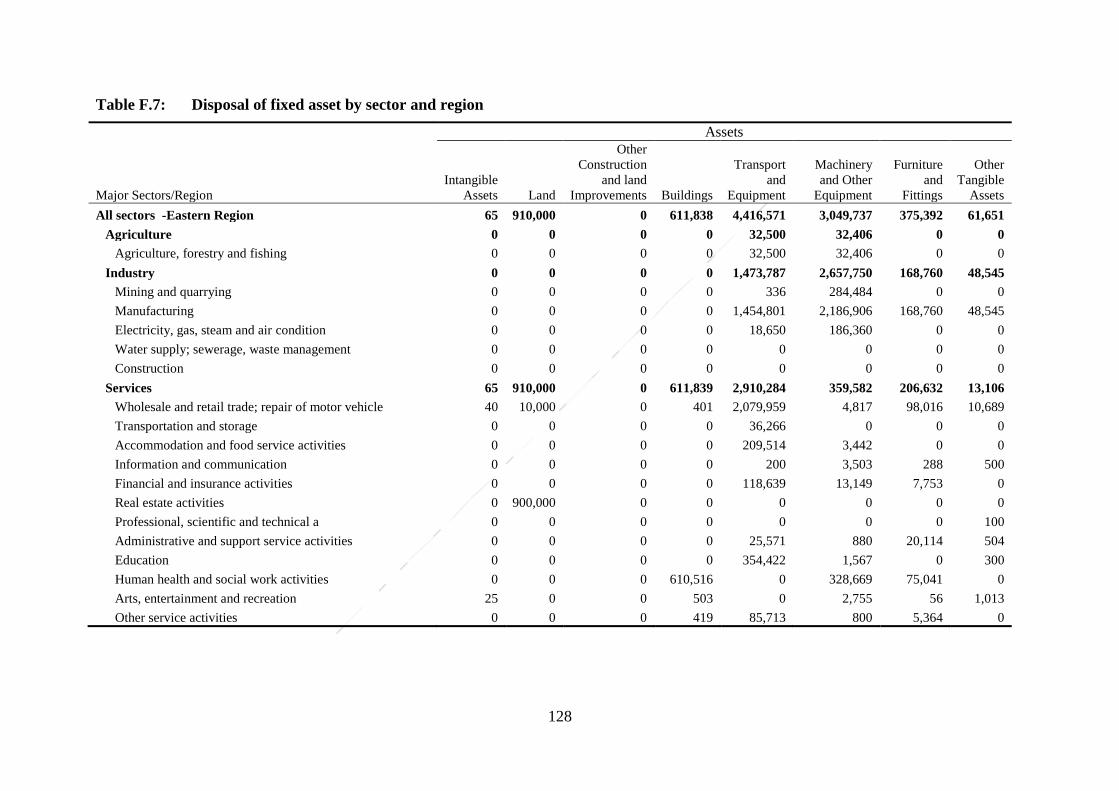
128
Table F.7: Disposal of fixed asset by sector and region
Major Sectors/Region
Assets
Intangible
Assets Land
Other
Construction
and land
Improvements Buildings
Transport
and
Equipment
Machinery
and Other
Equipment
Furniture
and
Fittings
Other
Tangible
Assets
All sectors -Eastern Region 65 910,000 0 611,838 4,416,571 3,049,737 375,392 61,651
Agriculture 0 0 0 0 32,500 32,406 0 0
Agriculture, forestry and fishing 0 0 0 0 32,500 32,406 0 0
Industry 0 0 0 0 1,473,787 2,657,750 168,760 48,545
Mining and quarrying 0 0 0 0 336 284,484 0 0
Manufacturing 0 0 0 0 1,454,801 2,186,906 168,760 48,545
Electricity, gas, steam and air condition 0 0 0 0 18,650 186,360 0 0
Water supply; sewerage, waste management 0 0 0 0 0 0 0 0
Construction 0 0 0 0 0 0 0 0
Services 65 910,000 0 611,839 2,910,284 359,582 206,632 13,106
Wholesale and retail trade; repair of motor vehicle 40 10,000 0 401 2,079,959 4,817 98,016 10,689
Transportation and storage 0 0 0 0 36,266 0 0 0
Accommodation and food service activities 0 0 0 0 209,514 3,442 0 0
Information and communication 0 0 0 0 200 3,503 288 500
Financial and insurance activities 0 0 0 0 118,639 13,149 7,753 0
Real estate activities 0 900,000 0 0 0 0 0 0
Professional, scientific and technical a 0 0 0 0 0 0 0 100
Administrative and support service activities 0 0 0 0 25,571 880 20,114 504
Education 0 0 0 0 354,422 1,567 0 300
Human health and social work activities 0 0 0 610,516 0 328,669 75,041 0
Arts, entertainment and recreation 25 0 0 503 0 2,755 56 1,013
Other service activities 0 0 0 419 85,713 800 5,364 0

129
Table F.8: Disposal of fixed asset by sector and region
Major Sectors/Region
Assets
Intangible
Assets Land
Other
Construction
and land
Improvements Buildings
Transport
and
Equipment
Machinery
and Other
Equipment
Furniture
and
Fittings
Other
Tangible
Assets
All sectors -Ashanti Region 27,581 729,823 7,559,492 4,442,849 29,879,806 160,445,803 5,548,118 5,926,059
Agriculture 0 0 0 0 0 2,357 0 0
Agriculture, forestry and fishing 0 0 0 0 0 2,357 0 0
Industry 15,951 221,950 76,821 12 27,027,012 159,571,482 79,908 261,264
Mining and quarrying 1 0 0 0 26,531,454 146,819,174 2,532 0
Manufacturing 0 218,950 76,821 12 217,766 2,622,289 77,376 201,409
Electricity, gas, steam and air condition 0 0 0 0 22,380 838,620 0 0
Water supply; sewerage, waste management 0 0 0 0 253,912 0 0 1,425
Construction 15,950 3,000 0 0 1,500 9,291,399 0 58,430
Services 11,630 507,873 7,482,671 4,442,837 2,852,794 871,964 5,468,210 5,664,795
Wholesale and retail trade; repair of motor
vehicle 0 347,734 0 100,412 1,089,370 65,597 129,426 0
Transportation and storage 5 56,250 0 0 593,538 0 0 54,340
Accommodation and food service activities 0 0 0 36 17,536 36 286 725,942
Information and communication 2,350 0 0 25,294 0 126,531 21,202 40,195
Financial and insurance activities 0 0 7,033,380 0 578,728 0 5,218,201 4,802,285
Real estate activities 0 0 0 0 0 0 0 0
Professional, scientific and technical a 0 103,889 0 4,721 31,292 7,716 189 5,657
Administrative and support service activities 9,275 0 0 19,900 93,118 202,484 20,800 0
Education 0 0 449,291 4,292,281 341,779 350,178 72,815 30,544
Human health and social work activities 0 0 0 0 29,033 0 4,986 5,741
Arts, entertainment and recreation 0 0 0 102 0 0 5 0
Other service activities 0 0 0 91 78,400 119,422 300 91

130
Table F.9: Disposal of fixed asset by sector and region
Major Sectors/ Region
Assets
Intangible
Assets Land
Other
Construction
and land
Improvements Buildings
Transport
and
Equipment
Machinery
and Other
Equipment
Furniture
and
Fittings
Other
Tangible
Assets
All sectors -Brong Ahafo Region 18,344 746,589 1,500 70,005 812,313 592,806 71,255 86,906
Agriculture, forestry and fishing 0 0 0 0 155,114 0 0 0
Agriculture, forestry and fishing 0 0 0 0 155,114 0 0 0
Industry 5,000 3,422 0 13 101,119 31,707 5,197 8,777
Mining and quarrying 0 0 0 0 0 0 0 0
Manufacturing 5,000 3,422 0 13 79,919 31,707 5,197 8,777
Electricity, gas, steam and air condition 0 0 0 0 0 0 0 0
Water supply; sewerage, waste management 0 0 0 0 0 0 0 0
Construction 0 0 0 0 21,200 0 0 0
Services 13,344 743,166 1,500 69,992 556,079 561,097 66,057 78,129
Wholesale and retail trade; repair of motor vehicle 0 377,830 1,500 8,784 83,515 460,025 9,623 15,707
Transportation and storage 0 0 0 0 99,653 0 0 41
Accommodation and food service activities 0 2,500 0 0 314,988 0 8,445 2,493
Information and communication 0 0 0 0 1,600 45,282 5,000 5,241
Financial and insurance activities 0 0 0 550 8,025 5,340 28,058 24,700
Real estate activities 0 116,000 0 0 0 0 0 0
Professional, scientific and technical activities 0 0 0 0 4,870 2,500 1,001 0
Administrative and support service activities 0 4,000 0 0 3,000 83 5,526 5,737
Education 0 0 0 0 0 27,450 2,053 0
Human health and social work activities 0 0 0 0 36,000 0 0 0
Arts, entertainment and recreation 0 0 0 0 0 488 126 24,000
Other service activities 13,344 242,836 0 60,658 4,428 19,929 6,225 210

131
Table F.10: Disposal of fixed asset by sector and region
Major Sectors/Region
Assets
Intangible
Assets Land
Other
Construction
and land
Improvements Buildings
Transport
and
Equipment
Machinery
and Other
Equipment
Furniture
and
Fittings
Other
Tangible
Assets
Northern Region
All sectors 0 61,977 0 1,427,007 910,539 1,215,824 141,842 2,160,610
Agriculture 0 0 0 0 83,326 10,850 1,950 0
Agriculture, forestry and fishing 0 0 0 0 83,326 10,850 1,950 0
Industry 0 0 0 43,306 41,122 138,826 6,381 0
Mining and quarrying 0 0 0 0 0 0 0 0
Manufacturing 0 0 0 43,306 41,122 128,629 6,381 0
Electricity, gas, steam and air condition 0 0 0 0 0 0 0 0
Water supply; sewerage, waste management 0 0 0 0 0 10,197 0 0
Construction 0 0 0 0 0 0 0 0
Services 0 61,977 0 1,383,700 786,092 1,066,148 133,511 2,160,610
Wholesale and retail trade; repair of motor vehicle 0 61,977 0 294,893 136,203 193,580 27,094 598
Transportation and storage 0 0 0 0 1,600 0 0 0
Accommodation and food service activities 0 0 0 0 15 32,520 0 0
Information and communication 0 0 0 0 0 0 0 0
Financial and insurance activities 0 0 0 683,165 618,711 819,065 84,680 2,152,434
Real estate activities 0 0 0 0 0 0 0 0
Professional, scientific and technical activities 0 0 0 0 7,500 8,000 0 0
Administrative and support service activities 0 0 0 0 0 0 15 7,230
Education 0 0 0 0 0 0 0 237
Human health and social work activities 0 0 0 0 20,000 0 0 0
Arts, entertainment and recreation 0 0 0 700 0 400 1,100 0
Other service activities 0 0 0 404,942 2,063 12,583 20,622 111
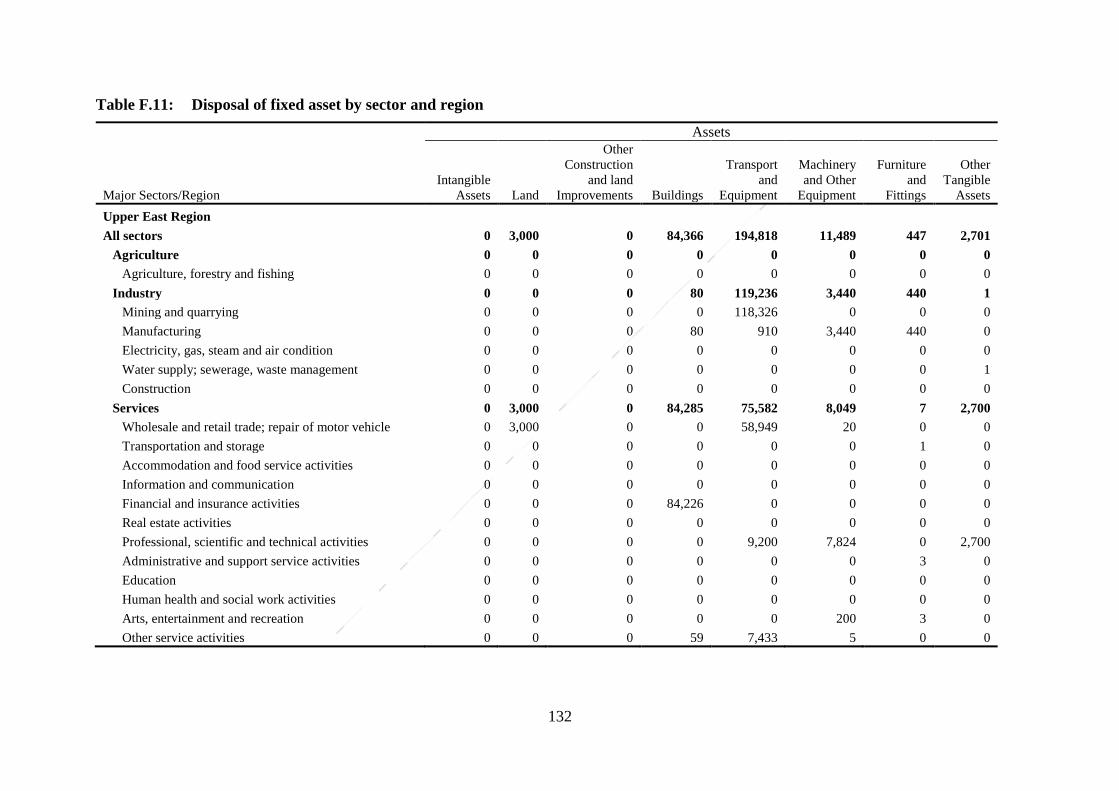
132
Table F.11: Disposal of fixed asset by sector and region
Major Sectors/Region
Assets
Intangible
Assets Land
Other
Construction
and land
Improvements Buildings
Transport
and
Equipment
Machinery
and Other
Equipment
Furniture
and
Fittings
Other
Tangible
Assets
Upper East Region
All sectors 0 3,000 0 84,366 194,818 11,489 447 2,701
Agriculture 0 0 0 0 0 0 0 0
Agriculture, forestry and fishing 0 0 0 0 0 0 0 0
Industry 0 0 0 80 119,236 3,440 440 1
Mining and quarrying 0 0 0 0 118,326 0 0 0
Manufacturing 0 0 0 80 910 3,440 440 0
Electricity, gas, steam and air condition 0 0 0 0 0 0 0 0
Water supply; sewerage, waste management 0 0 0 0 0 0 0 1
Construction 0 0 0 0 0 0 0 0
Services 0 3,000 0 84,285 75,582 8,049 7 2,700
Wholesale and retail trade; repair of motor vehicle 0 3,000 0 0 58,949 20 0 0
Transportation and storage 0 0 0 0 0 0 1 0
Accommodation and food service activities 0 0 0 0 0 0 0 0
Information and communication 0 0 0 0 0 0 0 0
Financial and insurance activities 0 0 0 84,226 0 0 0 0
Real estate activities 0 0 0 0 0 0 0 0
Professional, scientific and technical activities 0 0 0 0 9,200 7,824 0 2,700
Administrative and support service activities 0 0 0 0 0 0 3 0
Education 0 0 0 0 0 0 0 0
Human health and social work activities 0 0 0 0 0 0 0 0
Arts, entertainment and recreation 0 0 0 0 0 200 3 0
Other service activities 0 0 0 59 7,433 5 0 0

133
Table F.12: Disposal of fixed asset by sector and region
Major Sectors/ Region
Assets
Intangible
Assets Land
Other
Construction
and land
Improvements Buildings
Transport
and
Equipment
Machinery
and Other
Equipment
Furniture
and
Fittings
Other
Tangible
Assets
Upper West Region
All sectors 200 2,263 0 633,150 525,545 125,448 14,517 5,853
Agriculture 0 0 0 0 0 0 0 0
Agriculture, forestry and fishing 0 0 0 0 0 0 0 0
Industry 0 2,263 0 633,150 324,846 123,447 214 813
Mining and quarrying 0 0 0 0 202,584 93,374 0 0
Manufacturing 0 200 0 14,400 58,259 30,073 214 813
Electricity, gas, steam and air condition 0 0 0 0 0 0 0 0
Water supply; sewerage, waste management 0 0 0 0 0 0 0 0
Construction 0 2,063 0 618,750 64,003 0 0 0
Services 200 0 0 0 200,699 2,001 14,302 5,040
Wholesale and retail trade; repair of motor vehicle 0 0 0 0 187,165 1,000 3,141 0
Transportation and storage 0 0 0 0 0 0 0 0
Accommodation and food service activities 0 0 0 0 0 0 3,776 0
Information and communication 200 0 0 0 0 0 0 0
Financial and insurance activities 0 0 0 0 0 0 7,385 0
Real estate activities 0 0 0 0 0 0 0 0
Professional, scientific and technical activities 0 0 0 0 10,000 1,000 0 0
Administrative and support service activities 0 0 0 0 0 0 0 5,040
Education 0 0 0 0 0 0 0 0
Human health and social work activities 0 0 0 0 0 0 0 0
Arts, entertainment and recreation 0 0 0 0 0 0 0 0
Other service activities 0 0 0 0 3,534 1 0 0

134
Table G.1: Value of stocks at end of year by sub-sector in industry sector
Sector
No. of
Establishments
Total
GH¢
Raw Materials
and Supplies
GH¢
Work in
Progress
GH¢
Fuel
GH¢
Finished
Goods
GH¢
Goods for
Resale
GH¢
Other
Stocks
GH¢
National
Industry 106,330 18,593,750,595 10,096,074,473 4,279,176,676 149,088,562 1,107,440,818 774,293,713 2,187,676,353
Mining and quarrying 293 1,006,337,738 483,601,507 125,067,273 58,778,959 138,574,397 49,231,089 151,084,513
Manufacturing 101,789 3,344,686,088 1,687,263,059 597,500,875 43,524,809 715,660,786 157,078,235 143,658,324
Electricity, gas, steam and air conditioning supply 327 2,974,972,844 22,186,921 1,286,265,472 118,795 419,559 394,690 1,665,587,407
Water supply; sewerage, waste management 507 109,732,903 37,303,723 5,918,148 351,701 303,452 11,095,310 54,760,569
Construction 3,414 11,158,021,022 7,865,719,263 2,264,424,908 46,314,298 252,482,624 556,494,389 172,585,540
Table G.2: Value of stocks at end of year in industry sector by size of establishment
Sector
No. of
Establishments
Total
GH¢
Raw Materials
and Supplies
GH¢
Work in
Progress
GH¢
Fuel
GH¢
Finished
Goods
GH¢
Goods for
Resale
GH¢
Other Stocks
GH¢
National 106,330 18,593,750,595 10,096,074,473 4,279,176,676 149,088,562 1,107,440,818 774,293,713 2,187,676,353
Industry 106,330 18,593,750,595 10,096,074,473 4,279,176,676 149,088,562 1,107,440,818 774,293,713 2,187,676,353
Large-Sized Businesses 403 5,947,123,281 1,490,423,655 1,939,305,770 85,329,767 384,516,926 136,315,079 1,911,232,084
Medium-Sized Businesses 1,302 3,616,107,834 787,532,740 1,609,575,994 22,072,455 389,614,796 566,424,382 240,887,467
Small-Sized Businesses 27,693 8,751,918,404 7,734,194,569 664,917,933 32,638,510 226,991,333 57,890,505 35,285,554
Micro-Sized Businesses 76,931 278,601,079 83,923,508 65,376,980 9,047,831 106,317,763 13,663,749 271,248

135
Table G.3: Value of stocks at end of year by sub-sector in industry sector and region
Sector
No. of
Establishments
Total
GH¢
Raw Materials
and Supplies
GH¢
Work in
Progress
GH¢
Fuel
GH¢
Finished
Goods
GH¢
Goods for
Resale
GH¢
Other
Stocks
GH¢
Western Region
Industry 10,421 688,818,816 283,971,543 98,081,149 56,445,191 78,914,841 9,149,638 162,256,454
Mining and quarrying 118 522,599,537 208,358,325 88,926,183 55,625,825 31,575,768 8,199 138,105,237
Manufacturing 10,061 146,496,673 71,101,238 7,272,264 705,910 40,599,114 3,368,951 23,449,196
Electricity, gas, steam and air conditioning supply 16 635,540 58,226 2,270 0 257,308 239 317,497
Water supply; sewerage, waste management 48 809,856 78,880 337,715 0 10,483 0 382,778
Construction 178 18,277,210 4,374,874 1,542,717 113,456 6,472,168 5,772,249 1,746
Table G.4: Value of stocks at end of year by sub-sector in industry sector and region
Sector
No. of
Establishments
Total
GH¢
Raw Materials
and Supplies
GH¢
Work in
Progress
GH¢
Fuel
GH¢
Finished
Goods
GH¢
Goods for
Resale
GH¢
Other
Stocks
GH¢
Central Region
Industry 8,396 68,499,481 25,111,304 21,442,790 996,549 10,067,904 1,805,435 9,075,499
Mining and quarrying 8 2,091,439 1,120,690 15,000 495,911 38,000 0 421,838
Manufacturing 8,218 61,573,773 22,708,471 18,010,211 472,949 9,988,364 1,754,663 8,639,115
Electricity, gas, steam and air conditioning supply 9 5,144 2,293 946 0 0 100 1,805
Water supply; sewerage, waste management 17 26,930 9,051 5,138 0 0 0 12,741
Construction 144 4,802,195 1,270,799 3,411,495 27,689 41,540 50,672 0

136
Table G.5: Value of stocks at end of year by sub-sector in industry sector and region
Sector
No. of
Establishments
Total
GH¢
Raw Materials
and Supplies
GH¢
Work in
Progress
GH¢
Fuel
GH¢
Finished
Goods
GH¢
Goods for
Resale
GH¢
Other
Stocks
GH¢
Greater Accra Region
Industry 23,976 16,051,396,986 9,420,259,381 3,635,567,741 56,157,504 770,681,846 733,824,167 1,434,906,347
Mining and quarrying 82 458,013,645 269,139,589 33,453,802 1,196,677 92,454,518 49,222,491 12,546,568
Manufacturing 21,956 2,616,843,705 1,352,428,892 511,002,259 31,067,269 490,992,646 124,467,811 106,884,828
Electricity, gas, steam and air conditioning
supply 277 2,003,144,953 17,995,470 885,900,045 57,842 162,251 393,714 1,098,635,631
Water supply; sewerage, waste management 164 96,245,648 36,315,755 180,093 286,455 279,055 11,080,132 48,104,158
Construction 1,497 10,877,149,035 7,744,379,675 2,205,031,542 23,549,261 186,793,376 548,660,019 168,735,162
Table G.5: Value of stocks at end of year by sub-sector in industry sector
Sector
No. of
Establishments
Total
GH¢
Raw
Materials and
Supplies
GH¢
Work in
Progress
GH¢
Fuel
GH¢
Finished
Goods
GH¢
Goods for
Resale
GH¢
Other
Stocks
GH¢
Volta Region
Industry 9,804 147,909,235 78,441,524 16,208,187 4,427,785 45,844,234 2,824,657 162,848
Mining and quarrying 7 22,322 112 50 0 22,160 0 0
Manufacturing 9,254 78,749,967 40,197,292 1,663,308 829,120 33,760,280 2,299,191 776
Electricity, gas, steam and air conditioning supply 5 3,604 758 944 0 0 100 1,802
Water supply; sewerage, waste management 52 206,131 79,099 4,553 8,187 8,124 8,000 98,168
Construction 486 68,927,211 38,164,263 14,539,332 3,590,478 12,053,670 517,366 62,102

137
Table G.6: Value of stocks at end of year by sub-sector in industry sector and region
Sector
No. of
Establishments
Total
GH¢
Raw
Materials
and Supplies
GH¢
Work In
Progress
GH¢
Fuel
GH¢
Finished
Goods
GH¢
Goods for
Resale
GH¢
Other
Stocks
GH¢
Eastern Region
Industry 10,022 106,506,667 45,257,639 18,751,119 5,098,944 30,967,922 1,398,997 5,032,046
Mining and quarrying 28 6,683,443 2,297,250 441,362 730,087 3,203,544 400 10,800
Manufacturing 9,826 74,403,644 30,497,511 14,505,001 2,281,078 25,297,721 1,303,012 519,321
Electricity, gas, steam and air conditioning supply 1 1,436,658 0 679,890 38,439 0 0 718,329
Water supply; sewerage, waste management 29 111,355 9,689 49,400 200 0 0 52,066
Construction 138 23,871,567 12,453,189 3,075,466 2,049,140 2,466,657 95,585 3,731,530
Table G.7: Value of stocks at end of year by sub-sectors in industry sector and region
Sector
No. of
Establishments
Total
GH¢
Raw
Materials
and Supplies
GH¢
Work in
Progress
GH¢
Fuel
GH¢
Finished
Goods
GH¢
Goods for
Resale
GH¢
Other
Stocks
GH¢
Ashanti Region
Industry 20,948 347,487,407 148,432,032 50,862,225 15,849,617 113,418,775 10,616,734 8,308,024
Mining and quarrying 25 14,919,608 1,778,759 1,928,782 653,002 10,559,065 0 0
Manufacturing 20,447 245,463,923 116,691,215 25,214,437 6,780,116 84,131,257 10,081,926 2,564,972
Electricity, gas, steam and air conditioning supply 2 19,482 4,097 5,107 0 0 537 9,741
Water supply; sewerage, waste management 81 11,562,859 547,877 5,274,140 909 5,159 2,463 5,732,311
Construction 393 75,521,535 29,410,084 18,439,759 8,415,590 18,723,294 531,808 1,000

138
Table G.8: Value of stocks at end of year by sub-sector in industry sector and region
Sector
No. of
Establishments
Total
GH¢
Raw
Materials
and Supplies
GH¢
Work in
Progress
GH¢
Fuel
GH¢
Finished
Goods
GH¢
Goods for
Resale
GH¢
Other
Stocks
GH¢
Brong Ahafo Region
Industry 7,506 98,860,272 36,623,144 19,165,970 1,102,571 30,330,194 9,894,939 1,743,454
Mining and quarrying 5 988,942 185,853 257,000 39,509 506,580 0 0
Manufacturing 7,327 80,950,214 29,479,726 13,999,786 901,885 25,305,495 9,688,345 1,574,977
Electricity, gas, steam and air conditioning
supply 1 2,000 1,000 0 0 0 0 1,000
Water supply; sewerage, waste
management 40 239,370 53,534 64,904 2,500 240 4,715 113,477
Construction 133 16,679,746 6,903,031 4,844,280 158,677 4,517,879 201,879 54,000
Table G.9: Value of stocks at end of year by sub-sector in industry sector and region
Sector
No. of
Establishments
Total
GH¢
Raw
Materials
and Supplies
GH¢
Work in
Progress
GH¢
Fuel
GH¢
Finished
Goods
GH¢
Goods for
Resale
GH¢
Other
Stocks
GH¢
Northern Region
Industry 8,554 1,055,584,382 46,376,823 414,562,159 3,678,048 22,262,181 3,204,619 565,500,552
Mining and quarrying 1 70 0 0 0 0 0 70
Manufacturing 8,344 31,749,330 20,415,425 4,177,825 250,870 3,868,513 3,036,538 159
Electricity, gas, steam and air
conditioning supply 10 968,527,315 3,541,112 399,675,520 8,155 0 0 565,302,528
Water supply; sewerage, waste
management 55 395,590 145,275 20 52,500 0 0 197,795
Construction 144 54,912,077 22,275,011 10,708,794 3,366,523 18,393,668 168,081 0

139
Table G.10: Value of stocks at end of year by sub-sector in industry sector and region
Sector
No. of
Establishments
Total
GH¢
Raw
Materials
and Supplies
GH¢
Work in
Progress
GH¢
Fuel
GH¢
Finished
Goods
GH¢
Goods for
Resale
GH¢
Other
Stocks
GH¢
Upper East Region
Industry 3,802 16,128,588 7,757,192 900,103 5,122,709 998,988 675,726 673,870
Mining and quarrying 15 713,224 590,361 0 29,783 93,080 0 0
Manufacturing 3,639 3,574,393 1,637,534 481,858 148,771 719,641 564,019 22,570
Electricity, gas, steam and air conditioning supply 6 1,197,148 583,465 750 14,359 0 0 598,574
Water supply; sewerage, waste management 11 105,552 52,376 0 450 0 0 52,726
Construction 131 10,538,271 4,893,456 417,495 4,929,346 186,267 111,707 0
Table G.11: Value of stocks at end of year by sub-sector in industry sector and region
Sector
No. of
Establishments
Total
GH¢
Raw Materials
and Supplies
GH¢
Work in
Progress
GH¢
Fuel
GH¢
Finished
Goods
GH¢
Goods for
Resale
GH¢
Other
Stocks
GH¢
Upper West Region
Industry 2,904 12,558,769 3,843,895 3,635,234 209,645 3,953,934 898,803 17,258
Mining and quarrying 5 305,510 130,568 45,094 8,166 121,682 0 0
Manufacturing 2,717 4,880,468 2,105,756 1,173,927 86,840 997,756 513,780 2,409
Electricity, gas, steam and air conditioning supply 1 1,000 500 0 0 0 0 500
Water supply; sewerage, waste management 10 29,613 12,189 2,185 500 390 0 14,349
Construction 171 7,342,178 1,594,882 2,414,028 114,139 2,834,106 385,023 0

140
Table H.1: Value of stocks at beginning of year by sub-sector in industry sector
Sector
No. of
Establish
ments
Total
GH¢
Raw Materials
and Supplies
GH¢
Work in
Progress
GH¢
Fuel
GH¢
Finished
Goods
GH¢
Goods for
Resale
GH¢
Other Stocks
GH¢
INDUSTRY 106,330 18,048,886,784 10,405,563,130 3,843,604,842 203,560,687 1,195,627,711 1,202,693,460 1,197,836,954
Mining and quarrying 293 1,179,867,262 602,723,011 117,743,275 103,768,536 152,312,361 48,909,136 154,410,943
Manufacturing 101,789 3,964,975,913 1,793,524,620 656,059,688 40,806,275 748,528,297 574,169,109 151,887,924
Electricity, gas, steam and air conditioning
supply 327 1,778,493,940 18,362,108 1,082,241,224 86,109 720,000 768 677,083,731
Water supply; sewerage, waste
management 507 99,520,650 32,318,791 682,920 202,411 487,643 16,349,085 49,479,800
Construction 3,414 11,026,029,019 7,958,634,600 1,986,877,735 58,697,356 293,579,410 563,265,362 164,974,556
Table H.2: Value of stocks at beginning of year by sub-sector in industry sector and size of establishment
Sector
No. of
Establishments
Total
GH¢
Raw Materials
and Supplies
GH¢
Work in
Progress
GH¢
Fuel
GH¢
Finished
Goods
GH¢
Goods for
Resale
GH¢
Other Stocks
GH¢
Industry 106,330 18,048,886,784 10,405,563,130 3,843,604,842 203,560,687 1,195,627,711 1,202,693,460 1,197,836,954
Large-Sized Businesses 403 5,286,050,291 1,499,092,720 1,790,362,961 124,863,787 404,103,270 541,113,331 926,514,222
Medium-Sized
Businesses 1,302 3,712,705,451 881,494,809 1,583,931,344 31,513,268 406,932,536 566,251,978 242,581,516
Small-Sized Businesses 27,693 8,671,496,478 7,876,708,343 392,542,446 34,286,052 260,801,124 78,801,657 28,356,856
Micro-Sized Businesses 76,931 378,634,561 148,267,256 76,768,091 12,897,579 123,790,780 16,526,494 384,361
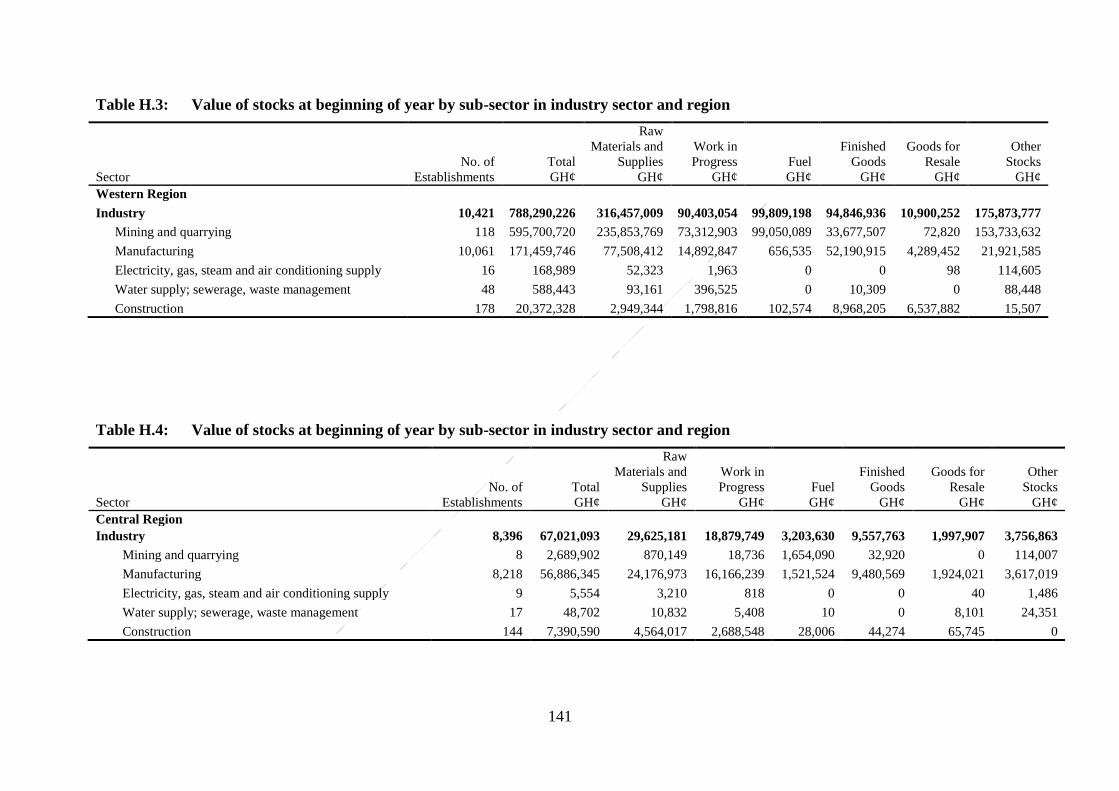
141
Table H.3: Value of stocks at beginning of year by sub-sector in industry sector and region
Sector
No. of
Establishments
Total
GH¢
Raw
Materials and
Supplies
GH¢
Work in
Progress
GH¢
Fuel
GH¢
Finished
Goods
GH¢
Goods for
Resale
GH¢
Other
Stocks
GH¢
Western Region
Industry 10,421 788,290,226 316,457,009 90,403,054 99,809,198 94,846,936 10,900,252 175,873,777
Mining and quarrying 118 595,700,720 235,853,769 73,312,903 99,050,089 33,677,507 72,820 153,733,632
Manufacturing 10,061 171,459,746 77,508,412 14,892,847 656,535 52,190,915 4,289,452 21,921,585
Electricity, gas, steam and air conditioning supply 16 168,989 52,323 1,963 0 0 98 114,605
Water supply; sewerage, waste management 48 588,443 93,161 396,525 0 10,309 0 88,448
Construction 178 20,372,328 2,949,344 1,798,816 102,574 8,968,205 6,537,882 15,507
Table H.4: Value of stocks at beginning of year by sub-sector in industry sector and region
Sector
No. of
Establishments
Total
GH¢
Raw
Materials and
Supplies
GH¢
Work in
Progress
GH¢
Fuel
GH¢
Finished
Goods
GH¢
Goods for
Resale
GH¢
Other
Stocks
GH¢
Central Region
Industry 8,396 67,021,093 29,625,181 18,879,749 3,203,630 9,557,763 1,997,907 3,756,863
Mining and quarrying 8 2,689,902 870,149 18,736 1,654,090 32,920 0 114,007
Manufacturing 8,218 56,886,345 24,176,973 16,166,239 1,521,524 9,480,569 1,924,021 3,617,019
Electricity, gas, steam and air conditioning supply 9 5,554 3,210 818 0 0 40 1,486
Water supply; sewerage, waste management 17 48,702 10,832 5,408 10 0 8,101 24,351
Construction 144 7,390,590 4,564,017 2,688,548 28,006 44,274 65,745 0
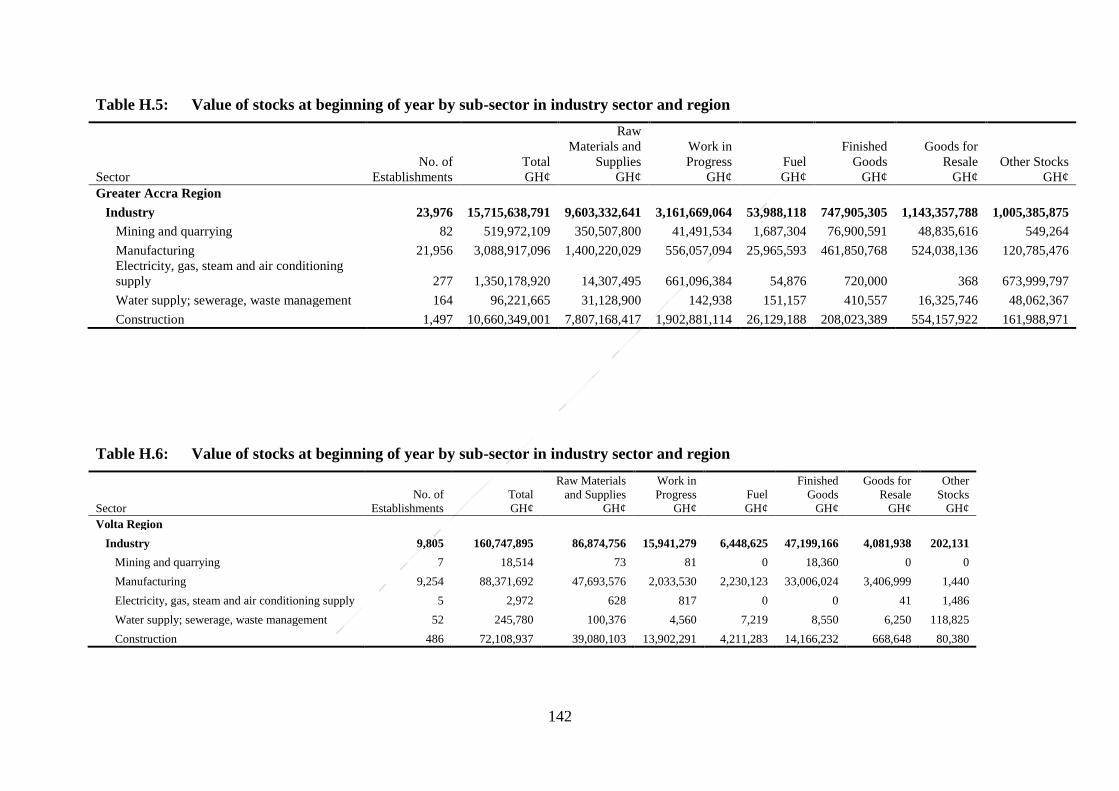
142
Table H.5: Value of stocks at beginning of year by sub-sector in industry sector and region
Sector
No. of
Establishments
Total
GH¢
Raw
Materials and
Supplies
GH¢
Work in
Progress
GH¢
Fuel
GH¢
Finished
Goods
GH¢
Goods for
Resale
GH¢
Other Stocks
GH¢
Greater Accra Region
Industry 23,976 15,715,638,791 9,603,332,641 3,161,669,064 53,988,118 747,905,305 1,143,357,788 1,005,385,875
Mining and quarrying 82 519,972,109 350,507,800 41,491,534 1,687,304 76,900,591 48,835,616 549,264
Manufacturing 21,956 3,088,917,096 1,400,220,029 556,057,094 25,965,593 461,850,768 524,038,136 120,785,476
Electricity, gas, steam and air conditioning
supply 277 1,350,178,920 14,307,495 661,096,384 54,876 720,000 368 673,999,797
Water supply; sewerage, waste management 164 96,221,665 31,128,900 142,938 151,157 410,557 16,325,746 48,062,367
Construction 1,497 10,660,349,001 7,807,168,417 1,902,881,114 26,129,188 208,023,389 554,157,922 161,988,971
Table H.6: Value of stocks at beginning of year by sub-sector in industry sector and region
Sector
No. of
Establishments
Total
GH¢
Raw Materials
and Supplies
GH¢
Work in
Progress
GH¢
Fuel
GH¢
Finished
Goods
GH¢
Goods for
Resale
GH¢
Other
Stocks
GH¢
Volta Region
Industry 9,805 160,747,895 86,874,756 15,941,279 6,448,625 47,199,166 4,081,938 202,131
Mining and quarrying 7 18,514 73 81 0 18,360 0 0
Manufacturing 9,254 88,371,692 47,693,576 2,033,530 2,230,123 33,006,024 3,406,999 1,440
Electricity, gas, steam and air conditioning supply 5 2,972 628 817 0 0 41 1,486
Water supply; sewerage, waste management 52 245,780 100,376 4,560 7,219 8,550 6,250 118,825
Construction 486 72,108,937 39,080,103 13,902,291 4,211,283 14,166,232 668,648 80,380

143
Table H.7: Value of stocks at beginning of year by sub-sector in industry sector and region
Sector
No. of
Establishments
Total
GH¢
Raw Materials
and Supplies
GH¢
Work in
Progress
GH¢
Fuel
GH¢
Finished
Goods
GH¢
Goods
for
Resale
GH¢
Other
Stocks
GH¢
Eastern Region
Industry 10,022 98,296,048 39,940,827 20,201,968 4,329,361 27,828,457 2,122,814 3,872,621
Mining and quarrying 28 5,199,264 1,766,941 264,344 587,453 2,565,826 700 14,000
Manufacturing 9,826 69,988,128 27,323,771 15,824,899 1,995,222 22,239,705 1,988,026 616,505
Electricity, gas, steam and air conditioning
supply 1 899,272 0 425,755 23,881 0 0 449,636
Water supply; sewerage, waste management 29 124,615 12,332 52,000 0 0 0 60,283
Construction 138 22,084,769 10,837,783 3,634,970 1,722,805 3,022,926 134,088 2,732,197
Table H.8: Value of stocks at beginning of year by sub-sector in industry sector and region
Sector
No. of
Establishments
Total
GH¢
Raw
Materials
and Supplies
GH¢
Work in
Progress
GH¢
Fuel
GH¢
Finished
Goods
GH¢
Goods for
Resale
GH¢
Other
Stocks
GH¢
Ashanti Region
Industry 20,948 488,200,450 202,804,505 53,866,394 15,496,275 187,038,010 23,961,507 5,033,759
Mining and quarrying 25 52,112,341 11,892,096 1,865,431 527,986 37,826,828 0 0
Manufacturing 20,447 328,431,406 144,649,453 25,749,379 6,766,615 123,648,620 23,213,648 4,403,691
Electricity, gas, steam and air conditioning
supply 2 16,054 3,391 4,415 0 0 221 8,027
Water supply; sewerage, waste management 81 1,060,029 470,178 11,481 775 57,667 7,389 512,539
Construction 393 106,580,620 45,789,387 26,235,688 8,200,899 25,504,895 740,249 109,502

144
Table H.9: Value of stocks at beginning of year by sub-sector in industry sector and region
Sector
No. of
Establishments
Total
GH¢
Raw
Materials
and Supplies
GH¢
Work in
Progress
GH¢
Fuel
GH¢
Finished
Goods
GH¢
Goods for
Resale
GH¢
Other
Stocks
GH¢
Brong Ahafo Region
Industry 7,506 114,409,648 38,095,611 25,772,500 1,611,243 38,234,418 10,010,550 685,326
Mining and quarrying 5 2,251,288 326,261 733,920 183,047 1,008,060 0 0
Manufacturing 7,327 90,397,688 28,167,275 17,650,133 968,958 33,318,908 9,778,142 514,272
Electricity, gas, steam and air conditioning
supply 1 4,000 2,000 0 0 0 0 2,000
Water supply; sewerage, waste management 40 246,783 54,392 67,688 1,900 150 1,599 121,054
Construction 133 21,509,889 9,545,683 7,320,759 457,338 3,907,300 230,809 48,000
Table H.10: Value of stocks at beginning of year by sub-sector in industry sector and region
Sector
No. of
Establishments
Total
GH¢
Raw Materials
and Supplies
GH¢
Work in
Progress
GH¢
Fuel
GH¢
Finished
Goods
GH¢
Goods for
Resale
GH¢
Other
Stocks
GH¢
Northern Region
Industry 8,554 572,006,522 69,739,414 447,836,055 10,271,559 36,714,070 4,706,250 2,739,174
Mining and quarrying 1 40 0 0 0 0 0 40
Manufacturing 8,344 58,738,922 37,613,292 5,495,709 336,702 10,918,122 4,366,273 8,824
Electricity, gas, steam and air conditioning
supply 10 426,632,922 3,532,109 420,711,072 6,792 0 0 2,382,949
Water supply; sewerage, waste management 55 695,327 308,046 20 39,900 0 0 347,361
Construction 144 85,939,311 28,285,967 21,629,254 9,888,165 25,795,948 339,977 0
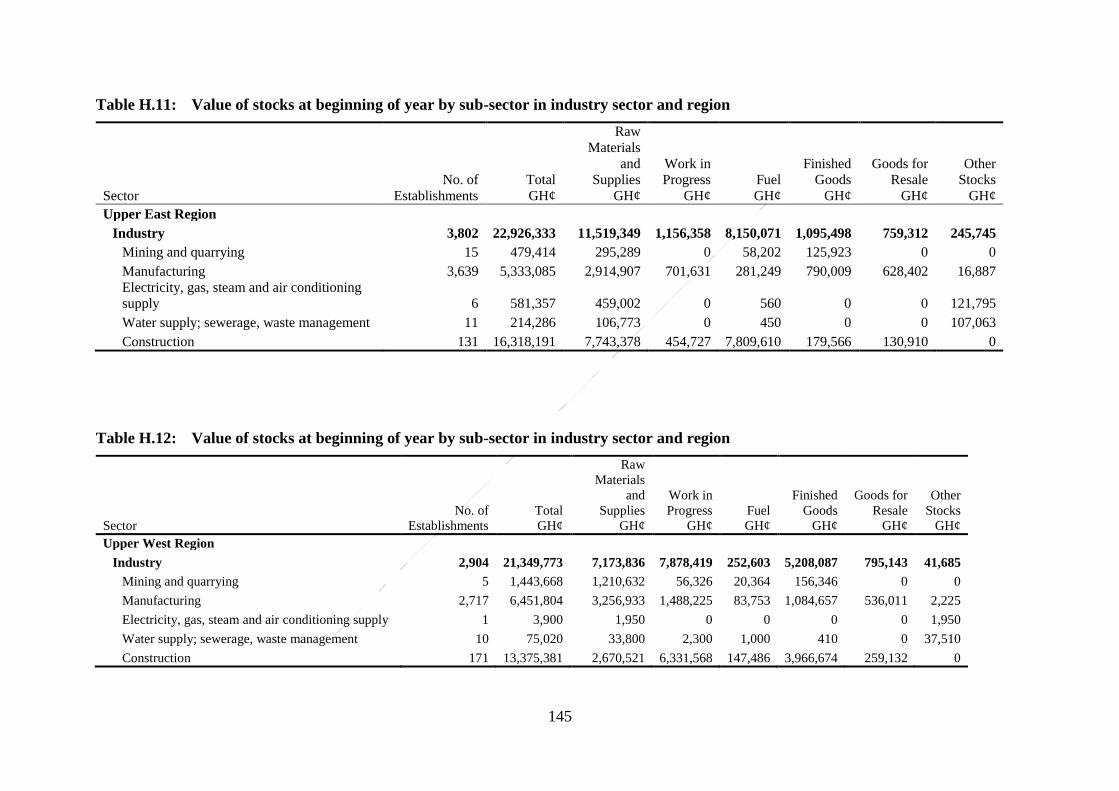
145
Table H.11: Value of stocks at beginning of year by sub-sector in industry sector and region
Sector
No. of
Establishments
Total
GH¢
Raw
Materials
and
Supplies
GH¢
Work in
Progress
GH¢
Fuel
GH¢
Finished
Goods
GH¢
Goods for
Resale
GH¢
Other
Stocks
GH¢
Upper East Region
Industry 3,802 22,926,333 11,519,349 1,156,358 8,150,071 1,095,498 759,312 245,745
Mining and quarrying 15 479,414 295,289 0 58,202 125,923 0 0
Manufacturing 3,639 5,333,085 2,914,907 701,631 281,249 790,009 628,402 16,887
Electricity, gas, steam and air conditioning
supply 6 581,357 459,002 0 560 0 0 121,795
Water supply; sewerage, waste management 11 214,286 106,773 0 450 0 0 107,063
Construction 131 16,318,191 7,743,378 454,727 7,809,610 179,566 130,910 0
Table H.12: Value of stocks at beginning of year by sub-sector in industry sector and region
Sector
No. of
Establishments
Total
GH¢
Raw
Materials
and
Supplies
GH¢
Work in
Progress
GH¢
Fuel
GH¢
Finished
Goods
GH¢
Goods for
Resale
GH¢
Other
Stocks
GH¢
Upper West Region
Industry 2,904 21,349,773 7,173,836 7,878,419 252,603 5,208,087 795,143 41,685
Mining and quarrying 5 1,443,668 1,210,632 56,326 20,364 156,346 0 0
Manufacturing 2,717 6,451,804 3,256,933 1,488,225 83,753 1,084,657 536,011 2,225
Electricity, gas, steam and air conditioning supply 1 3,900 1,950 0 0 0 0 1,950
Water supply; sewerage, waste management 10 75,020 33,800 2,300 1,000 410 0 37,510
Construction 171 13,375,381 2,670,521 6,331,568 147,486 3,966,674 259,132 0

146
Table I.1: Value of stocks at end of year by agricultural sector and size
Agricultural Sector /LMSM
Value of stocks at end of year (GH¢ )
Raw materials
and supplies
Goods for
resale Other stocks
National
Agriculture, forestry and fishing 58,800,203 35,324,802 24,041,904
Large-Sized Businesses 31,282,195 4,059,085 13,763,313
Medium-Sized Businesses 10,769,254 734,779 6,064,515
Small-Sized Businesses 15,432,058 23,465,205 3,979,521
Micro-Sized Businesses 1,316,697 7,065,733 234,555
Table I.2: Value of stocks at end of year by Sub-sector in agricultural sector
and size of establishment
Agricultural sector /LMSM
Value of stocks at end of year (GH¢ )
Raw materials
and supplies
Goods for
resale Other stocks
Crop and animal production, hunting and
related Service activities 34,669,127 35,266,591 24,020,284
Large-Sized Businesses 15,041,002 4,059,085 13,763,313
Medium-Sized Businesses 5,374,138 734,779 6,062,515
Small-Sized Businesses 12,959,822 23,422,764 3,962,221
Micro-Sized Businesses 1,294,165 7,049,963 232,235
Forestry and logging 1,196,186 500 20,700
Large-Sized Businesses 0 0 0
Medium-Sized Businesses 0 0 2,000
Small-Sized Businesses 1,191,886 0 16,500
Micro-Sized Businesses 4,300 500 2,200
Fishing and aquaculture 22,934,891 57,711 920
Large-Sized Businesses 16,241,193 0 0
Medium-Sized Businesses 5,395,116 0 0
Small-Sized Businesses 1,280,350 42,441 800
Micro-Sized Businesses 18,232 15,270 120

147
Table I.3: Value of stocks at end of year by sub-sector in agriculture sector
and region
Agricultural Sector/Region
Value of stocks at end of year (GH¢ )
Raw materials
and supplies
Goods for
resale
Other
stocks
Western Region
Agriculture, forestry and fishing 1,293,786 162,383 2,000
Crop and animal production, hunting and related service activities 1,292,396 162,383 2,000
Forestry and logging 0 0 0
Fishing and aquaculture 1,390 0 0
Central Region
Agriculture, forestry and fishing 172,422 855,773 25,527
Crop and animal production, hunting and related service activities 169,529 855,773 25,527
Forestry and logging 0 0 0
Fishing and aquaculture 2,893 0 0
Greater Accra Region
Agriculture, forestry and fishing 23,231,823 16,932,645 10,854,253
Crop and animal production, hunting and related service activities 2,890,695 16,907,004 10,854,253
Forestry and logging 0 0 0
Fishing and aquaculture 20,341,128 25,641 0
Volta Region
Agriculture, forestry and fishing 760,968 2,472,810 772,949
Crop and animal production, hunting and related service activities 546,748 2,466,310 769,449
Forestry and logging 1,463 0 3,500
Fishing and aquaculture 212,757 6,500 0
Eastern Region
Agriculture, forestry and fishing 2,927,353 3,298,419 713,340
Crop and animal production, hunting and related service activities 576,252 3,274,419 713,340
Forestry and logging 1,150 0 0
Fishing and aquaculture 2,349,951 24,000 0
Ashanti Region
Agriculture, forestry and fishing 25,172,961 5,537,552 4,869,208
Crop and animal production, hunting and related service activities 23,977,349 5,537,552 4,853,408
Forestry and logging 1,189,113 0 15,000
Fishing and aquaculture 6,500 0 800
Brong Ahafo Region
Agriculture, forestry and fishing 4,900,813 4,391,326 6,574,415
Crop and animal production, hunting and related service activities 4,877,981 4,389,256 6,572,095
Forestry and logging 4,460 500 2,200
Fishing and aquaculture 18,372 1,570 120
Northern Region
Agriculture, forestry and fishing 306,267 1,541,798 80,756
Crop and animal production, hunting and related service activities 305,467 1,541,798 80,756
Forestry and logging 0 0 0
Fishing and aquaculture 800 0 0
Upper East Region
Agriculture, forestry and fishing 24,842 128,590 76,910
Crop and animal production, hunting and related service activities 24,842 128,590 76,910
Forestry and logging 0 0 0
Fishing and aquaculture 0 0 0
Upper West Region
Agriculture, forestry and fishing 8,966 3,507 72,546
Crop and animal production, hunting and related service activities 7,866 3,507 72,546
Forestry and logging 0 0 0
Fishing and aquaculture 1,100 0 0

148
Table J.1: Value of stocks at end of year by sub-sector in service sector
Industry (2-DIGIT ISIC)
Total
GH¢
Consumables
and Supplies
GH¢
Goods for
Resale
GH¢
Other Stocks
GH¢
Service Sector - National 18,672,531,653 12,907,251,055 3,018,728,914 2,746,551,684
Service Sectors 5,496,320,204 2,752,376,379 2,209,110,398 534,833,427
Wholesale and retail trade; repair of motor
vehicles and motorcycles 1,723,584,713 21,317,930 1,702,139,755 127,028
Transportation and storage 142,768,487 108,577,754 16,588,546 17,602,187
Accommodation and food service activities 292,774,440 153,796,759 115,382,451 23,595,230
Information and communication 353,274,882 196,053,449 150,528,084 6,693,349
Financial and insurance activities 2,044,342,661 1,655,242,256 10,246,131 378,854,274
Real estate activities 94,687,077 57,495,459 29,295,331 7,896,287
Professional, scientific and technical activities 71,606,811 22,653,534 30,085,615 18,867,662
Administrative and support service activities 123,829,846 11,838,779 43,246,360 68,744,707
Education 59,492,614 42,065,633 14,601,132 2,825,849
Human health and social work activities 453,824,917 391,951,916 56,260,023 5,612,978
Arts, entertainment and recreation 2,191,804 1,419,550 591,981 180,273
Other service activities 133,941,950 89,963,359 40,144,988 3,833,603
Table J.2: Value of stocks at end of year by sub-sector in service sector and
size of establishment
Industry (2-Digit ISIC)
Total
GH¢
Consumables
and Supplies
GH¢
Goods for
Resale
GH¢
Other Stocks
GH¢
Services 5,496,320,204 2,752,376,379 2,209,110,398 534,833,427
Large-Sized Businesses 1,886,273,331 1,630,062,601 156,263,990 99,946,740
Medium-Sized Businesses 2,630,723,158 686,007,689 1,816,083,186 128,632,283
Small-Sized Businesses 835,797,737 374,110,848 159,883,361 301,803,528
Micro-Sized Businesses 143,525,977 62,195,240 76,879,861 4,450,876

149
Table J.3: Value of stocks at end of year by sub-sector in service sector and region
Industry (2-DIGIT ISIC)
TOTAL
GH¢
Consumables
and Supplies
GH¢
Goods For
Resale
GH¢
Other
Stocks
GH¢
National 18,388,245,627 6,935,097,271 10,702,918,917 750,229,439
Western Region 76,168,026 35,638,982 40,156,068 372,976
Wholesale and retail trade; repair of motor vehicles
and motorcycles 680,323 117,913 552,710 9,700
Transportation and storage 855,919 522,259 223,415 110,245
Accommodation and food service activities 30,390,304 16,405,546 13,961,784 22,974
Information and communication 17,945,691 94,670 17,851,021 0
Financial and insurance activities 6,971,030 6,525,415 264,524 181,091
Real estate activities 490 490 0 0
Professional, scientific and technical activities 1,584,791 1,516,936 67,855 0
Administrative and support service activities 366,607 270,970 95,637 0
Education 1,824,846 799,346 995,918 29,582
Human health and social work activities 9,883,750 6,492,332 3,388,418 3,000
Arts, entertainment and recreation 359,658 353,671 5,770 217
Other service activities 5,304,617 2,539,435 2,749,016 16,166
Table J.4: Value of stocks at end of year by sub-sector in service sector and region
Industry (2-DIGIT ISIC)
Total
GH¢
Consumables
and Supplies
GH¢
Goods f or
Resale
GH¢
Other Stocks
GH¢
Service Sector - National 18,388,245,627 6,935,097,271 10,702,918,917 750,229,439
Service Sector - Central 31,688,974 19,256,271 12,380,719 51,984
Wholesale and retail trade; repair of
motor vehicles and motorcycles 170,527 17,127 153,400 0
Transportation and storage 225,402 224,436 966 0
Accommodation and food service
activities 5,926,422 2,131,392 3,795,030 0
Information and communication 99,792 70,975 14,480 14,337
Financial and insurance activities 1,609,718 1,144,018 454,792 10,908
Real estate activities 3,189,757 210 3,189,547 0
Professional, scientific and technical
activities 156,746 135,857 5,101 15,788
Administrative and support service
activities 130,740 55,030 75,710 0
Education 2,497,176 1,912,520 578,203 6,453
Human health and social work
activities 2,862,499 959,571 1,902,928 0
Arts, entertainment and recreation 152,703 140,413 10,933 1,357
Other service activities 14,667,493 12,464,723 2,199,629 3,141

150
Table J.5: Value of stocks at end of year by sub-sector in service sector and region
ISIC Group
Total
GH¢
Consumables
and Supplies
GH¢
Goods for
Resale
GH¢
Other Stocks
GH¢
Service Sector - National 18,388,245,627 6,935,097,271 10,702,918,917 750,229,439
Service Sector - Greater Accra 4,727,125,079 2,164,514,373 2,061,361,236 501,249,470
Wholesale and retail trade; repair of motor vehicles and
motorcycles 1,716,277,618 18,750,706 1,697,409,594 117,318
Transportation and storage 136,322,592 106,177,745 12,658,705 17,486,142
Accommodation and food service activities 206,703,240 117,782,119 67,316,978 21,604,143
Information and communication 239,983,010 101,759,820 131,935,898 6,287,292
Financial and insurance activities 1,986,836,633 1,626,783,525 8,461,781 351,591,327
Real estate activities 90,342,732 57,177,530 25,339,105 7,826,097
Professional, scientific and technical activities 65,031,549 17,469,107 28,837,258 18,725,184
Administrative and support service activities 113,916,680 9,576,919 35,880,344 68,459,417
Education 31,716,489 20,391,133 9,478,440 1,846,916
Human health and social work activities 49,363,715 26,514,247 19,209,351 3,640,117
Arts, entertainment and recreation 1,099,936 492,517 442,519 164,900
Other service activities 89,530,885 61,639,006 24,391,263 3,500,616
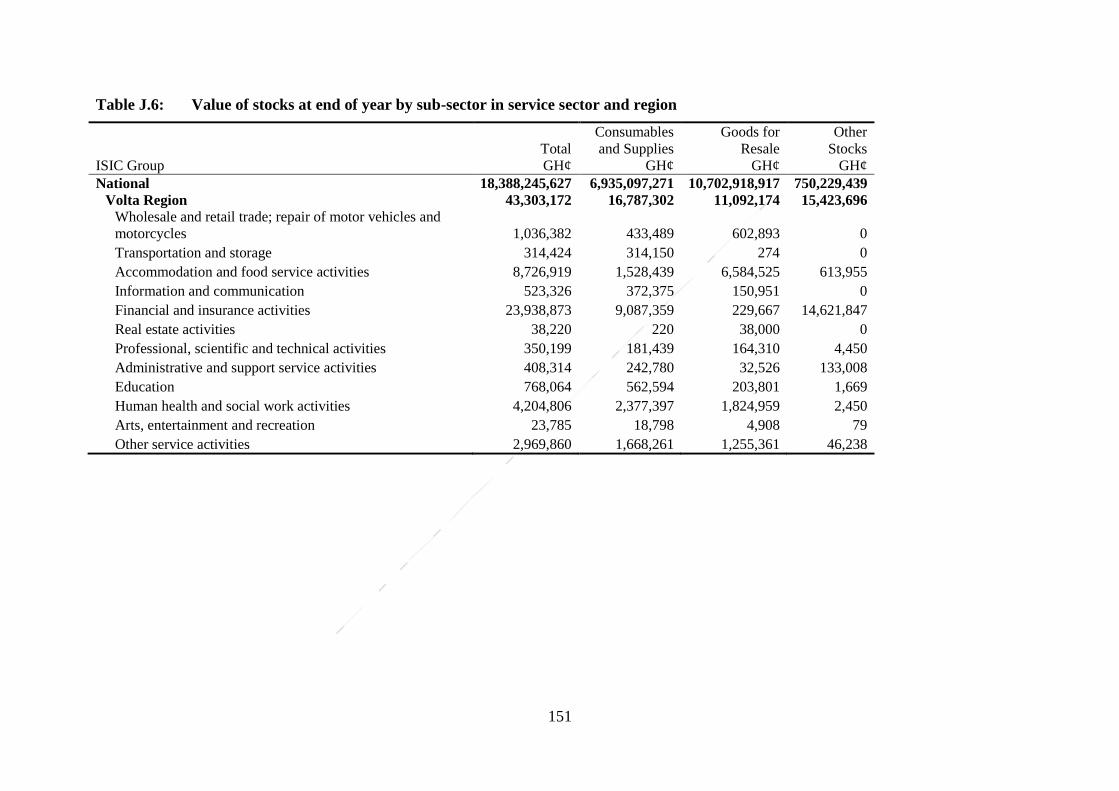
151
Table J.6: Value of stocks at end of year by sub-sector in service sector and region
ISIC Group
Total
GH¢
Consumables
and Supplies
GH¢
Goods for
Resale
GH¢
Other
Stocks
GH¢
National 18,388,245,627 6,935,097,271 10,702,918,917 750,229,439
Volta Region 43,303,172 16,787,302 11,092,174 15,423,696
Wholesale and retail trade; repair of motor vehicles and
motorcycles 1,036,382 433,489 602,893 0
Transportation and storage 314,424 314,150 274 0
Accommodation and food service activities 8,726,919 1,528,439 6,584,525 613,955
Information and communication 523,326 372,375 150,951 0
Financial and insurance activities 23,938,873 9,087,359 229,667 14,621,847
Real estate activities 38,220 220 38,000 0
Professional, scientific and technical activities 350,199 181,439 164,310 4,450
Administrative and support service activities 408,314 242,780 32,526 133,008
Education 768,064 562,594 203,801 1,669
Human health and social work activities 4,204,806 2,377,397 1,824,959 2,450
Arts, entertainment and recreation 23,785 18,798 4,908 79
Other service activities 2,969,860 1,668,261 1,255,361 46,238

152
Table J.7: Value of stocks at end of year by sub-sector in service sector and region
ISIC Group
Total
GH¢
Consumables
and Supplies
GH¢
Goods for
Resale
GH¢
Other
Stocks
GH¢
SERVICE SECTOR - National 18,388,245,627 6,935,097,271 10,702,918,917 750,229,439
Eastern Region 39,115,796 17,102,402 19,575,165 2,438,229
Wholesale and retail trade; repair of motor vehicles and
motorcycles 681,231 584,141 97,090 0
Transportation and storage 29,274 6,024 23,250 0
Accommodation and food service activities 10,439,197 2,639,391 7,045,876 753,930
Information and communication 1,071,084 768,134 32,605 270,345
Financial and insurance activities 1,172,045 893,832 126,285 151,928
Real estate activities 198,996 198,996 0 0
Professional, scientific and technical activities 221,313 64,391 149,819 7,103
Administrative and support service activities 395,663 340,583 27,050 28,030
Education 3,218,188 2,106,420 387,239 724,529
Human health and social work activities 18,679,539 8,007,569 10,283,207 388,763
Arts, entertainment and recreation 95,638 72,363 10,275 13,000
Other service activities 2,913,629 1,420,558 1,392,469 100,602

153
Table J.8: Value of stocks at end of year by sub-sector in service sector and region
ISIC Group
Total
GH¢
Consumables
and Supplies
GH¢
Goods for
Resale
GH¢
Other
Stocks
GH¢
Service Sector - National 18,388,245,627 6,935,097,271 10,702,918,917 750,229,439
Service Sector - Ashanti 97,028,596 51,723,166 41,975,620 3,329,810
Wholesale and retail trade; repair of motor vehicles and
motorcycles 4,493,707 1,304,170 3,189,537 0
Transportation and storage 4,052,001 879,653 3,172,348 0
Accommodation and food service activities 14,247,735 7,560,688 6,144,519 542,528
Information and communication 991,738 805,254 77,327 109,157
Financial and insurance activities 6,645,713 5,634,286 278,827 732,600
Real estate activities 808,760 115,891 622,679 70,190
Professional, scientific and technical activities 3,852,535 3,029,566 727,537 95,432
Administrative and support service activities 7,874,855 910,627 6,849,420 114,808
Education 14,060,568 11,656,988 2,324,304 79,276
Human health and social work activities 29,989,332 14,270,254 14,275,036 1,444,042
Arts, entertainment and recreation 277,518 189,660 87,788 70
Other service activities 9,734,133 5,366,129 4,226,298 141,706

154
Table J.9: Value of stocks at end of year by sub-sector in service sector and region
ISIC Group
Total
GH¢
Consumables
and Supplies
GH¢
Goods for
Resale
GH¢
Other
Stocks
GH¢
Service Sector - National 18,388,245,627 6,935,097,271 10,702,918,917 750,229,439
Service Sector - Brong Ahafo 132,148,313 108,276,982 12,249,196 11,622,135
Wholesale and retail trade; repair of motor vehicles and motorcycles 88,229 20,181 68,043 5
Transportation and storage 136,828 125,657 11,071 100
Accommodation and food service activities 8,038,156 2,940,460 5,096,146 1,550
Information and communication 92,440,631 92,063,560 369,762 7,309
Financial and insurance activities 13,192,456 1,590,763 38,139 11,563,554
Real estate activities 17,082 1,082 16,000 0
Professional, scientific and technical activities 180,138 116,945 61,303 1,890
Administrative and support service activities 338,911 244,418 93,705 788
Education 2,177,285 1,718,589 426,231 32,465
Human health and social work activities 9,391,101 5,862,893 3,527,403 805
Arts, entertainment and recreation 131,359 118,203 12,506 650
Other service activities 6,016,138 3,474,230 2,528,889 13,019

155
Table J.10: Value of stocks at end of year by sub-sector in service sector and region
ISIC Group
Total
GH¢
Consumables
and Supplies
GH¢
Goods for
Resale
GH¢
Other
Stocks
GH¢
Service Sector - National 18,388,245,627 6,935,097,271 10,702,918,917 750,229,439
Service Sector - Northern 14,053,003 9,409,246 4,494,589 149,168
Wholesale and retail trade; repair of motor vehicles and motorcycles 118,125 84,655 33,470 0
Transportation and storage 509,574 7,824 496,050 5,700
Accommodation and food service activities 3,462,764 1,808,785 1,624,750 29,229
Information and communication 178,168 84,243 91,092 2,833
Financial and insurance activities 3,347,575 3,077,595 268,960 1,020
Real estate activities 90,040 40 90,000 0
Professional, scientific and technical activities 127,268 61,452 55,202 10,614
Administrative and support service activities 164,189 85,709 78,480 0
Education 2,107,567 1,846,311 161,498 99,758
Human health and social work activities 2,340,011 1,450,767 889,244 0
Arts, entertainment and recreation 5,879 4,599 1,280 0
Other service activities 1,601,843 897,266 704,562 15

156
Table J.11: Value of stocks at end of year by sub-sector in service sector and region
ISIC Group
Total
GH¢
Consumables
and Supplies
GH¢
Goods for
Resale
GH¢
Other
Stocks
GH¢
Service Sector - National 18,388,245,627 6,935,097,271 10,702,918,917 750,229,439
Service Sector - Upper East 330,658,858 327,109,405 3,434,398 115,055
Wholesale and retail trade; repair of motor vehicles and
motorcycles 1,622 1,622 0 0
Transportation and storage 2,439 2,234 205 0
Accommodation and food service activities 2,417,382 429,062 1,968,820 19,500
Information and communication 26,453 22,145 4,308 0
Financial and insurance activities 161,043 149,043 12,000 0
Real estate activities 1,000 1,000 0 0
Professional, scientific and technical activities 86,226 70,796 13,130 2,300
Administrative and support service activities 78,589 36,438 33,494 8,657
Education 770,744 729,697 40,547 500
Human health and social work activities 326,379,146 325,362,764 942,554 73,828
Arts, entertainment and recreation 42,601 27,151 15,450 0
Other service activities 691,613 277,453 403,889 10,271

157
Table J.12: Value of stocks at end of year by sub-sector in service sector and region
ISIC Group
TOTAL
GH¢
Consumables
and Supplies
GH¢
Goods For
Resale GH¢
Other
Stocks
GH¢
Service Sector - National 18,388,245,627 6,935,097,271 10,702,918,917 750,229,439
Service Sector - Upper West 5,030,386 2,558,249 2,391,234 80,903
Wholesale and retail trade; repair of motor vehicles
and motorcycles 36,950 3,926 33,019 5
Transportation and storage 320,036 317,773 2,263 0
Accommodation and food service activities 2,422,324 570,878 1,844,024 7,422
Information and communication 14,988 12,273 640 2,075
Financial and insurance activities 467,575 356,419 111,156 0
Real estate activities 0 0 0 0
Professional, scientific and technical activities 16,046 7,046 4,100 4,900
Administrative and support service activities 155,298 75,305 79,993 0
Education 351,688 342,035 4,953 4,700
Human health and social work activities 731,017 654,121 16,923 59,973
Arts, entertainment and recreation 2,727 2,175 552 0
Other service activities 511,737 216,298 293,611 1,828

158
Table K.1: Value of stocks at beginning of year by sub-sector in service sector
ISIC Group
Total
GH¢
Consumables
and Supplies
GH¢
Goods for
Resale
GH¢
Other
Stocks
GH¢
Service Sector - National 5,531,365,859 2,338,524,139 2,947,293,702 245,548,018
Wholesale and retail trade; repair of motor vehicles and
motorcycles 2,353,461,882 20,337,529 2,333,058,310 66,043
Transportation and storage 147,157,329 116,876,806 16,291,576 13,988,947
Accommodation and food service activities 341,281,324 173,627,518 148,011,175 19,642,631
Information and communication 319,800,428 176,672,131 135,151,642 7,976,655
Financial and insurance activities 1,306,970,226 1,222,331,560 11,369,348 73,269,318
Real estate activities 139,753,182 50,743,481 51,811,224 37,198,477
Professional, scientific and technical activities 59,510,873 16,817,422 25,106,451 17,587,000
Administrative and support service activities 95,007,886 14,069,765 11,213,094 69,725,027
Education 75,733,090 55,606,875 18,066,468 2,059,747
Human health and social work activities 465,909,316 382,496,954 81,935,169 1,477,193
Arts, entertainment and recreation 2,456,279 1,629,216 711,379 115,684
Other service activities 224,324,044 107,314,881 114,567,866 2,441,297

159
Table K.2: Value of stocks at beginning of year by size of businesses in
the service sector
ISIC Group
Total
GH¢
Consumables
and Supplies
GH¢
Goods For
Resale GH¢
Other
Stocks
GH¢
Services 5,531,365,859 2,338,524,139 2,947,293,702 245,548,018
Large-Sized Businesses 1,484,066,103 1,250,214,893 157,054,319 76,796,891
Medium-Sized Businesses 3,202,039,047 605,122,253 2,441,767,828 155,148,966
Small-Sized Businesses 655,896,223 404,443,436 240,023,096 11,429,691
Micro-Sized Businesses 189,364,486 78,743,556 108,448,459 2,172,471
Table K.3: Value of stocks at beginning of year by sub-sector in service
sector and region
ISIC Group
Total
GH¢
Consumables
and Supplies
GH¢
Goods for
Resale
GH¢
Other Stocks
GH¢
Service Sector - National 5,531,365,859 2,338,524,139 2,947,293,702 245,548,018
Service Sector - Western 78,542,763 34,808,378 43,014,402 719,983
Wholesale and retail trade; repair of motor vehicles and motorcycles 1,146,420 110,707 1,027,093 8,620
Transportation and storage 1,261,927 801,959 154,275 305,693
Accommodation and food service activities 31,454,845 13,063,135 18,345,374 46,336
Information and communication 12,838,884 242,165 12,596,719 0
Financial and insurance activities 7,584,838 6,178,901 1,212,104 193,833
Real estate activities 1,027 1,027 0 0
Professional, scientific and technical activities 2,817,746 2,736,845 80,842 59
Administrative and support service activities 756,200 685,088 71,112 0
Education 2,292,107 969,335 1,186,577 136,195
Human health and social work activities 9,215,086 5,040,783 4,171,903 2,400
Arts, entertainment and recreation 421,001 403,003 17,777 221
Other service activities 8,752,681 4,575,429 4,150,627 26,625

160
Table K.4: Value of stocks at beginning of year by sub-sector in service
sector and region
ISIC Group
Total
GH¢
Consumables
and Supplies
GH¢
Goods
for Resale
GH¢
Other Stocks
GH¢
Service Sector - National 5,531,365,859 2,338,524,139 2,947,293,702 245,548,018
Service Sector - Central 30,304,456 15,433,419 14,705,132 165,905
Wholesale and retail trade; repair of motor vehicles and motorcycles 213,476 21,726 191,750 0
Transportation and storage 202,562 201,562 1,000 0
Accommodation and food service activities 11,184,811 2,611,259 8,573,552 0
Information and communication 205,729 93,111 20,281 92,337
Financial and insurance activities 2,181,719 1,406,455 759,968 15,296
Real estate activities 295 295 0 0
Professional, scientific and technical activities 118,431 80,214 6,743 31,474
Administrative and support service activities 310,846 180,918 129,928 0
Education 3,038,308 2,090,491 943,117 4,700
Human health and social work activities 2,822,971 1,342,116 1,476,988 3,867
Arts, entertainment and recreation 140,150 121,969 14,110 4,071
Other service activities 9,885,158 7,283,304 2,587,694 14,160

161
Table K.5: Value of stocks at beginning of year by sub-sector in service
sector and region
ISIC Group
Total
GH¢
Consumables and
Supplies
GH¢
Goods for
Resale
GH¢
Other Stocks
GH¢
Service Sector - National 5,531,365,859 2,338,524,139 2,947,293,702 245,548,018
Service Sector - Greater Accra 4,715,637,438 1,744,154,316 2,756,623,100 214,860,022
Wholesale and retail trade; repair of motor vehicles and
motorcycles 2,345,224,356 16,347,667 2,328,819,316 57,373
Transportation and storage 140,315,205 114,340,685 12,306,966 13,667,554
Accommodation and food service activities 231,221,556 131,970,132 80,682,893 18,568,531
Information and communication 211,430,511 82,445,572 121,647,747 7,337,192
Financial and insurance activities 1,251,107,882 1,195,733,146 7,983,608 47,391,128
Real estate activities 138,903,938 50,447,237 51,348,224 37,108,477
Professional, scientific and technical activities 49,426,324 9,717,289 22,428,565 17,280,470
Administrative and support service activities 81,866,103 10,035,417 2,393,074 69,437,612
Education 35,821,911 24,379,900 9,914,496 1,527,515
Human health and social work activities 62,509,177 31,355,997 31,026,268 126,912
Arts, entertainment and recreation 1,134,726 513,861 518,748 102,117
Other service activities 166,675,748 76,867,413 87,553,194 2,255,141

162
Table K.6: Value of stocks at beginning of year by sub-sector in service sector and region
Industry (2-DIGIT ISIC)
Total
GH¢
Consumables
and Supplies
GH¢
Goods For
Resale GH¢
Other
Stocks
GH¢
Service Sector - National 5,531,365,859 2,338,524,139 2,947,293,702 245,548,018
Service Sector - Volta 49,134,793 17,453,925 15,256,938 16,423,930
Wholesale and retail trade; repair of motor vehicles
and motorcycles 498,002 174,334 323,668 0
Transportation and storage 257,567 256,569 998 0
Accommodation and food service activities 10,061,005 1,818,255 7,694,612 548,138
Information and communication 346,328 290,317 56,011 0
Financial and insurance activities 23,590,069 8,002,111 87,200 15,500,758
Real estate activities 195,800 800 195,000 0
Professional, scientific and technical activities 1,763,150 549,844 1,206,656 6,650
Administrative and support service activities 489,124 244,662 105,183 139,279
Education 913,314 699,931 210,438 2,945
Human health and social work activities 5,260,348 2,364,685 2,692,692 202,971
Arts, entertainment and recreation 34,203 25,145 8,979 79
Other service activities 5,725,885 3,027,272 2,675,502 23,111
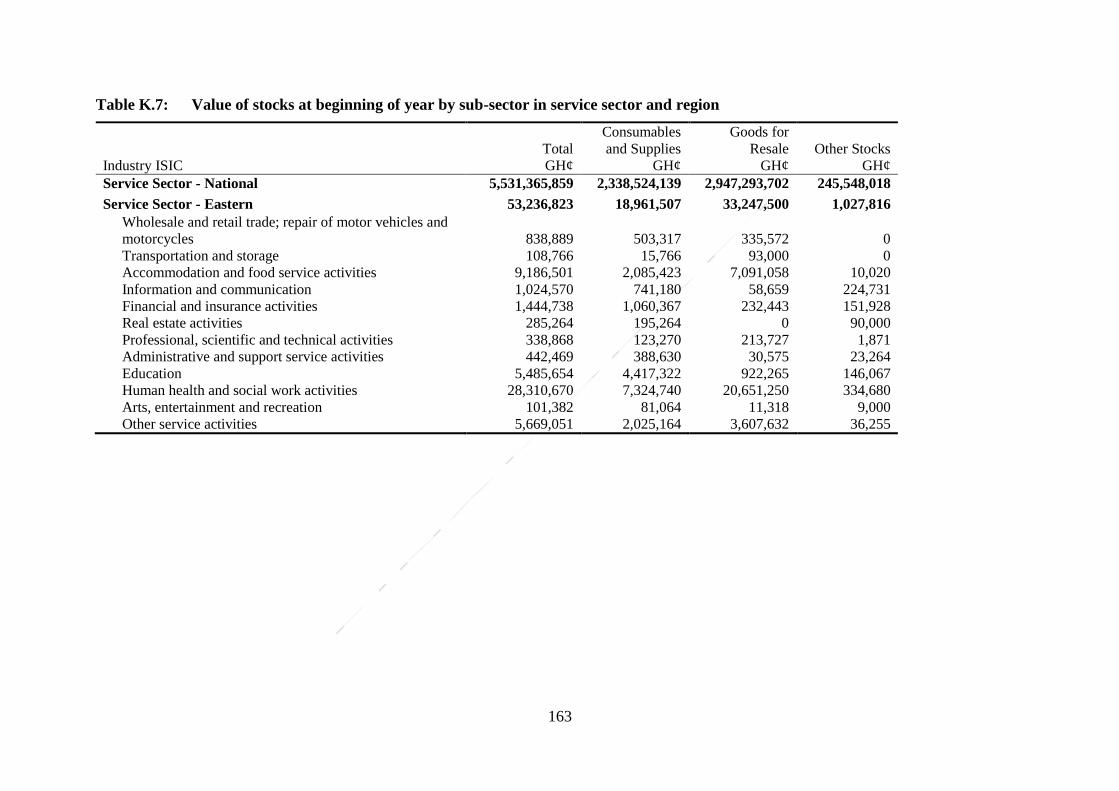
163
Table K.7: Value of stocks at beginning of year by sub-sector in service sector and region
Industry ISIC
Total
GH¢
Consumables
and Supplies
GH¢
Goods for
Resale
GH¢
Other Stocks
GH¢
Service Sector - National 5,531,365,859 2,338,524,139 2,947,293,702 245,548,018
Service Sector - Eastern 53,236,823 18,961,507 33,247,500 1,027,816
Wholesale and retail trade; repair of motor vehicles and
motorcycles 838,889 503,317 335,572 0
Transportation and storage 108,766 15,766 93,000 0
Accommodation and food service activities 9,186,501 2,085,423 7,091,058 10,020
Information and communication 1,024,570 741,180 58,659 224,731
Financial and insurance activities 1,444,738 1,060,367 232,443 151,928
Real estate activities 285,264 195,264 0 90,000
Professional, scientific and technical activities 338,868 123,270 213,727 1,871
Administrative and support service activities 442,469 388,630 30,575 23,264
Education 5,485,654 4,417,322 922,265 146,067
Human health and social work activities 28,310,670 7,324,740 20,651,250 334,680
Arts, entertainment and recreation 101,382 81,064 11,318 9,000
Other service activities 5,669,051 2,025,164 3,607,632 36,255
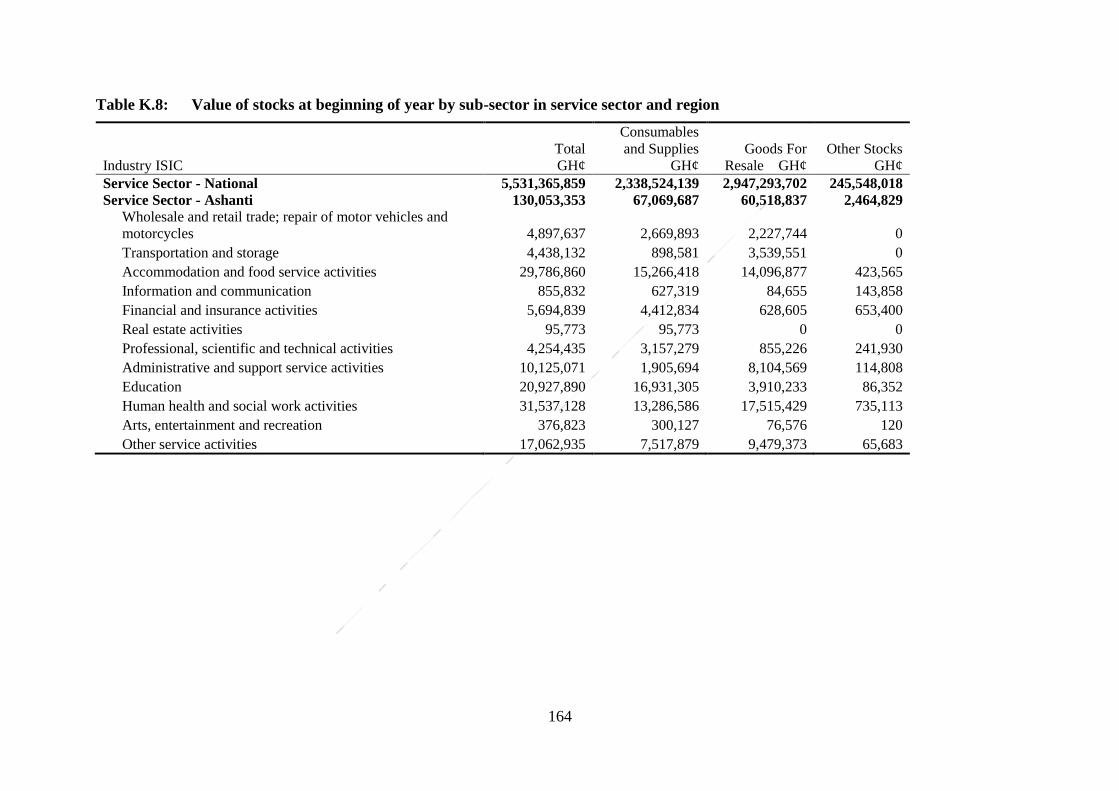
164
Table K.8: Value of stocks at beginning of year by sub-sector in service sector and region
Industry ISIC
Total
GH¢
Consumables
and Supplies
GH¢
Goods For
Resale GH¢
Other Stocks
GH¢
Service Sector - National 5,531,365,859 2,338,524,139 2,947,293,702 245,548,018
Service Sector - Ashanti 130,053,353 67,069,687 60,518,837 2,464,829
Wholesale and retail trade; repair of motor vehicles and
motorcycles 4,897,637 2,669,893 2,227,744 0
Transportation and storage 4,438,132 898,581 3,539,551 0
Accommodation and food service activities 29,786,860 15,266,418 14,096,877 423,565
Information and communication 855,832 627,319 84,655 143,858
Financial and insurance activities 5,694,839 4,412,834 628,605 653,400
Real estate activities 95,773 95,773 0 0
Professional, scientific and technical activities 4,254,435 3,157,279 855,226 241,930
Administrative and support service activities 10,125,071 1,905,694 8,104,569 114,808
Education 20,927,890 16,931,305 3,910,233 86,352
Human health and social work activities 31,537,128 13,286,586 17,515,429 735,113
Arts, entertainment and recreation 376,823 300,127 76,576 120
Other service activities 17,062,935 7,517,879 9,479,373 65,683
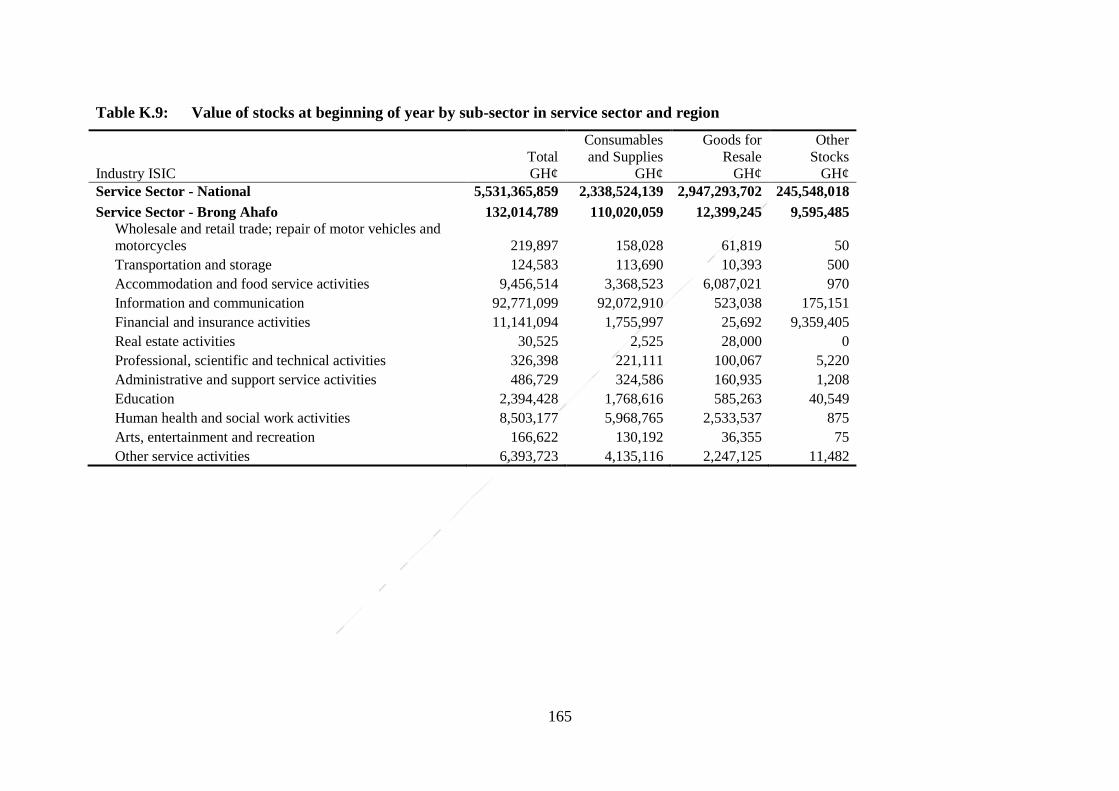
165
Table K.9: Value of stocks at beginning of year by sub-sector in service sector and region
Industry ISIC
Total
GH¢
Consumables
and Supplies
GH¢
Goods for
Resale
GH¢
Other
Stocks
GH¢
Service Sector - National 5,531,365,859 2,338,524,139 2,947,293,702 245,548,018
Service Sector - Brong Ahafo 132,014,789 110,020,059 12,399,245 9,595,485
Wholesale and retail trade; repair of motor vehicles and
motorcycles 219,897 158,028 61,819 50
Transportation and storage 124,583 113,690 10,393 500
Accommodation and food service activities 9,456,514 3,368,523 6,087,021 970
Information and communication 92,771,099 92,072,910 523,038 175,151
Financial and insurance activities 11,141,094 1,755,997 25,692 9,359,405
Real estate activities 30,525 2,525 28,000 0
Professional, scientific and technical activities 326,398 221,111 100,067 5,220
Administrative and support service activities 486,729 324,586 160,935 1,208
Education 2,394,428 1,768,616 585,263 40,549
Human health and social work activities 8,503,177 5,968,765 2,533,537 875
Arts, entertainment and recreation 166,622 130,192 36,355 75
Other service activities 6,393,723 4,135,116 2,247,125 11,482

166
Table K.10: Value of stocks at beginning of year by sub-sector in service sector and region
Industry ISIC
Total
GH¢
Consumables
and Supplies
GH¢
Goods for
Resale
GH¢
Other Stocks
GH¢
Service Sector - National 5,531,365,859 2,338,524,139 2,947,293,702 245,548,018
Service Sector - Northern 16,737,800 10,960,760 5,642,747 134,293
Wholesale and retail trade; repair of motor vehicles and motorcycles 385,014 342,266 42,748 0
Transportation and storage 212,004 13,409 183,395 15,200
Accommodation and food service activities 4,351,016 2,248,858 2,102,158 0
Information and communication 277,194 124,960 151,097 1,137
Financial and insurance activities 3,535,298 3,323,331 208,397 3,570
Real estate activities 240,060 60 240,000 0
Professional, scientific and technical activities 345,126 151,176 183,725 10,225
Administrative and support service activities 240,836 139,668 101,168 0
Education 2,191,417 1,806,164 281,132 104,121
Human health and social work activities 2,634,244 1,554,995 1,079,249 0
Arts, entertainment and recreation 15,199 14,033 1,166 0
Other service activities 2,310,391 1,241,839 1,068,512 40

167
Table K.11: Value of stocks at beginning of year by sub-sector in service sector and region
Industry ISIC
Total
GH¢
Consumables
and Supplies
GH¢
Goods for
Resale
GH¢
Other Stocks
GH¢
Service Sector - National 5,531,365,859 2,338,524,139 2,947,293,702 245,548,018
Service Sector - Upper East 320,060,905 316,623,052 3,301,822 136,031
Wholesale and retail trade; repair of motor vehicles and
motorcycles 2,114 2,114 0 0
Transportation and storage 4,747 4,359 388 0
Accommodation and food service activities 2,021,148 460,939 1,521,209 39,000
Information and communication 38,041 26,465 11,576 0
Financial and insurance activities 142,550 133,550 9,000 0
Real estate activities 500 500 0 0
Professional, scientific and technical activities 104,627 72,127 27,100 5,400
Administrative and support service activities 162,421 103,483 50,081 8,857
Education 2,075,448 2,013,073 56,375 6,000
Human health and social work activities 314,226,687 313,395,446 761,343 69,898
Arts, entertainment and recreation 63,117 37,767 25,350 0
Other service activities 1,219,506 373,230 839,400 6,876

168
Table K.12: Value of stocks at beginning of year by sub-sector in service sector and region
Industry ISIC
Total
GH¢
Consumables
and Supplies
GH¢
Goods for
Resale
GH¢
Other
Stocks
GH¢
Service Sector - National 5,531,365,859 2,338,524,139 2,947,293,702 245,548,018
Service Sector - Upper West 5,642,739 3,039,038 2,583,977 19,724
Wholesale and retail trade; repair of motor vehicles and
motorcycles 36,078 7,478 28,600 0
Transportation and storage 231,836 230,225 1,611 0
Accommodation and food service activities 2,557,068 734,576 1,816,421 6,071
Information and communication 12,243 8,133 1,860 2,250
Financial and insurance activities 547,199 324,868 222,331 0
Real estate activities 0 0 0 0
Professional, scientific and technical activities 15,768 8,268 3,800 3,700
Administrative and support service activities 128,087 61,619 66,468 0
Education 592,611 530,739 56,571 5,301
Human health and social work activities 889,828 862,841 26,509 478
Arts, entertainment and recreation 3,056 2,056 1,000 0
Other service activities 628,966 268,237 358,805 1,924

169
Table L.1: Receipts by sub-sector in industry sector
ISIC Group
Total
GH¢
Sales from main
industrial
activity
GH¢
Receipts for
Contract work
done
GH¢
Receipts for
repair and
installation
services
GH¢
Receipts
for other
industrial
services
GH¢
Receipts from
non-industrial
services GH¢
Sale of goods
sold in same
condition
GH¢
INDUSTRY - National 81,157,141,226 74,602,228,102 1,347,954,249 713,931,448 869,692,543 3,240,110,035 383,224,849
Mining and quarrying 20,000,296,655 16,498,255,877 212,169,452 3,260,925 693,879,564 2,586,263,673 6,467,164
Manufacturing 42,071,603,730 40,989,025,642 696,892,787 12,822,538 22,200,445 114,192,452 236,469,866
Electricity, gas, steam and air conditioning
supply 6,572,630,355 6,130,659,139 90,908,054 59,011,951 94,753,725 125,698,823 71,598,663
Water supply; sewerage, waste management 1,138,525,673 1,105,755,668 4,937,003 802,914 2,851,858 24,102,420 75,810
Construction 11,374,084,817 9,878,531,777 343,046,954 638,033,121 56,006,951 389,852,667 68,613,347
Table L.2: Receipts by firm sizes in the industry sector
ISIC Group
Total
GH¢
Sales from
main industrial
activity
GH¢
Receipts for
Contract
work done
GH¢
Receipts for
repair and
installation
services
GH¢
Receipts
for other
industrial
services
GH¢
Receipts from
non-industrial
services
GH¢
Sale of goods
sold in same
condition
GH¢
INDUSTRY - National 81,157,141,226 74,602,228,102 1,347,954,249 713,931,448 869,692,543 3,240,110,035 383,224,849
Large-Sized Businesses 53,018,778,911 49,116,231,251 321,960,160 87,177,024 532,989,878 2,911,911,916 48,508,682
Medium-Sized Businesses 16,477,738,764 15,871,739,684 137,382,407 37,566,344 246,457,458 79,275,074 105,317,797
Small-Sized Businesses 9,705,682,783 8,123,312,749 531,603,582 587,542,000 84,377,365 228,816,656 150,030,431
Micro-Sized Businesses 1,954,940,769 1,490,944,419 357,008,100 1,646,080 5,867,842 20,106,389 79,367,939

170
Table L.3: Receipts by sub-sector in industry sector and region
ISIC Group
Total
GH¢
Sales from
main industrial
activity
GH¢
Receipts for
Contract
work done
GH¢
Receipts
for repair
and
installation
services
GH¢
Receipts
for other
industrial
services
GH¢
Receipts from
non-industrial
services GH¢
Sale of
goods sold
in same
condition
GH¢
INDUSTRY -Western 16,272,255,862 13,102,886,506 66,094,517 3,169,498 433,933,454 2,572,317,548 93,854,339
Mining and quarrying 13,852,800,209 10,877,332,895 10,455,090 2,673,500 414,341,298 2,545,931,942 2,065,484
Manufacturing 2,031,923,314 1,952,150,333 43,147,688 0 1,595,180 19,512,688 15,517,425
Electricity, gas, steam and air conditioning
supply 308,782,079 221,251,690 0 0 15,895,440 88,286 71,546,663
Water supply; sewerage, waste management 6,182,653 4,210,760 55,583 271,500 1,584,701 60,109 0
Construction 72,567,606 47,940,829 12,436,155 224,498 516,835 6,724,523 4,724,766
Table L.4: Receipts by subsector in industry sector
ISIC Group
Total
GH¢
Sales from
main
industrial
activity
GH¢
Receipts for
Contract
work done
GH¢
Receipts for
repair and
installation
services
GH¢
Receipts
for other
industrial
services
GH¢
Receipts
from non-
industrial
services
GH¢
Sale of
goods sold
in same
condition
GH¢
INDUSTRY - Central 933,793,836 826,816,367 46,981,505 109,763 42,404,857 5,918,740 11,562,604
Mining and quarrying 229,420,155 206,500,154 0 0 21,705,001 1,215,000 0
Manufacturing 553,092,614 480,196,433 46,248,742 5,070 12,745,589 2,780,478 11,116,302
Electricity, gas, steam and air conditioning supply 118,350,560 110,402,840 0 0 7,947,720 0 0
Water supply; sewerage, waste management 2,117,172 2,046,185 3,585 52,351 6,547 5,879 2,625
Construction 30,813,333 27,670,754 729,178 52,342 0 1,917,382 443,677

171
Table L.5: Receipts by sub-sector in industry sector and region
ISIC Group
Total
GH¢
Sales from
main industrial
activity
GH¢
Receipts for
Contract
work done
GH¢
Receipts for
repair and
installation
services
GH¢
Receipts
for other
industrial
services
GH¢
Receipts
from non-
industrial
services
GH¢
Sale of
goods sold
in same
condition
GH¢
INDUSTRY - Greater Accra 51,345,397,960 48,731,986,709 831,611,788 693,468,927 329,430,284 597,089,060 161,811,192 Mining and quarrying 1,867,421,733 1,399,138,314 196,731,515 0 251,122,351 17,065,631 3,363,922
Manufacturing 33,893,168,126 33,473,614,662 230,520,860 10,003,552 1,364,482 70,990,887 106,673,683
Electricity, gas, steam and air conditioning supply 5,173,414,657 4,868,277,628 90,617,381 58,525,495 30,978,183 124,963,970 52,000
Water supply; sewerage, waste management 909,163,942 880,548,883 4,442,940 408,522 101,640 23,660,464 1,493
Construction 9,502,229,503 8,110,407,222 309,299,092 624,531,357 45,863,628 360,408,109 51,720,095
Table L.6: Receipts by sub-sector in industry sector and region
ISIC Group
Total
GH¢
Sales from
main
industrial
activity
GH¢
Receipts for
Contract
work done
GH¢
Receipts
for repair
and
installation
services
GH¢
Receipts for
other
industrial
services
GH¢
Receipts
from non-
industrial
services
GH¢
Sale of
goods sold
in same
condition
GH¢
INDUSTRY - Volta 1,209,148,877 1,160,768,037 21,110,347 901,892 7,673,471 6,928,093 11,767,037
Mining and quarrying 6,346,194 6,104,880 0 0 0 241,314 0
Manufacturing 793,489,685 765,645,248 18,546,003 0 7,200 625,167 8,666,067
Electricity, gas, steam and air conditioning supply 97,612,600 90,989,500 0 0 6,623,100 0 0
Water supply; sewerage, waste management 120,841,132 119,868,538 386,389 26,289 374,500 177,766 7,650
Construction 190,859,265 178,159,872 2,177,954 875,603 668,671 5,883,845 3,093,320

172
Table L.7: Receipts by sub-sector in industry sector and region
ISIC Group
Total
GH¢
Sales from
main
industrial
activity
GH¢
Receipts for
Contract
work done
GH¢
Receipts for
repair and
installation
services
GH¢
Receipts for
other
industrial
services
GH¢
Receipts
from non-
industrial
services
GH¢
Sale of
goods sold
in same
condition
GH¢
INDUSTRY - Eastern 3,851,282,048 3,759,759,819 40,600,751 932,848 2,977,930 29,353,511 17,657,189
Mining and quarrying 3,013,026,005 2,988,555,137 514,022 587,275 2,234,561 20,327,252 807,758
Manufacturing 587,346,089 523,241,434 39,758,712 100 0 8,089,748 16,256,095
Electricity, gas, steam and air conditioning supply 127,385,296 127,385,296 0 0 0 0 0
Water supply; sewerage, waste management 1,550,891 1,327,492 3,400 19,630 151,300 49,069 0
Construction 121,973,767 119,250,460 324,617 325,843 592,069 887,442 593,336
Table L.8: Receipts by sub-sector in industry sector and region
ISIC Group
Total
GH¢
Sales from
main
industrial
activity
GH¢
Receipts for
Contract
work done
GH¢
Receipts for
repair and
installation
services
GH¢
Receipts
for other
industrial
services
GH¢
Receipts
from non-
industrial
services
GH¢
Sale of
goods sold
in same
condition
GH¢
INDUSTRY - Ashanti 4,460,982,455 4,248,082,243 118,077,515 5,539,767 40,904,541 13,642,210 34,736,179
Mining and quarrying 810,436,314 800,213,756 4,344,185 0 4,350,788 1,297,585 230,000
Manufacturing 2,286,782,259 2,147,358,550 101,876,815 1,169,125 253,933 3,019,084 33,104,752
Electricity, gas, steam and air conditioning supply 488,063,000 454,947,500 0 0 33,115,500 0 0
Water supply; sewerage, waste management 16,296,308 16,228,201 0 0 0 4,065 64,042
Construction 859,404,573 829,334,236 11,856,514 4,370,642 3,184,319 9,321,477 1,337,385

173
Table L.9: Receipts by sub-sector in industry sector and region
ISIC Group
Total
GH¢
Sales from
main
industrial
activity
GH¢
Receipts for
Contract
work done
GH¢
Receipts for
repair and
installation
services
GH¢
Receipts
for other
industrial
services
GH¢
Receipts
from non-
industrial
services
GH¢
Sale of goods
sold in same
condition
GH¢
INDUSTRY - Brong Ahafo 1,717,525,611 1,587,921,490 77,614,014 370,355 6,891,616 9,506,775 35,221,361
Mining and quarrying 214,233,213 214,233,213 0 0 0 0 0
Manufacturing 1,435,455,661 1,309,174,838 76,265,210 113,833 6,234,060 9,001,551 34,666,169
Electricity, gas, steam and air conditioning supply 7,440,000 7,440,000 0 0 0 0 0
Water supply; sewerage, waste management 6,437,548 5,686,333 25,725 16,472 588,000 121,018 0
Construction 53,959,190 51,387,107 1,323,079 240,050 69,556 384,206 555,192
Table L.10: Receipts by sub-sector in industry sector and region
ISIC Group
Total
GH¢
Sales from
main
industrial
activity
GH¢
Receipts for
Contract
work done
GH¢
Receipts for
repair and
installation
services
GH¢
Receipts
for other
industrial
services
GH¢
Receipts
from non-
industrial
services
GH¢
Sale of goods
sold in same
condition
GH¢
INDUSTRY - Northern 885,747,804 775,777,661 85,045,350 8,577,170 5,241,769 1,756,135 9,349,719
Mining and quarrying 31,020 0 0 0 0 31,020 0
Manufacturing 291,553,548 201,450,735 83,064,198 1,509,057 0 143,140 5,386,418
Electricity, gas, steam and air conditioning supply 223,246,180 221,634,269 290,673 484,456 193,782 643,000 0
Water supply; sewerage, waste management 18,726,726 18,666,746 10,200 3,600 22,130 24,050 0
Construction 352,190,328 334,025,910 1,680,279 6,580,057 5,025,856 914,926 3,963,300

174
Table L.11: Receipts by sub-sector in industry sector and region
ISIC Group
Total
GH¢
Sales from
main
industrial
activity
GH¢
Receipts for
Contract
work done
GH¢
Receipts for
repair and
installation
services
GH¢
Receipts
for other
industrial
services
GH¢
Receipts
from non-
industrial
services
GH¢
Sale of
goods sold
in same
condition
GH¢
INDUSTRY - Upper East 259,391,338 216,580,708 37,091,164 804,983 126,165 175,264 4,613,054
Mining and quarrying 4,180,652 3,802,647 124,640 150 125,565 127,650 0
Manufacturing 126,443,466 86,716,050 36,696,910 21,800 0 17,800 2,990,906
Electricity, gas, steam and air conditioning supply 28,278,983 28,275,416 0 0 0 3,567 0
Water supply; sewerage, waste management 56,248,605 56,240,325 7,680 0 600 0 0
Construction 44,239,633 41,546,271 261,934 783,033 0 26,247 1,622,148
Table L.12: Receipts by sub-sector in industry sector and region
ISIC Group
Total
GH¢
Sales from
main
industrial
activity
GH¢
Receipts for
Contract
work done
GH¢
Receipts for
repair and
installation
services
GH¢
Receipts
for other
industrial
services
GH¢
Receipts
from non-
industrial
services
GH¢
Sale of
goods sold
in same
condition
GH¢
INDUSTRY - Upper West 221,615,438 191,648,562 23,727,298 56,246 108,457 3,422,700 2,652,175
Mining and quarrying 2,401,160 2,374,880 0 0 0 26,280 0
Manufacturing 72,348,964 49,477,360 20,767,647 0 0 11,910 2,092,047
Electricity, gas, steam and air conditioning supply 57,000 55,000 0 2,000 0 0 0
Water supply; sewerage, waste management 960,695 932,205 1,500 4,550 22,440 0 0
Construction 145,847,619 138,809,117 2,958,151 49,696 86,017 3,384,510 560,128

175
Table M.1: Receipts by sub-sector in agriculture sector and size of establishment
ISIC Group Total GH¢
Receipts of
Agriculture
Products
GH¢
Receipts
from non-
agriculture
activities
GH¢
Receipts for
Goods
Purchased
for resale
GH¢
Own
Consumption
GH¢
Subsidies
GH¢
AGRICULTURE -National 5,728,082,283 5,061,015,104 39,298,416 619,356,914 2,490,731 5,921,118
Large-Sized Businesses 460,748,940 425,751,144 21,981,967 12,650,629 3,200 362,000
Medium-Sized Businesses 1,559,910,677 1,545,938,349 9,872,198 7,000 19,700 4,073,430
Small-Sized Businesses 2,767,502,638 2,755,733,963 7,240,227 2,471,202 721,801 1,335,445
Micro-Sized Businesses 939,920,027 333,591,648 204,023 604,228,083 1,746,030 150,243

176
Table M.2: Receipts in agriculture sector and region
ISIC Group Total GH¢
Receipts of
Agriculture
Products
GH¢
Receipts
from non-
agriculture
activities
GH¢
Receipts for
Goods
Purchased
for resale
GH¢
Own
Consumption
GH¢
Subsidies
GH¢
AGRICULTURE
Western Region
Agriculture forestry and fishing 1,526,393,768 908,364,385 1,325,700 616,209,576 103,607 390,500
Central Region
Agriculture forestry and fishing 65,065,099 61,218,566 2,952,659 451,950 27,729 414,195
Greater Accra Region
Agriculture forestry and fishing 571,202,323 566,000,977 5,107,296 38,727 48,716 6,607
Volta Region
Agriculture forestry and fishing 42,807,641 42,179,774 541,435 52,640 32,588 1,204
Eastern Region
Agriculture forestry and fishing 109,995,106 109,043,365 591,670 24,000 175,349 160,722
Ashanti Region
Agriculture forestry and fishing 1,868,527,733 1,844,151,400 22,852,259 280,714 1,211,351 32,009
Brong Ahafo Region
Agriculture forestry and fishing 262,009,165 253,413,965 2,419,318 524,469 780,432 4,870,981
Northern Region
Agriculture forestry and fishing 1,274,182,403 1,271,791,763 513,210 1,774,838 87,412 15,180
Upper East Region
Agriculture forestry and fishing 1,772,760 1,756,400 250 0 12,390 3,720
Upper West Region
Agriculture forestry and fishing 6,126,284 3,094,510 2,994,619 0 11,155 26,000

177
Table M.3: Receipts by sub-sector in service sector
ISIC Group Total
Receipts for
Services
GH¢
Sales of Goods
in same
condition
GH¢
Other Income
GH¢
Subsidies
and Grants
GH¢
SERVICES - National 224,640,204,738 124,047,239,031 92,325,814,759 7,917,069,500 350,081,448
Wholesale and retail trade; repair of motor vehicles and
motorcycles 111,678,150,308 18,039,030,958 91,522,501,682 1,995,332,881 121,284,787
Transportation and storage 3,575,598,025 3,243,583,710 157,568,869 171,950,246 2,495,200
Accommodation and food service activities 4,793,771,020 4,602,646,937 114,227,522 64,453,548 12,443,013
Information and communication 8,487,955,147 8,412,942,797 36,701,821 38,080,888 229,641
Financial and insurance activities 82,942,926,917 77,506,206,983 78,534,565 5,351,639,361 6,546,008
Real estate activities 782,585,058 749,332,530 13,454,875 19,797,363 290
Professional, scientific and technical activities 1,185,362,872 1,103,574,638 6,902,603 46,750,454 28,135,177
Administrative and support service activities 847,397,392 792,319,842 7,061,887 45,105,657 2,910,006
Education 6,185,644,507 6,024,470,551 61,902,576 33,008,648 66,262,732
Human health and social work activities 1,816,660,573 1,656,668,646 31,068,949 70,871,384 58,051,594
Arts, entertainment and recreation 225,397,989 219,347,413 3,374,409 2,392,285 283,882
Other service activities 2,118,754,930 1,697,114,026 292,515,001 77,686,786 51,439,117

178
Table M.4: Receipts by size of business in service sector
ISIC Group Total
Receipts for
Services
GH¢
Sales of Goods
in same
condition
GH¢
Other Income
GH¢
Subsidies
and Grants
GH¢
SERVICES - National 224,640,204,738 124,047,239,031 92,325,814,759 7,917,069,500 350,081,448
Large-Sized Businesses 61,168,019,402 49,739,579,122 8,532,293,349 2,838,859,855 57,287,076
Medium-Sized Businesses 56,881,120,045 34,530,045,429 21,354,711,428 912,419,176 83,944,012
Small-Sized Businesses 51,617,742,560 21,238,922,764 28,489,736,464 1,710,842,109 178,241,223
Micro-Sized Businesses 54,973,322,732 18,538,691,716 33,949,073,518 2,454,948,360 30,609,138
Table M.5: Receipts by sub-sector in service sector and region
ISIC Group Total
Receipts for
Services
GH¢
Sales of Goods
in same
condition
GH¢
Other
Income
GH¢
Subsidies
and Grants
GH¢
SERVICES - Western Region 7,504,550,306 1,527,738,681 5,460,751,811 497,758,641 18,301,173
Wholesale and retail trade; repair of motor vehicles and motorcycles 5,685,368,032 55,492,003 5,339,431,369 284,111,990 6,332,670
Transportation and storage 439,909,416 317,880,024 821,180 121,208,212 0
Accommodation and food service activities 352,634,647 326,773,506 23,938,935 1,921,706 500
Information and communication 18,843,557 17,411,211 1,243,156 189,190 0
Financial and insurance activities 397,349,639 310,146,523 8,981,758 74,337,556 3,883,802
Real estate activities 3,753,640 3,747,240 0 6,400 0
Professional, scientific and technical activities 27,588,438 23,085,784 146,251 4,353,703 2,700
Administrative and support service activities 21,715,339 20,816,539 576,505 322,295 0
Education 183,169,108 120,710,388 56,966,179 1,667,587 3,824,954
Human health and social work activities 95,000,431 90,269,925 2,694,862 371,630 1,664,014
Arts, entertainment and recreation 69,782,023 69,738,043 3,450 40,530 0
Other service activities 209,436,036 171,667,494 25,948,167 9,227,841 2,592,534

179
Table M.6: Receipts by sub-sector in service sector and region
ISIC Group Total
Receipts for
Services
GH¢
Sales of Goods
in same
condition
GH¢
Other
Income
GH¢
Subsidies
and Grants
GH¢
SERVICES - Central Region 3,647,631,815 876,102,026 2,480,214,441 161,670,951 129,644,397
Wholesale and retail trade; repair of motor vehicles and motorcycles 2,714,626,051 37,558,268 2,427,513,487 147,494,401 102,059,895
Transportation and storage 10,970,622 10,952,925 100 17,597 0
Accommodation and food service activities 199,161,931 158,024,222 38,500,168 2,637,541 0
Information and communication 5,944,449 5,456,448 32,784 375,297 79,920
Financial and insurance activities 433,198,328 426,582,206 1,646,253 4,453,508 516,361
Real estate activities 15,754,861 15,754,861 0 0 0
Professional, scientific and technical activities 5,601,920 4,584,020 25,456 991,844 600
Administrative and support service activities 5,976,359 5,803,958 57,820 105,346 9,235
Education 99,930,069 97,834,204 106,762 1,885,505 103,598
Human health and social work activities 50,256,418 46,478,515 686 745,217 3,032,000
Arts, entertainment and recreation 7,944,973 7,604,884 17,798 322,291 0
Other service activities 98,265,836 59,467,514 12,313,129 2,642,405 23,842,788

180
Table M.7: Receipts by sub-sector in service sector and region
ISIC Group Total
Receipts for
Services
GH¢
Sales of Goods
in same
condition
GH¢
Other Income
GH¢
Subsidies
and Grants
GH¢
SERVICES -Greater Accra Region 170,053,252,672 112,742,803,398 50,450,843,094 6,701,450,143 158,156,037
Wholesale and retail trade; repair of motor vehicles and
motorcycles 68,917,512,366 17,560,210,291 50,149,324,669 1,199,226,344 8,751,062
Transportation and storage 2,919,968,711 2,731,143,834 136,784,754 49,556,923 2,483,200
Accommodation and food service activities 2,809,819,772 2,754,225,485 11,130,775 41,383,950 3,079,562
Information and communication 8,363,385,028 8,312,721,364 15,715,586 34,948,078 0
Financial and insurance activities 78,018,738,014 72,783,129,551 50,976,923 5,184,497,601 133,939
Real estate activities 755,067,557 721,824,719 13,454,875 19,787,963 0
Professional, scientific and technical activities 1,046,144,704 981,926,665 1,026,049 37,550,452 25,641,538
Administrative and support service activities 691,597,402 643,753,108 3,459,116 41,488,108 2,897,070
Education 5,015,113,317 4,936,066,055 1,433,754 17,979,145 59,634,363
Human health and social work activities 675,649,151 569,687,478 23,518,808 39,128,110 43,314,755
Arts, entertainment and recreation 85,720,546 82,384,909 2,496,018 598,833 240,786
Other service activities 754,536,103 665,729,940 41,521,767 35,304,635 11,979,761

181
Table M.8: Receipts by sub-sector in service sector and region
ISIC Group Total
Receipts for
Services
GH¢
Sales of Goods
in same
condition
GH¢
Other Income
GH¢
Subsidies
and Grants
GH¢
SERVICES -Volta Region 2,232,830,896 507,576,968 1,679,076,928 45,683,272 493,728
Wholesale and retail trade; repair of motor vehicles and
motorcycles 1,655,117,459 26,240,243 1,621,268,746 7,608,470 0
Transportation and storage 11,970,861 11,888,365 9,500 72,996 0
Accommodation and food service activities 183,876,596 173,088,114 10,158,808 629,674 0
Information and communication 21,363,722 5,425,715 15,871,082 65,725 1,200
Financial and insurance activities 105,261,661 71,824,069 710,810 32,721,217 5,565
Real estate activities 229,067 229,067 0 0 0
Professional, scientific and technical activities 12,154,087 11,803,154 217,018 133,915 0
Administrative and support service activities 6,525,014 6,125,038 61,580 337,696 700
Education 79,036,998 77,771,437 900,284 332,938 32,339
Human health and social work activities 45,226,967 44,236,862 80,832 468,925 440,348
Arts, entertainment and recreation 5,760,823 5,615,511 17,503 116,084 11,725
Other service activities 106,307,639 73,329,394 29,780,764 3,195,630 1,851

182
Table M.9: Receipts by sub-sector in service sector and region
ISIC Group Total
Receipts for
Services
GH¢
Sales of
Goods in same
condition
GH¢
Other Income
GH¢
Subsidies
and Grants
GH¢
SERVICES - Eastern Region 3,573,802,338 868,814,627 2,630,102,041 70,733,330 4,152,340
Wholesale and retail trade; repair of motor vehicles and
motorcycles 2,700,084,544 66,050,095 2,592,054,636 41,951,338 28,475
Transportation and storage 24,511,917 6,041,922 18,373,358 84,637 12,000
Accommodation and food service activities 222,438,364 214,862,229 6,549,746 1,026,389 0
Information and communication 6,780,156 4,488,240 859,429 1,432,277 210
Financial and insurance activities 200,401,241 185,750,241 2,266,056 11,680,215 704,729
Real estate activities 1,114,937 1,114,937 0 0 0
Professional, scientific and technical activities 5,389,694 5,163,700 146,987 79,007 0
Administrative and support service activities 4,792,091 4,419,806 55,932 316,353 0
Education 115,140,204 113,554,015 121,947 682,010 782,232
Human health and social work activities 158,956,521 151,375,901 20,628 4,988,096 2,571,896
Arts, entertainment and recreation 4,130,839 3,724,054 291,426 112,828 2,531
Other service activities 130,061,830 112,269,487 9,361,897 8,380,179 50,267

183
Table M.10: Receipts by sub-sector in service sector and region
ISIC Group Total
Receipts for
Services
GH¢
Sales of Goods
in same
condition
GH¢
Other
Income
GH¢
Subsidies
and Grants
GH¢
SERVICES - Ashanti Region 22,534,015,042 5,010,457,783 17,389,736,995 120,257,984 13,562,280
Wholesale and retail trade; repair of motor vehicles and
motorcycles 17,542,499,425 165,040,811 17,322,076,598 54,593,238 788,778
Transportation and storage 103,983,166 102,895,947 232,448 854,771 0
Accommodation and food service activities 563,597,024 544,835,460 6,686,841 2,711,772 9,362,951
Information and communication 33,692,878 30,566,040 2,423,832 699,095 3,911
Financial and insurance activities 2,617,584,150 2,585,443,536 7,203,627 24,161,196 775,791
Real estate activities 5,870,814 5,870,814 0 0 0
Professional, scientific and technical activities 65,407,673 55,770,287 4,759,775 2,708,232 2,169,379
Administrative and support service activities 103,414,432 100,601,119 1,291,951 1,521,362 0
Education 482,969,979 477,241,072 1,720,685 3,861,597 146,625
Human health and social work activities 558,806,859 536,362,537 4,224,900 18,076,735 142,687
Arts, entertainment and recreation 29,306,592 27,781,193 522,317 981,082 22,000
Other service activities 426,882,048 378,048,966 38,594,021 10,088,903 150,158

184
Table M.11: Receipts by sub-sector in service sector and region
ISIC Group Total
Receipts for
Services
GH¢
Sales of Goods
in same
condition
GH¢
Other
Income
GH¢
Subsidies
and Grants
GH¢
SERVICES -Brong Ahafo Region 6,916,620,330 933,035,352 5,767,856,266 210,690,421 5,038,291
Wholesale and retail trade; repair of motor vehicles and
motorcycles 5,962,049,842 45,673,489 5,733,329,356 183,042,167 4,830
Transportation and storage 35,029,742 34,896,857 16,800 116,085 0
Accommodation and food service activities 172,124,262 157,430,734 13,378,031 1,315,497 0
Information and communication 15,469,251 15,255,837 45,096 168,318 0
Financial and insurance activities 231,221,657 211,104,976 5,690,525 14,426,156 0
Real estate activities 54,221 53,931 0 0 290
Professional, scientific and technical activities 7,816,344 6,795,962 315,827 704,555 0
Administrative and support service activities 4,970,061 4,141,044 316,980 509,037 3,000
Education 146,370,369 142,017,729 182,392 3,327,438 842,810
Human health and social work activities 143,304,526 135,315,130 274,070 4,429,338 3,285,988
Arts, entertainment and recreation 15,637,207 15,501,058 18,500 117,649 0
Other service activities 182,572,848 164,848,604 14,288,689 2,534,182 901,373

185
Table M.12: Receipts by sub-sector in service sector and region
ISIC Group Total
Receipts for
Services
GH¢
Sales of Goods
in same
condition
GH¢
Other
Income
GH¢
Subsidies
and Grants
GH¢
SERVICES - Northern Region 4,743,422,658 673,660,179 4,019,447,144 37,029,756 13,285,579
Wholesale and retail trade; repair of motor vehicles and
motorcycles 4,099,056,666 59,080,142 4,013,609,617 26,125,657 241,250
Transportation and storage 11,240,574 9,890,760 1,328,120 21,694 0
Accommodation and food service activities 117,642,400 115,042,139 1,538,452 1,061,809 0
Information and communication 12,431,056 11,975,627 285,717 75,312 94,400
Financial and insurance activities 364,588,979 359,986,162 98,253 4,014,045 490,519
Real estate activities 689,960 686,960 0 3,000 0
Professional, scientific and technical activities 8,716,701 8,268,467 181,835 197,584 68,815
Administrative and support service activities 3,580,214 3,230,138 200,620 149,456 0
Education 30,535,351 28,204,234 402,433 1,519,474 409,210
Human health and social work activities 35,437,400 32,305,066 86,197 2,115,519 930,618
Arts, entertainment and recreation 2,009,575 1,955,163 5,897 48,515 0
Other service activities 57,493,783 43,035,322 1,710,002 1,697,691 11,050,768

186
Table M.13: Receipts by sub-sector in service sector and region
ISIC Group Total
Receipts for
Services
GH¢
Sales of Goods
in same
condition
GH¢
Other
Income
GH¢
Subsidies
and Grants
GH¢
SERVICES - Upper East Region 1,760,939,957 247,329,826 1,442,110,321 65,694,554 5,805,256
Wholesale and retail trade; repair of motor vehicles and
motorcycles 1,381,751,850 11,942,396 1,320,466,034 46,292,889 3,050,531
Transportation and storage 9,445,057 9,428,801 33 16,223 0
Accommodation and food service activities 115,702,700 102,526,717 1,564,175 11,611,808 0
Information and communication 9,328,315 9,008,868 159,099 110,348 50,000
Financial and insurance activities 35,877,594 33,804,583 959,880 1,077,828 35,303
Real estate activities 50,000 50,000 0 0 0
Professional, scientific and technical activities 3,150,241 3,054,139 74,565 21,537 0
Administrative and support service activities 3,072,093 1,734,954 1,023,456 313,683 0
Education 19,417,545 17,885,741 9,167 1,237,637 285,000
Human health and social work activities 37,664,892 35,359,147 120,000 540,581 1,645,164
Arts, entertainment and recreation 4,084,860 4,030,049 1,500 52,471 840
Other service activities 141,394,812 18,504,432 117,732,412 4,419,550 738,418

187
Table M.14: Receipts by sub-sector in service sector and region
ISIC Group Total
Receipts for
Services
GH¢
Sales of Goods in
same condition
GH¢
Other Income
GH¢
Subsidies and
Grants GH¢
SERVICES -Upper West Region 1,673,138,725 659,720,191 1,005,675,718 6,100,449 1,642,367 Wholesale and retail trade; repair of motor vehicles and
motorcycles 1,020,084,072 11,743,219 1,003,427,170 4,886,386 27,297
Transportation and storage 8,567,957 8,564,275 2,576 1,106 0
Accommodation and food service activities 56,773,325 55,838,331 781,592 153,402 0
Information and communication 716,737 633,447 66,040 17,250 0
Financial and insurance activities 538,705,656 538,435,136 480 270,040 0
Real estate activities 0 0 0 0 0
Professional, scientific and technical activities 3,393,070 3,122,460 8,840 9,625 252,145
Administrative and support service activities 1,754,386 1,694,137 17,928 42,321 0
Education 13,961,564 13,185,676 58,972 515,316 201,600
Human health and social work activities 16,357,407 15,278,085 47,964 7,233 1,024,125
Arts, entertainment and recreation 1,020,550 1,012,550 0 2,000 6,000
Other service activities 11,803,998 10,212,874 1,264,155 195,769 131,200

188
Table N.1: Value of fixed asset at the end of year by sub-sector in all the sectors
ISIC Group
Intangible
Assets Land
Other
Construction
and land
Improvements Buildings
Transport and
Equipment
Machinery
and Other
Equipment
Furniture
and Fittings
Other
Tangible
Assets
All Sectors 1,340,061,518 18,064,742,020 7,591,234,933 26,101,058,860 25,277,005,328 95,857,872,954 3,895,882,794 2,243,171,210
Agriculture 2,226,247 48,542,330 12,591,004 188,593,417 340,582,381 9,132,328,530 14,238,510 72,460,818
Agriculture, forestry and fishing 2,226,247 48,542,330 12,591,004 188,593,417 340,582,381 9,132,328,530 14,238,510 72,460,818
Industry 599,382,863 16,067,653,205 6,443,072,876 5,180,301,771 10,811,717,766 83,424,368,217 850,118,252 559,618,975
Mining and quarrying 574,316,277 14,967,498,799 868,020,875 538,384,147 1,872,391,955 50,296,124,140 499,449,609 214,008,911
Manufacturing 11,603,301 234,456,161 3,500,390,558 1,930,724,528 7,660,805,355 23,136,831,978 118,834,487 258,407,065
Electricity, gas, steam and air conditioning 246,763 11,494,985 1,714,686,050 2,397,737,614 252,501,835 7,281,047,332 55,497,535 9,024,090
Water supply; sewerage, waste management 9,613,232 286,981,053 248,723,175 77,724,755 620,156,558 631,512,881 119,128,340 44,459,498
Construction 3,603,289 567,222,208 111,252,218 235,730,727 405,862,063 2,078,851,887 57,208,281 33,719,411
Services 738,452,408 1,948,546,485 1,135,571,053 20,732,163,673 14,124,705,181 3,301,176,207 3,031,526,032 1,611,091,417
Wholesale and retail trade and repair of
motor vehicles and motorcycles 14,254,557 714,882,395 439,497,701 2,347,019,092 1,729,124,151 1,399,027,906 212,204,037 294,562,565
Transportation and storage 8,917,952 54,085,418 42,451,255 608,545,708 1,571,613,014 136,895,512 22,865,310 31,939,183
Accommodation and food service activities 35,812,389 130,639,606 229,288,173 5,100,775,782 1,942,786,515 308,850,979 235,605,694 90,151,795
Information and communication 102,375,104 7,261,733 25,330,819 72,358,660 1,937,902,779 507,608,415 27,977,628 213,397,899
Financial and insurance activities 547,042,871 3,455,135 174,852,490 3,553,260,633 1,116,108,601 251,334,609 1,991,838,152 801,212,759
Real estate activities 2,034,053 164,984,328 49,779,094 201,693,487 18,212,592 14,980,248 8,902,142 10,666,825
Professional, scientific and technical
activities 2,342,996 11,511,157 2,937,710 133,936,847 92,338,289 71,787,070 37,411,805 28,119,980
Administrative and support service activities 5,684,433 23,226,846 15,433,343 112,169,557 3,535,944,781 74,000,362 64,813,419 28,401,871
Education 3,552,927 68,961,947 31,098,830 5,370,534,382 966,090,021 58,849,465 158,983,150 37,913,675
Human health and social work activities 2,676,189 426,256,843 33,770,382 855,535,452 89,558,489 224,338,002 39,900,047 27,722,540
Sports activities and amusement and
recreation activities 1,030,982 11,300,396 345,343 36,224,953 904,231,093 40,465,008 11,134,011 5,283,252
Other service activities 12,727,953 331,980,682 90,785,914 2,340,109,118 220,794,857 213,038,631 219,890,639 41,719,073

189
Table N.2: Value of fixed asset at the end of year by size of businesses in all the sectors
ISIC Group
Intangible
Assets Land
Other
Construction
and land
Improvements Buildings
Transport and
Equipment
Machinery
and Other
Equipment
Furniture
and Fittings
Other
Tangible
Assets
All Sectors 1,340,061,518 18,064,742,020 7,591,234,933 26,101,058,860 25,277,005,328 95,857,872,954 3,895,882,794 2,243,171,210
Agriculture 2,226,247 48,542,330 12,591,004 188,593,417 340,582,381 9,132,328,530 14,238,510 72,460,818
Large-Sized Businesses 310,810 12,629,724 6,550,000 80,705,159 317,208,299 9,071,250,183 10,772,274 65,371,495
Medium-Sized Businesses 1,732,771 9,489,571 3,711,461 23,207,350 4,571,011 34,856,506 409,197 4,037,661
Small-Sized Businesses 110,199 23,073,042 2,202,831 61,419,224 16,689,890 21,552,616 1,368,445 1,136,116
Micro-Sized Businesses 72,468 3,349,992 126,712 23,261,684 2,113,182 4,669,226 1,688,594 1,915,545
Industry 599,382,863 16,067,653,205 6,443,072,876 5,180,301,771 10,811,717,766 83,424,368,217 850,118,252 559,618,975
Large-Sized Businesses 43,555,081 452,265,911 2,429,563,595 1,404,378,585 597,576,412 14,884,149,295 167,515,949 342,476,367
Medium-Sized Businesses 10,649,438 15,403,696,948 3,281,342,244 2,759,275,036 9,660,779,415 48,359,492,011 620,521,131 121,239,261
Small-Sized Businesses 540,971,061 189,163,858 728,225,400 760,355,847 486,212,157 20,070,034,519 46,498,404 91,028,848
Micro-Sized Businesses 4,207,283 22,526,488 3,941,637 256,292,303 67,149,782 110,692,393 15,582,768 4,874,499
Services 738,452,408 1,948,546,485 1,135,571,053 20,732,163,673 14,124,705,181 3,301,176,207 3,031,526,032 1,611,091,417
Large-Sized Businesses 368,358,283 250,010,601 408,267,764 2,485,670,410 5,422,053,879 879,189,265 1,277,798,333 497,748,233
Medium-Sized Businesses 122,976,629 303,512,519 153,049,712 8,474,141,355 2,632,589,020 634,112,472 300,107,679 473,549,064
Small-Sized Businesses 45,471,549 905,676,099 432,209,703 6,470,768,430 4,672,907,350 1,010,521,765 922,981,837 234,793,809
Micro-Sized Businesses 201,645,946 489,347,266 142,043,874 3,301,583,477 1,397,154,932 777,352,705 530,638,183 405,000,312

190
Table N.3: Value of fixed asset at the end of year by sub-sector in all the sectors and region
ISIC Group
Intangible
Assets Land
Other
Construction
and land
Improvements Buildings
Transport and
Equipment
Machinery and
Other
Equipment
Furniture
and Fittings
Other
Tangible
Assets
Western - All Sectors 44,361,549 95,077,695 150,022,510 671,324,811 2,085,840,300 13,159,548,915 133,719,739 176,361,167
Agriculture 67,668 6,591,624 73,800 2,786,761 454,444 6,972,098 164,002 47,800
Agriculture, forestry and fishing 67,668 6,591,624 73,800 2,786,761 454,444 6,972,098 164,002 47,800
Industry 36,434,206 22,626,960 95,302,407 246,057,845 194,417,834 13,002,879,350 54,630,441 141,782,875
Mining and quarrying 34,637,642 741,829 67,350,357 105,530,659 89,623,535 12,036,883,761 31,619,081 114,430,286
Manufacturing 1,743,844 17,592,685 26,251,919 78,814,446 52,170,093 182,902,300 21,842,250 26,823,117
Electricity, gas, steam and air conditioning 17,486 2,266,275 1,686,114 59,146,797 16,192,919 765,505,644 170,477 19,890
Water supply; sewerage, waste management 30,855 0 0 0 27,157,595 223,863 166,099 17,815
Construction 4,379 2,026,171 14,017 2,565,943 9,273,692 17,363,782 832,534 491,767
Services 7,859,675 65,859,111 54,646,303 422,480,205 1,890,968,023 149,697,467 78,925,296 34,530,492
Wholesale and retail trade and repair of
motor vehicles and motorcycles 1,165,075 28,546,281 5,688,591 91,215,663 103,055,123 48,636,251 19,167,485 6,954,283
Transportation and storage 3,422 2,231,937 515,255 28,802,786 1,061,213,497 1,127,957 443,400 2,459,154
Accommodation and food service activities 2,217,387 17,110,914 15,879,660 66,581,627 7,841,161 43,310,736 14,501,980 6,619,549
Information and communication 190,077 1,800,207 2,622,857 4,145,861 1,678,922 9,699,553 1,087,176 1,396,983
Financial and insurance activities 293,242 400,000 3,869 40,531,018 6,775,475 5,068,319 8,898,700 7,475,579
Real estate activities 1,758,690 1,700,000 0 0 496,340 51,099 20,744 19,257
Professional, scientific and technical
activities 180,788 375,190 180,244 498,938 1,586,243 2,088,762 551,228 361,681
Administrative and support service
activities 6,235 176,376 0 478,493 1,772,958 3,175,900 2,221,626 1,890,538
Education 265,020 716,538 16,638,793 59,324,509 685,512,004 755,475 11,768,572 2,933,096
Human health and social work activities 84,261 1,278,351 4,721,295 13,211,739 1,973,109 16,737,252 3,053,943 616,781
Sports activities and amusement and
recreation activities 95,857 7,714 950 165,950 373,033 1,012,595 245,295 220,972
Other service activities 1,599,621 11,515,603 8,394,790 117,523,620 18,690,159 18,033,570 16,965,146 3,582,621

191
Table N.4: Value of fixed asset at the end of year by sub-sector in all the sectors and region
ISIC Group Intangible
Assets Land
Other
Construction
and land
Improvements Buildings
Transport and
Equipment
Machinery
and Other
Equipment
Furniture
and
Fittings
Other
Tangible
Assets
Central - All Sectors 2,445,492 101,846,839 57,708,720 3,610,120,994 2,849,856,619 680,511,810 81,246,663 74,809,107
Agriculture 13,300 7,282,800 282,055 4,761,532 3,268,824 1,055,253 834,743 517,586
Agriculture, forestry and fishing 13,300 7,282,800 282,055 4,761,532 3,268,824 1,055,253 834,743 517,586
Industry 756,488 14,494,224 2,610,309 62,930,952 23,208,234 625,845,304 5,978,490 56,519,275
Mining and quarrying 0 357,500 0 1,240,900 8,153,053 17,707,107 94,299 55,245,020
Manufacturing 709,366 11,433,152 2,339,837 41,140,036 10,860,439 37,626,109 2,005,782 1,234,433
Electricity, gas, steam and air conditioning 0 0 0 12,356,010 120,000 316,907,711 3,423,384 6,720
Water supply; sewerage, waste management 22,000 2,200 0 495,520 198,140 351,029 11,289 600
Construction 25,121 2,701,372 270,471 7,698,486 3,876,602 253,253,348 443,736 32,502
Services 1,675,704 80,069,815 54,816,357 3,542,428,510 2,823,379,561 53,611,253 74,433,430 17,772,246
Wholesale and retail trade and repair of motor
vehicles and motorcycles 243,273 7,507,517 2,736,297 59,062,651 53,697,391 22,600,960 5,445,723 3,376,505
Transportation and storage 95 19,000 42,565 271,914 1,674,640 2,060 68,699 9,442
Accommodation and food service activities 206,323 8,252,120 37,127,925 2,879,812,230 1,805,058,401 10,975,644 21,822,070 2,334,788
Information and communication 13,408 97,688 1,089 909,352 900,169,270 2,251,026 465,526 581,737
Financial and insurance activities 627,674 26,000 1,382,550 24,823,103 3,891,024 2,619,578 3,596,018 2,140,453
Real estate activities 180 10,384,038 10,883 1,094,221 543,500 240,120 190,070 65,608
Professional, scientific and technical activities 400 0 0 284,318 350,457 574,936 211,222 3,010,185
Administrative and support service activities 19,686 10,000 0 528,978 1,215,127 744,743 978,643 842,393
Education 257,175 43,028,556 164,532 252,474,475 10,781,806 806,888 7,072,217 1,362,204
Human health and social work activities 14,393 383,230 373,906 22,004,546 1,033,145 3,688,658 2,552,872 339,217
Sports activities and amusement and recreation
activities 92,641 1,515,200 7,800 582,468 160,739 135,945 137,332 536,113
Other service activities 200,456 8,846,466 12,968,809 300,580,253 44,804,062 8,970,695 31,893,037 3,173,601

192
Table N.5: Value of fixed asset at the end of year by sub-sector in all the sectors and region
ISIC Group
Intangible
Assets Land
Other
Construction
and land
Improvements Buildings
Transport and
Equipment
Machinery
and Other
Equipment
Furniture
and Fittings
Other
Tangible
Assets
Greater Accra - All Sectors 1,249,064,815 17,263,659,015 6,888,397,825 15,411,826,978 6,580,757,883 68,058,423,410 3,133,741,431 1,766,954,137
Agriculture 1,792,923 11,265,719 53,935 54,061,633 312,282,196 9,016,120,533 10,075,082 64,082,845
Agriculture, forestry and fishing 1,792,923 11,265,719 53,935 54,061,633 312,282,196 9,016,120,533 10,075,082 64,082,845
Industry 553,338,558 15,878,671,943 5,986,131,702 3,681,908,825 2,892,425,391 57,062,025,597 693,577,299 321,351,593
Mining and quarrying 535,623,415 14,856,329,900 578,296,665 87,406,843 1,652,517,556 37,637,446,089 440,668,188 24,774,288
Manufacturing 7,704,290 182,267,903 3,439,480,734 1,122,629,493 239,657,327 13,442,702,550 70,191,988 212,799,868
Electricity, gas, steam and air conditioning 226,225 5,747,400 1,712,999,936 2,209,795,919 204,490,352 3,781,365,057 16,993,285 8,988,329
Water supply; sewerage, waste
management 8,127,570 285,593,216 222,844,002 72,289,524 568,735,787 579,087,395 113,515,700 43,076,015
Construction 1,657,059 548,733,524 32,510,365 189,787,047 227,024,368 1,621,424,505 52,208,137 31,713,094
Services 693,933,333 1,373,721,353 902,212,188 11,675,856,520 3,376,050,296 1,980,277,281 2,430,089,050 1,381,519,699
Wholesale and retail trade and repair of
motor vehicles and motorcycles 8,149,042 407,057,123 402,440,446 1,514,961,241 1,349,157,244 658,539,528 135,678,648 258,312,178
Transportation and storage 7,112,145 49,847,663 41,388,920 551,353,676 323,888,729 131,286,414 20,645,349 28,991,379
Accommodation and food service
activities 20,447,302 97,813,459 160,499,664 1,306,260,346 87,602,198 179,985,971 119,386,474 40,206,174
Information and communication 101,612,822 4,321,384 22,305,034 57,065,100 124,298,956 421,633,343 22,385,813 200,384,494
Financial and insurance activities 542,754,418 564,330 164,256,492 3,103,702,618 1,002,758,186 181,730,918 1,871,350,992 752,125,464
Real estate activities 268,836 117,407,690 49,755,611 195,871,285 16,315,286 13,169,095 8,392,769 10,512,568
Professional, scientific and technical
activities 2,000,137 10,976,601 1,505,946 99,316,861 65,501,020 56,212,518 33,776,527 21,682,458
Administrative and support service
activities 5,393,409 21,307,812 15,286,507 102,084,974 127,991,239 51,493,344 49,371,338 19,360,945
Education 1,820,708 13,409,448 1,810,695 3,997,110,214 181,402,772 43,301,744 95,859,656 18,209,269
Human health and social work activities 1,386,305 423,755,421 17,525,494 437,090,904 63,293,143 107,104,315 16,810,763 13,567,565
Sports activities and amusement and
recreation activities 765,078 7,049,586 53,826 7,966,933 2,074,453 35,722,075 9,387,129 2,379,024
Other service activities 2,223,132 220,210,837 25,383,554 303,072,368 31,767,071 100,098,017 47,043,590 15,788,182

193
Table N.6: Value of fixed asset at the end of year by sub-sector in all the sectors and region
ISIC Group
Intangible
Assets Land
Other
Construction
and land
Improvements Buildings
Transport
and
Equipment
Machinery
and Other
Equipment
Furniture
and Fittings
Other
Tangible
Assets
Volta - All Sectors 13,629,548 25,949,003 13,923,681 799,853,125 988,588,984 443,471,853 135,613,144 10,233,003
Agriculture 814 3,553,934 34,689 9,072,020 4,161,348 6,926,662 129,520 201,709
Agriculture, forestry and fishing 814 3,553,934 34,689 9,072,020 4,161,348 6,926,662 129,520 201,709
Industry 1,060,204 3,424,756 6,125,878 63,508,546 34,045,416 373,392,095 31,801,540 917,541
Mining and quarrying 0 35,660 83,310 733,531 1,328,008 2,077,087 51,246 2,684
Manufacturing 34,309 1,959,904 3,057,139 40,212,246 11,238,444 42,594,625 1,722,827 669,073
Electricity, gas, steam and air conditioning 0 0 0 14,480,750 8,096,319 316,990,000 25,647,750 0
Water supply; sewerage, waste management 1,023,608 13,020 5,874 1,331,849 4,723,602 759,651 3,520,927 12,647
Construction 2,287 1,416,173 2,979,555 6,750,169 8,659,042 10,970,732 858,790 233,136
Services 12,568,530 18,970,312 7,763,114 727,272,559 950,382,220 63,153,096 103,682,084 9,113,753
Wholesale and retail trade and repair of motor vehicles and
motorcycles 296,571 3,322,961 2,009,713 82,246,505 17,213,117 25,662,634 7,721,387 1,823,741
Transportation and storage 3,031 29,776 2,077 4,368,420 6,629,037 540,500 153,525 47,364
Accommodation and food service activities 11,121,562 1,540,340 3,695,565 93,385,291 4,516,925 7,145,406 11,337,214 1,133,233
Information and communication 53,727 40,683 6,973 1,209,623 218,878 2,232,205 381,103 416,994
Financial and insurance activities 400,167 19,180 0 6,547,550 1,982,115 2,401,845 1,774,409 2,096,832
Real estate activities 0 105,000 0 8,280 98,500 81,568 29,680 15,855
Professional, scientific and technical activities 378 2,209 13,276 478,496 286,455 1,008,072 192,660 220,289
Administrative and support service activities 498 496,730 13,961 896,127 292,542 1,072,365 509,126 964,280
Education 0 1,466,758 0 66,161,601 9,157,570 2,708,953 13,678,417 1,448,365
Human health and social work activities 95,250 2,400 0 43,959,345 1,885,192 10,003,157 900,018 268,178
Sports activities and amusement and recreation activities 3,571 92,845 85,656 896,816 900,068,852 285,257 93,141 126,829
Other service activities 593,776 11,851,430 1,935,895 427,114,505 8,033,037 10,011,132 66,911,403 551,793

194
Table N.7: Value of fixed asset at the end of year by sub-sector in all the sectors and region
ISIC Group
Intangible
Assets Land
Other
Construction
and land
Improvements Buildings
Transport and
Equipment
Machinery
and Other
Equipment
Furniture
and
Fittings
Other
Tangible
Assets
Eastern - All Sectors 3,709,084 60,665,516 53,934,486 760,804,633 7,416,170,043 769,459,213 61,776,461 23,527,557
Agriculture 1,700 5,852,293 3,986,569 7,433,198 3,474,959 7,689,099 215,199 309,646
Agriculture, forestry and fishing 1,700 5,852,293 3,986,569 7,433,198 3,474,959 7,689,099 215,199 309,646
Industry 565,455 5,886,880 34,746,695 157,021,565 7,286,900,826 679,919,458 9,789,860 5,621,299
Mining and quarrying 14,580 1,467,578 5,102,115 3,074,872 6,352,797 36,179,257 405,587 237,475
Manufacturing 517,954 1,096,407 3,575,657 137,627,042 7,261,269,309 257,981,654 6,316,482 5,146,929
Electricity, gas, steam and air conditioning 0 0 0 14,798,400 6,988,150 380,300,000 2,849,150 460
Water supply; sewerage, waste management 6,023 254,000 25,779,200 1,131,586 1,304,895 912,968 49,222 60,248
Construction 26,899 3,068,896 289,724 389,665 10,985,675 4,545,579 169,419 176,186
Services 3,141,929 48,926,342 15,201,222 596,349,869 125,794,258 81,850,656 51,771,401 17,596,612
Wholesale and retail trade and repair of motor vehicles and
motorcycles 88,148 7,355,157 4,225,202 64,833,421 38,087,160 21,536,028 5,160,348 3,256,813
Transportation and storage 860 6,800 0 813,397 4,064,547 317,321 272,362 22,961
Accommodation and food service activities 476,321 219,260 3,454,314 171,522,891 1,668,136 30,890,484 15,457,990 2,745,677
Information and communication 214,228 61,391 291,774 594,900 4,688,308 3,020,655 348,219 1,447,517
Financial and insurance activities 58,045 485,159 1,559,544 14,130,306 4,575,230 2,698,889 5,175,374 3,576,022
Real estate activities 3,000 31,561,500 10,800 3,923,430 526,639 1,254,674 5,627 5,830
Professional, scientific and technical activities 30,827 0 0 362,387 1,012,612 583,716 215,894 349,228
Administrative and support service activities 3,822 26,196 0 545,180 784,514 957,485 1,002,798 934,724
Education 125,539 2,614,231 1,075,346 145,815,842 12,846,489 2,682,070 5,424,447 2,275,137
Human health and social work activities 3,600 0 455,100 28,206,609 1,512,716 7,055,041 2,897,392 410,940
Sports activities and amusement and recreation activities 5,809 20,125 29,798 1,479,132 71,402 190,313 102,882 173,425
Other service activities 2,131,731 6,576,523 4,099,344 164,122,374 55,956,504 10,663,979 15,708,068 2,398,339

195
Table N.8: Value of fixed asset at the end of year by sub-sector in all the sectors and region
ISIC Group
Intangible
Assets Land
Other
Construction
and land
Improvements Buildings
Transport and
Equipment
Machinery and
Other
Equipment
Furniture
and Fittings
Other
Tangible
Assets
Ashanti - All Sectors 18,244,527 309,048,213 378,734,942 2,996,221,773 3,954,278,495 11,745,592,337 180,655,237 118,877,017
Agriculture 54,626 6,788,829 6,766,657 79,531,163 10,110,603 85,093,624 2,403,094 5,452,705
Agriculture, forestry and fishing 54,626 6,788,829 6,766,657 79,531,163 10,110,603 85,093,624 2,403,094 5,452,705
Industry 4,768,816 14,793,453 309,153,683 812,920,419 210,646,452 11,312,019,017 46,686,931 16,513,019
Mining and quarrying 4,020,281 5,444,982 217,183,508 333,421,591 106,673,820 483,674,057 26,295,123 5,556,473
Manufacturing 726,948 8,133,318 17,132,231 407,725,950 63,404,901 9,034,729,223 10,729,703 9,702,487
Electricity, gas, steam and air conditioning 0 0 0 66,532,048 8,373,780 1,711,065,184 6,392,088 0
Water supply; sewerage, waste management 475 211,429 46,612 348,326 3,055,646 8,923,858 1,502,318 922,550
Construction 21,112 1,003,725 74,791,332 4,892,504 29,138,305 73,626,695 1,767,699 331,509
Services 13,421,085 287,465,930 62,814,602 2,103,770,191 3,733,521,440 348,479,695 131,565,212 96,911,293
Wholesale and retail trade and repair of
motor vehicles and motorcycles 3,203,823 236,609,070 9,636,595 335,118,458 66,867,969 132,290,581 24,123,147 17,843,802
Transportation and storage 1,795,445 1,571,349 501,355 18,889,164 145,391,764 3,449,387 1,077,515 323,379
Accommodation and food service activities 795,615 1,919,782 1,391,958 398,073,791 25,422,686 22,519,178 39,737,606 33,320,337
Information and communication 124,729 510,563 4,950 2,084,000 5,092,511 61,741,560 2,109,417 7,947,407
Financial and insurance activities 658,887 1,721,910 5,560,453 284,612,764 12,231,888 6,204,041 14,947,583 8,120,072
Real estate activities 3,000 3,555,300 0 668,561 143,427 119,553 255,221 31,347
Professional, scientific and technical
activities 49,814 126,956 1,238,244 12,924,200 2,457,701 8,400,209 1,690,863 1,685,100
Administrative and support service activities 230,969 986,876 7,202 5,662,480 3,401,052,286 14,010,350 4,885,557 2,785,865
Education 756,093 5,822,283 9,614,821 553,531,073 22,738,639 4,463,442 14,079,464 4,966,822
Human health and social work activities 415,085 721,500 7,502,419 166,900,187 8,407,450 63,476,537 7,443,037 9,482,807
Sports activities and amusement and
recreation activities 40,635 84,948 166,538 2,684,985 323,550 2,555,958 479,186 479,436
Other service activities 5,346,989 33,835,394 27,190,067 322,620,527 43,391,569 29,248,900 20,736,617 9,924,918

196
Table N.9: Value of fixed asset at the end of year by sub-sector in all the sectors and region
ISIC Group
Intangible
Assets Land
Other
Construction
and land
Improvements Buildings
Transport
and
Equipment
Machinery
and Other
Equipment
Furniture
and
Fittings
Other
Tangible
Assets
Brong Ahafo - All Sectors 3,621,325 151,818,284 25,002,786 1,123,422,851 160,086,411 746,554,903 76,089,483 49,182,023
Agriculture 9,230 6,613,060 1,358,195 28,353,442 5,695,434 4,536,933 299,624 85,898
Agriculture, forestry and fishing 9,230 6,613,060 1,358,195 28,353,442 5,695,434 4,536,933 299,624 85,898
Industry 138,981 112,412,325 240,660 82,362,664 25,310,196 198,666,583 4,565,257 15,736,295
Mining and quarrying 19,141 100,440,820 4,900 768,103 6,296,503 75,978,627 122,526 13,555,675
Manufacturing 42,394 11,739,288 204,521 79,208,800 14,792,317 113,413,664 4,054,703 1,681,248
Electricity, gas, steam and air conditioning 971 0 0 17,100 31,430 0 0 720
Water supply; sewerage, waste management 72,355 109,750 19,087 1,761,719 844,772 4,092,629 69,778 302,344
Construction 4,120 122,467 12,152 606,943 3,345,173 5,181,663 318,250 196,309
Services 3,473,114 32,792,899 23,403,931 1,012,706,745 129,080,781 543,351,387 71,224,602 33,359,830
Wholesale and retail trade and repair of motor vehicles and
motorcycles 722,053 13,812,848 5,840,812 65,725,752 32,306,747 446,055,146 6,157,228 1,473,128
Transportation and storage 800 182,078 900 1,868,323 6,147,000 130,927 63,302 6,825
Accommodation and food service activities 269,189 1,559,857 4,354,244 97,419,152 2,334,444 7,053,993 7,210,046 2,631,681
Information and communication 129,392 215,154 14,185 4,291,135 443,156 4,411,711 705,063 548,276
Financial and insurance activities 928,727 139,512 935,568 27,776,136 15,251,082 44,299,695 29,945,815 15,444,576
Real estate activities 147 110,800 1,800 127,710 32,400 9,909 3,841 11,030
Professional, scientific and technical activities 80,032 0 0 1,108,438 19,805,144 1,486,929 361,232 520,865
Administrative and support service activities 5,159 78,260 110,970 1,112,827 2,207,463 1,293,925 291,667 718,747
Education 298,784 1,578,834 1,570,594 220,319,508 39,606,712 2,774,181 7,162,582 3,648,885
Human health and social work activities 673,974 57,000 2,125,960 52,178,652 3,315,199 6,724,622 3,772,666 2,420,765
Sports activities and amusement and recreation activities 21,317 2,520,779 450 22,085,214 776,764 411,477 597,828 1,262,622
Other service activities 343,541 12,537,777 8,448,447 518,693,897 6,854,670 28,698,872 14,953,333 4,672,430

197
Table N.10: Value of fixed asset at the end of year by sub-sector in all the sectors and region
ISIC Group
Intangible
Assets Land
Other
Construction
and land
Improvements Buildings
Transport
and
Equipment
Machinery
and Other
Equipment
Furniture
and
Fittings
Other
Tangible
Assets
Northern - All Sectors 3,922,679 44,779,278 9,914,033 473,838,528 251,898,957 159,897,284 72,888,295 16,344,997
Agriculture 280,782 186,620 17,100 1,598,338 879,859 3,154,796 95,398 1,747,911
Agriculture, forestry and fishing 280,782 186,620 17,100 1,598,338 879,859 3,154,796 95,398 1,747,911
Industry 1,897,218 12,000,237 531,277 45,055,837 118,203,826 113,544,021 1,707,004 489,112
Mining and quarrying 0 0 0 4,200 0 577 9,900 840
Manufacturing 11,948 91,945 204,877 11,522,493 3,317,074 15,649,687 1,112,480 139,845
Electricity, gas, steam and air conditioning 1,796 3,481,310 0 20,607,390 8,204,728 8,913,136 16,305 4,405
Water supply; sewerage, waste management 24,356 797,439 0 340,328 4,884,653 16,458,082 134,997 38,209
Construction 1,859,118 7,629,543 326,400 12,581,426 101,797,370 72,522,539 433,323 305,813
Services 1,744,679 32,592,421 9,365,656 427,184,353 132,815,273 43,198,467 71,085,892 14,107,974
Wholesale and retail trade and repair of motor vehicles and
motorcycles 145,988 6,767,375 5,617,635 80,298,091 23,988,164 23,700,575 4,717,242 543,652
Transportation and storage 100 34,600 0 764,666 21,321,685 11,246 53,598 14,397
Accommodation and food service activities 59,054 1,636,506 2,125,679 47,726,423 5,120,299 4,401,081 3,946,495 456,150
Information and communication 4,641 206,663 15,757 1,560,189 723,977 1,361,754 317,201 453,381
Financial and insurance activities 1,292,733 51,162 66,497 37,211,551 66,850,587 5,204,596 55,152,530 9,501,034
Real estate activities 200 160,000 0 0 56,500 54,230 3,390 5,080
Professional, scientific and technical activities 620 14,100 0 5,376,669 652,413 415,669 75,811 100,896
Administrative and support service activities 23,650 111,683 1,117 214,122 339,152 594,799 337,686 375,502
Education 1,824 300,000 0 43,728,290 1,788,485 701,078 1,504,945 1,609,491
Human health and social work activities 0 16,917 0 72,635,418 5,311,787 2,811,828 1,220,771 206,986
Sports activities and amusement and recreation activities 5,625 8,000 0 214,911 281,514 93,623 70,006 97,610
Other service activities 210,244 23,285,415 1,538,971 137,454,023 6,380,711 3,847,987 3,686,217 743,795
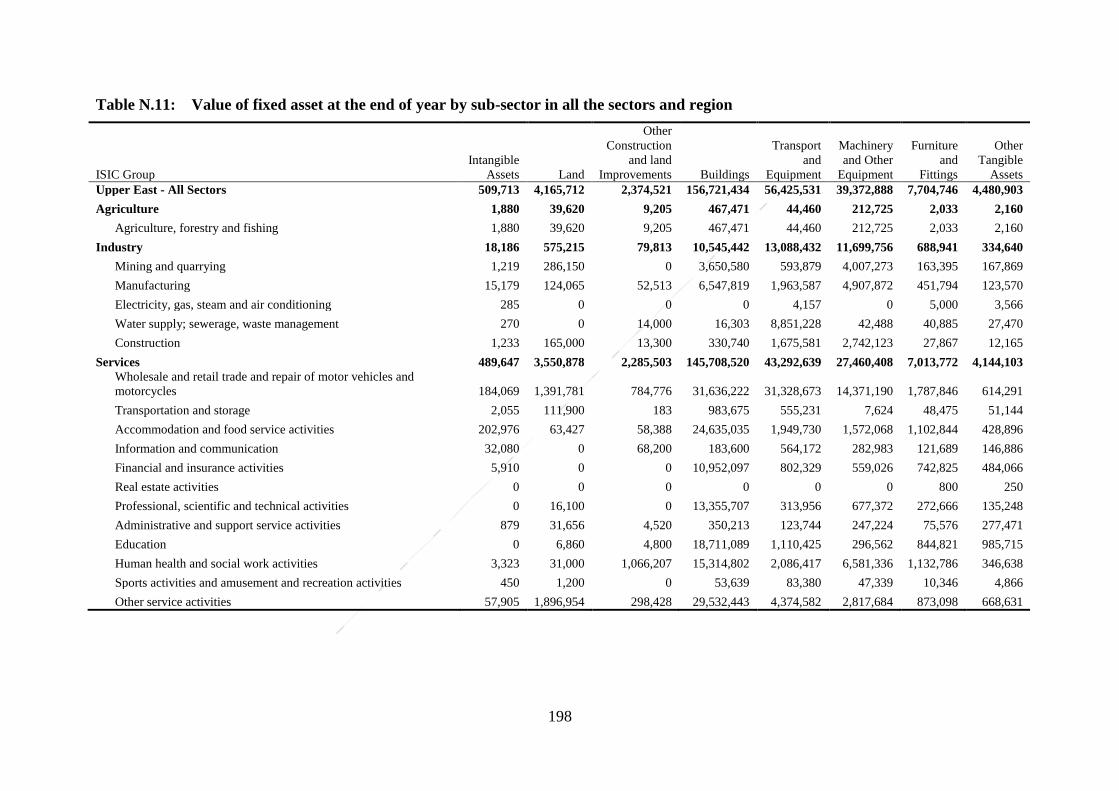
198
Table N.11: Value of fixed asset at the end of year by sub-sector in all the sectors and region
ISIC Group
Intangible
Assets Land
Other
Construction
and land
Improvements Buildings
Transport
and
Equipment
Machinery
and Other
Equipment
Furniture
and
Fittings
Other
Tangible
Assets
Upper East - All Sectors 509,713 4,165,712 2,374,521 156,721,434 56,425,531 39,372,888 7,704,746 4,480,903
Agriculture 1,880 39,620 9,205 467,471 44,460 212,725 2,033 2,160
Agriculture, forestry and fishing 1,880 39,620 9,205 467,471 44,460 212,725 2,033 2,160
Industry 18,186 575,215 79,813 10,545,442 13,088,432 11,699,756 688,941 334,640
Mining and quarrying 1,219 286,150 0 3,650,580 593,879 4,007,273 163,395 167,869
Manufacturing 15,179 124,065 52,513 6,547,819 1,963,587 4,907,872 451,794 123,570
Electricity, gas, steam and air conditioning 285 0 0 0 4,157 0 5,000 3,566
Water supply; sewerage, waste management 270 0 14,000 16,303 8,851,228 42,488 40,885 27,470
Construction 1,233 165,000 13,300 330,740 1,675,581 2,742,123 27,867 12,165
Services 489,647 3,550,878 2,285,503 145,708,520 43,292,639 27,460,408 7,013,772 4,144,103
Wholesale and retail trade and repair of motor vehicles and
motorcycles 184,069 1,391,781 784,776 31,636,222 31,328,673 14,371,190 1,787,846 614,291
Transportation and storage 2,055 111,900 183 983,675 555,231 7,624 48,475 51,144
Accommodation and food service activities 202,976 63,427 58,388 24,635,035 1,949,730 1,572,068 1,102,844 428,896
Information and communication 32,080 0 68,200 183,600 564,172 282,983 121,689 146,886
Financial and insurance activities 5,910 0 0 10,952,097 802,329 559,026 742,825 484,066
Real estate activities 0 0 0 0 0 0 800 250
Professional, scientific and technical activities 0 16,100 0 13,355,707 313,956 677,372 272,666 135,248
Administrative and support service activities 879 31,656 4,520 350,213 123,744 247,224 75,576 277,471
Education 0 6,860 4,800 18,711,089 1,110,425 296,562 844,821 985,715
Human health and social work activities 3,323 31,000 1,066,207 15,314,802 2,086,417 6,581,336 1,132,786 346,638
Sports activities and amusement and recreation activities 450 1,200 0 53,639 83,380 47,339 10,346 4,866
Other service activities 57,905 1,896,954 298,428 29,532,443 4,374,582 2,817,684 873,098 668,631

199
Table N.12: Value of fixed asset at the end of year by sub-sector in all the sectors and region
ISIC Group
Intangible
Assets Land
Other
Construction
and land
Improvements Buildings
Transport
and
Equipment
Machinery
and Other
Equipment
Furniture
and
Fittings
Other
Tangible
Assets
Upper West - All Sectors 552,786 7,732,466 11,221,428 96,923,734 933,102,104 55,040,341 12,447,597 2,401,299
Agriculture 3,325 367,830 8,800 527,859 210,254 566,809 19,814 12,557
Agriculture, forestry and fishing 3,325 367,830 8,800 527,859 210,254 566,809 19,814 12,557
Industry 404,749 2,767,213 8,150,452 17,989,674 13,471,160 44,377,036 692,489 353,325
Mining and quarrying 0 2,394,380 20 2,552,868 852,803 2,170,305 20,264 38,301
Manufacturing 97,069 17,495 8,091,129 5,296,203 2,131,864 4,324,292 406,476 86,495
Electricity, gas, steam and air conditioning 0 0 0 3,200 0 600 96 0
Water supply; sewerage, waste management 305,720 0 14,400 9,600 400,240 20,660,918 117,125 1,600
Construction 1,961 355,338 44,903 10,127,804 10,086,253 17,220,920 148,527 226,930
Services 144,712 4,597,424 3,062,177 78,406,201 919,420,690 10,096,497 11,735,294 2,035,417
Wholesale and retail trade and repair of motor vehicles and
motorcycles 56,516 2,512,282 517,633 21,921,089 13,422,564 5,635,011 2,244,983 364,173
Transportation and storage 0 50,315 0 429,686 726,884 22,076 39,084 13,138
Accommodation and food service activities 16,660 523,941 700,776 15,358,996 1,272,535 996,418 1,102,974 275,310
Information and communication 0 8,000 0 314,900 900,024,630 973,625 56,420 74,223
Financial and insurance activities 23,069 47,881 1,087,517 2,973,489 990,687 547,703 253,906 248,662
Real estate activities 0 0 0 0 0 0 0 0
Professional, scientific and technical activities 0 0 0 230,834 372,288 338,888 63,702 54,029
Administrative and support service activities 126 1,256 9,067 296,163 165,757 410,228 5,139,403 251,406
Education 27,784 18,440 219,250 13,357,781 1,145,119 359,071 1,588,029 474,692
Human health and social work activities 0 11,025 0 4,033,251 740,330 155,255 115,799 62,662
Sports activities and amusement and recreation activities 0 0 325 94,904 17,405 10,426 10,865 2,356
Other service activities 20,557 1,424,284 527,608 19,395,108 542,491 647,795 1,120,128 214,765

200
Table O.1: Disposal of fixed asset by sub-sector in all the sectors
Sector
Assets
Intangible
Assets Land
Other
Construction
and land
Improvements Buildings
Transport
and
Equipment
Machinery
and Other
Equipment
Furniture
and Fittings
Other
Tangible
Assets
All Sectors -National 53,360,007 241,833,614 80,829,587 57,946,683 683,499,029 18,470,729,386 176,866,077 537,443,650
Agriculture, forestry and fishing 25,693 270,182 11,658,941 1,398,375 400,290 662,482 71,515 1,079,962
Agriculture, forestry and fishing 25,693 270,182 11,658,941 1,398,375 400,290 662,482 71,515 1,079,962
Industry 49,439,999 2,390,896 58,877,325 15,119,185 546,871,163 18,432,891,366 152,597,284 186,147,226
Mining and quarrying 49,419,049 325,325 1,854,738 6,054,464 528,995,599 18,374,809,098 149,254,162 148,100,675
Manufacturing 5,000 447,090 43,676,218 1,376,487 9,133,517 25,664,581 1,915,297 37,821,951
Electricity, gas, stream and air conditioning supply 0 0 0 0 1,645,370 5,255,669 0 800
Water supply; sewerage, waste management and
remediation activities 0 0 0 0 487,762 15,084,683 1,326,000 1,426
Construction 15,950 1,618,481 13,346,369 7,688,233 6,608,916 12,077,335 101,825 222,374
Services 3,894,315 239,172,537 10,293,321 41,429,124 136,227,575 37,175,538 24,197,278 350,216,462
Wholesale and retail; repair of motor vehicles and
motorcycles 155,291 1,584,484 2,148,457 493,562 10,009,627 7,135,028 2,638,697 1,070,131
Transportation and storage 505 1,000,080 0 58,319 14,687,292 2,119,591 1,150,238 979,317
Accommodation and food service activities 17,549 2,461,300 0 1,049 1,332,864 805,658 88,371 736,439
Information and communication 3,036,403 0 0 27,294 56,573,011 16,372,491 402,054 116,232,769
Financial and insurance activities 625,890 0 7,332,084 794,903 45,617,215 1,028,623 15,770,149 229,347,016
Real estate activities 0 33,886,019 9,785 3,493,678 257,842 3,000 0 0
Professional, scientific and technical activities 9,579 103,889 0 4,721 2,001,831 7,366,429 40,695 1,427,271
Administrative and support service activities 10,275 206,242 352,704 19,900 1,417,325 649,482 138,255 52,732
Education 579 9,526 450,291 14,151,132 1,438,825 498,507 3,776,609 86,810
Human health and social work activities 2,866 169,533,333 0 21,852,170 642,065 795,054 152,104 62,040
Arts, entertainment and recreation 25 0 0 1,308 49,287 17,284 1,688 33,817
Other service activities 35,352 30,387,664 0 531,088 2,200,391 384,391 38,418 188,119

201
Table O.2: Disposal of fixed asset by size of businesses in all the sectors
Sector
Intangible
Assets Land
Other
Construction
and land
Improvements Buildings
Transport
and
Equipment
Machinery
and Other
Equipment
Furniture
and Fittings
Other
Tangible
Assets
All Sectors - National 53,360,007 241,833,615 80,829,587 57,946,684 683,499,028 18,470,729,386 176,866,077 537,443,650
Agriculture, forestry and fishing 25,693 270,182 11,658,941 1,398,375 400,290 662,482 71,515 1,079,962
Large-Sized Businesses 25,693 0 11,658,941 1,398,375 161,871 660,125 69,365 1,079,962
Medium-Sized Businesses 0 0 0 0 48,804 0 0 0
Small-Sized Businesses 0 270,182 0 0 189,614 2,357 1,950 0
Micro-Sized Businesses 0 0 0 0 1 0 200 0
Industry 49,439,999 2,390,896 58,877,325 15,119,185 546,871,163 18,432,891,366 152,597,284 186,147,226
Large-Sized Businesses 49,419,048 614,825 3,424,675 9,774,915 72,063,632 361,154,447 4,732,723 184,991,125
Medium-Sized Businesses 0 730,900 46,499,963 2,274,122 470,189,186 18,039,640,843 147,517,231 846,250
Small-Sized Businesses 20,951 1,030,174 8,952,687 3,026,003 3,504,227 30,960,739 336,764 287,855
Micro-Sized Businesses 0 14,996 0 44,145 1,114,118 1,135,338 10,566 21,996
Services 3,894,315 239,172,537 10,293,321 41,429,124 136,227,575 37,175,538 24,197,278 350,216,462
Large-Sized Businesses 636,573 731,376 8,413,944 9,585,065 90,452,808 15,914,226 11,854,550 16,985,604
Medium-Sized Businesses 26,541 14,538,560 1,867,092 2,060,009 26,102,674 7,959,031 1,988,977 1,734,115
Small-Sized Businesses 3,180,475 188,909,924 12,285 28,955,863 17,178,670 11,220,412 9,290,118 111,663,280
Micro-Sized Businesses 50,726 34,992,677 0 828,187 2,493,424 2,081,869 1,063,634 219,833,463

202
Table O.3: Disposal of fixed asset by sub-sector in all the sectors and region
Major Sectors/Region
Assets
Intangible
Assets Land
Other
Construction
and land
Improvements Buildings
Transport
and
Equipment
Machinery
and Other
Equipment
Furniture
and Fittings
Other
Tangible
Assets
All sectors -Western Region 49,421,446 48,100 1,569,882 16,050,680 35,946,027 331,944,226 7,467,928 147,588,990
Agriculture, forestry and fishing 0 0 0 0 1 0 200 0
Agriculture, forestry and fishing 0 0 0 0 1 0 200 0
Industry 49,419,048 3,756 1,569,882 6,260,229 35,053,208 331,886,563 3,755,673 147,451,094
Mining and quarrying 49,419,048 0 1,530,877 5,972,464 34,044,594 328,669,993 3,209,627 147,237,220
Manufacturing 0 3,756 39,005 287,765 1,008,614 2,842,544 546,046 213,874
Electricity, gas, steam and air condition 0 0 0 0 0 372,720 0 0
Water supply; sewerage, waste management 0 0 0 0 0 0 0 0
Construction 0 0 0 0 0 1,306 0 0
Services 2,398 44,344 0 9,790,451 892,817 57,663 3,712,055 137,896
Wholesale and retail trade; repair of motor vehicle 0 9,344 0 47 18,800 50,069 1,730 0
Transportation and storage 0 0 0 404 646,000 0 0 24
Accommodation and food service activities 0 15,000 0 0 12,000 0 0 0
Information and communication 2,198 0 0 0 9,751 0 808 1,400
Financial and insurance activities 0 0 0 0 35,595 0 0 105,329
Real estate activities 0 0 0 0 0 0 0 0
Professional, scientific and technical activities 0 0 0 0 0 6,180 600 852
Administrative and support service activities 0 20,000 0 0 30,600 5 71,651 30,291
Education 200 0 0 9,790,000 7,456 0 3,634,800 0
Human health and social work activities 0 0 0 0 0 0 0 0
Arts, entertainment and recreation 0 0 0 0 0 884 0 0
Other service activities 0 0 0 0 132,615 525 2,466 0

203
Table O.4: Disposal of fixed asset by sub-sector in all the sectors and region
Major Sectors/ Region
Assets
Intangible
Assets Land
Other
Construction
and land
Improvements Buildings
Transport
and
Equipment
Machinery
and Other
Equipment
Furniture
and
Fittings
Other
Tangible
Assets
All sectors -Central Region 10,683 3,050,000 0 668,182 876,121 1,003,875 224,437 22,775
Agriculture, forestry and fishing 0 0 0 0 0 0 0 0
Agriculture, forestry and fishing 0 0 0 0 0 0 0 0
Industry 0 0 0 668,182 177,307 964,519 218,987 17,522
Mining and quarrying 0 0 0 0 0 0 3,000 1,650
Manufacturing 0 0 0 0 174,422 809,219 215,987 15,872
Electricity, gas, steam and air condition 0 0 0 0 0 155,300 0 0
Water supply; sewerage, waste management 0 0 0 0 0 0 0 0
Construction 0 0 0 668,182 2,885 0 0 0
Services 10,683 3,050,000 0 0 698,815 39,356 5,450 5,253
Wholesale and retail trade; repair of motive vehicle 0 0 0 0 184,000 0 0 515
Transportation and storage 0 0 0 0 17,700 0 0 0
Accommodation and food service activities 0 0 0 0 0 0 0 2
Information and communication 0 0 0 0 0 2 0 0
Financial and insurance activities 0 0 0 0 0 0 0 0
Real estate activities 0 3,050,000 0 0 0 0 0 0
Professional, scientific and technical activities 0 0 0 0 0 0 0 2,055
Administrative and support service activities 0 0 0 0 0 8,633 2,467 1,950
Education 0 0 0 0 360,640 0 0 0
Human health and social work activities 0 0 0 0 0 0 0 0
Arts, entertainment and recreation 0 0 0 0 0 268 0 731
Other service activities 10,683 0 0 0 136,475 30,453 2,983 0

204
Table O.5: Disposal of fixed asset by sub-sector in all the sectors and region
Major Sectors/ Region
Assets
Intangible
Assets Land
Other
Construction
and land
Improvements Buildings
Transport
and
Equipment
Machinery
and Other
Equipment
Furniture
and Fittings
Other
Tangible
Assets
All sectors -Greater Accra region 3,851,824 235,634,705 71,698,713 33,655,351 609,403,362 17,968,437,953 163,004,211 381,537,011
Agriculture, forestry and fishing 25,693 258,182 11,658,941 1,398,375 129,349 616,869 69,365 1,079,962
Agriculture, forestry and fishing 25,693 258,182 11,658,941 1,398,375 129,349 616,869 69,365 1,079,962
Industry 0 1,564,258 57,230,622 7,276,793 482,278,085 17,933,667,784 148,349,874 38,342,239
Mining and quarrying 0 325,325 323,861 82,000 468,098,305 17,898,942,073 146,039,003 861,805
Manufacturing 0 216,943 43,560,392 793,491 5,971,580 13,319,226 883,046 37,316,254
Electricity, gas, steam and air condition 0 0 0 0 1,604,340 3,547,369 0 800
Water supply; sewerage, waste management 0 0 0 0 233,850 15,074,486 1,326,000 0
Construction 0 1,021,990 13,346,369 6,401,302 6,370,010 2,784,630 101,825 163,380
Services 3,826,131 233,812,265 2,809,150 24,980,183 126,995,928 34,153,301 14,584,973 342,114,809
Wholesale and retail trade; repair of motor
vehicle 155,251 748,487 2,146,957 89,024 6,160,785 6,353,278 2,369,398 1,041,352
Transportation and storage 500 943,830 0 57,915 13,272,534 2,119,591 1,150,237 924,912
Accommodation and food service activities 17,549 2,430,000 0 2 704,500 769,660 75,863 8,002
Information and communication 3,012,771 0 0 2,000 56,561,460 16,197,173 374,757 116,185,433
Financial and insurance activities 625,890 0 298,704 26,961 44,252,695 180,069 10,424,072 222,262,267
Real estate activities 0 29,820,019 9,785 3,493,678 257,842 3,000 0 0
Professional, scientific and technical
activities 9,579 0 0 0 1,800,269 7,333,209 38,906 1,401,206
Administrative and support service activities 1,000 182,242 352,704 0 1,265,036 429,502 12,278 1,980
Education 0 9,526 1,000 68,851 374,528 119,311 66,940 55,308
Human health and social work activities 2,866 169,533,333 0 21,241,654 557,031 466,385 72,072 56,299
Arts, entertainment and recreation 0 0 0 0 49,287 12,049 0 7,875
Other service activities 725 30,144,828 0 98 1,739,961 170,074 450 170,175

205
Table O.6: Disposal of fixed asset by sub-sector in all the sectors and region
Major Sectors/ Region
Assets
Intangible
Assets Land
Other
Construction
and land
Improvements Buildings
Transport
and
Equipment
Machinery
and Other
Equipment
Furniture
and
Fittings
Other
Tangible
Assets
All sectors - Volta region 29,863 647,158 0 303,256 533,926 3,902,224 17,930 51,093
Agriculture, forestry and fishing 0 12,000 0 0 0 0 0 0
Agriculture, forestry and fishing 0 12,000 0 0 0 0 0 0
Industry 0 595,247 0 237,420 275,440 3,845,848 11,848 16,971
Mining and quarrying 0 0 0 0 0 0 0 0
Manufacturing 0 3,818 0 237,420 126,122 3,690,548 11,848 16,407
Electricity, gas, steam and air condition 0 0 0 0 0 155,300 0 0
Water supply; sewerage, waste management 0 0 0 0 0 0 0 0
Construction 0 591,429 0 0 149,318 0 0 564
Services 29,863 39,911 0 65,836 258,486 56,376 6,083 34,123
Wholesale and retail trade; repair of motor vehicle 0 26,111 0 0 10,882 6,643 270 1,271
Transportation and storage 0 0 0 0 20,001 0 0 0
Accommodation and food service activities 0 13,800 0 1,011 74,311 0 0 0
Information and communication 18,884 0 0 0 0 0 0 0
Financial and insurance activities 0 0 0 0 4,823 11,000 0 0
Real estate activities 0 0 0 0 0 0 0 0
Professional, scientific and technical activities 0 0 0 0 138,700 0 0 14,700
Administrative and support service activities 0 0 0 0 0 7,894 5,400 0
Education 379 0 0 0 0 0 0 420
Human health and social work activities 0 0 0 0 0 0 5 0
Arts, entertainment and recreation 0 0 0 4 0 240 399 199
Other service activities 10,600 0 0 64,821 9,769 30,599 9 17,533

206
Table O.7: Disposal of fixed asset by sub-sector in all the sectors and region
Major Sectors/ Region
Assets
Intangible
Assets Land
Other
Construction
and land
Improvements Buildings
Transport
and
Equipment
Machinery
and Other
Equipment
Furniture
and
Fittings
Other
Tangible
Assets
All sectors - Eastern region 65 910,000 0 611,838 4,416,571 3,049,737 375,392 61,651
Agriculture, forestry and fishing 0 0 0 0 32,500 32,406 0 0
Agriculture, forestry and fishing 0 0 0 0 32,500 32,406 0 0
Industry 0 0 0 0 1,473,787 2,657,750 168,760 48,545
Mining and quarrying 0 0 0 0 336 284,484 0 0
Manufacturing 0 0 0 0 1,454,801 2,186,906 168,760 48,545
Electricity, gas, steam and air condition 0 0 0 0 18,650 186,360 0 0
Water supply; sewerage, waste management 0 0 0 0 0 0 0 0
Construction 0 0 0 0 0 0 0 0
Services 65 910,000 0 611,839 2,910,284 359,582 206,632 13,106
Wholesale and retail trade; repair of motor bicycle 40 10,000 0 401 2,079,959 4,817 98,016 10,689
Transportation and storage 0 0 0 0 36,266 0 0 0
Accommodation and food service activities 0 0 0 0 209,514 3,442 0 0
Information and communication 0 0 0 0 200 3,503 288 500
Financial and insurance activities 0 0 0 0 118,639 13,149 7,753 0
Real estate activities 0 900,000 0 0 0 0 0 0
Professional, scientific and technical a 0 0 0 0 0 0 0 100
Administrative and support service activities 0 0 0 0 25,571 880 20,114 504
Education 0 0 0 0 354,422 1,567 0 300
Human health and social work activities 0 0 0 610,516 0 328,669 75,041 0
Arts, entertainment and recreation 25 0 0 503 0 2,755 56 1,013
Other service activities 0 0 0 419 85,713 800 5,364 0

207
Table O.8: Disposal of fixed asset by sub-sector in all the sectors and region
Major Sectors/ Region
Assets
Intangible
Assets Land
Other
Construction
and land
Improvements Buildings
Transport
and
Equipment
Machinery
and Other
Equipment
Furniture
and Fittings
Other
Tangible
Assets
All sectors -Ashanti region 27,581 729,823 7,559,492 4,442,849 29,879,806 160,445,803 5,548,118 5,926,059
Agriculture, forestry and fishing 0 0 0 0 0 2,357 0 0
Agriculture, forestry and fishing 0 0 0 0 0 2,357 0 0
Industry 15,951 221,950 76,821 12 27,027,012 159,571,482 79,908 261,264
Mining and quarrying 1 0 0 0 26,531,454 146,819,174 2,532 0
Manufacturing 0 218,950 76,821 12 217,766 2,622,289 77,376 201,409
Electricity, gas, steam and air condition 0 0 0 0 22,380 838,620 0 0
Water supply; sewerage, waste management 0 0 0 0 253,912 0 0 1,425
Construction 15,950 3,000 0 0 1,500 9,291,399 0 58,430
Services 11,630 507,873 7,482,671 4,442,837 2,852,794 871,964 5,468,210 5,664,795
Wholesale and retail trade; repair of motor 0 347,734 0 100,412 1,089,370 65,597 129,426 0
Transportation and storage 5 56,250 0 0 593,538 0 0 54,340
Accommodation and food service activities 0 0 0 36 17,536 36 286 725,942
Information and communication 2,350 0 0 25,294 0 126,531 21,202 40,195
Financial and insurance activities 0 0 7,033,380 0 578,728 0 5,218,201 4,802,285
Real estate activities 0 0 0 0 0 0 0 0
Professional, scientific and technical a 0 103,889 0 4,721 31,292 7,716 189 5,657
Administrative and support service activities 9,275 0 0 19,900 93,118 202,484 20,800 0
Education 0 0 449,291 4,292,281 341,779 350,178 72,815 30,544
Human health and social work activities 0 0 0 0 29,033 0 4,986 5,741
Arts, entertainment and recreation 0 0 0 102 0 0 5 0
Other service activities 0 0 0 91 78,400 119,422 300 91

208
Table O.9: Disposal of fixed asset by sub-sector in all the Sectors and Region
Major Sectors/ Region
Assets
Intangible
Assets Land
Other
Construction
and land
Improvements Buildings
Transport
and
Equipment
Machinery
and Other
Equipment
Furniture
and
Fittings
Other
Tangible
Assets
All sectors -Brong Ahafo region 18,344 746,589 1,500 70,005 812,313 592,806 71,255 86,906
Agriculture, forestry and fishing 0 0 0 0 155,114 0 0 0
Agriculture, forestry and fishing 0 0 0 0 155,114 0 0 0
Industry 5,000 3,422 0 13 101,119 31,707 5,197 8,777
Mining and quarrying 0 0 0 0 0 0 0 0
Manufacturing 5,000 3,422 0 13 79,919 31,707 5,197 8,777
Electricity, gas, steam and air condition 0 0 0 0 0 0 0 0
Water supply; sewerage, waste management 0 0 0 0 0 0 0 0
Construction 0 0 0 0 21,200 0 0 0
Services 13,344 743,166 1,500 69,992 556,079 561,097 66,057 78,129
Wholesale and retail trade; repair of motor vehicle 0 377,830 1,500 8,784 83,515 460,025 9,623 15,707
Transportation and storage 0 0 0 0 99,653 0 0 41
Accommodation and food service activities 0 2,500 0 0 314,988 0 8,445 2,493
Information and communication 0 0 0 0 1,600 45,282 5,000 5,241
Financial and insurance activities 0 0 0 550 8,025 5,340 28,058 24,700
Real estate activities 0 116,000 0 0 0 0 0 0
Professional, scientific and technical a 0 0 0 0 4,870 2,500 1,001 0
Administrative and support service activities 0 4,000 0 0 3,000 83 5,526 5,737
Education 0 0 0 0 0 27,450 2,053 0
Human health and social work activities 0 0 0 0 36,000 0 0 0
Arts, entertainment and recreation 0 0 0 0 0 488 126 24,000
Other service activities 13,344 242,836 0 60,658 4,428 19,929 6,225 210

209
Table O.10: Disposal of fixed asset by sub-sector in all the sectors and region
Major Sectors/ Region
Assets
Intangible
Assets Land
Other
Construction
and land
Improvements Buildings
Transport
and
Equipment
Machinery
and Other
Equipment
Furniture
and
Fittings
Other
Tangible
Assets
All sectors -Northern region 0 61,977 0 1,427,007 910,539 1,215,824 141,842 2,160,610
Agriculture, forestry and fishing 0 0 0 0 83,326 10,850 1,950 0
Agriculture, forestry and fishing 0 0 0 0 83,326 10,850 1,950 0
Industry 0 0 0 43,306 41,122 138,826 6,381 0
Mining and quarrying 0 0 0 0 0 0 0 0
Manufacturing 0 0 0 43,306 41,122 128,629 6,381 0
Electricity, gas, steam and air condition 0 0 0 0 0 0 0 0
Water supply; sewerage, waste management 0 0 0 0 0 10,197 0 0
Construction 0 0 0 0 0 0 0 0
Services 0 61,977 0 1,383,700 786,092 1,066,148 133,511 2,160,610
Wholesale and retail trade; repair of motor vehicle 0 61,977 0 294,893 136,203 193,580 27,094 598
Transportation and storage 0 0 0 0 1,600 0 0 0
Accommodation and food service activities 0 0 0 0 15 32,520 0 0
Information and communication 0 0 0 0 0 0 0 0
Financial and insurance activities 0 0 0 683,165 618,711 819,065 84,680 2,152,434
Real estate activities 0 0 0 0 0 0 0 0
Professional, scientific and technical activities 0 0 0 0 7,500 8,000 0 0
Administrative and support service activities 0 0 0 0 0 0 15 7,230
Education 0 0 0 0 0 0 0 237
Human health and social work activities 0 0 0 0 20,000 0 0 0
Arts, entertainment and recreation 0 0 0 700 0 400 1,100 0
Other service activities 0 0 0 404,942 2,063 12,583 20,622 111

210
Table O.11: Disposal of fixed asset by sub-sector in all the sectors and region
Major Sectors/ Region
Assets
Intangible
Assets Land
Other
Construction
and land
Improvements Buildings
Transport
and
Equipment
Machinery
and Other
Equipment
Furniture
and
Fittings
Other
Tangible
Assets
All sectors -Upper East region 0 3,000 0 84,366 194,818 11,489 447 2,701
Agriculture, forestry and fishing 0 0 0 0 0 0 0 0
Agriculture, forestry and fishing 0 0 0 0 0 0 0 0
Industry 0 0 0 80 119,236 3,440 440 1
Mining and quarrying 0 0 0 0 118,326 0 0 0
Manufacturing 0 0 0 80 910 3,440 440 0
Electricity, gas, steam and air condition 0 0 0 0 0 0 0 0
Water supply; sewerage, waste management 0 0 0 0 0 0 0 1
Construction 0 0 0 0 0 0 0 0
Services 0 3,000 0 84,285 75,582 8,049 7 2,700
Wholesale and retail trade; repair of motor vehicle 0 3,000 0 0 58,949 20 0 0
Transportation and storage 0 0 0 0 0 0 1 0
Accommodation and food service activities 0 0 0 0 0 0 0 0
Information and communication 0 0 0 0 0 0 0 0
Financial and insurance activities 0 0 0 84,226 0 0 0 0
Real estate activities 0 0 0 0 0 0 0 0
Professional, scientific and technical a 0 0 0 0 9,200 7,824 0 2,700
Administrative and support service activities 0 0 0 0 0 0 3 0
Education 0 0 0 0 0 0 0 0
Human health and social work activities 0 0 0 0 0 0 0 0
Arts, entertainment and recreation 0 0 0 0 0 200 3 0
Other service activities 0 0 0 59 7,433 5 0 0

211
Table O.12: Disposal of fixed asset by sub-sector in all the sectors and region
Major Sectors/Region
Assets
Intangible
Assets Land
Other
Construction
and land
Improvements Buildings
Transport
and
Equipment
Machinery
and Other
Equipment
Furniture
and
Fittings
Other
Tangible
Assets
All sectors -Upper West region 200 2,263 0 633,150 525,545 125,448 14,517 5,853
Agriculture 0 0 0 0 0 0 0 0
Agriculture, forestry and fishing 0 0 0 0 0 0 0 0
Industry 0 2,263 0 633,150 324,846 123,447 214 813
Mining and quarrying 0 0 0 0 202,584 93,374 0 0
Manufacturing 0 200 0 14,400 58,259 30,073 214 813
Electricity, gas, steam and air condition 0 0 0 0 0 0 0 0
Water supply; sewerage, waste management 0 0 0 0 0 0 0 0
Construction 0 2,063 0 618,750 64,003 0 0 0
Services 200 0 0 0 200,699 2,001 14,302 5,040
Wholesale and retail trade; repair of motor vehicle 0 0 0 0 187,165 1,000 3,141 0
Transportation and storage 0 0 0 0 0 0 0 0
Accommodation and food service activities 0 0 0 0 0 0 3,776 0
Information and communication 200 0 0 0 0 0 0 0
Financial and insurance activities 0 0 0 0 0 0 7,385 0
Real estate activities 0 0 0 0 0 0 0 0
Professional, scientific and technical a 0 0 0 0 10,000 1,000 0 0
Administrative and support service activities 0 0 0 0 0 0 0 5,040
Education 0 0 0 0 0 0 0 0
Human health and social work activities 0 0 0 0 0 0 0 0
Arts, entertainment and recreation 0 0 0 0 0 0 0 0
Other service activities 0 0 0 0 3,534 1 0 0
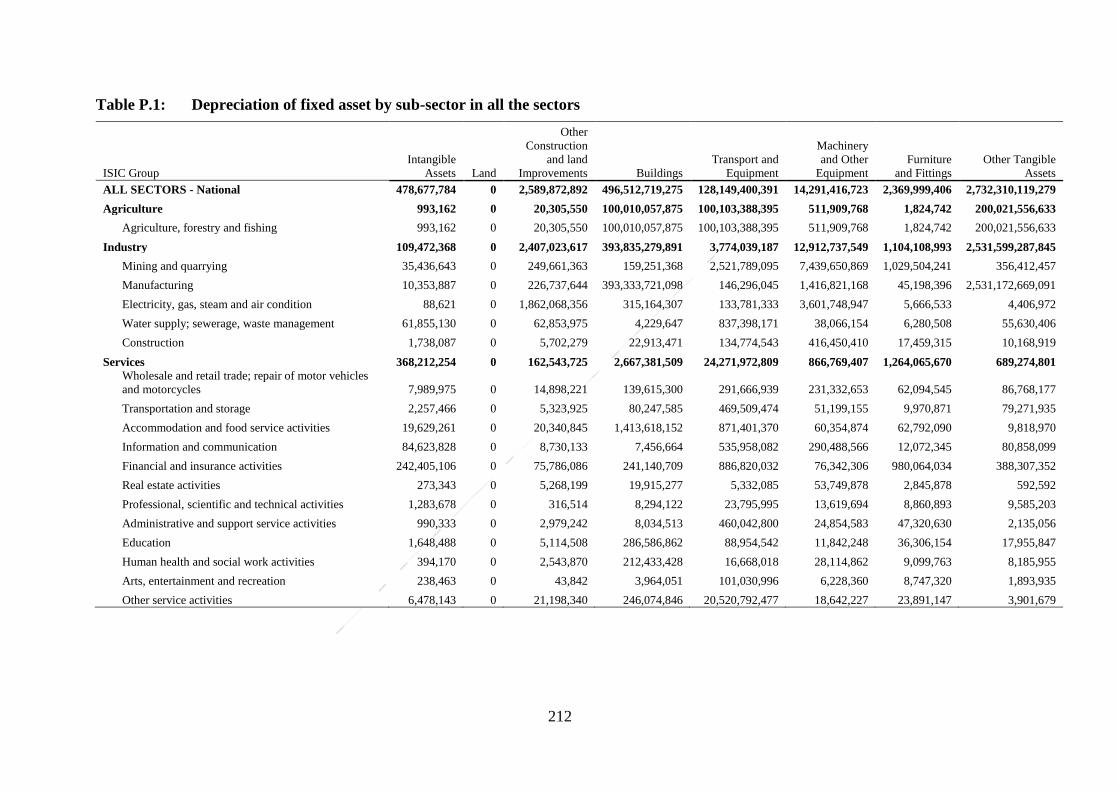
212
Table P.1: Depreciation of fixed asset by sub-sector in all the sectors
ISIC Group
Intangible
Assets Land
Other
Construction
and land
Improvements Buildings
Transport and
Equipment
Machinery
and Other
Equipment
Furniture
and Fittings
Other Tangible
Assets
ALL SECTORS - National 478,677,784 0 2,589,872,892 496,512,719,275 128,149,400,391 14,291,416,723 2,369,999,406 2,732,310,119,279
Agriculture 993,162 0 20,305,550 100,010,057,875 100,103,388,395 511,909,768 1,824,742 200,021,556,633
Agriculture, forestry and fishing 993,162 0 20,305,550 100,010,057,875 100,103,388,395 511,909,768 1,824,742 200,021,556,633
Industry 109,472,368 0 2,407,023,617 393,835,279,891 3,774,039,187 12,912,737,549 1,104,108,993 2,531,599,287,845
Mining and quarrying 35,436,643 0 249,661,363 159,251,368 2,521,789,095 7,439,650,869 1,029,504,241 356,412,457
Manufacturing 10,353,887 0 226,737,644 393,333,721,098 146,296,045 1,416,821,168 45,198,396 2,531,172,669,091
Electricity, gas, steam and air condition 88,621 0 1,862,068,356 315,164,307 133,781,333 3,601,748,947 5,666,533 4,406,972
Water supply; sewerage, waste management 61,855,130 0 62,853,975 4,229,647 837,398,171 38,066,154 6,280,508 55,630,406
Construction 1,738,087 0 5,702,279 22,913,471 134,774,543 416,450,410 17,459,315 10,168,919
Services 368,212,254 0 162,543,725 2,667,381,509 24,271,972,809 866,769,407 1,264,065,670 689,274,801
Wholesale and retail trade; repair of motor vehicles
and motorcycles 7,989,975 0 14,898,221 139,615,300 291,666,939 231,332,653 62,094,545 86,768,177
Transportation and storage 2,257,466 0 5,323,925 80,247,585 469,509,474 51,199,155 9,970,871 79,271,935
Accommodation and food service activities 19,629,261 0 20,340,845 1,413,618,152 871,401,370 60,354,874 62,792,090 9,818,970
Information and communication 84,623,828 0 8,730,133 7,456,664 535,958,082 290,488,566 12,072,345 80,858,099
Financial and insurance activities 242,405,106 0 75,786,086 241,140,709 886,820,032 76,342,306 980,064,034 388,307,352
Real estate activities 273,343 0 5,268,199 19,915,277 5,332,085 53,749,878 2,845,878 592,592
Professional, scientific and technical activities 1,283,678 0 316,514 8,294,122 23,795,995 13,619,694 8,860,893 9,585,203
Administrative and support service activities 990,333 0 2,979,242 8,034,513 460,042,800 24,854,583 47,320,630 2,135,056
Education 1,648,488 0 5,114,508 286,586,862 88,954,542 11,842,248 36,306,154 17,955,847
Human health and social work activities 394,170 0 2,543,870 212,433,428 16,668,018 28,114,862 9,099,763 8,185,955
Arts, entertainment and recreation 238,463 0 43,842 3,964,051 101,030,996 6,228,360 8,747,320 1,893,935
Other service activities 6,478,143 0 21,198,340 246,074,846 20,520,792,477 18,642,227 23,891,147 3,901,679

213
Table P.2: Depreciation of fixed asset by size of businesses in all the sectors
ISIC Group
Intangible
Assets land
Other
Construction
and land
Improvements Buildings
Transport and
Equipment
Machinery
and Other
Equipment
Furniture
and Fittings
Other Tangible
Assets
ALL SECTORS - National 478,677,784 0 2,589,872,892 496,512,719,275 128,149,400,391 14,291,416,723 2,369,999,406 2,732,310,119,279
Large-Sized Businesses 218,406,039 0 2,030,442,054 917,614,924 1,822,008,491 5,655,230,002 786,449,445 924,885,822
Medium-Sized Businesses 46,575,014 0 251,100,033 494,037,027,159 103,877,992,997 7,397,651,022 1,175,674,219 200,110,773,609
Small-Sized Businesses 116,539,116 0 293,940,940 1,349,454,761 21,626,925,878 1,184,448,029 251,017,449 2,531,164,049,838
Micro-Sized Businesses 97,157,615 0 14,389,864 208,622,431 822,473,025 54,087,670 156,858,293 110,410,010
Agriculture 993,162 0 20,305,550 100,010,057,875 100,103,388,395 511,909,768 1,824,742 200,021,556,633
Large-Sized Businesses 165,371 0 19,085,844 5,243,695 84,976,852 501,169,803 1,179,994 17,732,967
Medium-Sized Businesses 814,686 0 751,952 100,001,876,958 100,001,452,275 6,069,966 188,587 200,001,320,664
Small-Sized Businesses 9,201 0 429,301 2,257,960 16,592,224 4,090,813 270,952 747,536
Micro-Sized Businesses 3,904 0 38,453 679,262 367,043 579,186 185,210 1,755,466
Industry 109,472,368 0 2,407,023,617 393,835,279,891 3,774,039,187 12,912,737,549 1,104,108,993 2,531,599,287,845
Large-Sized Businesses 16,229,014 0 1,946,232,846 483,091,859 475,942,721 4,751,463,447 115,806,900 526,518,825
Medium-Sized Businesses 5,716,580 0 231,263,580 393,308,824,988 3,180,453,497 7,166,530,971 972,631,229 23,163,197
Small-Sized Businesses 87,339,938 0 229,077,042 36,419,594 100,760,694 985,808,459 12,128,840 2,531,047,526,523
Micro-Sized Businesses 186,836 0 450,149 6,943,450 16,882,275 8,934,672 3,542,024 2,079,300
Services 368,212,254 0 162,543,725 2,667,381,509 24,271,972,809 866,769,407 1,264,065,670 689,274,801
Large-Sized Businesses 202,011,654 0 65,123,365 429,279,370 1,261,088,918 402,596,751 669,462,552 380,634,029
Medium-Sized Businesses 40,043,748 0 19,084,502 726,325,213 696,087,224 225,050,085 202,854,403 86,289,749
Small-Sized Businesses 29,189,977 0 64,434,596 1,310,777,207 21,509,572,961 194,548,758 238,617,657 115,775,779
Micro-Sized Businesses 96,966,875 0 13,901,262 200,999,720 805,223,707 44,573,812 153,131,059 106,575,244

214
Table Q.1: Gross additions to fixed asset (purchases of fixed assets) by sub-sector in all the sectors
Sector
Intangible
Assets Land
Other
Construction
and land
Improvements Buildings
Transport and
Equipment
Machinery and
Other Equipment
Furniture and
Fittings
Other
Tangible
Assets
ALL SECTORS - National 432,552,373 356,945,105 2,818,917,141 2,284,239,503 3,592,936,865 20,592,125,872 1,704,801,587 1,128,616,733
Agriculture 31,727 1,427,854 700,507 5,771,471 11,528,529 54,666,400 10,365,012 63,145,725
Agriculture, forestry and fishing 31,727 1,427,854 700,507 5,771,471 11,528,529 54,666,400 10,365,012 63,145,725
Industry 68,245,069 189,168,104 2,490,310,284 631,662,438 2,600,088,383 19,248,388,787 667,568,600 180,161,199
Mining and quarrying 63,349,023 4,101,545 61,517,720 102,955,541 2,130,187,033 14,265,281,248 476,672,373 28,009,989
Manufacturing 3,979,128 36,825,559 1,661,883,586 369,485,672 163,433,001 744,454,543 31,729,505 92,010,134
Electricity, gas, steam and air conditioning
supply 55,951 1,275,780 506,400,000 144,505,660 107,209,847 2,594,422,905 23,097,497 10,242,808
Water supply; sewerage, waste management 63,401 128,953,475 251,578,965 5,538,552 124,414,305 203,408,303 114,492,278 36,585,764
Construction 797,566 18,011,745 8,930,013 9,177,012 74,844,197 1,440,821,788 21,576,946 13,312,504
Services 364,275,577 166,349,147 327,906,350 1,646,805,594 981,319,953 1,289,070,685 1,026,867,975 885,309,809
Wholesale and retail trade and repair of motor
vehicles and motorcycles 5,609,231 101,441,806 181,697,390 336,297,167 365,321,713 761,817,701 66,214,985 108,057,557
Transportation and storage 5,955,255 3,650,855 10,750,043 20,517,799 94,202,324 19,437,744 6,733,664 6,316,096
Accommodation and food service activities 2,856,753 4,920,141 61,508,339 323,454,081 26,452,255 49,147,863 29,290,195 7,908,054
Information and communication 50,368,772 634,206 1,018,136 11,919,925 82,936,902 248,299,645 4,740,962 138,856,771
Financial and insurance activities 289,550,089 618,327 32,537,262 746,551,579 259,385,632 81,919,714 846,718,420 573,674,818
Real estate activities 78,588 30,514,131 190,929 23,106,730 5,330,748 2,724,262 1,879,623 5,429,859
Professional, scientific and technical activities 423,074 152,012 1,976,531 27,090,070 17,417,279 15,688,297 7,426,447 8,110,366
Administrative and support service activities 1,610,350 3,784,115 15,527,695 45,138,589 68,859,564 22,402,269 11,258,040 10,317,370
Education 1,517,714 1,465,515 5,880,288 46,444,043 20,643,130 12,601,299 21,366,694 9,910,458
Human health and social work activities 321,281 66,710 2,639,732 31,920,933 8,206,367 25,421,221 7,318,923 7,525,846
Arts, entertainment and recreation 386,268 10,357 89,185 426,122 1,120,194 7,989,466 5,477,375 978,694
Other service activities 5,598,202 19,090,971 14,090,819 33,938,556 31,443,845 41,621,203 18,442,646 8,223,920

215
Table Q.2: Gross additions (purchases) to fixed asset by size of businesses in all the sectors
Sector
Intangible
Assets Land
Other
Construction
and land
Improvements Buildings
Transport
and
Equipment
Machinery
and Other
Equipment
Furniture
and Fittings
Other
Tangible
Assets
ALL SECTORS - National 432,552,373 356,945,105 2,818,917,141 2,284,239,503 3,592,936,865 20,592,125,872 1,704,801,587 1,128,616,733
Agriculture 31,727 1,427,854 700,507 5,771,471 11,528,529 54,666,400 10,365,012 63,145,725
Large-Sized Businesses 10,684 444,654 0 1,994,916 3,703,188 49,925,051 10,184,372 60,503,480
Medium-Sized Businesses 0 13,500 950 20,000 1,293,322 2,564,857 24,803 1,919,331
Small-Sized Businesses 21,043 918,200 610,257 2,365,358 6,462,385 2,066,381 150,851 576,983
Micro-Sized Businesses 0 51,500 89,300 1,391,196 69,634 110,111 4,986 145,932
Industry 68,245,069 189,168,104 2,490,310,284 631,662,438 2,600,088,383 19,248,388,787 667,568,600 180,161,199
Large-Sized Businesses 64,684,041 152,338,743 827,517,507 297,199,081 247,763,890 6,300,497,116 45,189,894 120,090,199
Medium-Sized Businesses 2,449,961 11,356,114 1,612,399,760 263,147,328 2,222,294,979 12,399,427,040 607,558,695 20,743,031
Small-Sized Businesses 658,160 24,302,615 50,191,987 56,342,898 114,434,209 516,618,480 11,779,492 37,815,061
Micro-Sized Businesses 452,907 1,170,632 201,030 14,973,131 15,595,306 31,846,152 3,040,519 1,512,907
Services 364,275,577 166,349,147 327,906,350 1,646,805,594 981,319,953 1,289,070,685 1,026,867,975 885,309,809
Large-Sized Businesses 142,636,413 21,625,184 159,398,818 424,088,372 438,430,630 326,527,979 647,428,229 187,064,636
Medium-Sized Businesses 31,912,088 54,824,457 28,427,662 338,166,701 213,062,659 164,122,143 78,352,836 200,190,861
Small-Sized Businesses 13,210,068 67,748,334 128,044,143 379,508,648 268,900,070 291,202,107 103,991,422 144,889,809
Micro-Sized Businesses 176,517,007 22,151,171 12,035,726 505,041,873 60,926,594 507,218,456 197,095,488 353,164,504
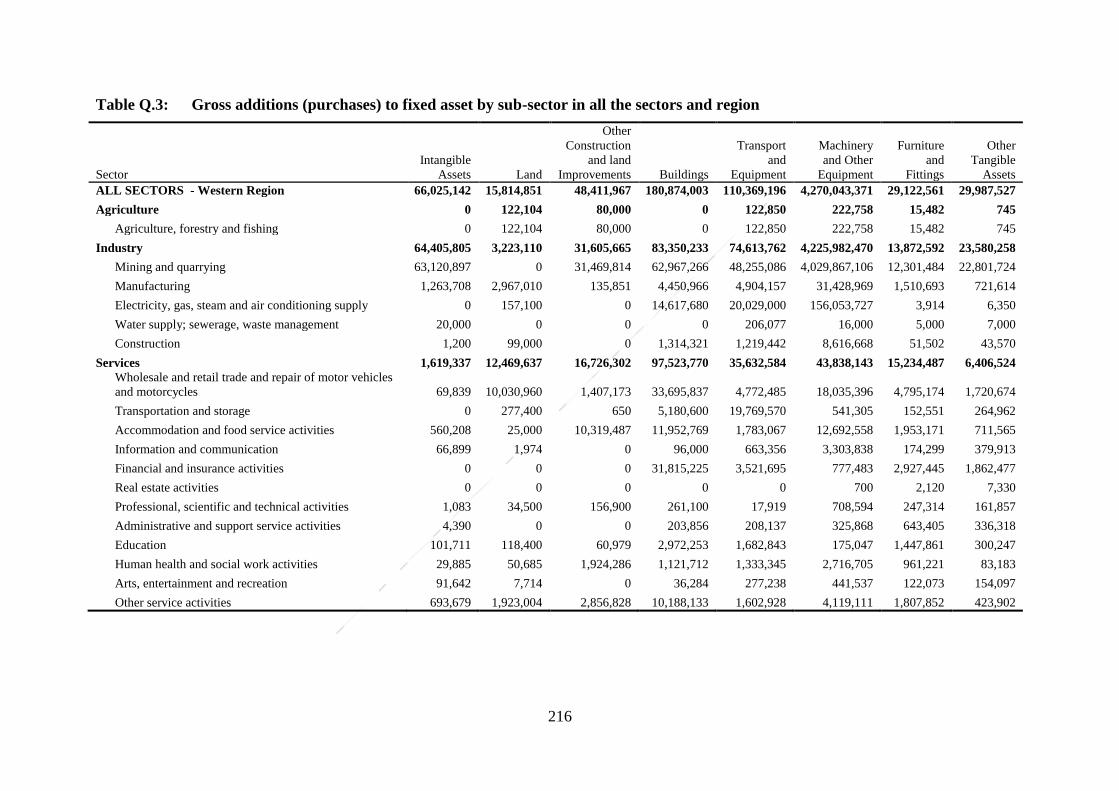
216
Table Q.3: Gross additions (purchases) to fixed asset by sub-sector in all the sectors and region
Sector
Intangible
Assets Land
Other
Construction
and land
Improvements Buildings
Transport
and
Equipment
Machinery
and Other
Equipment
Furniture
and
Fittings
Other
Tangible
Assets
ALL SECTORS - Western Region 66,025,142 15,814,851 48,411,967 180,874,003 110,369,196 4,270,043,371 29,122,561 29,987,527
Agriculture 0 122,104 80,000 0 122,850 222,758 15,482 745
Agriculture, forestry and fishing 0 122,104 80,000 0 122,850 222,758 15,482 745
Industry 64,405,805 3,223,110 31,605,665 83,350,233 74,613,762 4,225,982,470 13,872,592 23,580,258
Mining and quarrying 63,120,897 0 31,469,814 62,967,266 48,255,086 4,029,867,106 12,301,484 22,801,724
Manufacturing 1,263,708 2,967,010 135,851 4,450,966 4,904,157 31,428,969 1,510,693 721,614
Electricity, gas, steam and air conditioning supply 0 157,100 0 14,617,680 20,029,000 156,053,727 3,914 6,350
Water supply; sewerage, waste management 20,000 0 0 0 206,077 16,000 5,000 7,000
Construction 1,200 99,000 0 1,314,321 1,219,442 8,616,668 51,502 43,570
Services 1,619,337 12,469,637 16,726,302 97,523,770 35,632,584 43,838,143 15,234,487 6,406,524
Wholesale and retail trade and repair of motor vehicles
and motorcycles 69,839 10,030,960 1,407,173 33,695,837 4,772,485 18,035,396 4,795,174 1,720,674
Transportation and storage 0 277,400 650 5,180,600 19,769,570 541,305 152,551 264,962
Accommodation and food service activities 560,208 25,000 10,319,487 11,952,769 1,783,067 12,692,558 1,953,171 711,565
Information and communication 66,899 1,974 0 96,000 663,356 3,303,838 174,299 379,913
Financial and insurance activities 0 0 0 31,815,225 3,521,695 777,483 2,927,445 1,862,477
Real estate activities 0 0 0 0 0 700 2,120 7,330
Professional, scientific and technical activities 1,083 34,500 156,900 261,100 17,919 708,594 247,314 161,857
Administrative and support service activities 4,390 0 0 203,856 208,137 325,868 643,405 336,318
Education 101,711 118,400 60,979 2,972,253 1,682,843 175,047 1,447,861 300,247
Human health and social work activities 29,885 50,685 1,924,286 1,121,712 1,333,345 2,716,705 961,221 83,183
Arts, entertainment and recreation 91,642 7,714 0 36,284 277,238 441,537 122,073 154,097
Other service activities 693,679 1,923,004 2,856,828 10,188,133 1,602,928 4,119,111 1,807,852 423,902

217
Table Q.4: Gross additions (purchases) to fixed asset by sub-sector in all the sectors and region
Sector
Intangible
Assets Land
Other
Construction
and land
Improvements Buildings
Transport
and
Equipment
Machinery
and Other
Equipment
Furniture
and
Fittings
Other
Tangible
Assets
ALL SECTORS - Central Region 371,954 6,192,179 2,627,132 25,947,205 14,703,009 269,813,741 8,213,753 3,802,356
Agriculture 0 144,433 300 109,064 99,430 137,009 22,646 114,504
Agriculture, forestry and fishing 0 144,433 300 109,064 99,430 137,009 22,646 114,504
Industry 50,436 1,767,260 65,195 7,108,029 6,851,741 257,453,644 2,195,534 628,921
Mining and quarrying 0 0 0 0 150,000 109,443 2,529 0
Manufacturing 22,936 1,682,463 59,089 3,384,602 5,748,401 6,786,365 632,648 623,518
Electricity, gas, steam and air conditioning supply 0 0 0 3,045,350 0 64,878,458 1,434,320 0
Water supply; sewerage, waste management 27,500 0 0 4,000 0 6,530 6,188 0
Construction 0 84,797 6,106 674,077 953,341 185,672,847 119,850 5,403
Services 321,518 4,280,486 2,561,637 18,730,112 7,751,838 12,223,088 5,995,573 3,058,931
Wholesale and retail trade and repair of motor vehicles
and motorcycles 34,928 1,871,829 1,842,914 4,904,620 4,369,550 8,494,639 1,232,606 570,254
Transportation and storage 0 0 40,000 8,575 160,000 0 2,910 0
Accommodation and food service activities 35,352 521,752 357,400 2,123,174 25,000 801,324 983,397 27,003
Information and communication 906 1,500 0 180,680 21,000 683,945 27,884 95,116
Financial and insurance activities 0 3,500 126,047 252,024 946,991 403,015 847,891 909,587
Real estate activities 0 1,199,038 803 0 80,000 83,400 103,282 51,073
Professional, scientific and technical activities 0 0 0 33,400 35,000 39,837 85,353 56,906
Administrative and support service activities 500 10,000 0 2,500 174,110 179,598 235,124 301,987
Education 148,540 6,000 60,192 6,244,044 1,869,187 84,101 1,407,994 207,098
Human health and social work activities 0 0 0 1,432,467 30,000 58,925 259,858 78,635
Arts, entertainment and recreation 9,459 0 7,800 36,286 0 51,289 19,777 96,123
Other service activities 91,834 666,867 126,480 3,512,343 41,000 1,343,015 789,497 665,150

218
Table Q.5: Gross additions (purchases) to fixed asset by sub-sector in all the sectors and region
Sector
Intangible
Assets Land
Other
Construction
and land
Improvements Buildings
Transport
and
Equipment
Machinery
and Other
Equipment
Furniture
and Fittings
Other
Tangible
Assets
ALL SECTORS - Greater Accra Region 357,672,888 290,652,115 2,722,184,869 1,503,172,215 3,179,360,643 14,713,311,695 1,575,919,120 1,053,415,053
Agriculture 10,684 387,273 0 390,093 2,387,397 4,314,820 8,208,540 59,778,069
Agriculture, forestry and fishing 10,684 387,273 0 390,093 2,387,397 4,314,820 8,208,540 59,778,069
Industry 3,179,579 173,428,392 2,443,861,368 364,038,569 2,394,557,922 13,993,089,354 628,529,395 152,938,148
Mining and quarrying 5,931 3,962,238 27,414,484 6,483,794 2,035,945,489 10,121,892,769 464,134,797 4,953,335
Manufacturing 2,332,882 22,793,235 1,650,650,771 241,969,178 130,900,235 589,446,022 24,285,314 88,414,844
Electricity, gas, steam and air conditioning supply 55,501 1,110,600 506,400,000 103,697,970 51,622,093 1,872,191,005 6,883,923 10,236,458
Water supply; sewerage, waste management 0 128,189,275 251,578,965 5,415,852 110,348,848 177,640,532 112,417,172 36,505,929
Construction 785,265 17,373,044 7,817,148 6,471,775 65,741,257 1,231,919,026 20,808,189 12,827,583
Services 354,482,625 116,836,450 278,323,501 1,138,743,553 782,415,324 715,907,521 939,181,185 840,698,836
Wholesale and retail trade and repair of motor
vehicles and motorcycles 4,902,507 62,607,383 169,655,070 235,133,420 306,419,509 270,097,006 42,198,668 99,187,229
Transportation and storage 5,948,573 2,742,154 10,706,910 12,771,748 60,199,871 18,715,322 6,506,710 5,922,018
Accommodation and food service activities 1,448,065 3,872,286 44,975,902 177,116,659 20,577,171 25,677,951 18,031,099 4,542,726
Information and communication 50,067,952 524,111 1,003,348 11,145,078 80,827,294 241,138,169 3,719,843 136,404,862
Financial and insurance activities 288,360,170 61,070 31,448,665 580,196,230 210,745,256 73,731,561 827,469,220 561,837,266
Real estate activities 72,588 29,000,093 190,126 19,690,965 5,080,334 2,525,261 1,745,777 5,357,491
Professional, scientific and technical activities 377,582 23,490 629,753 26,647,358 15,977,978 8,943,690 6,542,387 6,775,986
Administrative and support service activities 1,514,573 3,316,630 15,527,173 44,664,668 65,591,776 19,668,385 9,270,194 8,060,079
Education 807,605 35,040 576,605 19,483,419 6,556,385 9,841,560 12,316,679 5,114,809
Human health and social work activities 247,526 5,000 579,383 7,322,815 2,380,454 13,119,012 2,193,440 3,250,372
Arts, entertainment and recreation 262,423 0 30,289 157,935 504,134 6,823,613 5,202,835 617,215
Other service activities 473,061 14,649,193 3,000,278 4,413,259 7,555,160 25,625,990 3,984,333 3,628,782

219
Table Q.6: Gross additions (purchases) to fixed asset by sub-sector in all the sectors and region
Sector
Intangible
Assets Land
Other
Construction
and land
Improvements Buildings
Transport
and
Equipment
Machinery
and Other
Equipment
Furniture
and
Fittings
Other
Tangible
Assets
ALL SECTORS - Volta Region 413,861 2,634,937 4,395,930 40,575,036 28,900,836 78,636,573 16,838,097 1,558,020
Agriculture 0 23,600 5,914 355,858 3,640,480 277,236 9,636 130,763
Agriculture, forestry and fishing 0 23,600 5,914 355,858 3,640,480 277,236 9,636 130,763
Industry 11,006 255,777 1,261,664 4,547,369 12,164,300 72,530,500 12,176,885 322,225
Mining and quarrying 0 31,500 85,377 183,974 1,056,336 1,121,481 49,906 0
Manufacturing 10,135 196,277 91,982 1,231,917 1,874,343 4,987,244 194,488 303,561
Electricity, gas, steam and air conditioning supply 0 0 0 3,045,350 7,411,044 64,877,848 10,723,950 0
Water supply; sewerage, waste management 260 2,000 0 15,200 1,123,746 16,689 1,195,204 11,500
Construction 611 26,000 1,084,305 70,929 698,830 1,527,238 13,336 7,164
Services 402,855 2,355,560 3,128,352 35,671,809 13,096,056 5,828,837 4,651,576 1,105,032
Wholesale and retail trade and repair of motor
vehicles and motorcycles 79,245 386,921 687,733 14,343,656 2,216,993 2,996,178 1,533,882 82,909
Transportation and storage 0 0 0 4,000 51,000 67,218 1,200 16,884
Accommodation and food service activities 40,924 17,083 2,231,750 7,059,028 838,663 359,814 1,396,385 154,335
Information and communication 63,031 1,500 0 78,997 32,600 432,776 29,126 27,750
Financial and insurance activities 33,995 0 0 250,521 332,883 422,196 185,014 358,591
Real estate activities 0 75,000 0 1,800 40,000 10,000 4,840 3,600
Professional, scientific and technical activities 0 0 0 160 112,560 91,203 45,733 145,817
Administrative and support service activities 700 113,357 337 0 44,099 231,285 74,147 110,814
Education 51 960,000 0 2,048,898 4,535,643 100,379 480,957 86,222
Human health and social work activities 21,395 0 0 10,351,914 123,013 243,946 209,201 54,130
Arts, entertainment and recreation 1,500 0 0 12,177 7,218 45,679 8,034 11,464
Other service activities 162,015 801,698 208,532 1,520,658 4,761,384 828,165 683,057 52,517

220
Table Q.7: Gross additions (purchases) to fixed asset by sub-sector in all the sectors and region
Sector
Intangible
Assets Land
Other
Construction
and land
Improvements Buildings
Transport
and
Equipment
Machinery
and Other
Equipment
Furniture
and
Fittings
Other
Tangible
Assets
ALL SECTORS - Eastern Region 1,319,522 3,497,744 10,921,906 84,933,397 50,085,592 133,234,711 18,598,804 6,633,395
Agriculture 0 357,800 100,000 422,643 1,566,952 1,228,814 31,373 222,677
Agriculture, forestry and fishing 0 357,800 100,000 422,643 1,566,952 1,228,814 31,373 222,677
Industry 138,647 331,965 3,701,127 19,852,988 31,175,949 115,424,922 3,221,448 1,339,684
Mining and quarrying 6,100 6,683 2,548,045 269,633 1,079,167 10,562,515 77,667 22,401
Manufacturing 123,547 275,282 1,152,914 15,913,634 8,018,123 25,984,190 1,950,097 1,198,166
Electricity, gas, steam and air conditioning supply 0 0 0 3,654,420 18,416,050 77,853,424 1,191,550 0
Water supply; sewerage, waste management 0 50,000 0 13,500 199,299 399,153 750 20,900
Construction 9,000 0 167 1,800 3,463,310 625,640 1,385 98,217
Services 1,180,875 2,807,979 7,120,779 64,657,766 17,342,691 16,580,975 15,345,983 5,071,034
Wholesale and retail trade and repair of motor
vehicles and motorcycles 8,930 2,279,394 1,825,899 2,200,066 10,082,152 5,626,932 801,670 219,104
Transportation and storage 860 2,800 0 58,400 565,550 0 23,920 6,540
Accommodation and food service activities 338,659 112,060 2,542,650 53,711,468 16,560 4,208,394 4,270,535 765,841
Information and communication 114,600 0 700 17,902 185,086 614,768 94,445 437,299
Financial and insurance activities 3,860 300,000 300,069 1,071,972 2,395,775 1,150,422 3,345,472 1,679,967
Real estate activities 3,000 0 0 3,307,888 25,000 6,000 2,000 4,500
Professional, scientific and technical activities 2,657 0 0 19,278 739,581 116,754 28,581 135,144
Administrative and support service activities 4,457 7,543 0 27,040 81,097 288,267 148,868 199,032
Education 39,089 0 438,347 2,910,609 3,031,297 810,011 945,817 657,638
Human health and social work activities 0 0 0 690,664 186,006 2,105,597 1,483,638 116,314
Arts, entertainment and recreation 5,922 0 5,213 20,769 12,253 52,651 18,868 25,658
Other service activities 658,842 106,181 2,007,901 621,709 22,333 1,601,179 4,182,170 823,997

221
Table Q.8: Gross additions (purchases) to fixed asset by sub-sector in all the sectors and region
Sector
Intangible
Assets Land
Other
Construction
and land
Improvements Buildings
Transport and
Equipment
Machinery
and Other
Equipment
Furniture
and Fittings
Other
Tangible
Assets
ALL SECTORS - Ashanti Region 5,195,497 31,024,685 26,532,219 371,152,619 109,575,906 581,807,673 33,676,881 23,943,784
Agriculture 14,143 290,245 445,143 3,247,478 2,112,725 47,890,562 2,051,596 2,875,255
Agriculture, forestry and fishing 14,143 290,245 445,143 3,247,478 2,112,725 47,890,562 2,051,596 2,875,255
Industry 365,703 8,089,814 9,673,966 136,571,487 55,445,808 495,524,890 5,719,787 787,298
Mining and quarrying 216,095 97,224 0 32,966,060 43,533,412 99,890,364 74,034 110,883
Manufacturing 149,608 7,856,115 9,663,995 87,160,537 7,830,714 33,910,234 2,400,190 608,196
Electricity, gas, steam and air conditioning
supply 0 0 0 16,444,890 2,215,260 350,326,000 2,859,720 0
Water supply; sewerage, waste management 0 0 0 0 1,462,022 1,097,125 2,950 9,400
Construction 0 136,475 9,971 0 404,400 10,301,167 382,893 58,818
Services 4,815,651 22,644,626 16,413,110 231,333,654 52,017,373 38,392,221 25,905,498 20,281,231
Wholesale and retail trade and repair of motor
vehicles and motorcycles 182,998 20,664,322 3,631,284 28,483,481 16,506,680 16,286,037 8,263,345 4,435,626
Transportation and storage 4,905 561,138 2,300 2,375,596 8,681,082 78,264 17,200 68,238
Accommodation and food service activities 271,194 0 795,511 64,692,945 2,574,097 2,708,185 1,362,659 1,520,969
Information and communication 22,620 88,621 0 291,270 899,642 1,183,753 540,216 1,264,085
Financial and insurance activities 634,243 200,000 662,481 116,317,289 2,519,134 2,548,647 6,656,928 4,317,537
Real estate activities 3,000 0 0 106,077 102,914 46,201 19,504 715
Professional, scientific and technical activities 40,768 72,722 1,189,878 120,524 259,823 5,395,878 404,847 732,729
Administrative and support service activities 74,528 270,000 0 52,205 2,498,589 969,245 713,010 989,121
Education 363,698 302,075 4,743,486 6,563,272 1,623,948 1,052,636 2,867,182 1,841,313
Human health and social work activities 11,099 0 310 5,529,341 1,951,786 2,744,607 732,375 3,182,561
Arts, entertainment and recreation 10,650 0 45,558 96,710 221,908 425,435 82,775 7,583
Other service activities 3,195,947 485,747 5,342,302 6,704,945 14,177,769 4,953,334 4,245,457 1,920,752

222
Table Q.9: Gross additions (purchases) to fixed asset by sub-sector in all the sectors and region
Sector
Intangible
Assets Land
Other
Construction
and land
Improvements Buildings
Transport
and
Equipment
Machinery
and Other
Equipment
Furniture
and
Fittings
Other
Tangible
Assets
ALL SECTORS - Brong Ahafo Region 421,970 3,456,184 450,037 34,600,286 9,819,475 491,299,613 11,325,366 3,909,238
Agriculture 2,900 93,900 61,150 1,122,514 1,058,876 137,147 13,410 5,800
Agriculture, forestry and fishing 2,900 93,900 61,150 1,122,514 1,058,876 137,147 13,410 5,800
Industry 26,925 806,271 26,236 12,722,521 2,509,957 50,224,328 404,759 113,695
Mining and quarrying 0 0 0 0 161,213 679,829 16,512 0
Manufacturing 22,425 782,271 23,296 12,632,521 1,817,178 47,455,067 260,407 45,085
Electricity, gas, steam and air conditioning supply 0 0 0 0 0 0 0 0
Water supply; sewerage, waste management 4,500 0 0 90,000 103,700 1,997,299 1,190 28,985
Construction 0 24,000 2,940 0 427,867 92,133 126,650 39,625
Services 392,145 2,556,013 362,651 20,755,251 6,250,642 440,938,138 10,907,197 3,789,743
Wholesale and retail trade and repair of motor
vehicles and motorcycles 215,167 2,113,039 28,555 5,228,298 4,385,243 434,529,279 5,478,908 1,345,044
Transportation and storage 0 15,373 0 11,000 575,000 11,000 860 0
Accommodation and food service activities 1,250 70,000 197,994 2,600,139 20,000 1,102,733 675,258 96,968
Information and communication 16,466 16,500 3,571 166 4,253 67,487 36,584 59,128
Financial and insurance activities 57,674 12,385 0 2,046,953 329,521 639,395 2,174,173 517,476
Real estate activities 0 80,000 0 0 0 0 0 2,100
Professional, scientific and technical activities 0 0 0 2,000 58,390 149,376 16,762 23,336
Administrative and support service activities 74 5,860 0 1,182 20,050 319,099 20,050 19,250
Education 57,019 30,000 0 4,055,006 310,447 120,519 675,716 1,054,001
Human health and social work activities 11,376 0 129,273 2,134,947 487,543 2,596,687 490,895 439,109
Arts, entertainment and recreation 793 2,643 0 34,306 29,000 101,135 6,529 4,850
Other service activities 32,327 210,214 3,257 4,641,256 31,197 1,301,429 1,331,462 228,481

223
Table Q.10: Gross additions (purchases) to fixed asset by sub-sector in all the sectors and region
Sector
Intangible
Assets Land
Other
Construction
and land
Improvements Buildings
Transport
and
Equipment
Machinery
and Other
Equipment
Furniture
and
Fittings
Other
Tangible
Assets
ALL SECTORS - Northern Region 573,315 2,482,527 1,952,592 20,821,062 61,569,116 17,684,389 6,807,807 2,924,512
Agriculture 4,000 0 0 107,971 487,820 438,104 11,604 15,789
Agriculture, forestry and fishing 4,000 0 0 107,971 487,820 438,104 11,604 15,789
Industry 8,664 1,109,199 17,736 609,863 11,105,537 10,303,680 1,094,939 18,548
Mining and quarrying 0 0 0 0 0 0 0 0
Manufacturing 633 131,490 17,736 594,743 789,301 1,507,390 196,445 12,548
Electricity, gas, steam and air conditioning supply 450 8,080 0 0 7,516,400 8,242,443 120 0
Water supply; sewerage, waste management 7,341 712,200 0 0 2,360,464 327,372 855,032 0
Construction 240 257,429 0 15,120 439,372 226,476 43,342 6,000
Services 560,651 1,373,328 1,934,856 20,103,228 49,975,759 6,942,605 5,701,264 2,890,175
Wholesale and retail trade and repair of motor
vehicles and motorcycles 46,903 775,775 1,808,630 3,930,151 4,519,499 2,561,843 1,081,788 237,866
Transportation and storage 0 0 0 0 4,195,700 1,800 2,660 2,950
Accommodation and food service activities 2,006 226,439 2,080 1,359,947 450,379 921,075 252,122 34,176
Information and communication 5,958 0 8,317 109,833 18,520 187,968 30,093 132,765
Financial and insurance activities 457,947 30,772 0 12,561,477 37,968,606 1,739,177 2,866,047 1,944,044
Real estate activities 0 160,000 0 0 2,500 52,700 1,300 2,800
Professional, scientific and technical activities 0 6,300 0 250 30,250 52,658 10,657 22,183
Administrative and support service activities 10,250 47,333 100 73,456 39,190 192,187 86,202 101,096
Education 0 0 0 549,459 343,581 269,317 380,705 115,105
Human health and social work activities 0 0 0 1,365,596 612,301 231,000 115,844 18,646
Arts, entertainment and recreation 3,080 0 0 18,119 39,306 18,170 8,272 60,183
Other service activities 34,507 126,710 115,729 134,940 1,755,927 714,711 865,574 218,362

224
Table Q.11: Gross additions (purchases) to fixed asset by sub-sector in all the sectors and region
Sector
Intangible
Assets Land
Other
Construction
and land
Improvements Buildings
Transport and
Equipment
Machinery
and Other
Equipment
Furniture
and
Fittings
Other
Tangible
Assets
ALL SECTORS - Upper East Region 248,705 606,166 763,532 10,575,958 22,716,103 7,774,386 2,431,671 1,561,939
Agriculture 0 8,500 0 850 43,000 400 225 200
Agriculture, forestry and fishing 0 8,500 0 850 43,000 400 225 200
Industry 18,026 85,212 10,501 1,371,270 9,894,376 3,345,383 219,895 191,832
Mining and quarrying 0 3,900 0 84,814 6,330 1,086,131 15,445 117,000
Manufacturing 16,776 81,312 10,501 1,286,456 1,018,608 1,567,772 174,487 58,582
Electricity, gas, steam and air conditioning supply 0 0 0 0 0 0 0 0
Water supply; sewerage, waste management 0 0 0 0 8,239,648 3,000 8,782 1,200
Construction 1,250 0 0 0 629,790 688,480 21,181 15,050
Services 230,679 512,454 753,031 9,203,838 12,778,727 4,428,603 2,211,551 1,369,907
Wholesale and retail trade and repair of motor
vehicles and motorcycles 46,316 313,031 437,625 3,007,165 9,372,716 588,120 301,704 149,214
Transportation and storage 917 51,675 183 90,080 1,350 1,520 17,724 29,595
Accommodation and food service activities 156,577 0 9,500 740,878 57,529 517,595 219,599 28,222
Information and communication 9,850 0 2,200 0 265,150 54,890 65,773 15,784
Financial and insurance activities 2,200 0 0 2,029,731 361,136 424,923 122,393 203,124
Real estate activities 0 0 0 0 0 0 800 250
Professional, scientific and technical activities 984 15,000 0 6,000 52,988 146,729 42,613 38,170
Administrative and support service activities 753 13,391 0 78,278 77,357 103,109 26,483 109,483
Education 0 0 0 143,877 480,822 92,007 301,991 318,070
Human health and social work activities 0 0 6,480 1,604,265 839,079 1,551,194 822,872 292,444
Arts, entertainment and recreation 800 0 0 10,936 27,637 25,310 4,302 820
Other service activities 12,283 119,356 297,043 1,492,628 1,242,963 923,206 285,296 184,731

225
Table Q.12: Gross additions (purchases) to fixed asset by sub-sector in all the sectors and region
Sector
Intangible
Assets Land
Other
Construction
and land
Improvements Buildings
Transport and
Equipment
Machinery
and Other
Equipment
Furniture
and
Fittings
Other
Tangible
Assets
ALL SECTORS - Upper West Region 309,518 583,718 676,957 11,587,723 5,836,988 28,519,721 1,867,526 880,907
Agriculture 0 0 8,000 15,000 9,000 19,550 500 1,922
Agriculture, forestry and fishing 0 0 8,000 15,000 9,000 19,550 500 1,922
Industry 40,278 71,104 86,826 1,490,109 1,769,029 24,509,616 133,365 240,589
Mining and quarrying 0 0 0 0 0 71,610 0 4,645
Manufacturing 36,478 60,104 77,451 861,118 531,941 1,381,290 124,736 24,020
Electricity, gas, steam and air conditioning supply 0 0 0 0 0 0 0 0
Water supply; sewerage, waste management 3,800 0 0 0 370,500 21,904,604 10 850
Construction 0 11,000 9,375 628,991 866,588 1,152,113 8,619 211,074
Services 269,240 512,614 582,131 10,082,614 4,058,959 3,990,555 1,733,661 638,396
Wholesale and retail trade and repair of motor
vehicles and motorcycles 22,398 399,152 372,508 5,370,473 2,676,886 2,602,270 527,239 109,637
Transportation and storage 0 315 0 17,800 3,200 21,315 7,929 4,910
Accommodation and food service activities 2,517 75,522 76,065 2,097,075 109,789 158,235 145,970 26,248
Information and communication 490 0 0 0 20,000 632,050 22,700 40,070
Financial and insurance activities 0 10,600 0 10,157 264,635 82,895 123,838 44,749
Real estate activities 0 0 0 0 0 0 0 0
Professional, scientific and technical activities 0 0 0 0 132,790 43,580 2,200 18,238
Administrative and support service activities 126 0 85 35,405 125,160 125,228 40,557 90,190
Education 0 14,000 680 1,473,207 208,976 55,723 541,791 215,955
Human health and social work activities 0 11,025 0 367,213 262,840 53,548 49,580 10,452
Arts, entertainment and recreation 0 0 325 2,600 1,500 4,648 3,910 700
Other service activities 243,708 2,000 132,468 708,685 253,183 211,064 267,948 77,246