copyright warning &...
TRANSCRIPT

Copyright Warning & Restrictions
The copyright law of the United States (Title 17, United States Code) governs the making of photocopies or other
reproductions of copyrighted material.
Under certain conditions specified in the law, libraries and archives are authorized to furnish a photocopy or other
reproduction. One of these specified conditions is that the photocopy or reproduction is not to be “used for any
purpose other than private study, scholarship, or research.” If a, user makes a request for, or later uses, a photocopy or reproduction for purposes in excess of “fair use” that user
may be liable for copyright infringement,
This institution reserves the right to refuse to accept a copying order if, in its judgment, fulfillment of the order
would involve violation of copyright law.
Please Note: The author retains the copyright while the New Jersey Institute of Technology reserves the right to
distribute this thesis or dissertation
Printing note: If you do not wish to print this page, then select “Pages from: first page # to: last page #” on the print dialog screen

The Van Houten library has removed some of the personal information and all signatures from the approval page and biographical sketches of theses and dissertations in order to protect the identity of NJIT graduates and faculty.

ABSTRACT
IMPACT OF ACCESS POINTS ON MULTILANE HIGHWAY ACCIDENTS
by Tao Qu
This thesis presents an analysis of reported accidents on multilane highways and
regression models that identify the primary explanatory variables that have a significant
effect on accident rates midblock to signalized intersections. The analysis was based on
traffic and reported accident data provided by New Jersey DOT. The access points per
mile and the accident rates per million-vehicle-miles-traveled were analyzed based on a
large number of roadway sections which were selected from five NJ State routes.
Comparative accident analysis related with traffic and roadway geometric characteristics
were performed. The analysis showed that approximately 30% of accidents occurred
between intersections, which were primarily attributed to the presence of access points.
Among these, about 80% of the accidents were caused by a vehicle moving straight
through on the mainline and a turning vehicle from/to an access point. Although
nonlinear models show good fit, none of the coefficients of the variables show significant
t-statistic values. It can be concluded that no good regression models among those tested
provide good estimation of accident rates for multilane highways. A field study was
conducted and presented several quantitative variables of speed reduction, delay and
percentages of affected vehicles at access points.

IMPACT OF ACCESS POINTS ON MULTILANE HIGHWAY ACCIDENTS
by Tao Qu
A Thesis Submitted to the Faculty of
New Jersey Institute of Technology in Partial Fulfillment of the Requirements for the Degree of
Master of Science in Transportation
Committee for the Interdisciplinary Program in Transportation
January 1998


APPROVAL PAGE
IMPACT OF ACCESS POINTS ON MULTILANE HIGHWAY ACCIDENTS
Tao Qu
Dr. Kyriacos C. Mouskos, Thesis Adviser Date Assistant Professor of Civil and Environmental Engineering, NJIT
Dr. Steven I. J. Chien,'Committee Member Date Assistant Professor of Civil and Environmental Engineering, NJIT
Dr. Louis J. Pignataro, Committee Member Date Executive Director, Institute for Transportation, NJIT
BIOGRAPHICAL SKETCH
Author: Tao Qu
Degree: Master of Science in Transportation
Date: January 1998
Undergraduate and Graduate Education:
• Master of Science in Transportation Engineering New Jersey Institute of Technology, Newark, NJ, 1998
• Bachelor of Science in Civil Engineering, Beijing Polytechnic University, Beijing, People's Republic of China, 1990
Major: Transportation Engineering
iv

This thesis is dedicated to my family and friends
who have supported me throughout this work

ACKNOWLEDGMENT
First, I would like to express great thanks to my wife who supported me
throughout this research.
I wish to express my sincere gratitude to my advisor, Dr. Kyriacos C. Mouskos,
for his most valuable guidance, support, and especially his encouragement throughout the
course of this thesis. I extend special thanks to Dr. Louis J. Pignataro and Dr. Steven I. J.
Chien for serving as members of the committee and their valuable guidance and support.
Special thanks are forwarded to Mr. Wu Sun for his valuable contribution to this thesis,
and all my friends for their help.
This thesis is the main component of the final report for Project NCTIP990908-
NJDOT993970, which was conceived by Mr. Arthur Eisdorfer of N.IDOT, to whom I
extend my sincere gratitude. 1 would also like to thank Ms. Sandra Gogualin for her
assistance throughout this project. Finally, the valuable aid of Mr. George Kuziew and his
personnel in providing pertinent data related to this study is acknowledged and
appreciated.
TABLE OF CONTENTS
Chapter Page
1 INTRODUCTION 1
1.1 Access Management 1
1.2 Objectives 5
1.3 Thesis Outline 5
2 LITERATURE REVIEW 7
2.1 Accident Rate Analysis 7
2.2 Impact of Access Points on Accident Rate 14
3 PROBLEM DEFINITION AND METHODOLOGY 16
3.1 Problem Definition 16
3.2 Methodology 18
3.2.1 Accident Analysis Procedure 19
3.2.2 Regression Analysis Procedure 21
3.2.3 Field Study 23
4 DATA COLLECTION 25
5 ACCIDENT ANALYSIS AND RESULTS 27
5.1 Accident Analysis in General 27
5.1.1 Accident Analysis by Location 28
5.1.2 Accident Analysis by Collision Type 30
5.1.3 Accident Analysis by Vehicle Action 38
5.1.4 Section-Accident Analysis by Turning Action 40
vii
TABLE OF CONTENTS (Continued)
Chapter Page
5.1.5 Accident Analysis by Vehicle Contribution Circumstance 41
5.1.6 Accident Analysis by Weather Condition 43
5.1.7 Accident Analysis by Surface Condition 45
5.1.8 Accident Analysis by Light Conditions 47
5.1.9 Accident Variations by Month, Day of Week, and Hour 49
5.2 Relationship Between Access Points and Accidents 52
5.3 Accident Analysis by Geometric Classification 58
5.3.1 Number of Lanes 59
5.3.2 Shoulder 60
5.3.3 Median 60
5.3.4 Speed Limit 61
5.3.5 Traffic Volume 62
5.4 Regression Model Analysis 64
5.4.1 Two-lane Highway Regression Models 64
5.4.2 Four-lane Highway Regression Models 66
6 FIELD STUDY AND DATA ANALYSIS 68
6.1 Data Collection 68
6.1.1 Speed Data Collection 68
6.1.2 Traffic Data Collection 70
6.2 Speed Data Analysis 71
viii

TABLE OF CONTENTS (Continued)
Chapter Page
6.2.1 Average Speed not Affected by Vehicle Turning at Access Points 71
6.2.2 Average Speed Affected by Vehicle Turning at Access Points 73
6.2.3 Percentage of Test Runs Affected by Turning Vehicles at Access Points 78
6.2.4 Delay and Speed Reduction Due to Turning Movements at Access Points 78
6.3 Traffic Data Analysis 80
6.3.1 Main Roadway Traffic 80
6.3.2 Traffic Volume at Access Points 81
6.3.3 Impact Analysis of Turning Movements at Access Points 83
7 CONCLUSIONS AND RECOMMANDATIONS 85
7.1 Summary 85
7.2 Conclusions 86
7.3 Recommendations 89
APPENDIX A HYPOTHESIS TESTING 92
APPENDIX B REGRESSION ANALYSIS RESULTS 95
APPENDIX C SAMPLE DATABASE OF ROAD SECTIONS 114
REFFERENCES 120
ix

LIST OF TABLES
Table Page
1.1 Access Classification System 4
5.1 Accident Distribution by Collision Type 31
5.2 Sample Access Database of Study Road Sections 59
5.3 Comparison between Two-lane and Four-lane Highway Accident Rates 59
5.4 Comparison between Highways with Shoulders and Highways without Shoulders on Accident Rates 60
5.5 Access Density and Accident Rate on Four-lane Highways with/without Median 61
5.6 Average Access Density and Accident Rate by Speed Limit 61
5.7 Comparison of Access Density and Accident Rate by AADT 63
5.8 Two-lane Highway Regression Models 65
5.9 Four-lane Highway Regression Models 66
6.1 Sample Tally Sheet for Traffic Counts at Access Points 71
6.2 Percentage of Test Runs Affected by Turning Movements 78
6.3 Delay and Speed Reduction due to Turning Movements 79
6.4 Hourly Traffic Volumes on Mainline 81
6.5 Percentage of Turning Movements Impacting on Other Vehicles 83
LIST OF FIGURES
Figure Page
5. 1 Percentage of Section-Accidents as Part of the Total Accidents of all Routes (Route 21, 27, 28, 33 and 35); 1991-1994 29
5. 2 Percentage of Section-Accidents (Section-Accidents/ Total Accidents) vs. Route Number 29
5. 3 Same Direction Rear Collision Section-Accidents (%) and Intersection- Accidents (%) vs. Route Number 32
5. 4 Same Direction Side Collision Section-Accidents (%) and Intersection- Accidents (%) vs. Route Number 33
5. 5 Left-turn Collision Percentage of Section-Accidents and Intersection- Accidents vs. Route Number 33
5. 6 Collisions with Objects Section-Accidents (%) and Intersection-Accidents (%) vs. Route Number 34
5. 7 Overturn Collision Section-Accidents (%) and Intersection-Accidents (%) vs. Route Number 34
5. 8 Strike Parking Vehicle Collision Section-Accidents (%) and Intersection- Accidents (%) vs. Route Number 35
5. 9 Pedestrian Collision—Section-Accidents (%) and Intersection-Accidents (%) vs. Route Number 35
5. 10 Angel Collision Section-Accidents (%) and Intersection-Accidents (%) vs. Route Number 36
5. 11 Head-on Collision Section-Accidents (%) and Intersection-Accidents (%) vs. Route Number 36
5. 12 Left-turn Accidents Section-Accidents (%) and Intersection-Accidents (%) vs. Route Number 39
5. 13 Right-turn Accidents Section-Accidents (%) and Intersection-Accidents (%) vs. Route Number 39
xi

LIST OF FIGURES (Continued)
Figure Page
5. 14 Percentage of Section-Accidents Caused by Turning Vehiclesys. Route Number 40
5. 15 Left-turn Section-Accidents Percentage by Type 41
5. 16 Right-turn Section-Accidents Percentage by Type 42
5. 17 Percentage of Section-Accidents and Intersection-Accidents by Vehicle Contribution Circumstances 42
5. 18 Percentage of Section-Accidents (%) and Intersection-Accidents (%) under Clear Weather Conditions 43
5. 19 Percentage of Section-Accidents (%) and Intersection-Accidents (%) under Rain Weather Conditions 44
5. 20 Percentage of Section-Accidents (%) and Intersection-Accidents (%) under Snow Weather Conditions 44
5. 21 Percentage of Section-Accidents (%) and Intersection-Accidents (%) under Dry Pavement Surface Conditions 46
5. 22 Percentage of Section-Accidents (%) and Intersection-Accidents (%) under Wet Pavement Surface Conditions 46
5. 23 Percentage of Section-Accidents (%) and Intersection-Accidents (%) under Snow and Ice Pavement Surface Conditions 47
5. 24 Percentage of Section-Accidents (%) and Intersection-Accidents (%) under Daytime Conditions 48
5. 25 Percentage of Section-Accidents (%) and Intersection-Accidents (%) under Dark Conditions 48
5. 26 Percentage of Section-Accidents (%) and Intersection-Accidents (%) under Dawn and Daybreak (DNDK) Conditions 49
5. 27 Accident Percentage for all Routes vs. Month 49
5. 28 Percentage of Section-Accidents (%) and Intersection-Accidents (%) on Weekdays vs. Route Number 50
xii
LIST OF FIGURES (Continued)
Figure Page
5. 29 Percentage of Section-Accidents (%) and Intersection-Accidents (%) on Weekends vs. Route Number 51
5. 30 Accident Percentage (%) versus Hour of the Day 52
5. 31 Accident Rate and Access Density vs. Milepost on Route 27 (Northbound, 1994) 53
5. 32 Accident Rate and Access Density vs. Milepost on Route 27 (Southbound, 1994) 54
5. 33 Accident Rate and Access Density vs. Milepost on Route 28 (Eastbound, 1994) 54
5. 34 Accident Rate and Access Density vs. Milepost on Route 28 (Westbound, 1994) 55
5. 35 Accident Rate and Access Density vs. Milepost on Route 33 (Eastbound, 1994) 55
5. 36 Accident Rate and Access Density vs. Milepost on Route 33 (Westbound, 1994) 56
5. 37 Accident Rate and Access Density vs. Milepost on Route 35 (Northbound, 1994) 56
5. 38 Accident Rate and Access Density vs. Milepost on Route 35 (Southbound, 1994) 57
5. 39 Average Accident Rate (#/MVM 1:10) vs. Access Density (#/mile) 58
5. 40 Accident Rate and Access Density vs. Speed Limit 62
5.41 Accident Rate (#/MVM 1:10) and Access Density (#/mile) vs. AADT (vpd) 63
6. 1 Basic Information of the Study Roadway Section of Linden, NJ State Route 27 69
6. 2 Vehicle Speed not Affected vs. Access Point Number (Northbound) 72
xiii
LIST OF FIGURES (Continued)
Figure Page
6. 3 Vehicle Speed not Affected vs. Access Point Number (Southbound) 73
6. 4 Speed of Lane-2 Affected by Opposite Direction Left-turn Movements vs. Access Point Number 74
6. 5 Speed of Lane-2 Affected by Same Direction Left-turn Movements vs. Access Point Number 74
6. 6 Speed of Lane-1 Affected by Same Direction Right-turn Movements vs. Access Point Number 75
6. 7 Speed of Lane-1 Affected by Same Direction Left-turn Movements vs. Access Point Number 75
6. 8 Speed of Lane-1 Affected by Opposite Direction Left-turn Movements vs. Access Point Number 76
6. 9 Speed Affected by Left-turn Exiting Movements vs. Access Point Number 77
6. 10 Speed Affected by Right-turn Exiting Movements vs. Access Point Number 77
6. 11 Distribution of Average Traffic Volume (15 minutes) on Weekdays 80
6. 12 Hourly Traffic Volume vs. Weekdays at Access Points of Gas Stations 82
6. 13 Hourly Traffic Volume vs. Weekdays at Access Points of Restaurant (Burger King) 82
xiv
CHAPTER 1
INTRODUCTION
The degradation of operational efficiency and increase in accident rates along multilane
highways prompted several states in developing access management techniques. One of
the issues that is of critical importance is the impact of access points, midblock to
signalized intersections on accident rates. This thesis presents an analysis of accident
rates on multilane highways and the development of regression models that identify the
primary explanatory variables that have a significant effect on accident rates midblock to
signalized intersections. First, a brief introduction to access management is presented.
1.1 Access Management
Multilane highways are located in suburban communities leading to central cities or
along high-volume rural corridors that connect main cities. They usually have four to six
lanes, which may be divided or undivided by medians. Traffic signals are usually spaced
at two miles or less, and traffic volumes typically range from 15,000 to 40,000 vehicles
per day. Although multilane highways are not completely access controlled, they have
greater control on the number of access points per mile than two-lane highways. Both
property owners and roadway users have the right of reasonable access to the multilane
highway system, freedom of movement, safety, and efficient expenditure of public funds.
While the demand for access increases, the road accidents increase significantly and the
system's operational efficiency and integrity degrades. An acceptable level of safety and
1

2
operational efficiency are two of the main goals of multilane highway operation and
access management. One of the techniques used by access management is the allocation
of access permits to improve the economic productivity while limiting the impact on the
safety and operational efficiency of the roadway.
In NCHRP report 348 (1992), access management was established as a response to
the problems of speed reduction, capacity loss, and increasing accident rate along the
roadways. Typical issues that access management is responsible for include access points
of gas stations, convenience stores, malls and city blocks. It intends to solve the conflicts
between the mainline traffic movement and the access functions. It calls for efforts in
research and significant improvements in access control and design to preserve the
functional integrity and operational viability of the road system. Access management is
the process that provides or manages access to land development while simultaneously
preserving the flow of traffic on the surrounding road system in terms of safety, speed,
and capacity needs. A set of systematic approaches of balancing the access and mobility
requirement are provided in this section.
The access management program mainly involves:
• Establish an access classification system,
• Define the allowable access level and access spacing for each class of highway,
• Set up a mechanism for granting variances when reasonable access can not be
provided, and
• Develop a means for enforcement of the program.

3
Main techniques for managing access points include the application of the
established traffic engineering, roadway design, and planning principles that:
• Limit the number of conflicts,
• Separate basic conflict areas,
• Reduce interference with through traffic due to turns into or out of a site,
• Provide sufficient spacing between at-grade intersections,
• Maintain progressive speeds along highways, and
• Provide adequate on-site storage areas.
The method of Access Code is another technique that is currently adopted by
several states such as New Jersey, Florida and Colorado. A comprehensive access code
can provide a supportable, predictable, and systematic basis for making and enforcing
access decisions.
The allowable kinds of access between activity centers and mainline cover a broad
spectrum. In NCHRP Report 348 (1992), seven levels of access have been defined for
application to any state, county, or local road systems. Due to safety considerations, the
access levels range from full access control (freeways) to partial access control (local and
collector streets and frontage roads). Access level 1 for uninterrupted flow applies to
limited access highways, and levels 2 through 7 govern "controlled access" highways.
The access classification is shown in Table 1.1.

4
Table 1. 1 Access Classification System
Access Level Description of Allowable Access
Roadway Classification
General Roadway Design Features
Level I Access at Interchanges Only (Uninterrupted Flow)
Freeway Multi-lane, Median
Level 2 Access at Public Street Intersections or at Interchanges Only (Uninterrupted Flow)
1
Expressway Multi-lane, Median
Level 3 Right Access Only (or Access at Interchange) (Uninterrupted Flow)
Strategic Highways
Multi-lane, Median
Level 4 Right and Left Turn with Left Turn Lane In and Out Required (Interrupted Flow-Both Directions)
Principal Highways
Multi-lane, Median
Level 5 Right and Left Turn with Left Turn Lane In and Out Required (Interrupted Flow-Both Directions)
Other Highways Multi-lane or 2-lane
Level 6 Right and Left Turn In and Out with Left Turn Lane Optional-In and Out (Uninterrupted Flow-Both Directions)
Collector 2-lane
Level 7 Right and Left Turn In and Out (Safety Requirements Only)
Local/Frontage Road
2-lane
Source: Access Management Guidelines for Activity Centers, NCHRP Report 348
In reference to the latest videotape of an overview of access management produced
by FHWA in May 1997, six major benefits are sited that could be obtained in a
transportation system by practicing access management techniques, as follows:
I) Provide substantial reduction in accident costs,
2) Maintain the efficient movement of people and goods,
5
3) Preserve the public investment in transportation infrastructures,
4) Reduce the need to build more roadways,
5) Protect the value of private investments,
6) Enhance the environment and economy of communities.
These benefits coincide with the goals of the Intermodal Surface Transportation
Efficiency Act of 1991 (ISTEA). Research in access management can play a key role in
reaching the ISTEA goals for management systems, environmental impacts, and
metropolitan planning.
1.2 Objectives
The primary objectives of this thesis are:
1) Statistical analysis of accidents on multilane highways in the state of New Jersey,
2) Development of regression models identifying the principal explanatory variables that
are related to accident rates occurring midblock to signalized intersection of multilane
highways,
3) Summarize the results of a field study on the operational characteristics of a section of
multilane highway.
1.3 Thesis Outline
This thesis is comprised of seven chapters. Chapter 1 presents an introduction to access
management and outlines the specific objectives of this thesis. Chapter 2 provides a
literature review on accident studies related to multilane highways. Chapter 3 presents the

problem definition and the methodology followed in this study. Chapter 4 outlines the
data collection procedure. Chapter 5 presents the corresponding analysis and the primary
results. Chapter 6 summarizes the field study conducted on a section of NJ State Route
27. Chapter 7 presents the conclusions and recommendations.
6

CHAPTER 2
LITERATURE REVIEW
This chapter presents the main literature related to accident rates analyses and the impact
of access points on accident rates.
2.1 Accident Rate Analysis
The analysis of the relationship between safety, roadway design standards, and traffic
volumes is the primary focus in safety studies. Several studies in traffic safety have been
conducted in the past several decades.
Roadway geometric factors, pavement conditions, and operational factors have
significant impact on safety. According to McGee (1995), roadway geometric factors
were divided into 5 subgroups: cross section, horizontal alignment, vertical alignment,
median width and roadside design. TRB Special Report 214 (1987) stated: "In general,
the relationship between safety and highway features is not well understood
quantitatively, and the linkage between these relationships and highway design standards
has been neither straight forward nor explicit", but great efforts have been devoted to this
field.
The most well studied subject is the impact of cross section (shoulder and lane-
width) on safety. Some basic statistical analysis, (see Belmont (1954) and Perkins
(1956)), conducted in the 1950's, indicated that accident rates decrease in the facilities
with wider shoulders. Opposite results were reported by Blensley and Head (1960).
7

8
Dart(1970) found that wider shoulders have a relatively small impact on accident rates.
Later, Dearinger (1970) reported a reduction in accident rates with the presence of wider
lanes. Numerous other studies reported by Jorgensen Associates (1978) and Zegeer
(1981) have also confirmed that accident rates decrease because of wider shoulders and
lanes. Later, Goldstine (1991), verified the relationship among accident rates, AADT and
road width. Most of the aforementioned studies were based on either before-and-after
studies or comparison of the entity of specific interest with other similar entity groups. A
before-and-after study follows a simple pattern: the count of accidents on entities of
specific interest is compared with the record of accident occurrence after the treatment.
On the basis of such a comparison, inferences are made about the effect of the measure of
treatment, (see TRR 1068, Hauer and Lovell (1986)). In FHWA-RD-87-008, Zegeer
(1987), an accident prediction model was developed and used to determine the expected
effect of lane and shoulder widening improvements on accidents. This is the most
complete and thorough quantitative study on the relationship of safety to lane width and
shoulder width. Also in this study, accident classifications were considered to be
necessary in fitting regression models. However, in Zegeer (1987), the models exhibited
relatively low R square, therefore, the usefulness of the models is questionable. The
models developed can only be applied to 2-lane rural highways. Despite these shortages,
this study is still considered as one of the most critical research efforts on the safety
impact of cross sections.
The safety impact of horizontal alignment design is also well studied. NCHRP
Report 374 (1995) concluded: sufficient evidence appears to indicate that, in general,

9
horizontal curves experience higher accident rates than tangent, and accident rates
generally increase as a function of increasing degree of curvature. Two prediction models
were developed in this area: Glennon's Horizontal Curve Model (1985), and Zegeer's
Horizontal Curve Model (1991). Although both of these two models have limitations
(Zegeer's model did not consider roadside, Glennon's model lost accuracy when curves
are sharper than 15 degrees, etc.), they are still considered as great contributions to safety
studies. According to NCHRP Report 374 (1995), Zegeer's model appears to represent
the best available relationship to estimate the number of accidents on individual
horizontal curves on 2-lane rural roads.
In comparison to horizontal alignment design, the effect of vertical alignment
design on accident rates was not well studied. Neuman, and Glennon (1983), provided a
model that relates accidents on crest curve to available sight distance, but this model has
not been validated by using real accident data.
The median is another geometric factor that has been reported to have a significant
impact on safety. Median width, median cross slope, and median type (raised, flush,
depressed) are the 3 major variables which influence safety. According to NCHRP Report
374 (1995), in general, wider medians achieve a higher degree of safety. Median widths
in the range of 60 to 80 feet or more with flat slopes are considered as adequate.
Roadside also has an impact on safety. Roadside refers to the area between the
outside shoulder edge and the right-of-way limits. According to NCHRP Report 374
(1995), providing clear zones with traversal slopes greatly enhances traffic safety.

10
Pavement conditions also have impact on accident rates, where, according to NCHRP
report 162 (1975) and the paper by Hakkert (1983), resurfacing can reduce accidents up
to 33%. A recent research conducted by Craus (1991), who used data from Israel,
concluded that if anti-skid treatment is provided, accident rates can be reduced.
In terms of operational factors, NCHRP report 330 (1990) provided guidelines for
improving traffic operation on urban highways without changing the total curb-to-curb
street width. TWLTL (two-way left-turn lanes) have been found to be a very effective
method for improving traffic operation. TWLTLs can reduce accidents on urban and
suburban highways by 35 %. In a recent study, Harwood (1995) concluded: Installing of
passing lanes and short four-lane sections and reallocation of street width on urban
highways, through use of narrower through lanes can lead to reduction of accident rates.
The author also pointed out that further research is needed to establish the relationship
between traffic congestion (v/c ratio) and safety.
One of the early studies of the relationship between traffic volume and safety, was
reported by Veh (1937), where he found that as the average daily traffic volume increases
to approximately 7000 vehicles per day, accidents also increase. Beyond an Average
Daily Traffic (ADT) of 7000 vehicles per day, there is a gradual decrease in the accident
rate, despite an increase in traffic. Lundy (1965) developed a regression model with the
independent variable of the ADT. The main critic for this model is that the segment
length was not incorporated. Numerous similar studies followed the aforementioned
research by Lundy, however, inconsistent, and sometimes contradictory results were
found. This discrepancy may be attributed to two reasons: (see Persaud and Mucsi
11
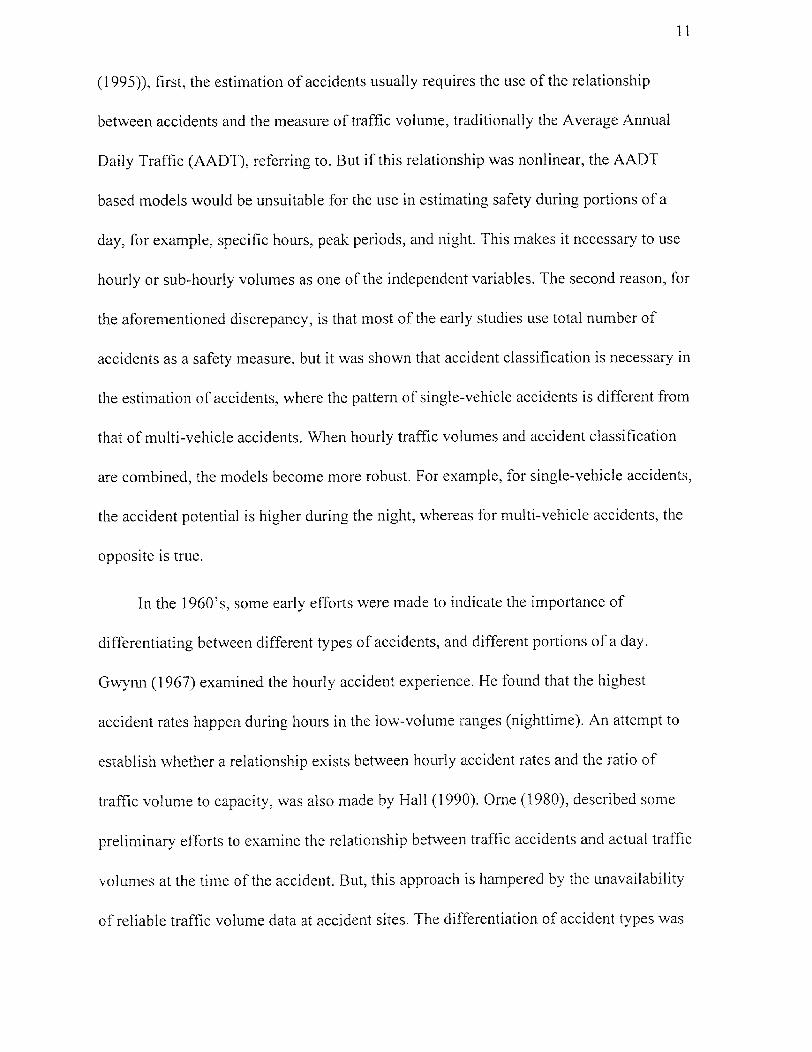
(1995)), first, the estimation of accidents usually requires the use of the relationship
between accidents and the measure of traffic volume, traditionally the Average Annual
Daily Traffic (AADT), referring to. But if this relationship was nonlinear, the AADT
based models would be unsuitable for the use in estimating safety during portions of a
day, for example, specific hours, peak periods, and night. This makes it necessary to use
hourly or sub-hourly volumes as one of the independent variables. The second reason, for
the aforementioned discrepancy, is that most of the early studies use total number of
accidents as a safety measure, but it was shown that accident classification is necessary in
the estimation of accidents, where the pattern of single-vehicle accidents is different from
that of multi-vehicle accidents. When hourly traffic volumes and accident classification
are combined, the models become more robust. For example, for single-vehicle accidents,
the accident potential is higher during the night, whereas for multi-vehicle accidents, the
opposite is true.
In the 1960's, some early efforts were made to indicate the importance of
differentiating between different types of accidents, and different portions of a day.
Gwynn (1967) examined the hourly accident experience. He found that the highest
accident rates happen during hours in the low-volume ranges (nighttime). An attempt to
establish whether a relationship exists between hourly accident rates and the ratio of
traffic volume to capacity, was also made by Hall (1990). Orne (1980), described some
preliminary efforts to examine the relationship between traffic accidents and actual traffic
volumes at the time of the accident. But, this approach is hampered by the unavailability
of reliable traffic volume data at accident sites. The differentiation of accident types was
12
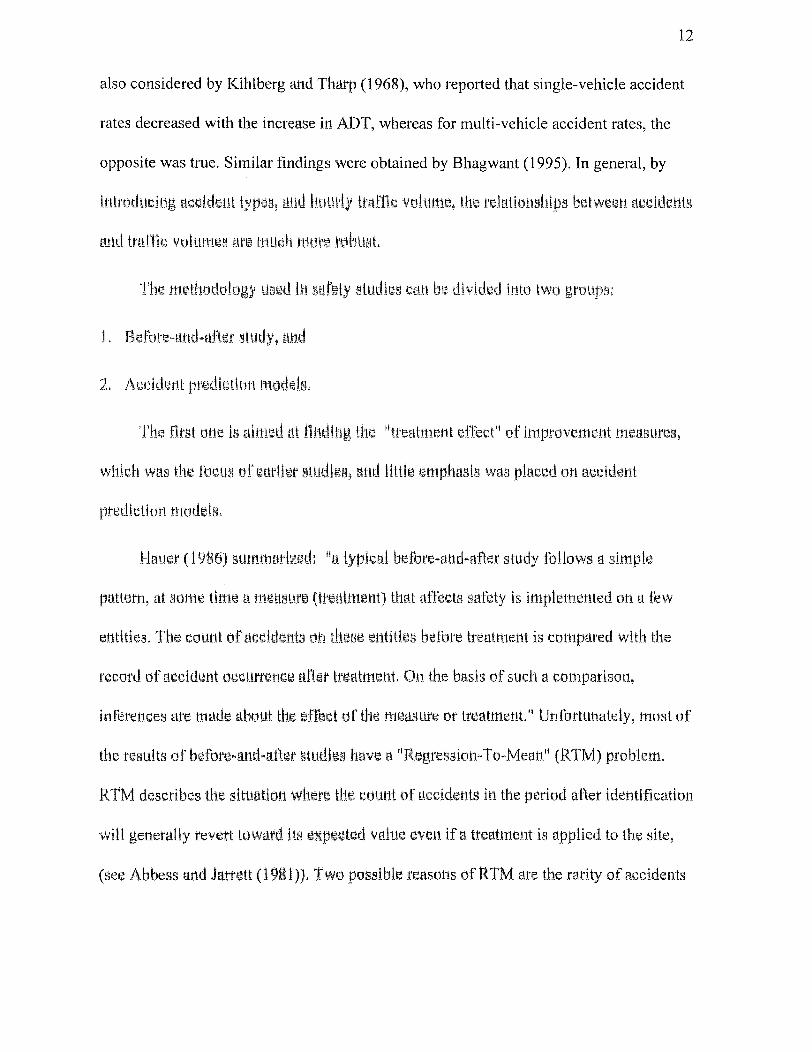
also considered by Kihlberg and Tharp (1968), who reported that single-vehicle accident
rates decreased with the increase in AIN, whereas for multi-vehicle accident rates, the
opposite was true. Similar findings were obtained by Bhagwant (1995). In general, by
introducing accident types, and hourly track volume, the relationships between accidents
and traffic volumes are much more robust.
The methodology used hi safety studies can be divided into two groups:
1. Before-and-after study, and
2. Accident prediction models.
The first one is aimed at finding the "treatment effect" of improvement measures,
which was the focus of earlier studies, and little emphasis was placed on accident
prediction models.
Hauer (1986) summarized: "a typical before-and-after study follows a simple
pattern, at some time a measure (treatment) that affects safety is implemented on a few
entities. The count of accidents on these entities before treatment is compared with the
record of accident occurrence after treatment. On the basis of such a comparison,
inferences are made about the effect of the measure or treatment." Unfortunately, most of
the results of before-and-after studies have a "Regression-To-Mean" (RTM) problem.
RTM describes the situation where the count of accidents in the period after identification
will generally revert toward its expected value even if a treatment is applied to the site,
(see Abbess and Jarrett (1981)). Two possible reasons of RTM are the rarity of accidents

13
and the annual variations in the accident count, and the sites chosen for treatment because
of recent poor accident records.
A method developed by Lau (1989) to overcome the RTM problem, was to use a
combination of accident history. This method differs from the previous prediction models
(regression models) in two aspects:
1. Use an Empirical Bayesian (BB) procedure, Persaud and Mucsi (1995),
2. Most of the regression theory Is based on the assumption that the error structure is
normal with mean equal to 0, gild a constant variance; however, this hypothesis is not
valid in traffic safety analysis.
Studies have shown that a negative binomial type of error is more appropriate to
describe the variations In the number of accidents (see Belanger (1994)).
The data used in the EB procedure, (Hauer and Persaud (1988)), comes from two
sources: casual factors, which tell something about the safety of similar entities, and
accident records, which capture the history of the specific entity, the safety of which is
examined. Indeed, a major difficulty associated with the use of the EB method consists of
defining a reference population, which have similar characteristics as the specific site,
and is sufficiently homogeneous to be reliable, (see Belanger (1994)). In fact, the major
task of the EB is to develop a method to estimate the expected accident rates. Two
methods can be used to achieve this task, (see Hauer (1992)), the method of sample
moments and the multivariate regression method. The first method depends on a large
reference population, where the larger the population is, the more accurate the estimates

14
are. Two practical difficulties arise here. First, it is rare that a sufficiently large data set
can be found to allow for an adequate accurate estimation. Second, even with very large
data sets, one cannot find an adequate reference population when entities are described by
several traits. The multivariate method extends the applicability of the EB procedure to
circumstances in which a large reference population does not exit. The underlying basis
of this method Is that It can be described by some Independent variables in a systematic
way. These independent variables are called traits, such as daily traffic volumes,
geometric design elements, etc. The importance of these methods is not only can they be
applied to a specific case, but also they can be applied to various types of entities.
2.2 Impact of Access Points on Accident Rate
The safety impacts of access points is one of the major concerns of access management.
This can be divided into two groups; the relationship between safety and geometric
design factors pertaining to access points, and the relationship between safety and traffic
volumes on access roads (driveways, unsignalized intersections, signalized intersections,
etc.)
Among the geometric factors, access density, access classification, spacing and left-
turn control are considered to be the most influential on safety. In a study conducted by
Dart and Mann (1970), they found that accident rates increase as access density (number
of access points along a particular highway section) increases. Similar conclusions can be
found in NCHRP Report 93 (1970) and FHWA-IP-82-3 (1982). Left-turn control is
considered to be very important to safety improvement, because, according to previous
15
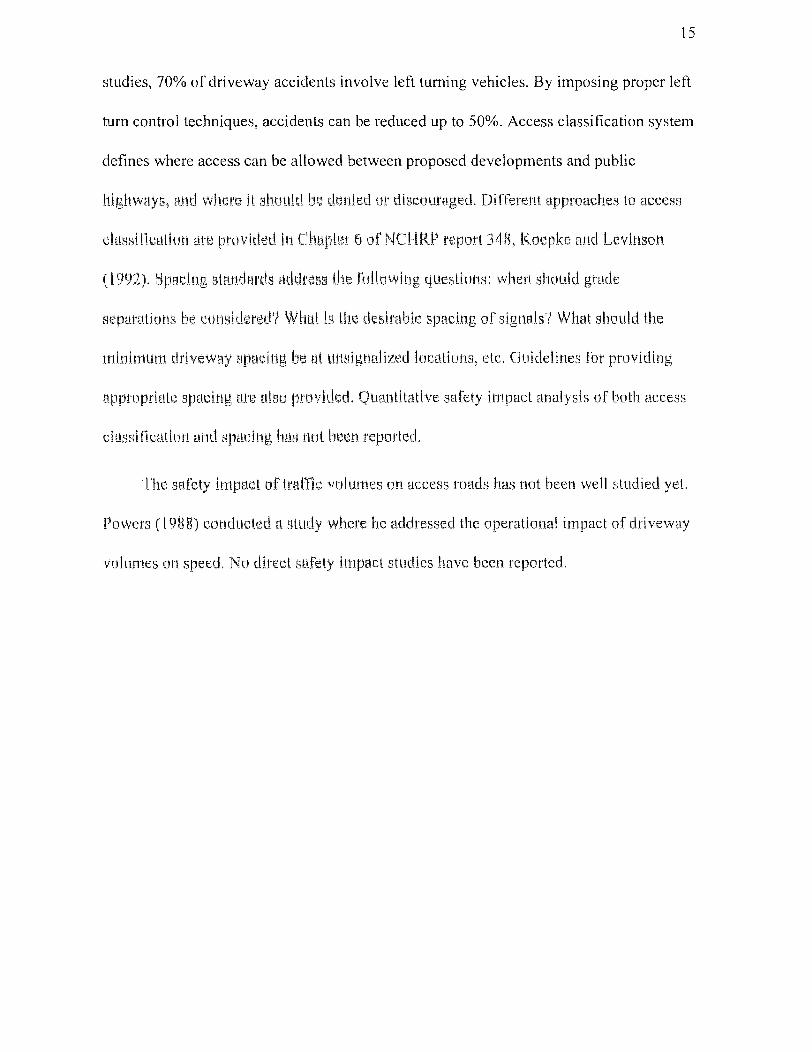
studies, 70% of driveway accidents involve left turning vehicles. By imposing proper left
turn control techniques, accidents can be reduced up to 50%. Access classification system
defines where access can be allowed between proposed developments and public
highways, and where It should be denied or discouraged. Different approaches to access
classification are provided In Chapter 6 of NCI-1RP report 348, Koepke and Levinson
(1992). Spacing standards address the following questions: when should grade
separations be considered? What Is the desirable spacing of signals? What should the
minimum driveway spacing be at unsignalized locations, etc. Guidelines for providing
appropriate spacing are also provided. Quantitative safety impact analysis of both access
classification and spacing has not been reported.
The safety impact of traffic volumes on access roads has not been well studied yet.
Powers (1988) conducted a study where he addressed the operational impact of driveway
volumes on speed. No direct safety impact studies have been reported.

CHAPTER 3
PROBLEM DEFINITION AND METHODOLOGY
3.1 Problem Definition
Two of the primary goals of transportation agencies is the improvement of the safety and
the operational efficiency of the high-way system. A major category of the highway
system are the multilane highways, which are generally located in urban and suburban
areas. They either connect two cities an urban area with a suburban area, or a suburban
area to another suburban area. The Increase in development along multilane highways is a
major issue of the State Dom hi the U.S. as well as in other countries. Several states,
including the state of New Jersey, have developed an Access Code which restricts the
number of access points along multilane highways and has developed standards for the
geometric configuration of the access points. Whereas, numerous studies have been
undertaken to examine the accident causes at the vicinity of signalized intersections, only
limited studies have dealt with the accident causes due to access points between
signalized intersections for multilane highways. These access points are either
unsignalized intersections, driveways, or direct access to various type of facilities such as
gas stations, restaurants, residences, etc.. The state of New Jersey requested that a study
be undertaken which would identify the major causes of accidents at six selected state
routes between signalized intersections.
The principal hypothesis is that the access points of multilane highways located
between signalized intersections may be a significant source of accidents. Underlying this
hypothesis are the specific geometric, traffic flow and weather characteristics of the
16

access points and the roadway sections which are the primary causes of the accidents
occurring at these sections of the multilane highways. Specifically the following
categories are identified for analysis as possible contributors to accidents on multilane
highways:
• Accident location,
• Collision type,
• Vehicle action (turning movements),
• Light condition,
• Roadway surface,
• Weather condition,
• Day of week,
• Hour of day,
• Month,
• Vehicle contributing circumstances,
• Number of lanes
• Shoulder
• Median
• Speed limit
• Traffic volume
The analysis focused on the effects of the above mentioned elements on reported
accidents occurred on multilane highways for sections between signalized intersections.
The next section presents the methodology followed for this analysis.
17

18
3.2 Methodology
In this research, six principal highways are selected as study objects that are composed of
urban and suburban sections. These highways include NJ State Routes 21, 27, 28, 33, 35,
82. Due to data unavailability, Route 82 was eliminated from the study. This study covers
multilane highway sections totaling about 175.8 miles, consisting of 4-lane and 2-lane
sections. All geometric elements, traffic volume and accident types pertaining to
driveways were taken into consideration. First an analysis of the accidents occurred on a
set of New Jersey State multilane highways is conducted. Then a regression analysis is
undertaken to identify the relationship between accident rates and a set of independent
variables.
Two key terms, access density and accident rate, are used through the process of the
study, which are defined as follows:
• Access density is the number of access points per mile (abbreviated in #/mile) on a
road section in each direction, refer to equation (1), which is obtained by dividing the
number of access points with the corresponding section length. It is an important
measurement of access spacing, which reflects the distance between access points.
AD = N L (1 )
Where,
AD = access density, #/mile
N = number of access points
L = length of the corresponding roadway section, in miles

19
• Accident rate is the number of accidents occurred per million vehicle miles traveled
(in #/MVM) on a road section in each direction, refer to equation (2), which is
calculated by dividing the number of accidents occurred in each direction with the
AADT and length of the road section.
AR = M x106 / (365xAADTxL) (2)
Where,
AR = accident rate, #/MVM
M = number of accidents
AADT= Annually Average Daily Traffic, in vehicles per day (vpd)
L = length of the corresponding roadway section, in miles
One significant difference from previous studies is that both of the above rates were
calculated per direction instead of combining them for both directions of traffic. The
difference resulted from the finding that there is a significant variability of accidents and
access points in the two opposite directions of traffic for the same roadway section.
3.2.1 Accident Analysis Procedure
A statistical analysis of accidents occurring on New Jersey State multilane highways was
conducted on Route 21, 27, 28, 33, and 35. The analysis was conducted-by route,
direction of traffic and category of accidents. Specifically, the following elements were
taken into consideration:
20
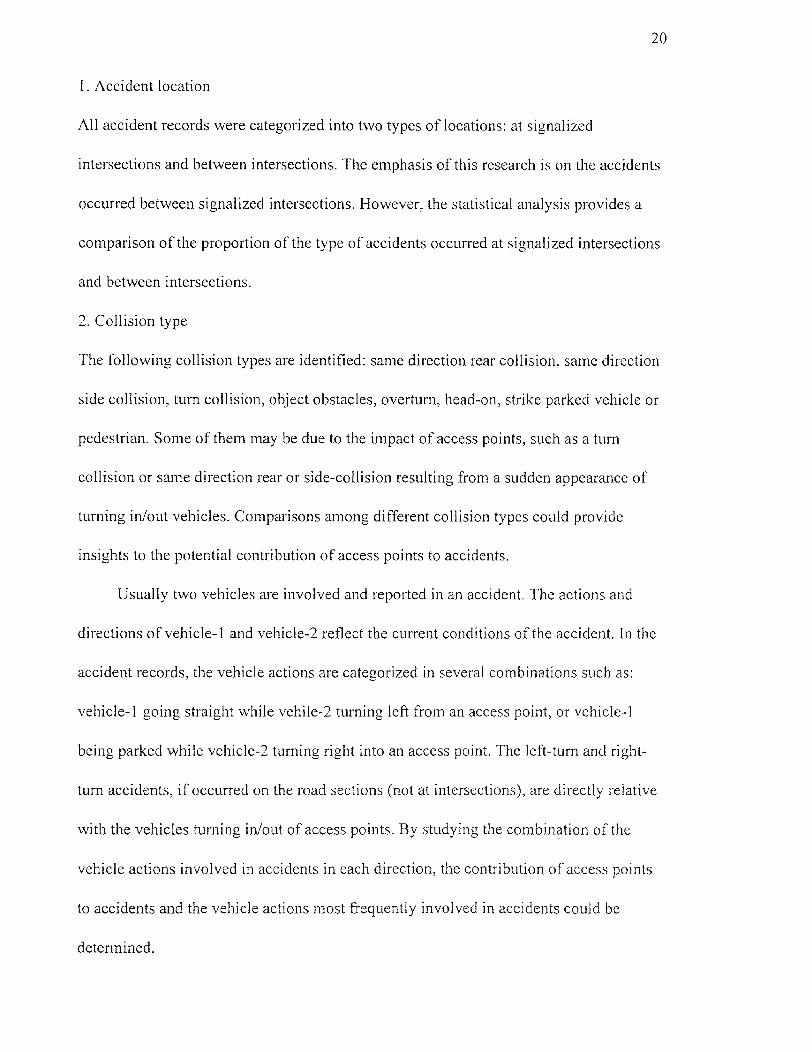
1. Accident location
All accident records were categorized into two types of locations: at signalized
intersections and between intersections. The emphasis of this research is on the accidents
occurred between signalized intersections. However, the statistical analysis provides a
comparison of the proportion of the type of accidents occurred at signalized intersections
and between intersections.
2. Collision type
The following collision types are identified: same direction rear collision, same direction
side collision, turn collision, object obstacles, overturn, head-on, strike parked vehicle or
pedestrian. Some of them may be due to the impact of access points, such as a turn
collision or same direction rear or side-collision resulting from a sudden appearance of
turning in/out vehicles. Comparisons among different collision types could provide
insights to the potential contribution of access points to accidents.
Usually two vehicles are involved and reported in an accident. The actions and
directions of vehicle-1 and vehicle-2 reflect the current conditions of the accident. In the
accident records, the vehicle actions are categorized in several combinations such as:
vehicle-1 going straight while vehile-2 turning left from an access point, or vehicle-1
being parked while vehicle-2 turning right into an access point. The left-turn and right-
turn accidents, if occurred on the road sections (not at intersections), are directly relative
with the vehicles turning in/out of access points. By studying the combination of the
vehicle actions involved in accidents in each direction, the contribution of access points
to accidents and the vehicle actions most frequently involved in accidents could be
determined.
21
Other elements, such as light, road surface, weather, day of week, time, month,
vehicle contributing circumstances, were also taken into consideration in order to further
identify the potential differences among the reported accidents under the impact of access
points.
The Microsoft Access and Excel software were used for the analysis of the various
data. As a database management tool, Access can provide efficient queries and other
powerful functions to process large amount of data. The various statistical techniques and
worksheet calculation functions provided by Excel was found satisfactory for the needs of
this data analysis.
3.2.2 Regression Analysis Procedure
The dependent variable identified in this regression analysis is the accident rate. The
following elements were considered as potential independent variables:
• Traffic volume:
♦ Traffic volume on main roads,
♦ Traffic volume on driveways,
♦ Conflict volume.
• Geometric factors of access points:
♦ Access classification,
Residential,
Gas station,

22
➢ Activity center,
♦ Access point density (spacing): number of access point per mile,
♦ Left turn control (permitted or not).
• Geometric factors:
♦ Number of lanes,
♦ Shoulder (with or without),
♦ Median (with or without).
• Traffic control factors
♦ Speed limit.
In order to conduct an unbiased regression analysis, a careful classification of
roadway sections with uniform characteristics was necessary. The analysis resulted in
sections ranging from 0.3 to 2.0 miles of length. Several iterations were conducted in
finalizing the appropriate sections.
Accidents due to accessing vehicles are usually the result of the conflict between
the mainline traffic and the entering/exiting traffic at access points. For two-lane
highways, the conflicting traffic is the sum of the mainline traffic and the traffic to/from
the access points, which includes both left-turn and right-turn vehicles. For four-lane
highways, the conflicting traffic is composed of the accessing traffic and part of the
mainline traffic, which includes the traffic in lane-1 and part of the traffic in lane-2.2 The
percentage of the traffic in lane-2, which is part of the conflicting traffic, pan only be
estimated through a field study. This percentage is a function of the driving
Lane-1 is the lane that provides access from the highway or arterial to the access driveways on the right, Lane-2 is the lane left of Lane-1.
23
characteristics of the drivers either exiting directly from lane-2 to the driveway or
entering into lane-2 from the driveway, including both left-turn and right-turn vehicles.
The geometric factors may also have a significant impact on accident rates. Therefore, the
analysis was carried out by classifying the roadway sections based on common geometric
characteristics, such as shoulder or no shoulder, presence of median and access
classification. Furthermore, traffic control factors such as the speed limit and left turn
control (e.g. no left turn) were taken into consideration in the classification of the
roadway section.
Access densities and accident rates were computed by section, and comparative
analysis was conducted by using the access density versus the accident rate diagrams
along the mileposts. Tentative statistical regression models between access densities and
accident rates were developed by grouping the study sections according to the geometric
and traffic characteristics.
Based on the data availability for the analysis, year 1994 was chosen as the study
year. Every case study was based on the data of year 1994. Out of the six New Jersey
State highways, Routes 21, 27, 28, 33 and 35 were taken into consideration for the
analysis. Route 82 was excluded due to the incompleteness of the corresponding data
stated earlier.
3.2.3 Field Study
The field study was conducted on the Union County Liden Section of NJ State Route 27,
which was one of study objects. The study section is about 0.6 miles long with two lanes
in each direction and without medians. The study included taking traffic counts and speed
24
measurements. Traffic volumes both at access points and on the main road were counted
by using traffic counters. A video camera was used to record the speed measurements in a
test vehicle. This survey covered both AM/PM peak periods and off-periods for the five
weekdays from Monday to Friday.

CHAPTER 4
DATA COLLECTION
The principal data collected included access point information, reported accidents,
roadway geometric and traffic conditions, which were provided by the NJ Department of
Transportation. The data collected focused on 4-lane and 2-lane highways and covered
the four years from 1991 to 1996. Six New Jersey State highways were considered:
Routes 21, 27, 28, 33, 35 and 82. The roadway geometric data were extracted from the
New Jersey state-line diagrams. The geometric data include the number of lanes,
shoulder, median, intersections, functional class, and speed limit. The traffic volumes
were also obtained from the state-line diagrams. The milepost, the points of the geometric
changes and their locations could easily be identified on the state-line diagrams, with
error differences of less than 0.001 miles.
The information on access points was extracted from videotapes provided by
NJDOT. The specific video monitor was set in the front of the test vehicle and recorded
the milepost, date, time, vehicle speed and the right side of the roadway. By viewing the
videotapes utilizing the slow motion function of the VCRs, the access type and location
could be identified. The error difference is within the range of 0.001 miles, which was
considered adequate for the scope of this study. The access point information has been
extracted from the seven video tapes including Routes 21, 27, 28, 33, 35, 82 for years
1991, 1992, 1993, 1994 and 1995.
All the accidents referred to throughout this study are the reported accidents on
these routes. Based on previous studies, it is expected that the reported accidents are only
25

26
a fraction of the total. The reported accident records were provided by the Office of
Telecommunications and Information, Department of the Treasury through NJDOT, in a
diskette containing data from reports MACLSTRT-1 and MACLSTRT-2 for the years
1989 through 1994, except for 1990. The accident database is contained in self-extracting
files, which include: the route number, milepost, location, collision type, vehicle
direction, vehicle type, and vehicle action. They also contain data on weather, surface,
light, time, date, number of persons killed and injured, etc. The accident data were
converted into a Microsoft Access data format from the original format of the data sets
provided by NJDOT.
Traffic volume data were obtained by accessing the NJDOT database system
through their computerized Bulletin Board.
The data collected are summarized as follows:
• Reported accident data ( MACLSTRT-1 and MACLSTRT-2 ); Years 1989, 1991,
1992, 1993, 1994,
• NJ state-line diagrams (1996),
• Access point information ( 7 videotapes from years 1991 to 1995),
• AADT data from 1992 to 1996 for the selected routes under investigation (NJDOT
Bulletin Board).

CHAPTER 5
ACCIDENT ANALYSIS AND RESULTS
5.1 Accident Analysis in General
In this study, the reported accident analysis is based on a NJDOT data file "Detail of
Motor Vehicle Accidents On Mileposted Highways In Route & Milepost Order", which
is also known as "MACLSTRT-2". The accident records retrieved for this study cover the
period from January 1, 1994 to December 31, 1994. The routes in this study include
Routes 21, 27, 28, 33 and 35. Each reported accident record in MACLSTRT-2 includes
the following information: collision types, vehicle directions, vehicle type, vehicle
actions, weather conditions, road surface conditions, light conditions, month/date, day of
week, hour, vehicle contribution circumstances, and the location of accidents (at
intersections / between intersections). In each reported record, the number of injured and
killed are also recorded.
The research objective of this study is to conduct an analysis of the impact of
access driveways on accidents, the accidents occurred at signalized intersections are
beyond the scope of this study. The accident records in MACLSTRT-2 are classified into
two groups:
1) Section-accidents: accidents occurred between signalized intersections are defined as
section-accidents and,
27
28
2) Intersection-accidents: accidents occurred at intersections are defined as intersection-
accidents. Section-accidents are considered to be more likely to be affected by access
driveways.
Although intersection-accidents are not the primary concern of this study; they are
included for comparison purposes.
In this section a comparison study is conducted between intersection-accidents and
section-accidents for each route by collision types, vehicle actions, weather conditions,
road surface conditions, light conditions, month, day of week, hour and vehicle
contribution circumstances. In the collision type comparison, collision types are divided
into same-direction-rear, same-direction-side, left turn collisions, collision with objects,
overturn, strike parking vehicle, pedestrian, angle collision, head-on, and other collision
types. For each of these subgroups, the percentage (same-direction-rear, same-direction-
side, left turn collisions, collision with objectives, overturn, strike parking vehicle,
pedestrian, angle collision, head-on, and other collision) is calculated for both section-
accidents and intersection-accidents, and a comparison bar chart is drawn for each of the
subgroups.
5.1.1 Accident Analysis by Location
The percentage of section-accidents as part of the total number of accidents occurring on
all routes (Route 21,27, 28, 33, and 35) and the percentage of section-accidents per route
are presented in Figures 5.1 and 5.2, respectively.
As seen from the figures, the percentage of section-accidents is approximately 30%
for all routes, with the exception of Route 21. Route 21 is not taken into consideration
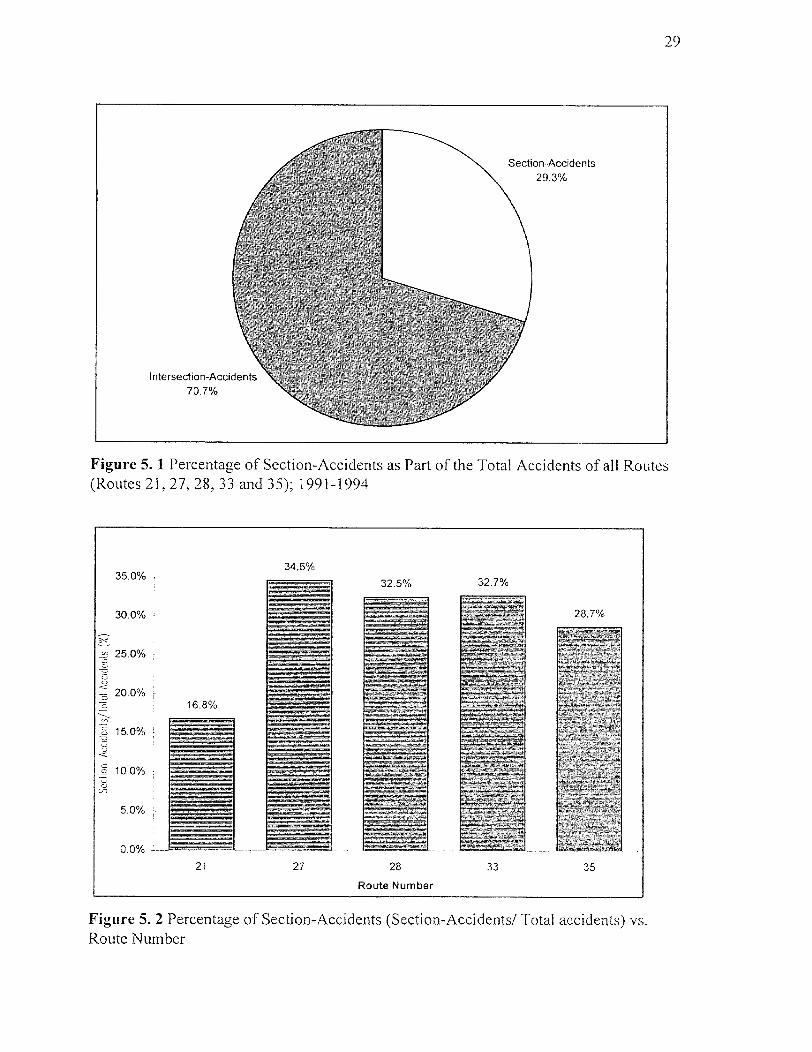
Figure 5. 1 Percentage of Section-Accidents as Part of the Total Accidents of all Routes (Routes 21, 27, 28, 33 and 35); 1991-1994
Figure 5. 2 Percentage of Section-Accidents (Section-Accidents/ Total accidents) vs. Route Number
29

30
because of its small sample size. These values indicate that the majority (about 70%) of
accidents occurred at signalized intersections, and only about 30% of the accidents
occurred between intersections. The 30% accidents could be caused either by vehicles
entering or exiting midblock access points or by vehicles passing through the road
segment. The number of accidents occurring in the vicinity of access points can only be
identified with the help of access location information, which is addressed later in this
report.
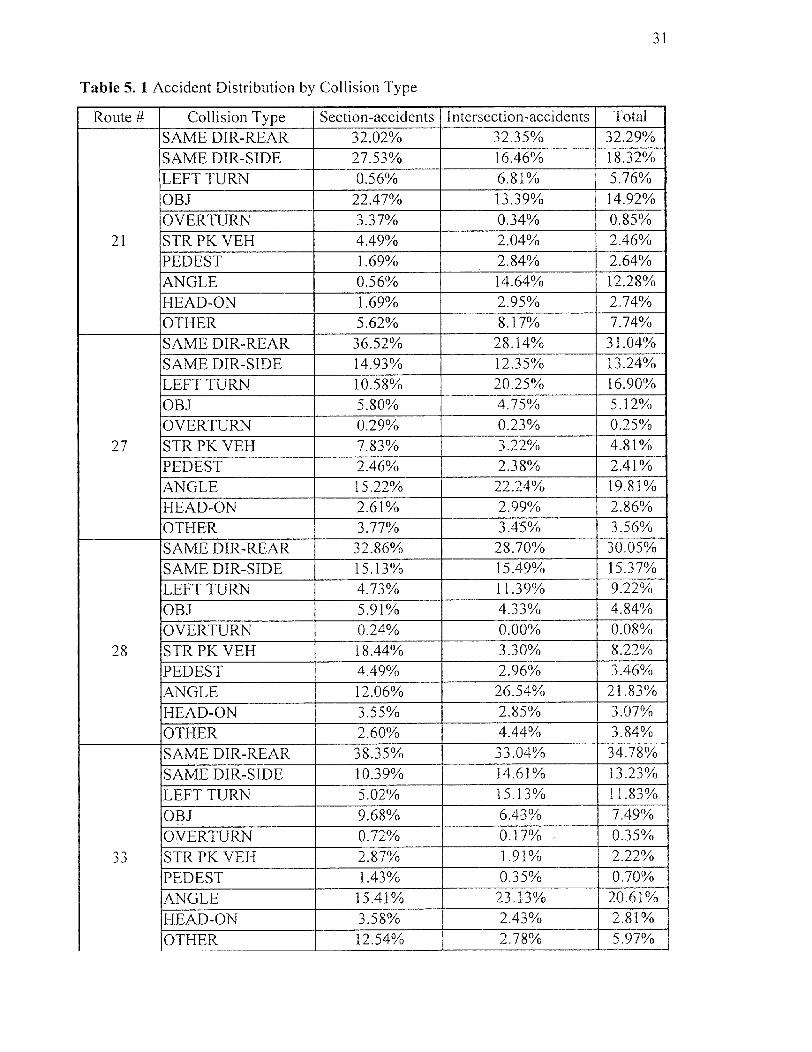
5.1.2 Accident Analysis by Collision Type
In this section, a comparison of section-accidents and intersection-accidents is conducted
based on collision types. In MACLSTRT-2, collision types are divided into the following
categories: same direction rear collision (SAME DIR-REAR), same direction side
collision (SAME DIR-SIDE), left turn collision (LEFT TURN), collision with objectives
(OBJ), overturn (OVERTURN), strike parking vehicles (STR PK VEH), collision with
pedestrians (PEDEST), angle collision (ANGLE), head-on collision (HEAD-ON), and
other collisions (OTHER). The percentages of the types of collisions are summarized in
Table 5.1 and a series of bar charts.
The percentages of left turn collisions and angle collisions of intersection-accidents
are higher that those of section-accidents (See Figures 5.3 and 5.8, respectively). This
observation can be justified by the fact that more left turning movements occur at
intersections in comparison to those occurring between intersections.
31
Table 5. 1 Accident Distribution by Collision Type
Route # Collision Type Section-accidents Intersection-accidents Total
21
SAME DIR-REAR 32.02% 32.35% 32.29%
SAME DIR-SIDE 27.53% 16.46% 18.32%
LEFT TURN 0.56% 6.81% 5.76%
OBJ 22.47% 13.39% 14.92%
OVERTURN 3.37% 0.34% 0.85% STR PK VEH 4,49%© 2.04% 2.46%
PEDEST 1.69% 2.84% 2.64%
ANGLE 0.56% 14.64% 12.28%
HEAD-ON 1.69% 2.95% 2.74%
OTHER 5.62% 8.17% 7.74%
27
SAME DIR-REAR 36.52% 28.14% 31.04%
SAME DIR-SIDE 14.93% 12.35% 13.24%
LEFT TURN 10.58% 20.25% 16.90%
OBJ 5.80% 4.75% 5.12%
OVERTURN 0.29% 0.23% 0.25%
STR PK VEH 7.83% 3.22% 4.81%
PEDEST 2.46% 2.38% 2.41%
ANGLE 15.22% 22.24% 19.81%
HEAD-ON 2.61% 2.99% 2.86%
OTHER 3.77% 3.45% 3.56%
28
SAME DIR-REAR 32.86% 28.70% 30.05%
SAME DIR-SIDE 15.13% 15.49% 15.37%
LEFT TURN 4.73% 11.39% 9.22% OBJ 5.91% 4.33% 4.84%
OVERTURN 0.24% 0.00% 0.08%
STR PK VEH 18.44% 3.30% 8.22%
PEDEST 4.49% 2.96% 3.46%
ANGLE 12.06% 26.54% 21.83%
HEAD-ON 3.55% 2.85% 3.07%
OTHER 2.60% 4.44% 3.84%
33
SAME DIR-REAR 38.35% 33.04% 34.78%
SAME DIR-SIDE 10.39% 14.61% 13.23%
LEFT TURN 5.02% 15.13% 11.83%
OBJ 9.68% 6.43% 7.49%
OVERTURN 0.72% 0.17% 0.35%
STR PK VEH 2.87% 1.91% 2.22%
PEDEST 1.43% 0.35% 0.70%
ANGLE 15.41% 23.13% 20.61%
HEAD-ON 3.58% 2.43% 2.81%
OTHER 12.54% 2.78% 5.97%

32
Table 5.1 (Continued)
Route # Collision Type Section-accidents Intersection-accidents Total
35
SAME DIR-REAR 39.74% 39.40% 39.50% SAME DIR-SIDE 18.48% 17.67% 17.90% LEFT TURN 3.52% 9.84% 8.03% OBJ 13.64% 6.60% 8.61% OVERTURN 0.29% 0.12% 0.17% STR PK VEH 3.52% 0.88% 1.64% PEDEST 2.20% 1.35% 1.60% ANGLE 11.44% 19.91% 17.48% HEAD-ON 3.37% 1.65% 2.14% OTHER 3.81% 2.59% 2.94%
Figure 5. 3 Same Direction Rear Collision Section-Accidents (%) and Intersection-Accidents (%) vs. Route Number
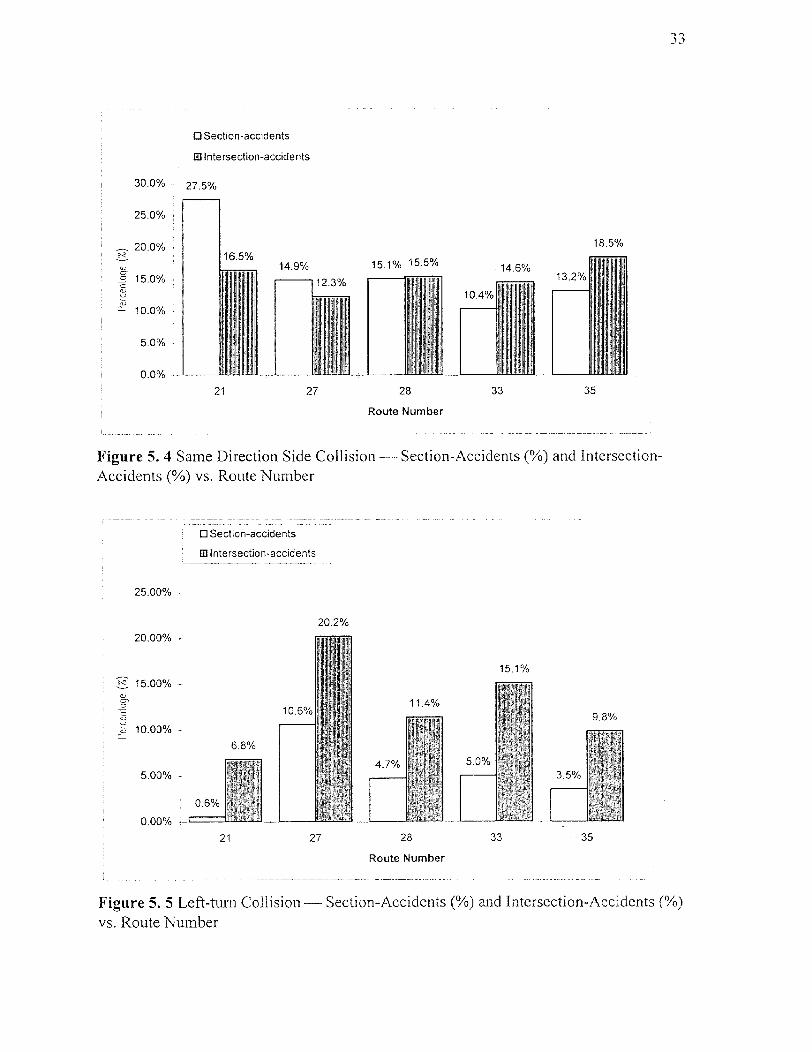
Figure 5. 4 Same Direction Side Collision — Section-Accidents (%) and Intersection-Accidents (%) vs. Route Number
Figure 5. 5 Left-turn Collision— Section-Accidents (%) and Intersection-Accidents (%) vs. Route Number
33
34
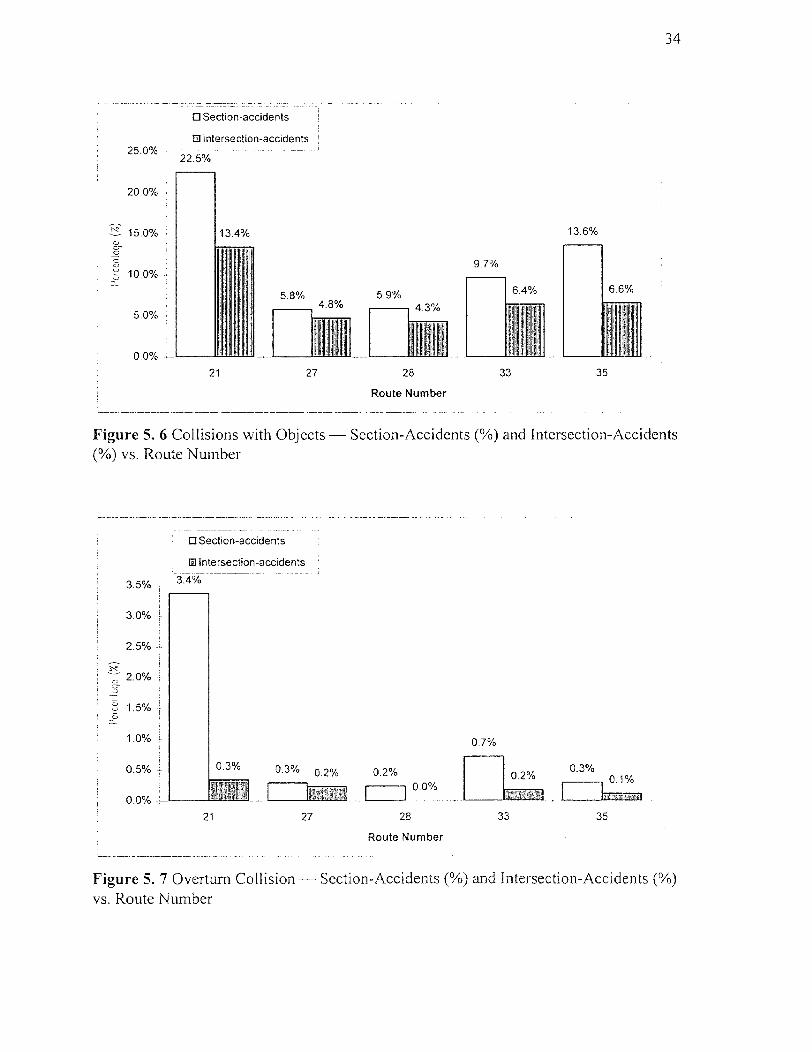
Figure 5. 6 Collisions with Objects — Section-Accidents (%) and Intersection-Accidents (%) vs. Route Number
Figure 5. 7 Overturn Collision Section-Accidents (%) and intersection-Accidents (%) vs. Route Number
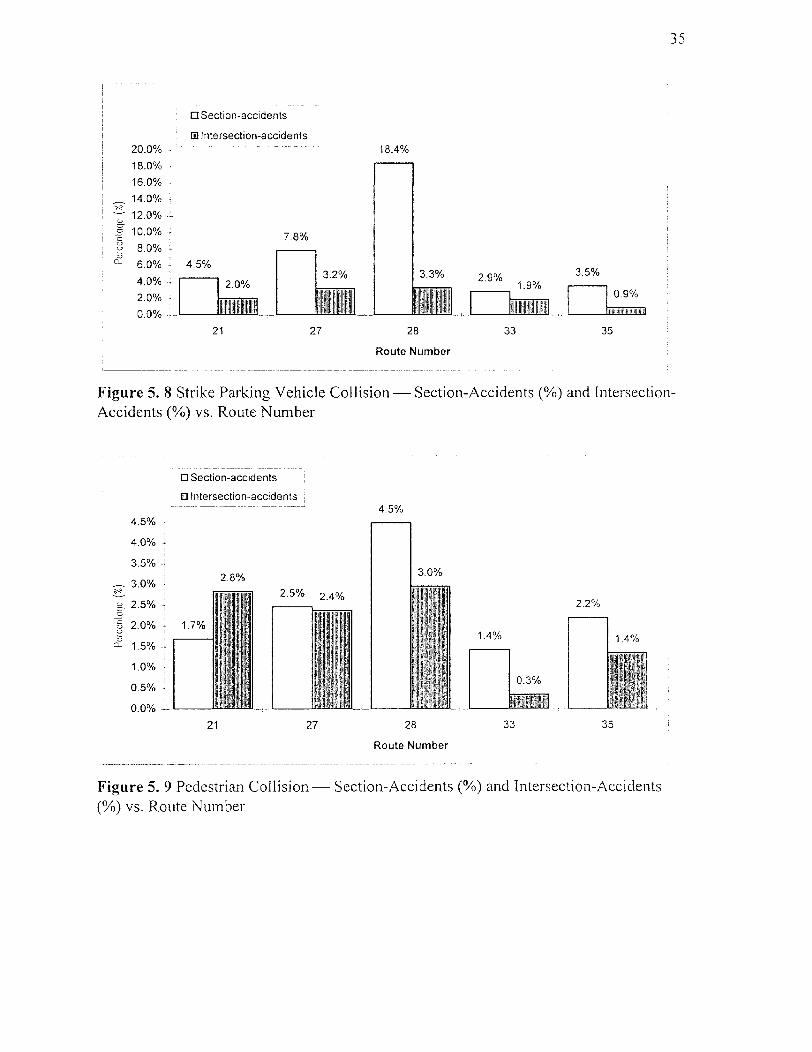
Figure 5. 8 Strike Parking Vehicle Collision — Section-Accidents (%) and Intersection-Accidents (%) vs. Route Number
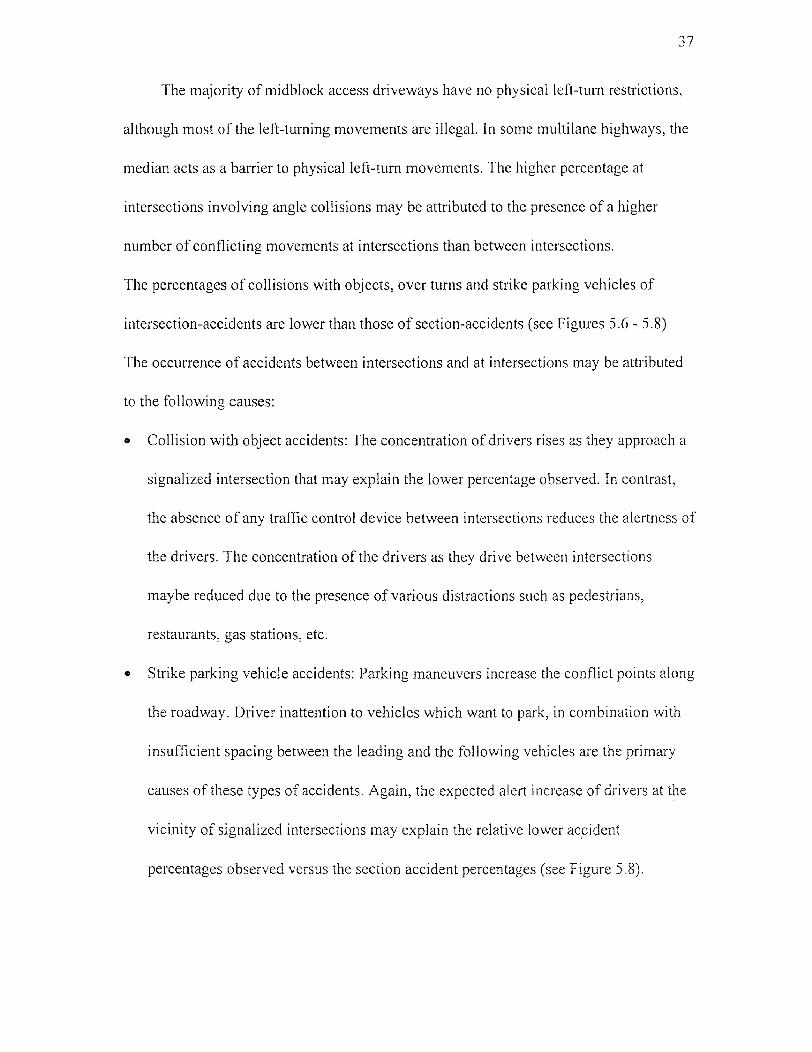
Figure 5. 9 Pedestrian Collision — Section-Accidents (%) and Intersection-Accidents (%) vs. Route Number
35

36
Figure 5. 10 Angel Collision — Section-Accidents (%) and Intersection-Accidents (%) vs. Route Number
Figure 5. 11 Head-on Collision — Section-Accidents (%) and Intersection-Accidents (%) vs. Route Number
37
The majority of midblock access driveways have no physical left-turn restrictions,
although most of the left-turning movements are illegal. In some multilane highways, the
median acts as a barrier to physical left-turn movements. The higher percentage at
intersections involving angle collisions may be attributed to the presence of a higher
number of conflicting movements at intersections than between intersections.
The percentages of collisions with objects, over turns and strike parking vehicles of
intersection-accidents are lower than those of section-accidents (see Figures 5.6 - 5.8)
The occurrence of accidents between intersections and at intersections may be attributed
to the following causes:
• Collision with object accidents: The concentration of drivers rises as they approach a
signalized intersection that may explain the lower percentage observed. In contrast,
the absence of any traffic control device between intersections reduces the alertness of
the drivers. The concentration of the drivers as they drive between intersections
maybe reduced due to the presence of various distractions such as pedestrians,
restaurants, gas stations, etc.
• Strike parking vehicle accidents: Parking maneuvers increase the conflict points along
the roadway. Driver inattention to vehicles which want to park, in combination with
insufficient spacing between the leading and the following vehicles are the primary
causes of these types of accidents. Again, the expected alert increase of drivers at the
vicinity of signalized intersections may explain the relative lower accident
percentages observed versus the section accident percentages (see Figure 5.8).
38
• Head-on collision accidents: The occurrence of these accidents may be attributed to
driver aggressiveness entering into the lanes of the opposing traffic. The results here
are mixed for the different routes examined.
• Collisions with pedestrians: The occurrence of these accidents at signalized
intersections may be attributed to both drivers and pedestrians. The occurrence of
these accidents between intersections may primarily be attributed to pedestrians trying
to cross the highway or arterial, or standing/walking near the curb. However, driver
inattention and speeding may also contribute to these accidents. With the exception of
Route 21, signalized intersection accidents exhibit lower accident percentages than
the corresponding section accident percentages.
5.1.3 Accident Analysis by Vehicle Action
Comparisons of section-accidents and intersection-accidents by vehicle actions are
presented in this section. In MACLSTRT-2, vehicle actions are classified into right-turn,
left-turn, going straight, changing lanes, merging, backing, and others. In this study, only
left-turn and right-turn actions were taken into consideration. In MACLSTRT-2 accident
records, the actions of both vehicles are recorded. As long as any one of the two vehicles
is in left-turn or right-turn actions, the accident is considered as a left-turn accident or a
right-turn accident, respectively, (see Figure 5.12).
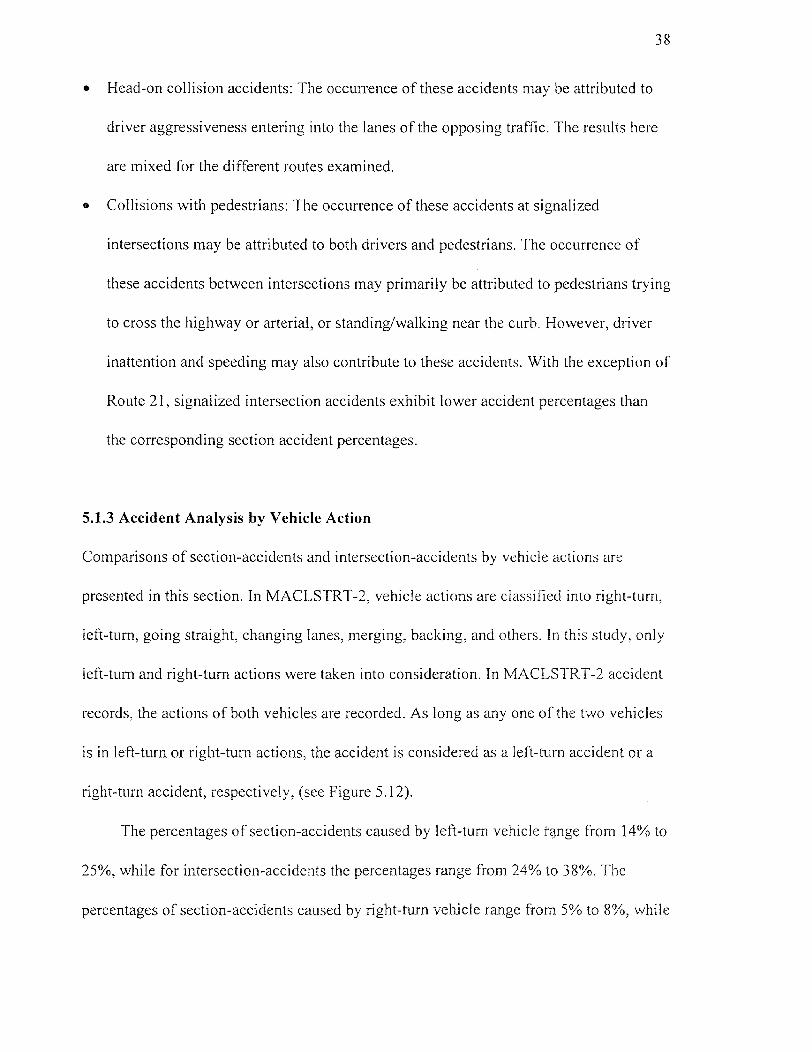
The percentages of section-accidents caused by left-turn vehicle range from 14% to
25%, while for intersection-accidents the percentages range from 24% to 38%. The
percentages of section-accidents caused by right-turn vehicle range from 5% to 8%, while
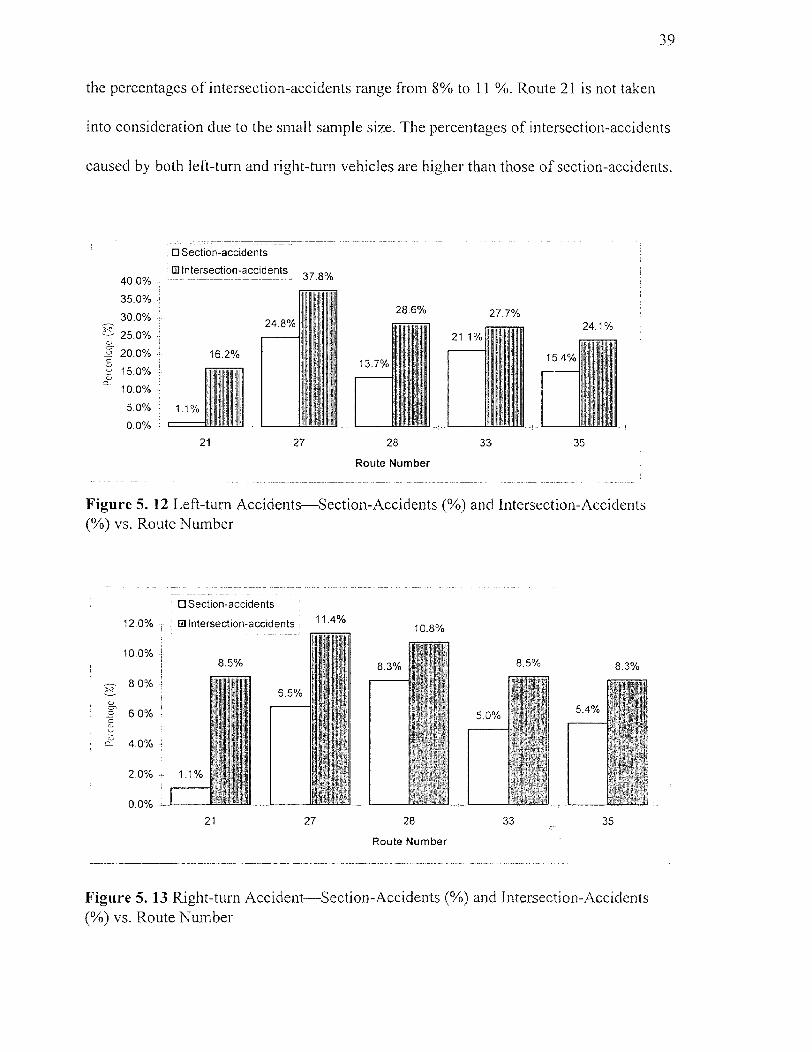
39
the percentages of intersection-accidents range from 8% to 11 %. Route 21 is not taken
into consideration due to the small sample size. The percentages of intersection-accidents
caused by both left-turn and right-turn vehicles are higher than those of section-accidents.
Figure 5. 12 Left-turn Accidents—Section-Accidents (%) and Intersection-Accidents (%) vs. Route Number
Figure 5. 13 Right-turn Accident—Section-Accidents (%) and Intersection-Accidents (%) vs. Route Number
40
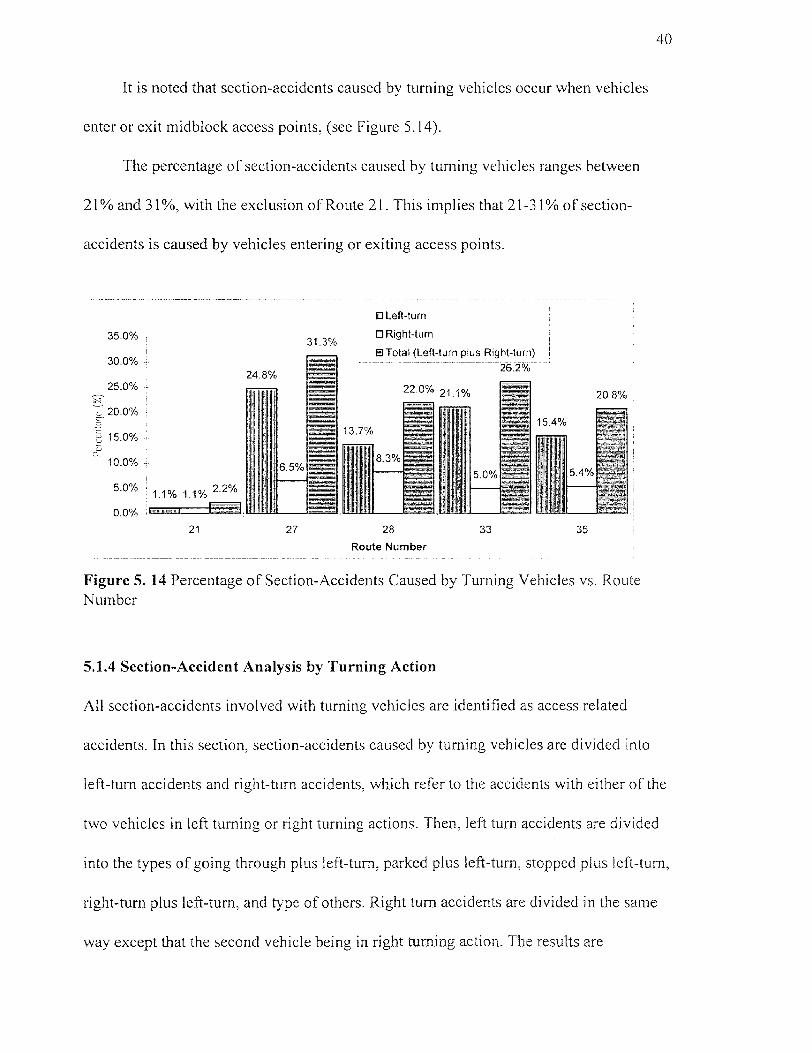
It is noted that section-accidents caused by turning vehicles occur when vehicles
enter or exit midblock access points, (see Figure 5.14).
The percentage of section-accidents caused by turning vehicles ranges between
21% and 31%, with the exclusion of Route 21. This implies that 21-31% of section-
accidents is caused by vehicles entering or exiting access points.
Figure 5. 14 Percentage of Section-Accidents Caused by Turning Vehicles vs. Route Number
5.1.4 Section-Accident Analysis by Turning Action
All section-accidents involved with turning vehicles are identified as access related
accidents. In this section, section-accidents caused by turning vehicles are divided into
left-turn accidents and right-turn accidents, which refer to the accidents with either of the
two vehicles in left turning or right turning actions. Then, left turn accidents are divided
into the types of going through plus left-turn, parked plus left-turn, stopped plus left-turn
right-turn plus left-turn, and type of others. Right turn accidents are divided in the same
way except that the second vehicle being in right turning action. The results are

41
summarized in Figures 5.15 and 5.16 for the left-turn and right-turn accidents,
respectively.
Figure 5. 15 Left-turn Section-Accidents Percentage by Type
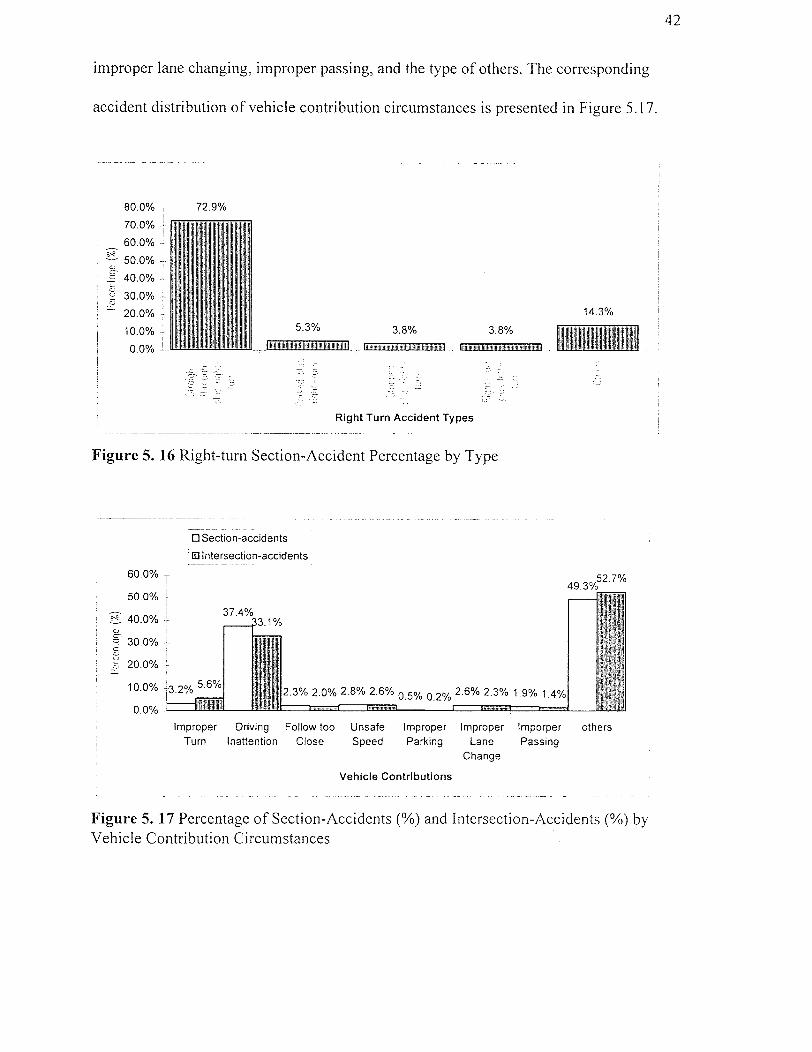
Figures 5.15 and 5.16 indicate that the majority of section-accidents involved with
turning vehicles are caused by a straight through vehicle (main road) and a turning
vehicle which could be either entering or exiting an access point. The accident
percentages are 88% and 73%, for left-turn and right-turn accidents respectively. This
result implies that a large portion of access related accidents are caused by a vehicle
moving straight through on the main road and a vehicle entering or exiting an access
point.
5.1.5 Accident Analysis by Vehicle Contribution Circumstance
In database MACLSTRT-2, vehicle contribution circumstances are divided into improper
turning, driving inattention, following too close, unsafe speed, improper parking,
42
improper lane changing, improper passing, and the type of others. The corresponding
accident distribution of vehicle contribution circumstances is presented in Figure 5.17.
Figure 5. 16 Right-turn Section-Accident Percentage by Type
Figure 5. 17 Percentage of Section-Accidents (%) and Intersection-Accidents (%) by Vehicle Contribution Circumstances

43
5.1.6 Accident Analysis by Weather Condition
The weather conditions can be classified into three groups: clear, rain, and snow. In this
section a comparison of the impact of weather conditions on section-accidents and
intersection-accidents is conducted by calculating the percentage of accidents reported
under different weather conditions for each route. See Figures 5.18 to 5.20.
As seen from Figures 5.18 and 5.19, clear and rain weather conditions do not show
any apparent difference between section-accidents and intersection-accidents. It is noted
though that for Routes 21 to 35, intersection-accidents exhibit a much higher accident
occurrence percentage than the corresponding section-accidents. It is observed in Figure
5.20, for all the routes, that the percentages of section-accidents reported are higher than
those of intersection-accidents.
Figure 5. 18 Percentage of Section-Accidents (%) and Intersection-Accidents (%) under Clear Weather Conditions

44
Figure 5. 19 Percentage of Section-Accidents (%) and Intersection-Accidents (%) under Rain Weather Conditions
Figure 5. 20 Percentage of Section-Accidents (%) and Intersection-Accidents (%) under Snow Weather Conditions

45
5.1.7 Accident Analysis by Surface Condition
Surface conditions are very important in safety analysis, since a substantial number of
accidents occur when the roadway surface is in bad condition. Surface conditions are
closely related to weather conditions, however they are not identical. A bad weather may
only last for one day, but bad surface conditions may last for several days even after the
bad weather is gone. Based on the information in MACLSTRT-2, surface conditions are
grouped into dry, wet, snow and ice. This classification parallels the classification of
weather conditions that include clear, rain, and snow. The percentages of accidents for
different surface conditions were calculated both for section-accidents and intersection-
accidents. The results are presented in Figures 5.21, 5.22 and 5.23, for dry, wet, snow and
ice pavement surface conditions, respectively.
The results of the accidents under dry surface conditions (Figure 5.21) show no
apparent difference between section-accidents and intersection-accidents. Under wet
surface conditions (Figure 5.22), the percentages of intersection-accidents are slightly
higher than the percentages of section-accidents, except for route 35. However, under
snow and ice surface conditions, the percentages of section-accidents are higher than the
percentages of intersection-accidents. The results of the surface condition analysis are
consistent with those of weather condition analysis.

46
Figure 5. 21 Percentage of Section-Accidents (%) and Intersection-Accidents (%) under Dry Pavement Surface Conditions
Figure 5. 22 Percentage of Section-Accidents (%) and Intersection-Accidents (%) under Wet Pavement Surface Conditions

47
Figure 5. 23 Percentage of Section-Accidents (%) and Intersection-Accidents (%) under Snow and Ice Pavement Surface Conditions
5.1.8 Accident Analysis by Light Condition
Light conditions are divided into DAY, DARK, and DNDK (Dawn plus Daybreak). The
percentages of section-accidents and intersection-accidents occurred under different light
conditions are presented in Figures 5.24, 5.25, and 5.26, respectively.
As seen from Figures 5.24, 5.25, and 5.26, the majority of accidents occur during
day light conditions. With the exception of Route 21, which is not typical because of its
small sample size, over 70% of all the accidents occur in day light conditions. The
percentages of accidents occurring in dark light conditions range between 20% and 30%.
Day light and dark light conditions do not show any significant difference on the patterns
of section-accidents and intersection-accidents.

48
Figure 5. 24 Percentage of Section-Accidents (%) and Intersection-Accidents (%) under Daytime Conditions
Figure 5. 25 Percentage of Section-Accidents (%) and Intersection-Accidents (%) under Dark Conditions
49
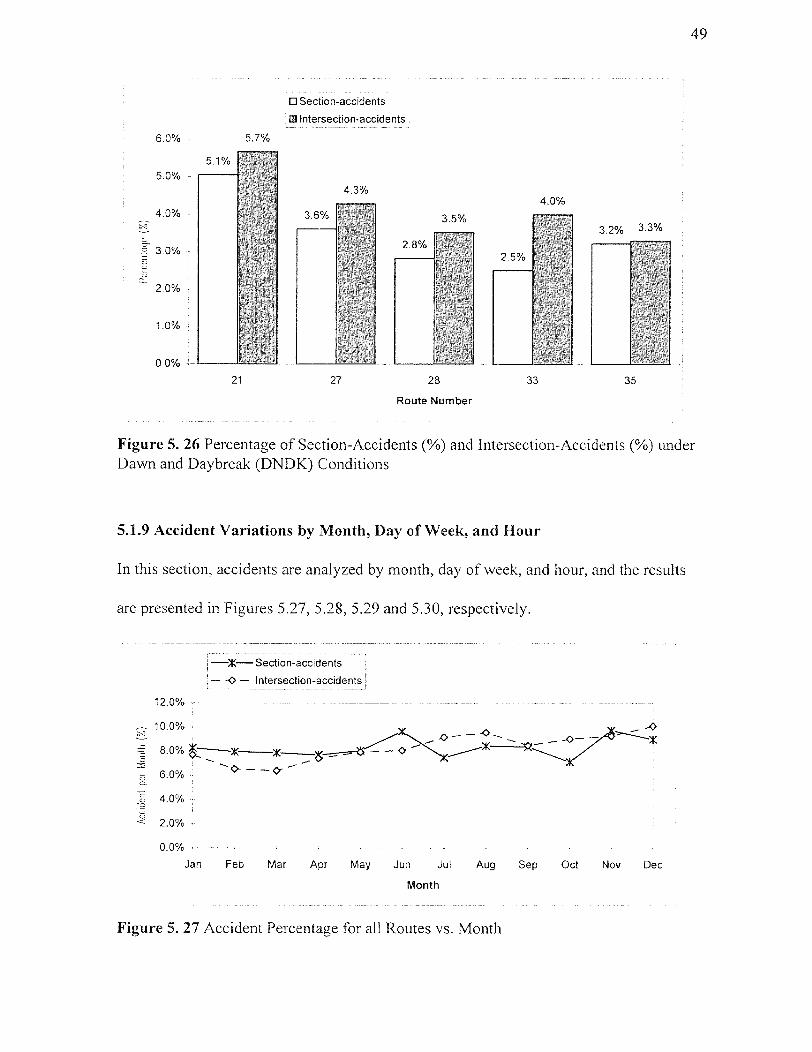
Figure 5. 26 Percentage of Section-Accidents (%) and Intersection-Accidents (%) under Dawn and Daybreak (DNDK) Conditions
5.1.9 Accident Variations by Month, Day of Week, and Hour
In this section, accidents are analyzed by month, day of week, and hour, and the results
are presented in Figures 5.27, 5.28, 5.29 and 5.30, respectively.
Figure 5. 27 Accident Percentage for all Routes vs. Month

50
The intersection-accidents exhibit a monthly accident range between 6.4% to
10.1%, while the section-accidents range from 7.1% to 9.7%. It is noted that, for the first
half of a year, the monthly percentages of intersection-accidents are lower than those of
section-accidents, but for the second half of the year, the trend is the opposite.
The accident analysis by day of the week was divided into two categories,
weekdays and weekends. The accident occurrences of different weekdays do no show an:
significant differences between each other. Similarly, the accident occurrences on
Saturdays and Sundays also show no substantial variations. The percentages of accidents
occurred on weekdays and weekends were calculated for both section-accidents and
intersection-accidents, and the results are shown in Figures 5.28 and 5.29 for each
category, respectively.
Figure 5. 28 Percentage of Section-Accidents (%) and Intersection-Accidents (%) on
Weekdays vs. Route Number

51
Figure 5. 29 Percentage of Section-Accidents (%) and Intersection-Accidents (%) on Weekends vs. Route Number
The percentages of weekday and weekend accidents were then combined into a
single database for both the section-accidents and intersection-accidents. The average
accident probabilities for the weekdays and weekends were found to be 71% and 29%,
respectively.
As observed in Figure 5.28, the percentages of the weekday section-accidents range
from 71% to 77%, while for intersection-accidents the range is from 73% to 79%. The
percentages of intersection-accidents on weekdays are higher than the percentages of
section-accidents. On the other hand, the distribution of accidents on weekends shows an
opposite pattern, the percentage of weekend section-accidents are higher than those of
intersection-accidents. The hourly accident distributions is shown in Figure 5.30.
The hourly distribution patterns of section-accidents and intersection-accidents are very
similar. The lowest accident rate occurs between 4:00am to 5:00am, and then it starts to
climb continuously. Between 5:00pm to 6:00pm, the accident rate reaches its peak, and

52
then starts to decline until the period of 4:00am to 5:00am, where the next cycle starts.
The high accident rates in the period of 3:00pm to 6:00pm are consistent with the
afternoon peak traffic. However, in the morning peak hour (for most routes, it is within
the period of 7:00am to 11:00am), the accident rates are not as high as might have been
expected. The period of the least occurrence of accidents is the early morning from
4:00am to 6:00am.
Figure 5. 30 Accident Percentage (%) versus Hour of the Day
5.2 Relationship between Access Points and Accidents
Filtering the reported accidents which occurred at intersections out, the relationship
between accidents and access points is analyzed for each route. The relationships between
accidents caused by turning traffic and access points are also analyzed along the milepost
53
for each route. Although trials for identifying the types of access points have been
conducted, the milepost can not provide a reliable base in identifying the correlation
between accident location and the corresponding access point. Therefore, a classified
analysis of the relationship between the three types of access points, commercial access,
gas stations, and residential access, and accidents could not be carried out.
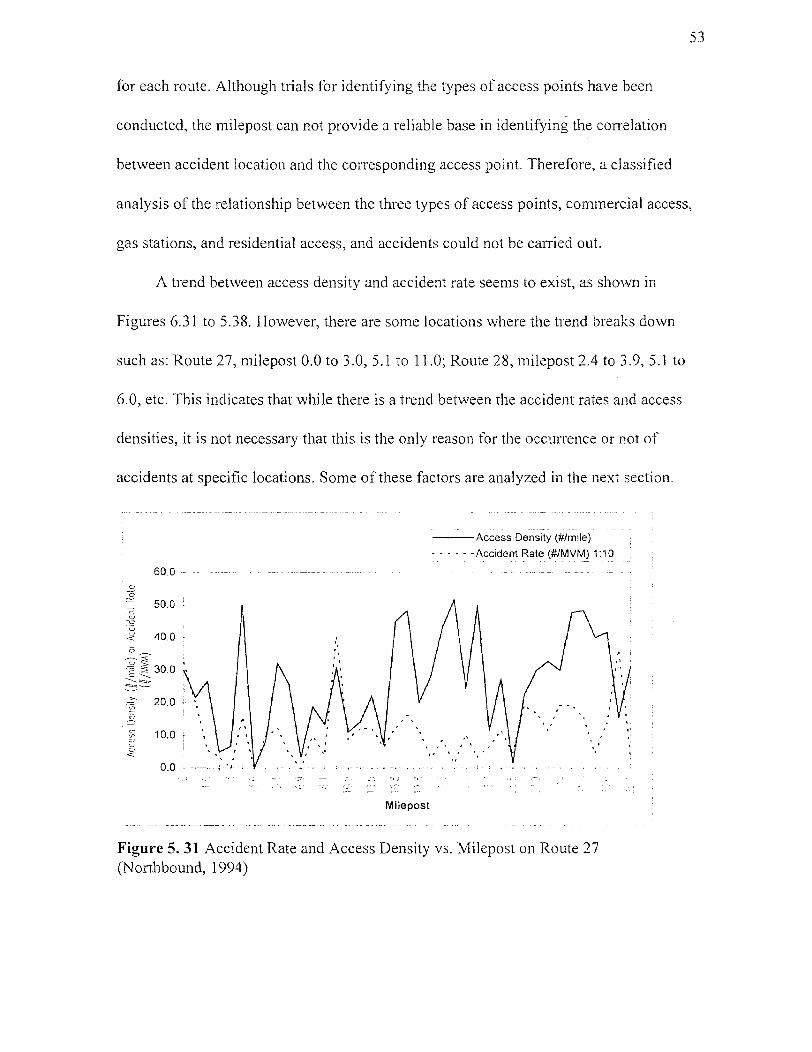
A trend between access density and accident rate seems to exist, as shown in
Figures 6.31 to 5.38. However, there are some locations where the trend breaks down
such as: Route 27, milepost 0.0 to 3.0, 5.1 to 11.0; Route 28, milepost 2.4 to 3.9, 5.1 to
6.0, etc. This indicates that while there is a trend between the accident rates and access
densities, it is not necessary that this is the only reason for the occurrence or not of
accidents at specific locations. Some of these factors are analyzed in the next section.
Figure 5. 31 Accident Rate and Access Density vs. Milepost on Route 27 (Northbound, 1994)
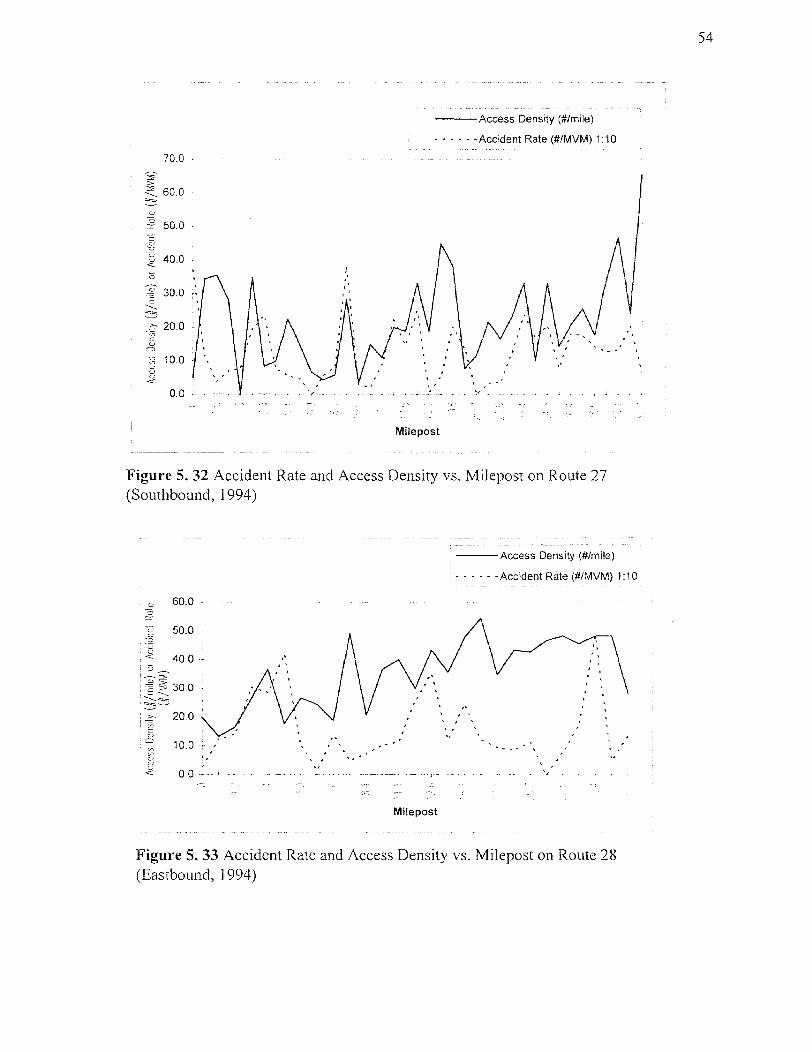
Figure 5. 32 Accident Rate and Access Density vs. Milepost on Route 27 (Southbound, 1994)
Figure 5. 33 Accident Rate and Access Density vs. Milepost on Route 28 (Eastbound, 1994)
54
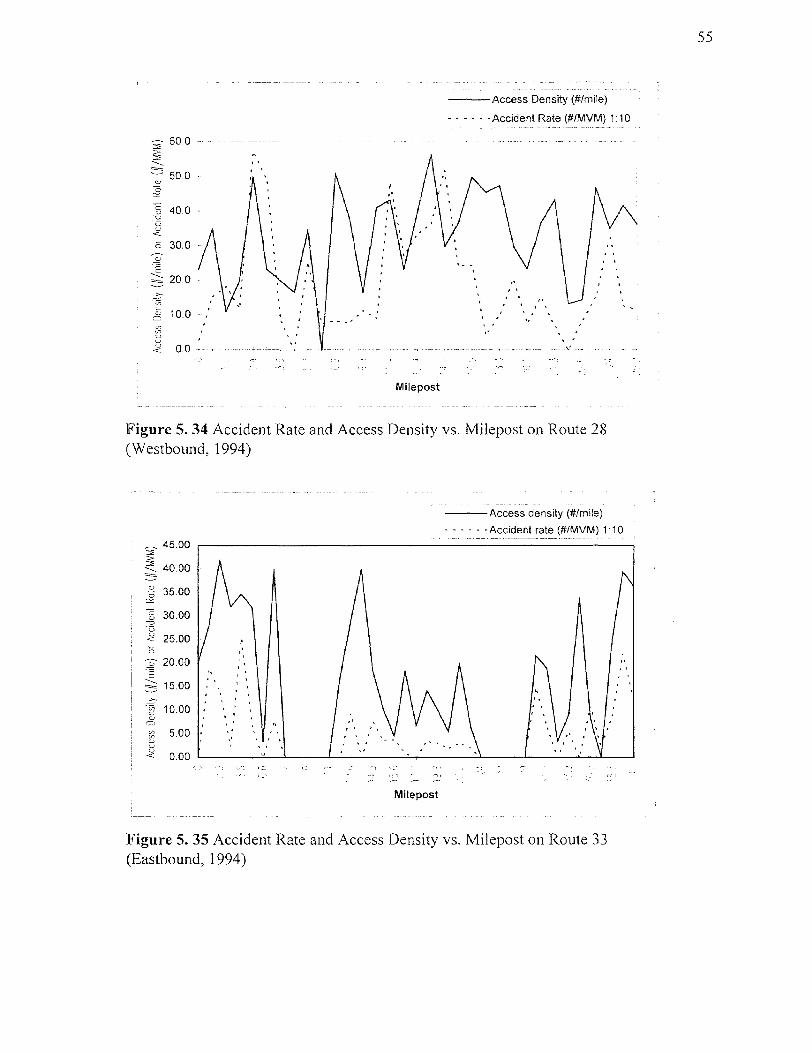
Figure 5. 34 Accident Rate and Access Density vs. Milepost on Route 28 (Westbound, 1994)
Figure 5. 35 Accident Rate and Access Density vs. Milepost on Route 33 (Eastbound, 1994)
55
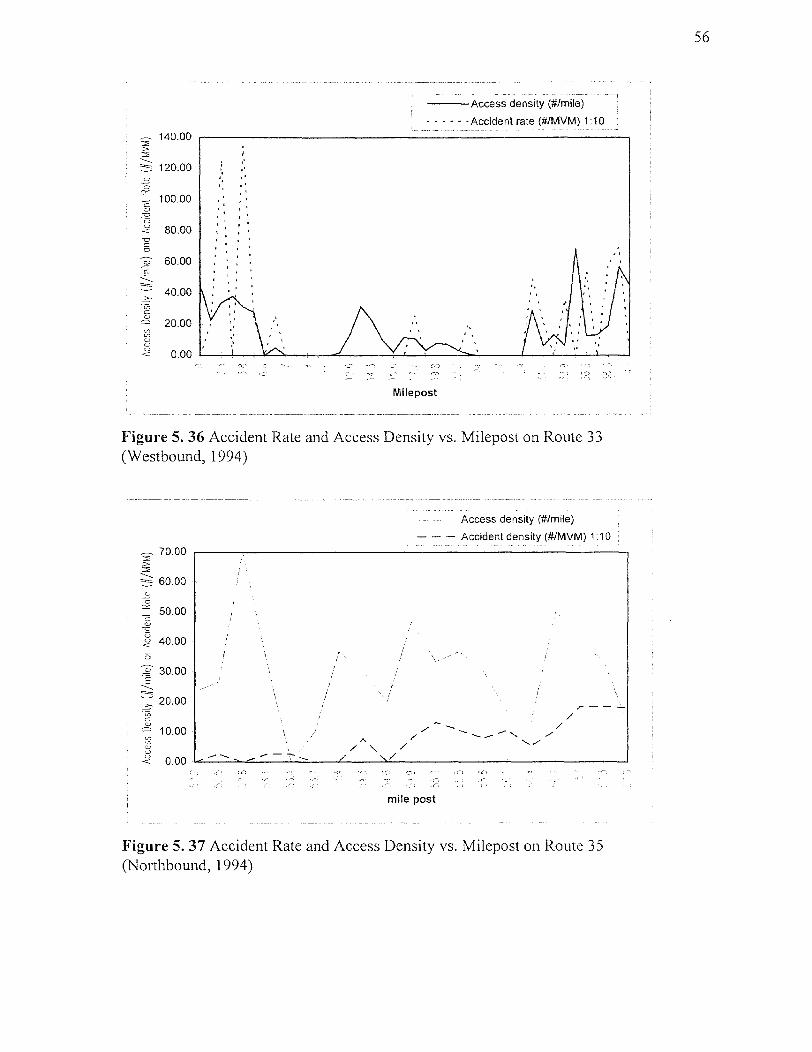
Figure 5. 36 Accident Rate and Access Density vs. Milepost on Route 33 (Westbound, 1994)
Figure 5. 37 Accident Rate and Access Density vs. Milepost on Route 35 (Northbound, 1994)
56
57
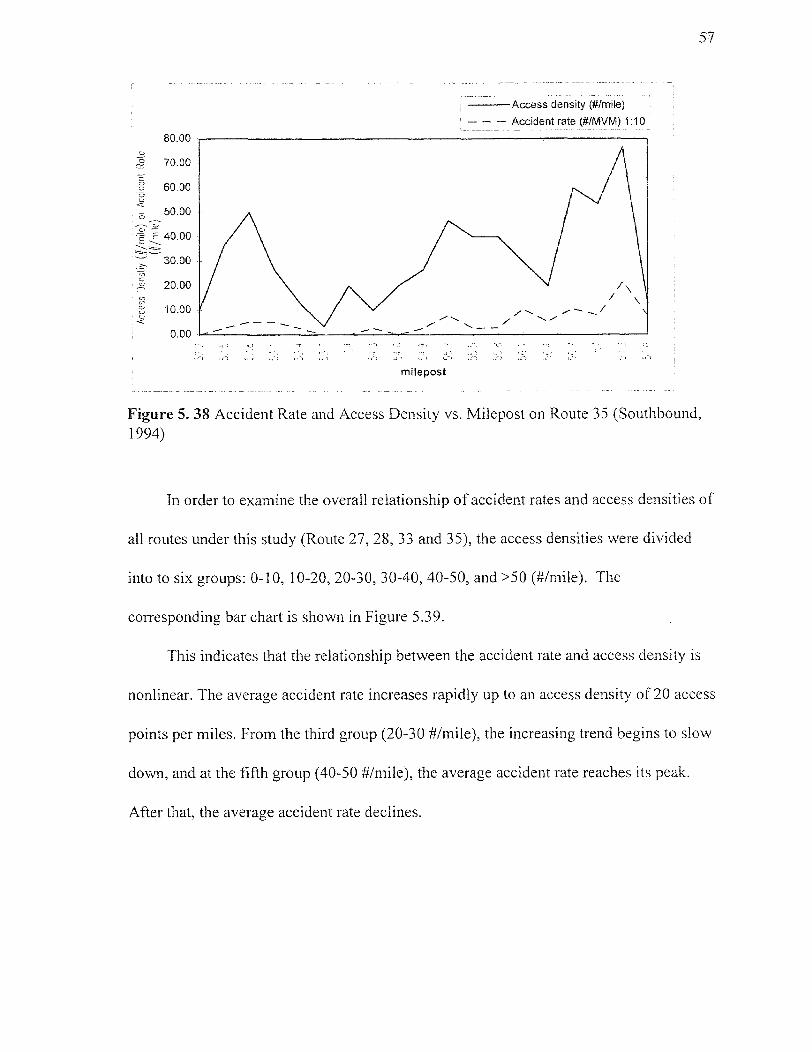
Figure 5. 38 Accident Rate and Access Density vs. Milepost on Route 35 (Southbound, 1994)
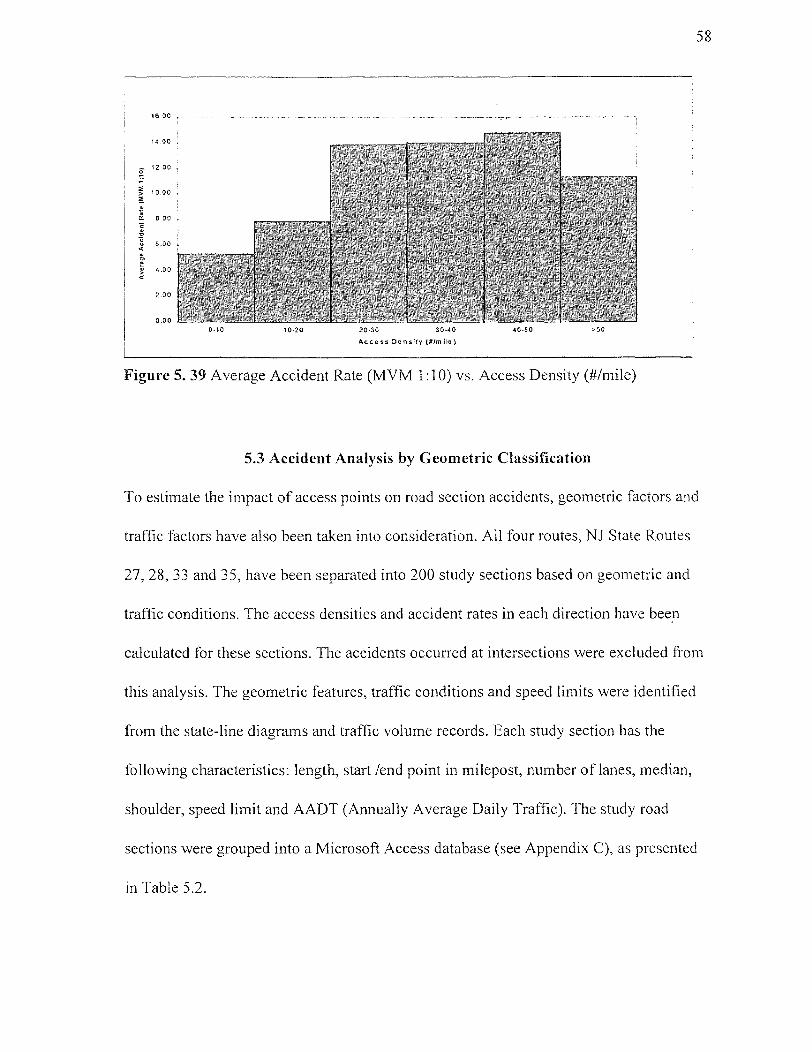
In order to examine the overall relationship of accident rates and access densities of
all routes under this study (Route 27, 28, 33 and 35), the access densities were divided
into to six groups: 0-10, 10-20, 20-30, 30-40, 40-50, and >50 (#/mile). The
corresponding bar chart is shown in Figure 5.39.
This indicates that the relationship between the accident rate and access density is
nonlinear. The average accident rate increases rapidly up to an access density of 20 access
points per miles. From the third group (20-30 #/mile), the increasing trend begins to slow
down, and at the fifth group (40-50 #/mile), the average accident rate reaches its peak.
After that, the average accident rate declines.
58
Figure 5. 39 Average Accident Rate (MVM 1:10) vs. Access Density (#/mile)
5.3 Accident Analysis by Geometric Classification
To estimate the impact of access points on road section accidents, geometric factors and
traffic factors have also been taken into consideration. All four routes, NJ State Routes
27, 28, 33 and 35, have been separated into 200 study sections based on geometric and
traffic conditions. The access densities and accident rates in each direction have been
calculated for these sections. The accidents occurred at intersections were excluded from
this analysis. The geometric features, traffic conditions and speed limits were identified
from the state-line diagrams and traffic volume records. Each study section has the
following characteristics: length, start /end point in milepost, number of lanes, median,
shoulder, speed limit and AADT (Annually Average Daily Traffic). The study road
sections were grouped into a Microsoft Access database (see Appendix C), as presented
in Table 5.2.

59
Table 5. 2 Sample Access Database of Study Road Sections
Start End Length (mile)
AADT Lane Speed Limit
(mi/hr)
Shoulder Median Access Density (#/mile)
Accident Rate
MVM (1:10)
0.000 0.600 0.600 16000 2 30 Y N 5.00 37.10
0.600 1.500 0.900 16000 2 30 N N 34.44 11.42
1.500 2.400 0.900 16000 2 45 Y N 35.56 3.81
2.400 3.000 0.600 13000 2 45 Y N 28.33 7.02
3.000 3.300 0.300 11700 4 45 Y N 0.00 7.81
3.300 3.900 0.600 11700 2 35 Y N 35.00 19.51
3.900 4.500 0.600 11700 2 45 Y N 8.33 23.42
4.500 5.100 0.600 11700 2 45 Y N 10.00 7.81
5.100 6.300 1.200 20000 2 50 Y N 22.50 5.71
6.300 6.900 0.600 20000 2 50 Y N 15.00 4.57
5.3.1 Number of Lanes
The average access densities, accident rates and the variances for two-lane and four-lane
highways are shown in Table 5.3.
Table 5. 3 Comparison between Two-lane and Four-lane Highway Accident Rates
Highway type Road sections Average access density Average accident rate
(#/mile) Variance (MVM 1:10) Variance
Two-lane 115 26.23 217.03 13.13 153.82
Four-lane 85 26.44 280.56 9.13 72.20
The average access densities are basically the same, but the average accident rate of
two-lane highways is higher than that of four-lane highways by 44 percent. The 1-test
showed that there is a statistically significant difference between the accident rate of two-
lane highways and that of four-lane highways (see Appendix A).

60
5.3.2 Shoulder
Shoulders provide good sight distance for both mainline traffic and entering/exiting
traffic at access points. Additionally, they are used as deceleration/acceleration lanes for
vehicles entering or exiting to/from access points. The accident rates, access densities and
the variances are summarized in Table 5.4. The average access densities of highways
without shoulders are greater than that of highways with shoulders. The average accident
rates for two-lane highway sections without shoulders exhibit higher percentage that the
sections with shoulders. However, the reverse is true for four-lane highways. The t-test
showed that there was a statistically significant difference between the average accident
rate of two-lane highways with shoulder and that of two-lane highways without shoulder.
The t-test showed that there was no statistically significant difference between the
average accident rate of four-lane highways with shoulder and that of four-lane highways
without shoulder.
Table 5. 4 Comparison between Highways with Shoulders and Highways without Shoulders on Accident Rates
Highway type Road sections
Average access density Average accident rate
(#/mile) Variance (MVM 1:10) Variance
2-lane with shoulder 71 21.74 204.88 11.22 123.92
2-lane without shoulder 44 33.47 154.81 16.22 190.32
4-lane with shoulder 48 22.45 263.68 9.60 90.78
4-lane without shoulder 37 31.21 263.25 8.58 50.68
5.3.3 Median
The median separates the opposing traffic streams and reduces access from the mainline
to the access points, and from access points to the mainline. It generally is used to

61
improve the traffic flow operations of the highways. There are 27 road sections with
median and 58 sections without median. The t-test (see Appendix A) shows that there is a
significant difference between the average accident rate of highways with median and
that of highways without median. The same is true for the average access density, (see
Table 5.6).
Table 5. 5 Access Density and Accident Rate on Four-lane highways with/without Median
Highway type Road sections Average access density Average accident rate (#/mile) Variance (MVM 1:10) Variance
Four-lane with median
27 41.24 54.96 19.48 198.35
Four-lane without median
58 33.10 201.48 11.06 61.58
5.3.4 Speed Limit
The speed limit of the NJ State highways studied ranges from 25 mile per hour to 55 mile
per hour. Table 5.7 shows the number of road sections, access densities, accident rates
and variances computed corresponding to each speed limit.
Table 5. 6 Average Access Density and Accident Rate by Speed Limit
Speed Limit (mile/hour)
Road sections Average access density Average accident rate
(#/mile) Variance (MVM 1:10) Variance 25 6 22.39 190.60 1.25 7.10 30 18 33.40 219.66 13.01 178.43 35 49 34.16 155.91 15.33 145.75 40 34 34.01 208.00 13.77 73.05 45 29 16.31 150.20 7.04 44.72 50 36 17.08 168.24 8.29 67.96 55 18 8.53 27.48 2.83 3.25
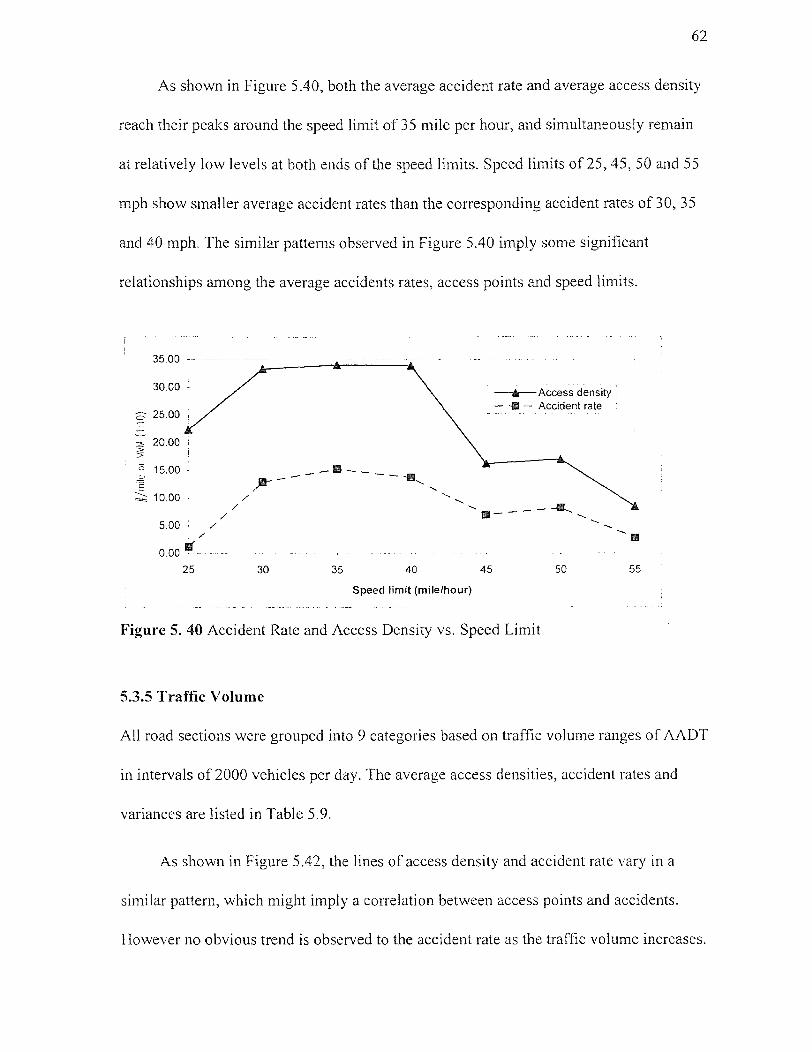
62
As shown in Figure 5.40, both the average accident rate and average access density
reach their peaks around the speed limit of 35 mile per hour, and simultaneously remain
at relatively low levels at both ends of the speed limits. Speed limits of 25, 45, 50 and 55
mph show smaller average accident rates than the corresponding accident rates of 30, 35
and 40 mph. The similar patterns observed in Figure 5.40 imply some significant
relationships among the average accidents rates, access points and speed limits.
Figure 5. 40 Accident Rate and Access Density vs. Speed Limit
5.3.5 Traffic Volume
All road sections were grouped into 9 categories based on traffic volume ranges of AADT
in intervals of 2000 vehicles per day. The average access densities, accident rates and
variances are listed in Table 5.9.
As shown in Figure 5.42, the lines of access density and accident rate vary in a
similar pattern, which might imply a correlation between access points and accidents.
However no obvious trend is observed to the accident rate as the traffic volume increases.

63
Table 5. 7 Comparison of Access Density and Accident Rate by AADT
AADT (vpd)
Road sections Average access density Average accident rate
(#/mile) Variance (MVM 1:10) Variance 0-10000 14 38.97 138.18 32.75 174,26
10000-12000 15 17.85 243.60 10.67 171.28 12000-14000 25 26.67 324.10 8.88 54.93 14000-16000 34 23.20 129.57 13.42 117.23 16000-18000 23 32.00 235.36 12.55 112.00 18000-20000 24 22.24 174.17 9.19 40.92 20000-22000 27 23.58 175.91 11.11 106.60 22000-24000 6 9.44 32.35 3.30 4.98 24000-26000 12 27.18 214.56 7.80 49.05
>26000 20 36.60 314.57 7.21 35.29
Figure 5. 41 Accident Rate (#/MVM 1:10) and Access Density (#/mile) vs. AADT (vpd)
64
5.4 Regression Model Analysis
Since there was a statistically significant difference between the accident rate of two-lane
highways and the accident rate of four-lane highways, two groups of regression models
were developed and analyzed.
The regression models were developed based on the ranges of roadway section
length, which were grouped in the length of 0-0.3 miles, 0.3-0.6 miles, 0.6-0.9 miles, 0.9-
1.2 miles, 1.2-1.5 miles, and above 1.5 miles. The independent variables considered were
speed limit, traffic volume (AADT) and access density. Shoulder was also taken into
consideration. The dependent variable used was the accident rate (number of accidents
per million vehicle miles traveled, in 1:10). The detailed results of the regression analysis
are shown in Appendix B. The sample database used for the analysis is shown in
Appendix C.
5.4.1 Two-Lane Highway Regression Models
The two-lane highway regression models were based on a sample size of 115 roadway
sections. For each range of roadway length, both linear models and nonlinear models
were developed, except the nonlinear model for the range of 0.3 miles due to limited
sample size (see Table 5.10). R squares showed a good fit for the nonlinear model with
length greater than 1.5 miles. In general the R squares of the nonlinear models indicated
better fit than linear models, however only a few of them show a good fit. For two-lane
highways, the models of the highways with/without shoulder confirm the previous
conclusion that they belong to different populations. The linear regression model 4 with
shoulder exhibit very low fit (R2 =0.0980), and the linear regression model 5 without

65
shoulder exhibits a better fit (R2 =0.5436). The nonlinear regression model 4 with
shoulder exhibits very low fit (R2 =0.2677), and the nonlinear regression model 5 without
shoulder exhibits a better fit (R2 =0.5707).
Table 5.8 Two-lane Highway Regression Models
Model Length (miles)
Equation
Linear 1 0.3 Y = 2.5610 + 0.3052X1 -0,0009X2 + 0.2155X3 0.8141
Linear 2 0.6 Y = 43.6586 - 0.3059X1 - 0.0012X2 + 0.0935X3 0.2980
Linear 3 0.9 Y= 70.7597 -0.6471X1 -0.0015X2 -0.2220X3 0.4294
Linear 4 (shoulder)
0.9 Y = 24.8702 -0.3712X1 + 0.0001X2 - 0.1006X3 0.0980
Linear 5 (no shoulder)
0.9 Y = 91.5866- 0.6825X1 - 0.0029X2 + 0.2430X3 0.5436
Linear 6 1.2 Y = -26.0668+0.5300X1 -0.0003X2 +0.4317X3 0.2298
Linear 7 >1.5 Y =11.4828+ 0.1061X1 -0.0006X2 + 0.2716X, 0.2502
Nonlinear 1 0.3 N/A N/A Nonlinear 2 0.6 y= 139.2991-3.1753X1 + 0.0374 X12 -0.0055X2
+ 0.0000002X22 - 0.6182 X3 + 0.0140X
3 2
0.4541
Nonlinear 3 0.9 y= 191.0309 - 4.9683X1 +0.0579X1
2
-0.0086X2
+0.0000002X22 + 0.5040X3 - 0.0095X3
2
0.6132
Nonlinear 4 (shoulder)
0.9 Y = 141.2106 - 6.6364X1 + 0.0768X12 - 0.0001X2
+ 0.00000001X22 + 0.4255X3 - 0.0083X32
0.2677
Nonlinear 5 (no shoulder)
0.9 Y= -49.4611+108437X1 -0.1845X12 - 0.0104X2
+ 0.0000003X22 + 0.2805X3 - 0.0058X32
0.5707
Nonlinear 6 1.2 y= 37.2859 + 3.4168X1 -0.0335X12 - 0.0165X2
+0.0000005X2
2
+1.6288X3 - 0.0206X3
2
0.4014
Nonlinear 7 >1.5 Y = -165.5240 + 18.6628X1 - 0.2377X1
2
- 0.0911X2
+ 0.0000007X22 +0.0263X3 - 0.0097X3
2
0.8683
Shoulder Y = 5.9749 + 0.2415X3 0.0964 No shoulder Y =11.8310+ 0.1310X3 0.0140
Where, Y represents accident rate (#/MVM in 1:10), X, represents speed limit (mph), X, represents AADT (vpd), X3 represents access density (#/mile).
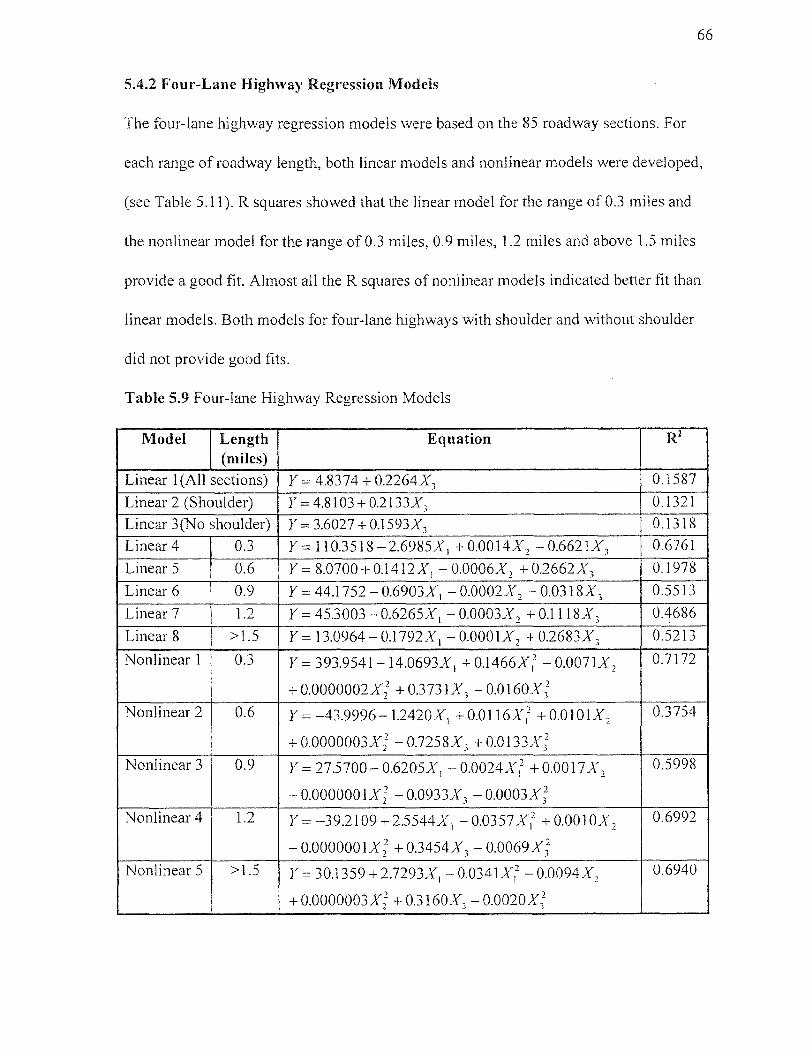
66
5.4.2 Four-Lane Highway Regression Models
The four-lane highway regression models were based on the 85 roadway sections. For
each range of roadway length, both linear models and nonlinear models were developed,
(see Table 5.11). R squares showed that the linear model for the range of 0.3 miles and
the nonlinear model for the range of 0.3 miles, 0.9 miles, 1.2 miles and above 1.5 miles
provide a good fit. Almost all the R squares of nonlinear models indicated better fit than
linear models. Both models for four-lane highways with shoulder and without shoulder
did not provide good fits.
Table 5.9 Four-lane Highway Regression Models
Model Length (miles)
Equation R2
Linear 1(All sections) Y = 4.8374 + 0.2264X3 0.1587
Linear 2 (Shoulder) Y = 4.8103+0.2133X3 0.1321 Linear 3(No shoulder) Y = 3.6027 +0.1593X3 0.1318 Linear 4 0.3 Y= 110.3518- 2.6985X1 + 0.0014X2 -0.6621X3 0.6761
Linear 5 0.6 Y= 8.0700+ 0.1412X1 -0.0006X2 + 0.2662X3 0.1978
Linear 6 0.9 Y = 44.1752 - 0.6903X1 - 0.0002X2 - 0.0318X3 0.5513 Linear 7 1.2 Y = 45.3003 - 0.6265X1 - 0.0003X2 + 0.1118X3 0.4686 Linear 8 >1.5 Y= 13.0964- 0.1792X1 - 0.0001X2 +0.2683X3 0.5213
Nonlinear 1 0.3 y= 393.9541-14.0693X1 +0.1466X2 -0.0071X3
+0.0000002X22 +0.3731X3 -0.0160X
0.7172
Nonlinear 2 0.6 y= -43.9996-1.2420X1 + 0.0116X12 + 0.0101X2
+0.0000003X22 - 0.7258X3 +0.0133X
0.3754
Nonlinear 3 0.9 Y= 27.5700
2
- 0.6205X1 - 0.0024X1
2
+0.0017X2
-0.0000001X2
2
- 0.0933X3 -0.0003X32
0.5998
Nonlinear 4 1.2 Y = -392109 + 7.5544X1 - 0.0357X12 + 0.0010X2
- 0.0000001X22 + 0.3454X3 -0.0069X3
2
0.6992
Nonlinear 5 >1.5 Y = 30.1359 + 2.7293X, - 0.0341X; -0.0094X2
+0.0000003X22 + 0.3160X3 - 0.0020X3
2
0.6940
67
Where, Y represents accident rate (#/MVM in 1:10), X1 represents speed limit
(mph), X, represents AADT (vpd), X3 represents access density (#/mile).
There is no linear relationship between accident rates and access density for two-
lane highways. A higher relationship between accident rates and access density for four-
lane highways, but R squares do not show good fit.
Although nonlinear models show good fit, none of the coefficients show significant
t-statistic values. It can be concluded that the regression models shown do not produce
robust predictions of accident rates on two-lane highways.
Although nonlinear models show good fit, none of the coefficients show significant
t-statistic values. It can be concluded that the regression models shown do not produce
robust predictions of accident rates on four-lane highways.

CHAPTER 6
FIELD STUDY AND DATA ANALYSIS
The field study was conducted in late August and early September 1997 on the Section
of NJ State Route 27, between Chestnut Street and Summit Street, Linden, New Jersey.
The study section is about 0.6 miles long with two lanes in each direction and without
any median. The study involved taking traffic counts and speed measurements. Traffic
volumes both at access points and on main road were counted by using traffic counters. A
video camera was used to tape the speed indication from the odometer of a test vehicle.
This survey covered both AM/PM peak periods and off-peak periods for five weekdays
from Monday to Friday. The objective of the speed study was to record the operational
characteristics of a multilane highway section.
6.1 Data Collection
Two kinds of data collection which include traffic speed measurement and traffic volume
counts were performed during the field study. The diagram of the study section is shown
in Figure 6.1.
6.1.1 Speed Data Collection
Speed data collection was conducted for 3 days on September 4, 8 and 11, 1997. All the
access points were labeled before the study, as shown in Figure 6.1; there are 31 points
68

Figure 6.1 Basic Information of the Study Roadway Section of Linden, NJ State Route 27

70
southbound and 18 points northbound. A test vehicle was used to traverse the road
segment between Summit Street and Roselle Street. The driver was instructed to make
round trips traveling either in lane-1 or lane-2 which was recorded by the observer. A
total number of 43 test runs on lane-1 and lane-2 were conducted, respectively. A video
camera was used to video tape the odometer of the vehicle. Speed information was read
and recorded from the tapes into a Microsoft Excel worksheet for analysis after the field
study. The information obtained includes: speed at each access point, speed reduction and
delay of test vehicle caused by vehicles entering/exiting access points, and the types of
vehicle operations that affected the test vehicle.
6.1.2 Traffic Data Collection
Traffic volume study was conducted for 6 days as follows: 8/26, 8/27, 8/28, 9/4, 9/5 and
9/8, 1997. The study covered all weekdays, Monday through Friday. Six persons
participated in this study, where each of them was responsible for 5-6 adjacent access
points. Data was collected on three mornings from 07:00 to 12:00, and three afternoons
from 14:00 to 19:00. The data collected is divided into the traffic volume of the main
roadway on both directions and the traffic volume at access points. Traffic at access
points was divided into entering and exiting volumes which were further grouped
according to turning movements and their impact on other vehicles. For entering
volumes, the data categories on a tally sheet (Table 6.1) include left turning vehicles
which have impact on other vehicles, left turning vehicles which have no impact on other
vehicles, right turning vehicles which have impact on other vehicles, and right turning
vehicles which have no impact on other vehicles. For exiting vehicles, the data categories
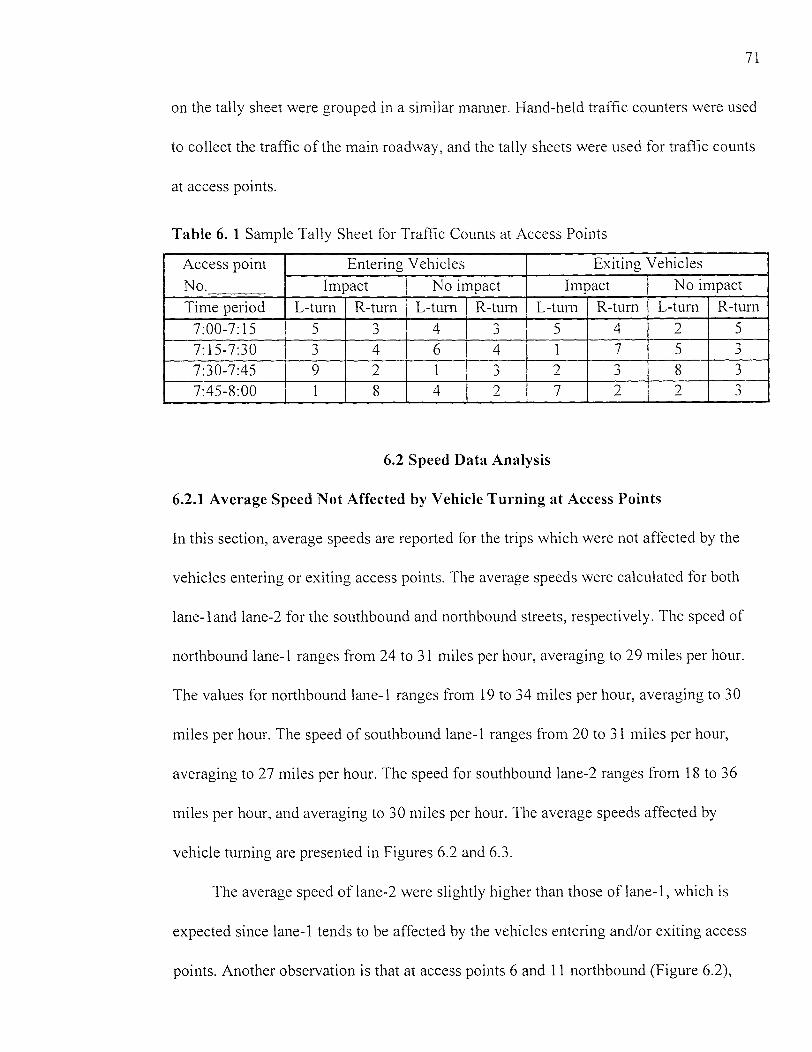
71
on the tally sheet were grouped in a similar manner. Hand-held traffic counters were used
to collect the traffic of the main roadway, and the tally sheets were used for traffic counts
at access points.
Table 6. 1 Sample Tally Sheet for Traffic Counts at Access Points
Access point
No.
Entering Vehicles Exiting Vehicles
Impact No impact Impact No impact
Time period L-turn R-turn L-turn R-turn L-turn R-turn L-turn R-turn
7:00-7:15 5 3 4 3 5 4 2 5
7:15-7:30 3 4 6 4 1 7 5 3
7:30-7:45 9 7 1 3 7 3 8 3
7:45-8:00 1 8 4 2 7 2 2 3
6.2 Speed Data Analysis
6.2.1 Average Speed Not Affected by Vehicle Turning at Access Points
In this section, average speeds are reported for the trips which were not affected by the
vehicles entering or exiting access points. The average speeds were calculated for both
lane-1 and lane-2 for the southbound and northbound streets, respectively. The speed of
northbound lane-1 ranges from 24 to 31 miles per hour, averaging to 29 miles per hour.
The values for northbound lane-1 ranges from 19 to 34 miles per hour, averaging to 30
miles per hour. The speed of southbound lane-1 ranges from 20 to 31 miles per hour,
averaging to 27 miles per hour. The speed for southbound lane-2 ranges from 18 to 36
miles per hour, and averaging to 30 miles per hour. The average speeds affected by
vehicle turning are presented in Figures 6.2 and 6.3.
The average speed of lane-2 were slightly higher than those of lane-1, which is
expected since lane-1 tends to be affected by the vehicles entering and/or exiting access
points. Another observation is that at access points 6 and 11 northbound (Figure 6.2),
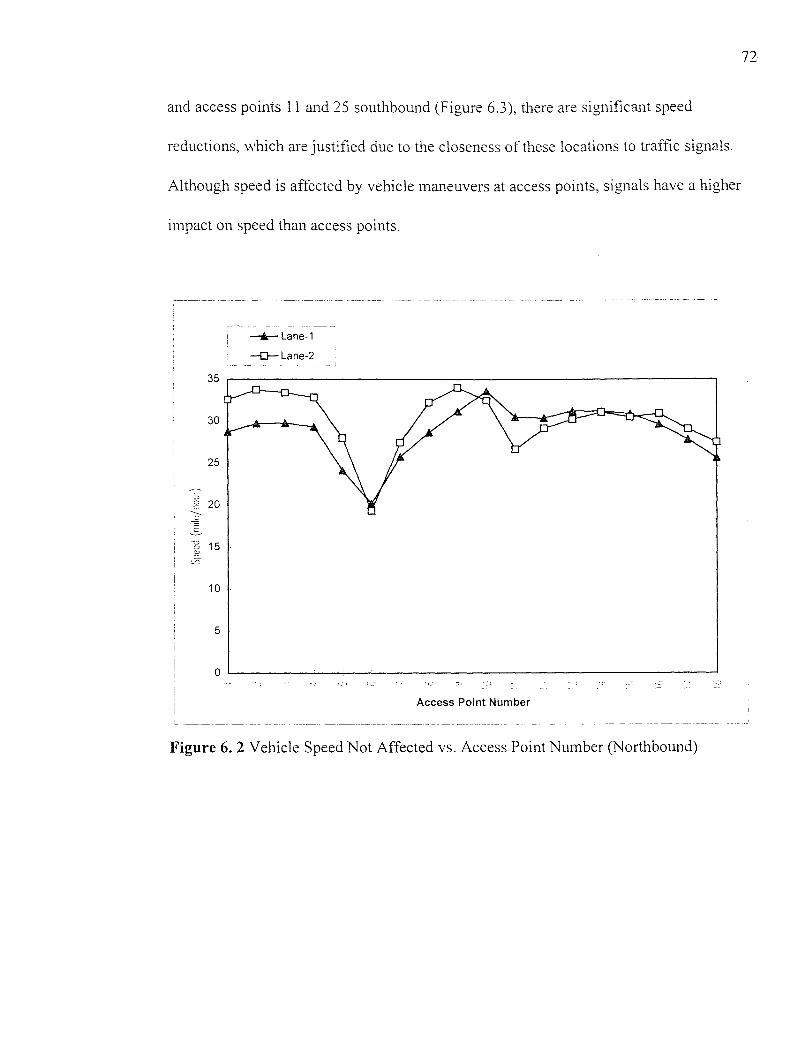
and access points 11 and 25 southbound (Figure 6.3), there are significant speed
reductions, which are justified due to the closeness of these locations to traffic signals.
Although speed is affected by vehicle maneuvers at access points, signals have a higher
impact on speed than access points.
72
Figure 6. 2 Vehicle Speed Not Affected vs. Access Point Number (Northbound)
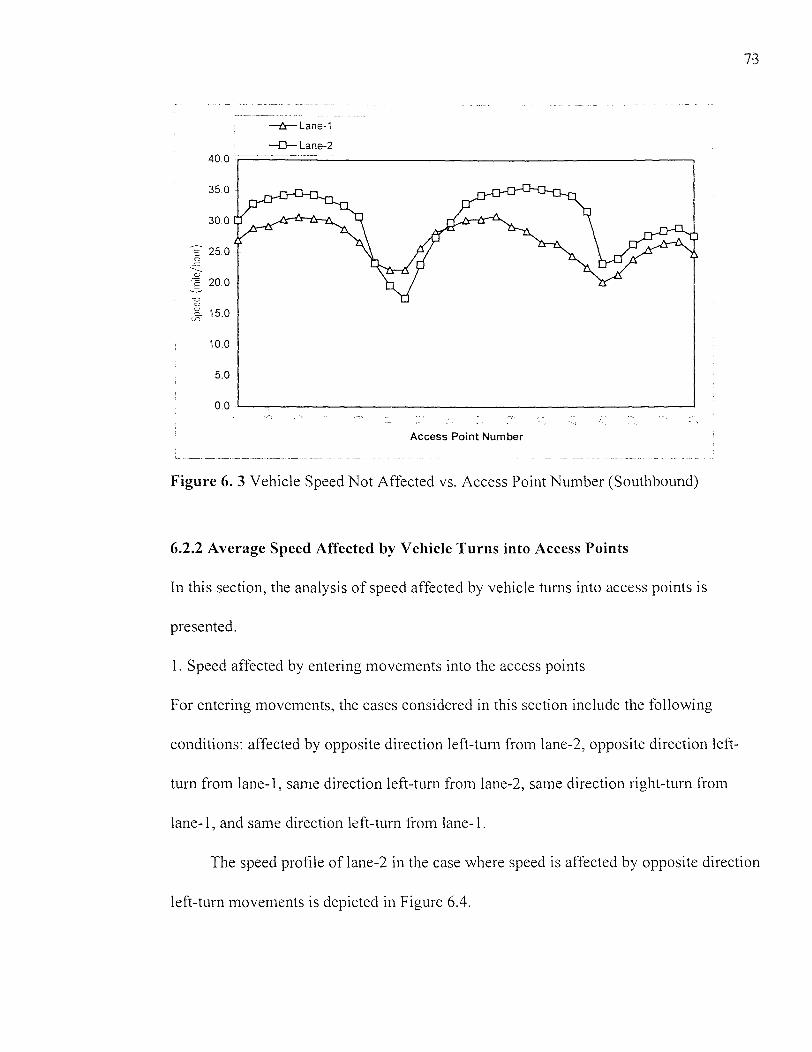
Figure 6. 3 Vehicle Speed Not Affected vs. Access Point Number (Southbound)
6.2.2 Average Speed Affected by Vehicle Turns into Access Points
In this section, the analysis of speed affected by vehicle turns into access points is
presented.
1. Speed affected by entering movements into the access points
For entering movements, the cases considered in this section include the following
conditions: affected by opposite direction left-turn from lane-2, opposite direction left-
turn from lane-I, same direction left-turn from lane-2, same direction right-turn from
lane-1, and same direction left-turn from lane-1.
The speed profile of lane-2 in the case where speed is affected by opposite direction
left-turn movements is depicted in Figure 6.4.

Figure 6. 4 Speed of Lane-2 Affected by Opposite Direction Left-turn Movements vs. Access Point Number
The speed profile of lane-2 in the case where speed is affected by same direction
left-turn movements is depicted in Figure 6.5.
Figure 6. 5 Speed of Lane-2 Affected by Same Direction Left-turn Movements vs. Access Point Number
74
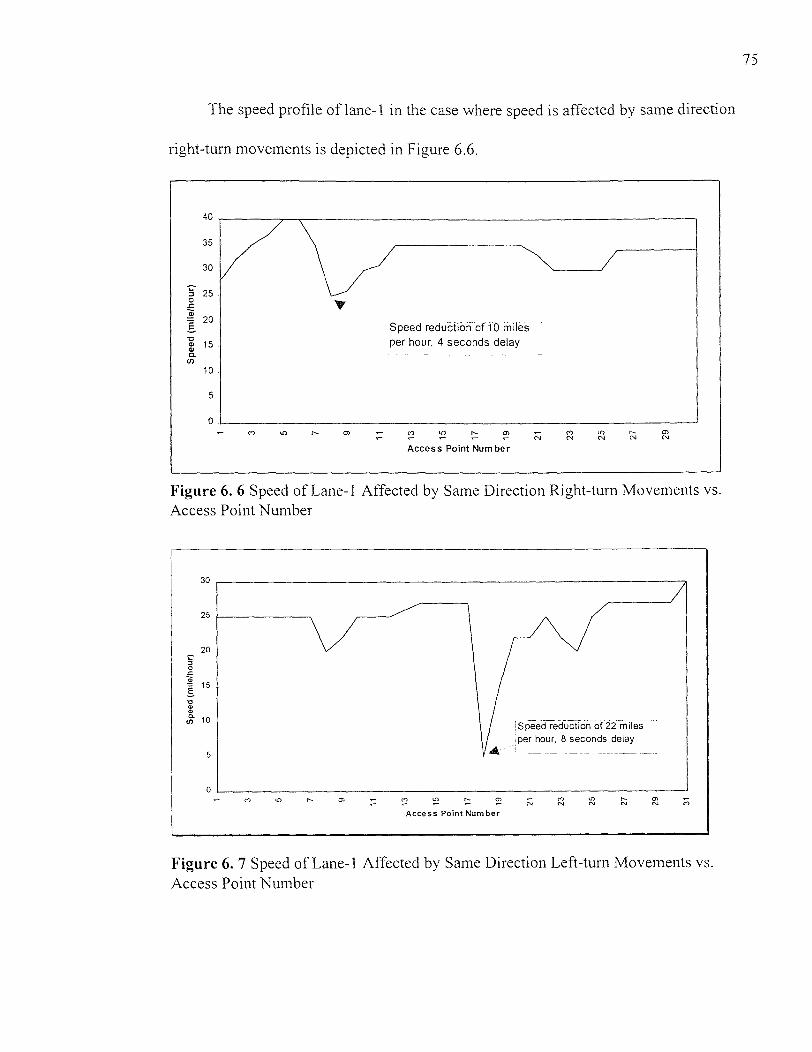
The speed profile of lane-1 in the case where speed is affected by same direction
right-turn movements is depicted in Figure 6.6.
Figure 6. 6 Speed of Lane-1 Affected by Same Direction Right-turn Movements vs. Access Point Number
Figure 6. 7 Speed of Lane-1 Affected by Same Direction Left-turn Movements vs. Access Point Number
75

76
The speed profile of lane-1 in the case where speed is affected by same direction
left-turn movements is depicted in Figure 6.7.
The speed profile of lane-1 in the case where speed is affected by opposite direction
left-turn movements is depicted in Figure 6.8.
Figure 6. 8 Speed of Lane-1 Affected by Opposite Direction Left-turn Movements vs. Access Point Number
2. Speed affected by exiting movements from the access points
For exiting movements, the cases considered in this section include test runs affected by
left-turn and right-turn vehicles from access points into the mainline.
The speed reduction due to left-turns from access points is shown in Figure 6.9:
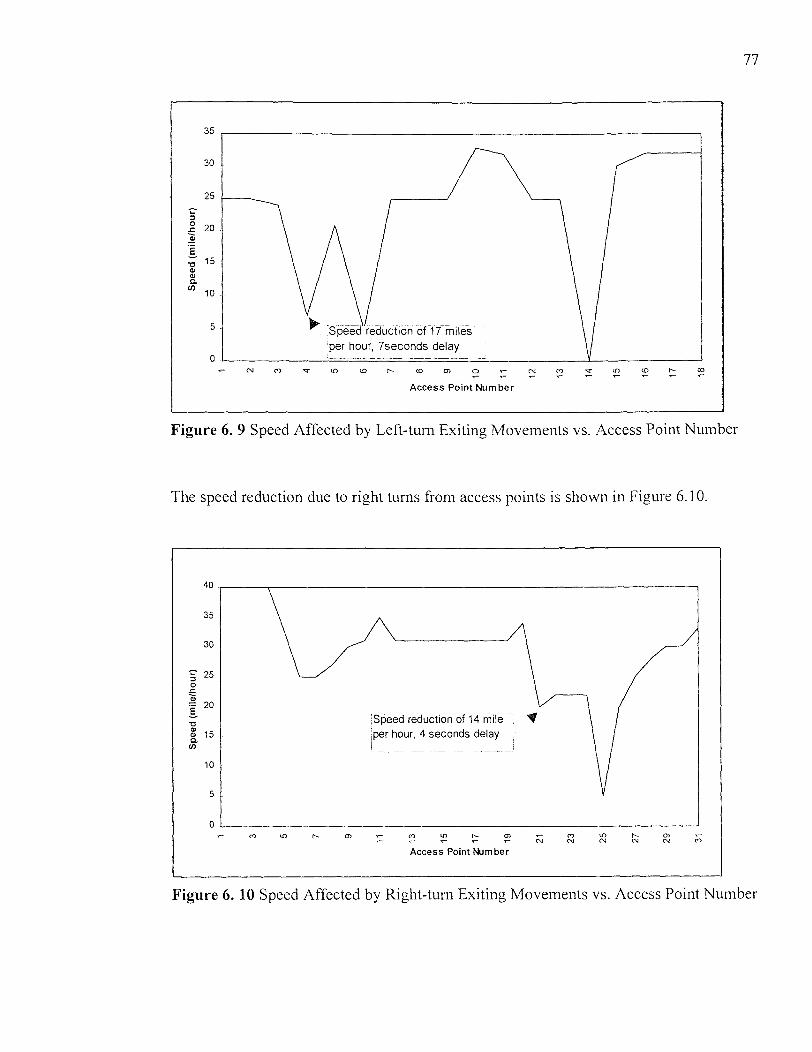
Figure 6. 9 Speed Affected by Left-turn Exiting Movements vs. Access Point Number
The speed reduction due to right turns from access points is shown in Figure 6.10.
77
Figure 6. 10 Speed Affected by Right-turn Exiting Movements vs. Access Point Number

78
6.2.3 Percentage of Test Runs Affected by Turning Vehicles at Access Points
The total number of test runs conducted were 86; 43 runs were conducted on lane-2, and
the other 43 runs were conducted on lane-1. Thirty (30) percent of the test runs were
affected by turning movements at access points. Analyzing lane-2 and lane-1 separately,
Lane-2 exhibits a higher percentage of test runs affected by turning movements, as shown
in Table 6.2.
Table 6. 2 Percentage of Test Runs Affected by Turning Movements
Test runs Affected Not affected
On lane-1 26% 74% On lane-2 35% 65%
On both lanes 30% 70%
6.2.4 Delay and Speed Reduction Due to Turning Movements at Access Points
In this section, the analysis of the impact of maneuvering vehicles of access points on the
test vehicle going straight through is presented. Maneuvering vehicles include both
vehicles entering into and exiting from access points. The drivers of exiting vehicles are
very cautious when they try to exit from an access point. In most cases, they would only
make an exiting maneuver when they find an acceptable gap occurring on the main road.
The impact of these exiting vehicles on through vehicles is not significant. For entering
vehicles, the drivers are not as careful as those in the previous case. In this section, only
the analysis of entering maneuvers is conducted. These entering maneuvers include:
opposite direction left-turning on lane-2, same direction left-turning on lane-2, same
direction right-turning on lane-1, and opposite direction left-turning on lane-1. The
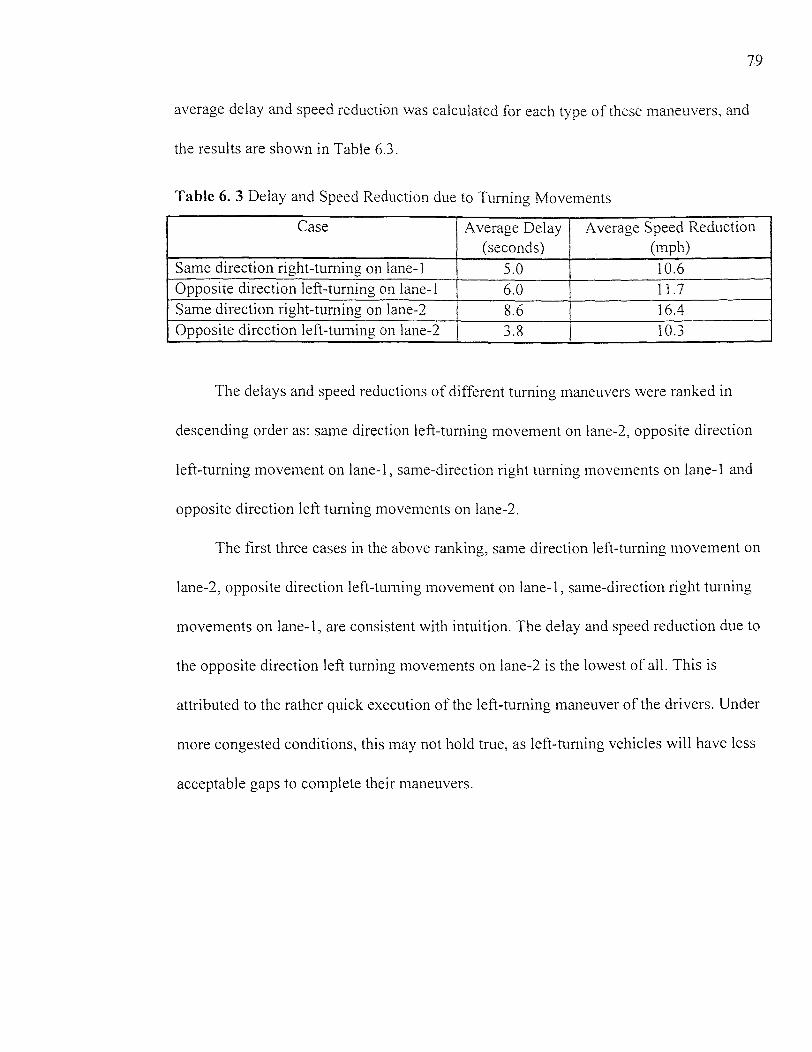
79
average delay and speed reduction was calculated for each type of these maneuvers, and
the results are shown in Table 6.3.
Table 6. 3 Delay and Speed Reduction due to Turning Movements
Case Average Delay (seconds)
Average Speed Reduction (mph)
Same direction right-turning on lane-1 5.0 10.6 Opposite direction left-turning on lane-1 6.0 11.7 Same direction right-turning on lane-2 8.6 16.4 Opposite direction left-turning on lane-2 3.8 10.3
The delays and speed reductions of different turning maneuvers were ranked in
descending order as: same direction left-turning movement on lane-2, opposite direction
left-turning movement on lane-1, same-direction right turning movements on lane-1 and
opposite direction left turning movements on lane-2.
The first three cases in the above ranking, same direction left-turning movement on
lane-2, opposite direction left-turning movement on lane-1, same-direction right turning
movements on lane-1, are consistent with intuition. The delay and speed reduction due to
the opposite direction left turning movements on lane-2 is the lowest of all. This is
attributed to the rather quick execution of the left-turning maneuver of the drivers. Under
more congested conditions, this may not hold true, as left-turning vehicles will have less
acceptable gaps to complete their maneuvers.

80
6.3 Traffic Data Analysis
6.3.1 Main Roadway Traffic
The hourly traffic volumes on the main roadway are summarized in Table 6.4. The hourly
traffic volume ranges from 664 to 1529 in the morning period, and 788 to 2204 in the
afternoon period. The afternoon peak hour happens between 16:00 to 18:00 which is
consistent to general belief. However, the morning peak hour happens between 10:00 to
12:00 AM instead of 07:00 to 09:00 AM. Another observation is that approximately forty
percent of the traffic travels on lane-2, and sixty percent travels on lane-1. Figure 6.11
presents the distribution of the average traffic volume on weekdays.
Figure 6. 11 Distribution of Average Traffic Volume (15 minutes) on Weekdays
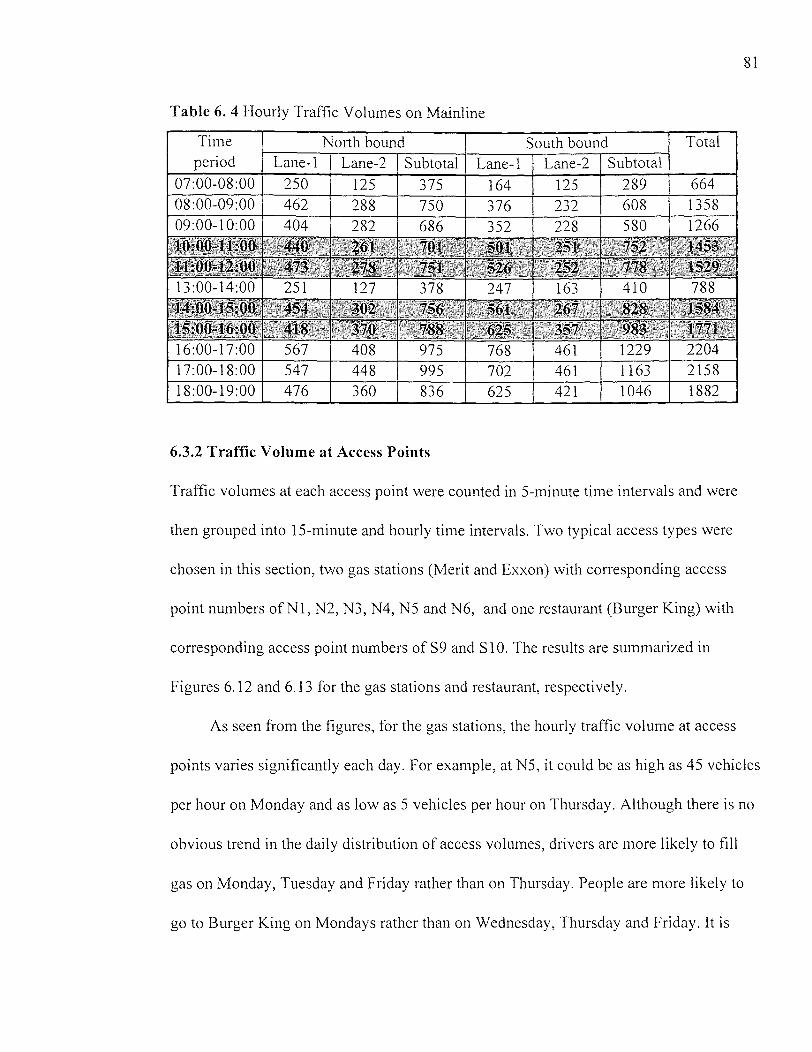
81
Table 6. 4 Hourly Traffic Volumes on Mainline
Time period
North bound South bound Total Lane-I Lane-2 Subtotal Lane-1 Lane-2 Subtotal
07:00-08:00 250 125 375 164 125 289 664 08:00-09:00 462 288 750 376 232 608 1358 09:00-10:00 404 282 686 352 228 580 1266 10:00-11:00
440 261 701 501 251 75Z 1453 11:00-12:00 413 278 751 526 252 778 1529 13:00-14:00 251 1 2 7 378 247 1 63 410 788 14:00-15 00 454 302 756 561 267 828 158 15:00-16:00 418 370e 788 5 357 983 1771 16:00-17:00 567 408 975 768 461 1229 2204 17:00-18:00 547 448 995 702 461 1163 2158 18:00-19:00 476 360 836 625 421 1046 1882
6.3.2 Traffic Volume at Access Points
Traffic volumes at each access point were counted in 5-minute time intervals and were
then grouped into 15-minute and hourly time intervals. Two typical access types were
chosen in this section, two gas stations (Merit and Exxon) with corresponding access
point numbers of N1, N2, N3, N4, N5 and N6, and one restaurant (Burger King) with
corresponding access point numbers of S9 and S10. The results are summarized in
Figures 6.12 and 6.13 for the gas stations and restaurant, respectively.
As seen from the figures, for the gas stations, the hourly traffic volume at access
points varies significantly each day. For example, at N5, it could be as high as 45 vehicles
per hour on Monday and as low as 5 vehicles per hour on Thursday. Although there is no
obvious trend in the daily distribution of access volumes, drivers are more likely to fill
gas on Monday, Tuesday and Friday rather than on Thursday. People are more likely to
go to Burger King on Mondays rather than on Wednesday, Thursday and Friday. It is
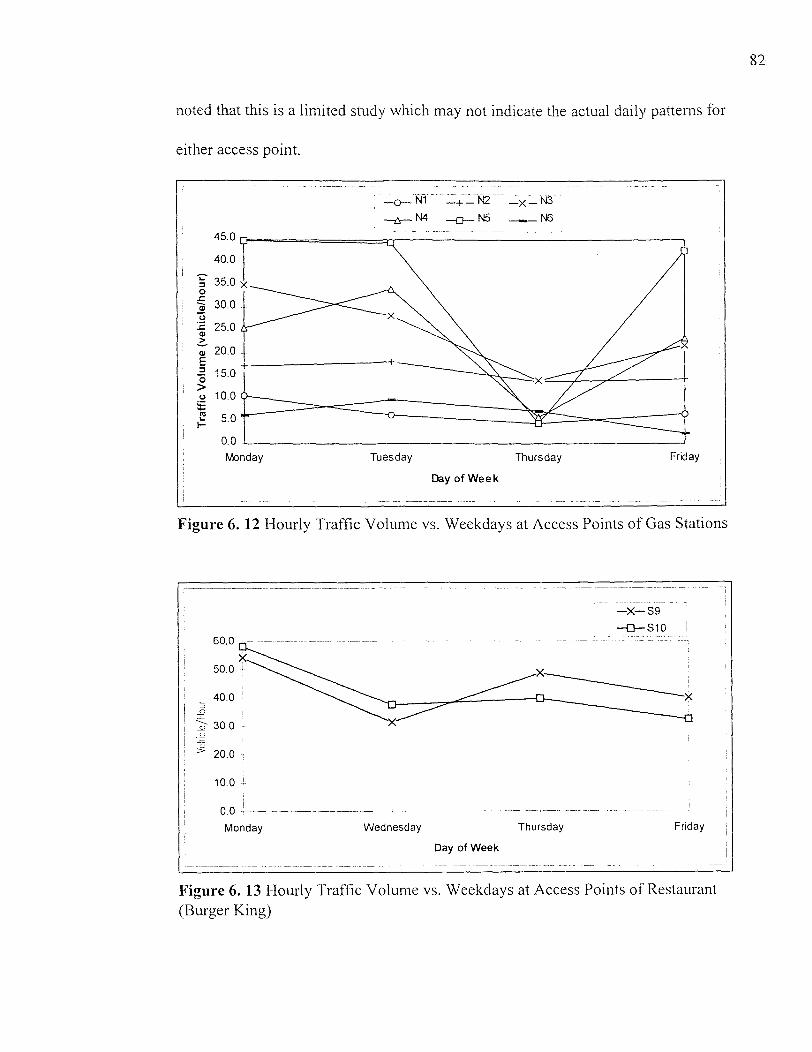
noted that this is a limited study which may not indicate the actual daily patterns for
either access point.
Figure 6. 12 Hourly Traffic Volume vs. Weekdays at Access Points of Gas Stations
Figure 6. 13 Hourly Traffic Volume vs. Weekdays at Access Points of Restaurant (Burger King)
82

6.3.3 Impact Analysis of Turning Movements at Access Points
To study the impact of access traffic on the traffic operation on main roadways, turning
vehicles are grouped according to types of maneuver (entering and exiting), turning
movements (left turn and right turn), impact on other vehicles (impact and no impact),
and time periods (peak hour, and off-peak hour). The analysis was conducted for 3 days,
and the results are presented in Table 6.5.
Comparing the results of the entering vehicles with those of the exiting vehicles,
the percentage of left turning entering vehicles having an impact on other vehicles is
higher than the percentage of left turning exiting vehicles for both peak and off-peak
hours: 24% vs. 15% (peak hour), and 19% vs. 10% (off-peak hour), respectively. This
indicates that drivers are more cautious in a left turning maneuver exiting from an access
point. In contrast, the percentage of the left turning entering vehicles without impact on
other vehicles is lower than the percentage of the left turning exiting vehicles for both
peak and off-peak hours: 14% vs. 17% (peak hour), and 15% vs. 21% (off-peak hour),
respectively.
Table 6. 5 Percentage of Turning Movements Impacting on Other Vehicles
Turning Movement Left-turning Right-turning
Impact No impact Impact No impact
Entering (Peak hour) 24% 15% 6% 55%
Entering (Off-peak) 19% 16% 8% 57%
Exiting (Peak hour) 14% 16% 8% 62%
Exiting (Off-peak) 10% 21% 13% 56%
The percentage of right turning vehicles without impact on other vehicles is above
50%. In contrast, the percentage of right turning vehicles with impact on other vehicles is

84
much lower. These results indicate that the right turning vehicle action has the least
impact on other vehicles from all the other vehicle movements.
The percentage of peak hour left turning vehicles with impact on other vehicles is
higher than that of off-peak hours for both entering and exiting cases. In contrast, the
percentage of peak hour left turning vehicles without impact on other vehicles is lower
than that of off-peak hour for both entering and exiting vehicle actions. This indicates that
with increasing traffic volume on the mainline, the left turning movements have a higher
impact on other vehicles.
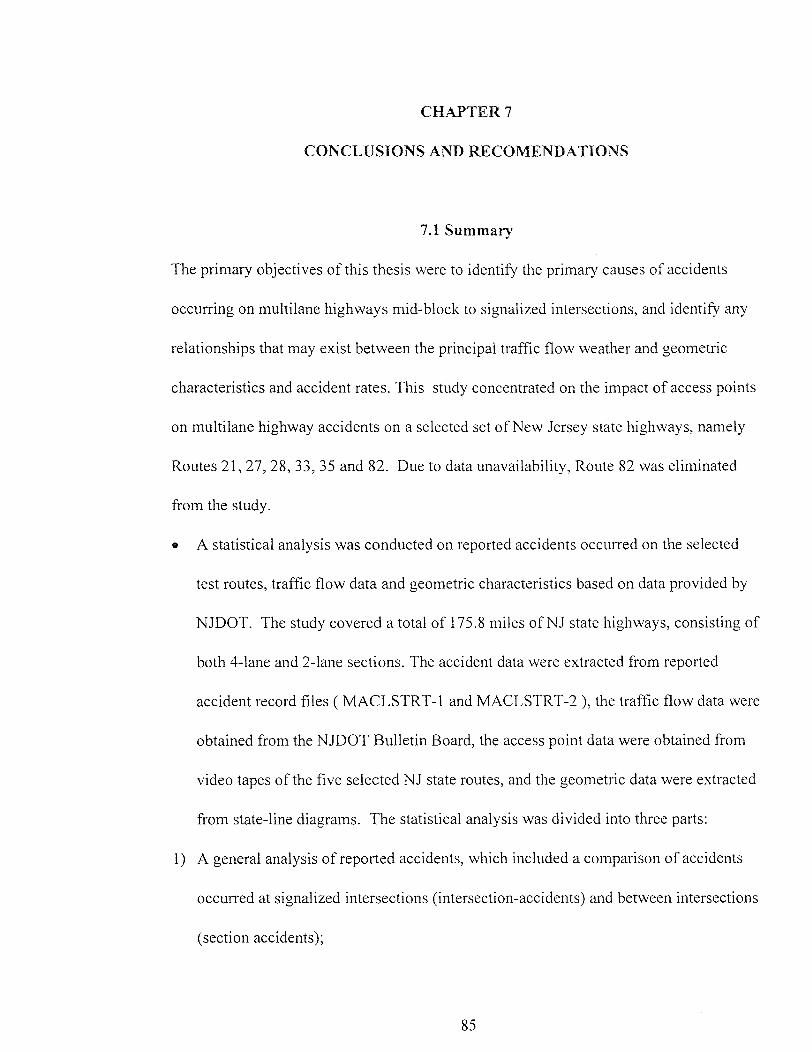
CHAPTER 7
CONCLUSIONS AND RECOMENDATIONS
7.1 Summary
The primary objectives of this thesis were to identify the primary causes of accidents
occurring on multilane highways mid-block to signalized intersections, and identify any
relationships that may exist between the principal traffic flow weather and geometric
characteristics and accident rates. This study concentrated on the impact of access points
on multilane highway accidents on a selected set of New Jersey state highways, namely
Routes 21, 27, 28, 33, 35 and 82. Due to data unavailability, Route 82 was eliminated
from the study.
• A statistical analysis was conducted on reported accidents occurred on the selected
test routes, traffic flow data and geometric characteristics based on data provided by
NJDOT. The study covered a total of 175.8 miles of NJ state highways, consisting of
both 4-lane and 2-lane sections. The accident data were extracted from reported
accident record files ( MACLSTRT-1 and MACLSTRT-2 ), the traffic flow data were
obtained from the NJDOT Bulletin Board, the access point data were obtained from
video tapes of the five selected NJ state routes, and the geometric data were extracted
from state-line diagrams. The statistical analysis was divided into three parts:
1) A general analysis of reported accidents, which included a comparison of accidents
occurred at signalized intersections (intersection-accidents) and between intersections
(section accidents);
85

86
2) accident analysis based on geometric and traffic flow conditions; and
3) analysis of the relationship between accidents and access points, which included the
development of regression models between accident rates and a number of different
independent variables such as: access density, speed limit, AADT, and geometric
factors.
In addition to the statistical analysis on accidents on state highways, a field study
was undertaken where the main objective was to identify the basic operational
characteristics of a section of a multilane highway in New Jersey. The field study was
undertaken on a 0.6 mile section of NJ state route 27 in Linden New Jersey. The principal
data collected were the speed variation on lane 1 and lane 2, which was obtained through
the use of a test vehicle based on a total of 43 test runs, and traffic flow data at the
mainline and at access points during a five weekday period.
The primary results and conclusions are presented next.
7.2 Conclusions
The major results of the analysis are summarized below:
• Approximately 30% of the reported accidents were midblock section-accidents, which
were primarily caused due to the presence of access points. Seventy (70%) of the
reported accidents occurred at signalized intersections.
• Left turn collision and angle collision reported accidents were shown to be
proportionally higher at signalized intersections in comparison to the corresponding
proportion observed between signalized intersections. In contrast, collisions with

87
objects, over turns, strike parking vehicles and same direction rear collisions reported
between signalized intersections were proportionally higher than those reported at
signalized intersections.
• Left-turn and right-turn vehicle actions exhibit a higher proportion of accidents at
signalized intersections than between signalized intersections.
• Midblock section-accidents were mainly caused by vehicles entering and exiting mid-
block access points. 70-80% of the section-accidents were caused by a vehicle
moving straight through on the mainline and a turning vehicle from/to an access
point.
• The analysis of vehicle contribution accident indicated that improper turnings were
the primary reason for accidents occurring at intersections than accidents between
intersections. The diving-inattention category experienced a higher proportion among
section-accidents rather than intersection-accidents.
• Neither clear and rain weather conditions nor dry and wet roadway surface conditions
show any difference on the patterns of section-accidents and intersection-accidents.
However, under snow weather conditions, or when the surface was covered with
snow or ice, there was a distinct difference between the proportion observed on
section-accidents and the corresponding intersection-accidents.
• The proportion of weekday intersection-accidents is higher than that of weekend
intersection-accidents, whereas the weekend section-accidents exhibits a higher
proportion than the weekday section-accidents.
88
• In the hourly accident distribution analysis, 4:00-5:00 AM exhibits the lowest
accident percentage. The evening traffic peak period between 5:00 to 6:00 PM
exhibited the highest percentage of accident rates.
• The average accident rate of two-lane highways was higher than that of four-lane
highways by 44 percent, while the average access densities were statistically the
same. And the t-test showed that there was statistically significant difference between
the accident rate of two-lane highways and that of four-lane highways.
• The t-test showed that there was a statistically significant difference between the
average accident rate of two-lane highways with shoulder and that of two-lane
highways without shoulder. The t-test showed that there was no statistically
significant difference between the average accident rate of four-lane highways with
shoulder and that of four-lane highways without shoulder.
• The accident rate and access density showed similar patterns as the speed limit
increases.
• Through a limited field study, speed reduction, delay, and the percentage of affected
vehicles due to turning movements to/from access points were identified as main
variables in estimation of impact of access points on multilane highway accidents.
• Approximately 25% of the entering/exiting vehicles from/to access points has impact
on mainline traffic within this study section. Left turning movements have greater
impact on mainline traffic than right turning movements. For left turning movements,
the entering traffic has more impact on mainline vehicles than the exiting traffic.

89
• There is no linear relationship between accident rates and access density for two-lane
highways. Four-lane highways exhibit better linear relationships, but the R squares do
not show good fit of the developed models.
• Although nonlinear models show good fit, none of the coefficients show significant t-
statistic values. It can be concluded that the regression models shown do not produce
robust predictions of accident rates on two-lane highways.
• Although nonlinear models show good fit, none of the coefficients show significant t-
statistic values. It can be concluded that the regression models shown do not produce
robust predictions of accident rates on four-lane highways.
• Although the data do not produce good fit, there is a very strong trend among the
average accident rate and the average access density per section length. The high
variability observed for each section length group however does not provide any high
confidence in the trend observed.
7.3 Recommendations
This study presented some insights into the relation of access points to accident rates and
the linear and nonlinear relationships were developed for the five NJ State highways.
Further research should focus on the relationship between the accidents caused by turning
traffic and the types of access points (e.g. gas station, restaurants, residential, other). Due
to the limited accidents and access information in this study, the development of an
accurate model which can capture the relationship between accidents caused by turning
traffic and access points was not possible at this stage. A general model between the
90
accidents and access points can not be developed for the purpose of accident evaluations,
since too many factors are involved in the impact study of accidents.
In addition, 15-minute or hourly traffic flow rates were not available for the
selected routes. A more detailed analysis should be conducted which would incorporated
15-minute and/or hourly traffic volume into the analysis of accidents between
intersections.
A limited field study was conducted to identify the impact of access points on the
traffic operations of the highway. A more comprehensive study should be conducted with
the main goal of developing a simulation model which can capture the microscopic traffic
flow characteristics of multilane highways between signalized intersections. The present
version of CORSIM can not represent access points closely spaced together accurately.
Such a simulation model will establish a tool that can become as a tool for traffic impact
analysis for access management.
The analysis was conducted on NJ State highways. A nationwide study can be
undertaken which would identify the similarities and/or differences of different states.
Develop an Access Management Information System (AMIS) using a Geographic
Information System (GIS) platform in conducting accidents analysis and traffic impact
analysis on multilane highways. This could include links in conducting microscopic
simulation analysis using a variation of CORSIM.
The present 1994 Highway Capacity Manual concentrates on capacity under normal
conditions in establishing the level of service. However, this is misleading and not
91
comprehensive. Other variables should be introduced, which would include the effect of
incidents on the level of service of a roadway. These additional variables could include:
• Number of accidents per mile,
• Number of fatal accidents per mile,
• Total delay due to accidents per mile,
• Benefit/Cost ratio per mile; should include the cost per accident, and the cost per time
delay,
• Benefit/Cost ratio for new facility,
• Other
In essence the new manual will need to change to become the Highway Level of
Service Manual or the Highway Benefit/Costs Analysis Manual. Capacity analysis will
then became a part of this more comprehensive manual.

APPENDIX A
HYPOTHESIS TESTING
Hypothesis testing was conducted for identifying if there were statistically significant
differences among the accident rates of different type of highways. Three pairs of
highways conducted are listed as below:
• Two-lane highways versus four-lane highways,
• Two-lane highways with shoulder versus two-lane highways without shoulder,
• Four-lane highways with shoulder versus four-lane highways without shoulder,
Based on 95% confidence interval, for the cases where the variances are unequal, the
following t-test is conducted:
92
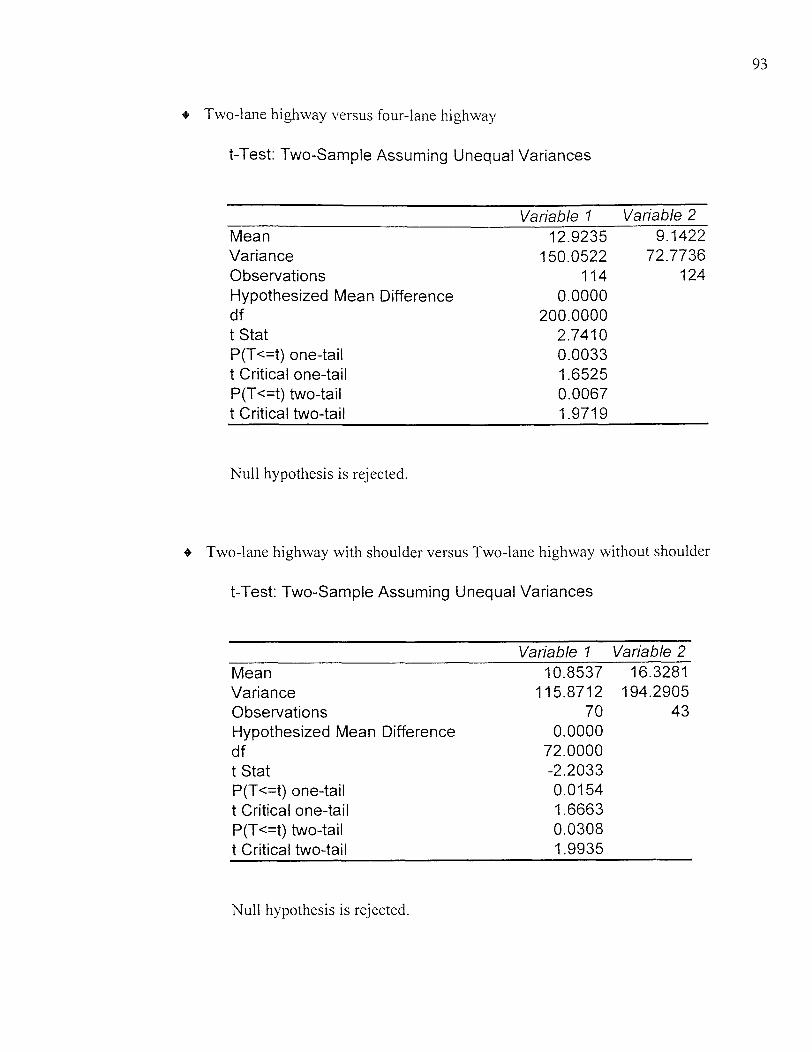
♦ Two-lane highway versus four-lane highway
t-Test: Two-Sample Assuming Unequal Variances
Variable 1 Variable 2 Mean 12.9235 9.1422 Variance 150.0522 72.7736 Observations 114 124 Hypothesized Mean Difference 0.0000 df 200.0000 t Stat 2.7410 P(T<=t) one-tail 0.0033 t Critical one-tail 1.6525 P(T<=t) two-tail 0.0067 t Critical two-tail 1.9719
Null hypothesis is rejected.
* Two-lane highway with shoulder versus Two-lane highway without shoulder
t-Test: Two-Sample Assuming Unequal Variances
Variable 1 Variable 2 Mean 10.8537 16.3281 Variance 115.8712 194.2905 Observations 70 43 Hypothesized Mean Difference 0.0000 df 72.0000 t Stat -2.2033 P(T<=t) one-tail 0.0154 t Critical one-tail 1.6663 P(T<=t) two-tail 0.0308 t Critical two-tail 1.9935
Null hypothesis is rejected.
93
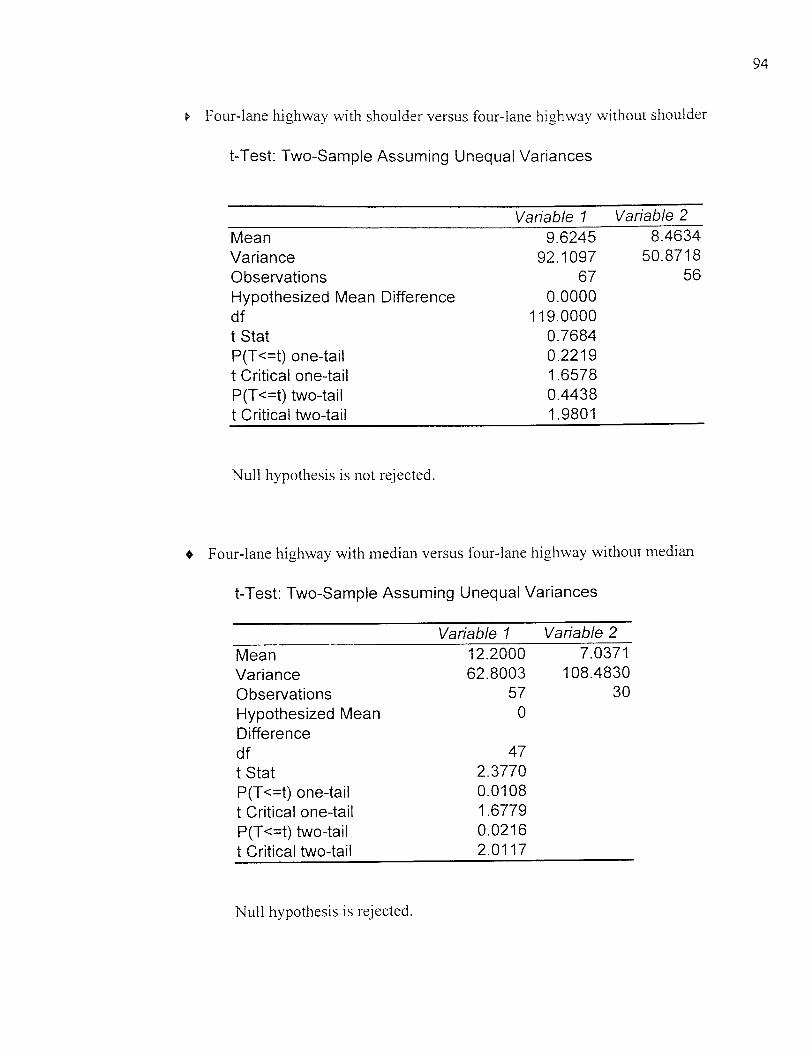
I, Four-lane highway with shoulder versus four-lane highway without shoulder
t-Test: Two-Sample Assuming Unequal Variances
Variable 1 Variable 2 Mean 9.6245 8.4634 Variance 92.1097 50.8718 Observations 67 56 Hypothesized Mean Difference 0.0000 df 119.0000 t Stat 0.7684 P(T<=t) one-tail 0.2219 t Critical one-tail 1.6578 P(T<=t) two-tail 0.4438 t Critical two-tail 1.9801
Null hypothesis is not rejected.
Four-lane highway with median versus four-lane highway without median
t-Test: Two-Sample Assuming Unequal Variances
Variable 1 Variable 2
Mean 12.2000 7.0371 Variance 62.8003 108.4830 Observations 57 30 Hypothesized Mean 0 Difference df 47 t Stat 2.3770 P(T<=t) one-tail 0.0108 t Critical one-tail 1.6779 P(T<=t) two-tail 0.0216 t Critical two-tail 2.0117
Null hypothesis is rejected.
94
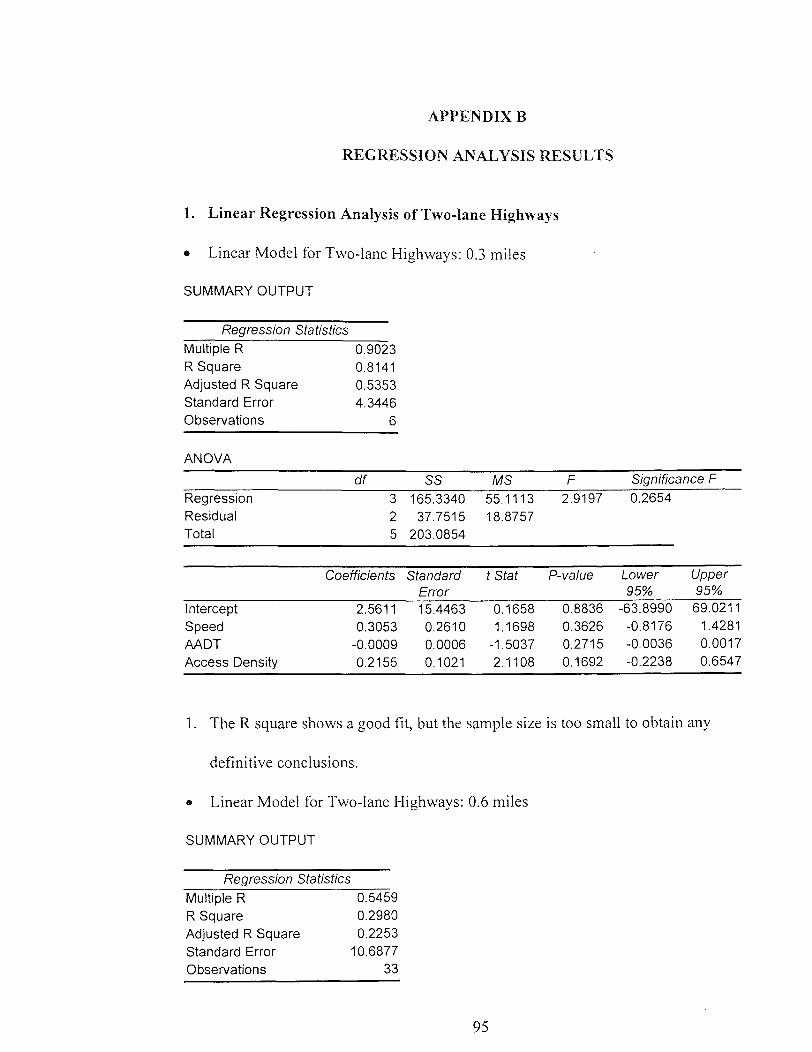
APPENDIX B
REGRESSION ANALYSIS RESULTS
1. Linear Regression Analysis of Two-lane Highways
• Linear Model for Two-lane Highways: 0.3 miles
SUMMARY OUTPUT
Regression Statistics
Multiple R 0.9023 R Square 0.8141 Adjusted R Square 0.5353 Standard Error 4.3446 Observations 6
ANOVA
df SS MS F Significance F
Regression 3 165.3340 55.1113 2.9197 0.2654 Residual 2 37.7515 18.8757 Total 5 203.0854
Coefficients Standard t Stat P-value Lower Upper Error 95% 95%
Intercept 2.5611 15.4463 0.1658 0.8836 -63.8990 69.0211
Speed 0.3053 0.2610 1.1698 0.3626 -0.8176 1.4281
AADT -0.0009 0.0006 -1.5037 0.2715 -0.0036 0.0017
Access Density 0.2155 0.1021 2.1108 0.1692 -0.2238 0.6547
1. The R square shows a good fit, but the sample size is too small to obtain any
definitive conclusions.
• Linear Model for Two-lane Highways: 0.6 miles
SUMMARY OUTPUT
Regression Statistics
Multiple R 0.5459
R Square 0.2980
Adjusted R Square 0.2253
Standard Error 10.6877
Observations 33
95
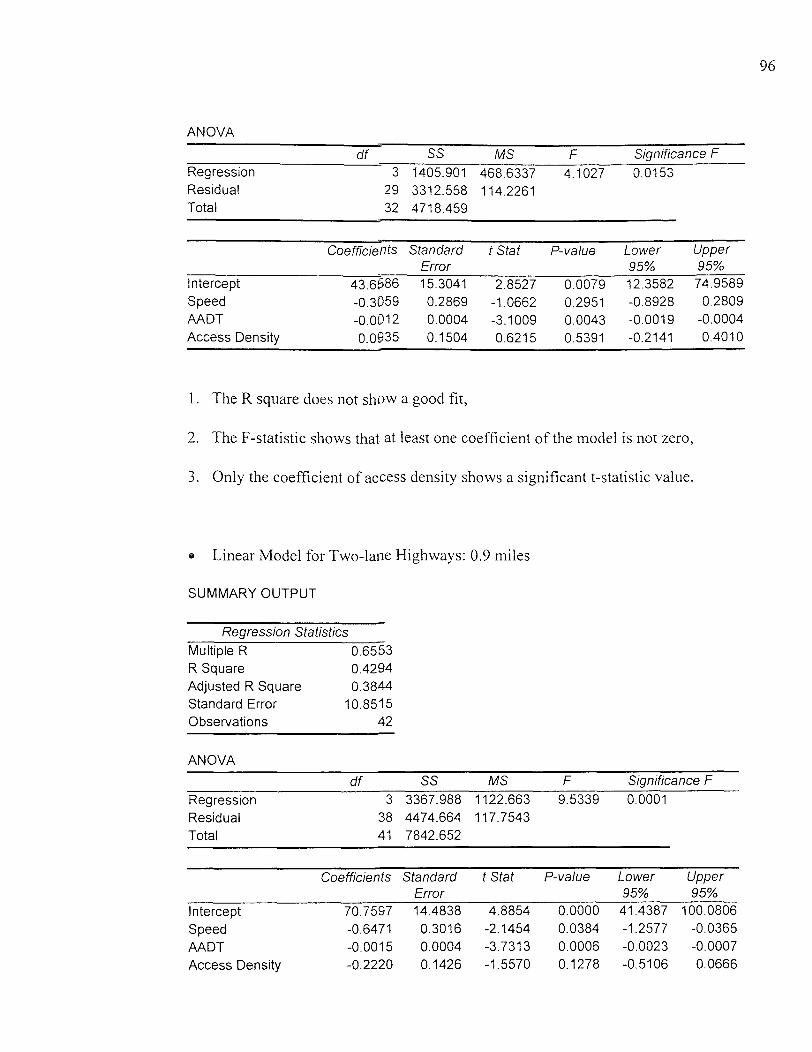
ANOVA
df f SS MS F Significance F Regression 3 1405.901 468.6337 4.1027 0.0153 Residual 29 3312.558 114.2261 Total 32 4718.459
Coefficients Standard t Stat P-value Lower Upper Error 95% 95%
Intercept 43.6586 15.3041 2.8527 0.0079 12.3582 74.9589 Speed -0.3059 0.2869 -1.0662 0.2951 -0.8928 0.2809 AADT -0.0012 0.0004 -3.1009 0.0043 -0.0019 -0.0004
Access Density 0.0935 0.1504 0.6215 0.5391 -0.2141 0.4010
1. The R square does not show a good fit,
2. The F-statistic shows that at least one coefficient of the model is not zero,
3. Only the coefficient of access density shows a significant t-statistic value.
® Linear Model for Two-lane Highways: 0.9 miles
SUMMARY OUTPUT
Regression Statistics
Multiple R 0.6553 R Square 0.4294 Adjusted R Square 0.3844 Standard Error 10.8515 Observations 42
ANOVA
df SS MS F Significance F
Regression 3 3367.988 1122.663 9.5339 0.0001
Residual 38 4474.664 117.7543
Total 41 7842.652
Coefficients Standard t Stat P-value Lower Upper Error 95% 95%
Intercept 70.7597 14.4838 4.8854 0.0000 41.4387 100.0806
Speed -0.6471 0.3016 -2.1454 0.0384 -1.2577 -0.0365
AADT -0.0015 0.0004 -3.7313 0.0006 -0.0023 -0.0007
Access Density -0.2220 0.1426 -1.5570 0.1278 -0.5106 0.0666
96
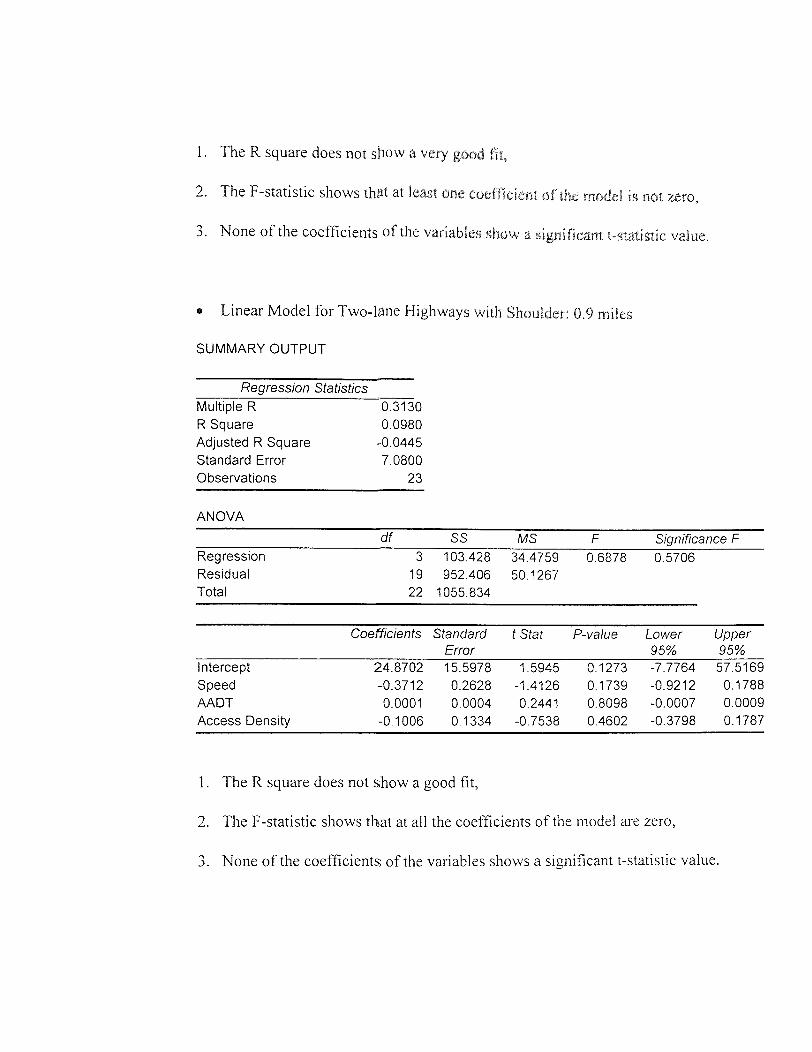
1. The R square does not show a very good fit,
2. The F-statistic shows that at least one coefficient of the model is not zero,
3. None of the coefficients of the variables show a significant t-statistic value.
e Linear Model for Two-lane Highways with Shoulder: 0.9 miles
SUMMARY OUTPUT
Regression Statistics Multiple R 0.3130 R Square 0.0980 Adjusted R Square -0.0445 Standard Error 7.0800 Observations 23
ANOVA
df SS MS F Significance F Regression 3 103.428 34.4759 0.6878 0.5706 Residual 19 952.406 50.1267 Total 22 1055.834
Coefficients Standard t Stat P-value Lower Upper Error 95% 95%
Intercept 24.8702 15.5978 1.5945 0.1273 -7.7764 57.5169 Speed -0.3712 0.2628 -1.4126 0.1739 -0.9212 0.1788 AADT 0.0001 0.0004 0.2441 0.8098 -0.0007 0.0009 Access Density -0.1006 0.1334 -0.7538 0.4602 -0.3798 0.1787
1. The R square does not show a good fit,
2. The F-statistic shows that at all the coefficients of the model are zero,
3. None of the coefficients of the variables shows a significant t-statistic value.

• Linear Model for Two-lane Highways without Shoulder: 0.9 miles
Regression Statistics
Multiple R 0.7373 R Square 0.5436 Adjusted R Square 0.4523 Standard Error 11.5074 Observations 19
ANOVA
df SS MS F Significance F
Regression 3 2365.633 788.5442 5.9548 0.0070
Residual 15 1986.319 132.4213 Total 18 4351.952
Coefficients Standard t Stat P-value Lower Upper
Error 95% 95%
Intercept 91.5866 37.0496 2.4720 0.0259 12.6173 170.5559
Speed -0.6825 1.1792 -0.5788 0.5713 -3.1958 1.8308
AADT -0.0029 0.0007 -3.9425 0.0013 -0.0044 -0.0013
Access Density -0.2430 0.2555 -0.9512 0.3566 -0.7875 0.3015
1. The R square does not show a very good fit, but better than the corresponding one
with shoulder,
2. The F-statistic shows that at least one coefficient of the model is not zero,
3. None of the coefficients of the variables show significant t-statistic values.
• Linear Model for Two-lane Highways: 1.2 miles
SUMMARY OUTPUT
Regression Statistics
Multiple R 0.4794
R Square 0.2298
Adjusted R Square 0.1082
Standard Error 10.2141
Observations 23

ANOVA
F df SS MS F Significance
Regression 3 591.434 197.1446 1.8897 0.1656
Residual 19 1982.219 104.3273 Total 22 2573.653
Upper Coefficients Standard t Stat P-value Lower Error 95% 95%
Intercept -26.0668 16.4512 -1.5845 0.1296 -60.4995 8.3659
Speed 0.5300 0.3623 1.4630 0.1598 -0.2282 1.2883
AADT 0.0003 0.0007 0.4228 0.6772 -0.0012 0.0017
Access Density 0.4317 0.2442 1.7676 0.0932 -0.0795 0.9428
1. The R square does not show a good fit,
2. The F-statistic shows that all the coefficients of the model are zero,
3. None of the coefficients of the variables show significant t-statistic values.
• Linear Model for Two-lane Highways: above 1.5 miles
SUMMARY OUTPUT
Regression Statistics
Multiple R 0.5002 R Square 0.2502 Adjusted R Square -0.0711 Standard Error 11.5542 Observations 11
ANOVA
df SS MS F Significance F
Regression 3 311.839 103.9463 0.7786 0.5422
Residual 7 934.503 133.5005
Total 10 1246.342
Coefficients Standard t Stat P-value Lower Upper Error 95% 95%
Intercept 11.4829 41.2674 0.2783 0.7889 -86.0990 109.0647
Speed 0.1061 0.4959 0.2140 0.8367 -1.0665 1.2787
AADT -0.0006 0.0013 -0.4574 0.6612 -0.0036 0.0024
Access Density 0.2716 0.3046 0.8917 0.4022 -0.4486 0.9918
99

1. The R square does not show a good fit,
2. The F-statistic shows that all the coefficients of the model are zero,
3. None of the coefficients show significant t-statistic values.
2. Nonlinear Regression Analysis of Two-lane Highways
• Nonlinear Model for Two-lane Highways: 0.6 miles
SUMMARY OUTPUT
Regression Statistics
Multiple R R Square Adjusted R Square Standard Error Observations
0.6739 0.4541 0.3282 9.9531
33
ANOVA
df SS MS F Significance F
Regression 6 2142.791 357.1318 3.6051 0.0098
Residual 26 2575.668 99.0642
Total 32 4718.459
Coefficients Standard t Stat P-value Lower Upper Error 95% 95%
Intercept 139.2991 91.2224 1.5270 0.1388 -48.2114 326.8096
Speed -3.1753 4.3519 -0.7296 0.4721 -12.1208 5.7702
Speed square 0.0374 0.0545 0.6853 0.4992 -0.0747 0.1494
AADT -0.0055 0.0020 -2.7183 0.0115 -0.0096 -0.0013
AADT square 0.0000 0.0000 2.1758 0.0388 0.0000 0.0000
Access density -0.6182 0.5203 -1.1882 0.2455 -1.6877 0.4512
Access density square
0.0140 0.0101 1.3798 0.1794 -0.0069 0.0349
1. The R square does not show a very good fit,
2. The F-statistic shows that at least one of the coefficients of the model is not zero,
3. None of the coefficients show significant t-statistic values.
100

• Nonlinear Model for Two-lane Highways: 0.9 miles
SUMMARY OUTPUT
Regression Statistics
Multiple R R Square Adjusted R Square Standard Error Observations
0.7831 0.6132 0.5469 9.3093
42
ANOVA
df SS MS F Significance F
Regression 6 4809.46 801.5767 9.2494 4.38E-06
Residual 35 3033.192 86.6626 Total 41 7842.652
Coefficients Standard t Stat P-value Lower Upper
Error 95% 95%
Intercept 191.0309 67.9162 2.8127 0.0080 53.1534 328.9083
Speed -4.9683 3.4059 -1.4587 0.1536 -11.8825 1.9460
Speed square 0.0579 0.0427 1.3567 0.1836 -0.0288 0.1446
AADT -0.0086 0.0019 -4.5543 0.0001 -0.0125 -0.0048
AADT square 2.13E-07 5.61E-08 3.7948 0.0006 9.9E-08 3.27E-07
Access density 0.5040 0.4224 1.1931 0.2408 -0.3536 1.3615
Access density square
-0.0095 0.0059 -1.5927 0.1202 -0.0215 0.0026
1. The R square shows a good fit,
2. The F-statistic shows that at least one of the coefficients of the model is not zero,
3. None of the coefficients show significant t-statistic values.
• Nonlinear Model for Two-lane Highways with Shoulder: 0.9 miles
Regression Statistics
Multiple R 0.5174
R Square 0.2677
Adjusted R Square -0.0068
Standard Error 6.9513
Observations 23
101

ANOVA
df SS MS F Significance F Regression 6 282.696 47.1160 0.9751 0.4730 Residual 16 773.138 48.3211 Total 22 1055.834
Coefficients Standard t Stat P-value Lower Upper Error 95% 95%
Intercept 141.2106 82.0393 1.7213 0.1045 -32.7049 315.1261 Speed -6.6364 3.8174 -1.7385 0.1013 -14.7289 1.4561 Speed square 0.0768 0.0466 1.6491 0.1186 -0.0219 0.1755 AADT 0.0001 0.0036 0.0174 0.9863 -0.0075 0.0077 AADT square 4.53E-09 9.02E-08 0.0503 0.9605 -1.9E-07 1.96E-07 Access density 0.4255 0.3615 1.1771 0.2564 -0.3408 1.1918 Access density square
-0.0083 0.0054 -1.5463 0.1416 -0.0198 0.0031
1. The R square does not show a good fit,
2. The F-statistic shows that all the coefficients of the model are zero,
3. None of the coefficients show significant t-statistic values.
• Nonlinear Model for Two-lane Highways without Shoulder: 0.9 miles
SUMMARY OUTPUT
Regression Statistics Multiple R 0.7555 R Square 0.5707 Adjusted R Square 0.3561 Standard Error 12.4773 Observations 19
ANOVA
df SS MS F Significance F Regression 6 2483.766 413.9610 2.6590 0.0705 Residual 12 1868.186 155.6821 Total 18 4351.952
102

Coefficients Standard Error
t Stat P-value Lower 95%
Upper 95%
Intercept -49.4611 0 65535.0 0.9863 -49.4611 -49.4611 Speed 10.8437 0 65535.0 0.9605 10.8437 10.8437 Speed square -0.1845 0 65535.0 0.2564 -0.1845 -0.1845 AADT -0.0104 0.0088 -1.1888 0.2575 -0.0295 0.0087 AADT square 2.75E-07 3.18E-07 0.8641 0.4045 -4.2E-07 9.67E-07 Access density 0.2805 1.4992 0.1871 0.8547 -2.9860 3.5470 Access density square
-0.0058 0.0206 -0.2821 0.7826 -0.0507 0.0391
1. The R square does not show a very good fit,
2. The F-statistic shows that all the coefficients of the model are zero,
3. None of the coefficients show significant t-statistic values.
• Nonlinear Model for Two-lane Highways: 1.2 miles
SUMMARY OUTPUT
Regression Statistics Multiple R R Square Adjusted R Square Standard Error Observations
0.6336 0.4014 0.1769 9.8125
23
ANOVA
df SS MS F Significance F
Regression 6 1033.079 172.180 1.7882 0.1650 Residual 16 1540.574 96.286 Total 22 2573.653
Coefficients Standard t Stat P-value Lower Upper Error 95% 95%
Intercept 37.2859 74.6415 0.4995 0.6242 -120.9471 195.5189 Speed 3.4168 3.3306 1.0259 0.3202 -3.6438 10.4773 Speed square -0.0335 0.0414 -0.8086 0.4306 -0.1213 0.0543 AADT -0.0165 0.0114 -1.4469 0.1672 -0.0407 0.0077 AADT square 4.88E-07 3.31E-07 1.4749 0.1596 -2.1E-07 1.19E-06 Access density 1.6288 0.7354 2.2149 0.0416 0.0699 3.1878 Access density square
-0.0207 0.0138 -1.5021 0.1525 -0.0499 0.0085
103

1. The R square does not show a very good fit,
2. The F-statistic shows that all the coefficients of the model are zero,
3. None of the coefficients show significant t-statistic values.
• Nonlinear Model for Two-lane Highways: above 1.5 miles
SUMMARY OUTPUT
Regression Statistics Multiple R R Square Adjusted R Square Standard Error Observations
0.9318 0.8683 0.6707 6.4062
11
ANOVA
df SS MS F Significance F
Regression 6 1082.187 180.3645 4.3950 0.0867 Residual 4 164.155 41.0388 Total 10 1246.342
Coefficients Standard t Stat P-value Lower Upper Error 95% 95%
Intercept -165.5238 81.2302 -2.0377 0.1112 -391.0554 60.0077
Speed 18.6628 5.3183 3.5091 0.0247 3.8967 33.4288
Speed square -0.2377 0.0698 -3.4062 0.0271 -0.4314 -0.0439
AADT -0.0211 0.0066 -3.2128 0.0325 -0.0394 -0.0029
AADT square 6.54E-07 2.11E-07 3.1035 0.0361 6.89E-08 1.24E-06
Access density 0.0264 0.7930 0.0333 0.9751 -2.1753 2.2280
Access density square
-0.0097 0.0125 -0.7782 0.4799 -0.0444 0.0250
1. The R square shows a good fit,
2. The F-statistic shows that all the coefficients of the model are zero,
3. None of the coefficients show significant t-statistic values.
104
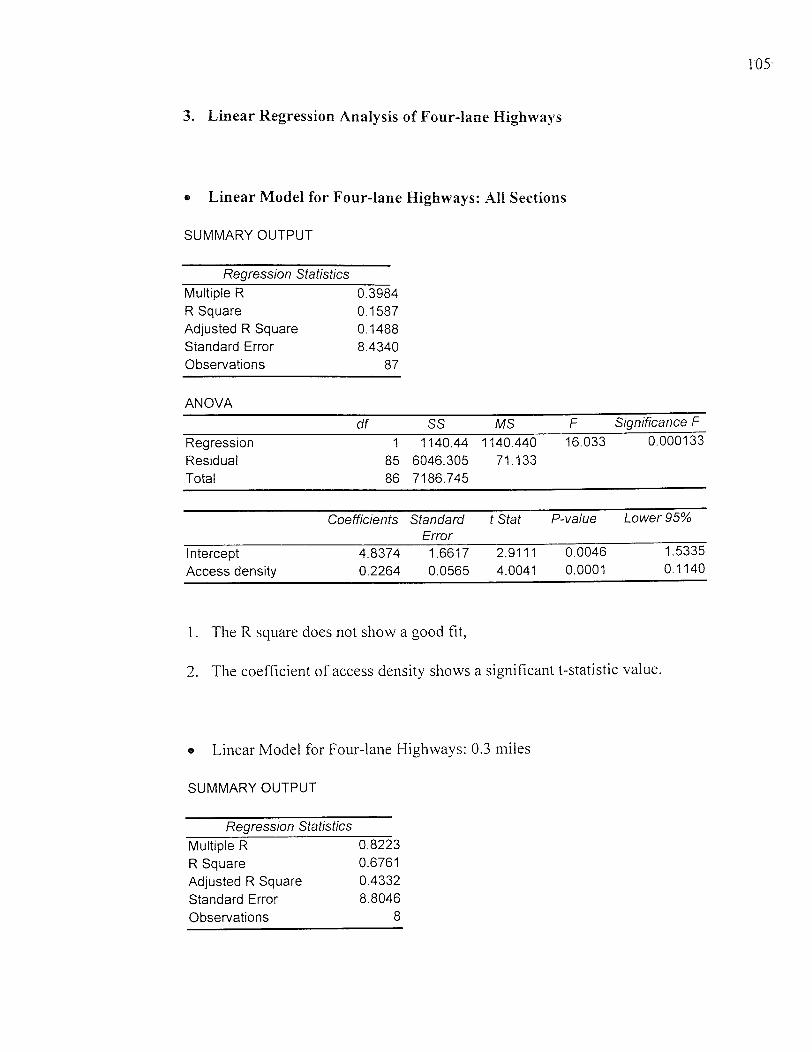
3. Linear Regression Analysis of Four-lane Highways
• Linear Model for Four-lane Highways: All Sections
SUMMARY OUTPUT
Regression Statistics
Multiple R 0.3984 R Square 0.1587 Adjusted R Square 0.1488 Standard Error 8.4340 Observations 87
ANOVA
df SS MS F Significance F
Regression 1 1140.44 1140.440 16.033 0.000133
Residual 85 6046.305 71.133 Total 86 7186.745
Coefficients Standard t Stat P-value Lower 95% Error
Intercept 4.8374 1.6617 2.9111 0.0046 1.5335
Access density 0.2264 0.0565 4.0041 0.0001 0.1140
1. The R square does not show a good fit,
2. The coefficient of access density shows a significant t-statistic value.
• Linear Model for Four-lane Highways: 0.3 miles
SUMMARY OUTPUT
Regression Statistics
Multiple R 0.8223
R Square 0.6761
Adjusted R Square 0.4332
Standard Error 8.8046
Observations 8
105
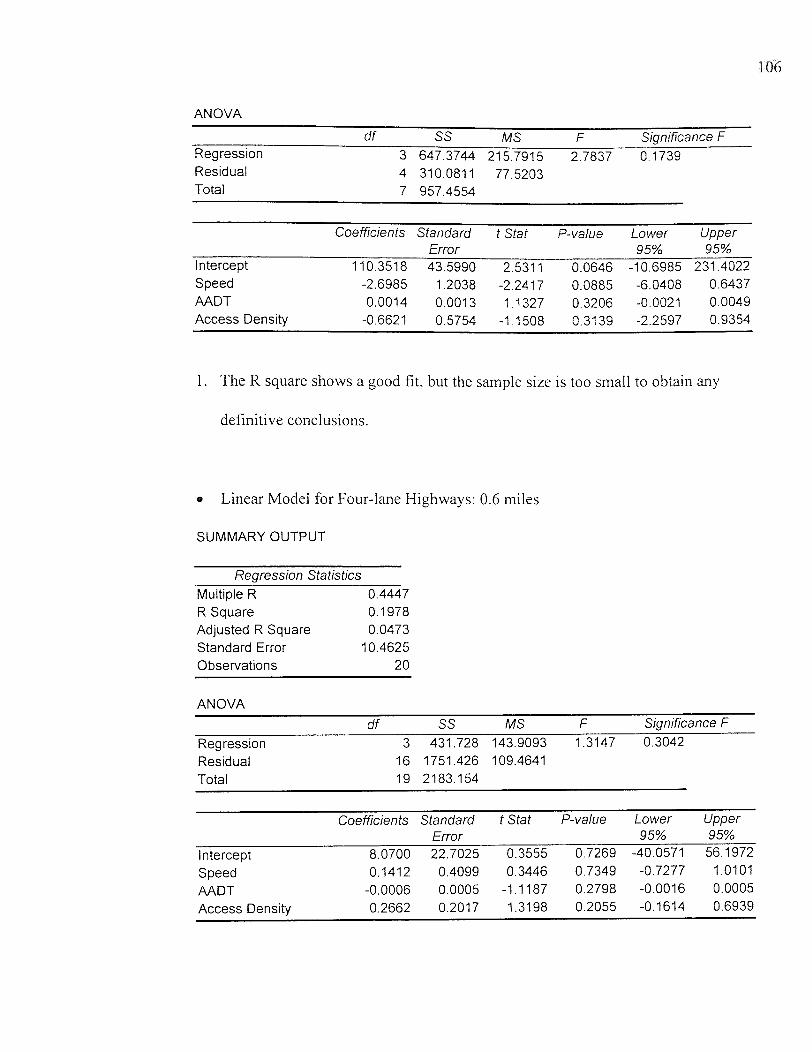
ANOVA
df SS MS F Significance F Regression 3 647.3744 215.7915 2.7837 0.1739 Residual 4 310.0811 77.5203 Total 7 957.4554
Coefficients Standard t Stet P-value Lower Upper Error 95% 95%
Intercept 110.3518 43.5990 2.5311 0.0646 -10.6985 231.4022 Speed -2.6985 1.2038 -2.2417 0.0885 -6.0408 0.6437 AADT 0.0014 0.0013 1.1327 0.3206 -0.0021 0.0049 Access Density -0.6621 0.5754 -1.1508 0.3139 -2.2597 0.9354
1. The R square shows a good fit, but the sample size is too small to obtain any
definitive conclusions.
• Linear Model for Four-lane Highways: 0.6 miles
SUMMARY OUTPUT
Regression Statistics
Multiple R 0.4447 R Square 0.1978 Adjusted R Square 0.0473 Standard Error 10.4625 Observations 20
ANOVA
df SS MS F Significance F
Regression 3 431.728 143.9093 1.3147 0.3042
Residual 16 1751.426 109.4641
Total 19 2183.154
Coefficients Standard t Stat P-value Lower Upper Error 95% 95%
Intercept 8.0700 22.7025 0.3555 0.7269 -40.0571 56.1972
Speed 0.1412 0.4099 0.3446 0.7349 -0.7277 1.0101
AADT -0.0006 0.0005 -1.1187 0.2798 -0.0016 0.0005
Access Density 0.2662 0.2017 1.3198 0.2055 -0.1614 0.6939
106

1. The R square does not show a good fit,
2. The F-statistic shows that all the coefficients of the model are zero,
3. None of the coefficients show significant t-statistic values.
Linear Model for Four-lane Highways: 0.9 miles
SUMMARY OUTPUT
Regression Statistics
Multiple R 0.7425 R Square 0.5513 Adjusted R Square 0.4840 Standard Error 6.4776 Observations 24
ANOVA
df SS MS F Significance F
Regression 3 1031.109 343.7030 8.1914 0.0009
Residual 20 839.179 41.9590
Total 23 1870.288
Coefficients Standard t Stat P-value Lower Upper
Error 95% 95%
Intercept 44.1753 15.2788 2.8913 0.0090 12.3043 76.0463
Speed -0.6903 0.2207 -3.1273 0.0053 -1.1507 -0.2298
AADT -0.0002 0.0003 -0.8300 0.4164 -0.0007 0.0003
Access Density 0.0319 0.1464 0.2176 0.8299 -0.2735 0.3373
1. The R square does not show a very good fit,
2. The F-statistic shows that at least one of the coefficients of the model is not zero,
3. None of the coefficients show significant t-statistic values.
107

• Linear Model for Four-lane Highways: 1.2 miles
SUMMARY OUTPUT
Regression Statistics Multiple R 0.6846 R Square 0.4686 Adjusted R Square 0.3624 Standard Error 6.0547 Observations 19
ANOVA
df SS MS F Significance F
Regression 3 484.984 161.6613 4.4098 0.0206 Residual 15 549.892 36.6595 Total 18 1034.876
Coefficients Standard t Stat P-value Lower Upper Error 95% 95%
Intercept 45.3003 11.6861 3.8764 0.0015 20.3918 70.2087
Speed -0.6265 0.1861 -3.3663 0.0042 -1.0231 -0.2298
AADT -0.0002 0.0004 -0.6006 0.5571 -0.0011 0.0006
Access Density -0.1118 0.0941 -1.1884 0.2531 -0.3123 0.0887
1. The R square does not show a good fit,
2. The F-statistic shows that at least one of the coefficients of the model is not zero,
3. None of the coefficients show significant t-statistic values.
• Linear Model for Four-lane Highways: above 1.5 miles
SUMMARY OUTPUT
Regression Statistics
Multiple R 0.7899
R Square 0.6239
Adjusted R Square 0.5213
Standard Error 4.3556
Observations 15
108
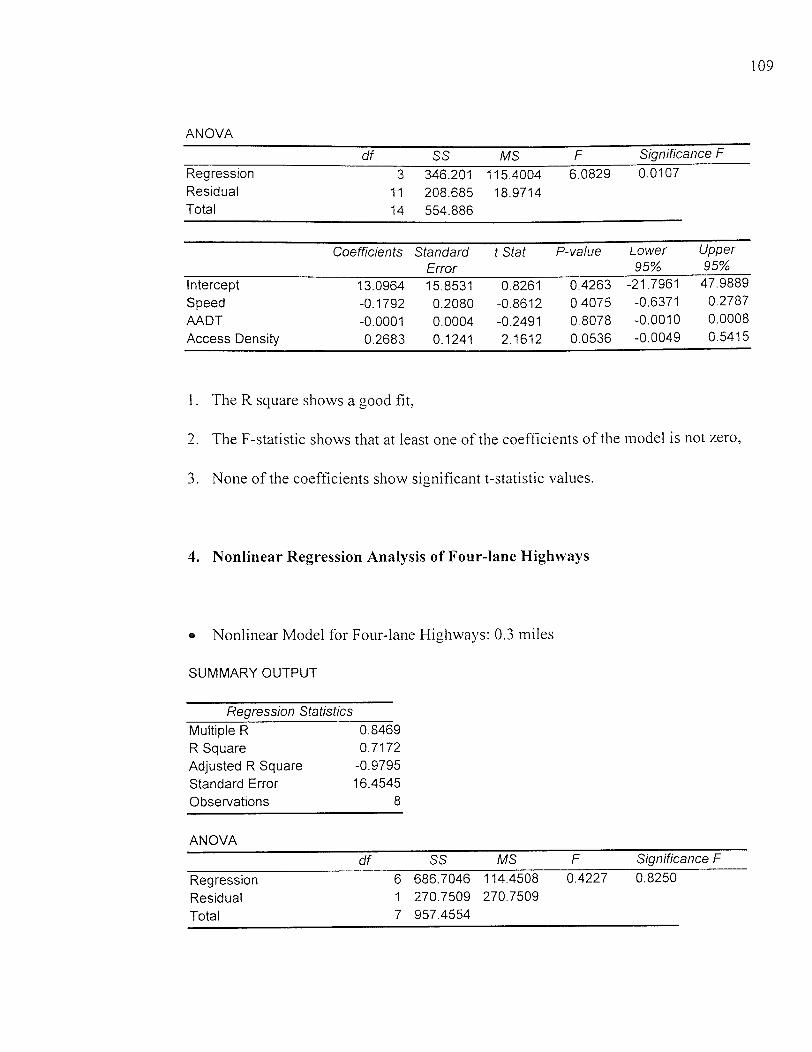
ANOVA
df SS MS F Significance F
Regression 3 346.201 115.4004 6.0829 0.0107
Residual 11 208.685 18.9714 Total 14 554.886
Coefficients Standard t Stat P-value Lower Upper
Error 95% 95%
Intercept 13.0964 15.8531 0.8261 0.4263 -21.7961 47.9889
Speed -0.1792 0.2080 -0.8612 0.4075 -0.6371 0.2787
AADT -0.0001 0.0004 -0.2491 0.8078 -0.0010 0.0008
Access Density 0.2683 0.1241 2.1612 0.0536 -0.0049 0.5415
1. The R square shows a good fit,
2. The F-statistic shows that at least one of the coefficients of the model is not zero,
3. None of the coefficients show significant t-statistic values.
4. Nonlinear Regression Analysis of Four-lane Highways
Nonlinear Model for Four-lane Highways: 0.3 miles
SUMMARY OUTPUT
Regression Statistics
Multiple R 0.8469
R Square 0.7172
Adjusted R Square -0.9795 Standard Error 16.4545
Observations 8
ANOVA
df SS MS F Significance F
Regression 6 686.7046 114.4508 0.4227 0.8250
Residual 1 270.7509 270.7509
Total 7 957.4554
109
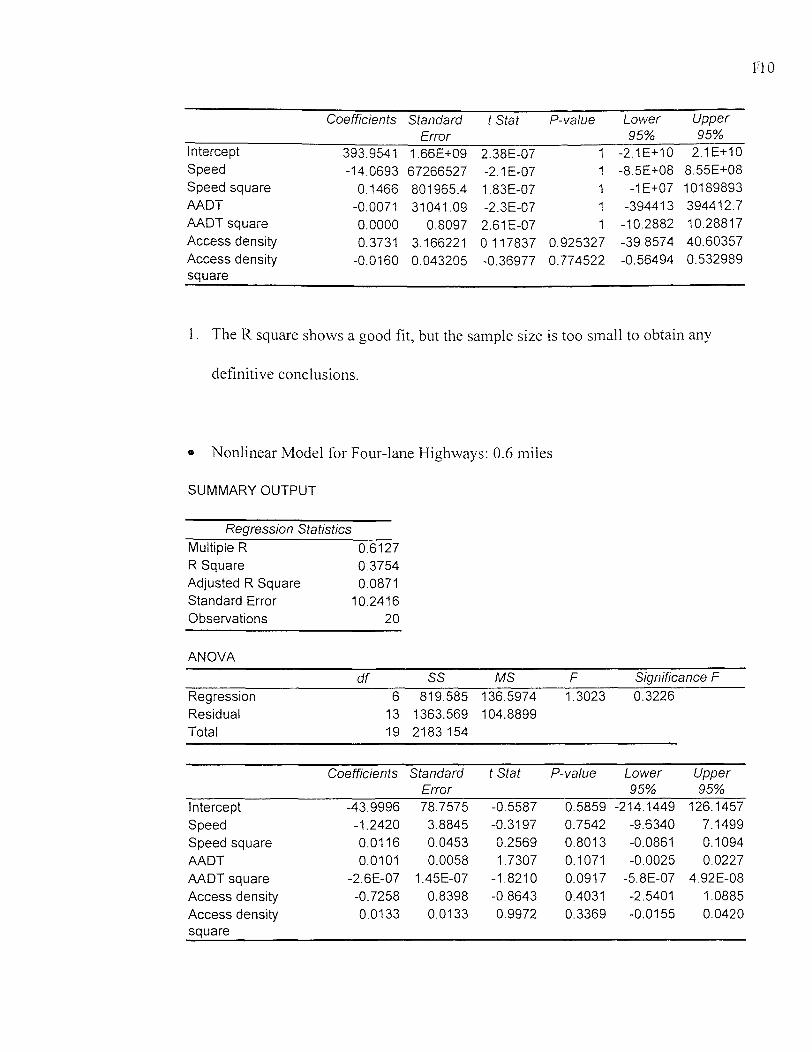
Coefficients Standard Error
t Stet P-value Lower 95%
Upper 95%
Intercept 393.9541 1.66E+09 2.38E-07 1 -2.1E+10 2.1E+10 Speed -14.0693 67266527 -2.1E-07 1 -8.5E+08 8.55E+08 Speed square 0.1466 801965.4 1.83E-07 1 -1E+07 10189893 AADT -0.0071 31041.09 -2.3E-07 1 -394413 394412.7 AADT square 0.0000 0.8097 2.61E-07 1 -10.2882 10.28817 Access density 0.3731 3.166221 0.117837 0.925327 -39.8574 40.60357 Access density square
-0.0160 0.043205 -0.36977 0.774522 -0.56494 0.532989
1. The R square shows a good fit, but the sample size is too small to obtain any
definitive conclusions.
• Nonlinear Model for Four-lane Highways: 0.6 miles
SUMMARY OUTPUT
Regression Statistics Multiple R R Square Adjusted R Square Standard Error Observations
0.6127 0.3754 0.0871
10.2416 20
ANOVA
df SS MS F Significance F
Regression 6 819.585 136.5974 1.3023 0.3226 Residual 13 1363.569 104.8899 Total 19 2183.154
Coefficients Standard t Stat P-value Lower Upper Error 95% 95%
Intercept -43.9996 78.7575 -0.5587 0.5859 -214.1449 126.1457
Speed -1.2420 3.8845 -0.3197 0.7542 -9.6340 7.1499
Speed square 0.0116 0.0453 0.2569 0.8013 -0.0861 0.1094
AADT 0.0101 0.0058 1.7307 0.1071 -0.0025 0.0227
AADT square -2.6E-07 1.45E-07 -1.8210 0.0917 -5.8E-07 4.92E-08
Access density -0.7258 0.8398 -0.8643 0.4031 -2.5401 1.0885
Access density square
0.0133 0.0133 0.9972 0.3369 -0.0155 0.0420
110
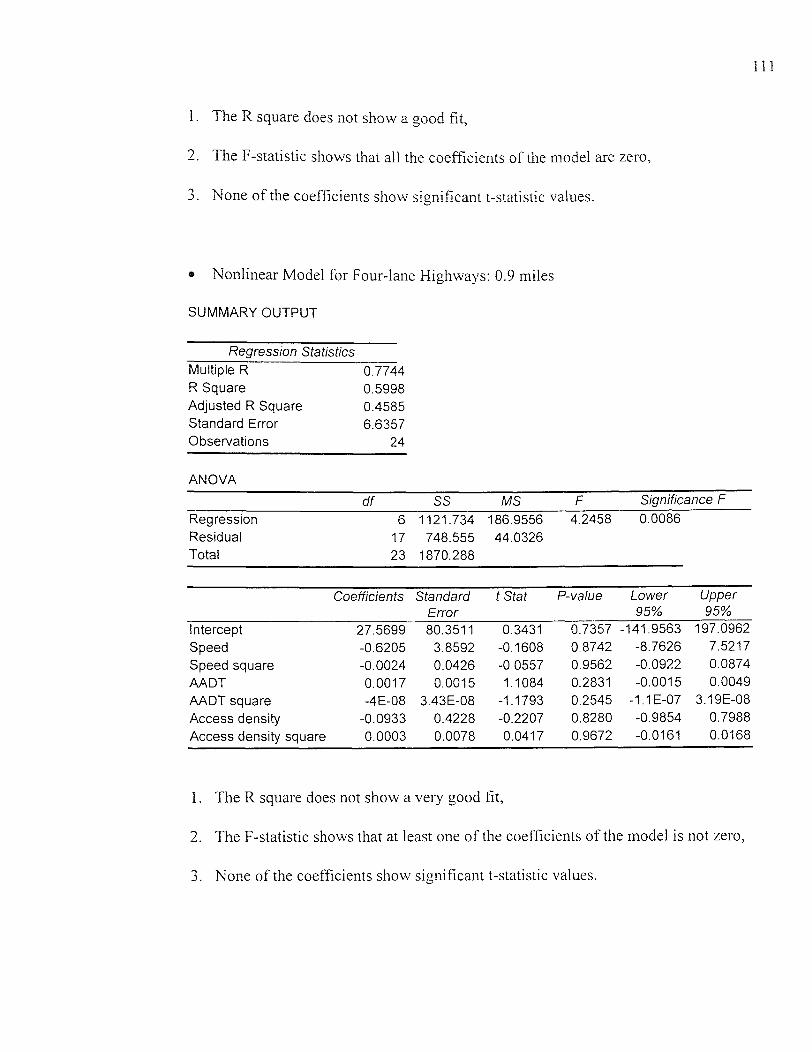
I. The R square does not show a good fit,
2. The F-statistic shows that all the coefficients of the model are zero,
3. None of the coefficients show significant t-statistic values.
• Nonlinear Model for Four-lane Highways: 0.9 miles
SUMMARY OUTPUT
Regression Statistics Multiple R 0.7744 R Square 0.5998 Adjusted R Square 0.4585 Standard Error 6.6357 Observations 24
ANOVA
df SS MS F Significance F
Regression 6 1121.734 186.9556 4.2458 0.0086
Residual 17 748.555 44.0326 Total 23 1870.288
Coefficients Standard t Stat P-value Lower Upper Error 95% 95%
Intercept 27.5699 80.3511 0.3431 0.7357 -141.9563 197.0962
Speed -0.6205 3.8592 -0.1608 0.8742 -8.7626 7.5217
Speed square -0.0024 0.0426 -0.0557 0.9562 -0.0922 0.0874
AADT 0.0017 0.0015 1.1084 0.2831 -0.0015 0.0049
AADT square -4E-08 3.43E-08 -1.1793 0.2545 -1.1E-07 3.19E-08
Access density -0.0933 0.4228 -0.2207 0.8280 -0.9854 0.7988
Access density square 0.0003 0.0078 0.0417 0.9672 -0.0161 0.0168
1. The R square does not show a very good fit,
2. The F-statistic shows that at least one of the coefficients of the model is not zero,
3. None of the coefficients show significant t-statistic values.
111
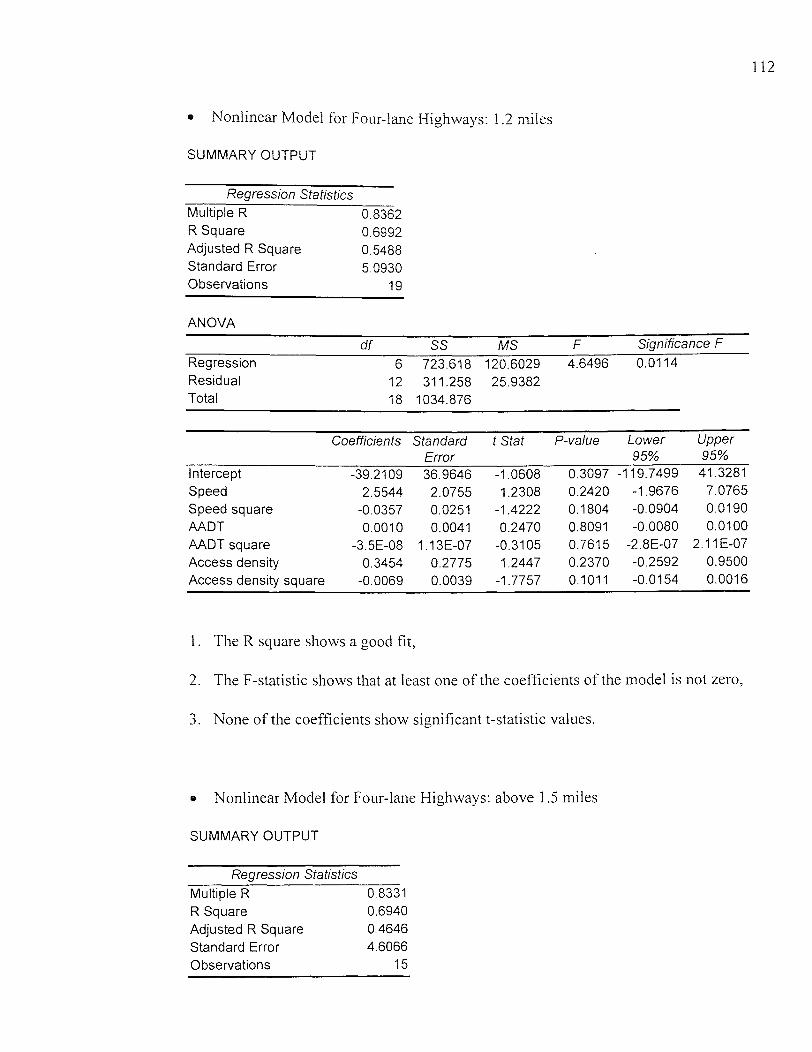
• Nonlinear Model for Four-lane Highways: 1.2 miles
SUMMARY OUTPUT
Regression Statistics Multiple R 0.8362 R Square 0.6992 Adjusted R Square 0.5488 Standard Error 5.0930 Observations 19
ANOVA
df SS MS F Significance F
Regression 6 723.618 120.6029 4.6496 0.0114 Residual 12 311.258 25.9382 Total 18 1034.876
Coefficients Standard t Stat P-value Lower Upper Error 95% 95%
Intercept -39.2109 36.9646 -1.0608 0.3097 -119.7499 41.3281
Speed 2.5544 2.0755 1.2308 0.2420 -1.9676 7.0765
Speed square -0.0357 0.0251 -1.4222 0.1804 -0.0904 0.0190
AADT 0.0010 0.0041 0.2470 0.8091 -0.0080 0.0100
AADT square -3.5E-08 1.13E-07 -0.3105 0.7615 -2.8E-07 2.11E-07
Access density 0.3454 0.2775 1.2447 0.2370 -0.2592 0.9500
Access density square -0.0069 0.0039 -1.7757 0.1011 -0.0154 0.0016
1. The R square shows a good fit,
2. The F-statistic shows that at least one of the coefficients of the model is not zero,
3. None of the coefficients show significant t-statistic values.
• Nonlinear Model for Four-lane Highways: above 1.5 miles
SUMMARY OUTPUT
Regression Statistics
Multiple R 0.8331 R Square 0.6940 Adjusted R Square 0.4646
Standard Error 4.6066
Observations 15
112
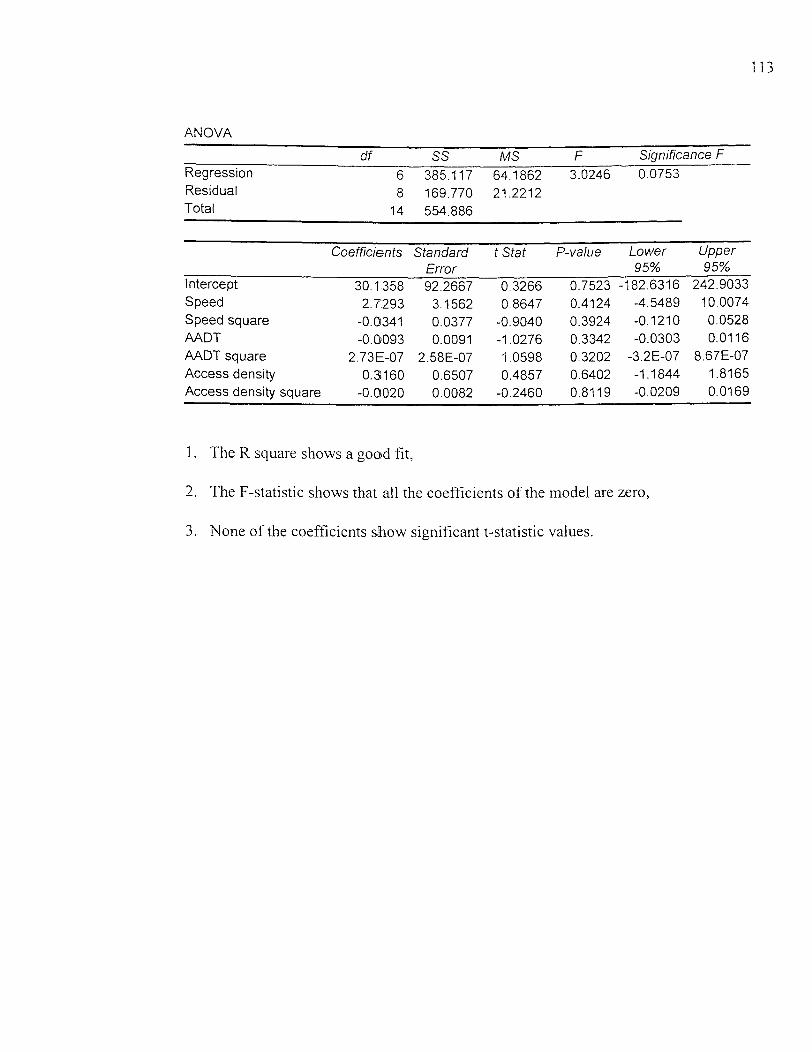
ANOVA
df SS MS F Significance F Regression Residual Total
6 8
14
385.117 169.770 554.886
64.1862 21.2212
3.0246 0.0753
Coefficients Standard t Stat P-value Lower Upper
Error 95% 95% Intercept 30.1358 92.2667 0.3266 0.7523 -182.6316 242.9033 Speed 2.7293 3.1562 0.8647 0.4124 -4.5489 10.0074 Speed square -0.0341 0.0377 -0.9040 0.3924 -0.1210 0.0528 AADT -0.0093 0.0091 -1.0276 0.3342 -0.0303 0.0116 AADT square 2.73E-07 2.58E-07 1.0598 0.3202 -3.2E-07 8.67E07 Access density 0.3160 0.6507 0.4857 0.6402 -1.1844 1.8165
Access density square -0.0020 0.0082 -0.2460 0.8119 -0.0209 0.0169
1. The R square shows a good fit,
2. The F-statistic shows that all the coefficients of the model are zero,
3. None of the coefficients show significant t-statistic values.
113
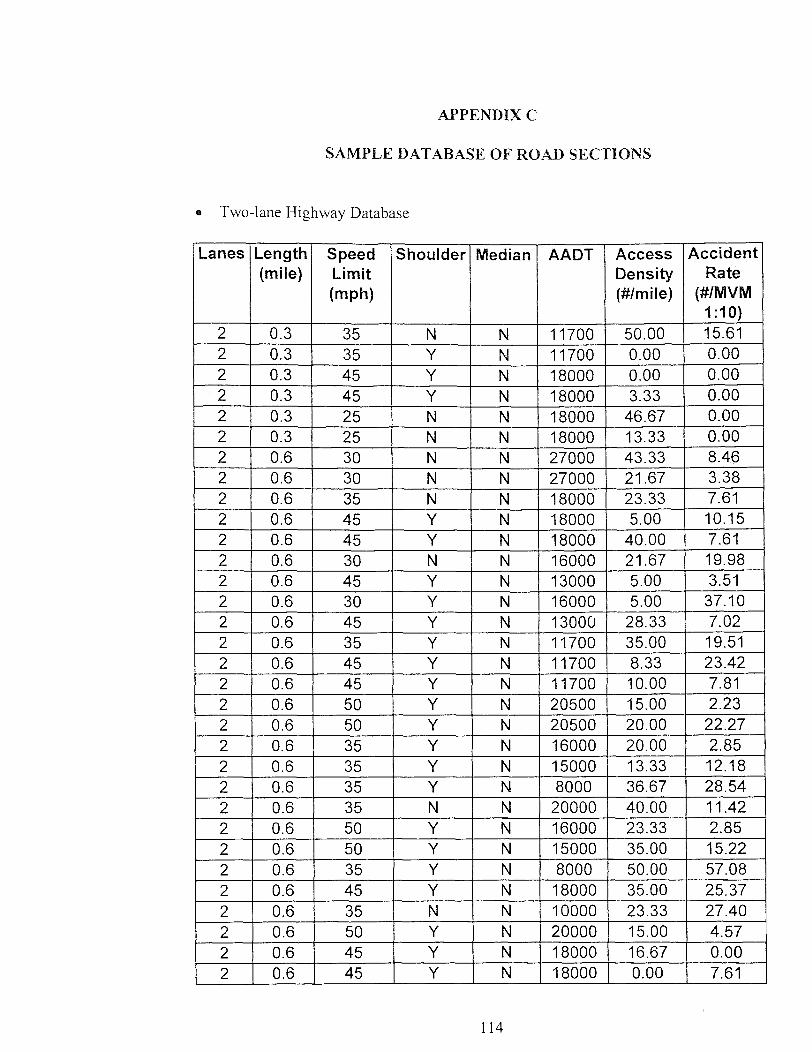
APPENDIX C
SAMPLE DATABASE OF ROAD SECTIONS
• Two-lane Highway Database
Lanes Length (mile)
Speed Limit (mph)
Shoulder Median AADT Access Density (#/mile)
Accident Rate
(#/MVM 1:10)
2 0.3 35 N N 11700 50.00 15.61 2 0.3 35 Y N 11700 0.00 0.00 2 0.3 45 Y N 18000 0.00 0.00 2 0.3 45 Y N 18000 3.33 0.00 2 0.3 25 N N 18000 46.67 0.00 2 0.3 25 N N 18000 13.33 0.00 2 0.6 30 N N 27000 43.33 8.46 2 0.6 30 N N 27000 21.67 3.38 2 0.6 35 N N 18000 23.33 7.61 2 0.6 45 Y N 18000 5.00 10.15 2 0.6 45 Y N 18000 40.00 7.61 2 0.6 30 N N 16000 21.67 19.98 2 0.6 45 Y N 13000 5.00 3.51 2 0.6 30 Y N 16000 5.00 37.10 2 0.6 45 Y N 13000 28.33 7.02 2 0.6 35 Y N 11700 35.00 19.51 2 0.6 45 Y N 11700 8.33 23.42 2 0.6 45 Y N 11700 10.00 7.81 2 0.6 50 Y N 20500 15.00 2.23 2 0.6 50 Y N 20500 20.00 22.27 2 0.6 35 Y N 16000 20.00 2.85 2 0.6 35 Y N 15000 13.33 12.18 2 0.6 35 Y N 8000 36.67 28.54 2 0.6 35 N N 20000 40.00 11.42 2 0.6 50 Y N 16000 23.33 2.85 2 0.6 50 Y N 15000 35.00 15.22 2 0.6 35 Y N 8000 50.00 57.08 2 0.6 45 Y N 18000 35.00 25.37 2 0.6 35 N N 10000 23.33 27.40 2 0.6 50 Y N 20000 15.00 4.57 2 0.6 45 Y N 18000 16.67 0.00 2 0.6 45 Y N 18000 0.00 7.61
114

Table (Continued) Lanes Length
(mile) Speed Limit (mph)
Shoulder Median AADT Access Density (#/mile)
Accident Rate
(#IMVM 1:10)
2 0.6 30 N N 21000 31.67 4.35 2 0.6 30 N N 21000 40.00 0.00 2 0.6 45 N N 27000 11.67 6.76 2 0.6 45 N N 27000 10.00 16.91 2 0.6 35 N N 18000 48.33 7.61 2 0.6 35 N N 18000 30.00 20.29 2 0.6 35 N N 18000 36.67 15.22 2 0.7 35 Y N 21000 22.86 1.86 2 0.7 35 Y N 21000 18.57 7.46 2 0.8 30 N N 14000 45.00 9.78 2 0.8 30 N N 14000 36.25 12.23 2 0.9 50 Y N 14000 13.33 4.35 2 0.9 50 Y N 14000 3.33 0.00 2 0.9 40 Y N 27000 24.44 10.15 2 0.9 30 Y N 13200 40.00 4.61 2 0.9 40 Y N 27000 23.33 12.40 2 0.9 30 Y N 13600 65.56 6.72 2 0.9 35 N N 10000 47.78 24.35 2 0.9 35 N N 18000 43.33 8.46 2 0.9 35 N N 10000 56.67 36.53 2 0.9 35 N N 10000 50.00 24.35 2 0.9 35 N N 18000 43.33 6.76 2 0.9 35 N N 18000 14.44 8.46 2 0.9 50 Y N 22000 18.89 9.69 2 0.9 50 Y N 22000 4.44 5.53 2 0.9 35 Y N 18000 51.11 8.46
2 0.9 30 Y N 16000 30.00 32.34
2 0.9 45 Y N 16000 26.67 5.71
2 0.9 50 Y N 20000 32.22 12.18
2 0.9 50 Y N 20000 25.56 4.57
2 0.9 30 N N 16000 34.44 11.42
2 0.9 45 Y N 16000 35.56 3.81
2 0.9 50 Y N 20500 3.33 2.97
2 0.9 50 Y N 20500 11.11 8.91
2 0.9 35 Y N 15000 16.67 14.21
2 0.9 30 N N 8000 17.78 41.86
2 0.9 45 Y N 18000 24.44 1.69
2 0.9 45 Y N 18000 18.89 13.53
115
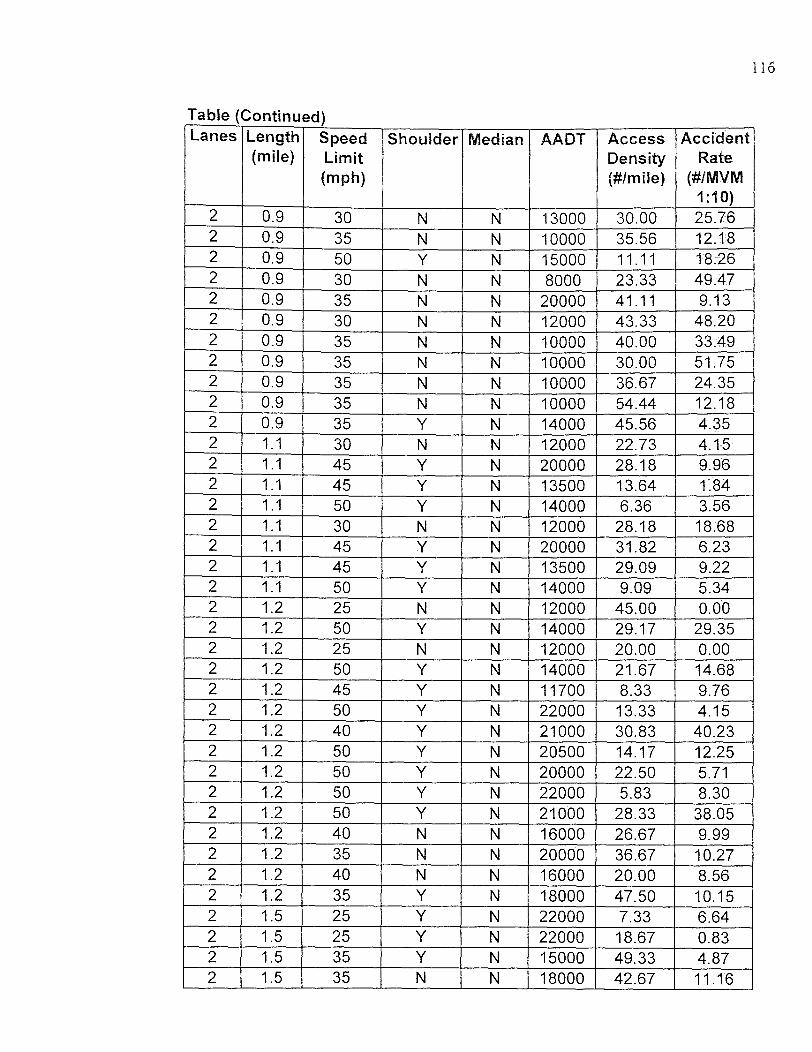
Table (Continued) Lanes Length
(mile) Speed Limit (mph)
Shoulder Median AADT Access Density (#/mile)
Accident Rate
(#/MVM 1:10)
2 0.9 30 N N 13000 30.00 25.76 2 0.9 35 N N 10000 35.56 12.18 2 0.9 50 Y N 15000 11.11 18.26 2 0.9 30 N N 8000 23.33 49.47 2 0.9 35 N N 20000 41.11 9.13 2 0.9 30 N N 12000 43.33 48.20 2 0.9 35 N N 10000 40.00 33.49 2 0.9 35 N N 10000 30.00 51.75 2 0.9 35 N N 10000 36.67 24.35 2 0.9 35 N N 10000 54.44 12.18 2 0.9 35 Y N 14000 45.56 4.35 2 1.1 30 N N 12000 22.73 4.15 2 1.1 45 Y N 20000 28.18 9.96 2 1.1 45 Y N 13500 13.64 1.84 2 1.1 50 Y N 14000 6.36 3.56 2 1.1 30 N N 12000 28.18 18.68 2 1.1 45 Y N 20000 31.82 6.23 2 1.1 45 Y N 13500 29.09 9.22 2 1.1 50 Y N 14000 9.09 5.34 2 1.2 25 N N 12000 45.00 0.00 2 1.2 50 Y N 14000 29.17 29.35 2 1.2 25 N N 12000 20.00 0.00 2 1.2 50 Y N 14000 21.67 14.68 2 1.2 45 Y N 11700 8.33 9.76 2 1.2 50 Y N 22000 13.33 4.15 2 1.2 40 Y N 21000 30.83 40.23 2 1.2 50 Y N 20500 14.17 12.25 2 1.2 50 Y N 20000 22.50 5.71 2 1.2 50 Y N 22000 5.83 8.30 2 1.2 50 Y N 21000 28.33 38.05 2 1.2 40 N N 16000 26.67 9.99 2 1.2 35 N N 20000 36.67 10.27 2 1.2 40 N N 16000 20.00 8.56 2 1.2 35 Y N 18000 47.50 10.15 2 1.5 25 Y N 22000 7.33 6.64 2 1.5 25 Y N 22000 18.67 0.83 2 1.5 35 Y N 15000 49.33 4.87 2 1.5 35 N N 18000 42.67 11.16
116

Table (Continued) Lanes Length
(mile) Speed Limit (mph)
Shoulder Median AADT Access Density (#/mile)
Accident Rate
(#/MVM 1:10)
2 1.7 40 Y N 18000 31.18 28.65 2 1.7 40 Y N 18000 34.71 25.07 2 1.8 50 Y N 14000 6.11 6.52 2 1.8 50 Y N 14000 18.89 6.52 2 1.8 50 Y N 20500 11.11 8.91 2 1.8 35 N N 10000 43.33 35.01 2 2.7 35 Y N 14000 34.81 9.42
* Four-lane Highway Database
Lanes Length (mile)
Speed Limit (mph)
Shoulder Median AADT Access Density (#/mile)
Accident Rate
(#/MVM 1:10)
4 0.3 45 Y N 11700 6.67 0.00 4 0.3 50 Y N 20000 3.33 0.00 4 0.3 45, Y N 11700 0.00 7.81 4 0.3 50 Y N 20000 6.67 0.00 4 0.3 35 Y N 15000 26.67 30.44 4 0.3 35 Y N 15000 20.00 12.18 4 0.3 40 N N 27000 50.00 3.38 4 0.3 40 N N 27000 33.33 23.68 4 0.5 40 Y N 22000 38,00 7,47 4 0.5 40 Y N 22000 32.00 2.49 4 0.6 30 Y N 22000 45.00 12.45 4 0.6 35 Y Y 18000 48.33 5.07 4 0.6 35 Y Y 18000 41.67 12.68 4 0.6 45 Y N 13500 1.67 10.15 4 0.6 55 Y Y 25000 10.00 7.31 4 0.6 45 Y N 13500 16.67 0.00 4 0.6 55 Y Y 25000 10.00 3.65 4 0.6 35 N N 20000 16.67 11.42 4 0.6 35 N N 27000 28.33 3.38 4 0.6 30 Y N 27000 51.67 1.69 4 0.6 35 Y N 19000 30.00 16.82 4 0.6 35 Y N 19000 30.00 19.23 4 0.6 30 N N 13200 41.67 13.84
117

Table (Continued) Lanes Length
(mile) Speed Limit (mph)
Shoulder Median AADT Access Density (#/mile)
Accident Rate
(#/MVM 1:10)
4 0.6 35 N N 27000 11.67 0.00 4 0.6 30 Y N 27000 16.67 3.38 4 0.6 30 Y N 13600 36.67 3.36 4 0.6 35 Y Y 18000 48.33 48.20 4 0.6 35 N Y 18000 46.67 15.22 4 0.6 35 Y Y 18000 35.00 32.98 4 0.9 55 Y Y 20000 7.78 0.00 4 0.9 55 Y Y 15000 1.11 4.06 4 0.9 50 Y Y 14000 13.33 2.17 4 0.9 55 Y Y 20000 10.00 3.04 4 0.9 55 Y Y 15000 6.67 2.03 4 0.9 50 Y Y 14000 0.00 2.17 4 0.9 30 Y N 37000 20.00 11.52 4 0.9 35 Y N 19000 47.78 19.23 4 0.9 35 Y N 16000 15.56 36.15 4 0.9 35 Y N 16000 31.11 3.81 4 0.9 30 Y N 37000 7.78 13.99 4 0.9 45 Y N 19000 14.44 8.01 4 0.9 35 Y N 19000 25.56 17.62 4 0.9 35 Y N 19000 17.78 14.42 4 0.9 35 N Y 18000 45.56 16.91 4 0.9 55 Y Y 25000 2.22 2.44 4 0.9 55 Y Y 25000 4.44 3.65 4 0.9 40 N N 20500 18.89 14.85 4 0.9 40 N N 22000 33.33 24.91 4 0.9 55 Y Y 12000 11.11 5.07 4 0.9 55 Y Y 20000 3.33 4.57 4 0.9 55 Y Y 12000 6.67 0.00 4 0.9 55 Y Y 20000 20.00 3.04 4 0.9 35 Y N 19000 34.44 12.82 4 1 40 Y N 17500 34.00 20.35 4 1 40 Y N 17500 42.00 14.09 4 1.1 50 Y N 14000 12.73 8.90 4 1.1 50 Y N 14000 8.18 10.67 4 1.2 55 Y Y 25000 11.67 1.83 4 1.2 55 Y Y 20000 3.33 2.28 4 1.2 55 Y Y 25000 18.33 0.91 4 1.2 55 Y Y 20000 14.17 3.42
118
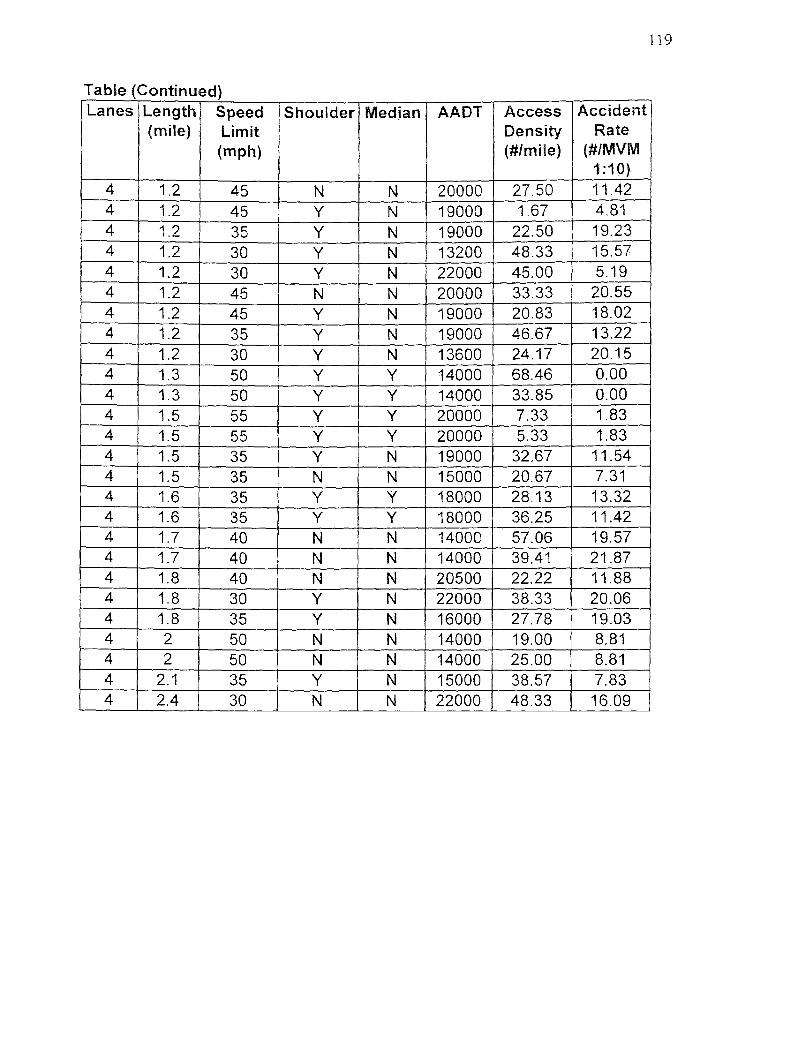
Table (Continued) Lanes Length
(mile) Speed Limit (mph)
Shoulder Median AADT Access Density (#/mile)
Accident Rate
(#/MVM 1:10)
4 1.2 45 N N 20000 27.50 11.42 4 1.2 45 Y N 19000 1.67 4.81 4 1.2 35 Y N 19000 22.50 19.23 4 1.2 30 Y N 13200 48.33 15.57 4 1.2 30 Y N 22000 45.00 5.19 4 1.2 45 N N 20000 33.33 20.55 4 1.2 45 Y N 19000 20.83 18.02 4 1.2 35 Y N 19000 46.67 13.22 4 1.2 30 Y N 13600 24.17 20.15 4 1.3 50 Y Y 14000 68.46 0.00 4 1.3 50 Y Y 14000 33.85 0.00 4 1.5 55 Y Y 20000 7.33 1.83 4 1.5 55 Y Y 20000 5.33 1.83 4 1.5 35 Y N 19000 32.67 11.54 4 1.5 35 N N 15000 20.67 7.31 4 1.6 35 Y Y 18000 28.13 13.32 4 1.6 35 Y Y 18000 36.25 11.42 4 1.7 40 N N 14000 57.06 19.57 4 1.7 40 N N 14000 39.41 21.87 4 1.8 40 N N 20500 22.22 11.88 4 1.8 30 Y N 22000 38.33 20.06 4 1.8 35 Y N 16000 27.78 19.03 4 2 50 N N 14000 19.00 8.81 4 2 50 N N 14000 25.00 8.81 4 2.1 35 Y N 15000 38.57 7.83 4 2.4 30 N N 22000 48.33 16.09
119

REFERENCES
H.W. McGee, W.E. Huges, and K.Daily, "Effect of Highway Standards on Safety", NCHRP Report 374, TRB, National Research Council, Washington, D.C., 1995.
D.M. Belmont, "Effect of Shoulder Width on Accident on Two-lane Tangents", HRB, Bull.91, 1954.
E.T. Perkins, "Relationship of Accident Rate to Highway Shoulder Width", HRB, Bull.151, 1956.
R.C. Blensley and J.A. Head, "Statistical Determination of Effect of Paved Shoulder Width on Traffic Accident Frequency", HRB, BulI.240, 1960.
O.K.Dart and L.Mann, Jr., "Relationship of Rural Highway Geometry to Accident Rates in Louisiana", HRB 310, 1970.
Jorgensen, R., and Associates, NCHRP Report No. 197 "Cost and Safety Effectiveness of Highway Design Elements", TRB, National Research Council, Washington, D.C, 1978.
Zegeer, C.V., J.Mayes, and R.Deen, "Effect of Lane and Shoulder Width on Accident Reduction on Rural Two-lane Roads", TRR 806, TRB, National Research Council, Washington, D.C, 1981.
Rachel Goldtine, "Influence of Road Width on Accident Rates by Traffic Volume", TRR 1318, TRB, National Research Council, Washington, D.C, 1991.
Ezra Hauer and Jane Lovell, "New Direction for Learning About the Safety Effect of Measures", TRR 1068, National Research Council, Washington, D.C, 1986.
Zegeer, C.V., J. Hummer, D.Reinfurt, L.Herf and W. Hunter, Safety Effects of Cross-
section Design for Two-lane Roads, Volume I and 11, Report No. FHWA-RD-87-008, FHWA, U.S. Department of Transportation, 1987.
J.C. Laughland, L.E. Haefner, J.W. Hall, and D.R. Clough, NCHRP Report No.162: "Methods for Evaluation of Highway Safety Improvement", TRB, National Research Council, Washington, D.C, 1975.
120
121
A.S. Hakkert, "Determining the Priority of Road Safety Improvements", Technical Report RY/6183, National Institute for Transportation and Road Research, Council for Industrial and Scientific Research, Pretoria, South Africa, 1983.
Joseph Craus, Moshe Livneh, and Ilan Ishai, "Effect of Pavement and Shoulder Condition on Highway Accidents", TRR 1318, TRB, National Research Council, Washington, D.C, 1991.
Harwood, D.W., NCHRP Report No.330: "Effective Utilization of Street Width on Urban Arterial", TRB, National Research Council, Washington, D.C, 1990.
Harwood, D.W., "Relationships Between Operational and Safety Considerations in Geometric Design Improvements", TRR 1512, TRB, National Research Council, Washington, D.C, 1995.
Glennon, J.C., Neuman, T.R., and Leisch, J.E., "Safety and operational Consideration for Design of Rural Curves", Report No. FHWAIRD-86/035, Federal Highway Administration, Washington, D.C. 1985.
Zegeer, C.V., Stewart, R., Reinfurt, D., Council, F., Neuman, T.R., Hamilton, E., Miller, and Hunter, W., "Cost-Effective Geometric Improvement for Safety Upgrading of Horizontal Curves", Report No. FHWA/RD-90/021, Federal Highway Administration, Washington, D.C, 1991.
Neuman, T.R. and Glennon, J.C., "Cost-Effectiveness of Improvements to Stopping-Sight-Distance Safety Problems", TRR 923, TRB, National Research Council, Washington, D.C, 1983.
A. H. Veh, Improvements to Reduce Traffic Accidents, Proc., ASCE, 1937.
R.A. Lundy, "Effect of Traffic Volumes and Number of Lanes on Freeway Accident Rates", Highway Research Record 99, HRB, National Research Council, Washington, D.C, 1965.
Bhagwant N.Persaud and Kornel Mucsi, "Microscopic Accident Potential Models for Two-lane Rural Roads", TRR 1485, TRB, National Research Council, Washington, D.C, 1995.
D.W. Gwynn, "Relationship of Accident Rates and Accident Involvement with Hourly Volume", Traffic Quarterly, 1967.
J.W. Hall and O.J. Pendleton, "Rural Accident Rate Variation with Traffic Volume", TRR 1281, National Research Council, Washington, D.C, 1990.

122
D.Orne, "Traffic , Accident and Highway Data-State Perspective", Implementing Highway Safety Improvement, ASCE, Washington, D.C, 1980.
J.K.Kihlberg and K.J.Tharp, NCHRP Report No.47: "Accident Rates as Related to Design Elements of Rural Highways", HRB, National Research Council, Washington, D.C, 1968.
Abbess, C., D. Jarrett, and C.C.Wright, Accidents at Blackspots: "Estimating the Effectiveness of Remedial Treatment, with Special Reference to the "Regression-To-Mean" Effect", Traffic Engineering and Control, Vol.22, No.10,1981.
Michael Yiu-Kuen Lau, Adlof D.May, and Richard N.Smith, "Application of Accident Prediction Models", TRR 1238, TRB, National Research Council, Washington, D.C, 1989.
E.Hauer and B.N. Persaud, "How to Estimate the Safety of Rail-Highway Grade Crossings and the Safety Effects of Warning Devices", TRR 1114, TRB, National Research Council, Washington, D.C, 1988.
Carl Belanger, "Estimation of Safety of Four-legged Unsignalized Intersections", TRR 1467, TRB, National Research Council, Washington, D.C, 1994.
Ezra Hauer and Jane Lovell, "New Directions for Learning About the Safety Effect of Measures", TRR 1068, TRB, National Research Council, Washington, D.C, 1986.
Ezra Hauer, "Empirical Bayes Approach to the Estimation of "Unsafety", The Multivariate Regression Method, Accident Analysis and Prevention", Vol. 24, No. S, 1992.
F.J. Koepke and H.S. Levinson, NCHRP Report No.348: "Access Management Guidelines for Activities Centers", TRB, National Research Council, Washington, D.C, 1992.
Access Management for Streets and Highways, FHWA Report FHWA-IP-82-3, 1982.
NCHRP Report No.93, Guidelines for Medial and Marginal Access Control on Major Roadways, HRB, National Research Council, Washington, D.C, 1970.
John C.Powers, "Effect of Access on Capacity and Flow", Final Report, June 1988.