core competencies and data collaboration for service integration: california adolescent sexual...
TRANSCRIPT

Core Competencies and Data Collaboration for Service Integration:
California Adolescent Sexual Health Work GroupSTD, HIV/AIDS, and Adolescent Birth Rate Tables
Joan M. Chow, MPH, DrPH
Sexually Transmitted Disease Control Branch
California Department of Public Health
Title X Business Meeting, Los Angeles, March 9, 2009

Overview
ASHWG Goals and Partners Core Competencies Data Collaboration Process Standardized state-level tables/charts Challenges for regional/local-level data Dissemination

California Adolescent Sexual Health Work Group (ASHWG)
A standing work group of program managers from the California Department of Public Health, California Department of Education, and key non-governmental organizations committed to working
more effectively to address the sexual and reproductive health of California adolescents.
Vision: Create a coordinated, collaborative, and integrated system among government and non-
government organizations to promote and protect the sexual and reproductive health of youth in
California.

ASHWG Goals
1) To increase awareness of ways to foster an integrative approach to HIV, STD, and teen pregnancy prevention
2) To strengthen communication and collaboration among HIV, STD, and teen pregnancy prevention programs.

ASHWG MembershipGovernmental
California Department of Public Health
• Maternal Chile Adolescent Health
• Office of Family Planning • Office of AIDS• STD Control Branch
California Department of Education
California Department of Alcohol & Drug Programs
California Department of Social Services
Non-Governmental • CA Family Health Council• MCH Action• CA Adolescent Health
Collaborative• Center for Health Training• ETR Associates• Gay/Straight Alliance Network• Health Initiatives for Youth• Internet Sexuality Information
Services (ISIS)• TeenNOW• California School Boards
Association

Core Competencies
• Did not exist for Adolescent Health Care
• Outline the knowledge, skills, and attitudes required of capable adolescent service providers
• May be used in hiring, training, evaluating staff
• Optimally will ensure that programs have a shared body of knowledge and skills

Core Competencies for Providers of Adolescent Sexual and Reproductive Health
Programs/Services
DomainsA. Professional and Legal RoleB. Adolescent Development C. Youth Centered Approach and Youth CultureD. Sexual and Reproductive Health E. Pregnancy, Sexually Transmitted Infections, and HIV
Sub-Domains
Each Domain is divided into two Sub-Domains
Cognitive: What a provider should know Operative: What a provider should be able to do

Core Competencies for Adolescent and Reproductive Health
California Adolescent Sexual Health Work Group
• Core Competencies were finalized and approved in September 2008
• Available on the California Adolescent Health Collaborative website at:
http://www.californiateenhealth.org/CC_registration.php.


Data collaboration and standardization process
• Adolescent age groups– MCAH 15-19– STD 10-14, 15-19– OA 13-29– Final: 10-14, 15-17, 18-19, (20-24)
• Race/ethnicity categories– White, African-American/Black, Hispanic/Latino, Asian/Pacific
Islander, Native American/Alaska Native• Time period: 2000-2006• Tables by age and race• Time trend charts by age; by race (15-19)
– Exception: HIV/AIDS charts based on cumulative, living AIDS cases

Adolescent Birth Data - California
Age GroupCases Rate Cases Rate Cases Rate Cases Rate Cases Rate Cases Rate Cases Rate
Age 10-14 895 0.7 809 0.6 743 0.5 710 0.5 695 0.5 756 0.5 681 0.5Age 15-17 18,887 26.5 17,307 23.8 16,660 22.4 16,193 21.2 16,263 20.6 16,740 20.3 17,208 20.0Age 18-19 36,486 76.8 35,659 73.5 33,541 68.5 33,137 66.5 33,474 65.5 33,277 63.9 35,562 66.3Age 15-19 55,373 46.7 52,966 43.7 50,201 40.7 49,330 39.1 49,737 38.2 50,017 37.2 52,770 37.8*Rate per 1,000 age-specific females
Race/EthnicityCases Rate Cases Rate Cases Rate Cases Rate Cases Rate Cases Rate Cases Rate
White (Non Hispanic) 9,871 21.6 8,989 19.2 8,375 17.5 7,947 16.3 7,340 14.8 7,028 13.9 7,118 13.9African American (Non Hispanic) 4,841 58.0 4,354 50.1 3,913 43.7 3,890 41.9 3,872 40.2 3,819 38.4 4,143 40.8
American Indian (Non Hispanic) 316 43.5 283 37.0 276 34.8 250 30.1 245 28.3 281 31.2 271 29.3Asian/Pacific Islander (Non Hispanic) 2,286 16.4 2,125 15.0 1,919 13.5 1,809 12.6 1,679 11.6 1,675 11.6 1,549 10.9Hispanic 36,892 78.7 36,051 76.1 34,613 72.0 34,252 69.1 35,315 68.1 36,025 65.4 38,243 65.0
Adolescent Birth Rates and Cases by Race/Ethnicity, For Female California Residents Age 15-19, 2000- 2006
2000 2001
*Rate per 1,000 females age 15-19
Adolescent Birth Rates and Cases by Mother’s Age, For Female California Residents Age 10-19, 2000-20062004 2005 2006
2000 2001 2002 2003 2004 2005 2006
2002 2003
Source: Number of births are derived from the California Birth Statistical Master File, 2000-2006.
Rates are per 1,000 age-specific females. Female population projections are derived from the California Department of Finance, Race/Ethnic Populations with Age & Sex Detail, 2000-2005. Sacramento, CA, July 2007.
Prepared by: California Department of Public Health, Maternal, Child and Adolescent Health Program.

Adolescent Birth Rates by Mother’s Age For Female California Residents Age 10-19
2000 - 2006
0
20
40
60
80
100
2000 2001 2002 2003 2004 2005 2006
Year of Child's Birth
Rat
es p
er 1
,000
ag
e-sp
ecif
ic
fem
ales
Age 10-14 Age 15-17 Age 18-19 Age 15-19
Source: Number of births are derived from the California Birth Statistical Master File, 2000-2006.
Rates are per 1,000 age-specific females. Female population projections are derived from the California Department of Finance, Race/Ethnic Populations with Age & Sex Detail, 2000-2005. Sacramento, CA, July 2007.
Prepared by: California Department of Public Health, Maternal, Child and Adolescent Health Program.

Adolescent Birth Rates by Race/EthnicityFor Female California Residents Age 15-19
2000 - 2006
0.0
20.0
40.0
60.0
80.0
100.0
2000 2001 2002 2003 2004 2005 2006Year of Child's Birth
Ra
tes
pe
r 1
,00
0 f
em
ale
s a
ge
15
-19 White (Non Hispanic)
African American (Non Hispanic)
American Indian (Non Hispanic)
Asian/Pacific Islander(Non Hispanic)
Hispanic
Source: Number of births are derived from the California Birth Statistical Master File, 2000-2006
Rates are per 1,000 age-specific females. Female population projections are derived from the California Department of Finance, Race/Ethnic Population with Age & Sex Detail, 2000-2005. Sacramento, CA, July 2007.
Prepared by: California Department of Public Health, Maternal, Child and Adolescent Health Program.

Adolescent/Young Adult AIDS Data - California
White Ages 10 - 14 * ^ 14 3.0
15 - 17 * ^ 18 5.618 - 19 * * 38 17.1(15 - 19) 23 4.5 56 10.320 - 24 87 17.6 595 110.9
African American/Black Ages 10 - 14 11 ^ * ^
15 - 17 8 ^ * *18 - 19 18 44.4 * *(15 - 19) 26 25.2 47 43.720 - 24 125 141.2 321 332.5
Hispanic/Latino Ages 10 - 14 15 2.2 19 2.7
15 - 17 15 3.8 36 8.718 - 19 26 11.4 97 39.9(15 - 19) 41 6.6 133 20.220 - 24 160 31.3 1,053 188.3
Other/Unknown Ages 10 - 14 * ^ * ^
15 - 17 * ^ * ^18 - 19 * ^ * *(15 - 19) 7 ^ 15 7.320 - 24 19 9.7 96 46.8
TOTAL Ages 10 - 14 38 2.7 45 3.1
15 - 17 36 4.1 71 7.718 - 19 61 11.0 180 30.5(15 - 19) 97 6.7 251 16.620 - 24 391 30.3 2,065 147.8
*Data w itheld to ensure case confidentiality.^Rates w here the Relative Standard error w as above 0.3000 w itheld due to statistical instability.
Other/Unknow n includes Asian/Pacif ic Islanders, Native Americans, Multi-Race and those w ith missing race/ethnicity information.
Source: California Department of Public Health, Office of AIDS, HIV/AIDS Case Registry Section, data as of October 31, 2007.
California Department of Finance, Race/Ethnic Population w ith Age & Sex Detail, 2000-2050, Sacramento, CA, July 2007.
For more information, call the HIV/AIDS Case Registry Section at (916) 449-5866.
Rundate: 11/07/2007, WD.
Living AIDS Cases and Rates Among 10-24 Year Olds by Race/Ethnicity, Age Group and Gender, Cummulative Cases Reported Through July 31, 2007
AGE GROUP BYRACE/ETHNICITY
FEMALE MALECases Rate Cases Rate

Adolescent/Young Adult AIDS Data - California
White Ages 10 - 14 0 0
15 - 17 * ^ 9 ^
18 - 19 5 ^ 20 9.0
(15 - 19) * ^ 29 5.3
20 - 24 50 10.1 393 73.3
African American/Black Ages 10 - 14 0 0
15 - 17 5 ^ 11 ^
18 - 19 10 ^ 25 58.6
(15 - 19) 15 14.6 36 33.5
20 - 24 70 79.1 246 254.8
Hispanic/Latino Ages 10 - 14 0 * ^
15 - 17 5 ^ 18 4.3
18 - 19 18 7.9 71 29.2
(15 - 19) 23 3.7 89 13.5
20 - 24 113 22.1 793 141.8
Other/Unknown Ages 10 - 14 0 0
15 - 17 * ^ 0
18 - 19 0 7 ^
(15 - 19) * ^ 7 ^
20 - 24 9 ^ 77 37.5
TOTAL Ages 10 - 14 0 * ^
15 - 17 15 1.7 38 4.1
18 - 19 33 5.9 123 20.8
(15 - 19) 48 3.3 161 10.6
20 - 24 242 18.8 1,509 108.0
*Data witheld to ensure case confidentiality.^Rates where the Relative Standard error was above 0.3000 witheld due to statistical instability.
MSM=Men who have sex with men.
Other/Unknown includes Asian/Pacific Islanders, Native Americans, Multi-Race and those with missing race/ethnicity infromation.
Source: California Department of Public Health, Office of AIDS, HIV/AIDS Case Registry Section, data as of October 31, 2007.
California Department of Finance, Race/Ethnic Population with Age & Sex Detail, 2000-2050, Sacramento, CA, July 2007.
For more information, call the HIV/AIDS Case Registry Section at (916) 449-5866.
Rundate: 11/07/2007, WD.
Living AIDS Cases and Rates Among 10-24 Year Olds for MSM and Heterosexual Contact Modes of Exposure by Race/Ethnicity, Age Group and Gender. Cummulative Cases Reported Through July 31, 2007
AGE GROUP BYRACE/ETHNICITY
FEMALE MALECases Rate Cases Rate
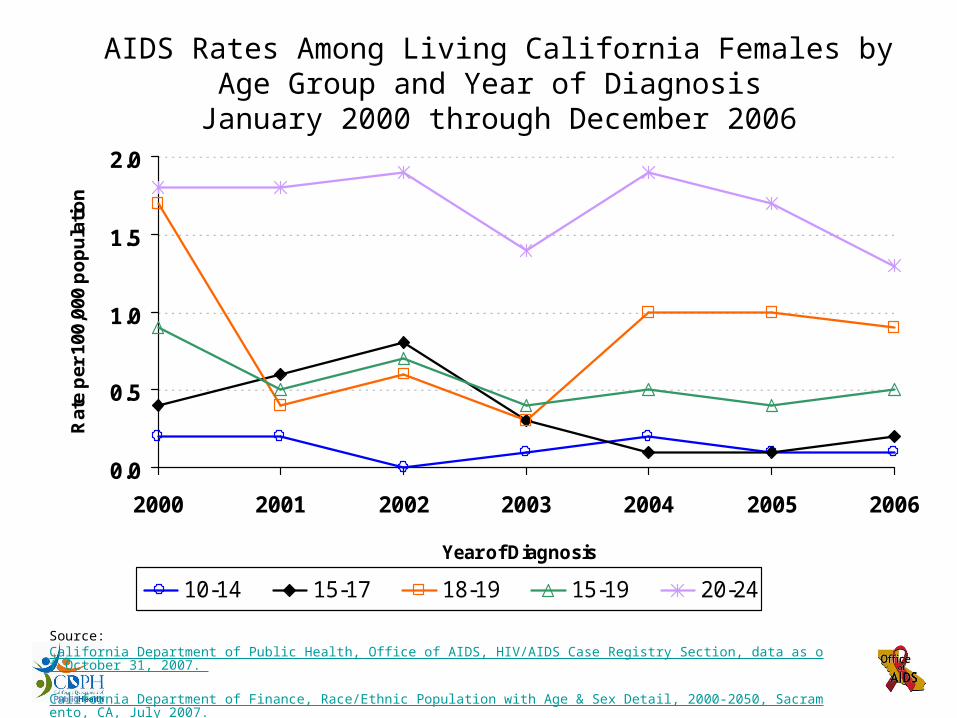
AIDS Rates Among Living California Females by Age Group and Year of Diagnosis
January 2000 through December 2006
0.0
0.5
1.0
1.5
2.0
2000 2001 2002 2003 2004 2005 2006
Year of Diagnosis
Rat
e p
er 1
00,0
00 p
op
ula
tion
10-14 15-17 18-19 15-19 20-24
Source: California Department of Public Health, Office of AIDS, HIV/AIDS Case Registry Section, data as of October 31, 2007. California Department of Finance, Race/Ethnic Population with Age & Sex Detail, 2000-2050, Sacramento, CA, July 2007.For more information, call the HIV/AIDS Case Registry Section at (916) 449-5866.

AIDS Rates Among Living California Males by Age Group and Year of Diagnosis From January 2000
Through December 2006
0
2
4
6
8
10
12
2000 2001 2002 2003 2004 2005 2006
Year of Diagnosis
Rat
e p
er 1
00,0
00 p
op
ula
tion
10-14 15-17 18-19 15-19 20-24Source: California Department of Public Health, Office of AIDS, HIV/AIDS Case Registry Section, data as of October 31, 2007. California Department of Finance, Race/Ethnic Population with Age & Sex Detail, 2000-2050, Sacramento, CA, July 2007.For more information, call the HIV/AIDS Case Registry Section at (916) 449-5866.

Adolescent STD Data: Chlamydia California
Age GroupCases Rate Cases Rate Cases Rate Cases Rate Cases Rate Cases Rate Cases Rate
10-14 1,362 107.2 1,247 94.1 1,323 96.4 1,226 87.0 1,305 91.1 1,192 83.2 1,135 80.015-17 11,399 1,600.9 11,386 1,567.3 11,947 1,607.5 12,269 1,605.7 12,652 1,601.4 13,175 1,597.4 13,495 1,571.718-19 13,937 2,934.7 14,345 2,958.8 15,010 3,063.9 15,713 3,152.1 16,644 3,259.1 17,344 3,332.7 18,288 3,408.915-19 25,336 2,134.5 25,731 2,124.2 26,957 2,186.1 27,982 2,216.2 29,296 2,252.3 30,519 2,268.8 31,783 2,278.2* Rate per 100,000 population
Race/EthnicityCases Rate Cases Rate Cases Rate Cases Rate Cases Rate Cases Rate Cases Rate
Native American/Alaskan Native 106 1,459.1 98 1,282.7 109 1,374.4 129 1,553.7 83 960.4 111 1,232.8 116 1,253.2Asian/Pacific Islander 758 544.0 759 537.3 880 618.8 872 607.9 878 607.6 874 606.2 880 603.4African American/Black 4,164 4,985.0 4,120 4,745.3 4,427 4,938.9 4,821 5,193.4 5,236 5,437.6 5,945 5,973.7 6,381 6,279.3Hispanic/Latino 7,799 1,664.0 8,268 1,744.4 8,686 1,806.1 9,116 1,838.0 9,405 1,812.5 9,973 1,811.2 10,213 1,734.7White 3,596 788.2 3,423 729.9 3,811 795.4 4,297 880.5 4,357 875.8 4,144 819.1 4,046 789.0* Rate per 100,000 age- and gender-specific population
Age GroupCases Rate Cases Rate Cases Rate Cases Rate Cases Rate Cases Rate Cases Rate
10-14 154 11.5 162 11.6 165 11.5 134 9.1 174 11.6 142 9.5 148 10.015-17 2,463 324.2 2,567 334.4 2,629 336.5 2,698 336.1 2,761 333.2 3,066 354.3 3,197 354.818-19 2,767 533.9 2,964 560.4 3,099 585.1 3,402 640.0 3,652 674.0 3,922 709.8 4,193 735.815-19 5,230 409.3 5,531 426.6 5,728 437.0 6,100 457.2 6,413 467.9 6,988 492.9 7,390 502.4* Rate per 100,000 population
Race/EthnicityCases Rate Cases Rate Cases Rate Cases Rate Cases Rate Cases Rate Cases Rate
Native American/Alaskan Native 14 182.9 16 198.0 20 235.8 25 285.0 21 231.3 18 191.5 16 165.8Asian/Pacific Islander 127 86.5 129 85.9 134 88.2 133 86.7 146 94.4 142 92.1 117 75.3African American/Black 1,294 1,450.5 1,253 1,352.8 1,344 1,410.9 1,475 1,506.4 1,625 1,608.1 1,885 1,809.9 2,099 1,974.6Hispanic/Latino 1,768 341.5 1,948 379.1 1,979 386.3 2,075 397.2 2,151 395.4 2,242 388.3 2,276 368.1White 533 109.8 534 106.9 540 105.9 662 127.9 703 133.5 676 126.1 646 118.8* Rate per 100,000 age- and gender-specific population
2001 2002 2004
Chlamydia Rates for Adolescent Females by Age Group California, 2000–2006
Chlamydia Rates for Adolescent Males by Age Group, California, 2000–2006
200620052004200320022001
Chlamydia Rates by Race/Ethnicity, For Female California Residents Age 15-19, 2000- 2006
2003 2004 2005 2006
2003
2002 20032000 20042001
2000
2000
2000 2001 2002
2005 2006
2005 2006
Chlamydia Rates by Race/Ethnicity, For Male California Residents Age 15-19, 2000- 2006
Source: California Department of Public Health, STD Control BranchState of California, Department of Finance, Race/Ethnic Population with Age and Sex Detail, 2000-2050. Sacramento, California, July 2007 Prepared by: California Department of Public Health, STD Control Branch

0
1,000
2,000
3,000
4,000
2000 2001 2002 2003 2004 2005 2006
Year
Ra
te p
er
10
0,0
00
po
pu
lati
on
10-14 15-17 18-19 15-19Source: California Department of Public Health, STD Control Branch
State of California, Department of Finance, Race/Ethnic Population with Age and Sex Detail, 2000-2050. Sacramento, California, July 2007
Prepared by: California Department of Public Health, STD Control Branch
Chlamydia Rates for Adolescent Females by Age GroupCalifornia, 2000–2006

Chlamydia Rates by Race/EthnicityFor Female California Residents Age 15-19
2000 - 2006
0
1000
2000
3000
4000
5000
6000
7000
2000 2001 2002 2003 2004 2005 2006Year
Ra
tes
pe
r 1
00
,00
0 fe
ma
les
ag
e 1
5-1
9 White
AfricanAmerican/Black
NativeAmerican/AlaskanNative
Asian/Pacific Islander(Non Hispanic)
Hispanic/Latino
Rates are per 100,000 age-specific females. Female population projections are derived from the State of California Department of Finance, Race/Ethnic Population with Age & Sex Detail, 2000-2005. Sacramento, CA, July 2007.
Prepared by: California Department of Public Health, STD Control Branch, August 2007


Web Links to California Adolescent Sexual Health Data
• Overview– http://californiateenhealth.org/data_overview.asp
• STD– www.std.ca.gov
• Birth Rates– http://www.cdph.ca.gov/data/statistics/Documents/VSC-2006-
0201.pdf
• HIV/AIDS– http://www.cdph.ca.gov/programs/aids/Documents/
HIVAIDSMergedDec08.pdf

Acknowledgments
• CDPH STD Control– Denise Gilson, Paul Gibson
• CDPH MCAH– Aldona Herrndorf, Lori Llewellyn, Mike Curtis
• CDPH Office of AIDS– Winnie Dysle, Lisette Tabshouri, Michael
Donohue
• Adolescent Health Collaborative (PHI)– Sandi Goldstein, Liz Worthy
