corncob dry matter loss in storage as affected by
TRANSCRIPT
Graduate Theses and Dissertations Iowa State University Capstones, Theses andDissertations
2010
Corncob dry matter loss in storage as affected bytemperature and moisture contentBernardo Gusman Del CampoIowa State University
Follow this and additional works at: https://lib.dr.iastate.edu/etd
Part of the Bioresource and Agricultural Engineering Commons
This Thesis is brought to you for free and open access by the Iowa State University Capstones, Theses and Dissertations at Iowa State University DigitalRepository. It has been accepted for inclusion in Graduate Theses and Dissertations by an authorized administrator of Iowa State University DigitalRepository. For more information, please contact [email protected].
Recommended CitationDel Campo, Bernardo Gusman, "Corncob dry matter loss in storage as affected by temperature and moisture content" (2010).Graduate Theses and Dissertations. 11796.https://lib.dr.iastate.edu/etd/11796
Corn cob dry matter loss in storage as affected by temperature and moisture content
by
Bernardo G. del Campo
A thesis submitted to the graduate faculty
in partial fulfillment of the requirements for the degree of
MASTER OF SCIENCE
Co-majors: Biorenewable Resources and Technology and Industrial and Agricultural
Technology
Program of Study Committee:
Thomas J. Brumm, Major Professor
Carl J. Bern
Russell E. Mullen
Theodore B. Bailey
Iowa State University
Ames, Iowa
2010

ii
To my family and friends
iii
TABLE OF CONTENTS
LIST OF FIGURES ....................................................................................................................... iv
LIST OF TABLES .......................................................................................................................... v
CHAPTER 1: GENERAL INTRODUCTION ............................................................................... 1
Rationale and Overview ................................................................................................... 1
Dissertation Organization ................................................................................................ 3
Objective ........................................................................................................................... 3
CHAPTER 2: LITERATURE REVIEW ........................................................................................ 4
Biomass, Cellulosic Potential .......................................................................................... 4
Corn Cobs Commercial Utilization ................................................................................. 5
Corncob Characterization .............................................................................................. 13
Cob Storage and Deterioration ....................................................................................... 17
Shelled Corn Storage Time and Previous Respirometer Studies ................................... 27
CHAPTER 3: CORN COB DRY MATTER LOSS IN STORAGE AS AFFECTED BY
TEMPERATURE AND MOISTURE CONTENT. .................................................................. 30
Abstract .......................................................................................................................... 30
Materials and Methods ................................................................................................... 33
Results and Discussions ................................................................................................. 39
Conclusions .................................................................................................................... 44
References ...................................................................................................................... 46
CHAPTER 4: GENERAL CONCLUSIONS................................................................................ 48
REFERENCES ............................................................................................................................. 50
APPENDIX A. DIAGRAM AND CODING................................................................................ 53
Diagram for the Electrical Components and Experimental set up ................................. 53
List of Materials and Datasheets .................................................................................... 53
Codes for the Interface: .................................................................................................. 54
APPENDIX B. STATISTICAL RESULTS ................................................................................. 67
ACKNOWLEDGEMENTS .......................................................................................................... 79

iv
LIST OF FIGURES
Figure 1: Containers used for hold on corn cob samples for the experiment. ......................... …34
Figure 2: 24 port manifold, regulator valves and air gauges controlling individual
sample’s air flow. .......................................................................................................................... 36
Figure 3: Deterioration trend line in DM loss (%) for 21 days ..................................................... 41
Figure 4: Dry matter loss for each treatment as a function of time.. ............................................ 43

v
LIST OF TABLES
Table 1: Averaged % dry matter loss for the three runs and every combination between
15, 25 and 35% moisture and 10, 20 & 30ºC. ............................................................................... 40
Table 2: Estimated 0.5 % DM loss on cobs and kernel in days .................................................... 42
Table 3: Predicted cobs DM loss (%) over 6 months storage ....................................................... 44

1
CHAPTER 1: GENERAL INTRODUCTION
Rationale and Overview
The petroleum-based economy has been playing a key role in the development of
countries. Since the Industrial Revolution, fossil fuels have leveraged the growth and progress of
nations, reaching a vital function in our energy-dependent society. Nevertheless, the uses of
fossil fuels have several disadvantages that have become strongly evident in the present. Global
warming, pollution, glacial melting, petroleum spills and gas leaks, contamination and health
problems are just few of the countless problems associated with burning petroleum, natural gas
and coal. Conversely, a promising area getting stronger is developing fuels, chemicals and
materials in a bio-sustainable way. The bioeconomy, a bio-based platform economy, is
enlightening the challenge but has a long way to go through before achieving its final goal of
replacing petroleum products and non-renewable energy sources.
Biomass has the potential to strongly contribute to the bioeconomy, supplying a myriad
of ingredients and energy alternatives, yet to be discovered. Biomass is abundant and can be
produced and harvested from crops, forest, animal wastes, etc. around the globe.
Biomass, as defined by Perlack et al. (2005) is “Any organic matter that is available on a
renewable or recurring basis, including agricultural crops and trees, wood and wood residues,
plants (including aquatic plants), grasses, animal manure, municipal residues, and other residue
materials.” And it is generally “produced in a sustainable manner from water and carbon dioxide
by photosynthesis.”

2
The challenge of biomass is to find an economically feasible assembly of every link in
the production process and to cost-effectively compete with petro-base products. The Achilles'
heel of this bio-based platform would be the association between the current enormous usage of
resources and the potentially available biomass, harvested using environmentally friendly
methods. Although lignocellulosic materials are very promising, the amounts needed, the means
to harvest and handle, the storage facilities, the low energy density, the water content, the
embedded lignin guard for fermentation, the recycling of nutrients back to the crop lands,
together with the competition for land and input for food crops and the environmental
considerations, all pose great challenges to the bioeconomy growth and development.
McKibben (2007) emphasized that environmental stewardship as well as economic
prosperity should be faced urgently. The author contends that climate change and global
warming are the biggest challenge that human beings are yet to face. Needless to say, the
anthropocentric increase of carbon dioxide is the main contributor to the problem, increasing at a
pace of 2 ppm per year. Before the industrial revolution, the Earth’s atmosphere retained 280
ppm and with the burning of fossil fuels in 1950 ramped up 35 ppm more, reaching 315 ppm and
currently being at 380 ppm, 100 ppm more from previous fossil fuel extended usage. In fact,
with the present adoption of technologies and lifestyle changes, the world could build to 450
ppm of CO2 in the atmosphere by 2050, set as the threshold of irreversible damage to ecosystem
and environment (McKibben, 2007). As a whole, humankind will witness the melting of glaciers
and perennial ice regions, changes in seasonal patterns’, pronounced droughts and floods, rising
sea levels, just to mention a few. The scale of the problem will need several strategies, like
3
substitution of fossil fuels, in order to reduce current emissions, to strongly embrace
conservation and to achieve carbon negative technologies. Such technologies, like biochar or
CO2 sequestration would entail CO2 burial in forms of solid or gas deposits that would prevent it
from returning back to the atmosphere.
Dissertation Organization
This dissertation contains a general introduction, literature review, followed by a paper.
The paper is presented in the required format for publishing in Transaction of the American
Society of Agricultural and Biological Engineers.
Objective
During storage, biomass feedstock encounters considerable material losses due to
microbial respiration. Therefore, studies should be directed to understand the causes of
deterioration to appropriately handle roughage biomasses on storage. The objective of the study
was to quantify corn cobs’ decay exposed to different storage conditions 10, 20 and 30ºC and
cobs moistures of 15, 25 and 35% w.b., by measuring the evolution of carbon dioxide over 21
days.
The hypothesis underlined was that the higher storage temperatures and moisture
contents increases the dry matter losses of biomass.

4
CHAPTER 2: LITERATURE REVIEW
Biomass, Cellulosic Potential
Only after times of scarcity and energy independence constraints, such as OPEC’s
embargo in 1967, the oil crisis in 1973, the rise in oil price in 2008, etc, is when we realize how
brittle and reliant on petroleum our society is, with the resulting interest in finding and exploring
alternative energy avenues. Many countries have taken the initiative to walk the path of
substitutes, and breaking the scheme of fossil energy’s monopoly. Bourne (2007) emphasized
that current replacement of conventional fuels by alternatives are small but highly promising. He
claims that at most 12 % of gasoline and 6 % of the diesel demand (as to that particular year)
could be supplied if all the corn and soybean cropped in the US was to be processed into
biofuels. However, the information only referred to conventional food crops that are now being
routed towards liquid fuels. But prospective technology breakthroughs could increase by many
fold the current biofuel production threshold. In this respect, biomass has been a leading
candidate as a substitute for liquid fuel transportation.
The National Renewable Laboratories in Golden, Colorado, estimate a maximum
conversion rate of corn crop residues of 113 gallons of ethanol per dry metric ton (NREL, 2007);
however, Reeder and Li (2010) estimate that feasible carbohydrate fermentation will yield
around 73 gal/dry ton. The Billion Ton Study presented by the U.S. Department of Agriculture
showed that the U.S could produce 1.3 billion tons of feedstock for bioethanol conversion,
reaching approximately 90 billion gallons of ethanol (Perlack et al., 2005). Thermochemical

5
processes could greatly overcome fermentation yields, but still, biomass conventional processed
could replace more than half of the transportation fuel currently burned each year.
Corn Cob Commercial Utilization
Corn cobs are an abundant source of thermal energy for producing heat, power, fuels and
many chemicals too (Kaliyan & Vance, 2008). Historically, corn cobs have been used for whole
array of different products, from small modifications of its original physical and chemical
properties to highly industrialized goods. For instance, The Andersons Inc. located in Indiana has
long processed cobs for many agrichemical and commercial applications such as abrasives,
absorbents, activated carbon, asphalt shingle and roofing, chemical waste absorbent, concrete
additive, feedstock for petrochemical industry (xylitol, furfural, oxalic acid), fermentation
substrates, fertilizer diluents, food fiber source, carriers for chemicals such as herbicide,
insecticide and pesticides, insulating materials, plastic extenders, and many more products
(Anderson Inc). Recently, studies are exploring the use of corn cob for its energy content mainly
for ethanol fermentation, co-firing and as a feedstock in thermochemical conversion
technologies, thus potentially broadening the demand and importance of this so called “farm
residue”.
Further work to refine specific systems of utilizing corn cobs would be of great benefit to
agriculture, finding markets and alternative uses of material for farmers’ profits. Economic
comparison between storage options and deterioration during storage will influence cobs value
and cost of storage. In energy systems, cob costs need to include dry matter loss and changes of
moisture content, whereas if the cobs are being stored for chemical production then mass loss but
6
even more important, compositional changes will be a factor determining cob storing and
handling.
Ethanol sector has rapidly grown in the last decade, reaching close to 11 billion gallons in
2009 (Renewable Fuel Association). Private and public sector are strongly supporting the
development of this renewable fuel as it has a number of advantages in terms of social, economic
and environmental aspects. Currently, ethanol is mainly produced from the corn kernel, but it is
envisioned to be also produced from lignocellulosic, such as corn stover, switchgrass, woody
biomass, etc. The new regulations proposed by Environmental Protection Agency establishes the
production of 36 billion gallon of renewable fuels, in which 16 billion gallons will come from
cellulosic biofuels, in which the cellulose fermentation pathway would be one of the major
contributors (EPA, 2009).
Decades ago, corn cobs have been used for drying seed and more recently as an energy
source. The seed industry and farmers tried to benefit from cobs barely used before and find a
new use for the material that could let them save money on drying operations (Dahlberg R.
1977). In the past, many cob burners and gasifiers were proposed to be used. The energy content
of corn cobs is around 18.4 MJ/kg (high heating value), comparable to other cellulosic materials
such as wood, and even cobs have 6% more energy than shelled corn and 11% more than
cornstalks (Dahlberg, 1977). He also claimed that from kernel with 35% moisture and 66%
efficient drier, there is enough energy in the cob to dry the corresponding kernels under average
corn-belt drying conditions. Many seed plants had implemented different types of burners, and
7
have successfully decreased drying expenses; however, problems in cob handling and burners
prevented the technology from being extensively adopted.
Main problems were focused on material handling, particulate matter emission (very fine
ash). Also, corrosion caused by water vapor in combination with sulfur and chlorides producing
acids, difficulties for temperature control, greater maintenance required than conventional natural
gas burners, and slag formation at high temperature (950ºC) where minerals components melt
and solidify as green glass-like substance. These problems highlighted by Dahlberg (1977)
which prevented cobs from replacing natural gas for seed companies in drier facilities.
Furthermore, natural gas could be easily hooked on and it is a relatively cheap source of energy.
Other problems associated with this types of seed dryers were tar material condensation
at low temperature (below 300ºC), which would plug pipes, fans, burners and valves.
Approaches to solving tar condensation were to burn the producer gas at high temperature before
it condense, use down-draft gasifiers in order to oxidize and burn tars, or cool down the gas to
condense the tar and burn the gas once it has been cleaned.
A latter more sophisticated approach to solve many of the problems with cobs burners
was the use of gasifiers or pyrolysis units to produce low energy gas (in comparison to methane).
If utilized within short distances, low BTU values for the gas wouldn’t be detrimental; but it is
still a problem that adds to the cost (heat content of 150 BTU/cu. ft vs. natural gas 1000 BTU/cu.
ft).
Morey et al. (1984) proposed that a farmer with 200 ha requires approximately 50 tons of
cobs to dry his corn with average yielding. Cob piles in farm drying operations are a feasible

8
alternative system to be used in the same season or, depending on the conditions, dried and
stored for later use.
Cobs: harvesting, transportation and processing
Although corn cobs are a potential feedstock for producing heat, power, fuels and
chemicals, pitfalls on harvesting, transporting and processing have to be thought for establishing
profitable commercial channels for its use (Kaliyan & Vance, 2008; Morey et al., 1984; Foley et
al., 1978). Improvements for harvesting the residues have to be rapidly addressed so that the
material could be more efficiently harvested with less passes, and by removing the least amounts
of nutrients as to maintain soil long term productivity (Johnson et al., 2010). Densification of
corn cobs into briquettes/pellets has being proposed for improving their bulk density and its
viability for handling, transportation, and storage (Kaliyan & Vance Morey, 2008).
With the existing commercial harvesters, only kernels are saved while stover and cobs are
left on the field. Several modifications to existing corn harvesting systems have been suggested
to collect either cobs or stover and cobs in a single pass concurrent to the grain harvest. Smith et
al. (1985) emphasize that corn cobs are the densest fraction of corn’s residues, are also harvested
with the kernels making them easier to collect and redirect, so less modifications need be
implemented into the harvesters.
In terms of availability, nearly 15-20% (d.b.) of above ground corn residues (non-grain)
are corn cobs (Pordecimo et al., 2005; Kaliyan & Vance, 2008). Although, at harvest, the driest
fraction of the corn’s residue is the cobs, the moisture content may range from 20 to 55% (w.b.)
depending on the grain moisture content at the time of harvest (Morey and Thimsen, 1980). The

9
harvest window for the Midwest is generally limited from October to November. Therefore,
gathering locations, centralized or distributed, will be needed to store cobs if they are to be
processed year-around (Smith et al., 1985). From a broader perspective, current sizes of
commercial cobs’ piles are around 1,000 to 50,000 Mg (Anderson Inc.). Still, if cellulosic
ethanol plants utilizing corn cobs are to be scaled up to 2,000 Mg/day (330 days operation x
2,000 Mg/day) that would imply provisioning of 660,000 Mg. Theoretically, this is equivalent to
a 50 million gallons per year ethanol plant that is roughly half the size of a current typical dry
grind ethanol facility. Considering that this material has a low density of 0.16-0.21 g/cm3
(Dunning et al., 1948), it will demand 4.0 x10⁶ m³ to contain such an amount, equivalent to a
prism of one hectare base and 400m high. It seems appropriate to think that outside storage, or
with little cover, is likely to happen at first.
If driven by economies of scale, biorefineries will need to economically compete with
petrochemical distilleries. Each refinery will need to have at least 4.7 to 7.8 million Mg of
biomass capacity annually (Wright and Brown, 2007). This will undoubtedly challenge the
whole production chain from handling, transportation and storage operations. Problems related
to handling, dry matter and quality loss due to weathering and microbial deterioration are likely
to grow if they are not correctly addressed. In addition, since corn stover is only harvested for a
short period each year, long-term storage is required to provide supplies year-round to the
biorefineries distributed in one or multiple locations but reasonably close to the facility.

10
Biomass long-term storage
According the Billion Ton study (Perlack et al., 2005), agricultural land would be able to
supply almost one billion tons of dry biomass, where the greater portion of readily available
biomass (450 million tons) would come from crop residues, such as corn cobs and stover, wheat,
soybean and small grain straw. Needless to say, it is not just a matter of producing the biomass
but harvesting, collecting, transporting and effectively storing it. The last aspect is explored in
this study, researching decomposition under aerobic respiration of corn cobs.
Several studies indicate that numerous roughages under certain conditions encounter
large amounts of decomposition, aggravated over long periods of stacking. In addition, quality
and physical property changes are likely to occur and limit the final utilization of the biomass.
Blunk et al. (2003) claimed that annual crop harvests pose important challenges on long-term
storage if the material is to be available throughout the year. Studying deterioration in rice straw
during long-term storage, they found that the material’s final quality was strongly dependent on
the storage conditions and length of storage. Major factors influencing the storage quality of
baled rice straw were related to weathering and biochemical degradation. Therefore, tarps,
permanent covers and protected storage would greatly impact the final product over 12 months
of sheltering. Water gain, leaching, ultraviolet degradation, material erosion and microbial
degradation have profound impact on the amount and final characteristic of stored straw rice
bales. Bales exposed at the top of uncovered stacks suffered large losses of organic matter,
substantial reduction in heating value, volatile matter, fixed carbon, and related properties.
Losses in lower bales were not that important, neither side bales, but still there will be different

11
grades of decay within regions. Different regions of a stuck encounters different property
changes but exposed surfaces to weathering resulted in high organic matter losses of 40% or
more (Blunk et al., 2003).
Lignocellulosic materials were found to have comparable relation with high moisture and
dry matter loss. Nelson et al. (1983) found that baled ryegrass initially stored at 18% moisture
(w.b.) lost 27.6% of dry matter (DM) through decomposition and 15% due to handling losses
after 7 months, while losing 39.8% and 12.4% respectively after 12 months study. Also, plastic
covers and racks stands with covers around the bales reduced dramatically the moisture and the
DM losses. What seems to be clear is that moisture contents within piled material strongly
influences microbial rates of degradation. White et al. (1983) reported 84%, 108% and 190%
increase in average moisture content of chips, bark and sawdust piles, respectively after one year.
Similar conclusions on deterioration gradients were drawn from Smith et al. (1985) as
well as important information provided on different initial material moisture contents and the
progressive decay on corn cobs, from small farm scale and commercial piles. In this study,
microbial respiration and auto-oxidation were identified as the main sources of degradation.
Outside piles of corn cobs in the Midwest showed a rise in moisture content during
storage (Dunning et al. 1948; Smith et al., 1985). The latter author reported different moisture
increases over different pile zones. In surrounding layer of about 0.9 m, moisture increased from
12-18% to 40-80%, whereas the interior reached 33% after 24 months time frame. It appears to

12
be clear that not only the materials initial moisture but also the weathering and deterioration
processes are responsible for pile’s moisture increase.
Moisture also has been cited to have a direct relationship with temperature increase. Self
heating was observed on rice straw stacks with more than 20% moisture content, and those with
40-50% moisture had maximum temperatures of approximately 65ºC within 4 days (Dobie and
Haq, 1980). Likewise, Blunk et al. (2003) observed self heating over the first few weeks of
storage of rice straw where moisture higher than 12% exhibited increases of 10 to 40ºC over
ambient air, plus additional heating following rains. Nonetheless, indoor bales initially
experienced some heating, but later followed the ambient temperature. Increases of water from
rainfall also result in rising temperatures and losses bales in storage on quantity and quality,
influencing overall utilization (Blunk et al., 2003).
Another less important moisture gain was the upward migration from the ground and
condensation under surface cover. The potential decay of some materials under favorable
conditions is clearly visible. Hence, it would be essential to have an overall understanding of the
process of deterioration, taking into account the changes produced throughout the storage, which
parameters are important to track, on what range they have significant effect and how.
Small stack storage experiments suggest that open stacks, pole barns, and fully enclosed
metal barns should cost between $4- 7 /ton (Blunk et al. 2003). On the other hand, open stacks
will incur higher overall quality losses that could significantly impact the posterior usage and
13
later costs of processing. In addition to the higher chances of spontaneous combustion that could
occur from the combination of moisture and self-heating of the material.
Corn Cob Characterization
Chemical composition
Cobs are classified as a lignocellulosic material, mainly composed of cellulose,
hemicellulose and lignin. Lignin is the most stable component of biomass, followed by cellulose
and hemicellulose (Dunning et al., 1948; Smith et al., 1985). The carbohydrates (cellulose and
hemicellulose) are tightly bound to the lignin fraction posing important challenges for ethanol
fermentation and possibly for deterioration too.
The cellulose is an organic compound consisting of several hundred of glucose units with
β (1-4) linkage. Unlike cellulose, hemicellulose consists on several hundred of different
monomers, not just glucose, with different linkage too. Lignin is a complex chemical and is an
integral part of secondary cell walls, filling spaces of the fibers conferring mechanical strength to
the plant.
Foley et al. (1978) reported contents of 45.6% cellulose, 39.8% hemicelluloses and 6.7
lignin (on a dry base), whereas the pentosan comprises 38% of the hemicelluloses, and xylan 87
% of the pentosan fraction. Clark and Lathrop (1953) found mean values of 32.3% cellulose,
41.3% pentosan and 13.9% lignin, on average for 31 hybrids of corn.

14
Ultimate analysis
Ultimate analysis performed by Clark and Lathrop (1953) showed carbon content of
48.4%, hydrogen 5.6%, nitrogen 0.3%, ash 1.4% and oxygen (calculated by difference) 44.3%,
on a moisture free basis. Similar values were reported by Brown (2003), where the elemental
composition was: carbon 46.58%, hydrogen 5.87 %, oxygen 45.46%, nitrogen 0.47% and 1.4%
ash.
Energy content and available energy
Several parameters have being established to define the biomass energy content’s
depending on its application. The most common are:
GHC (gross heat of combustion) is the energy released by heat when a material is
combusted in presence of oxygen under standard conditions. Also accounting for the
energy released as the water vapors condense.
NHC (net heat of combustion) is the energy released by heat when a material is combusted
in presence of oxygen without condensing the water vapors, therefore, not accounting for
the energy present in the water vapor phase.
EA (energy available) is the energy released by heat when a material is combusted in the
presence of oxygen, not accounting for the energy present in form of water vapor neither
the energy needed to evaporate the water already present in the biomass (previous
parameters refers to dry biomass).
15
The gross heat of combustion (GHC) was reported to be 18.25 and 19.18 MJ/kg (Clark
and Lathrop, 1953). Foley (1978) reported values of 18.52-18.78 MJ/kg and corn residues 18.72
MJ/kg Net heat of combustion (NHC). Smith et al. (1985) stated:
NHC = GHC–L (Hx0.09)
Where the L is the latent heat of vaporization of water and H is the percentage of total hydrogen
(ASTM 1979). In general, corn cobs will contain about 6% of hydrogen, reported NHC=0.93 x
GHC resulting in NHC for dry cobs around 17.34 MJ/Kg.
Although it is important to establish the energy that could be harvested from the complete
combustion with air of cobs, the energy available (EA) could be on practice more important. The
moisture content (water contained in the biomass) would play an important role in determining
the energy that could be effectively used as part of it is used to evaporate the free water in the
biomass, hence the importance to handle dry materials.
Smith et al. (1985) also calculated EA as:
EA= (NHCxB)-(LxM)
Where Energy Available (in MJ) is the result of the NHC (in MJ/dry kg), B is the total
dry mass of material in the zone, L is the latent heat of vaporization of free water (MJ/kg) and M
the total mass of moisture within the material B (in kg).

16
The gross heat of combustion is determined with Parr Adiabatic Calorimeter, ASTM
1979 standard procedures. A calorimeter consists of a metal container filed with water with a
thermometer attached to measure the heat capacity of a substance after combustion.
Knowing the composition (chemical fraction) of the cobs could give a close
approximation of the GHC. The hemicellulose and cellulose fraction contains around 17.5 MJ/kg
and the lignin 26.7 MJ/kg (Shafizadeh & Degroot 1976). Therefore, knowing the constituents
can be used to approximately determine the GHC. What can be easily seen is whether
carbohydrates increase in proportion to lignin, or ash increase in proportion to other fractions, it
will lessen the energy content of cobs. That was the reason stated by Smith et al. (1985), in
which the gross heat of combustion slightly increased for deteriorated layers of cobs in contrast
to the original energy content of the material, as the ratio of lignin increased over carbohydrates.
Similarly, the gross heat of combustion per dry kg increased in the wet and surface layers, in
commercial and farm piles. But if the GHC is based on the original mass of cobs, the outside
storage of high moisture corn cobs could result in significant losses of the energy available as the
material is consumed (primarily the carbohydrate fraction) and water is also gained. Smith et al.
(1985) reported drops of up to 33% of the energy available in cobs under severely weathered
piles. The energy loss on outside storage with partially drying with ambient air, (the pile still
being weathered) was reduced to about 20%, yet a considerable loss.
As it has been mentioned above, the use of decentralized outdoor storage facilities would
be challenging; because reducing the size of the pile would increase the proportion to potentially
decay from weathering effects. In this regards, Smith et al. (1985) suggested that outside stored

17
small piles are not practical in the Midwest without losing a large proportion of the energy
available.
Cob Storage and Deterioration
Pile regions and deterioration
Several researchers have shown marked differences between regions with cob piles, with
regard to the final chemical composition and deterioration. Mainly, two layers have been
classified, the exterior layer and the inside of a pile (Blunk et al. 2003). Sometimes a third layer
is defined as the outside crust of the surface layer of the wet exterior. For a large pile study,
Smith et al. (1985) identified three zones. The surface layer wet zone (up to 0.2 m from the
surface) with 50 to 80% moisture w.b, an intermediate zone from 0.3 to 0.9 m and an interior
established more than 1.5m depth, identified by visual observation. The surface layer suffers
from externalities such as rain, snow, sunlight, wind, etc., resulting in higher moisture content
and greater degradation. The intermediate zone will be a transition and will have in-between
conditions. The interior of the pile will have properties that will better match the original
conditions of the biomass, influenced somewhat by degradation, but clearly not experiencing as
much weathering effects. Therefore, on large piles most of the material will be on the interior
and will greatly respond to conditions of initial storage, whereas in small piles the outside layer
will comprise a greater portion and, consequently, the weathering effects on the pile. Tracking
the layers’ conditions will become important to predict precise deterioration on large piles.

18
Large piles studies
Most deterioration studies of biological materials are done in vitro or with small piles of
material (Chitrakar et al., 2006; Bern et al., 2002; White, 2007; Moog et al., 2008). However,
some researchers have been implementing larger storage of biomass (Smith et al., 1985; Blunk et
al., 2003; Buggelnl and Rynk, 2002; Collins et al., 1997; Hogland et al., 1996). For example,
Smith et al. (1985) used nylon mash bags with cobs placed in a large commercial pile as it was
being formed. In 18 months of storage, the author indicated similar layer structure to the
analogous study on a farm pile, but the interior portion compromised the largest share of the total
mass. Originally, the moisture was 9-12% w.b. but increased to 12-17%. The dry matter loss
from the interior zones of the large piles through direct measure of mash bags dry matter loss
was not significant. On the other hand, the wet surface layer and the middle layer were similar in
structure to the small piles with moisture contents of 70 % and 31%, respectively. For the two
wetter regions, the dry mass loss (determined from bulk density test) had an average of 28% in
the wet layer and 21% in the subsequent layer. The wet and surface layers comprised about 26%
of the total mass of the large commercial piles as opposed to 45% farm scale piles on the parallel
study. Further losses also occur along the base of the biomass piles directly on the ground. The
dry matter loss losses due to degradation within the base of the pile in contact to the ground will
be similar to the losses in the wet and surface layers (Blunk et al., 2003). Nonetheless, the major
ground losses occur in handling the cobs, when mixing with soil can cause unwanted
contamination and complication on further processing. Therefore, it is inevitable to have
substantial leftovers, i.e. cobs that cannot be utilized.

19
The greatest losses of energy content occurred within the wet layer, which are between
the surface and 0.9m depth in the small piles. The wet layer is increasingly important in small
piles, therefore, piling up the cobs as high as possible will decrease the portion of this layer
compared to the total amount stored, thus reducing the great losses that occurs within this zone.
Safety considerations should be taken when piling up too high large amounts as it can collapse or
slide down when removing material from the base.
On the whole, in outside storage, important quantity and quality losses occurred when
moisture contents were above 20%. The moisture resulted from the materials initial moist plus
the water gained throughout storing time. As a matter of fact, dry matter loss and composition
changes resulted in losses of 43% of the available pentosan (used for chemicals and product
synthesis) from the wet layers after 18 months of storage (Smith et al., 1985). But the interior
layer cobs did not deteriorate significantly if they were dried below 12% before storage.
Focusing on energy production for drying seeds, Smith et al. (1985), states that small
piles outside are not practical for the Midwest due to remaining energy available and dry matter
losses. Other concern is the health hazard associated with handling the moldy material and
potential produced mycotoxins through spoiled material.
Corn cobs are a rich source of energy and chemical feedstock, yet economic evaluation
between storage costs and handling opportunities (drying, covering, etc) as well as deterioration
during storage, will be necessary to determine whether or not is practical and economically
feasible to store cobs and use them for energy and products. In energy platforms

20
(thermochemical or biological fermentation) might not be as stringent as chemical platform
especially to those associated with the hemicelluloses and cellulose transformation which have
shown to be highly degradable. For farm use of burners and gasification technologies, tracking
dry matter loss is as important as moisture gains and losses of available energy.
Cob harvest moisture variation
Two main corn cob streams are commercially found today differing in origins and
management. One comes from the collection of corn ears for the production of hybrid seeds,
where parental lines are crossed for the production of corn hybrid seed. The second, and
increasingly important, is the collection of cobs from commercial corn production. The two types
of cobs differ mainly in that for seed production, the ears are harvested at high moisture but are
taken to the facility for post-harvest drying, thus thoroughly drying the kernel and cobs.
On the other hand, in the collection of cobs from the commercial corn production, besides
including different genotypes that may vary in composition, the main difference is a wide range
of water content depending on the time in which they are harvested. The harvest time is mainly
driven by kernel moisture, which is typically harvested below 30% moisture for the Corn Belt
(Pordesimo et al., 2005). In other words, if cobs are collected from corn lines for the production
of hybrid seed, the moisture is typically 10-12% moisture (cobs and kernel dried together in the
facility and later shelled). However, when the cobs are coming from commercial crops, the
moisture can be determined by the harvesting time of the kernel, in which its moisture will be
related to the moisture of the kernels. Indeed, large collection of cobs from commercial grain

21
fields will imply higher moistures in comparison to cobs from lines ranging from 20 to 55% w.b.
(Kaliyan & Vance, 2008).
The moisture correlation between the cob and the kernel has being addressed by many
authors (e.g., Pordesimo et al., 2005). Therefore, wetter kernel harvest due to environmental
conditions or farmer decision will entail higher cobs’ moisture. Thus it will encourage microbe’s
growth and material degradation if it is not handled correctly.
Moisture increase with storage
Besides the original moisture in which cobs are stored there is strong evidence indicating
that moisture content inside and outside located piles in the Midwest were found to increase
during storage e.g. 36 months of storage study carried on by Dunning et al. (1948). Also, after
one year storage, sawdust piles slightly increased the interior moisture but more prominent the
surface of the pile became highly saturated (White et al., 1983). Also Smith et al. (1985) noted
that moisture increased differently depending on the layer of the pile as initially stored at 12-
18%. After 24 months, in large piles the outer 0.9m was 40 to 80% while interior reached 33%.
Besides weathering factors such as rainfall, snow, high relative humidity days, etc., the water
produced during respiration process would result into raise of water within the material. From an
hypothetical degradation of 10g of cellobiose per 100g of original DM (approximately 10%
degradation), would result in 5.56g of additional water to the material having double effect on
moisture content, firstly increasing the water content on the material and also reducing the
proportion of dry matter. It should also be important to highlight the potential positive feedback

22
that greater moisture could generate greater deterioration and, consequently, this deterioration
will potentially increase the moisture too. It has being cited that moisture gains also promotes
increases in temperature as a result of oxidation or fermentation (depending if the conditions are
aerobic or anaerobic) also leveraging microbial respiration between certain temperature range.
This heat produced could eventually be accumulated to the point of reaching uncontrollable
temperatures were spontaneous combustion could occur.
Pile temperature
Temperature in the stored material is another important factor to be considered for a safe
and durable storage. Blunk et al. (2003) study over rice straw observed self heating over the first
few weeks of storage with moistures higher than 12%. Self heating exhibited increases of 10 to
40ºC over ambient air closely related with initial moisture. Nevertheless, the main rise in
temperature was observed right after the material was stored, but secondly important determining
the temperature rise, were rainfall events. Obviously, indoor storage of straw observed
temperature increase only during the first days of storage. Overall, temperature is an important
factor in determining chemical reaction and microbial growth rates. Therefore, it should be
considered and safely managed for good preservation.
On the other hand, temperature rise pose a potential benefit for self drying, as manifested
by Smith et al. (1985). Where a fan coupled with a thermostat automatically switched on when
the temperature exceeded 24ºC and turned off when reached 19ºC, finding the internal heat of the
pile useful to assist in drying. Another experiment was performed with a pile of approximately

23
18 tons where a fan blew for 6.5 h/day and the pile temperatures followed the average ambient
air warmth closely. Still, there are some challenges identified in this experiment where
unventilated zones near the base of the pile isolated by layers of husk material were heavily
molded. Also, the initial and final moisture of this base portion of the pile was almost the same,
not having a relevant drying.
Spontaneous combustion
Spontaneous combustion (SP) is defined as sudden firing of the material in the absence of
"forced ignition", such as spark or flame. It is defined as a series of chemical and physical events
that initiate heat producing reaction via biotic and abiotic processes involving oxygen and some
water. (Hogland et al.,1996).
Each year spontaneous combustion causes great losses of material and safety hazards in
Virginia and throughout US (Cundiff & Marsh, 1996). Organic material such as corn stover, hay
stacks, baled straws, nuts, hulls, linseed, etc., with adequate conditions is prone to self combust
(Pordesimo et al., 2005; Blunk et al., 2003).
Not only corn stover but also cobs themselves can self ignite. On 27th
of December 2008
in Anderson’s grain facility (near Delphi, Indiana) a corn cob pile of 17,000 tons suddenly
caught fire. It started deep in the pile and the fire traveled upward through the pile. Also in 1989
the company had another fire with a 35,000 tons pile where again instantaneous combustion was
responsible (in press December 27th
2008, www.Pharostribune.com)
24
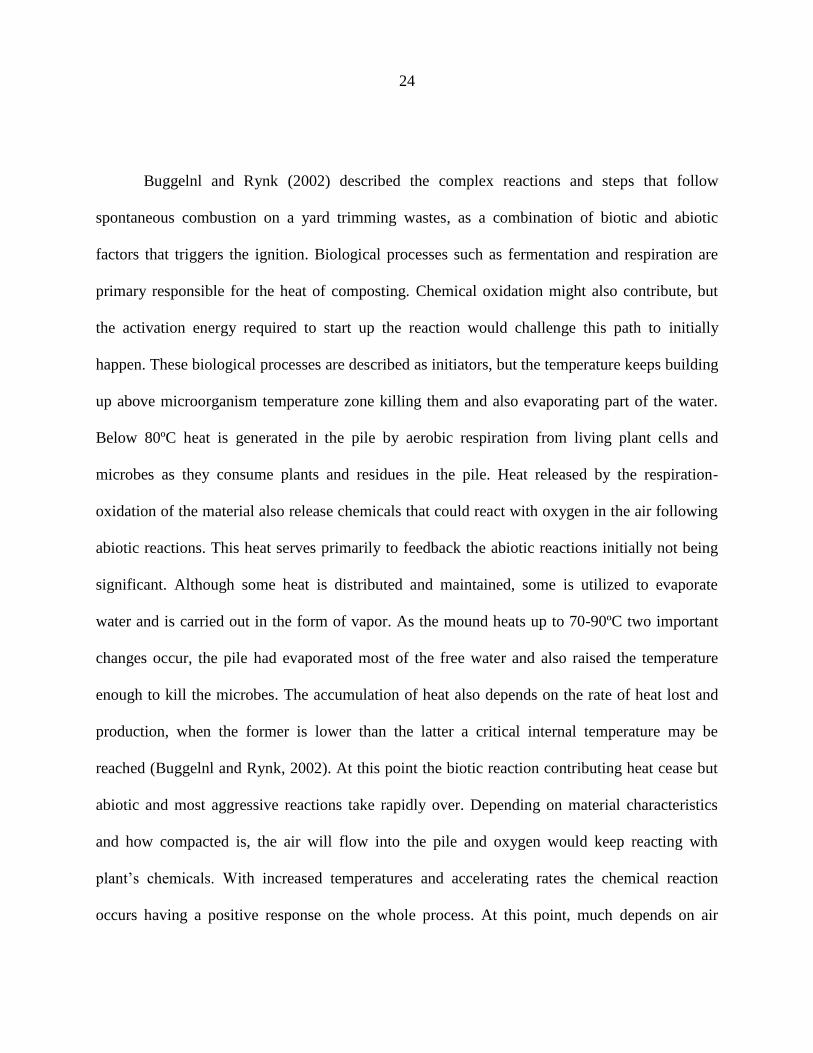
Buggelnl and Rynk (2002) described the complex reactions and steps that follow
spontaneous combustion on a yard trimming wastes, as a combination of biotic and abiotic
factors that triggers the ignition. Biological processes such as fermentation and respiration are
primary responsible for the heat of composting. Chemical oxidation might also contribute, but
the activation energy required to start up the reaction would challenge this path to initially
happen. These biological processes are described as initiators, but the temperature keeps building
up above microorganism temperature zone killing them and also evaporating part of the water.
Below 80ºC heat is generated in the pile by aerobic respiration from living plant cells and
microbes as they consume plants and residues in the pile. Heat released by the respiration-
oxidation of the material also release chemicals that could react with oxygen in the air following
abiotic reactions. This heat serves primarily to feedback the abiotic reactions initially not being
significant. Although some heat is distributed and maintained, some is utilized to evaporate
water and is carried out in the form of vapor. As the mound heats up to 70-90ºC two important
changes occur, the pile had evaporated most of the free water and also raised the temperature
enough to kill the microbes. The accumulation of heat also depends on the rate of heat lost and
production, when the former is lower than the latter a critical internal temperature may be
reached (Buggelnl and Rynk, 2002). At this point the biotic reaction contributing heat cease but
abiotic and most aggressive reactions take rapidly over. Depending on material characteristics
and how compacted is, the air will flow into the pile and oxygen would keep reacting with
plant’s chemicals. With increased temperatures and accelerating rates the chemical reaction
occurs having a positive response on the whole process. At this point, much depends on air

25
movement and oxygen concentrations (consumed by the oxidation but supplied by the incoming
airstream) but if the temperature keeps increasing eventually will catch fire, thus spontaneously
combust. The activation energy required for direct chemical oxidation of glucose in air is much
higher than undergoing biochemical oxidation by microbial enzymatic reactions but when the
chemical reaction happens the rate of reaction accelerate much faster.
Different materials vary in compositions that could facilitate abiotic oxidation like, oils
and resins, within the lower temperature regime, for example coniferous materials will contain
more resin and linseed more oil. Availability of oxygen can determine where the process
eventually goes, and carbon dioxide produced dissolved in water will form weak acids that can
further accelerate the decomposition of complex molecules into more reactive acidic organic
compounds (Buggelnl & Rynk, 2002).
Woodward (2004) stated that wet hay is more likely to lead to a spontaneous combustion
than dry hay does if it gets higher than 22 percent moisture. Also, hay helps to insulate, so the
larger the haystack the less chances to cool the pile and offset the heat. Internal temperature of
55ºC leads to chemical reactions producing flammable gases that can potentially ignite if the
temperature goes high enough. Temperature will rise within a stack and then declines to a safe
level in 15 to 60 days, depending on bale, density, ambient temperature, humidity, and rainfall.
However, when spontaneous combustion occurs, it does not originate in the center of the round
bale, but nearer the outside, because oxygen levels in the middle of the bale are usually too low
for combustion to occur (Collins et al., 1997). On waste management piles, Hogland, et al.,
(1996) also claimed that oxygen content decreases to almost zero in the lower parts of the storage

26
pile but after several months of high but stable temperature conditions, self-ignition occurred in
storaged piles. Nevertheless, waste management materials have a very different chemical
composition and prevailing reactions.
Changes in chemical composition
During storage, Dunning et al. (1948) quoted that on a 24 months outside storage,
cellulose and hemicellulose were the ones that mostly decreased. In depth of 0.6m, it decreased
from 38.6 to 30% cellulose and Pentosan from 33.9 to 24.7%. However, these components did
not change when cobs were air dried and stored inside. Pentosan content decreased more than
cellulose content during storage, Smith et al., (1985) showing the highest loss of 21% from wet
layer samples of large piles after 18 months storage, while cellulose decrease were 11% lower
than control. Decrease in cellulose and pentosan content resulted in higher proportion of lignin
(mostly) and ashes, hence resulted in an increase of heat of combustion (on a dry base).
These carbohydrates were particularly reduced in the wet layers where weathering and
microbes could have greater chances to grow. Important considerations must be taken in regards
to quantity and quality during outside storage when moisture contents are above 20% (Smith et
al. 1985). The combined effects of mass loss and composition change resulted in losses of 43%
of the available Pentosan (main component of the hemicelluloses fraction) while cellulose had
11% less than the control in the wet layers after 18 months of storage. The interior layer of cobs
was dried below 12% before stored, not being significantly deteriorated. All studies point out the
importance of moisture associated with deterioration, whether is weathering the cause of water
gain or high initial moisture content. If the material is being stored for chemical production or to

27
be fermented, where it is specifically interested in these carbohydrates, outside storage for long
periods of time might not be the best solution. On the other hand, if the material is to be burned
or pyrolyzed might not be such a detrimental problem besides the loss of material and energy.
Certainly, gains of moisture will consume greater fraction of the heat released thus having less
energy available as a whole. Nevertheless, the gross heat of combustion increases with
deterioration of cobs, on a dry basis, due to increased proportion of lignin that has less oxygen
content and more energy density for thermochemical processes than the carbohydrates. Outside
storage for farm scale piles (Smith et al., 1985) resulted in losses of up to 33% of the available
energy in high material moisture due to dry matter loss and water gains within the pile. In
contrast, the energy loss was reduced to about 20% for the interior of the pile when it was dried
with ambient air.
Shelled Corn Storage Time and Previous Respirometer Studies
Direct measurement of dry matter loss
The development of objective methods to precisely quantify dry matter loss will have a
key role for understanding deteriorations, favorable conditions and tools to remediate/diminish
losses. Directly quantifying material losses poses great challenges, such as measuring weight
losses in which moisture variation within the materials and the methods used to quantify may
have substantial disparity when trying to account small percentage of weight changes. Also, the
need to oven dry and destroy the sample so as to directly measure moisture content and dry
matter have an obvious impediment for consecutive measurement of the sample over time. The
28
overall sample requirements to overcome variability of the measuring procedures make direct
measures of DM loss difficult to achieve.
Indirect measurement
Indirect measures of dry matter are found to be useful in most cases. CO2 evolution has
been used in many agricultural and environmental studies due to its biological role in living
organism. For instance, tracking CO2 emissions from the material being stored has been
proposed as a correlation method to estimate material losses during storage (Wilcke et al., 2001;
Chitrakar et al., 2006; Friday et al., 1989; Bern et al., 2002; White S., 2007) . Therefore,
equations have been established to predict CO2 production from the respiration of corn samples
with varying moisture, temperature, and mechanical damage (Bern et al., 2002) with the aim of
establishing storage time remaining before deterioration becomes significant (reducing by one
USDA grade) . The assumption underlined is that dry matter loss of 1% will represent 14.66g of
CO2 released, so by tracking carbon dioxide emitted, the dry matter consumed by microbes,
respired by the seed and chemically oxidized could be back calculated.
Various techniques have been used to measure carbon dioxide release. Frequently,
reacting the CO2 from the air and sequestrating it into hydroxides (such as NaOH or KOH), or
measuring the CO2 in the air by analytical methods (such as gas chromatography and infra-red
analysis). Alternatively, another indirect method has been successfully implemented for rapidly
measuring this gas, Solvita gel, which is used to evaluate CO2 respiration, from soil, compost or
grain in an efficient and cost-effective manner (Haney et al., 2008; Chitrakar et al., 2006).
29
Solvita gel technology is different from alkali traps in the sense that it does not absorb all the
CO2 but a portion of it. This pH-sensitive gel (paddle) changes color as it absorbs CO2 and after
certain time allotted the paddle is removed from the incubation chamber to be analyzed with a
digital color reader. Haney et al. (2008) compared solvita gel with chemical titration and Infra-
red gas analyzer for measuring soil respiration, and found that Solvita number had good
correlation with the other two traditional methods. However, it could have small interference
from volatile fatty acids which form a positive response with CO2 gel, also has to be prior
calibrated and it is influenced by the chamber volume. Another big disadvantage is that the
paddles have better response at room temperatures between 20°C and 25°C (Woods End
Research, 2002) thus limiting the range of its uses.
Another indirect measure that doesn’t involve carbon dioxide would be the correlate
decomposition of the biomass with acid- insoluble ash. This fraction should remain relatively
constant, on a weight basis, before and after storage. Therefore, the changes in the proportion of
the rest of the fractions in comparison to the acid insoluble ashes could be associated with the
decomposition. Still, Blunk et al. (2003) found high level of uncertainty in samples with the acid
insoluble ashes (big variation and inconsistent results) and bias in the overall deterioration.

30
CHAPTER 3: CORNCOB DRY MATTER LOSS IN STORAGE AS AFFECTED BY
TEMPERATURE AND MOISTURE CONTENT.
A paper to be submitted to the Transactions of the ASABE
B. del Campo, T. J. Brumm, C. J. Bern and C.G. Nyendu,
Bernardo G. del Campo, ASABE Member, Graduate Student, and Che G. Nyendu,
ASABE Member, Department of Agricultural and Biosystem Engineering, Iowa State
University, Ames, Iowa, USA. Corresponding author: Thomas J. Brumm, 102 Davidson Hall
Ames Iowa 50011; phone: 515-294-5145; fax: 515-294-1123; e-mail: [email protected].
Abstract. Agricultural residues, like corn cobs, are one of the first promising cellulosic
materials to be fermented and thermochemically processed into fuel in the emerging bio-based
economy. Few studies have been conducted on the deterioration of cellulosic feedstock in
storage. This study measured the loss of corn cob dry matter, as measured by carbon dioxide
evolution, under various storage conditions (temperature and moisture content) for 21 days.
High moisture content and temperature conditions (35% w.b. and 30ºC) resulted in almost 3 %
dry matter loss in 21days, as opposed to negligible losses at drier conditions (15% w.b.). There
was a significant interaction between the effects of moisture content and temperature on dry
matter loss. These data provide a first approach on understanding the material loss due to
microbial activity, thus helping to identify storage strategies to maximize the conservation of
cellulosic feedstock.
Keywords: Corn cobs, deterioration, cellulosic feedstock.

31
The second generation of biofuels will be derived from residues generated mainly by
agricultural and forestry endeavors (Arvelakis and Koukios, 2002; Blunk et al., 2003; Johnson et
al., 2010; Perlack et al., 2005). Agro-residues have the advantage of being renewable and with
the potential of being converted into heat, power and fuels on a decentralized platform
(Arvelakis and Koukios, 2002; Kaliyan et al., 2008; Latif and Rajoka, 2001; Ioannidou et al.,
2009; Shinners et al., 2003). Corn cobs and corn stover are some of the first lignocellulosic
agricultural materials to be fermented into alcohols and thermochemically transformed. While
many studies target the improvement in production, transportation, densification and utilization
of this type of biomass (e.g., Shinners et al. 2003; Kaliyan and Vance, 2008; Wilcke et al., 2001),
few articles have been published on what happens during storage of these materials between
harvest and processing.
Smith et al. (1985) reported a decrease in corn cob’s cellulose and hemicellulose during
outside storage increasing the concentration of the lignin fraction over time. As a result of
deterioration, intermediate organic compounds were produced and little is known regarding their
quantity and impact on the overall fermentation process. Olsson and Hahn-Hagerdal (1996)
published compelling information regarding inhibitors that could be co-produced, their influence
on microorganisms, and their effect on ethanol fermentation.
Many authors (Chitrakar et al., 2006; Bern et al., 2002; White 2007; Wilcke et al., 2001;
Moog et al., 2008) quantified corn kernel deterioration due to fungal growth with different
conditions of moisture, temperature, mechanical damage, genetic hybrid resistance, ozone
32
treatments and fungicide treatments. Nevertheless, little is known about handling and
appropriately storing cellulosic biomass for biofuels production.
Considerable dry matter loss in biomass feedstock during storage is possible due to
microbial activity (Blunk et al., 2003; Smith et al., 1985; Hogland et al., 1996; Huhnke, 2003;
Collins et al., 1997). Objective data on dry matter loss in such feedstock are necessary to develop
storage recommendations and practices. However, quantifying losses directly is difficult due to
such things as difficulties measuring small changes in weight losses and moisture, the need to
destroy the samples to directly measure dry matter, the difficulty of consecutive measurements
over time, and the sample quantity requirements to overcome variability of the measuring
procedures.
The deterioration of corn kernel dry matter has been modeled by Saul and Steele (1966)
as the complete oxidation of glucose under aerobic conditions. In corn cobs, the sugars oxidized
would come from the cellulosic and hemicellulosic portion of the biomass containing glucose
and pentose. Oxidation of glucose with β 1-4 linkages in large chains of cellulose would be as
follows (Haug, 1993):
C6H10O5 + 6O2 6CO2 + 5H2O
The objective of this study was to quantify the loss of corn cob dry matter (as measured
by carbon dioxide evolution) in storage under different temperatures and moisture contents. For
this study, 21 days was chosen based on previous trials where significant dry matter loss was
achieved with high moisture cobs, exceeding the apparatus scale.

33
Materials and Methods
Sample Material
Corncobs were harvested from an 111 day hybrid on October 26th
2009 from a field near
Ames, Iowa. A modified John Deere 9860 combine separated cobs from the grain and stover.
The cobs were harvested at approximately 26% moisture w.b. and stored in polyethylene plastic
bags (three bags to prevent moisture exchange with the environment) in a cold room at 4˚C until
needed for the experiment. Foreign material and remaining stover were removed from the
samples by hand separation once the cobs were taken from storage.
Prior to testing all cob moistures were determined using a hot air oven for 24 hours and
103C (ASABE Standards, 2003).
The moisture content of the corn cobs were adjusted, as necessary, to obtain desired
levels for the experiment (15, 25 and 35% w.b.). If the moisture level had to be increased, the
samples were sprayed with a calculated amount of distilled water necessary to reach the desired
MC and then stored at 4˚C for 48 hours to allow the moisture to equilibrate within the material.
If samples needed to be dried, they were left in open air at ambient conditions, occasionally
weighed until the desired MC (weight) was achieved, usually few hours. Immediately before the
experiment was performed, sample MC was re-determined.
Experimental Apparatus
Three temperature-controlled chambers were used (model I-35LLVL Incubator, Percival
Scientific, Inc., Boone, Iowa) and set to one of the treatment temperatures (10, 20 and 30ºC),
34
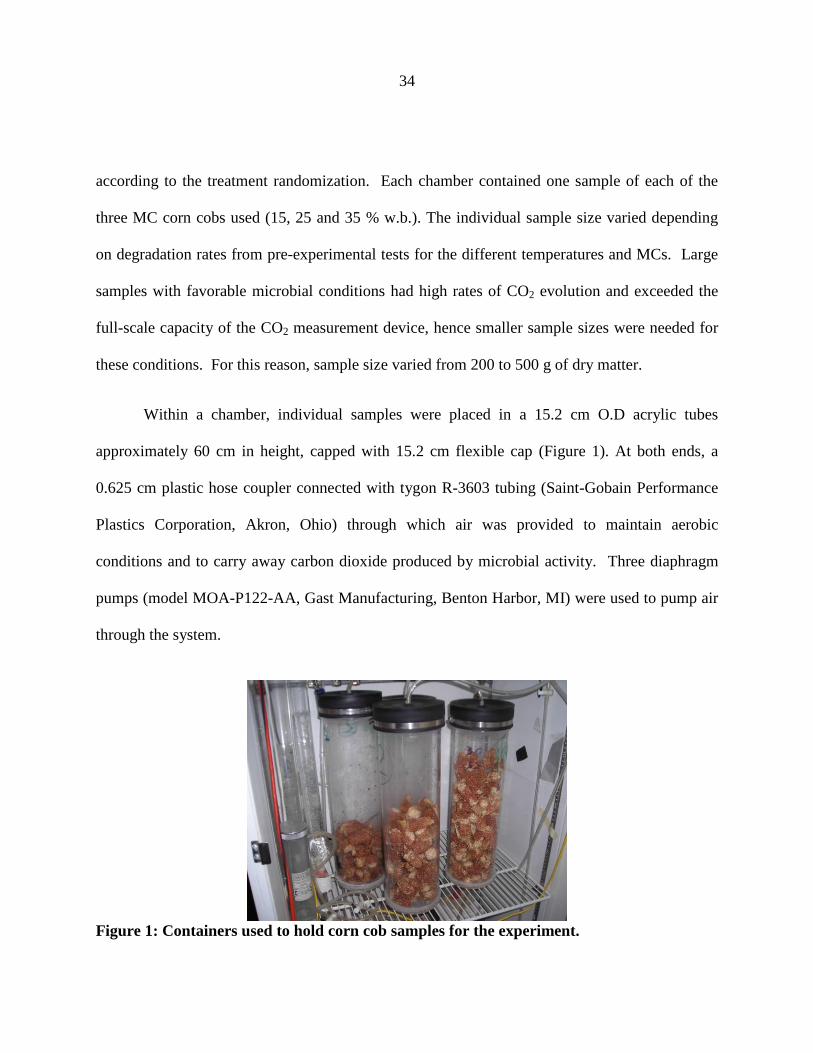
according to the treatment randomization. Each chamber contained one sample of each of the
three MC corn cobs used (15, 25 and 35 % w.b.). The individual sample size varied depending
on degradation rates from pre-experimental tests for the different temperatures and MCs. Large
samples with favorable microbial conditions had high rates of CO2 evolution and exceeded the
full-scale capacity of the CO2 measurement device, hence smaller sample sizes were needed for
these conditions. For this reason, sample size varied from 200 to 500 g of dry matter.
Within a chamber, individual samples were placed in a 15.2 cm O.D acrylic tubes
approximately 60 cm in height, capped with 15.2 cm flexible cap (Figure 1). At both ends, a
0.625 cm plastic hose coupler connected with tygon R-3603 tubing (Saint-Gobain Performance
Plastics Corporation, Akron, Ohio) through which air was provided to maintain aerobic
conditions and to carry away carbon dioxide produced by microbial activity. Three diaphragm
pumps (model MOA-P122-AA, Gast Manufacturing, Benton Harbor, MI) were used to pump air
through the system.
Figure 1: Containers used to hold corn cob samples for the experiment.

35
Depending on the moisture content of the samples, air could be bubbled through a 0.5 m
distilled water column before entering the samples in order to gain moisture or be mixed with
ambient air to approximate to the relative humidity that would enable to get the desired
equilibrium moisture content of the samples, as determined by ASAE Standard D245.5 (ASAE,
2001). Porcelain filters were place at the entrance to these water columns to decrease bubble
size, increasing the rate of water transfer to the air. A 250 mL flask was placed outside of each
of the 20 and 30ºC chambers downstream from the samples to collect condensing water that
might interfere with the CO2 measurement system.
One empty sample tube was used in each chamber to determine the ambient CO2
concentration. In pre-experiment tests, ambient CO2 concentration varied widely, depending on
human activities within the laboratory, which was connected to a teaching laboratory. For this
reason, an approximately 150 L plastic bag enclosure was used as an air reservoir before the air
pumps, buffering changes in the CO2 concentration of incoming air to the system.
Data collection
Temperature within the chambers was monitored using an LM 35 integrated-circuit
temperature sensor (National Semiconductor Corporation, USA). Relative humidity of the air
leaving the bubbling columns was monitored with an HIH- 4000-001 (Honeywell International
Inc) relative humidity sensor.
Air leaving each of the sample tubes entered a gas multiplexer, a device that has the
capacity to divert airflow from one of 24 ports for analysis (Figure 2). This apparatus consisted

36
of 24 0-5VDC solenoids operated through a SSR24 relay board (Measurement Computing Corp,
Norton, MA). This relay board had 24 selectable terminals which, when directed by a computer
program would select the specific port and the time to be opened to direct the airflow for CO2
concentration measurement. The airflow rate into the CO2 measurement device was determined
by a TSI Thermal Mass Flowmeter Model 4140 (TSI Incorporated, Shoreview, MN). This sensor
has a linear response to airflow from 0 to 10 volts corresponding to 0 to 20 Standard L/min (2
Standard L/min per Vdc).
Figure 2: 24 port manifold, regulator valves and air gauges controlling individual sample’s
air flow.
CO2 concentration (ppm) was measured with a Rosemount Analytical Model 880A Non-
Dispersive Infrared Analyzer (Emerson Process Management, Orrville, Ohio). The analyzer was
calibrated at the beginning of each replicate and weekly thereafter according to the

37
manufacturer’s specifications using a gas containing 1200 ppm of CO2. The accuracy as stated
by the manufacturer is ± 1% full scale.
A laptop computer was used to record the data from the sensors and also to operate the
solenoids, relay boards and microcontroller. The device used for analog to digital conversion
(microcontroller) was a PMD 1408 LS (Measurement Computing Corp, Norton, MA), which is a
USB bus-powered module with eight 14-bit analog inputs, two analog 12-bit analog outputs, and
16 digital I/O lines. The codes were written in Visual Basic Application for Microsoft Office
Access 2007.
The air being analyzed (when the solenoid valve was opened) would pass through the
airflow meter to the CO2 sensor transducer. Measures were taken from 12 a.m. to 8 a.m. in order
to minimize the effect of the carbon dioxide variation in the laboratory. Every three minutes the
gas multiplexer switched to the next sample and recorded the measurement. For every on each
sample, the average of all the measurements collected on the 8 hour period was recorded for later
analysis.
Calculation of dry matter loss
From the measured CO2 concentration and the airflow rate, the amount of CO2 produced
(difference between atmospheric and the sample measurement) was calculated by:
CO2 = (C/1000) x (A) x 1440
Where: CO2 = standard L of CO2 produced per day
38
C = measured CO2 concentration (ppm) averaged over 8 hour collection period
A = airflow rate (standard L/min)
1440 = 1440 minutes per day
Applying the Ideal Gas Law:
N = (P x CO2) / (R x T)
Where : N = moles of CO2 produced per day
CO2 = standard L of CO2 produced per day
P = standard pressure = 1 atm
R = constant = 0.082056 L*atm/(°K*mol)
T = standard temperature = 294 °K
One mole of C6H10O5 (monomer constitute of the cellulose chain) with a molecular
weight of 162 g/mol, when oxidized, results in six moles of carbon dioxide with a molecular
weight of 44 g/mol. Multiplying the number of moles CO2, produced per day by
162/(44*6)/162 or 0.6136 resulted in the amount of glucose (dry-matter) consumed per day in
grams. Dividing by the initial amount of dry-matter gave the % dry matter loss.
Statistical Analysis
Nine treatments (experimental units) were formulated from the combination of three MC
levels (15, 25 and 35 % w.b.) and three temperatures (10, 20 and 30ºC), performed in triplicate
(three runs), corresponding to a 3x3 complete factorial design. Temperature treatments were
randomly allocated to a chamber and moisture treatments were randomly allocated to certain

39
order within each chamber. For every replication (run) there would be a chamber randomly
assigned to one of the three temperatures and successively randomized on the later runs.
Statistical Analysis System (SAS Institute Inc) was used to analyze the data, with ANOVA
(analysis of variance). Differences in means were determine using Tukey-Kramer method with
alpha ≤ 0.05.
Results and Discussion
Table 1 gives the amount of dry matter loss, as estimated by CO2 evolution for each of
the treatments after 21 days of incubation. In general, treatments with 15% moisture content and
10ºC had nearly no dry matter loss (average of 0.1 percent), while higher moisture (35%
moisture content) and higher temperature (30ºC) had on average 2.75 % loss. Similar rates of
degradation were observed under 35% moisture and 20ºC averaging 2.4% DM loss.
Results drawn from the ANOVA indicates that temperature, moisture and the interaction
within both are highly significant (p values = 0.00032, <0.0001 and 0.0017 respectively),
whereas the replication was not significant.

40
Table 1: Average dry matter loss (%) for every combination between 15, 25 and 35%
moisture and 10, 20 and 30ºC.
Moisture 15% 25% 35%
Temp. DM Loss DM Loss DM Loss Average
10 ºC 0.01 (Aa) 0.24(Ab) 1.09 (Ac) 0.45
20 ºC 0.07 (Ba) 0.62 (Bb) 2.40 (Bc) 1.03
30 ºC 0.17 (Ca) 1.66 (Cb) 2.75 (Cc) 1.53
Average 0.08 0.84 2.08
Note: Tukey’s standardized range is symbolized with capital letters for temperature difference (between
rows) and lower case letters for difference between moisture contents (within columns). Significantly
different means was tested with α<0.05.
A T test (LSD) was performed with alpha 0.05 for the treatments identifying differences
among moistures and another test performed for the differences in temperatures. The least
significant difference among temperature means was found to be 0.22% DM, whereas the least
significant difference among moisture was 0.34% DM loss. The greatest deterioration was
achieved with 35% moisture significantly different from the 25 and 15%. Likewise, lower
temperature of 10C was statistically different 20 and 30C. As a whole, every moisture and
temperature was statistically different from each other. The resulting combination of both
factors high temperature and moisture resulted in 2.73 % ±0.40% of dry matter loss, whereas
negligible dry matter loss was observed with 10C and 15% moisture. On average, for every
increase of one percent of moisture, the dry matter loss increased 0.1 percentage point versus
0.05 percentage point for every Celsius degree over 21 days. Thus moisture content should be
carefully kept in mind while storing this kind of biomass.
41
The interaction makes the analysis and interpretation more complicated, in the sense that
not only moisture and temperature had additive effects on the deterioration model but also an
interaction effect which was highly significant. Therefore, it is not appropriate to just consider
each variable separately; both have to be considered for calculation of the resulting dry matter
loss.
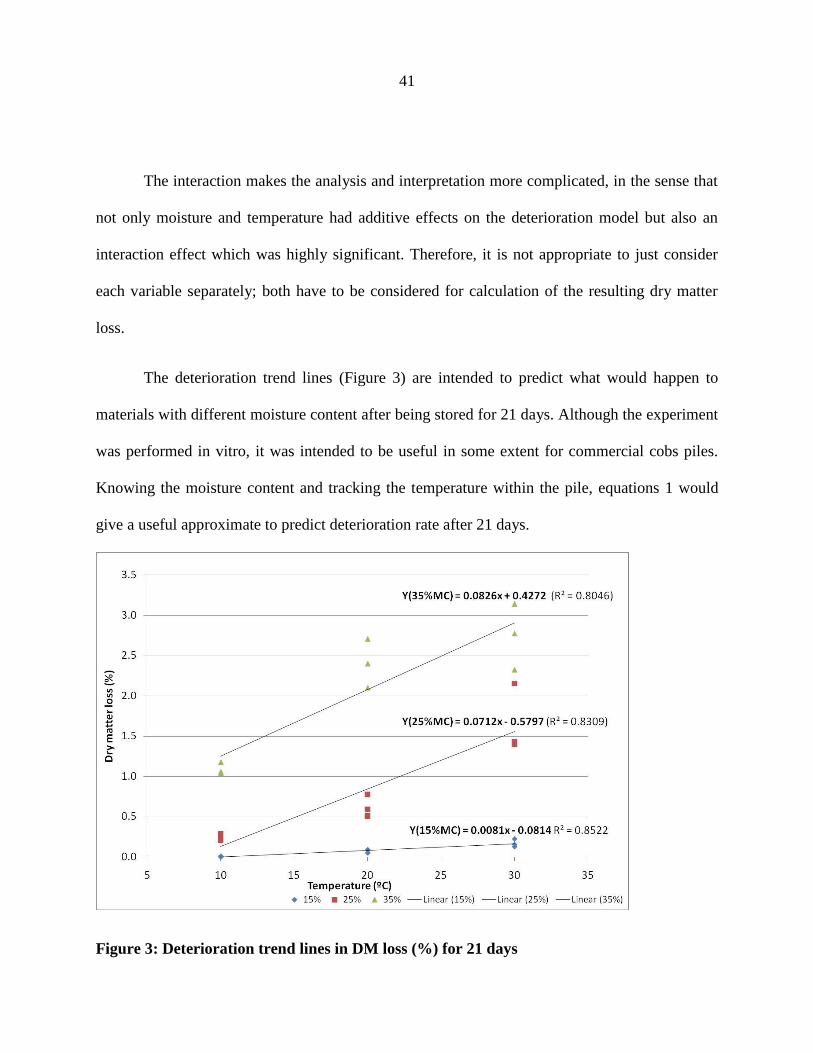
The deterioration trend lines (Figure 3) are intended to predict what would happen to
materials with different moisture content after being stored for 21 days. Although the experiment
was performed in vitro, it was intended to be useful in some extent for commercial cobs piles.
Knowing the moisture content and tracking the temperature within the pile, equations 1 would
give a useful approximate to predict deterioration rate after 21 days.
Figure 3: Deterioration trend lines in DM loss (%) for 21 days

42
Linear regression of the deterioration for the three moisture contents
Dry matter loss (15%MC) = 0.0081(Temp ˚C) - 0.0814 (R² = 0.85)
Dry matter loss (25%MC) = 0.0712(Temp ˚C) - 0.5797 (R² = 0.83)
Dry matter loss (35%MC) = 0.0826(Temp ˚C) + 0.4272 (R² = 0.80)
Although there are 9 points for every model to define the trend lines, all of them have a
coefficient of determination greater than 0.80, fitting quite well the data collected. The
interaction between temperature and moisture can also be seen by the different slopes presented
in each equation.
Table 2 combines information from the estimated dry matter loss of corn kernels
presented by Bern et al. (2002) with the deterioration rates resulted from this research, in order to
roughly evaluate kernels and cobs DM loss with similar storage conditions. Kernels were
assumed to have 30% damage and no fungicide and a generic hybrid was used. The shelled corn
and cobs storage time for 0.5% DM loss in days would approximately be as follow:
Table 2: Estimated 0.5 % DM loss of cobs and kernels in days.
Moisture 15% 25% 35%
Temp. Kernel Cobs Kernel Cobs Kernel Cobs
10 ºC 629 1480 22 44 9 10
20 ºC 175 160 7 17 3 5
30 ºC 63 63 3 6 1 4

43
For this table, it was assumed that the cob deterioration linear trend appropriately fit
prolonged periods of time, greater than 21 days. More studies are necessary to verify this
assumption. Overall, corn kernels with 15% moisture showed less deterioration than cobs
(besides 30 ˚C) whereas other conditions clearly favored.
The rate of dry matter loss (Figure 4) presented a linear trend for all the treatments as
opposed to the equivalent conditions for kernels, in which after a short lag phase an exponential
curve was observed (Moog et al. 2008; Wilcke et al. 2001; Friday et al. 1989).
Figure 4: DM loss for each treatment as a function of time.
44
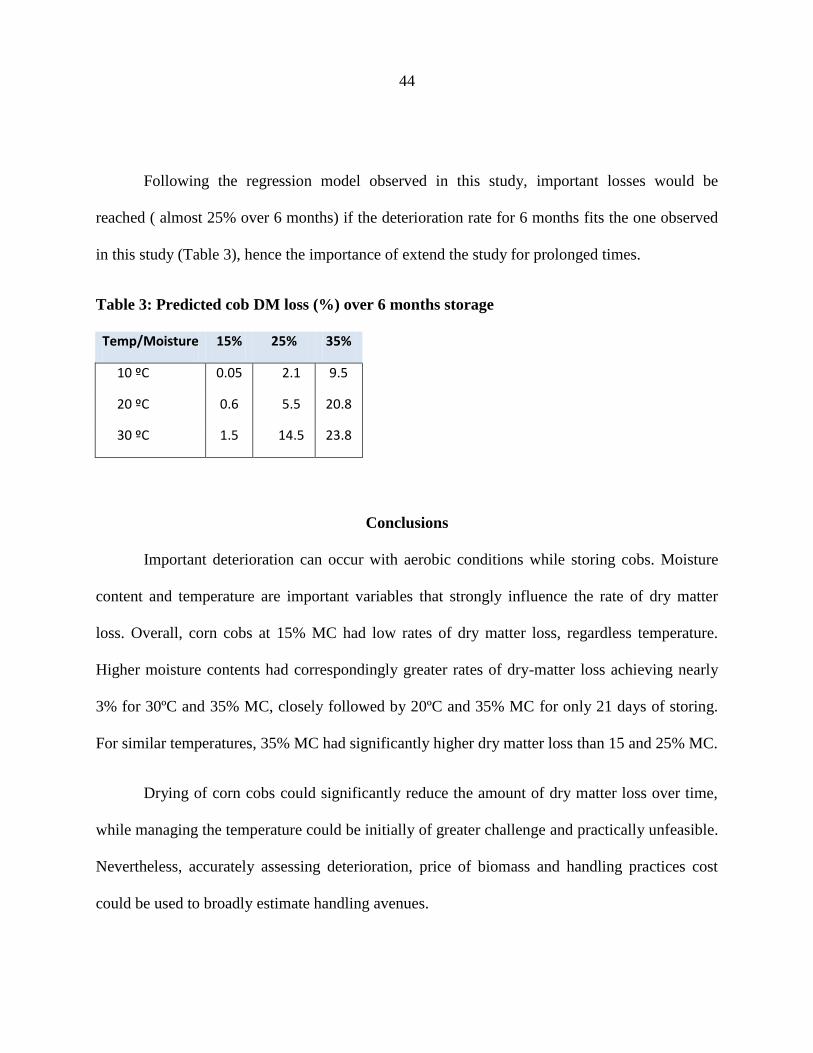
Following the regression model observed in this study, important losses would be
reached ( almost 25% over 6 months) if the deterioration rate for 6 months fits the one observed
in this study (Table 3), hence the importance of extend the study for prolonged times.
Table 3: Predicted cob DM loss (%) over 6 months storage
Temp/Moisture 15% 25% 35%
10 ºC 0.05 2.1 9.5
20 ºC 0.6 5.5 20.8
30 ºC 1.5 14.5 23.8
Conclusions
Important deterioration can occur with aerobic conditions while storing cobs. Moisture
content and temperature are important variables that strongly influence the rate of dry matter
loss. Overall, corn cobs at 15% MC had low rates of dry matter loss, regardless temperature.
Higher moisture contents had correspondingly greater rates of dry-matter loss achieving nearly
3% for 30ºC and 35% MC, closely followed by 20ºC and 35% MC for only 21 days of storing.
For similar temperatures, 35% MC had significantly higher dry matter loss than 15 and 25% MC.
Drying of corn cobs could significantly reduce the amount of dry matter loss over time,
while managing the temperature could be initially of greater challenge and practically unfeasible.
Nevertheless, accurately assessing deterioration, price of biomass and handling practices cost
could be used to broadly estimate handling avenues.

45
The deterioration rates showed by cob clearly differ to those shown by kernel. While
kernel has being extensively shown to be exponential, a linear trend seems to better match cob
DM decay. This trend could be related to the different types of carbohydrates present in both
materials, as to the germination and respiration process that could take place by the seed, or as a
result of the lignin fraction on cobs that serves as a barrier to microorganism growth. Yet, larger
periods should be considered in order to have a better response over longer periods of time.
Future studies should be carried out to determine dry matter loss for time periods longer
than 21 days. Also, the dry matter losses under aerobic conditions in this study should be
compared to that under actual storage conditions, where a combination of aerobic and anaerobic
condition might prevail. Furthermore, the impact of cob size, contaminants such as chaff, stover
and dirt may carry inoculums increasing the rates of microbial activity. Also, other situations that
will likely occur in storage should be examined, not only greater ranges of temperatures and
moistures but variation on both parameters throughout storage.

46
References
Arvelakis S, E.G Koukios. 2002. Physicochemical upgrading of agroresidues as feedstocks
for energy production via thermo-chemical conversion methods. Biomass Bioenergy 22:331–348
ASABE Standards. 2003. S358.2: Moisture measurement - Forages. St. Joseph, Mich.:
ASABE.
ASAE Standard. 2001. Whole CornCob Equlibrium Moisture Curves. D245.5
Bern, C. J., J. L. Steele and R.V. Morey. 2002. Shelled corn CO2 evolution and storage
time for 0.5% dry matter loss. Applied Engineering in Agriculture 18(6): 703-706.
Blunck, S.L., M.W. Yore, M.D. Summers, G.K. Lau, S.T. Tang, and B.M. Jenkins. 2003.
Quality and property changes in rice straw during long term storage. ASAE 036091. American
Society of Agricultural Engineers, St. Joseph, MI 49085-9659.
Chitrakar, S., C.J. Bern and D.S. Shrestha. 2006. Quantifying corn deterioration due to
fungal growth by use of CO2-sensitive gel. Applied Engineering in Agriculture 22(1): 81–86.
Collins, M., D. Ditsch, J.C. Henning, L.W. Turner, S. Isaacs and G.D. Lacefield. 1997.
Round bale hay storage in Kentucky. Cooperative Extension Service, University of Kentucky
publication AGR-171.
Friday, D., J. Tuite and R. Stroshine. 1989. Effect of hybrid and physical damage on mold
development and carbon dioxide production during storage of high-moisture shelled corn. Cereal
Chem. 66(4): 422-426.
Haug, R.T. 1993. The Practical Handbook of Compost Engineering. Lewis Publishers,
Boca Ratan, Florida. Pp. 261-278.
Hogland, W., T. Bramryd and I. Persson. 1996. Physical, biological and chemical effects of
unsorted fractions of industrial solid waste in waste fuel storage. Waste Management & Research
14: 197-210.
Huhnke, R.L. 2003. Round bale hay storage. Oklahoma State Coop. Extension Services. F-
1716: 2-5.
Ioannidou, O., A. Zabaniotou, E. V. Antonakou, K. M. Papazisi, A. A. Lappas and C.
Athanassiou. 2009. Investigating the potential for energy, fuel, materials and chemicals

47
production from corn residues (cobs and stalks) by non-catalytic and catalytic pyrolysis in two
reactor configurations. Renew Sustain Energy Rev 13:750–762.
Johnson, J M. Fane, W. W. Wilhelm, D. L. Karlen, D. W. Archer, B. Wienhold, D. T.
Lightle, D. Laird, et al. 2010. Nutrient removal as a function of corn stover cutting height and
cob harvest. BioEnergy Research. 3:342-352.
Kaliyan, N. & M. R. Vance. 2008. Densification Characteristics of Corn Cobs. ASABE
meeting presentation paper number 084267.
Latif, F. and M. I. Rajoka. 2001. Production of ethanol and xylitol from corn cobs by
yeasts. Bioresource Technology 77: 57-63.
Moog, D. J. P., R. L. Stroshine and L. M. Seitz. 2008. Relationship of shelled corn fungal
susceptibility to carbon dioxide evolution and kernel attributes. Cereal Chemistry 85(1):19-26.
Olsson L. and B. Hahn~Hagerdal. 1996. Fermentation of lignocellulosic hydrolysates for
ethanol production. Enzyme and Microbial Technology 18:312-331.
Perlack R.D., L.L. Wright, A.F. Turhollow, R.L. Graham, B.J. Stokes, D.C. Erbach. 2005.
Biomass as Feedstock for a Bioenergy and Bioproducts Industry: The Technical Feasibility of a
Billion Ton Annual Supply (Oak Ridge National Laboratory, Oak Ridge, TN) ORNL/TM-
2005/66.
Saul, R. A., and J. L. Steele. 1966. Why damaged corn costs more to dry. Agricultural
Engineering 47(6): 326-329.
Shinners, K. J., B. N. Binversie & P. Savoie. 2003. Whole-plant corn harvesting for
biomass: comparison of single-pass and multiple-pass harvest systems. ASABE meeting
presentation Nr. 036089.
Smith, R.D, R.M. Peart, J.B. Liljedahl, L.R. Barrett & O.C. Doering. 1985. Corncob
property changes during outside storage. Transaction of the ASAE 28(3):937-942.
White, S.D., 2007. Using Ozone to Control Fungi in High Moisture Corn. M.S. thesis, Iowa
State University, Ames, IA.
Wilcke, W.F., K.E. Ileleji, P. Gupta, R.V. Morey and R.A. Meronuck. 2001. Comparison
of sample storage and conditioning methods for corn storability tests. Transactions of the ASAE
44(2): 369–376.
48
CHAPTER 4: GENERAL CONCLUSIONS
Biomass may encounter considerable dry matter losses due to microbial activity,
depending on the material, the storage conditions and prevention practices. The next generation
of biofuels and the intended bioeconomy will need large amounts of feedstock for producing
food, fuel and fibers in a renewable fashion. Thus it is necessary to understand and quantify the
losses and quality changes that varied feedstock could encounter before being processed.
Although it is important to quantify this parameters, the difficulties associated with
measuring deterioration directly, the technical challenges for relatively small amounts over long
periods and the associated measuring errors poses important challenges for collecting adequate
data.
What appears to be clear is that the amount of dry matter loss can be quite significant.
The microbes’ respiration is directly related to the conditions for their development, i.e., whether
the type material and the environment of storage is supporting their growth. Different types of
cellulosic microorganisms have being identified, with different optimum ranges of moistures,
temperatures, PH, salinity, oxygen levels (aerobic and anaerobic), etc., that directly support their
growth rate. Thereby, the importance of identifying the type of microorganism and the
conditions that prevent their development to consequently improve handling strategies can help
maximize material’s quantity and quality. Needless to say that feedstock, such as agricultural
residues, might need to be stored for prolonged times such as a year or more. Not only biological
decomposition but chemical oxidation will be a concern too. In this sense, extreme conditions
49
(biological activity could serve as a starter) could lead to spontaneous combustion and large
number of consequences associated with it.
Corn cobs have been shown to degrade while in storage. Although it is a lignocellulosic
material, in which many cases is claimed to be extremely resilient, with sugars attached with beta
linkage and lignin protecting the fibers, we experience considerable losses in short periods of
time. For the greatest treatment reaching almost 3% in 21 days, and those conditions are yet
likely to be seen in accumulation areas. Although temperature is an important factor, higher
moisture content appeared to be more detrimental, resulting in greater difference of decay for
every percentage in increase (for the range of conditions in this study). Moreover, current storage
practices will likely increase decaying conditions with higher moistures, higher pile
temperature’s, with more degradable materials (chaffs and stover), smaller particle size or with
greater amount of inoculum (for example with soil contamination) that might ramp up the rates
of deterioration. Further studies with other materials, and conditions listed above should follow
this preliminary study to correctly assess storage conditions and consequently improve handling
strategies.

50
REFERENCES
Anderson Inc. 1978. Corn cob granules as a carrier, diluents and extender fro agrichemical
and lawn & garden Products. Technical data sheet. Delphi. Indiana.
ASTM. 1979. Annual Book of ASTM Standards, part 23. American Society of Testing
Materials, Philadelphia, PA.
Bern, C. J., J. L. Steele and R.V. Morey. 2002. Shelled corn CO2 evolution and storage time
for 0.5% dry matter loss. Applied Engineering in Agriculture 18(6): 703-706.
Blunck, S.L., M.W. Yore, M.D. Summers, G.K. Lau, S.T. Tang, and B.M. Jenkins. 2003.
Quality and property changes in rice straw during long term storage. ASAE 036091. American
Society of Agricultural Engineers, St. Joseph, MI 49085-9659.
Bourne J.K. 2007. Green dreams. National Geographic 212(4):38–59
Brown, R. C. 2003. Biorenewable resources: engineering new products from agriculture.
Iowa State Press, Ames, Iowa, USA.
Buggelnl, R. & R. Rynk. 2002. Self-Heating In Yard Trimmings: conditions leading to
spontaneous combustion. Compost Science & Utilization 10:162-182
Chitrakar, S., C.J. Bern and D.S. Shrestha. 2006. Quantifying corn deterioration due to fungal
growth by use of CO2-sensitive gel. Applied Engineering in Agriculture 22(1): 81–86.
Clark, T.F., & E.C. Lathrop. 1953. Corncobs their composition availability, agricultural and
industrial uses. USDA-ARS North Regional Research Laboratory, Peoria, IL. AIC-177.
Collins, M., D. Ditsch, J.C. Henning, L.W. Turner, S. Isaacs and G.D. Lacefield. 1997.
Round bale hay storage in Kentucky. Cooperative Extension Service, University of Kentucky
publication AGR-171.
Cundiff, J. & L. Marsh. 1996. Harvest and storage costs for bales of switchgrass in the
southeastern United States. Bioresource Technology, 56(1), 95-101.
Dahlberg R. W. 1977. Corn cobs- an energy source for drying seed. Pioneer Hi-bred
International Inc. Johnston Iowa. Pg. 1-11
Dobie, J.B. & Haq, A. (1980) Outside storage of baled rice straw. TRANSACTIONS of the
ASAE 23(4):990-993.
Dunning, J.W., P. Winter, and D. Dallas. 1948. The storage of corncobs and other
agricultural residues for industrial use. Agricultural Engineering 29(1): 11-13.

51
Environmental Protection Agency. 2009. EPA Proposes New Regulations for the National
Renewable Fuel Standard Program for 2010 and Beyond. Available at:
http://www.epa.gov/oms/renewablefuels/420f09023.htm accessed Jun 1st 2010.
Friday, D., J. Tuite and R. Stroshine. 1989. Effect of hybrid and physical damage on mold
development and carbon dioxide production during storage of high-moisture shelled corn. Cereal
Chem. 66(4): 422-426.
Foley, K.M. 1978. Physical Properties, Chemical Properties, and Uses of The Andersons’
Corncob Products. 2nd ed. Maumee, OH: The Andersons, Cob Division Processing Group.
Haney, R. L., Brinton, W. F., & Evans, E. 2008. Soil CO2 respiration : Comparison of
chemical titration , CO2 IRGA analysis and the Solvita gel system. Renewable agriculture and
food system 23(2):171-176.
Hogland, W., T. Bramryd and I. Persson. 1996. Physical, biological and chemical effects of
unsorted fractions of industrial solid waste in waste fuel storage. Waste Management & Research
14: 197-210.
Johnson, J M. Fane, W. W. Wilhelm, D. L. Karlen, D. W. Archer, B. Wienhold, D. T.
Lightle, D. Laird, et al. 2010. Nutrient removal as a function of corn stover cutting height and
cob harvest. BioEnergy Research. 3:342-352.
Kaliyan, N. & M. R. Vance. (2008). Densification Characteristics of Corn Cobs. ASABE
meeting presentation paper number 084267.
Mckibben, B. 2007. Carbon's New Math. National Geographic 212(4):33-34.
Moog, D. J. P., R. L. Stroshine and L. M. Seitz. 2008. Relationship of shelled corn fungal
susceptibility to carbon dioxide evolution and kernel attributes. Cereal Chemistry 85(1):19-26.
Morey, R.V., and D.P. Thimsen. 1980. Combustion of crop residues to dry corn. Proceedings
of the ASAE Energy Symposium, Kansas City, Missouri, Sept. 29 - Oct. 1, 1980. 6 pp.
Morey, R.V., D.P. Thimsen, J.P. Lang, and D.J. Hansen. 1984. A corncob–fueled drying
system. Trans. ASAE 27(2): 556-560.
Nelson, B. D., Verma, L. R. & C.R. Montgomery. 1983. Effects of storage method on losses
and quality changes in round bales of ryegrass and alfalfa hay. LSU Agric. Exp. Sta. Bull. 750.
NREL. 2007. Theoretical ethanol yield calculator. Washington, D.C.: U.S. Department of
Energy. Available at: www.eere.energy.gov/biomass/ethanol_yield_calculator.html. Accessed
1st June 2010.

52
Perlack R.D., L.L. Wright, A.F. Turhollow, R.L. Graham, B.J. Stokes, D.C. Erbach. 2005.
Biomass as Feedstock for a Bioenergy and Bioproducts Industry: The Technical Feasibility of a
Billion Ton Annual Supply (Oak Ridge National Laboratory, Oak Ridge, TN) ORNL/TM-
2005/66.
.Pordesimo, L.O., B.R. Hames, S. Sokhansanj, and W.C. Edens. 2005. Variation in corn
stover composition and energy content with crop maturity. Biomass and Bioenergy 28(4):366-
374.
Reeder, R. & Y. Li. 2010. Determining Location of Cellulosic Ethanol Plants in Ohio, Based
on Availability of Crop Residues. Transactions of the ASAE 52(1): 313-318.
Shafizadeh F. & W.F. DeGroot .1976. Combustion characteristics of cellulosic
fuels. Thermal uses and properties of carbohydrates and lignins. New York: Academic Press, 1–
17
Renewable Fuel Association. Webpage http://www.ethanolrfa.org/pages/statistics
Smith, R.D, R.M. Peart, J.B. Liljedahl, L.R. Barrett & O.C. Doering. 1985. Corncob property
changes during outside storage. Transaction of the ASAE 28(3):937-942.
White, M.S., Curtis, M.L., Sarles, R.L., Green, D.W. (1983) Effects of outside storage on the
energy potential of hardwood particulate fuels: Part I. Moisture content and temperature. Forest
Products Journal 33(6):31-38.
White, S.D., 2007. Using Ozone to Control Fungi in High Moisture Corn. M.S. thesis, Iowa
State University, Ames, IA.
Wilcke, W.F., K.E. Ileleji, P. Gupta, R.V. Morey and R.A. Meronuck. 2001. Comparison of
sample storage and conditioning methods for corn storability tests. Transactions of the ASAE
44(2): 369–376.
Woodward, W. T. W. 2004. Spontaneous Combustion in Hay Stacks (pp. 15-17). Pasco, WA
99301.
Wright, M., & R.C. Brown. 2007. Establishing the optimal sizes of different kinds of
biorefineries. Biofuels, Bioproducts and Biorefining, 1(3), 191-200.

53
APPENDIX A. DIAGRAM AND CODING
Diagram for the Electrical Components and Experimental set up
List of Materials and Datasheets
Vendor Qty Vendor Part Number
Description
SSR 24 DigiKey 18 67-1068-nd DigiKey 18 470h-nd DigiKey 6 HE-100-nd reused 12 Rlyfma105c DigiKey 1 Mm74hc4514n-nd DigiKey 1 Relative humidity sensor DigiKey 1 Temperature Transducer Radio Shack 1 Relays DigiKey 1 PGA 204

54
DigiKey 2 Wm4648-nd Breadboard DigiKey 3 Wm4650-nd DigiKey 2 Wm2104-nd DigiKey 2 Wm2108-nd DigiKey 3 Wm2110-nd DigiKey 58 Wm2300-nd reused 1 LPS22(-T) Astec / Emerson Power Supply
5 volts – 2 amps Measurement Computing
1 PMD-1208-LS Personal Measurement Device
Lowes 36 na
Pneumatic valves manufactured by ARS Ingersoll-Rand –inserts from the ARS sales catalog
are included.
Digikey – http://www.digikey.com
Measurement Computing - http://www.measurementcomputing.com/
Codes for the Interface:
Option Explicit ' Force explicit variable declaration
'Graphic User Interface Define Dependent Constants Const colPort As String = "A" 'Column used for port number
Const colPortName As String = "B" 'Column used for port name
Const colCO2 As String = "C" 'Column used for CO2
Const colAirF As String = "D" 'Column used for Air Flow
Const colTemp As String = "E" 'Column used for Temperature
Const colRH As String = "F" 'Column used for Relative Humidity
Const colDryMat As String = "G" 'Column used for the % of Dry Matter Loss
Const colControlCO2 As String = "H" 'Column used for the TimeStamp
Const colTime As String = "I" 'Column used for the TimeStamp
Const startingRow As Long = 3 'Address of the row where the data starts to be stored
Const sheetName As String = "Interface"
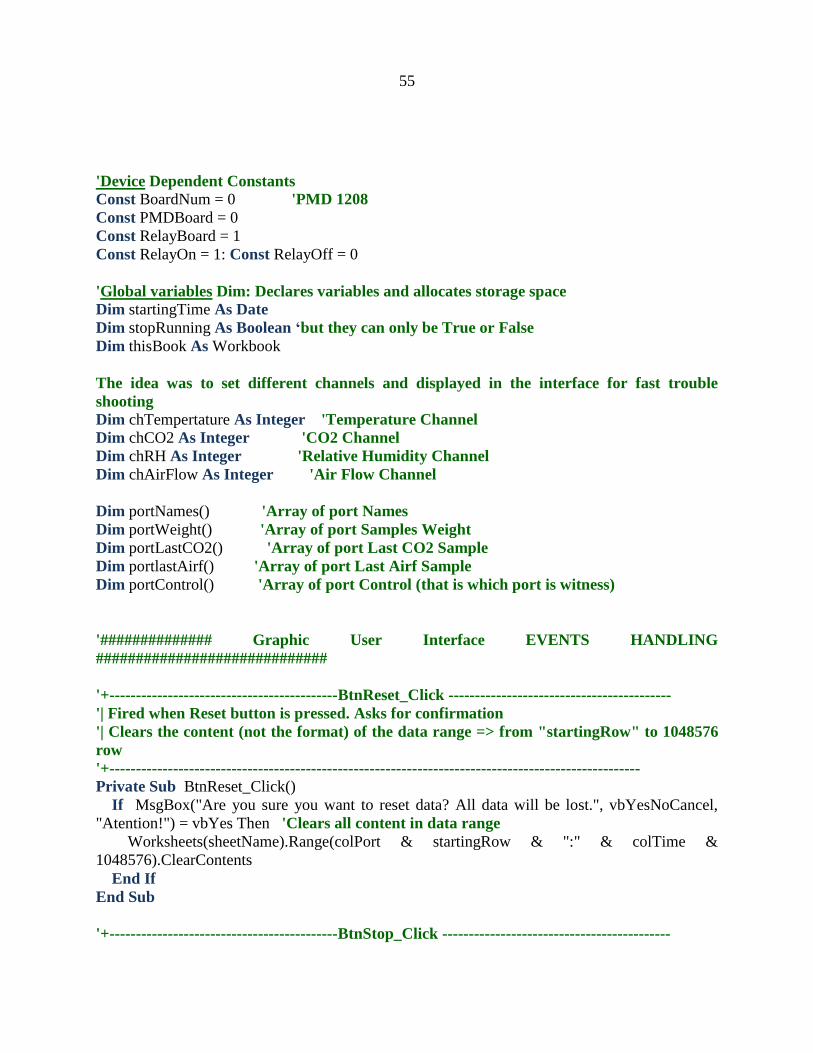
55
'Device Dependent Constants
Const BoardNum = 0 'PMD 1208
Const PMDBoard = 0
Const RelayBoard = 1
Const RelayOn = 1: Const RelayOff = 0
'Global variables Dim: Declares variables and allocates storage space
Dim startingTime As Date
Dim stopRunning As Boolean ‘but they can only be True or False
Dim thisBook As Workbook
The idea was to set different channels and displayed in the interface for fast trouble
shooting Dim chTempertature As Integer 'Temperature Channel
Dim chCO2 As Integer 'CO2 Channel
Dim chRH As Integer 'Relative Humidity Channel
Dim chAirFlow As Integer 'Air Flow Channel
Dim portNames() 'Array of port Names
Dim portWeight() 'Array of port Samples Weight
Dim portLastCO2() 'Array of port Last CO2 Sample
Dim portlastAirf() 'Array of port Last Airf Sample
Dim portControl() 'Array of port Control (that is which port is witness)
'############## Graphic User Interface EVENTS HANDLING
#############################
'+-------------------------------------------BtnReset_Click ------------------------------------------
'| Fired when Reset button is pressed. Asks for confirmation
'| Clears the content (not the format) of the data range => from "startingRow" to 1048576
row
'+----------------------------------------------------------------------------------------------------
Private Sub BtnReset_Click()
If MsgBox("Are you sure you want to reset data? All data will be lost.", vbYesNoCancel,
"Atention!") = vbYes Then 'Clears all content in data range
Worksheets(sheetName).Range(colPort & startingRow & ":" & colTime &
1048576).ClearContents
End If
End Sub
'+-------------------------------------------BtnStop_Click -------------------------------------------

56
'| Fired when Stop button is pressed. Asks for confirmation
'| Changes the "stopRunnig" Flag checked on main loop
'+---------------------------------------------------------------------------------------------------- Private Sub BtnStop_Click()
If MsgBox("Are you sure you want to STOP?", vbYesNoCancel, "Warning!") = vbYes Then
stopRunning = True
End If
End Sub
'+-------------------------------------------BtnStart_Click ------------------------------------------
'| Fired when Start button is pressed.
'| Main procedure:
'| 1) Call init proc (checks if environment settings are correct) and global vars are settled
'| 2) Configures PMD
'| 3) Loop until Stop button is pressed
'| 3.1) Open current Relay
'| 3.2) Save file if it has to DEPENDING ON THE SETTINGS!
'| 3.3) Wait for the Sampling time interval (less the time used for saving the book)
'| 3.4) Read data measurement from the PMD device take CO2, Airflow, Temperature,
RH Data
'| 3.5) Store Data on a row and print results
'| 3.6) Close current relay and move to the next
'| 4) Close all relays, SAFE FAIL
'+----------------------------------------------------------------------------------------------------
Private Sub BtnStart_Click()
Dim co2 As Single, Airf As Single, temp As Single, RH As Single, portName As Variant
Dim row As Long, currentPort As Integer, portCount As Integer , i As Integer
Dim lastTimeStamp, initialTimeStamp, savingTime
Dim SamplingInterval As Long, savePeriod As Integer , saveCounter As Integer
'1) Global vars are settled and inic proc is called
Set thisBook = ActiveWorkbook 'ActiveBook is stored on auxiliary var because may fail if
user changes focus on a different book
'Calculate the sampling interval in seconds
SamplingInterval = 3600 * ReadRange("IntervalHour") + 60 * ReadRange("IntervalMin") +
ReadRange("IntervalSec")
'init proc is called, checks if all settings are correct, exits if not
If Not init() Then Exit Sub
'vars initialization
row = getLastRow() 'Find in which row to start writing data
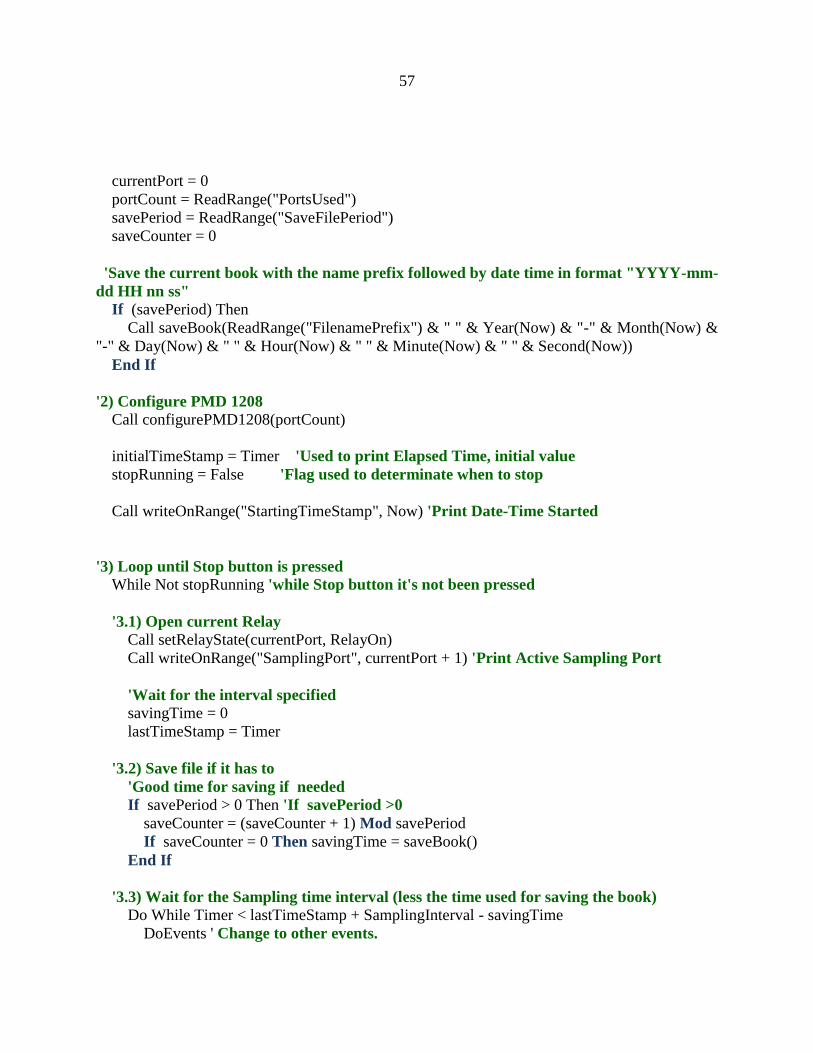
57
currentPort = 0
portCount = ReadRange("PortsUsed")
savePeriod = ReadRange("SaveFilePeriod")
saveCounter = 0
'Save the current book with the name prefix followed by date time in format "YYYY-mm-
dd HH nn ss"
If (savePeriod) Then
Call saveBook(ReadRange("FilenamePrefix") & " " & Year(Now) & "-" & Month(Now) &
"-" & Day(Now) & " " & Hour(Now) & " " & Minute(Now) & " " & Second(Now))
End If
'2) Configure PMD 1208
Call configurePMD1208(portCount)
initialTimeStamp = Timer 'Used to print Elapsed Time, initial value
stopRunning = False 'Flag used to determinate when to stop
Call writeOnRange("StartingTimeStamp", Now) 'Print Date-Time Started
'3) Loop until Stop button is pressed
While Not stopRunning 'while Stop button it's not been pressed
'3.1) Open current Relay
Call setRelayState(currentPort, RelayOn)
Call writeOnRange("SamplingPort", currentPort + 1) 'Print Active Sampling Port
'Wait for the interval specified
savingTime = 0
lastTimeStamp = Timer
'3.2) Save file if it has to
'Good time for saving if needed
If savePeriod > 0 Then 'If savePeriod >0
saveCounter = (saveCounter + 1) Mod savePeriod
If saveCounter = 0 Then savingTime = saveBook()
End If
'3.3) Wait for the Sampling time interval (less the time used for saving the book)
Do While Timer < lastTimeStamp + SamplingInterval - savingTime
DoEvents ' Change to other events.

58
Sleep (500) ' idle for half second to make stop button response better
If stopRunning Then Exit Do
Call writeOnRange("ElapsedTime", Format(Timer - initialTimeStamp, "Standard"))
Call writeOnRange("RemainingTime", Format(lastTimeStamp + SamplingInterval -
Timer, "Standard"))
Loop
'3.4) Read data measurement from the PMD device take CO2, Airflow, Temperature,
RH Data
'Start Measuring time 0.5 second before switching to different Valve
Call MeasureData(co2, Airf, temp, RH)
'3.5) Store Data and print results
Call WriteData(row, currentPort, co2, Airf, temp, RH)
Call writeOnRange("LastPort", currentPort)
Call writeOnRange("LastCO2", co2)
Call writeOnRange("LastAirFlow", Airf)
Call writeOnRange("LastTemperature", temp)
Call writeOnRange("LastRelHum", RH)
'3.6) Close current relay and move to the next
Call setRelayState(currentPort, RelayOff)
currentPort = (currentPort + 1) Mod (portCount) 'Modular arithmetic XE: 4 mod 3 = 1 (rest)
row = row + 1
Wend 'Loop until press Stop Button
'4) Close all relays
'Before exit close all relays
For i = 0 To portCount - 1 'Close all in case something goes wrong
Call setRelayState(i, RelayOff)
Next
End Sub
############### PMD Functions
###################################################
'+---------------------------------------- configurePMD1208 ------------------------------------------
'| Configures PMD1208 device. First set environment configs
'| Then closes all relays to be used
'+----------------------------------------------------------------------------------------------------
Private Sub configurePMD1208(portCount As Integer )
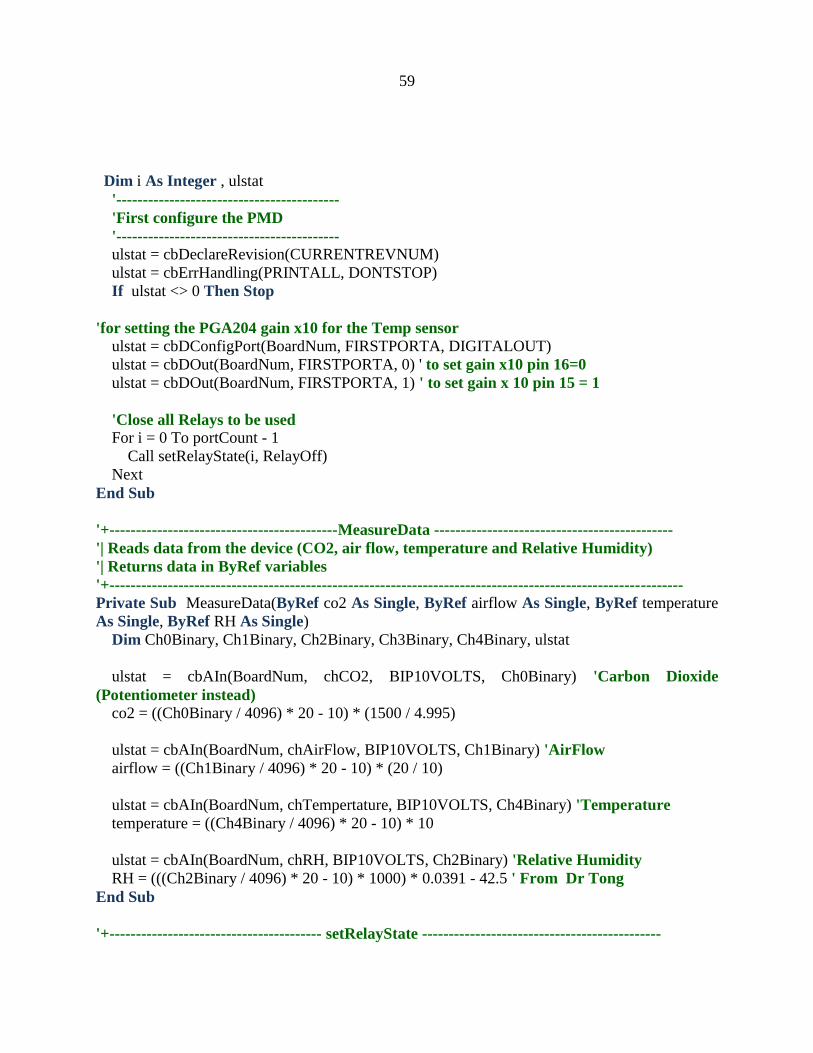
59
Dim i As Integer , ulstat
'------------------------------------------
'First configure the PMD
'------------------------------------------
ulstat = cbDeclareRevision(CURRENTREVNUM)
ulstat = cbErrHandling(PRINTALL, DONTSTOP)
If ulstat <> 0 Then Stop
'for setting the PGA204 gain x10 for the Temp sensor ulstat = cbDConfigPort(BoardNum, FIRSTPORTA, DIGITALOUT)
ulstat = cbDOut(BoardNum, FIRSTPORTA, 0) ' to set gain x10 pin 16=0
ulstat = cbDOut(BoardNum, FIRSTPORTA, 1) ' to set gain x 10 pin 15 = 1
'Close all Relays to be used For i = 0 To portCount - 1
Call setRelayState(i, RelayOff)
Next
End Sub
'+-------------------------------------------MeasureData ---------------------------------------------
'| Reads data from the device (CO2, air flow, temperature and Relative Humidity)
'| Returns data in ByRef variables
'+------------------------------------------------------------------------------------------------------------
Private Sub MeasureData(ByRef co2 As Single, ByRef airflow As Single, ByRef temperature
As Single, ByRef RH As Single)
Dim Ch0Binary, Ch1Binary, Ch2Binary, Ch3Binary, Ch4Binary, ulstat
ulstat = cbAIn(BoardNum, chCO2, BIP10VOLTS, Ch0Binary) 'Carbon Dioxide
(Potentiometer instead)
co2 = ((Ch0Binary / 4096) * 20 - 10) * (1500 / 4.995)
ulstat = cbAIn(BoardNum, chAirFlow, BIP10VOLTS, Ch1Binary) 'AirFlow
airflow = ((Ch1Binary / 4096) * 20 - 10) * (20 / 10)
ulstat = cbAIn(BoardNum, chTempertature, BIP10VOLTS, Ch4Binary) 'Temperature
temperature = ((Ch4Binary / 4096) * 20 - 10) * 10
ulstat = cbAIn(BoardNum, chRH, BIP10VOLTS, Ch2Binary) 'Relative Humidity
RH = (((Ch2Binary / 4096) * 20 - 10) * 1000) * 0.0391 - 42.5 ' From Dr Tong
End Sub
'+---------------------------------------- setRelayState ---------------------------------------------
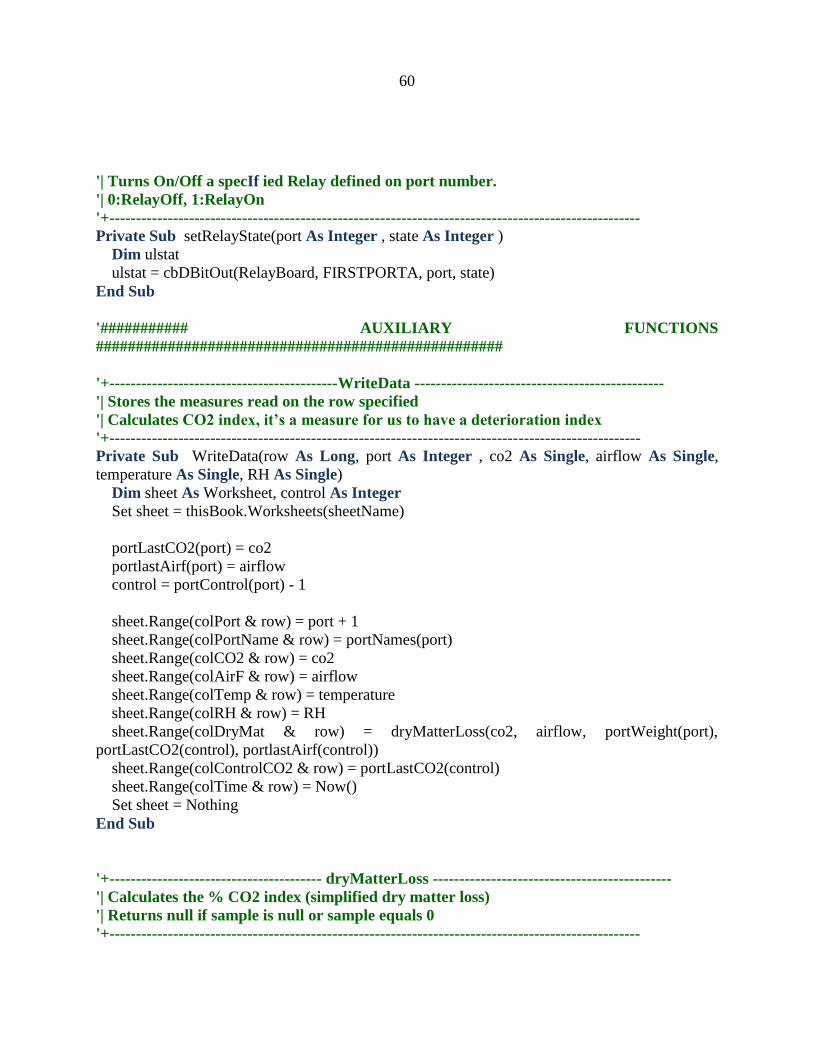
60
'| Turns On/Off a specIf ied Relay defined on port number.
'| 0:RelayOff, 1:RelayOn
'+----------------------------------------------------------------------------------------------------
Private Sub setRelayState(port As Integer , state As Integer )
Dim ulstat
ulstat = cbDBitOut(RelayBoard, FIRSTPORTA, port, state)
End Sub
'########### AUXILIARY FUNCTIONS
###################################################
'+-------------------------------------------WriteData -----------------------------------------------
'| Stores the measures read on the row specified
'| Calculates CO2 index, it’s a measure for us to have a deterioration index
'+----------------------------------------------------------------------------------------------------
Private Sub WriteData(row As Long, port As Integer , co2 As Single, airflow As Single,
temperature As Single, RH As Single)
Dim sheet As Worksheet, control As Integer
Set sheet = thisBook.Worksheets(sheetName)
portLastCO2(port) = co2
portlastAirf(port) = airflow
control = portControl(port) - 1
sheet.Range(colPort & row) = port + 1
sheet.Range(colPortName & row) = portNames(port)
sheet.Range(colCO2 & row) = co2
sheet.Range(colAirF & row) = airflow
sheet.Range(colTemp & row) = temperature
sheet.Range(colRH & row) = RH
sheet.Range(colDryMat & row) = dryMatterLoss(co2, airflow, portWeight(port),
portLastCO2(control), portlastAirf(control))
sheet.Range(colControlCO2 & row) = portLastCO2(control)
sheet.Range(colTime & row) = Now()
Set sheet = Nothing
End Sub
'+---------------------------------------- dryMatterLoss ---------------------------------------------
'| Calculates the % CO2 index (simplified dry matter loss)
'| Returns null if sample is null or sample equals 0
'+----------------------------------------------------------------------------------------------------

61
Public Function dryMatterLoss(co2 As Single, airflow As Single, weight As Variant, ByVal
controlCO2 As Single, ByVal ControlAirf As Single) As Variant
dryMatterLoss = Null
If IsNumeric(weight) Then
If weight <> 0 Then dryMatterLoss = (co2 * airflow - controlCO2 * ControlAirf) /
weight
End If End Function
'+---------------------------------------------- init ------------------------------------------------
'| Configures environment settings
'| Checks the preconditions to detect everything if it is fine before start
'| Resets some values
'+----------------------------------------------------------------------------------------------------
Private Function init() As Boolean
Dim OK As Boolean, description As String, sheet As Worksheet
Set sheet = thisBook.Worksheets(sheetName)
OK = checkNames() 'Check If the application has all variables defined
Call loadPortsData
If OK Then
'Failsafe #1 First Check that the Ports to be used is valid (between 1 and 24)
If Not isBetween(1, 24, sheet.Range("PortsUsed")) Then 'Check a numerical value
OK = False
description = "Number of port used must between 1-24"
End If
'Failsafe #2 First Check that the Sampling Interval is valid
'2.1 Check Hours are correct, between 0-23
If Not isBetween(0, 23, sheet.Range("IntervalHour")) Then
OK = False
description = description & vbNewLine & "Sample Interval hours must be between 0-
23"
End If
'2.2 Check Minutes are correct, between 0-59
If Not isBetween(0, 59, sheet.Range("IntervalMin")) Then
OK = False
description = description & vbNewLine & "Sample Interval minutes must be between
0-59"

62
End If
'2.3 Check Minutes are correct, between 0-59
If Not isBetween(0, 59, sheet.Range("IntervalSec")) Then
OK = False
description = description & vbNewLine & "Sample Interval seconds must be between
0-59"
End If
'#3 First Check that the Temperature Channel
If Not IsNumeric(ReadRange("ChannelTemperature")) Then 'Check a numerical value
OK = False
description = description & vbNewLine & "Temperature Channel must be numeric. See
'Settings' sheet."
End If
'#4 First Check that the CO2 Channel
If Not IsNumeric(ReadRange("ChannelCO2")) Then 'Check a numerical value
OK = False
description = description & vbNewLine & "CO2 Channel must be numeric. See 'Settings'
sheet."
End If
'#5 First Check that the Air Flow Channel
If Not IsNumeric(ReadRange("ChannelAirFlow")) Then 'Check a numerical value
OK = False
description = description & vbNewLine & "Air Flow Channel must be numeric. See
'Settings' sheet."
End If
'#6 First Check that the Rel Humidity Channel If Not IsNumeric(ReadRange("ChannelRH")) Then 'Check a numerical value
OK = False
description = description & vbNewLine & "Relative Humidity Channel must be numeric.
See 'Settings' sheet."
End If
If Not OK Then MsgBox description, vbCritical, "Error: Invalid settings!"
Call writeOnRange("LastSaved", "Never")
Call writeOnRange("LastSavedTime", "Never")

63
End If
If OK Then
chTempertature = ReadRange("ChannelTemperature")
chCO2 = ReadRange("ChannelCO2")
chAirFlow = ReadRange("ChannelAirFlow")
chRH = ReadRange("ChannelRH")
End If init = OK
End Function
'+------------------------------------------ getLastRow ----------------------------------------------
'| Finds the first empty data row. Starting from "startingRow" and seeking in the port
column for the
'| first empty cell.
'+----------------------------------------------------------------------------------------------------
Private Function getLastRow()
Dim ready As Boolean, sheet As Worksheet, row As Long
Set sheet = Worksheets(sheetName)
row = startingRow
While Not ready
If IsEmpty(sheet.Range(colPort & row)) Then
ready = True
Else
row = row + 1
End If Wend
getLastRow = row
End Function
'+--------------------------------------- CheckNameExists --------------------------------------------
'| Checks if a Name on the book exists, if not exists write an error message on
"errorDescription" var
'+---------------------------------------------------------------------------------------------------- Private Function CheckNameExists(rangeName As String, ByRef errorDescription As String)
As Boolean
Dim temp
CheckNameExists = True
On Error GoTo NotExists
temp = thisBook.Names(rangeName)
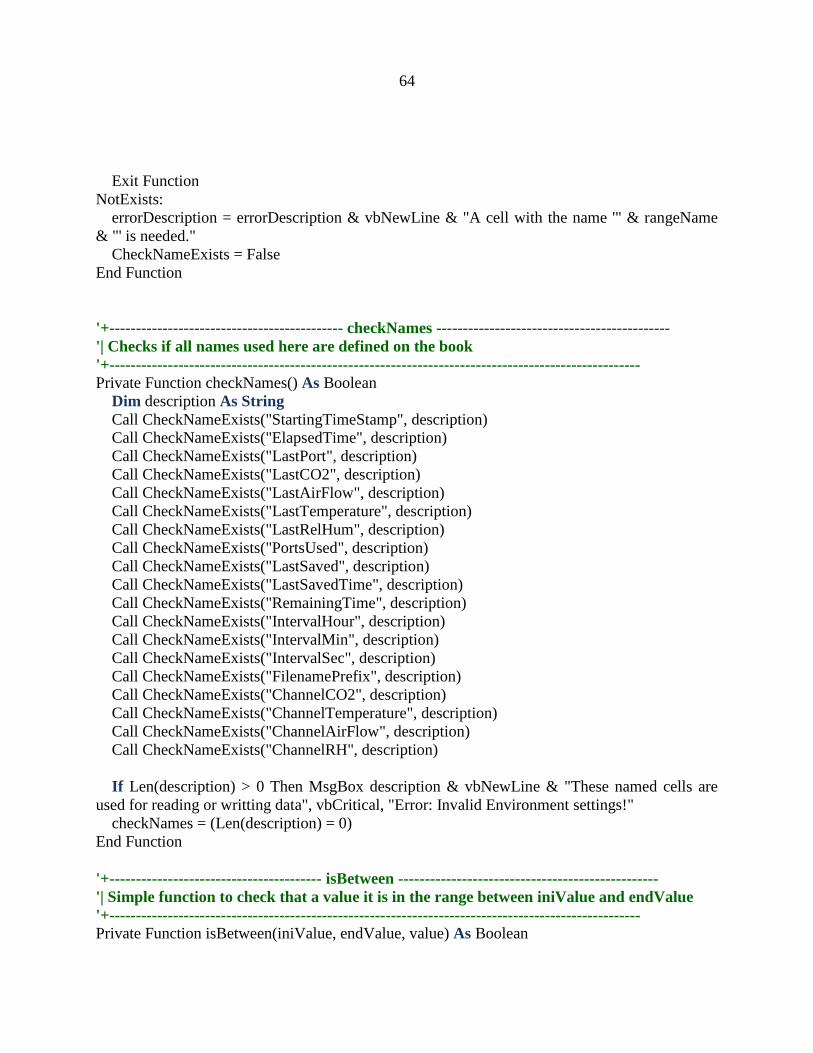
64
Exit Function
NotExists:
errorDescription = errorDescription & vbNewLine & "A cell with the name '" & rangeName
& "' is needed."
CheckNameExists = False
End Function
'+-------------------------------------------- checkNames --------------------------------------------
'| Checks if all names used here are defined on the book
'+----------------------------------------------------------------------------------------------------
Private Function checkNames() As Boolean
Dim description As String
Call CheckNameExists("StartingTimeStamp", description)
Call CheckNameExists("ElapsedTime", description)
Call CheckNameExists("LastPort", description)
Call CheckNameExists("LastCO2", description)
Call CheckNameExists("LastAirFlow", description)
Call CheckNameExists("LastTemperature", description)
Call CheckNameExists("LastRelHum", description)
Call CheckNameExists("PortsUsed", description)
Call CheckNameExists("LastSaved", description)
Call CheckNameExists("LastSavedTime", description)
Call CheckNameExists("RemainingTime", description)
Call CheckNameExists("IntervalHour", description)
Call CheckNameExists("IntervalMin", description)
Call CheckNameExists("IntervalSec", description)
Call CheckNameExists("FilenamePrefix", description)
Call CheckNameExists("ChannelCO2", description)
Call CheckNameExists("ChannelTemperature", description)
Call CheckNameExists("ChannelAirFlow", description)
Call CheckNameExists("ChannelRH", description)
If Len(description) > 0 Then MsgBox description & vbNewLine & "These named cells are
used for reading or writting data", vbCritical, "Error: Invalid Environment settings!"
checkNames = (Len(description) = 0)
End Function
'+---------------------------------------- isBetween -------------------------------------------------
'| Simple function to check that a value it is in the range between iniValue and endValue
'+----------------------------------------------------------------------------------------------------
Private Function isBetween(iniValue, endValue, value) As Boolean

65
isBetween = True
If Not IsNumeric(value) Then 'Check a numerical value
isBetween = False
Else
If value < CInt(iniValue) Or value > CInt(endValue) Then isBetween = False
End If End Function
'+---------------------------------------- ReadRange -------------------------------------------------
'| reads and returns data from a range
'+----------------------------------------------------------------------------------------------------
Private Function ReadRange(rangeName As String) As Variant
ReadRange = thisBook.Names(rangeName).RefersToRange
End Function
'+---------------------------------------- writeOnRange -------------------------------------------------
'| write data on a range name or range address
'+----------------------------------------------------------------------------------------------------
Private Sub writeOnRange(rangeName As String, value As Variant)
thisBook.Sheets(sheetName).Range(rangeName) = value
End Sub
'+---------------------------------------- saveBook -------------------------------------------------
'| Saves the book if not name is defined, or do a "Save as" command if name is given
'| Print the time when was Saved and how Long it took
'+----------------------------------------------------------------------------------------------------
Private Function saveBook(Optional bookName As String = "") As Long
Dim timestamp
timestamp = Timer
If Len(bookName) > 0 Then
thisBook.Saveas bookName
Else
thisBook.Save
End If
Call writeOnRange("LastSaved", Now)
Call writeOnRange("LastSavedTime", Format((Timer - timestamp), "Standard") & " sec")
saveBook = Timer - timestamp
End Function
'+---------------------------------------- loadPortsData ---------------------------------------------

66
'| Loads ports data:
'| Ports names on global portNames array defined
'| Ports samples on global portSamples array defined
'+----------------------------------------------------------------------------------------------------
Private Function loadPortsData()
Dim portNum As Integer , port As Integer , table As Range, portCount As Integer
Set table = thisBook.Worksheets("Settings").ListObjects("Ports").Range
portCount = ReadRange("PortsUsed")
ReDim portNames(portCount)
ReDim portWeight(portCount)
ReDim portLastCO2(portCount)
ReDim portControl(portCount)
ReDim portlastAirf(portCount)
On Error GoTo NotValid
For port = 0 To portCount - 1
portLastCO2(port) = Null
portlastAirf(port) = Null
portNum = table.Cells((port + 2), 1) 'Column 1 port number
If (port + 1 <> portNum) Then GoTo NotValid 'Check If the row equals the port
number
portNames(port) = table.Cells((port + 2), 2) 'Column 2 port name
portControl(port) = table.Cells((port + 2), 3) 'Column 3 control port number
portWeight(port) = table.Cells((port + 2), 4) 'Column 4 port sample weight
GoTo Continue
NotValid:
portNames(port) = "Unknown"
portControl(port) = 1 'Default uses 1
Continue:
Next
End Function
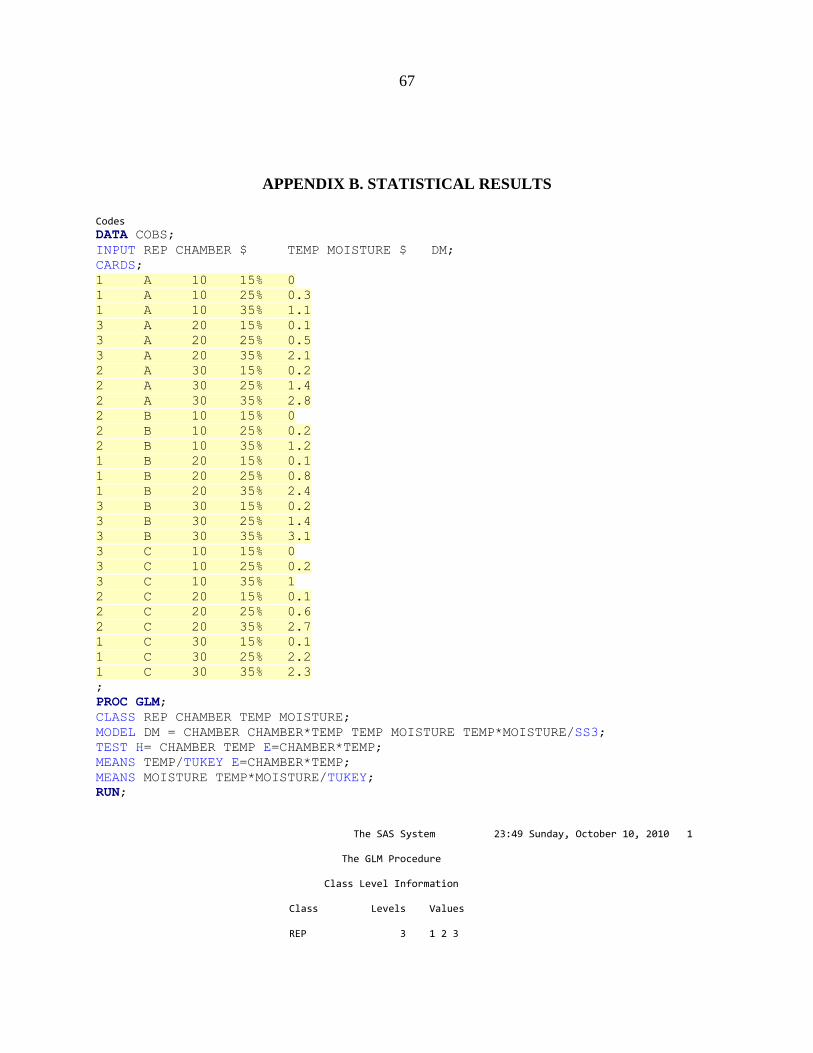
67
APPENDIX B. STATISTICAL RESULTS
Codes
DATA COBS;
INPUT REP CHAMBER $ TEMP MOISTURE $ DM;
CARDS;
1 A 10 15% 0
1 A 10 25% 0.3
1 A 10 35% 1.1
3 A 20 15% 0.1
3 A 20 25% 0.5
3 A 20 35% 2.1
2 A 30 15% 0.2
2 A 30 25% 1.4
2 A 30 35% 2.8
2 B 10 15% 0
2 B 10 25% 0.2
2 B 10 35% 1.2
1 B 20 15% 0.1
1 B 20 25% 0.8
1 B 20 35% 2.4
3 B 30 15% 0.2
3 B 30 25% 1.4
3 B 30 35% 3.1
3 C 10 15% 0
3 C 10 25% 0.2
3 C 10 35% 1
2 C 20 15% 0.1
2 C 20 25% 0.6
2 C 20 35% 2.7
1 C 30 15% 0.1
1 C 30 25% 2.2
1 C 30 35% 2.3
;
PROC GLM;
CLASS REP CHAMBER TEMP MOISTURE;
MODEL DM = CHAMBER CHAMBER*TEMP TEMP MOISTURE TEMP*MOISTURE/SS3;
TEST H= CHAMBER TEMP E=CHAMBER*TEMP;
MEANS TEMP/TUKEY E=CHAMBER*TEMP;
MEANS MOISTURE TEMP*MOISTURE/TUKEY;
RUN;
The SAS System 23:49 Sunday, October 10, 2010 1 The GLM Procedure Class Level Information Class Levels Values REP 3 1 2 3
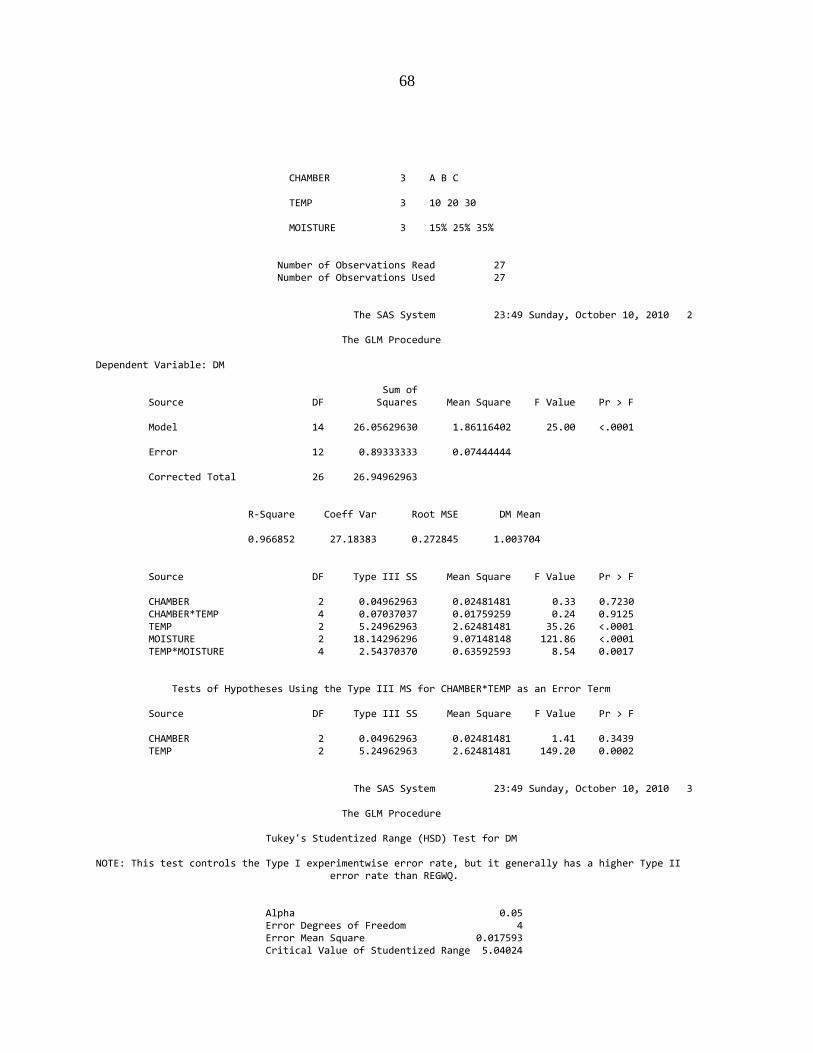
68
CHAMBER 3 A B C TEMP 3 10 20 30 MOISTURE 3 15% 25% 35% Number of Observations Read 27 Number of Observations Used 27 The SAS System 23:49 Sunday, October 10, 2010 2 The GLM Procedure Dependent Variable: DM Sum of Source DF Squares Mean Square F Value Pr > F Model 14 26.05629630 1.86116402 25.00 <.0001 Error 12 0.89333333 0.07444444 Corrected Total 26 26.94962963 R-Square Coeff Var Root MSE DM Mean 0.966852 27.18383 0.272845 1.003704 Source DF Type III SS Mean Square F Value Pr > F CHAMBER 2 0.04962963 0.02481481 0.33 0.7230 CHAMBER*TEMP 4 0.07037037 0.01759259 0.24 0.9125 TEMP 2 5.24962963 2.62481481 35.26 <.0001 MOISTURE 2 18.14296296 9.07148148 121.86 <.0001 TEMP*MOISTURE 4 2.54370370 0.63592593 8.54 0.0017 Tests of Hypotheses Using the Type III MS for CHAMBER*TEMP as an Error Term Source DF Type III SS Mean Square F Value Pr > F CHAMBER 2 0.04962963 0.02481481 1.41 0.3439 TEMP 2 5.24962963 2.62481481 149.20 0.0002 The SAS System 23:49 Sunday, October 10, 2010 3 The GLM Procedure Tukey's Studentized Range (HSD) Test for DM NOTE: This test controls the Type I experimentwise error rate, but it generally has a higher Type II error rate than REGWQ. Alpha 0.05 Error Degrees of Freedom 4 Error Mean Square 0.017593 Critical Value of Studentized Range 5.04024
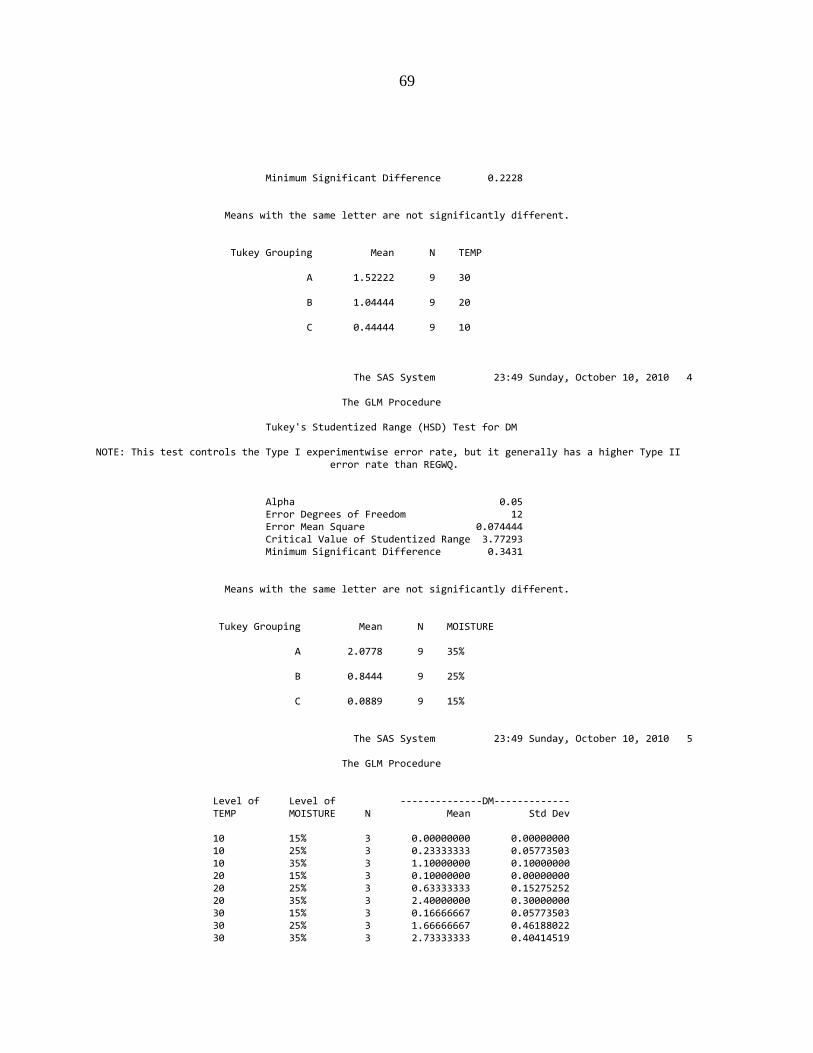
69
Minimum Significant Difference 0.2228 Means with the same letter are not significantly different. Tukey Grouping Mean N TEMP A 1.52222 9 30 B 1.04444 9 20 C 0.44444 9 10 The SAS System 23:49 Sunday, October 10, 2010 4 The GLM Procedure Tukey's Studentized Range (HSD) Test for DM NOTE: This test controls the Type I experimentwise error rate, but it generally has a higher Type II error rate than REGWQ. Alpha 0.05 Error Degrees of Freedom 12 Error Mean Square 0.074444 Critical Value of Studentized Range 3.77293 Minimum Significant Difference 0.3431 Means with the same letter are not significantly different. Tukey Grouping Mean N MOISTURE A 2.0778 9 35% B 0.8444 9 25% C 0.0889 9 15% The SAS System 23:49 Sunday, October 10, 2010 5 The GLM Procedure Level of Level of --------------DM------------- TEMP MOISTURE N Mean Std Dev 10 15% 3 0.00000000 0.00000000 10 25% 3 0.23333333 0.05773503 10 35% 3 1.10000000 0.10000000 20 15% 3 0.10000000 0.00000000 20 25% 3 0.63333333 0.15275252 20 35% 3 2.40000000 0.30000000 30 15% 3 0.16666667 0.05773503 30 25% 3 1.66666667 0.46188022 30 35% 3 2.73333333 0.40414519

70
DM 'Clear Log; Clear output;';
PROC IMPORT OUT= WORK.CORN
DATAFILE= "C:\Documents and Settings\bernidc\My Documents\Datos
para correr en SAS COBS EXPERIMENT.csv"
DBMS=CSV REPLACE;
GETNAMES=YES;
DATAROW=2;
RUN;
Data Corn2;
Set Corn;
If (Temp = 10) And (Run = 1) Then Chamber = 'A';
If (Temp = 20) And (Run = 1) Then Chamber = 'B';
If (Temp = 30) And (Run = 1) Then Chamber = 'C';
If (Temp = 10) And (Run = 2) Then Chamber = 'B';
If (Temp = 20) And (Run = 2) Then Chamber = 'C';
If (Temp = 30) And (Run = 2) Then Chamber = 'A';
If (Temp = 10) And (Run = 3) Then Chamber = 'C';
If (Temp = 20) And (Run = 3) Then Chamber = 'A';
If (Temp = 30) And (Run = 3) Then Chamber = 'B';
Proc Print Data= Corn2;
Proc Mixed Data = Corn2 Method = Type3;
Class Run Temp Material Moisture Chamber;
Model DM = Chamber Temp Moisture Temp*Moisture/ DDFM = Satterthwaite;;
Random Chamber*Temp;
LSMeans Temp Moisture / Adjust = Tukey;
LSMeans Temp*Moisture / diff;
Where Day = 21 And Material = 'Cobs';
Run;
Quit;
---------------------------------------------------------------- The SAS System 10:57 Friday, June 11, 2010 775 The Mixed Procedure Model Information Data Set WORK.CORN2 Dependent Variable DM Covariance Structure Variance Components Estimation Method Type 3 Residual Variance Method Factor Fixed Effects SE Method Model-Based Degrees of Freedom Method Satterthwaite Class Level Information Class Levels Values

71
Run 3 1 2 3 Temp 3 10 20 30 Material 1 Cobs Moisture 3 15% 25% 35% Chamber 3 A B C Dimensions Covariance Parameters 2 Columns in X 19 Columns in Z 9 Subjects 1 Max Obs Per Subject 27 Number of Observations Number of Observations Read 27 Number of Observations Used 27 Number of Observations Not Used 0 Type 3 Analysis of Variance Sum of Source DF Squares Mean Square Chamber 2 0.049630 0.024815 Temp 2 5.249630 2.624815 Moisture 2 18.142963 9.071481 Temp*Moisture 4 2.543704 0.635926 Temp*Chamber 4 0.070370 0.017593 Residual 12 0.893333 0.074444 Type 3 Analysis of Variance Source Expected Mean Square Chamber Var(Residual) + 3 Var(Temp*Chamber) + Q(Chamber) Temp Var(Residual) + 3 Var(Temp*Chamber) + Q(Temp,Temp*Moisture) Moisture Var(Residual) + Q(Moisture,Temp*Moisture) Temp*Moisture Var(Residual) + Q(Temp*Moisture) Temp*Chamber Var(Residual) + 3 Var(Temp*Chamber) Residual Var(Residual) Type 3 Analysis of Variance Error Source Error Term DF F Value Pr > F Chamber MS(Temp*Chamber) 4 1.41 0.3439 Temp MS(Temp*Chamber) 4 149.20 0.0002 Moisture MS(Residual) 12 121.86 <.0001 Temp*Moisture MS(Residual) 12 8.54 0.0017 Temp*Chamber MS(Residual) 12 0.24 0.9125 Residual . . . . Covariance Parameter Estimates

72
Cov Parm Estimate Temp*Chamber -0.01895 Residual 0.07444 ---------------------------------------------------------------- The SAS System 10:57 Friday, June 11, 2010 776 The Mixed Procedure Fit Statistics -2 Res Log Likelihood 11.3 AIC (smaller is better) 15.3 AICC (smaller is better) 16.2 BIC (smaller is better) 15.7 Type 3 Tests of Fixed Effects Num Den Effect DF DF F Value Pr > F Chamber 2 4 1.41 0.3439 Temp 2 4 149.20 0.0002 Moisture 2 12 121.86 <.0001 Temp*Moisture 4 12 8.54 0.0017 Least Squares Means Standard Effect Temp Moisture Estimate Error DF Temp 10 0.4444 0.04421 4 Temp 20 1.0444 0.04421 4 Temp 30 1.5222 0.04421 4 Moisture 15% 0.08889 0.07852 14.4 Moisture 25% 0.8444 0.07852 14.4 Moisture 35% 2.0778 0.07852 14.4 Temp*Moisture 10 15% -444E-18 0.1360 14.4 Temp*Moisture 10 25% 0.2333 0.1360 14.4 Temp*Moisture 10 35% 1.1000 0.1360 14.4 Temp*Moisture 20 15% 0.1000 0.1360 14.4 Temp*Moisture 20 25% 0.6333 0.1360 14.4 Temp*Moisture 20 35% 2.4000 0.1360 14.4 Temp*Moisture 30 15% 0.1667 0.1360 14.4 Temp*Moisture 30 25% 1.6667 0.1360 14.4 Temp*Moisture 30 35% 2.7333 0.1360 14.4 Least Squares Means Effect Temp Moisture t Value Pr > |t| Temp 10 10.05 0.0006 Temp 20 23.62 <.0001 Temp 30 34.43 <.0001 Moisture 15% 1.13 0.2761 Moisture 25% 10.75 <.0001 Moisture 35% 26.46 <.0001 Temp*Moisture 10 15% -0.00 1.0000

73
Temp*Moisture 10 25% 1.72 0.1077 Temp*Moisture 10 35% 8.09 <.0001 Temp*Moisture 20 15% 0.74 0.4740 Temp*Moisture 20 25% 4.66 0.0003 Temp*Moisture 20 35% 17.65 <.0001 Temp*Moisture 30 15% 1.23 0.2401 Temp*Moisture 30 25% 12.25 <.0001 Temp*Moisture 30 35% 20.10 <.0001 Differences of Least Squares Means Effect Temp Moisture _Temp _Moisture Temp 10 20 Temp 10 30 Temp 20 30 Moisture 15% 25% Moisture 15% 35% Moisture 25% 35% Temp*Moisture 10 15% 10 25% Temp*Moisture 10 15% 10 35% Temp*Moisture 10 15% 20 15% Temp*Moisture 10 15% 20 25% Temp*Moisture 10 15% 20 35% Temp*Moisture 10 15% 30 15% Temp*Moisture 10 15% 30 25% Temp*Moisture 10 15% 30 35% Temp*Moisture 10 25% 10 35% Temp*Moisture 10 25% 20 15% Temp*Moisture 10 25% 20 25% Temp*Moisture 10 25% 20 35% Temp*Moisture 10 25% 30 15% Temp*Moisture 10 25% 30 25% Temp*Moisture 10 25% 30 35% Temp*Moisture 10 35% 20 15% Temp*Moisture 10 35% 20 25% Temp*Moisture 10 35% 20 35% Temp*Moisture 10 35% 30 15% Temp*Moisture 10 35% 30 25% Temp*Moisture 10 35% 30 35% Temp*Moisture 20 15% 20 25% Temp*Moisture 20 15% 20 35% Temp*Moisture 20 15% 30 15% Temp*Moisture 20 15% 30 25% Temp*Moisture 20 15% 30 35% Temp*Moisture 20 25% 20 35% Temp*Moisture 20 25% 30 15% Temp*Moisture 20 25% 30 25% Temp*Moisture 20 25% 30 35% Temp*Moisture 20 35% 30 15% Temp*Moisture 20 35% 30 25% Temp*Moisture 20 35% 30 35% Temp*Moisture 30 15% 30 25% Temp*Moisture 30 15% 30 35% Temp*Moisture 30 25% 30 35% Differences of Least Squares Means Standard Effect Temp Moisture Estimate Error DF Temp 10 -0.6000 0.06253 4

74
Temp 10 -1.0778 0.06253 4 Temp 20 -0.4778 0.06253 4 Moisture 15% -0.7556 0.1286 12 Moisture 15% -1.9889 0.1286 12 Moisture 25% -1.2333 0.1286 12 Temp*Moisture 10 15% -0.2333 0.2228 12 Temp*Moisture 10 15% -1.1000 0.2228 12 Temp*Moisture 10 15% -0.1000 0.1923 14.4 Temp*Moisture 10 15% -0.6333 0.1923 14.4 Temp*Moisture 10 15% -2.4000 0.1923 14.4 Temp*Moisture 10 15% -0.1667 0.1923 14.4 Temp*Moisture 10 15% -1.6667 0.1923 14.4 Temp*Moisture 10 15% -2.7333 0.1923 14.4 Temp*Moisture 10 25% -0.8667 0.2228 12 Temp*Moisture 10 25% 0.1333 0.1923 14.4 Temp*Moisture 10 25% -0.4000 0.1923 14.4 Temp*Moisture 10 25% -2.1667 0.1923 14.4 Temp*Moisture 10 25% 0.06667 0.1923 14.4 Temp*Moisture 10 25% -1.4333 0.1923 14.4 Temp*Moisture 10 25% -2.5000 0.1923 14.4 Temp*Moisture 10 35% 1.0000 0.1923 14.4 Temp*Moisture 10 35% 0.4667 0.1923 14.4 Temp*Moisture 10 35% -1.3000 0.1923 14.4 Temp*Moisture 10 35% 0.9333 0.1923 14.4 Temp*Moisture 10 35% -0.5667 0.1923 14.4 Temp*Moisture 10 35% -1.6333 0.1923 14.4 Temp*Moisture 20 15% -0.5333 0.2228 12 Temp*Moisture 20 15% -2.3000 0.2228 12 Temp*Moisture 20 15% -0.06667 0.1923 14.4 Temp*Moisture 20 15% -1.5667 0.1923 14.4 Temp*Moisture 20 15% -2.6333 0.1923 14.4 Temp*Moisture 20 25% -1.7667 0.2228 12 Temp*Moisture 20 25% 0.4667 0.1923 14.4 Temp*Moisture 20 25% -1.0333 0.1923 14.4 Temp*Moisture 20 25% -2.1000 0.1923 14.4 Temp*Moisture 20 35% 2.2333 0.1923 14.4 Temp*Moisture 20 35% 0.7333 0.1923 14.4 Temp*Moisture 20 35% -0.3333 0.1923 14.4 Temp*Moisture 30 15% -1.5000 0.2228 12 Temp*Moisture 30 15% -2.5667 0.2228 12 Temp*Moisture 30 25% -1.0667 0.2228 12 Differences of Least Squares Means Effect Temp Moisture t Value Pr > |t| Temp 10 -9.60 0.0007 Temp 10 -17.24 <.0001 Temp 20 -7.64 0.0016 Moisture 15% -5.87 <.0001 Moisture 15% -15.46 <.0001 Moisture 25% -9.59 <.0001 Temp*Moisture 10 15% -1.05 0.3156 Temp*Moisture 10 15% -4.94 0.0003 Temp*Moisture 10 15% -0.52 0.6110 Temp*Moisture 10 15% -3.29 0.0052 Temp*Moisture 10 15% -12.48 <.0001 Temp*Moisture 10 15% -0.87 0.4004 Temp*Moisture 10 15% -8.67 <.0001 Temp*Moisture 10 15% -14.21 <.0001 Temp*Moisture 10 25% -3.89 0.0021 Temp*Moisture 10 25% 0.69 0.4992 Temp*Moisture 10 25% -2.08 0.0559

75
Temp*Moisture 10 25% -11.26 <.0001 Temp*Moisture 10 25% 0.35 0.7339 Temp*Moisture 10 25% -7.45 <.0001 Temp*Moisture 10 25% -13.00 <.0001 Temp*Moisture 10 35% 5.20 0.0001 Temp*Moisture 10 35% 2.43 0.0289 Temp*Moisture 10 35% -6.76 <.0001 Temp*Moisture 10 35% 4.85 0.0002 Temp*Moisture 10 35% -2.95 0.0104 Temp*Moisture 10 35% -8.49 <.0001 Temp*Moisture 20 15% -2.39 0.0339 Temp*Moisture 20 15% -10.32 <.0001 Temp*Moisture 20 15% -0.35 0.7339 Temp*Moisture 20 15% -8.15 <.0001 Temp*Moisture 20 15% -13.69 <.0001 Temp*Moisture 20 25% -7.93 <.0001 Temp*Moisture 20 25% 2.43 0.0289 Temp*Moisture 20 25% -5.37 <.0001 Temp*Moisture 20 25% -10.92 <.0001 Temp*Moisture 20 35% 11.61 <.0001 Temp*Moisture 20 35% 3.81 0.0018 Temp*Moisture 20 35% -1.73 0.1044 Temp*Moisture 30 15% -6.73 <.0001 Temp*Moisture 30 15% -11.52 <.0001 Temp*Moisture 30 25% -4.79 0.0004 Differences of Least Squares Means Effect Temp Moisture Adjustment Adj P Temp 10 Tukey 0.0015 Temp 10 Tukey 0.0001 Temp 20 Tukey 0.0035 Moisture 15% Tukey-Kramer 0.0002 Moisture 15% Tukey-Kramer <.0001 Moisture 25% Tukey-Kramer <.0001 Temp*Moisture 10 15% . Temp*Moisture 10 15% . Temp*Moisture 10 15% . Temp*Moisture 10 15% . Temp*Moisture 10 15% . Temp*Moisture 10 15% . Temp*Moisture 10 15% . Temp*Moisture 10 15% . Temp*Moisture 10 25% . Temp*Moisture 10 25% . Temp*Moisture 10 25% . Temp*Moisture 10 25% . Temp*Moisture 10 25% . Temp*Moisture 10 25% . Temp*Moisture 10 25% . Temp*Moisture 10 35% . Temp*Moisture 10 35% . Temp*Moisture 10 35% . Temp*Moisture 10 35% . Temp*Moisture 10 35% . Temp*Moisture 10 35% . Temp*Moisture 20 15% . Temp*Moisture 20 15% . Temp*Moisture 20 15% . Temp*Moisture 20 15% . Temp*Moisture 20 15% . Temp*Moisture 20 25% .

76
Temp*Moisture 20 25% . Temp*Moisture 20 25% . Temp*Moisture 20 25% . Temp*Moisture 20 35% . Temp*Moisture 20 35% . Temp*Moisture 20 35% . Temp*Moisture 30 15% . Temp*Moisture 30 15% . Temp*Moisture 30 25% .
PROC GLM;
CLASS REP CHAMBER TEMP MOISTURE;
MODEL DM = CHAMBER CHAMBER*TEMP TEMP MOISTURE TEMP*MOISTURE/SS3;
TEST H= CHAMBER TEMP E=CHAMBER*TEMP;
MEANS TEMP/TUKEY E=CHAMBER*TEMP;
MEANS MOISTURE TEMP*MOISTURE/TUKEY;
RUN;
The SAS System 23:49 Sunday, October 10, 2010 1 The GLM Procedure Class Level Information Class Levels Values REP 3 1 2 3 CHAMBER 3 A B C TEMP 3 10 20 30 MOISTURE 3 15% 25% 35% Number of Observations Read 27 Number of Observations Used 27 The SAS System 23:49 Sunday, October 10, 2010 2 The GLM Procedure Dependent Variable: DM Sum of Source DF Squares Mean Square F Value Pr > F Model 14 26.05629630 1.86116402 25.00 <.0001 Error 12 0.89333333 0.07444444 Corrected Total 26 26.94962963 R-Square Coeff Var Root MSE DM Mean

77
0.966852 27.18383 0.272845 1.003704 Source DF Type III SS Mean Square F Value Pr > F CHAMBER 2 0.04962963 0.02481481 0.33 0.7230 CHAMBER*TEMP 4 0.07037037 0.01759259 0.24 0.9125 TEMP 2 5.24962963 2.62481481 35.26 <.0001 MOISTURE 2 18.14296296 9.07148148 121.86 <.0001 TEMP*MOISTURE 4 2.54370370 0.63592593 8.54 0.0017 Tests of Hypotheses Using the Type III MS for CHAMBER*TEMP as an Error Term Source DF Type III SS Mean Square F Value Pr > F CHAMBER 2 0.04962963 0.02481481 1.41 0.3439 TEMP 2 5.24962963 2.62481481 149.20 0.0002 The SAS System 23:49 Sunday, October 10, 2010 3 The GLM Procedure Tukey's Studentized Range (HSD) Test for DM NOTE: This test controls the Type I experimentwise error rate, but it generally has a higher Type II error rate than REGWQ. Alpha 0.05 Error Degrees of Freedom 4 Error Mean Square 0.017593 Critical Value of Studentized Range 5.04024 Minimum Significant Difference 0.2228 Means with the same letter are not significantly different. Tukey Grouping Mean N TEMP A 1.52222 9 30 B 1.04444 9 20 C 0.44444 9 10
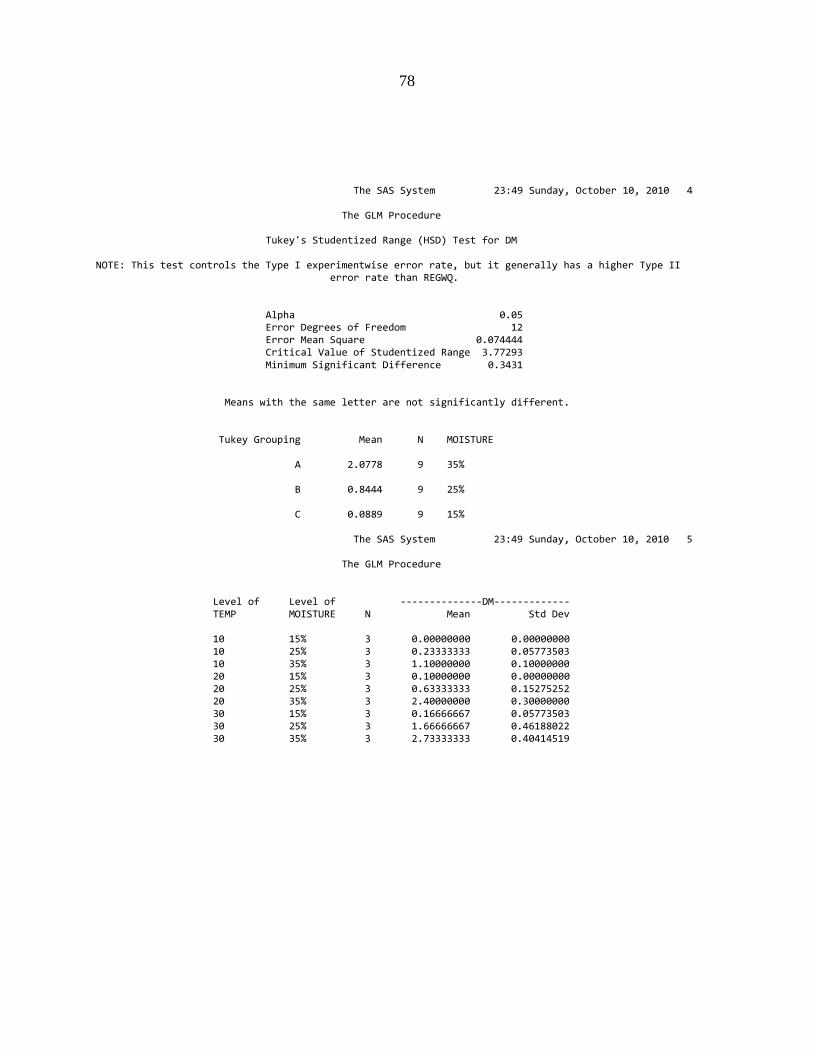
78
The SAS System 23:49 Sunday, October 10, 2010 4 The GLM Procedure Tukey's Studentized Range (HSD) Test for DM NOTE: This test controls the Type I experimentwise error rate, but it generally has a higher Type II error rate than REGWQ. Alpha 0.05 Error Degrees of Freedom 12 Error Mean Square 0.074444 Critical Value of Studentized Range 3.77293 Minimum Significant Difference 0.3431 Means with the same letter are not significantly different. Tukey Grouping Mean N MOISTURE A 2.0778 9 35% B 0.8444 9 25% C 0.0889 9 15% The SAS System 23:49 Sunday, October 10, 2010 5 The GLM Procedure Level of Level of --------------DM------------- TEMP MOISTURE N Mean Std Dev 10 15% 3 0.00000000 0.00000000 10 25% 3 0.23333333 0.05773503 10 35% 3 1.10000000 0.10000000 20 15% 3 0.10000000 0.00000000 20 25% 3 0.63333333 0.15275252 20 35% 3 2.40000000 0.30000000 30 15% 3 0.16666667 0.05773503 30 25% 3 1.66666667 0.46188022 30 35% 3 2.73333333 0.40414519

79
ACKNOWLEDGEMENTS
I would like to thank all those who helped me in the conduction of my research and writing
of the thesis. Dr. Thomas Brumm specially, for his long term support and tutoring throughout my
masters program, Dr. Carl Bern for his relentless inputs and help, from my friend Che Nyendu that
assisted me in several times trouble shooting codes and transistor, and certainly Dr. Russell Mullen
and Dr. Theodore Bailey for their help and inputs on my research during the process.