corporate leverage in emerging asia · corporate leverage in emerging asia1 ... kowloon, hong kong....
TRANSCRIPT

BIS Papers No 91 65
Corporate leverage in emerging Asia1
Vidhan Goyal2 and Frank Packer3
Abstract
This paper examines the leverage of firms of seven economies in emerging Asia – Hong Kong SAR, Indonesia, Korea, Malaysia, the Philippines, Singapore and Thailand – between 1991 and 2015. For the sample as a whole, neither the mean nor median, nor the upper tails of the leverage distribution show any upward shift in recent years. Corporate leverage appears quite stable across most jurisdictions, but not all. Standard firm characteristics such as asset tangibility and size explain leverage differences across the whole sample and within jurisdiction. Factors that help to overcome informational asymmetries may be less important in jurisdictions with stronger institutions.
Keywords: corporate finance, capital structure, leverage
JEL classification: G30, G32
1 We thank Dragon Tang, Madhusudan Mohanty, and participants at the BIS workshop and the BNM-
BIS conference on “Financial Systems and the Real Economy” in Hong Kong SAR in July 2015 and in Kuala Lumpur, in October 2016, respectively, for helpful comments. We thank also participants of a seminar organised by the Puey Ungphakorn Institute for Economic Research, Bank of Thailand. We also acknowledge the invaluable research assistance of Steven Kong and Harry Leung. Vidhan Goyal acknowledges the support of the BIS. The views expressed in this paper are those of the authors and not necessarily those of the BIS.
2 Professor of Finance, Department of Finance, Hong Kong University of Science and Technology, Clear Water Bay, Kowloon, Hong Kong. E-mail: [email protected].
3 Regional Adviser, Bank for International Settlements, Representative Office for Asia and the Pacific, Hong Kong. E-mail: [email protected].

66 BIS Papers No 91
1. Introduction
The rising debt burdens of corporations in emerging market economies (EMEs) are of increasing concern to policymakers and market participants alike. The non-financial corporate debt of EMEs rose from 58% of GDP in 2007 to 96% in 2015, surpassing the ratio in advanced economies (See Graph 1 based on data from the Bank for International Settlements (2016)). The accumulation of corporate debt has been even more marked in the subsample of EMEs in Asia-Pacific. Trends such as these hark back to the Asian financial crisis of the late 1990s, memories of which still linger in the region.4
Corporate debt is best viewed as high or low relative to the assets – including equity – that are available to support that debt. For that reason, we focus on corporate leverage measures that take into account such support, estimated both with book and market values of equity. Moreover, we look beyond averages to focus on leverage distributions in assessing system vulnerabilities. In particular, changes in leverage of the upper tail of leverage distribution can often be more informative about the sensitivity of bankruptcy rates and financial distress to aggregate shocks. In this respect, we follow the analysis of Bernanke and Campbell (1988), who addressed widespread worries about the rise of US corporate debt in the late 1980s.
Our focus is on examining the capital structure decisions of listed firms in emerging Asia with a view to understanding the extent to which recent increases in debt have outpaced those of equity and historical norms. In the process, we also provide a more granular understanding of the determinants of debt levels and debt changes of firms in Asia. Our analysis is based on publicly listed firms in Hong Kong
4 Although macroprudential policies have been enacted in many jurisdictions to control the quality,
quantity and procyclicality of lending, these measures frequently target household mortgage debt rather than the provision of credit to corporations. In addition, corporations are increasingly relying on bond markets and in particular, foreign bond markets, which are often out of reach of the macroprudential policymakers. In what has been identified as the “second phase of global liquidity”, bond markets have assumed a greater role in transmitting global financial conditions across borders. See Shin (2013).
Corporate debt of advanced economies and emerging market economies
As a percentage of GDP Graph 1
0
25
50
75
100
2007 2010 2015
Advanced economies Emerging market economies Emerging market economies - Asia

BIS Papers No 91 67
SAR, Indonesia, Korea, Malaysia, the Philippines, Singapore and Thailand, and covers the period from 1991 to 2015.
Our results can be summarised as follows:
1. For the sample as a whole, when corporate debt is measured relative to assets, we find little evidence of an increase in leverage in the more recent period. While corporate debt has increased, so have assets including both book and market equity on firms’ balance sheets. Contrary to the more common view that Asian firms have become excessively leveraged in recent years, we find that corporate leverage across the entire sample of Asian firms is remarkably stable. This contrasts sharply with what we observed ahead of the Asian financial crisis of the late 1990s.
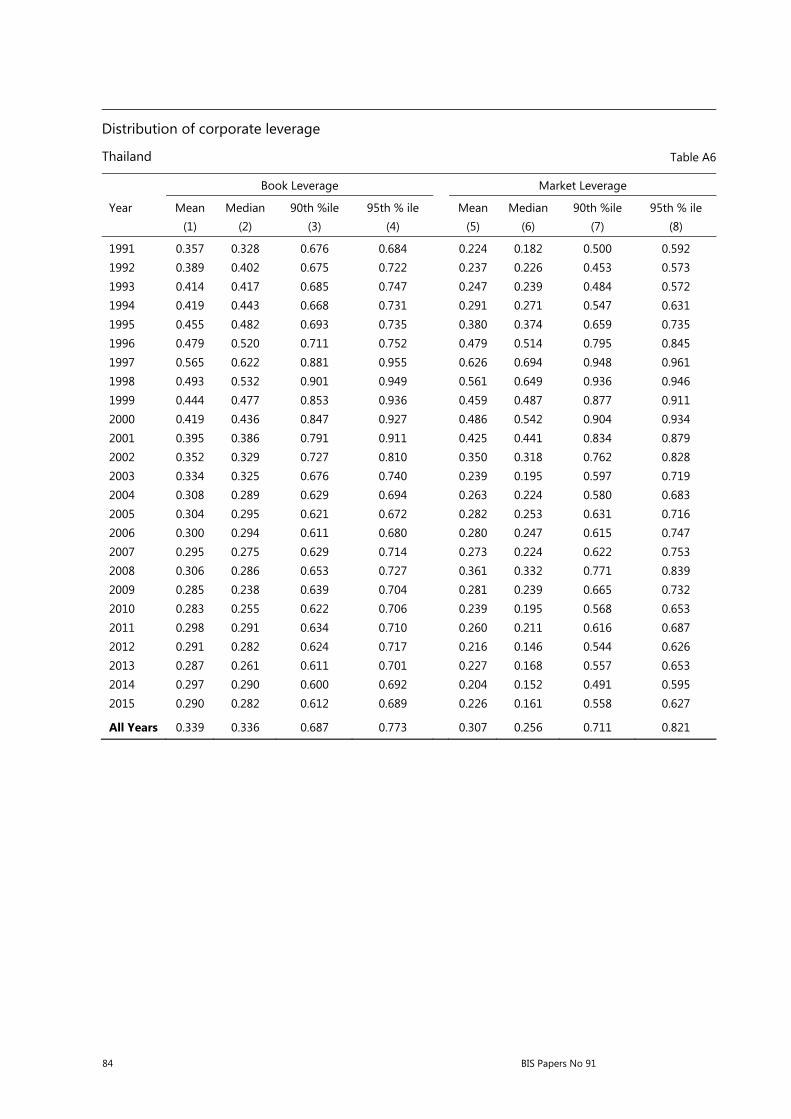
2. Over the past half-decade as well as earlier, firms in Indonesia, Korea and Thailand have carried relatively more debt than firms in Hong Kong SAR, Malaysia, the Philippines and Singapore. But among these three economies with high firm-level leverage, the current average debt levels are much lower than those observed prior to the Asian financial crisis. Market leverage did increase during the recent global financial crisis, but these are largely an artefact of a transitory drop in equity values of firms during the crisis. In the more recent period from 2010, both book and market leverage are similar to levels observed in the previous decade.
3. For the entire sample, the 90th and 95th percentiles of the distributions of leverage do not seem to have increased faster than the median. In other words, there is no tendency for the upper tail of distribution of leverage to have shifted out. However, for the individual jurisdictions of Hong Kong SAR, Singapore and the Philippines, book leverage measured at the higher ends of the distribution has risen over the past five years, and is over or close to all-time highs for those jurisdictions. It remains to be seen whether or not this is due to the changing industry composition of firms in those jurisdictions.
4. Among firms listed in Hong Kong SAR, there is a noticeable difference between firms headquartered locally in Hong Kong SAR over the sample period, and those headquartered elsewhere, almost all in mainland China. Not only is leverage much higher among non-local firms, but the recent increases to high levels are more marked.
5. Leverage is positively related to industry median leverage, firm size and tangibility of assets, and negatively related to profitability and market-to-book assets ratio. Firm characteristics explain a significantly greater proportion of cross-sectional variation in leverage in Indonesia, Korea, the Philippines and Thailand and less so in other jurisdictions. We surmise that firm characteristics such as firm size and tangibility are more weakly related to leverage in countries that are more developed and have stronger institutions.
The remainder of the paper proceeds as follows. We review the relevant empirical and theoretical literature in Section 2. In Section 3, we describe and summarise the corporate finance, country and global data employed in the study. Section 4 sets up and reports estimates from regressions of leverage on firm characteristics. We conclude with a summary of findings and issues for further investigation in Section 5.

68 BIS Papers No 91
2. Literature review
The determinants of the capital structure of firms internationally are an increasingly well researched topic. Despite the institutional differences in financial systems documented among countries, Rajan and Zingales (1995) identified four firm factors which had been important in studies focused in the United States – size, profitability, asset tangibility and market-to-book ratios – to be also generally important in regressions of G7 countries. Motivated by the work on US firms by Frank and Goyal (2009), two additional factors, median industry leverage and inflation, have been added to the set of “reliably important” factors for international firms (Öztekin (2015)). Other work focuses on institutional development and swings in risk-taking and global liquidity in determining international corporate leverage, but these are not the focus of this paper.5
Studies assessing the determinants of leverage have also frequently tested theories of corporate capital structure, most commonly the trade-off theory which sees capital structure as a balance of tax advantages versus the higher agency and bankruptcy costs that generally accrue to debt contracts (Myers (1977) and Stulz (1990)), as well as the pecking order theory which sees internal finance as usually preferred to external finance because of costs related to adverse selection costs, and debt finance as preferred to equity among external financing methods (Myers (1984) and Myers and Majluf (1984)). Frank and Goyal (2003) and Frank and Goyal (2009) have found the US data to be more supportive of trade-off theory than the pecking order theory; while Booth et al (2001) and Gungoraydinoglu and Öztekin (2011) have found some evidence in the international data consistent with both the trade-off and the pecking order theories. In this paper, we find the relationship of leverage with explanatory variables that is consistent with the various theories, but do not focus on the degree of explanatory power of one theory versus the other.
3. Data and summary statistics
We start with a discussion of average balance sheets of Asian firms and present a first look at cross-country differences in the asset and liability structure of firms. Section 3.1 describes our data sources and the resulting sample. Section 3.2 summarises leverage ratios and financing variables, while Section 3.3 presents summary statistics of firm characteristics. The statistics are disaggregated at the country level and for various subperiods of interest.
3.1 Data, sample and average balance sheets
Firm-level accounting data are from Worldscope and the stock market data are from Datastream. The period is 1991‒2015. In addition, we obtain country-level variables from various sources, including the Doing Business database available through the World Bank and World Economic Outlook from the IMF.
5 See Booth et al (2001), Gungoraydinoglu and Öztekin (2011) and Öztekin (2015) for an in-depth
discussion of cross-country institutional differences and leverage, and Kalemli-Ozcan et al (2012) and International Monetary Fund (2015) for the role of swings in risk-taking and global liquidity.

BIS Papers No 91 69
We exclude observations with missing or zero asset values. We also exclude financial firms (6000‒6999) and utilities (4000‒4999). We require firms to have data on book leverage and market leverage to be included in our analysis. The financial accounts are deflated using the consumer price index for each country from the World Development Indicators database from the World Bank. All ratio variables are winsorised at 0.5% in either tail of the distribution.
Table I presents the distribution of countries in our sample. The sample includes firms from Hong Kong SAR, Indonesia, Korea, Malaysia, the Philippines, Singapore and Thailand. We have 7,310 firms from seven economies with a total of 81,849 firm-year observations. The average panel length is 11.2 years. Korea has relatively more firms in the sample, while the Philippines has fewer. Despite these differences, we do not see any particular economy making an outsized influence on our sample. While the panel length varies from one year to 24 years, both the mean and median panel lengths range between nine and 12 years.
Appendix Table A1 reports the average balance sheet as a fraction of assets for publicly traded firms in each of the seven economies. Surprisingly, the balance sheets are not all that different and firms have very similar asset and liability structures despite significant differences in geography and institutions.
This is not to say that nothing stands out in this comparison. Firms in Hong Kong SAR and Singapore hold relatively more cash, have more current assets and fewer fixed assets. On the other hand, firms in the Philippines hold less cash, have fewer receivables, but significantly higher levels of fixed assets. On the liability side, we see significant differences in use of short-term debt – firms in Korea and Thailand have more short-term debt while firms in Hong Kong, the Philippines, Malaysia and Singapore have less. Firms in Indonesia and Thailand use relatively more long-term debt. Overall, debt levels are higher for firms in Indonesia, Korea and Thailand.
Sample distribution Table I
Jurisdiction # of firms # of firm-year observations
Average panel length Median panel length
Hong Kong SAR (HKG) 1,631 16,740 10.3 10.0
of which: local 1,155 12,462 10.8 11.0
non-local 476 4,278 9.0 8.0
Indonesia (IDN) 492 6,070 12.3 12.0
Korea (KOR) 1,992 20,260 10.2 10.0
Malaysia (MYS) 1,071 13,136 12.3 12.0
Philippines (PHL) 206 2,604 12.6 12.5
Singapore (SGP) 956 10,995 11.5 11.0
of which: local 718 8,098 11.3 11.0
non-local 238 2,897 12.2 10.0 Thailand (THA) 962 12,044 12.5 12.0
Total 7,310 81,849 11.2 11.0
Note: This table reports the distribution of firms and firm-year observations by country in our sample. The last two columns provide the mean and median panel length for firms in the sample. We exclude financial firms, utilities, and observations with asset values that are either missing or zero.

70 BIS Papers No 91
3.2 Leverage ratios
In the introduction, we reviewed concerns about the recent growth of debt in Asia-Pacific. However, the risks of debt outstanding are most appropriately measured relative to the assets that support them. We therefore use two leverage measures for our firm-level analysis, book leverage and market leverage. Academic opinion is divided on which is the most appropriate. Reasons for choosing book leverage include the view that assets in place provide better support to debt than growth opportunities (Myers (1977)) and the tendency of managers not to adjust capital structure in response to swings in the stock market (Graham and Harvey (2001)). Market leverage advocates view the book value of equity to be backward-looking and not managerially relevant (Welch (2004)).6
We define book leverage as the book value of debt divided by debt plus book equity. We define market leverage as the book value of debt divided by debt plus market equity. Welch (2011) argues that leverage ratios constructed using total assets suffer from the problem that total assets include the value of non-financial liabilities such as trade credit. Our leverage definitions are thus not affected by changes in non-financial liabilities. We require all firm-level leverage measures to have values between zero and one.
We start with an examination of changes over time and across countries in the mean leverage ratios for the sample firms (Table II, panels A and B). In addition to the entire period, we examine the subperiods of 1991‒98, 1999‒2007, 2008‒09 and 2010‒15. One clear point from the table is that, in sharp contrast to the rising corporate debt-to-GDP ratios discussed earlier, leverage is remarkably stable over time and across all economies. The mean leverage has steadily declined over time across the sample. With the exception of Hong Kong SAR and Singapore, where book leverage measures during the recent period are somewhat greater than those at the time of the global financial crisis, all leverage measures in the 2010–15 period are lower than they were during 2008‒09. In fact, the leverage of Asian firms is significantly below the historical numbers observed in the 1990s. Indeed, leverage was quite elevated for almost all economies before the Asian financial crisis but has since then steadily declined.
We find similar trends for both book leverage (Panel A) and market leverage (Panel B). For market leverage, firms in the recent period were significantly less levered than they were during 2008‒09. Only Singapore and Malaysia score market leverage measures that are somewhat higher than those before the Asian financial crisis.
Among the sample countries, we can divide the sample into two groups. The “high leverage” group includes firms from Indonesia, Korea and Thailand, which in terms of country long-term averages, range between 34% and 37% for book leverage and between 31% and 36% for market leverage. By contrast, the remaining four countries of Hong Kong SAR, Malaysia, the Philippines and Singapore range lower, between 25% and 27% for book leverage, and between 25% and 29% for market leverage.
6 Academic studies that examine both book and market leverage measures report that the two
measures behave similarly (Rajan and Zingales (1995), Fama and French (2002) and Leary and Roberts (2005)). DeAngelo and Roll (2015) note the high correlation between book and market leverage and conclude that “there is not much incremental information in the market series” (p 377).

BIS Papers No 91 71
Even among the high-leverage countries, leverage in Korea stood out in the early 1990s, averaging over 60% for both book and market leverage ahead of the Asian financial crisis. However, subsequent to the crisis, leverage fell below 40% to levels similar to those of Indonesia and Thailand. The average leverage of firms in those two countries also fell significantly after the Asian financial crisis, as generally did that of the other “low-leverage” jurisdictions.
By contrast, leveraging ahead of the 2008‒09 crisis is not readily apparent at the country level for our sample of country averages. The market leverage of all jurisdictions jumped in 2008‒09 across the board (the Philippines in 2008 alone), but this reflected a collapse in global equity markets, and leverage ratios continued a steady decline thereafter. Overall, the results parallel the findings of Kalemli-Ozcan et al (2012) across a sample covering firms in more than 60 countries. They concluded that “ahead of the global financial crisis there were no visible increases in leverage for the typical non-financial firm”.
On the whole, the leverage summary statistics underscore the importance of measuring debt burdens relative to the quantity of assets available to support them. Whereas in the introduction, we saw evidence of uniformly increasing corporate debt since the global financial crisis, both absolutely and compared to GDP, the increases in leverage in our sample of Asia-Pacific jurisdictions we study are much less marked
Mean leverage ratios for Asian firms, 1991–2015 Table II
Indonesia Korea Malaysia Philippines Singapore Thailand Hong Kong SAR All Firms Period
Panel A: Book Leverage
Subp
erio
ds
Book Lev 0.368 0.339 0.268 0.253 0.272 0.339 0.253 0.300
1991-1998 0.430 0.616 0.292 0.308 0.289 0.463 0.280 0.388
1999-2007 0.391 0.329 0.287 0.274 0.276 0.340 0.240 0.300
2008-2009 0.354 0.324 0.270 0.207 0.249 0.295 0.235 0.282
2010-2015 0.320 0.306 0.234 0.211 0.267 0.291 0.264 0.278
Panel B: Market Leverage
Subp
erio
ds
Market Lev 0.346 0.363 0.286 0.260 0.271 0.307 0.251 0.303
1991-1998 0.385 0.642 0.223 0.285 0.245 0.417 0.290 0.360
1999-2007 0.383 0.378 0.305 0.328 0.264 0.326 0.235 0.311
2008-2009 0.372 0.365 0.344 0.227 0.288 0.321 0.249 0.319
2010-2015 0.284 0.306 0.263 0.171 0.286 0.228 0.257 0.271
Panel C: Number of Observations - Leverage
Subp
erio
ds
Num Obs 6,070 20,260 13,136 2,604 10,995 12,044 16,740 81,849
1991-1998 1,080 1,447 1,578 441 1,619 2,047 1,666 9,878
1999-2007 2,178 7,133 5,689 1,060 4,453 4,592 6,227 31,332
2008-2009 616 2,636 1,559 257 1,323 1,273 1,905 9,569
2010-2015 2,196 9,044 4,310 846 3,600 4,132 6,942 31,070
Note: Mean leverage ratios for Asian firms. The sample period is from 1991 to 2015. The variables are defined in the Appendix.

72 BIS Papers No 91
and widespread when measured as a percentage of assets. In fact, the debt burdens for our sample of listed companies in the Asia-Pacific are generally far below what we document ahead of the Asian financial crisis and are well within historical ranges.
To be sure, mean leverage ratios based on aggregates do not capture the distribution of debt burdens across firms. To the extent we are interested in the likelihood of a surge in defaults and bankruptcies if the economies under investigation were to slow down or be hit by a shock, it makes sense to also examine the upper tails of the distribution in terms of leverage. Table III reports the mean, median, 90th and 95th percentiles of book and market leverage by year for the entire sample. Both book and market leverage rose sharply in the mid- to late 1990s. Leverage then declined following the Asian financial crisis – both for the median firm but also for firms in the upper tails of the distribution. There has been no significant trend in both leverage measures since then. Even in 2015, when mean and median book leverage rose, similar measures of market leverage declined.
Distribution of corporate leverage Table III
Book Leverage Market Leverage
Year Mean Median 90th %ile 95th % ile Mean Median 90th %ile 95th % ile (1) (2) (3) (4) (5) (6) (7) (8)
1991 0.307 0.278 0.676 0.747 0.255 0.182 0.667 0.771 1992 0.330 0.306 0.676 0.762 0.259 0.199 0.615 0.758 1993 0.359 0.362 0.685 0.763 0.246 0.192 0.598 0.704 1994 0.362 0.359 0.681 0.757 0.274 0.238 0.587 0.671 1995 0.376 0.391 0.687 0.747 0.319 0.280 0.678 0.761 1996 0.399 0.412 0.712 0.774 0.354 0.317 0.752 0.828 1997 0.449 0.459 0.828 0.884 0.494 0.513 0.910 0.951 1998 0.421 0.415 0.815 0.900 0.483 0.519 0.890 0.942 1999 0.369 0.351 0.752 0.853 0.386 0.365 0.810 0.884 2000 0.337 0.314 0.709 0.834 0.400 0.369 0.846 0.912 2001 0.322 0.290 0.688 0.798 0.366 0.326 0.799 0.876 2002 0.308 0.276 0.657 0.779 0.361 0.317 0.793 0.869 2003 0.299 0.268 0.639 0.737 0.298 0.242 0.712 0.801 2004 0.289 0.269 0.609 0.706 0.299 0.242 0.693 0.790 2005 0.285 0.259 0.612 0.701 0.284 0.230 0.665 0.761 2006 0.281 0.259 0.598 0.680 0.266 0.212 0.635 0.727 2007 0.272 0.248 0.596 0.678 0.244 0.183 0.601 0.704 2008 0.292 0.272 0.622 0.719 0.361 0.338 0.773 0.838 2009 0.272 0.241 0.600 0.700 0.278 0.229 0.658 0.756 2010 0.267 0.239 0.583 0.676 0.257 0.205 0.605 0.704 2011 0.276 0.251 0.593 0.680 0.290 0.236 0.672 0.750 2012 0.280 0.256 0.594 0.698 0.278 0.225 0.651 0.745 2013 0.282 0.252 0.606 0.698 0.274 0.216 0.652 0.744 2014 0.281 0.251 0.601 0.692 0.265 0.202 0.641 0.743 2015 0.285 0.262 0.617 0.705 0.262 0.193 0.645 0.745
All Years 0.300 0.277 0.637 0.735 0.303 0.246 0.709 0.801
Note: Distribution of book and market leverage for Asian corporations, 1991‒2015.
BIS Papers No 91 73
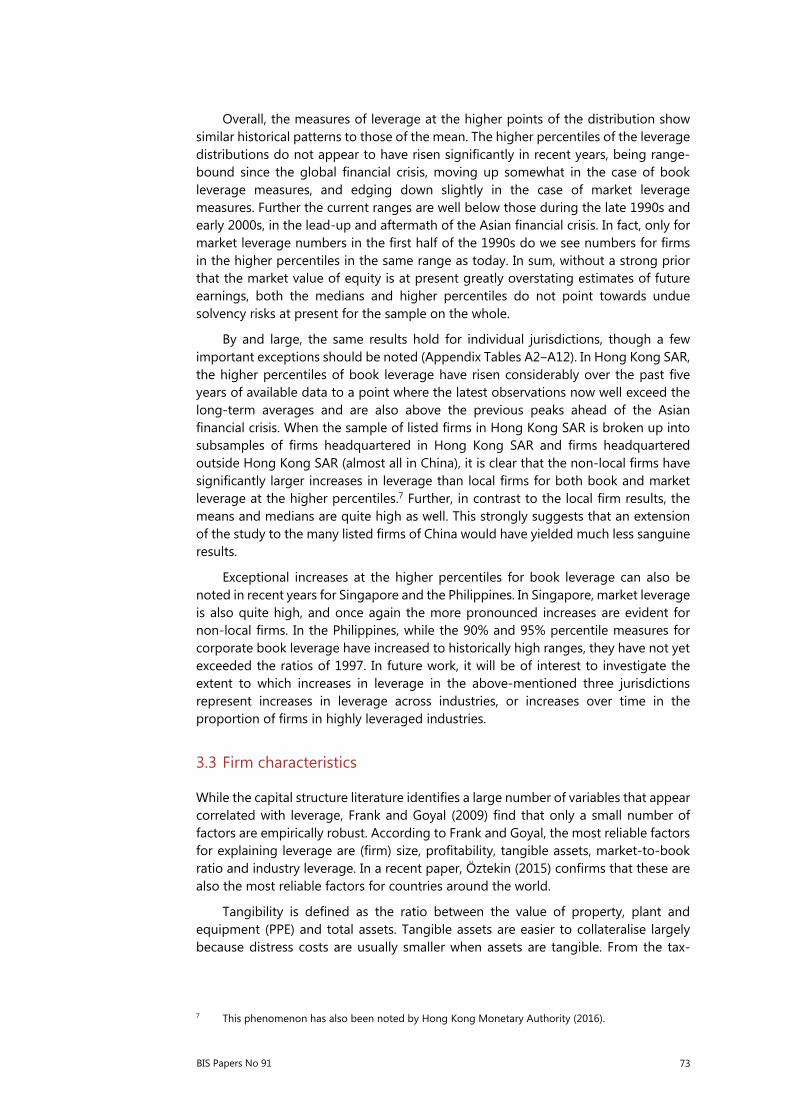
Overall, the measures of leverage at the higher points of the distribution show similar historical patterns to those of the mean. The higher percentiles of the leverage distributions do not appear to have risen significantly in recent years, being range-bound since the global financial crisis, moving up somewhat in the case of book leverage measures, and edging down slightly in the case of market leverage measures. Further the current ranges are well below those during the late 1990s and early 2000s, in the lead-up and aftermath of the Asian financial crisis. In fact, only for market leverage numbers in the first half of the 1990s do we see numbers for firms in the higher percentiles in the same range as today. In sum, without a strong prior that the market value of equity is at present greatly overstating estimates of future earnings, both the medians and higher percentiles do not point towards undue solvency risks at present for the sample on the whole.
By and large, the same results hold for individual jurisdictions, though a few important exceptions should be noted (Appendix Tables A2‒A12). In Hong Kong SAR, the higher percentiles of book leverage have risen considerably over the past five years of available data to a point where the latest observations now well exceed the long-term averages and are also above the previous peaks ahead of the Asian financial crisis. When the sample of listed firms in Hong Kong SAR is broken up into subsamples of firms headquartered in Hong Kong SAR and firms headquartered outside Hong Kong SAR (almost all in China), it is clear that the non-local firms have significantly larger increases in leverage than local firms for both book and market leverage at the higher percentiles.7 Further, in contrast to the local firm results, the means and medians are quite high as well. This strongly suggests that an extension of the study to the many listed firms of China would have yielded much less sanguine results.
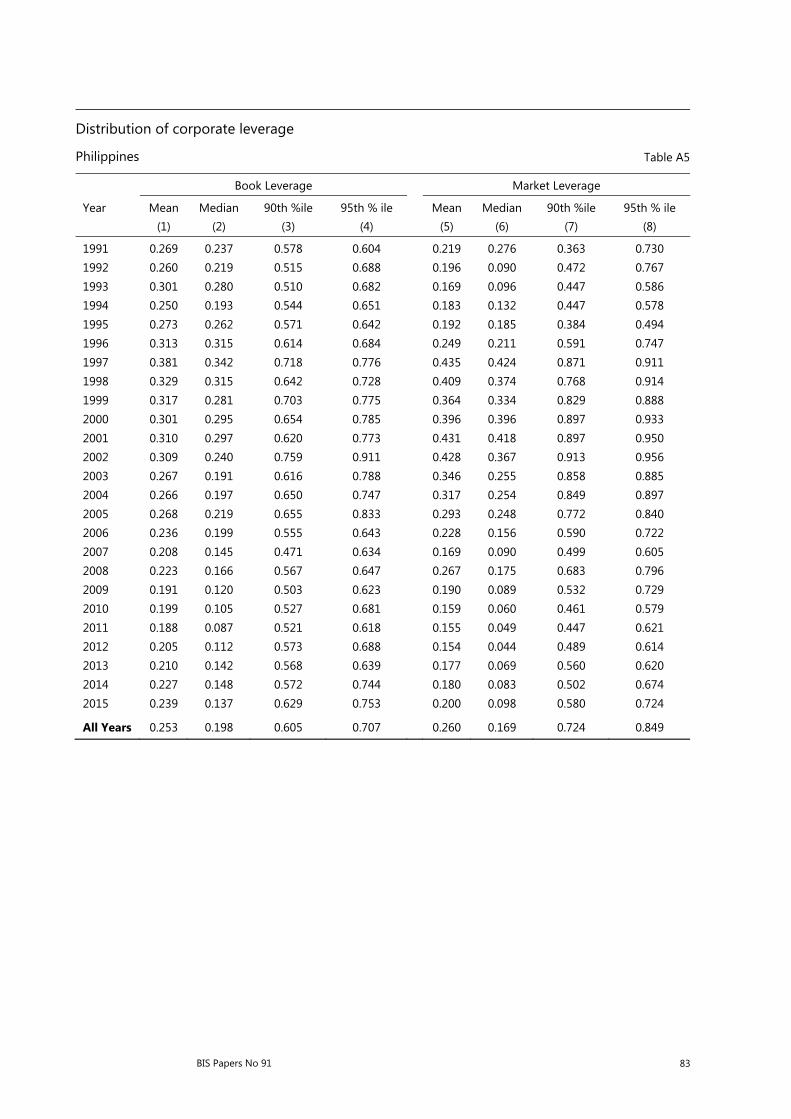
Exceptional increases at the higher percentiles for book leverage can also be noted in recent years for Singapore and the Philippines. In Singapore, market leverage is also quite high, and once again the more pronounced increases are evident for non-local firms. In the Philippines, while the 90% and 95% percentile measures for corporate book leverage have increased to historically high ranges, they have not yet exceeded the ratios of 1997. In future work, it will be of interest to investigate the extent to which increases in leverage in the above-mentioned three jurisdictions represent increases in leverage across industries, or increases over time in the proportion of firms in highly leveraged industries.
3.3 Firm characteristics
While the capital structure literature identifies a large number of variables that appear correlated with leverage, Frank and Goyal (2009) find that only a small number of factors are empirically robust. According to Frank and Goyal, the most reliable factors for explaining leverage are (firm) size, profitability, tangible assets, market-to-book ratio and industry leverage. In a recent paper, Öztekin (2015) confirms that these are also the most reliable factors for countries around the world.
Tangibility is defined as the ratio between the value of property, plant and equipment (PPE) and total assets. Tangible assets are easier to collateralise largely because distress costs are usually smaller when assets are tangible. From the tax-
7 This phenomenon has also been noted by Hong Kong Monetary Authority (2016).

74 BIS Papers No 91
bankruptcy costs trade-off perspective, tangibility reduces the costs of financial distress and hence results in higher leverage.
Size is estimated as the natural logarithm of book value of total assets (in real US dollars). The theory predicts that larger firms will have higher leverage since larger firms are more diversified and have lower default risk. Profitability is defined as operating income scaled by total assets. The trade-off theory predicts that profitability should be positively related to leverage since expected bankruptcy costs are lower and interest tax shields more valuable for profitable firms.
The empirical studies typically find a negative relation between profitability and leverage. Frank and Goyal (2015) show that the negative relation is consistent with the trade-off theory since adjustment costs imply that debt adjustment do not completely offset profitability shocks and the ratio of debt to capital declines.
Market-to-Book Ratio is defined as the ratio between the market value of total assets and the book value of the firm. The trade-off theory predicts a negative relation between leverage and growth because financial distress and underinvestment are more severe for high-growth firms. In addition, incentives to substitute risky assets for safe assets are also higher for firms with greater growth opportunities. We expect a negative relation between leverage and market-to-book ratios. Detailed variable definitions are given in Appendix A.
Table IV examines the cross-section and time-series of the most important leverage factors across all seven jurisdictions (size, profitability, asset tangibility and market-to-book ratio) as well as for the same subperiods identified for leverage earlier. In terms of the cross-sectional differences, it is not immediately apparent that the difference in the long-run average of firms in various countries corresponds to observed leverage patterns. To be sure, tangibility is much higher than average for two of the three high-leverage countries at around 0.40 for Indonesia and Thailand (as opposed to 0.35 for the entire sample). But, for both market-to-book assets ratio and log asset size, there is no obvious relation between these and the leverage ratios at the country level: the high leverage jurisdictions report both high and low measures of these firm factors. Firms in Indonesia, Korea and Thailand average significantly higher profitability than firms in other jurisdictions, similar to the grouping of their leverage, but pecking order theory would suggest that more profitable firms would be less leveraged.
In terms of the time-series trends, we also see a very mixed picture. Recall that the high leverage countries of Indonesia, Korea and the Thailand all increased their leverage ahead of the Asian financial crisis in the late 1990s. But profitability was either unchanged or declining for firms in Korea, Indonesia and Thailand over the same period. Similarly, market-to-book ratios, while rather volatile, were generally declining. Only the average asset tangibility metric rose for firms in all countries in the high leverage group.
Did any of the firm variables correspond with the decline in leveraging that occurred after the Asian financial crisis? In both Indonesia and Thailand, asset size declined after the crisis, although asset tangibility declined only for Thailand. Asset tangibility declined, but with a lag for Indonesia and Korea, from around 2000–01. Market-to-book assets ratio remained stable, while profitability declined only for Indonesia.

BIS Papers No 91 75
And finally, the rise in leverage over the recent half decade that we noted for Singapore, the Philippines and Hong Kong SAR over the recent five years or so does not appear to have corresponded with movements in the mean values of any of the explanatory factors other than perhaps asset size (for all three) and market-to-book for the Philippines. This may be related to the fact that the increases in leverage observed for those jurisdictions were principally at the higher percentiles.
Descriptive statistics for firm factors Table IV
Indonesia Korea Malaysia Philippines Singapore Thailand Hong Kong SAR
All Firms Period
Panel A: Profit
Subp
erio
ds
Profitability 0.079 0.043 0.041 0.035 0.037 0.055 0.029 0.043
1991-1998 0.096 0.055 0.068 0.051 0.053 0.062 0.063 0.064
1999-2007 0.073 0.049 0.039 0.021 0.042 0.058 0.025 0.043
2008-2009 0.081 0.044 0.033 0.029 0.039 0.045 0.025 0.040
2010-2015 0.074 0.036 0.036 0.046 0.022 0.051 0.026 0.037
S
Panel B: Firm Size
Subp
erio
ds
Firm size 3.031 4.604 3.927 3.616 5.046 4.120 5.450 4.508
1991-1998 4.578 6.044 4.860 4.591 5.552 4.497 5.511 5.138
1999-2007 2.781 4.560 3.836 3.287 4.783 3.945 4.904 4.272
2008-2009 2.535 4.318 3.686 3.289 4.911 3.998 5.568 4.361
2010-2015 2.657 4.491 3.794 3.620 5.193 4.166 5.894 4.592
Panel C: Tangibility
Subp
erio
ds
Tangibility 0.395 0.336 0.379 0.400 0.325 0.400 0.280 0.346
1991-1998 0.405 0.363 0.419 0.482 0.409 0.443 0.414 0.414
1999-2007 0.400 0.353 0.400 0.446 0.345 0.425 0.307 0.368
2008-2009 0.393 0.327 0.342 0.342 0.289 0.395 0.243 0.321
2010-2015 0.385 0.321 0.348 0.317 0.276 0.353 0.234 0.309
Panel D: Market-to-Book Ratio
Subp
erio
ds
Tangibility 1.377 1.167 1.232 1.413 1.288 1.385 1.423 1.301
1991-1998 1.411 1.047 1.885 1.471 1.519 1.414 1.318 1.439
1999-2007 1.227 1.128 1.178 1.172 1.360 1.241 1.487 1.266
2008-2009 1.209 1.052 0.975 1.320 1.077 1.059 1.300 1.110
2010-2015 1.557 1.250 1.156 1.724 1.171 1.631 1.425 1.351
Note: Mean values of firm characteristics for Asian firms. The sample period is from 1991‒2015. The variables are defined in the Appendix.
76 BIS Papers No 91
4. Firm characteristics and leverage
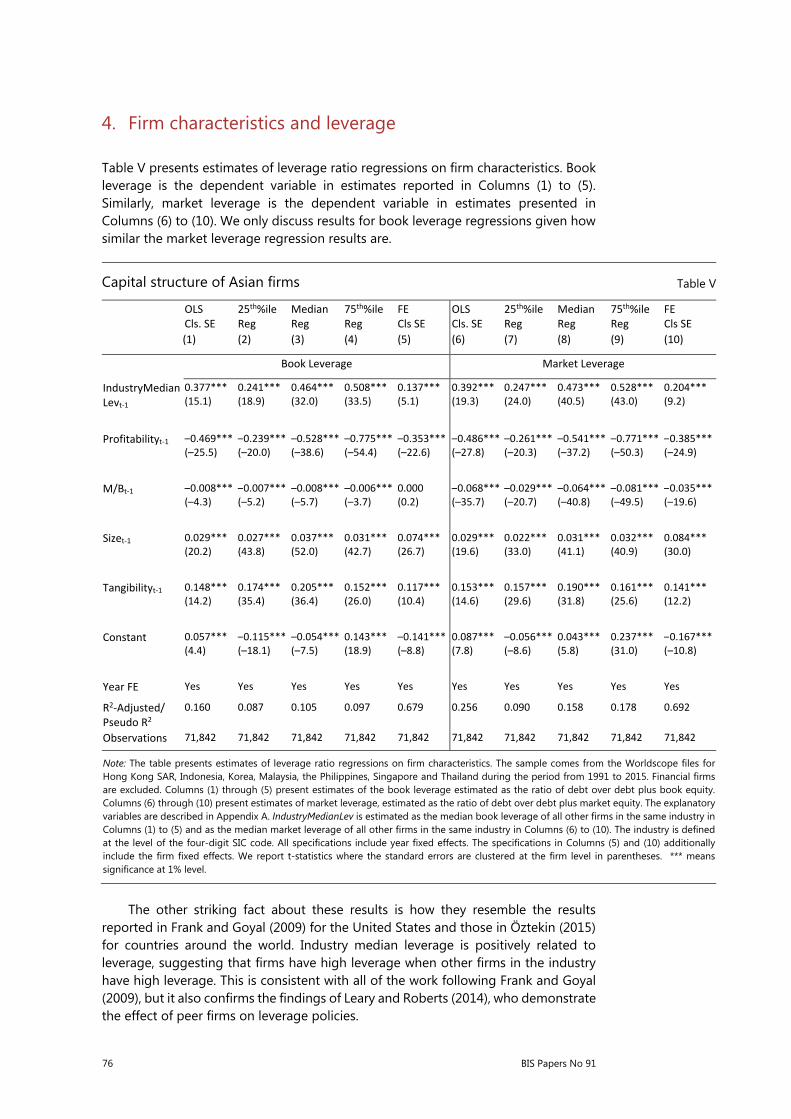
Table V presents estimates of leverage ratio regressions on firm characteristics. Book leverage is the dependent variable in estimates reported in Columns (1) to (5). Similarly, market leverage is the dependent variable in estimates presented in Columns (6) to (10). We only discuss results for book leverage regressions given how similar the market leverage regression results are.
The other striking fact about these results is how they resemble the results reported in Frank and Goyal (2009) for the United States and those in Öztekin (2015) for countries around the world. Industry median leverage is positively related to leverage, suggesting that firms have high leverage when other firms in the industry have high leverage. This is consistent with all of the work following Frank and Goyal (2009), but it also confirms the findings of Leary and Roberts (2014), who demonstrate the effect of peer firms on leverage policies.
Capital structure of Asian firms Table V
OLS Cls. SE
25th%ile Reg
Median Reg
75th%ile Reg
FE Cls SE
OLS Cls. SE
25th%ile Reg
Median Reg
75th%ile Reg
FE Cls SE
(1) (2) (3) (4) (5) (6) (7) (8) (9) (10)
Book Leverage Market Leverage
IndustryMedianLevt-1
0.377*** (15.1)
0.241*** (18.9)
0.464***(32.0)
0.508***(33.5)
0.137***(5.1)
0.392***(19.3)
0.247***(24.0)
0.473*** (40.5)
0.528*** (43.0)
0.204***(9.2)
Profitabilityt-1 –0.469***(–25.5)
–0.239*** (–20.0)
–0.528***(–38.6)
–0.775***(–54.4)
–0.353***(–22.6)
–0.486***(–27.8)
–0.261***(–20.3)
–0.541*** (–37.2)
–0.771***(–50.3)
–0.385***(–24.9)
M/Bt-1 –0.008***(–4.3)
–0.007*** (–5.2)
–0.008***(–5.7)
–0.006***(–3.7)
0.000(0.2)
–0.068***(–35.7)
–0.029***(–20.7)
–0.064*** (–40.8)
–0.081***(–49.5)
–0.035***(–19.6)
Sizet-1 0.029*** (20.2)
0.027*** (43.8)
0.037***(52.0)
0.031***(42.7)
0.074***(26.7)
0.029***(19.6)
0.022***(33.0)
0.031*** (41.1)
0.032*** (40.9)
0.084***(30.0)
Tangibilityt-1 0.148*** (14.2)
0.174*** (35.4)
0.205***(36.4)
0.152***(26.0)
0.117***(10.4)
0.153***(14.6)
0.157***(29.6)
0.190*** (31.8)
0.161*** (25.6)
0.141***(12.2)
Constant 0.057*** (4.4)
–0.115*** (–18.1)
–0.054***(–7.5)
0.143***(18.9)
–0.141***(–8.8)
0.087***(7.8)
–0.056***(–8.6)
0.043*** (5.8)
0.237*** (31.0)
–0.167***(–10.8)
Year FE Yes Yes Yes Yes Yes Yes Yes Yes Yes Yes
R2-Adjusted/ Pseudo R2
0.160 0.087 0.105 0.097 0.679 0.256 0.090 0.158 0.178 0.692
Observations 71,842 71,842 71,842 71,842 71,842 71,842 71,842 71,842 71,842 71,842
Note: The table presents estimates of leverage ratio regressions on firm characteristics. The sample comes from the Worldscope files for Hong Kong SAR, Indonesia, Korea, Malaysia, the Philippines, Singapore and Thailand during the period from 1991 to 2015. Financial firms are excluded. Columns (1) through (5) present estimates of the book leverage estimated as the ratio of debt over debt plus book equity. Columns (6) through (10) present estimates of market leverage, estimated as the ratio of debt over debt plus market equity. The explanatory variables are described in Appendix A. IndustryMedianLev is estimated as the median book leverage of all other firms in the same industry in Columns (1) to (5) and as the median market leverage of all other firms in the same industry in Columns (6) to (10). The industry is defined at the level of the four-digit SIC code. All specifications include year fixed effects. The specifications in Columns (5) and (10) additionally include the firm fixed effects. We report t-statistics where the standard errors are clustered at the firm level in parentheses. *** means significance at 1% level.

BIS Papers No 91 77
Leverage is negatively related to profitability. The negative relation between leverage and profitability is consistent with firms following a pecking order. However, as shown by Frank and Goyal (2015), the negative relation between leverage and profitability is also consistent with costly adjustment that results in firms making incomplete adjustments. Leverage is negatively related to the market-to-book ratio, which indicates that high-growth firms rely on equity financing. Both firm size and tangibility are positively related to leverage.
To estimate the relation between leverage and firm characteristics at different points in the conditional distribution of leverage, we provide estimates from quantile regressions in Columns (2) to (4), which report what happens at the 25th, 50th, and 75th percentiles, respectively. While the baseline model is robust in both signs and statistical significance, we find that the effect of profitability on leverage is much larger at the 75th percentile than it is at the 25th percentile. Column (5) includes firm fixed effects. Most of our results go through except for the market-to-book ratio, which continues to have the negative coefficient but it is no longer significant.
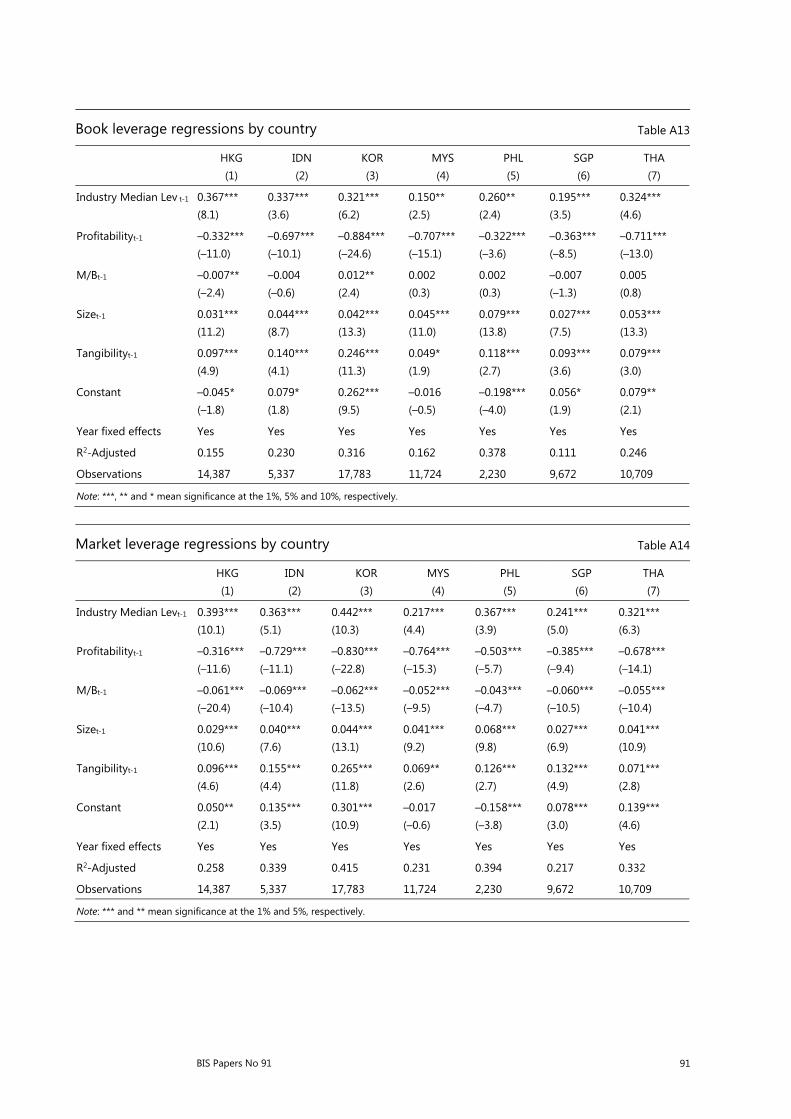
We also estimate leverage regressions by country and report results for book leverage in Appendix Table A13 and for market leverage in Appendix Table A14. It is reassuring that firm characteristics have similar effects on leverage in every economy that we examine, despite the heterogeneity in leverage trends documented earlier. While the signs and significance levels are similar across countries, we do note that Adjusted R-squared values are smaller for Hong Kong SAR, Malaysia and Singapore. In addition, several of the firm characteristics matter less for leverage in Hong Kong SAR and Singapore than they do for other countries.
It is quite possible that the structure of institutions, including creditor rights, political stability and investor protections, can account for some of the different explanatory power of economy regressions with “reliably important” factors.8 Both Hong Kong SAR and Singapore have had particularly strong institutions along the above dimensions over the sample period, which could have weakened the relation between leverage and measures of information frictions (Malaysia has also scored relatively highly on some measures as well). For instance, in countries with relatively weak institutions, lenders have limited ability to monitor and therefore lending might be more sensitive to the availability of hard assets (see Giannetti (2003) for related evidence). Overall, the differences in explanatory power we observe in Appendix Tables 13 and 14 are consistent with firm characteristics that help to overcome information asymmetries being less important in corporate financing decisions in countries with strong institutions.
5. Conclusion
We began this paper citing some concerns about the recent growth of corporate debt in the region. The risk of corporate debt is best gauged by taking into account the assets to support it. When corporate debt is measured relative to assets, neither the mean/median nor the upper tails of the distribution are currently in unusually high
8 In another paper, we document the importance of such institutions for the capital structure and
financing decisions of firms in Asia and the Pacific more systematically (Goyal and Packer (2017)).

78 BIS Papers No 91
territory on the whole for the more than 7,000 listed firms we examine in the economies of emerging Asia.
The picture is slightly more complicated when we examine leverage trends by jurisdictions. In three of the seven jurisdictions – Hong Kong SAR, the Philippines and Singapore – current book leverage is at or close to all-time highs in the upper tails of the leverage distribution. In Singapore, market leverage is also quite high at the 90th and 95th percentiles. It would be good in future work to check whether the observed increases in leverage in these jurisdictions reflected changes in the industry composition of firms towards more leveraged sectors such as real estate.
In the case of Hong Kong SAR, examination of the underlying data reveals that firms headquartered outside the jurisdiction, particularly in mainland China, have particularly marked increases in leverage. We take this as a strong indication that extending the research to include mainland Chinese firms might result in greater concerns about debt burdens in Asia.
We also find suggestive evidence that the legal environment and quality of institutions have an important influence on the leverage decision: standard firm factors are more weakly related to leverage in jurisdictions with stronger institutions, particularly in the area of creditor rights, political stability and investor protections. We interpret this to mean that firm characteristics such as asset tangibility and size that help to overcome information asymmetries are likely to be less important in the corporate financing decisions in countries with stronger institutions.

BIS Papers No 91 79
Appendix Tables
Common-size balance sheets of Asian firms, 1991–2015
As a fraction of assets Table A1
HKG IDN KOR MYS PHL SGP THA Total
Number of observations 16,740 6,070 20,260 13,136 2,604 10,995 12,044 81,849Number of firms 1,631 492 1,992 1,071 206 956 962 7,310
Cash and cash equivalents 0.218 0.123 0.149 0.131 0.116 0.178 0.103 0.154
+ Accounts receivable 0.167 0.162 0.206 0.206 0.122 0.191 0.164 0.184
+ Inventory 0.117 0.169 0.122 0.132 0.082 0.136 0.166 0.133
+ Other current assets 0.027 0.030 0.022 0.017 0.027 0.023 0.021 0.023
= Current Assets-Total 0.521 0.480 0.502 0.483 0.343 0.527 0.453 0.492
+ Property plant and equipment-net 0.280 0.395 0.336 0.379 0.400 0.325 0.400 0.346
+ Investment in associated companies 0.046 0.024 0.037 0.035 0.064 0.045 0.039 0.040
+ Other assets 0.149 0.098 0.123 0.100 0.188 0.100 0.104 0.119= Total assets 1.000 1.000 1.000 1.000 1.000 1.000 1.000 1.000
Short-term debt 0.102 0.139 0.165 0.124 0.090 0.112 0.158 0.133
+ Accounts payable 0.091 0.099 0.095 0.083 0.071 0.108 0.091 0.093
+ Other current liabilities 0.103 0.077 0.081 0.081 0.086 0.095 0.071 0.086
= Current Liabilities-Total 0.294 0.314 0.343 0.287 0.248 0.315 0.318 0.312
Long Term Debt 0.083 0.146 0.090 0.084 0.099 0.091 0.118 0.096
+ Other long-term liabilities 0.022 0.039 0.039 0.028 0.046 0.020 0.020 0.029
= Total Liabilities 0.401 0.501 0.473 0.402 0.409 0.429 0.458 0.439
+ Common equity 0.567 0.479 0.508 0.573 0.563 0.544 0.527 0.538
+ Minority interest 0.029 0.019 0.017 0.022 0.023 0.026 0.013 0.021
= Total Liabilities & Shareholders Equity 1.000 1.000 1.000 1.000 1.000 1.000 1.000 1.000
Note: The table reports average balance sheet items of firms in various Asian countries. All balance sheet items are expressed as a fraction of assets. The sample period is from 1991 to 2015.

80 BIS Papers No 91
Distribution of corporate leverage
Indonesia Table A2
Book Leverage Market Leverage
Year Mean Median 90th %ile 95th % ile Mean Median 90th %ile 95th % ile (1) (2) (3) (4) (5) (6) (7) (8)
1991 0.272 0.278 0.577 0.609 0.192 0.147 0.455 0.501 1992 0.333 0.310 0.600 0.628 0.244 0.237 0.528 0.581 1993 0.347 0.372 0.569 0.580 0.200 0.192 0.448 0.473 1994 0.347 0.371 0.594 0.609 0.271 0.244 0.551 0.586 1995 0.397 0.434 0.635 0.691 0.364 0.350 0.667 0.735 1996 0.432 0.457 0.670 0.700 0.382 0.418 0.713 0.741 1997 0.583 0.636 0.840 0.868 0.600 0.610 0.920 0.945 1998 0.584 0.652 0.927 0.957 0.617 0.717 0.956 0.970 1999 0.492 0.551 0.872 0.957 0.409 0.413 0.813 0.836 2000 0.445 0.435 0.896 0.912 0.434 0.434 0.861 0.908 2001 0.411 0.410 0.849 0.908 0.442 0.491 0.867 0.931 2002 0.373 0.377 0.784 0.860 0.438 0.459 0.873 0.919 2003 0.390 0.371 0.804 0.868 0.401 0.366 0.834 0.874 2004 0.371 0.374 0.728 0.837 0.358 0.317 0.794 0.837 2005 0.382 0.380 0.746 0.859 0.378 0.350 0.795 0.858 2006 0.350 0.326 0.662 0.754 0.331 0.264 0.763 0.826 2007 0.355 0.372 0.678 0.739 0.293 0.247 0.715 0.779 2008 0.368 0.396 0.710 0.809 0.409 0.423 0.834 0.884 2009 0.341 0.351 0.719 0.773 0.337 0.326 0.732 0.821 2010 0.311 0.311 0.640 0.731 0.263 0.218 0.651 0.758 2011 0.319 0.308 0.630 0.744 0.271 0.219 0.667 0.728 2012 0.314 0.304 0.623 0.735 0.263 0.197 0.660 0.774 2013 0.331 0.321 0.637 0.729 0.299 0.233 0.701 0.819 2014 0.319 0.325 0.634 0.722 0.280 0.212 0.716 0.811 2015 0.324 0.343 0.621 0.697 0.331 0.289 0.767 0.868
All Years 0.368 0.369 0.723 0.823 0.346 0.297 0.776 0.859

BIS Papers No 91 81
Distribution of corporate leverage
Korea Table A3
Book Leverage Market Leverage
Year Mean Median 90th %ile 95th % ile Mean Median 90th %ile 95th % ile (1) (2) (3) (4) (5) (6) (7) (8)
1991 0.669 0.688 0.862 0.894 0.683 0.720 0.845 0.920 1992 0.660 0.672 0.866 0.883 0.662 0.705 0.878 0.921 1993 0.635 0.658 0.834 0.903 0.586 0.609 0.824 0.861 1994 0.617 0.645 0.825 0.882 0.526 0.561 0.802 0.832 1995 0.609 0.638 0.847 0.891 0.600 0.654 0.847 0.896 1996 0.626 0.665 0.865 0.912 0.641 0.722 0.891 0.914 1997 0.673 0.721 0.911 0.951 0.771 0.861 0.971 0.980 1998 0.534 0.558 0.830 0.872 0.649 0.717 0.943 0.967 1999 0.441 0.436 0.757 0.864 0.560 0.590 0.924 0.964 2000 0.412 0.419 0.729 0.826 0.592 0.658 0.935 0.968 2001 0.392 0.402 0.742 0.825 0.500 0.535 0.883 0.931 2002 0.361 0.364 0.694 0.799 0.474 0.511 0.871 0.910 2003 0.336 0.325 0.673 0.779 0.425 0.445 0.822 0.872 2004 0.310 0.298 0.628 0.713 0.396 0.397 0.796 0.856 2005 0.291 0.274 0.619 0.695 0.273 0.224 0.631 0.736 2006 0.289 0.272 0.611 0.697 0.282 0.238 0.656 0.732 2007 0.289 0.263 0.626 0.708 0.263 0.209 0.627 0.711 2008 0.334 0.328 0.691 0.758 0.405 0.412 0.800 0.864 2009 0.314 0.299 0.643 0.720 0.326 0.295 0.712 0.792 2010 0.308 0.299 0.633 0.709 0.313 0.284 0.671 0.763 2011 0.317 0.311 0.640 0.726 0.339 0.306 0.724 0.799 2012 0.315 0.303 0.646 0.731 0.328 0.290 0.717 0.797 2013 0.312 0.288 0.648 0.727 0.315 0.273 0.693 0.781 2014 0.298 0.273 0.618 0.709 0.294 0.238 0.682 0.758 2015 0.286 0.262 0.607 0.702 0.252 0.182 0.619 0.715
All Years 0.339 0.328 0.688 0.775 0.363 0.329 0.777 0.858

82 BIS Papers No 91
Distribution of corporate leverage
Malaysia Table A4
Book Leverage Market Leverage
Year Mean Median 90th %ile 95th % ile Mean Median 90th %ile 95th % ile (1) (2) (3) (4) (5) (6) (7) (8)
1991 0.196 0.171 0.420 0.593 0.145 0.089 0.380 0.451 1992 0.197 0.155 0.453 0.501 0.125 0.073 0.338 0.414 1993 0.213 0.167 0.504 0.527 0.091 0.042 0.241 0.288 1994 0.249 0.224 0.544 0.601 0.129 0.079 0.318 0.399 1995 0.292 0.270 0.628 0.686 0.159 0.115 0.385 0.452 1996 0.315 0.339 0.630 0.709 0.170 0.127 0.394 0.505 1997 0.363 0.366 0.724 0.845 0.398 0.385 0.796 0.855 1998 0.365 0.360 0.756 0.864 0.374 0.368 0.765 0.833 1999 0.319 0.285 0.684 0.798 0.279 0.219 0.654 0.771 2000 0.299 0.265 0.642 0.762 0.319 0.262 0.717 0.801 2001 0.278 0.229 0.622 0.737 0.293 0.236 0.672 0.755 2002 0.290 0.256 0.640 0.749 0.326 0.293 0.732 0.796 2003 0.286 0.241 0.635 0.745 0.274 0.230 0.642 0.709 2004 0.285 0.255 0.619 0.737 0.301 0.240 0.682 0.757 2005 0.288 0.251 0.617 0.716 0.336 0.280 0.744 0.817 2006 0.285 0.263 0.601 0.690 0.306 0.267 0.679 0.765 2007 0.274 0.250 0.589 0.667 0.297 0.236 0.690 0.760 2008 0.280 0.258 0.589 0.683 0.376 0.362 0.769 0.826 2009 0.260 0.229 0.556 0.710 0.311 0.264 0.696 0.764 2010 0.246 0.222 0.539 0.649 0.284 0.240 0.640 0.745 2011 0.233 0.202 0.515 0.616 0.276 0.209 0.646 0.737 2012 0.234 0.201 0.517 0.615 0.276 0.227 0.657 0.738 2013 0.228 0.188 0.508 0.595 0.241 0.183 0.605 0.682 2014 0.225 0.189 0.505 0.596 0.244 0.188 0.595 0.703 2015 0.238 0.204 0.522 0.630 0.253 0.187 0.596 0.714
All Years 0.268 0.234 0.589 0.693 0.286 0.225 0.675 0.764
BIS Papers No 91 83
Distribution of corporate leverage
Philippines Table A5
Book Leverage Market Leverage
Year Mean Median 90th %ile 95th % ile Mean Median 90th %ile 95th % ile (1) (2) (3) (4) (5) (6) (7) (8)
1991 0.269 0.237 0.578 0.604 0.219 0.276 0.363 0.730 1992 0.260 0.219 0.515 0.688 0.196 0.090 0.472 0.767 1993 0.301 0.280 0.510 0.682 0.169 0.096 0.447 0.586 1994 0.250 0.193 0.544 0.651 0.183 0.132 0.447 0.578 1995 0.273 0.262 0.571 0.642 0.192 0.185 0.384 0.494 1996 0.313 0.315 0.614 0.684 0.249 0.211 0.591 0.747 1997 0.381 0.342 0.718 0.776 0.435 0.424 0.871 0.911 1998 0.329 0.315 0.642 0.728 0.409 0.374 0.768 0.914 1999 0.317 0.281 0.703 0.775 0.364 0.334 0.829 0.888 2000 0.301 0.295 0.654 0.785 0.396 0.396 0.897 0.933 2001 0.310 0.297 0.620 0.773 0.431 0.418 0.897 0.950 2002 0.309 0.240 0.759 0.911 0.428 0.367 0.913 0.956 2003 0.267 0.191 0.616 0.788 0.346 0.255 0.858 0.885 2004 0.266 0.197 0.650 0.747 0.317 0.254 0.849 0.897 2005 0.268 0.219 0.655 0.833 0.293 0.248 0.772 0.840 2006 0.236 0.199 0.555 0.643 0.228 0.156 0.590 0.722 2007 0.208 0.145 0.471 0.634 0.169 0.090 0.499 0.605 2008 0.223 0.166 0.567 0.647 0.267 0.175 0.683 0.796 2009 0.191 0.120 0.503 0.623 0.190 0.089 0.532 0.729 2010 0.199 0.105 0.527 0.681 0.159 0.060 0.461 0.579 2011 0.188 0.087 0.521 0.618 0.155 0.049 0.447 0.621 2012 0.205 0.112 0.573 0.688 0.154 0.044 0.489 0.614 2013 0.210 0.142 0.568 0.639 0.177 0.069 0.560 0.620 2014 0.227 0.148 0.572 0.744 0.180 0.083 0.502 0.674 2015 0.239 0.137 0.629 0.753 0.200 0.098 0.580 0.724
All Years 0.253 0.198 0.605 0.707 0.260 0.169 0.724 0.849
84 BIS Papers No 91
Distribution of corporate leverage
Thailand Table A6
Book Leverage Market Leverage
Year Mean Median 90th %ile 95th % ile Mean Median 90th %ile 95th % ile (1) (2) (3) (4) (5) (6) (7) (8)
1991 0.357 0.328 0.676 0.684 0.224 0.182 0.500 0.592 1992 0.389 0.402 0.675 0.722 0.237 0.226 0.453 0.573 1993 0.414 0.417 0.685 0.747 0.247 0.239 0.484 0.572 1994 0.419 0.443 0.668 0.731 0.291 0.271 0.547 0.631 1995 0.455 0.482 0.693 0.735 0.380 0.374 0.659 0.735 1996 0.479 0.520 0.711 0.752 0.479 0.514 0.795 0.845 1997 0.565 0.622 0.881 0.955 0.626 0.694 0.948 0.961 1998 0.493 0.532 0.901 0.949 0.561 0.649 0.936 0.946 1999 0.444 0.477 0.853 0.936 0.459 0.487 0.877 0.911 2000 0.419 0.436 0.847 0.927 0.486 0.542 0.904 0.934 2001 0.395 0.386 0.791 0.911 0.425 0.441 0.834 0.879 2002 0.352 0.329 0.727 0.810 0.350 0.318 0.762 0.828 2003 0.334 0.325 0.676 0.740 0.239 0.195 0.597 0.719 2004 0.308 0.289 0.629 0.694 0.263 0.224 0.580 0.683 2005 0.304 0.295 0.621 0.672 0.282 0.253 0.631 0.716 2006 0.300 0.294 0.611 0.680 0.280 0.247 0.615 0.747 2007 0.295 0.275 0.629 0.714 0.273 0.224 0.622 0.753 2008 0.306 0.286 0.653 0.727 0.361 0.332 0.771 0.839 2009 0.285 0.238 0.639 0.704 0.281 0.239 0.665 0.732 2010 0.283 0.255 0.622 0.706 0.239 0.195 0.568 0.653 2011 0.298 0.291 0.634 0.710 0.260 0.211 0.616 0.687 2012 0.291 0.282 0.624 0.717 0.216 0.146 0.544 0.626 2013 0.287 0.261 0.611 0.701 0.227 0.168 0.557 0.653 2014 0.297 0.290 0.600 0.692 0.204 0.152 0.491 0.595 2015 0.290 0.282 0.612 0.689 0.226 0.161 0.558 0.627
All Years 0.339 0.336 0.687 0.773 0.307 0.256 0.711 0.821

BIS Papers No 91 85
Distribution of corporate leverage
Hong Kong SAR Table A7
Book Leverage Market Leverage
Year Mean Median 90th %ile 95th % ile Mean Median 90th %ile 95th % ile (1) (2) (3) (4) (5) (6) (7) (8)
1991 0.228 0.184 0.450 0.681 0.211 0.168 0.478 0.607 1992 0.223 0.188 0.479 0.602 0.205 0.159 0.453 0.566 1993 0.233 0.221 0.440 0.559 0.190 0.162 0.402 0.492 1994 0.277 0.276 0.544 0.574 0.268 0.248 0.573 0.617 1995 0.304 0.294 0.565 0.641 0.306 0.284 0.635 0.697 1996 0.295 0.281 0.566 0.678 0.266 0.209 0.597 0.667 1997 0.288 0.268 0.548 0.653 0.311 0.283 0.668 0.754 1998 0.286 0.264 0.576 0.648 0.373 0.344 0.751 0.849 1999 0.256 0.244 0.505 0.585 0.285 0.220 0.666 0.736 2000 0.240 0.203 0.532 0.634 0.285 0.226 0.698 0.772 2001 0.229 0.199 0.507 0.596 0.255 0.171 0.650 0.732 2002 0.231 0.192 0.517 0.605 0.274 0.196 0.711 0.769 2003 0.242 0.198 0.535 0.610 0.226 0.161 0.587 0.693 2004 0.243 0.215 0.531 0.605 0.229 0.173 0.575 0.668 2005 0.244 0.211 0.522 0.641 0.235 0.165 0.587 0.694 2006 0.246 0.218 0.543 0.646 0.210 0.140 0.564 0.673 2007 0.232 0.194 0.532 0.620 0.177 0.113 0.460 0.586 2008 0.244 0.216 0.534 0.637 0.303 0.247 0.725 0.804 2009 0.227 0.183 0.522 0.607 0.197 0.123 0.511 0.603 2010 0.231 0.196 0.522 0.606 0.201 0.133 0.533 0.621 2011 0.249 0.214 0.550 0.626 0.271 0.197 0.661 0.733 2012 0.261 0.227 0.573 0.664 0.268 0.209 0.646 0.732 2013 0.266 0.229 0.590 0.675 0.264 0.202 0.662 0.736 2014 0.278 0.236 0.606 0.691 0.263 0.193 0.643 0.750 2015 0.295 0.268 0.639 0.736 0.270 0.206 0.665 0.762
All Years 0.253 0.220 0.555 0.646 0.251 0.185 0.628 0.724

86 BIS Papers No 91
Distribution of corporate leverage
Hong Kong SAR—Local corporates Table A8
Book Leverage Market Leverage
Year Mean Median 90th %ile 95th % ile Mean Median 90th %ile 95th % ile (1) (2) (3) (4) (5) (6) (7) (8)
1991 0.234 0.190 0.474 0.693 0.224 0.178 0.516 0.615 1992 0.228 0.189 0.476 0.648 0.218 0.169 0.466 0.619 1993 0.236 0.220 0.449 0.563 0.203 0.167 0.421 0.510 1994 0.285 0.286 0.546 0.581 0.286 0.273 0.581 0.619 1995 0.309 0.300 0.590 0.649 0.316 0.306 0.639 0.697 1996 0.301 0.284 0.577 0.694 0.279 0.235 0.597 0.669 1997 0.291 0.271 0.548 0.674 0.330 0.312 0.683 0.760 1998 0.285 0.257 0.585 0.648 0.391 0.366 0.761 0.856 1999 0.251 0.227 0.504 0.582 0.290 0.238 0.666 0.732 2000 0.237 0.200 0.510 0.603 0.293 0.230 0.700 0.774 2001 0.225 0.194 0.505 0.586 0.262 0.176 0.661 0.740 2002 0.227 0.189 0.514 0.593 0.285 0.206 0.717 0.770 2003 0.240 0.195 0.534 0.613 0.238 0.169 0.614 0.705 2004 0.241 0.211 0.520 0.604 0.237 0.173 0.610 0.676 2005 0.243 0.208 0.522 0.641 0.244 0.174 0.611 0.698 2006 0.240 0.202 0.543 0.657 0.220 0.146 0.589 0.686 2007 0.226 0.187 0.513 0.620 0.196 0.129 0.505 0.614 2008 0.237 0.199 0.526 0.637 0.315 0.256 0.745 0.824 2009 0.213 0.164 0.500 0.594 0.205 0.132 0.532 0.617 2010 0.218 0.178 0.505 0.594 0.209 0.143 0.546 0.628 2011 0.234 0.199 0.537 0.615 0.271 0.198 0.667 0.737 2012 0.244 0.208 0.543 0.642 0.263 0.209 0.639 0.724 2013 0.240 0.189 0.557 0.636 0.239 0.173 0.611 0.707 2014 0.249 0.200 0.571 0.665 0.233 0.158 0.597 0.711 2015 0.261 0.213 0.593 0.717 0.235 0.158 0.620 0.728
All Years 0.242 0.205 0.537 0.635 0.253 0.188 0.629 0.722

BIS Papers No 91 87
Distribution of corporate leverage
Hong Kong SAR—Non-local corporates Table A9
Book Leverage Market Leverage
Year Mean Median 90th %ile 95th % ile Mean Median 90th %ile 95th % ile (1) (2) (3) (4) (5) (6) (7) (8)
1991 0.179 0.120 0.401 0.407 0.106 0.058 0.316 0.368 1992 0.187 0.124 0.479 0.486 0.092 0.029 0.182 0.415 1993 0.212 0.221 0.323 0.440 0.098 0.071 0.220 0.342 1994 0.207 0.182 0.440 0.449 0.123 0.096 0.284 0.348 1995 0.261 0.233 0.482 0.538 0.221 0.174 0.456 0.606 1996 0.256 0.263 0.451 0.545 0.170 0.122 0.378 0.618 1997 0.267 0.244 0.508 0.574 0.190 0.165 0.444 0.486 1998 0.287 0.265 0.565 0.696 0.273 0.209 0.657 0.798 1999 0.288 0.304 0.561 0.689 0.258 0.171 0.637 0.752 2000 0.261 0.217 0.551 0.644 0.240 0.129 0.633 0.741 2001 0.258 0.222 0.537 0.635 0.209 0.160 0.527 0.650 2002 0.251 0.194 0.527 0.643 0.207 0.179 0.484 0.558 2003 0.250 0.214 0.542 0.593 0.161 0.125 0.365 0.478 2004 0.251 0.234 0.544 0.640 0.191 0.173 0.487 0.531 2005 0.246 0.225 0.497 0.634 0.195 0.132 0.447 0.570 2006 0.265 0.244 0.526 0.608 0.176 0.117 0.433 0.542 2007 0.248 0.242 0.540 0.626 0.128 0.072 0.336 0.414 2008 0.263 0.247 0.544 0.632 0.275 0.221 0.645 0.750 2009 0.259 0.236 0.562 0.630 0.178 0.110 0.449 0.547 2010 0.256 0.231 0.557 0.621 0.185 0.122 0.487 0.569 2011 0.277 0.255 0.576 0.645 0.273 0.197 0.656 0.731 2012 0.293 0.267 0.605 0.673 0.277 0.209 0.661 0.747 2013 0.318 0.293 0.639 0.706 0.310 0.254 0.701 0.773 2014 0.339 0.333 0.656 0.722 0.326 0.286 0.733 0.799 2015 0.353 0.351 0.676 0.777 0.328 0.267 0.743 0.785
All Years 0.285 0.262 0.592 0.670 0.245 0.176 0.623 0.726

88 BIS Papers No 91
Distribution of corporate leverage
Singapore Table A10
Book Leverage Market Leverage
Year Mean Median 90th %ile 95th % ile Mean Median 90th %ile 95th % ile (1) (2) (3) (4) (5) (6) (7) (8)
1991 0.243 0.235 0.519 0.620 0.192 0.141 0.455 0.557 1992 0.255 0.237 0.522 0.608 0.198 0.155 0.425 0.540 1993 0.264 0.254 0.580 0.629 0.156 0.117 0.351 0.478 1994 0.249 0.220 0.518 0.588 0.169 0.122 0.390 0.501 1995 0.268 0.236 0.552 0.591 0.191 0.152 0.442 0.508 1996 0.300 0.297 0.559 0.616 0.225 0.221 0.478 0.544 1997 0.327 0.337 0.610 0.659 0.359 0.353 0.723 0.789 1998 0.352 0.357 0.672 0.775 0.378 0.354 0.764 0.820 1999 0.313 0.287 0.638 0.699 0.278 0.219 0.627 0.701 2000 0.293 0.282 0.615 0.674 0.307 0.279 0.686 0.764 2001 0.297 0.276 0.604 0.695 0.320 0.288 0.712 0.768 2002 0.291 0.278 0.596 0.681 0.328 0.297 0.700 0.772 2003 0.271 0.260 0.532 0.630 0.247 0.195 0.565 0.671 2004 0.274 0.257 0.533 0.610 0.262 0.216 0.593 0.698 2005 0.263 0.229 0.552 0.647 0.259 0.195 0.603 0.715 2006 0.267 0.230 0.548 0.627 0.221 0.165 0.533 0.614 2007 0.251 0.228 0.527 0.611 0.205 0.149 0.483 0.578 2008 0.257 0.229 0.544 0.635 0.330 0.280 0.733 0.819 2009 0.241 0.205 0.515 0.632 0.247 0.199 0.570 0.687 2010 0.237 0.207 0.510 0.606 0.232 0.185 0.541 0.631 2011 0.256 0.234 0.534 0.639 0.295 0.243 0.657 0.749 2012 0.270 0.258 0.561 0.645 0.285 0.252 0.614 0.718 2013 0.279 0.242 0.590 0.655 0.286 0.232 0.636 0.727 2014 0.283 0.256 0.594 0.692 0.306 0.268 0.693 0.789 2015 0.285 0.251 0.635 0.714 0.328 0.281 0.736 0.855
All Years 0.272 0.249 0.566 0.651 0.271 0.219 0.630 0.728

BIS Papers No 91 89
Distribution of corporate leverage
Singapore—Local corporates Table A11
Book leverage Market leverage
Year Mean Median 90th %ile 95th %ile Mean Median 90th %ile 95th %ile
(1) (2) (3) (4) (5) (6) (7) (8)
1991 0.223 0.200 0.468 0.561 0.181 0.129 0.441 0.547
1992 0.240 0.215 0.483 0.541 0.204 0.167 0.423 0.609
1993 0.261 0.251 0.551 0.620 0.165 0.124 0.351 0.475
1994 0.235 0.217 0.504 0.548 0.162 0.113 0.366 0.477
1995 0.260 0.226 0.545 0.582 0.181 0.141 0.409 0.470
1996 0.292 0.286 0.555 0.592 0.224 0.225 0.478 0.544
1997 0.322 0.326 0.584 0.625 0.343 0.328 0.691 0.780
1998 0.342 0.346 0.639 0.771 0.361 0.335 0.738 0.808
1999 0.294 0.274 0.574 0.669 0.249 0.196 0.571 0.690
2000 0.286 0.279 0.572 0.660 0.289 0.269 0.620 0.695
2001 0.293 0.275 0.593 0.693 0.310 0.288 0.670 0.734
2002 0.283 0.262 0.584 0.655 0.313 0.280 0.656 0.730
2003 0.267 0.259 0.526 0.605 0.238 0.188 0.544 0.613
2004 0.268 0.248 0.529 0.598 0.254 0.199 0.573 0.689
2005 0.261 0.223 0.544 0.647 0.253 0.190 0.584 0.680
2006 0.264 0.220 0.548 0.628 0.217 0.165 0.515 0.606
2007 0.248 0.226 0.517 0.606 0.199 0.149 0.467 0.567
2008 0.257 0.229 0.534 0.623 0.325 0.265 0.720 0.793
2009 0.241 0.216 0.496 0.625 0.242 0.199 0.561 0.651
2010 0.238 0.209 0.497 0.595 0.231 0.185 0.530 0.597
2011 0.259 0.235 0.533 0.644 0.293 0.239 0.641 0.742
2012 0.267 0.252 0.558 0.644 0.271 0.236 0.601 0.667
2013 0.269 0.222 0.587 0.642 0.269 0.215 0.616 0.683
2014 0.272 0.253 0.589 0.661 0.291 0.256 0.662 0.741
2015 0.276 0.225 0.630 0.708 0.317 0.281 0.719 0.790
All Years 0.267 0.242 0.554 0.638 0.263 0.212 0.608 0.699

90 BIS Papers No 91
Distribution of corporate leverage
Singapore—Non-local corporates Table A12
Book leverage Market leverage
Year Mean Median 90th %ile 95th %ile Mean Median 90th %ile 95th %ile
(1) (2) (3) (4) (5) (6) (7) (8)
1991 0.268 0.272 0.593 0.670 0.208 0.179 0.455 0.617
1992 0.276 0.249 0.599 0.716 0.190 0.142 0.427 0.534
1993 0.269 0.255 0.588 0.665 0.145 0.103 0.447 0.478
1994 0.275 0.289 0.583 0.678 0.181 0.144 0.501 0.551
1995 0.284 0.311 0.562 0.653 0.213 0.180 0.490 0.590
1996 0.316 0.371 0.589 0.616 0.227 0.212 0.471 0.514
1997 0.337 0.352 0.616 0.719 0.394 0.397 0.741 0.811
1998 0.374 0.368 0.702 0.779 0.414 0.429 0.774 0.838
1999 0.354 0.300 0.691 0.760 0.341 0.322 0.701 0.798
2000 0.316 0.300 0.652 0.729 0.364 0.321 0.784 0.811
2001 0.311 0.294 0.637 0.796 0.356 0.300 0.762 0.784
2002 0.318 0.306 0.611 0.708 0.380 0.383 0.755 0.827
2003 0.287 0.275 0.587 0.634 0.282 0.236 0.665 0.698
2004 0.296 0.308 0.549 0.653 0.295 0.239 0.656 0.772
2005 0.271 0.257 0.562 0.662 0.278 0.228 0.671 0.782
2006 0.277 0.311 0.565 0.621 0.235 0.188 0.561 0.646
2007 0.258 0.243 0.545 0.611 0.220 0.151 0.540 0.639
2008 0.256 0.230 0.571 0.660 0.344 0.296 0.774 0.838
2009 0.240 0.186 0.533 0.653 0.259 0.196 0.684 0.777
2010 0.233 0.185 0.546 0.648 0.235 0.188 0.561 0.746
2011 0.248 0.225 0.552 0.615 0.301 0.260 0.673 0.759
2012 0.279 0.265 0.562 0.652 0.324 0.296 0.693 0.813 2013 0.308 0.300 0.616 0.729 0.335 0.292 0.743 0.835
2014 0.319 0.273 0.641 0.890 0.357 0.302 0.823 0.860
2015 0.321 0.288 0.684 0.761 0.375 0.272 0.886 0.928
All Years 0.285 0.274 0.596 0.678 0.293 0.237 0.699 0.787
BIS Papers No 91 91
Book leverage regressions by country Table A13
HKG (1)
IDN (2)
KOR (3)
MYS (4)
PHL (5)
SGP (6)
THA (7)
Industry Median Lev t-1 0.367*** (8.1)
0.337*** (3.6)
0.321*** (6.2)
0.150** (2.5)
0.260** (2.4)
0.195*** (3.5)
0.324*** (4.6)
Profitabilityt-1 –0.332*** (–11.0)
–0.697*** (–10.1)
–0.884*** (–24.6)
–0.707*** (–15.1)
–0.322*** (–3.6)
–0.363*** (–8.5)
–0.711*** (–13.0)
M/Bt-1 –0.007** (–2.4)
–0.004 (–0.6)
0.012** (2.4)
0.002 (0.3)
0.002 (0.3)
–0.007 (–1.3)
0.005 (0.8)
Sizet-1 0.031*** (11.2)
0.044*** (8.7)
0.042*** (13.3)
0.045*** (11.0)
0.079*** (13.8)
0.027*** (7.5)
0.053*** (13.3)
Tangibilityt-1 0.097*** (4.9)
0.140*** (4.1)
0.246*** (11.3)
0.049* (1.9)
0.118*** (2.7)
0.093*** (3.6)
0.079*** (3.0)
Constant –0.045* (–1.8)
0.079* (1.8)
0.262*** (9.5)
–0.016 (–0.5)
–0.198*** (–4.0)
0.056* (1.9)
0.079** (2.1)
Year fixed effects Yes Yes Yes Yes Yes Yes Yes
R2-Adjusted 0.155 0.230 0.316 0.162 0.378 0.111 0.246
Observations 14,387 5,337 17,783 11,724 2,230 9,672 10,709
Note: ***, ** and * mean significance at the 1%, 5% and 10%, respectively.
Market leverage regressions by country Table A14
HKG (1)
IDN (2)
KOR (3)
MYS (4)
PHL (5)
SGP (6)
THA (7)
Industry Median Levt-1 0.393*** (10.1)
0.363*** (5.1)
0.442*** (10.3)
0.217*** (4.4)
0.367*** (3.9)
0.241*** (5.0)
0.321*** (6.3)
Profitabilityt-1 –0.316*** (–11.6)
–0.729*** (–11.1)
–0.830*** (–22.8)
–0.764*** (–15.3)
–0.503*** (–5.7)
–0.385*** (–9.4)
–0.678*** (–14.1)
M/Bt-1 –0.061*** (–20.4)
–0.069*** (–10.4)
–0.062*** (–13.5)
–0.052*** (–9.5)
–0.043*** (–4.7)
–0.060*** (–10.5)
–0.055*** (–10.4)
Sizet-1 0.029*** (10.6)
0.040*** (7.6)
0.044*** (13.1)
0.041*** (9.2)
0.068*** (9.8)
0.027*** (6.9)
0.041*** (10.9)
Tangibilityt-1 0.096*** (4.6)
0.155*** (4.4)
0.265*** (11.8)
0.069** (2.6)
0.126*** (2.7)
0.132*** (4.9)
0.071*** (2.8)
Constant 0.050** (2.1)
0.135*** (3.5)
0.301*** (10.9)
–0.017 (–0.6)
–0.158*** (–3.8)
0.078*** (3.0)
0.139*** (4.6)
Year fixed effects Yes Yes Yes Yes Yes Yes Yes
R2-Adjusted 0.258 0.339 0.415 0.231 0.394 0.217 0.332
Observations 14,387 5,337 17,783 11,724 2,230 9,672 10,709
Note: *** and ** mean significance at the 1% and 5%, respectively.

92 BIS Papers No 91
Appendix A. Variable definitions
Leverage measures
Book Leverage is the ratio of total debt (debt in current liabilities + long-term debt) to total debt plus book equity.
Market Leverage is the ratio of total debt (debt in current liabilities + long-term debt) to total debt plus market value of equity (stock price × shares outstanding).
Profitability
Profitability – operating income before depreciation (Profit) is the ratio of operating income before depreciation, to assets.
Firm size
Log of Assets (Assets) is the log of assets (in US dollars) deflated to 2010 dollars using the GDP deflator.
Growth opportunities
Market-to-Book ratio (Mktbk) is the ratio of market value of assets to book value of assets. Market value of assets is obtained as the sum of the assets – book value of equity + market value of equity (stock price × shares outstanding).
Industry
Median industry leverage (IndustLev) is the median of total debt to book (market) capitalisation by country, SIC code and year. Industry is defined at the four-digit SIC code level in the main results.
Nature of assets
Tangibility (Tang) is the ratio of net property, plant and equipment to assets.
Macroeconomic variables
Log(GDP per capita): Natural log of the average GDP per capita in US dollars.
General government gross debt as a percentage of GDP obtained from IMF World Economic Outlook (WEO).
Stock market capitalisation as a percentage of GDP also obtained from IMF WEO.
BIS Papers No 91 93
References
Bank for International Settlements (2016): 86th Annual Report, June.
Bernanke, B S and J Y Campbell (1988): “Is there a corporate debt crisis?”, Brookings Papers on Economic Activity, vol 1, pp 83‒139.
Booth, L, V Aivazian, A Demirguc-Kunt and V Maksimovic (2001): “Capital structures in developing countries”, Journal of Finance, vol 56, pp 87‒130.
DeAngelo, H and R Roll (2015): “How stable are corporate capital structures?”, Journal of Finance, vol 70, pp 373‒418.
Fama, E and K R French (2002): “Testing trade-off and pecking order predictions about dividends and debt”, Review of Financial Studies, vol 15, pp 1‒33.
Frank, M Z and V K Goyal (2003): “Testing the pecking order theory of capital structure”, Journal of Financial Economics, vol 67, pp 217‒48.
Frank, M Z and V K Goyal (2009): “Capital structure decisions: which factors are reliably important?”, Financial Management, vol 38, pp 1‒37.
Frank, M Z and V K Goyal (2015): “The profits-leverage puzzle revisited”, Review of Finance, vol 19, pp 1415‒53.
Giannetti, M (2003): “Do better institutions mitigate agency problems? Evidence from corporate finance choices”, Journal of Financial and Quantitative Analysis, vol 38, pp 185‒212.
Goyal, V K and F Packer (2017): “Capital structure in emerging Asia”, BIS Working Papers, forthcoming.
Graham, J R and C Harvey (2001): “The theory and practice of corporate finance: evidence from the field”, Journal of Financial Economics, vol 60, pp 187‒243.
Gungoraydinoglu, A and O Öztekin (2011): “Firm- and country-level determinants of corporate leverage: some new international evidence”, Journal of Corporate Finance, vol 17, pp 1457‒74.
Hong Kong Monetary Authority (2016): “Assessing Corporate Leverage In Hong Kong”, Half-Yearly Monetary and Financial Stability Report, September.
International Monetary Fund (2015): “Corporate leverage in emerging markets: a concern?”, Technical report, International Monetary Fund.
Kalemli-Ozcan, S, B Sorensen and S Yesiltas (2012): “Leverage across firms, banks, and countries”, Journal of International Economics, vol 88, pp 284‒98.
Leary, M and M Roberts (2014): “Do peer firms affect corporate financial policy?”, Journal of Finance, vol 69, pp 139‒78.
Leary, M T and M R Roberts (2005): “Do firms rebalance their capital structures?”, Journal of Finance, vol 60, pp 2575‒619.
Myers, S C (1977): “Determinants of corporate borrowing”, Journal of Financial Economics, vol 5, pp 147‒75.
Myers, S C (1984): “The capital structure puzzle”, Journal of Finance, vol 39, pp 575‒92.

94 BIS Papers No 91
Myers, S C and N S Majluf (1984): “Corporate financing and investment decisions when firms have information that investors do not have”, Journal of Financial Economics, vol 13, pp 187‒221.
Öztekin, O (2015): “Capital structure decisions around the world: which factors are reliably important?”, Journal of Financial and Quantitative Analysis, vol 50, pp 301‒23.
Rajan, R and L Zingales (1995): “What do we know about capital structure: some evidence from international data”, Journal of Finance, vol 50, pp 1421‒60.
Shin, H S (2013): “The second phase of global liquidity and its impact on emerging economies”, Keynote Speech at the Federal Research Bank of San Francisco, Asia Economic Policy Conference, November 3‒5, 2013, www.princeton.edu/ hsshin/www/FRBSF 2013.pdf.
Stulz, R (1990): “Managerial discretion and optimal financing policies”, Journal of Financial Economics, vol 26, pp 3‒27.
Welch, I (2004): “Capital structure and stock returns”, Journal of Political Economy, vol 112, pp 106‒31.
Welch, I (2011): “Two common problems in capital structure research: the financial-debt-to-assets ratio and issuing activity versus leverage changes”, International Review of Finance, vol 11, pp 1‒17.