corporate plan performance indicators
TRANSCRIPT

Corporate Plan Performance
Indicators
Headline Performance Update 31 December 2017

Forestry Commission England Headline Indicators Update 31 December 2017 2
Corporate Plan
Key Performance Indicators
Headline Performance Update
at 31 December 2017 (First Release)
Forestry Commission England’s Corporate Plan 2017-18 sets out our key performance indicators to show our contribution towards forestry and woodlands in England, and to
show barometers of trends in the wider forestry sector in England. The indicators continue to reflect our priorities to protect, improve and expand England’s woodlands.
They also display some of the contributions Forest Enterprise England makes to people, nature and the economy through the Public Forest Estate.
We report our six headline indicators in this series of quarterly updates, and report of our full suite of indicators annually. Our Indicators Report 2017 (June 2017) provides the
latest position. Our six headline performance indicators are shown in Table 1 below. Our use of indicators reflects Forestry Commission England’s commitment to evidence
based working and to ensuring that there is a robust evidence base available to the forestry sector to underpin policies and operational decisions.
We also help Defra provide Open Data. We publish much of the data that these reports are based upon and specific Open Datasets are signposted throughout this report. You
can obtain our spatial data from http://data-forestry.opendata.arcgis.com/ and statistical tables and spreadsheets from www.forestry.gov.uk/Statistics.
The 2016-17 outturns of these headline indicators have been assured by the Government Internal Audit Agency and also the systems in place by which these reports
have been produced have been verified by Internal Audit at the Forestry Commission.
Past, present and future reports are available from www.forestry.gov.uk > About us > Forestry Commission England > Indicators.
Responsible Statistician: David Cross CGeog
Evidence and Analysis Strategic Development, Forest Services
Bristol, 14th February 2017
Contact: [email protected]

Forestry Commission England Headline Indicators Update 31 December 2017 3
Table 1: Forestry Commission England Headline Performance Indicators
Forest Services
Protection Number of high priority forest pests in the UK Plant Health Risk
Register (UKPHRR).
Protection
Percentage of known tree felling that is carried out with Forestry
Commission approval (i.e. the % of felling that is licensable by the Forestry Commission that is not illegal felling. This excludes felling
with development approval)
Improvement Percentage of woodland in active management (including the Public Forest Estate)
Expansion Area of woodland and rate of new planting
Forest Enterprise England
Organisational Cost of managing the Public Forest Estate (per hectare)
Economy Number of private sector businesses operating on the Public Forest Estate

Forestry Commission England Headline Indicators Update 31 December 2017 4
Forest Services
Protection A. Number of high priority forest pests in the UK Plant Health Risk Register
(UKPHRR).
Source: UK Plant Health Risk Register (UKPHRR)1 data.
Report at end December 2017: There are 14 high priority forest pests in the UK
Plant Health Risk Register (UKPHRR), that require actions – in addition to
mitigations already implemented – to prevent them having a potentially substantial
negative impact on England’s woodland.
Fourteen (4%) of the 317 forest pests in the UKPHRR are ‘high priority’ because their
mitigated relative risk rating is 15 or more (see Note A and Table 2). The list and
number of high priority forest pests is the same as at the end previous quarter.
Of the 14 pests and diseases listed, 8 are currently present in England to varying
extents, with only 2 of these being classed as widespread, namely Pseudomonas
syringae pv. aesculi that causes horse chestnut bleeding canker, and Phytophthora alni
that affects all alder tree species in Britain.
1 https://secure.fera.defra.gov.uk/phiw/riskRegister/

Forestry Commission England Headline Indicators Update 31 December 2017 5
Phytophthora ramorum now represents a notable risk to sweet chestnut trees, and
Hymenoscyphus fraxineus (Chalara dieback of ash) continues to spread and cause death
of many ash trees, particularly in the south east and east, which is having an impact at a
landscape scale. Both are now considered widespread throughout Great Britain. Little
can be done to prevent trees becoming infected and there is no known cure for either
disease. Positively, however, following recommended biosecurity precautions does slow
disease spread.
Fourteen is one greater than the report at the end of June 2017, due to the addition of
Agrilus fleischeri that is a wood-boring insect, native to East Asia that can affect poplar
trees. It is currently absent from the UK but represents a palpable risk. The pathway for
movement is via wood packaging material such as pallets.
Table 2: The 14 high priority forest pests in the UKPHRR with a relative risk rating (mitigated) of 15 or more at end December 2017
Common
name Latin name
Type of
pest
Present
in the
UK?
Mitigated
Likelihood
score
Mitigated
Impact
rating
Mitigated
Likelihood
multiplied
by Impact
risk rating
Alder rust Melampsoridium
hiratsukanum Fungus
Present:
limited 5 4 20
Bleeding
canker of
horse
chestnut
Pseudomonas
syringae
pv. aesculi
Bacterium Present:
widespread 5 4 20
Shoot blight
on cedar/Tip
blight on
eastern
hemlocks
Sirococcus
tsugae Fungus
Present:
limited 5 4 20
n/a Agrilus
fleischeri Insect Absent 4 5 20
Sudden oak
death;
ramorum
dieback
Phytophthora
ramorum Oomycete
Present:
limited 4 4 16
Chalara ash
dieback
Hymenoscyphus
fraxineus Fungus
Present:
limited 4 4 16
Red-necked
longhorn
beetle
Aromia bungii Insect Absent 4 4 16

Forestry Commission England Headline Indicators Update 31 December 2017 6
Unmitigated risk ratings
The number of forest pests with an unmitigated risk rating of 15 or more at the end of
December 2017 is 54 (17%) of those on the UKPHRR. After mitigations the number is
14.
Notes:
A) Definition, Source and Summary: This indicator seeks to report trends in forest pests from
the UK Plant Health Risk Register (UKPHRR) that records and rates risks to UK crops, trees,
gardens and ecosystems from plant pests and pathogens. ‘High priority’ pests and diseases are
defined for the purposes of this indicator as those with a mitigated relative risk rating (the
mitigated likelihood score multiplied by the mitigated impact score) of 15 or more. The individual
ratings for likelihood and impact are each on a scale from 1 to 5. Relative risk ratings therefore
can have values from a minimum of 1 to a maximum of 25. Taking into account the economic,
environmental and social importance of the host species, these risk scores are used to help
prioritise additional actions to combat the threats posed by the pests. It should be noted that the
data are for the UK. Nearly all listed forest pests present in the UK will also be present in England
and listed forest pests absent from the UK are very likely to pose a threat to England.
B) ‘Likelihood’ provides an assessment of the probability of entry and establishment of a pest
for those pests that are absent from the UK which, when combined, can result in the introduction
of the threat to a new area. Some pests on the UKPHRR are already present in the UK. In these
cases the risk is that of the pest spreading to its maximum extent in the UK. The likelihood scale
has a minimum value of 1 (lowest risk) through to 5 (highest risk). There is more information on
Common
name Latin name
Type of
pest
Present
in the
UK?
Mitigated
Likelihood
score
Mitigated
Impact
rating
Mitigated
Likelihood
multiplied
by Impact
risk rating
Phytophthora
disease of
alder
Phytophthora
alni Oomycete
Present:
widespread 4 4 16
Zigzag elm
sawfly
Aproceros
leucopoda Insect Absent 4 4 16
Emerald ash
borer
Agrilus
planipennis Insect Absent 3 5 15
Acute oak
decline n/a Other
Present:
limited 3 5 15
Two spotted
oak
buprestid
Agrilus
biguttatus Insect
Present:
limited 3 5 15
Butternut
canker
Ophiognomonia
clavigignenti-
juglandacearum
Fungus Absent 3 5 15
Sachalin fir
bark beetle
Polygraphus
proximus Insect Absent 3 5 15

Forestry Commission England Headline Indicators Update 31 December 2017 7
the factors taken into account in the Phase 1 UK Plant Health Risk Register – Summary Guide2
(page 6).
C) ‘Impact’ is an indication of the relative consequence of the pest for the host plant or sector,
should the risk materialise. It does not take account of the size or value of the host or sector.
Where the pest is already present, the impact is that caused by further spread, against a baseline
of damage already occurring. Thus for a pest which is already widespread, the additional impact
of it spreading to its full potential distribution may be limited, even if the pest itself is very
damaging or expensive to control. The impact scale has a minimum value of 1 (lowest risk)
through to 5 (highest risk). There is more on the factors taken into account in the Phase 1 UK
Plant Health Risk Register – Summary Guide (page 6-7).
D) ‘Value at risk’. Value at risk is not taken into account in this indicator.
E) ‘Mitigations’ can reduce likelihood, impact or both and the risks remaining after mitigation
provide the basis for this indicator. Mitigations may reduce risk by enhancing regulation,
surveillance, awareness and research, or by providing an industry scheme or a contingency plan.
The difference between unmitigated and mitigated risk represents an expert judgement of the
effectiveness of the current mitigations. See Phase 1 UK Plant Health Risk Register – Summary
Guide (page 4) for details.
F) Possible Relative Risk Ratings: Relative risk ratings can take values from a minimum of 1
(lowest risk) through to 25 (highest risk). For the purposes of this indicator ‘high priority’ pests
have been defined as those with a relative risk rating of 15 or more.
G) Other forest pests and diseases affecting English woodland. The indicator is only based
on the pests included in the UKPHRR. In so doing it effectively captures the major non-native
pests threatening UK forestry together with a limited selection of native pests that are the subject
of major Government campaigns of action. There are many native and non-native forest pests
that are not included in the UKPHRR.
H) Precise end of quarter report dates are: 9th April 2014, 2nd July 2014, 19th September
2014, 31st December 2014, 30th March 2015, 23rd June 2015, 24th September 2015,
29th December 2015, 30th March 2016, 7th July 2016, 30th September 2016, 30th December 2016,
30th March 2017, 4th July 2017, 2nd October 2017, and 27th December 2017.
Open Data: The spreadsheets of the UK Plant Health Risk Register (UKPHRR).
2 https://secure.fera.defra.gov.uk/phiw/riskRegister/Summary-of-Guidance-for-phase-1-Public-Ver2.pdf

Forestry Commission England Headline Indicators Update 31 December 2017 8
B. Percentage of known tree felling that is carried out with Forestry Commission
approval (i.e. the % of felling that is licensable by the Forestry Commission that is not illegal felling. This excludes felling with development approval)
Source: Forestry Commission administrative data
Report for year to 31 December 2017: 99.93% of known tree felling was carried
out with Forestry Commission approval. The aim is to keep this indicator above
95%.
Open Data: Locations of approved felling licence applications in England are available
from the Forestry Commission Open Data site.

Forestry Commission England Headline Indicators Update 31 December 2017 9
Improvement
Percentage of woodland in active management (including the Public Forest
Estate)
Source: Forestry Commission administrative data and the National Forest Inventory
Position at 31 December 2017 is that 58 out of every 100 hectares of English
woodland are actively managed, totalling 763,000 hectares of woodland in
management.
The percentage of woodland that is actively managed remains at 58%. There is scope to
further increase the area of woodland in active management to meet the strong demand
for UK-grown timber and to help address the impact of tree pests and diseases.
Open Data: Locations of ‘managed woodland’ in England are available from the Forestry
Commission Open Data site.
Forestry Commission England Headline Indicators Update 31 December 2017 10
Expansion
Area of Woodland
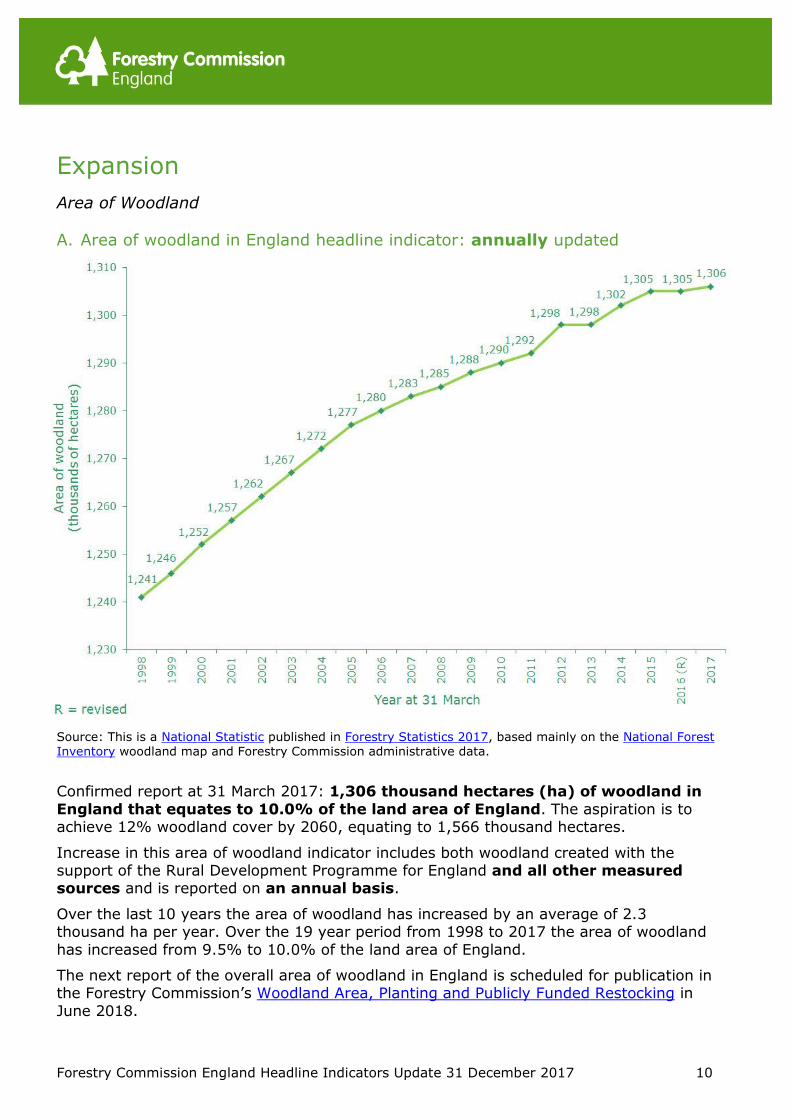
A. Area of woodland in England headline indicator: annually updated
Source: This is a National Statistic published in Forestry Statistics 2017, based mainly on the National Forest Inventory woodland map and Forestry Commission administrative data.
Confirmed report at 31 March 2017: 1,306 thousand hectares (ha) of woodland in
England that equates to 10.0% of the land area of England. The aspiration is to achieve 12% woodland cover by 2060, equating to 1,566 thousand hectares.
Increase in this area of woodland indicator includes both woodland created with the support of the Rural Development Programme for England and all other measured sources and is reported on an annual basis.
Over the last 10 years the area of woodland has increased by an average of 2.3 thousand ha per year. Over the 19 year period from 1998 to 2017 the area of woodland
has increased from 9.5% to 10.0% of the land area of England.
The next report of the overall area of woodland in England is scheduled for publication in the Forestry Commission’s Woodland Area, Planting and Publicly Funded Restocking in
June 2018.

Forestry Commission England Headline Indicators Update 31 December 2017 11
B. Hectares of woodland created (gross) specifically with the grant support of the
Rural Development Programme for England, and the approximate number of trees that represents – quarterly updated
The figures in this section show new planting of woodland in England supported by the Rural Development Programme for England: both the English Woodland Grant Scheme
(EWGS) and Countryside Stewardship (CS) incentives. This is based on the area (in hectares) of grant claims actually paid to woodland owners in each quarter.
Figures on the new planting of trees towards the Government’s manifesto commitment to plant 11 million trees in the 2017-22 parliament, also includes trees planted with
other forms of government support, and will be reported separately in Government supported new planting of trees in England in June 2018.
The most recent National Statistics covering all recorded new planting of woodland in England, also including that without direct government support, were published in
Forestry Statistics 2017. The next report of this measure of all new planting in England is scheduled for publication in the Forestry Commission’s Woodland Area, Planting and
Publicly Funded Restocking in June 2018.
i) RDPE-supported new planting by quarter (in hectares)
Source: Forestry Commission administrative data. Figures may not sum due to rounding.
Woodland created with RDPE grant support October to December 2017: 104 hectares,
equating to about 181,000 trees in this quarter.

Forestry Commission England Headline Indicators Update 31 December 2017 12
The area of paid RDPE claims in this quarter is greater than the comparable quarter in each of the previous two years, but broadly comparable with the average for this quarter
over the past six years.
ii) RDPE-supported new planting: summary by financial year (in hectares)
Open Data: The National Forest Inventory woodland map and locations of RDPE grant
supported woodland creation in England are available as spatial data from the Forestry
Commission Open Data site.

Forestry Commission England Headline Indicators Update 31 December 2017 13
Forest Enterprise England
Organisational
Cost of managing the Public Forest Estate (per hectare)
Source: Forestry Enterprise England accounts.
Reports for this indicator are published as at 31 March and 30 September each year. The most recent report as at 30 September 2017 is as follows.
Forecast for the 2017-18 financial year, as at 30 September 2017: £92.42 per hectare,
against a target of £98.81 per hectare.
The target for 2017-18 is greater than previous years due to Forest Enterprise England’s
(FEE) planned project expenditure on the transfer of shared services from Edinburgh
because of devolution. This expenditure is funded from FEE reserves.
Current and projected performance indicates FEE performance on this indicator should
be better than target for the full 2017-18 financial year.

Forestry Commission England Headline Indicators Update 31 December 2017 14
Economy
Number of private sector businesses operating on the Public Forest Estate (PFE)
Source: Forestry Commission administrative data.
Position at 31 December 2017: 606 private businesses and individuals.
There has been continued sustainable growth of the overall indicator, led by an increase
in the number of licences and permissions for business activities since September 2017.