key performance indicators to increase production ... · pdf filekey performance indicators to...
TRANSCRIPT
I J A B E R, Vol. 13, No. 7 (2015): 4745-4768
KEY PERFORMANCE INDICATORS TO INCREASE PRODUCTION PERFORMANCE:
A CASE STUDY OF A MEDIUM MANUFACTURE IN INDONESIA
Priscilia Tancongsonery,1 and Nila Krisnawati2
Abstract: This purpose of this study is to analyze the current performance measurement system (PMS) and key performance indicators (KPIs) implemented in the Production department of a medium manufacture in Indonesia and its implications towards production performance. This research is a mixture of quantitative and qualitative research and using both primary and secondary data, which were collected from the company internal reports and in-depth interview with the Head of Production Planning and Control of the company.
The current measurement system and KPIs were analyzed using the SCOR model, while the implications of KPIs towards production performance were analyzed using Structural Equation Modelling (SEM) to identify the influential factors to production performance. Overall, this study uses time series data from January 2014 – March 2014.
Based on the results of this research, it was analyzed that the current PMS has only integrated one out of four Operational KPIs implemented in the department to measure production performance. It has also been indicated that out of those four KPIs, three has been found to be influential in affecting production performance with Rework Rate as the most significant factor that affects performance.
Keywords: SEM, KPI, SCOR Model, Production Performance, Performance Measurement System.
I . INTRODUCTIONIn the tight global competition nowadays, performance measurement has become crucially important for the management to properly evaluate the company’s performance and to formulate further future goals. Information is gathered so that the tasks that are carried out can be controlled and be accountable. This is done to ensure that the business will be able to achieve efficiency and effectiveness throughout the whole business process (Widodo, 2011).
1. Swiss German University, [email protected]. Swiss German University, [email protected]
One of the approaches that can be used to measure performance is called Key Performance Indicators or simply KPI. KPIs are financial and non-financial measures that organizations use to reveal how successful they were in accomplishing long lasting goals (Velimirovic, Velimirovic, & Stankovic, 2011). KPI is commonly used to measure or compare performance in terms of meeting and achieving a company’s strategic and operational goals.
In a manufacture operational perspective, production performance is considered to be the most crucial factor in determining the overall company profitability. Making sure that their system and resources are working efficiently to help boost profitability most certainly has important roles in the operational strategies of these companies.
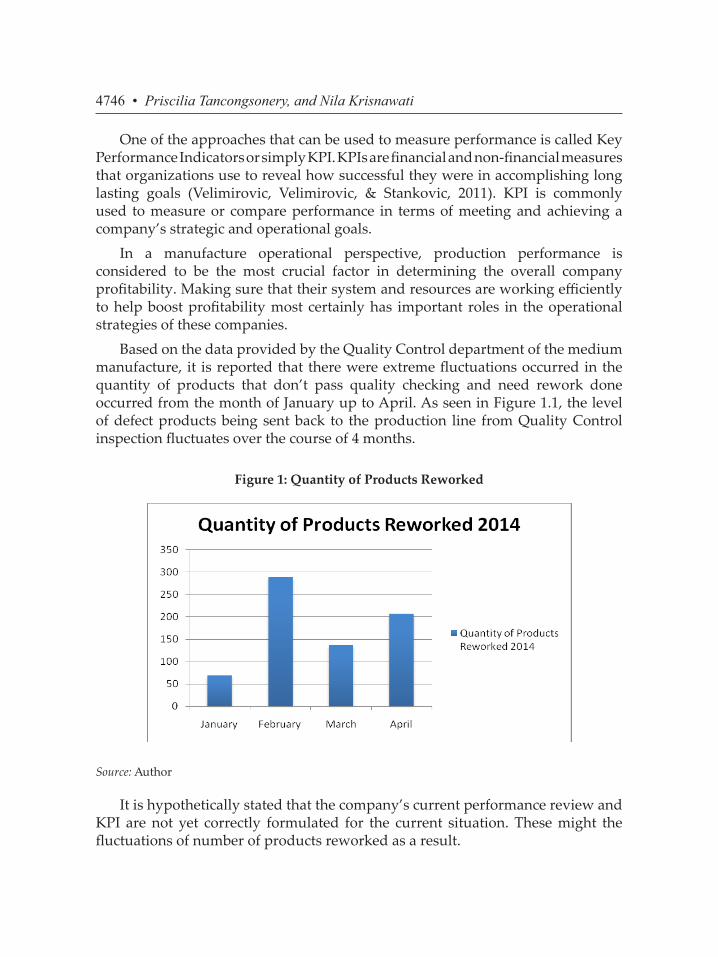
Based on the data provided by the Quality Control department of the medium manufacture, it is reported that there were extreme fluctuations occurred in the quantity of products that don’t pass quality checking and need rework done occurred from the month of January up to April. As seen in Figure 1.1, the level of defect products being sent back to the production line from Quality Control inspection fluctuates over the course of 4 months.
Figure 1: Quantity of Products Reworked
Source: Author
It is hypothetically stated that the company’s current performance review and KPI are not yet correctly formulated for the current situation. These might the fluctuations of number of products reworked as a result.
4746 • Priscilia Tancongsonery, and Nila Krisnawati
Therefore it is necessary to analyze the production process and the current Key Performance Indicators (KPI). It could also assist the company to overcome this current issue in their production line including improve its performance in the production department.
2. LITERATURE REVIEW
Key Performance Indicators
David Parmenter, a business measurement expert defines Key Performance Indicators or KPIs as “…quantifiable measurements, agreed to beforehand, that reflect the Critical Success Factors of the company or (departments or projects)”. Key Performance Indicators can also indicate the performance of specific and focused occurrences in the organisation that would be able to directly affect the value of the organisation itself (Kritzinger, 2009).
Key Performance Indicators represent a set of measures focusing on the aspects of performance that are vitally important for the current and upcoming success of the company. KPIs are not new to the organizations. They either have not been recognized before or have been abandoned to “gather dust” somewhere, out of sight of the current management team (Parmenter, 2010).
Key Performance Indicators must be determined for every single critical success factor of a company. The right KPIs will make a great difference, they will bring along more constant attention from the management because they will tell the management what action needs to take place. Also, KPIs are deep enough in the organization that it can be tied to an individual (Parmenter, 2010).
KPI for Measuring Production Performance
Manufacturing performance is crucial to the success of many companies. Fine performance leads to competitiveness. In order to hold its competitive position, manufacturing companies must evaluate their performance regularly. Thus, it is extremely important for manufacturing companies to identify and ensure good performance in the competition. When correctly introduced and analyzed, Key Performance Indicators can be used to comprehend and further improve manufacturing performance. It is mainly because KPIs are nowadays leaning towards real time data and are used to support in making decisions that can enhance manufacturing performance (Kuncoro, 2007).
Performance indicators do not just simply describe what has happened, but they also influence what will happen because they gives input and information for decision makers to make decisions that will further affect the future competitive position of the company. The role of performance indicators in manufacturing is to
Key Performance Indicators to Increase Production Performance… • 4747
reflect the current condition of the manufacturing situation, to monitor and control operational efficiency, to propel improvements and to measure the effectiveness of manufacturing decisions implemented (E. Amrina & S. M. Yusof, 2011).
Performance Measurement System
Performance Measurement Systems are considered to be an essential and critical element of any managerial systems. However, there is no single definition of Performance Measurement System (PMS) in the literature. (Ivan Cavalcante Araujo Junior & Roberto Antonio Martins, 2009). A thorough definition of it is that PMS is a system that allows informed decisions to be made and actions to be taken because it evaluates the efficiency and effectiveness of past actions through acquisition, collation, sorting, analysis, interpretation and dissemination of appropriate data (Neely, 2011).
Performance Measurement System lays out the essential information that is important for decision-making and actions. It becomes extremely difficult for companies to understand why poor performance still continually happens, or how improvement could be made without the use of appropriate PMSs (Leong, M. S. & Tilley, P., 2008).
SCOR Model
Supply Chain Operation Reference or simply called SCOR is a model reference based on supply chain operation. SCOR is able to map out various parts of supply chain, because basically SCOR is a model that is based on process (Pujawan, 2005).
SCOR model provides guidance on the metrics that can be used to get a balanced approach towards measuring the performance of a company’s overall supply chain. Moreover, SCOR Model approach addresses the needs of the management of the operations directly. (Supply Chain Council, 2004)
SCOR Five Distinct Management Processes
The SCOR process model consists of five distinct core management processes: Plan, Source, Make, Deliver and Return (Supply Chain Council, 2004). Those five process elements have the functions of:
(i) Plan
Processes that balance aggregate demand and supply to determine the best action taken in fulfilling orders, needs of production and shipment. Plan also includes the process of forecasting distribution needs, planning and supply control, material planning, production planning, capacity planning and balances the plan of supply chain with financial plan.
4748 • Priscilia Tancongsonery, and Nila Krisnawati
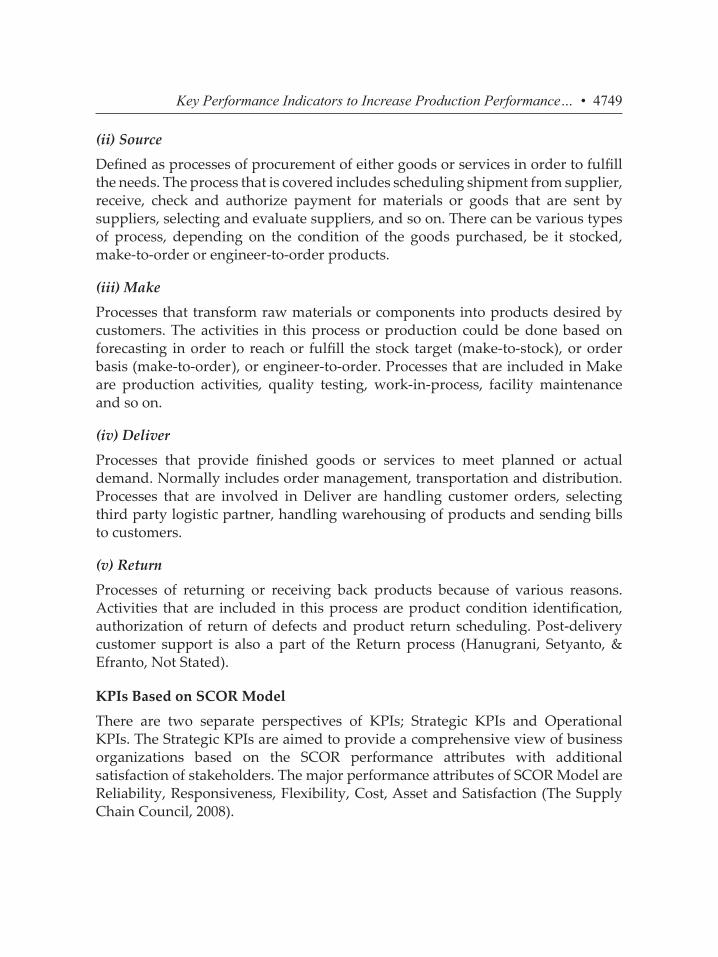
(ii) Source
Defined as processes of procurement of either goods or services in order to fulfill the needs. The process that is covered includes scheduling shipment from supplier, receive, check and authorize payment for materials or goods that are sent by suppliers, selecting and evaluate suppliers, and so on. There can be various types of process, depending on the condition of the goods purchased, be it stocked, make-to-order or engineer-to-order products.
(iii) Make
Processes that transform raw materials or components into products desired by customers. The activities in this process or production could be done based on forecasting in order to reach or fulfill the stock target (make-to-stock), or order basis (make-to-order), or engineer-to-order. Processes that are included in Make are production activities, quality testing, work-in-process, facility maintenance and so on.
(iv) Deliver
Processes that provide finished goods or services to meet planned or actual demand. Normally includes order management, transportation and distribution. Processes that are involved in Deliver are handling customer orders, selecting third party logistic partner, handling warehousing of products and sending bills to customers.
(v) Return
Processes of returning or receiving back products because of various reasons. Activities that are included in this process are product condition identification, authorization of return of defects and product return scheduling. Post-delivery customer support is also a part of the Return process (Hanugrani, Setyanto, & Efranto, Not Stated).
KPIs Based on SCOR Model
There are two separate perspectives of KPIs; Strategic KPIs and Operational KPIs. The Strategic KPIs are aimed to provide a comprehensive view of business organizations based on the SCOR performance attributes with additional satisfaction of stakeholders. The major performance attributes of SCOR Model are Reliability, Responsiveness, Flexibility, Cost, Asset and Satisfaction (The Supply Chain Council, 2008).
Key Performance Indicators to Increase Production Performance… • 4749
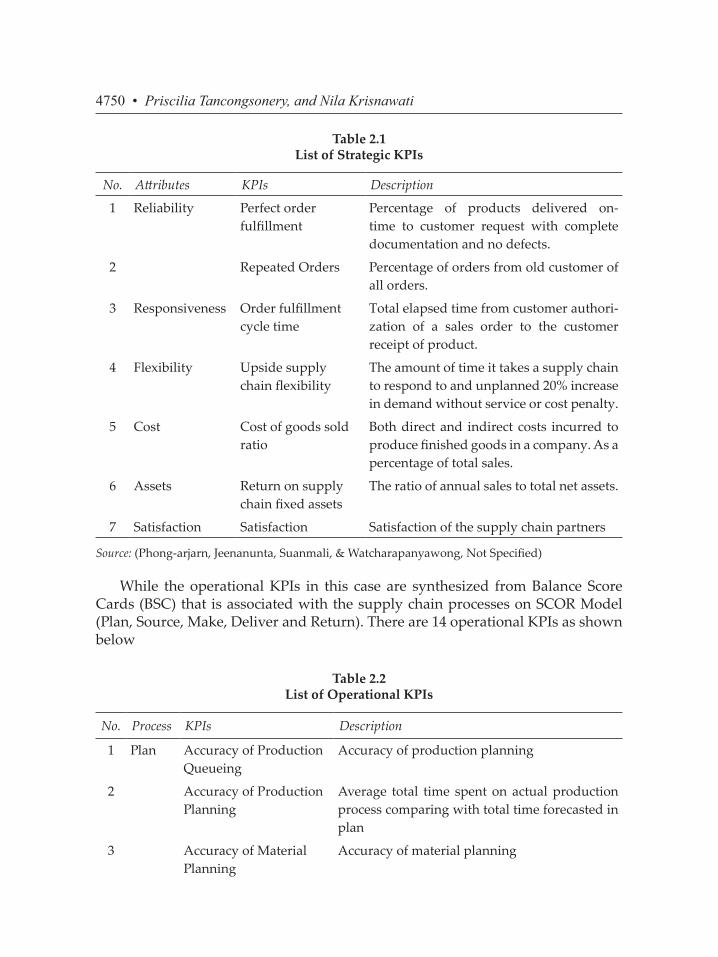
Table 2.1 List of Strategic KPIs
No. Attributes KPIs Description
1 Reliability Perfect order fulfillment
Percentage of products delivered on-time to customer request with complete documentation and no defects.
2 Repeated Orders Percentage of orders from old customer of all orders.
3 Responsiveness Order fulfillment cycle time
Total elapsed time from customer authori-zation of a sales order to the customer receipt of product.
4 Flexibility Upside supply chain flexibility
The amount of time it takes a supply chain to respond to and unplanned 20% increase in demand without service or cost penalty.
5 Cost Cost of goods sold ratio
Both direct and indirect costs incurred to produce finished goods in a company. As a percentage of total sales.
6 Assets Return on supply chain fixed assets
The ratio of annual sales to total net assets.
7 Satisfaction Satisfaction Satisfaction of the supply chain partners
Source: (Phong-arjarn, Jeenanunta, Suanmali, & Watcharapanyawong, Not Specified)
While the operational KPIs in this case are synthesized from Balance Score Cards (BSC) that is associated with the supply chain processes on SCOR Model (Plan, Source, Make, Deliver and Return). There are 14 operational KPIs as shown below
Table 2.2 List of Operational KPIs
No. Process KPIs Description
1 Plan Accuracy of Production Queueing
Accuracy of production planning
2 Accuracy of Production Planning
Average total time spent on actual production process comparing with total time forecasted in plan
3 Accuracy of Material Planning
Accuracy of material planning
4750 • Priscilia Tancongsonery, and Nila Krisnawati
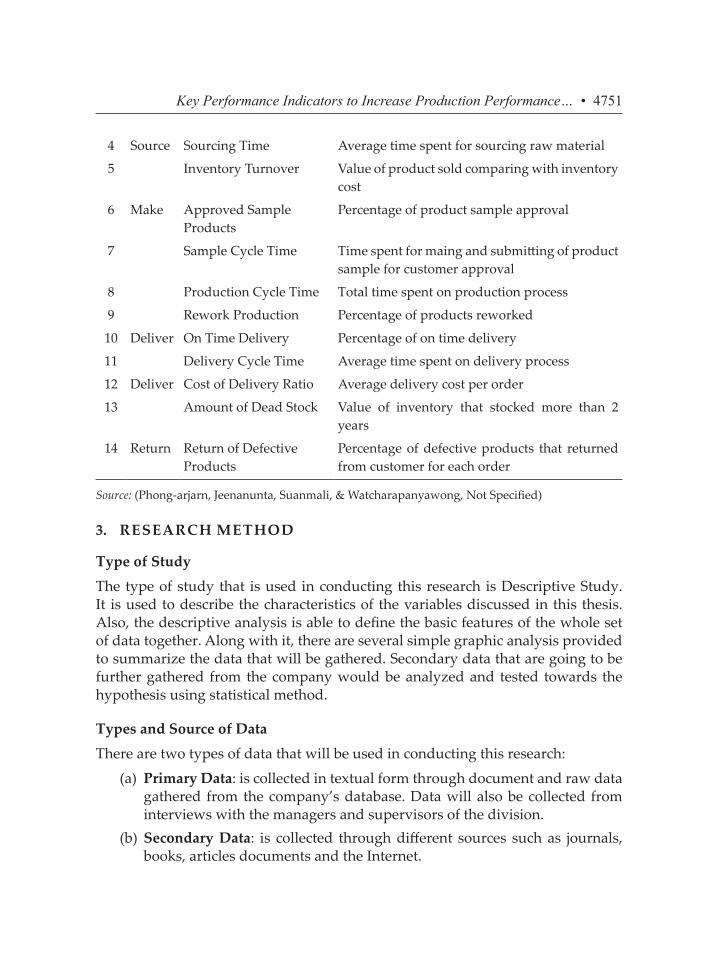
4 Source Sourcing Time Average time spent for sourcing raw material
5 Inventory Turnover Value of product sold comparing with inventory cost
6 Make Approved Sample Products
Percentage of product sample approval
7 Sample Cycle Time Time spent for maing and submitting of product sample for customer approval
8 Production Cycle Time Total time spent on production process
9 Rework Production Percentage of products reworked
10 Deliver On Time Delivery Percentage of on time delivery
11 Delivery Cycle Time Average time spent on delivery process
12 Deliver Cost of Delivery Ratio Average delivery cost per order
13 Amount of Dead Stock Value of inventory that stocked more than 2 years
14 Return Return of Defective Products
Percentage of defective products that returned from customer for each order
Source: (Phong-arjarn, Jeenanunta, Suanmali, & Watcharapanyawong, Not Specified)
3. RESEARCH METHOD
Type of Study
The type of study that is used in conducting this research is Descriptive Study. It is used to describe the characteristics of the variables discussed in this thesis. Also, the descriptive analysis is able to define the basic features of the whole set of data together. Along with it, there are several simple graphic analysis provided to summarize the data that will be gathered. Secondary data that are going to be further gathered from the company would be analyzed and tested towards the hypothesis using statistical method.
Types and Source of Data
There are two types of data that will be used in conducting this research:
(a) Primary Data: is collected in textual form through document and raw data gathered from the company’s database. Data will also be collected from interviews with the managers and supervisors of the division.
(b) Secondary Data: is collected through different sources such as journals, books, articles documents and the Internet.
Key Performance Indicators to Increase Production Performance… • 4751
SCOR Model Approach
Data Collection
Data collection is done within the research to gather and filter information. Data collected in this phase will be inputs in the next step of data processing. The methods that are used in this phase are internal data collection from the company, observation and in-depth interview. Data that are needed are Production Planning Report and Production Report.
Data Processing
After the data needed are collected, then data processing is done through scoring with SCOR model that is in line with the existing problem that is going to be further analyzed.
Analysis and Conclusion
Analysis that is going to be conducted would be towards the result of data processing based on the SCOR model system. The results will show the score and performance of the Operational KPIs. While conclusion is the final step of the research that will include the overall conclusion that is derived from the results of data collection, processing and analysis that all aim to answer the research objectives that have been set.
4. RESULTS AND DISCUSSIONS
A Brief of Company
The company mainly focuses on producing custom order products made out of Tungsten Carbide. Tungsten Carbide is a very hard gray compound made by the reaction of tungsten (a type of hard metal) and carbon at high temperatures, it is used in making engineering dies or moulds, cutting and drilling tools (Oxford University Press, None). The company itself is a result of a joint-venture effort of Indonesia and Taiwan.
The company’s products range from precision dies (or widely known as mould), nozzles, and tools to punchers and knives that are used in industries such as automotive, electronics and mining. The company is considered as one of the market leaders in Indonesia, since only a handful others that use Tungsten Carbide as the main material for their metal products.
Within its facility that employs 42 workers in their factory plan in the Production department, the company is able to produce an average of 9000 pieces of product every single month, The machineries that are used to produce such number of
4752 • Priscilia Tancongsonery, and Nila Krisnawati
output fell into two types, fully automated machineries that does not need any manual operators and conventional machines that although somewhat automatic, still need manual labor to operate and to adjust the settings for production. In percentage, around 90 percent of the machineries used in the factory are conventional machineries and only 10 percent of it is fully automated ones.
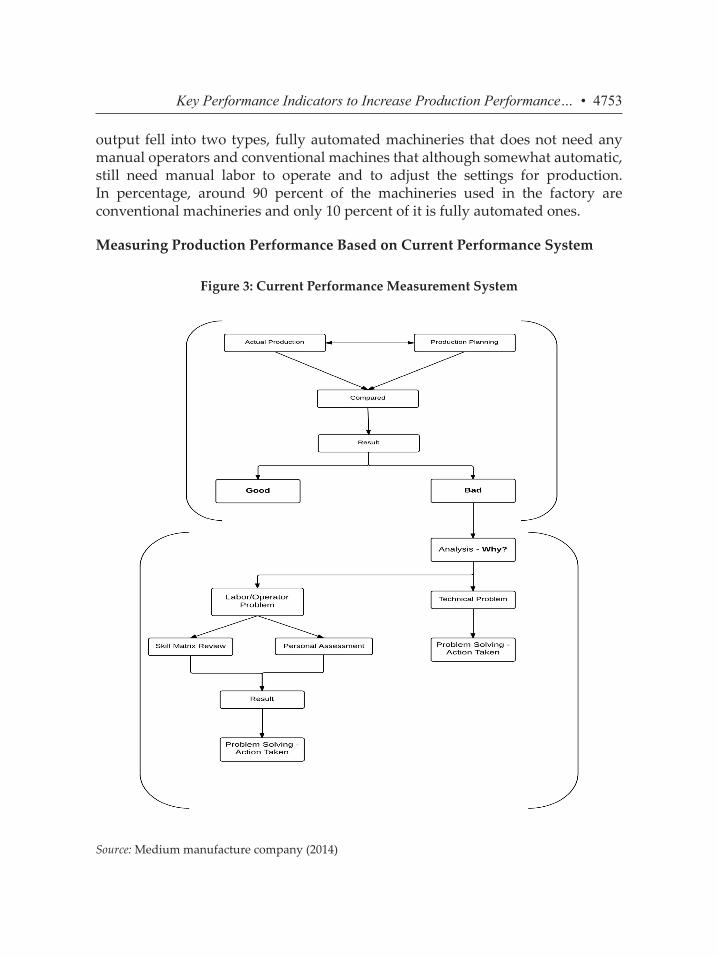
Measuring Production Performance Based on Current Performance System
Figure 3: Current Performance Measurement System
Source: Medium manufacture company (2014)
Key Performance Indicators to Increase Production Performance… • 4753
In the current situation of the Production Department in The current Performance system is divided into two sections, the first one is Comparison stage and the second one is Analysis stage.
Comparison Stage
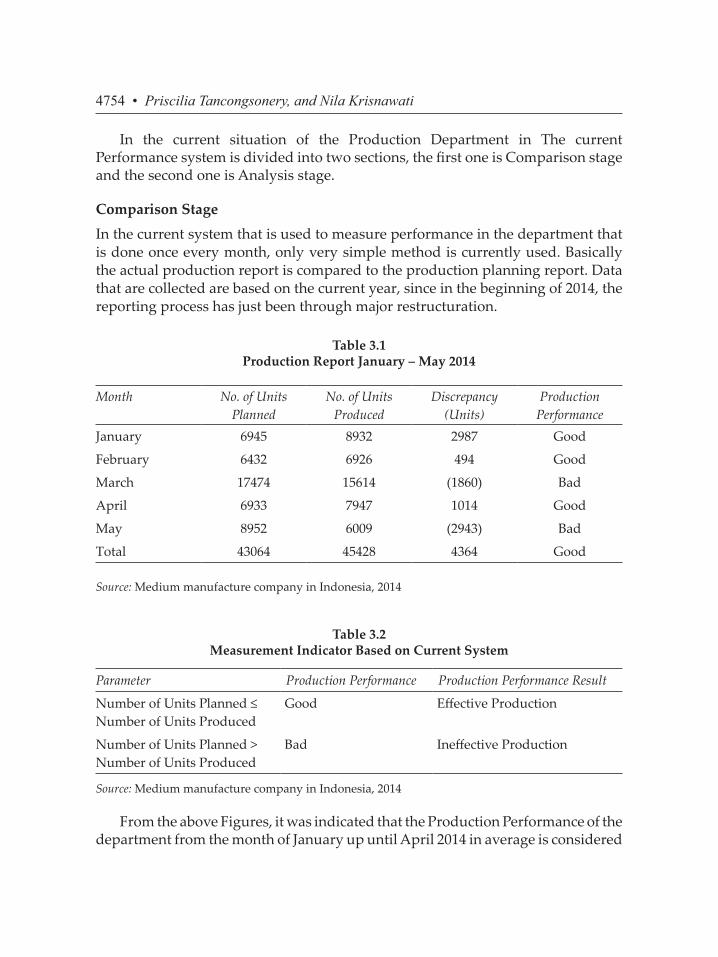
In the current system that is used to measure performance in the department that is done once every month, only very simple method is currently used. Basically the actual production report is compared to the production planning report. Data that are collected are based on the current year, since in the beginning of 2014, the reporting process has just been through major restructuration.
Table 3.1 Production Report January – May 2014
Month No. of Units Planned
No. of Units Produced
Discrepancy (Units)
ProductionPerformance
January 6945 8932 2987 Good
February 6432 6926 494 Good
March 17474 15614 (1860) Bad
April 6933 7947 1014 Good
May 8952 6009 (2943) Bad
Total 43064 45428 4364 Good
Source: Medium manufacture company in Indonesia, 2014
Table 3.2 Measurement Indicator Based on Current System
Parameter Production Performance Production Performance Result
Number of Units Planned ≤ Number of Units Produced
Good Effective Production
Number of Units Planned > Number of Units Produced
Bad Ineffective Production
Source: Medium manufacture company in Indonesia, 2014
From the above Figures, it was indicated that the Production Performance of the department from the month of January up until April 2014 in average is considered
4754 • Priscilia Tancongsonery, and Nila Krisnawati
Good as there was a surplus of actual production compared to production planned of 7575 units. It is normal for the production to experience surplus in comparison of the planning and the units produced, as gathered from the in-depth interview. It is mainly because customers order might come in way after production planning has been done the month before.
However, when there is a shortfall in the production, by means the number that was planned is bigger than the actual one produced, then the production performance is considered bad, as there must be an explanation as of why the production system cannot fulfil the number that was planned in the first place.
Analysis Stage
When the performance of the production line is considered bad, like for instance in based on the report above in the month of March through May, then analysis of problem is going to be carried out and the root of problem or what causes the performance to be bad or not satisfactory will be investigated.
Based on the current system, in all of the cases, there are only two possibilities:
(a) The problem is caused by technical issues, by means it might be caused by the machines, system or other technical components
(b) The problem is caused by the operator (worker)When it is found out that technical issues caused the problem, then necessary
action or adjustment must be taken immediately so that it does not affect the upcoming production. However, when the problem was caused by the operator or worker, then two assessments or review will be conducted, which are the Skills Matrix Review and Personal Assessment. Based on this, the supervisors in the department will assess the operators and take action based on the result of the assessments.
The Production department currently implements four Operational KPIs in their system, which are Production Planning, Material Planning, Rework Production and Return of Defective Products. However, in the current Performance Measurement System, only one out of the four are being integrated and used to measure performance. The only Operational KPI integrated is Production Planning. Even though Material Planning is tied together with Production Planning in the department as explained previously, it is not used to measure performance in the current system
The other two KPIs, Rework Production and Return of Defective Products are not yet integrated to the department’s formal system to measure production performance up until now. Even though, according to the in depth interview conducted, those two other indicators have the ability to assess the level of
Key Performance Indicators to Increase Production Performance… • 4755
production performance of the department and the majority time are discussed in the monthly Production control meeting.
Measuring Production Performance Based on SCOR Model
a. Identifying Process and Performance Target Process in Production
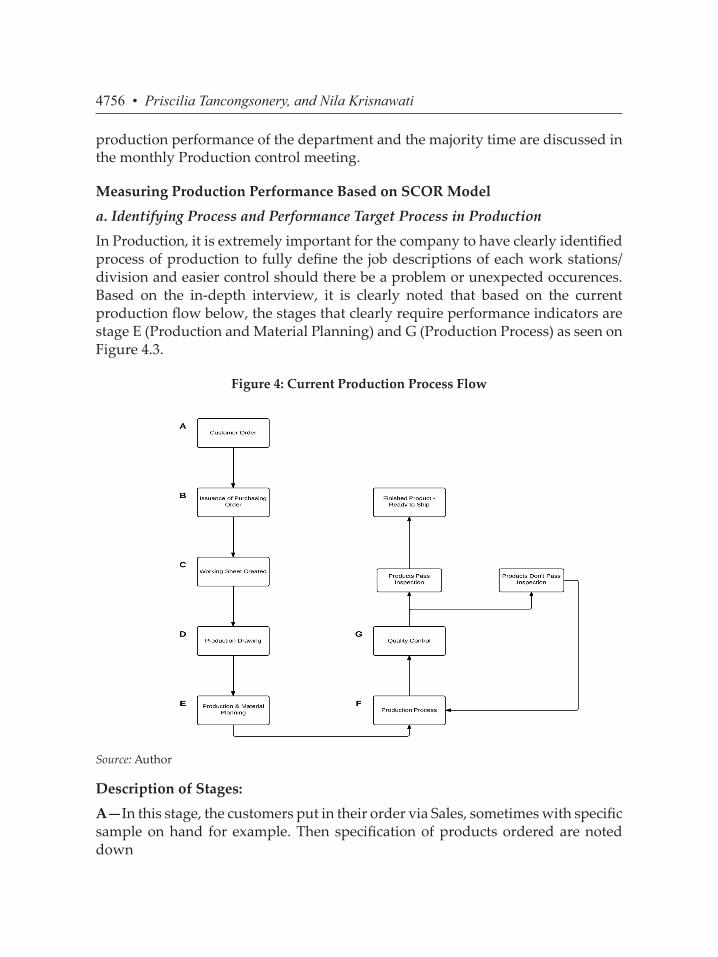
In Production, it is extremely important for the company to have clearly identified process of production to fully define the job descriptions of each work stations/division and easier control should there be a problem or unexpected occurences. Based on the in-depth interview, it is clearly noted that based on the current production flow below, the stages that clearly require performance indicators are stage E (Production and Material Planning) and G (Production Process) as seen on Figure 4.3.
Figure 4: Current Production Process Flow
Source: Author
Description of Stages:
A—In this stage, the customers put in their order via Sales, sometimes with specific sample on hand for example. Then specification of products ordered are noted down
4756 • Priscilia Tancongsonery, and Nila Krisnawati
B—The customer specifications that were noted in the first stage are turned into Purchasing Order (P/O). Then the P/O is transferred from Sales to Production.
C—Production Department translated the Purchasing Order (P/O) into a working sheet with detailed specifications of order for production line.
D—Then the working sheet created is turned into model drawing for working instruction for operators
E—In this stage, Production Planning Control (PPC) plans the production timeline, units and material needed for production
F—Production begins based on the product drawing specifications that was created in the previous stage. Then, finished outputs are transferred to Quality Control for inspection based on drawing and specifications
G—Afterwards, compability of finished products with specifications ordered by customers checked. If the products failed to comply with the specifications, those will be transferred back to Production to be reworked, if they pass the inspection, those will be packed and shipped to the customers.
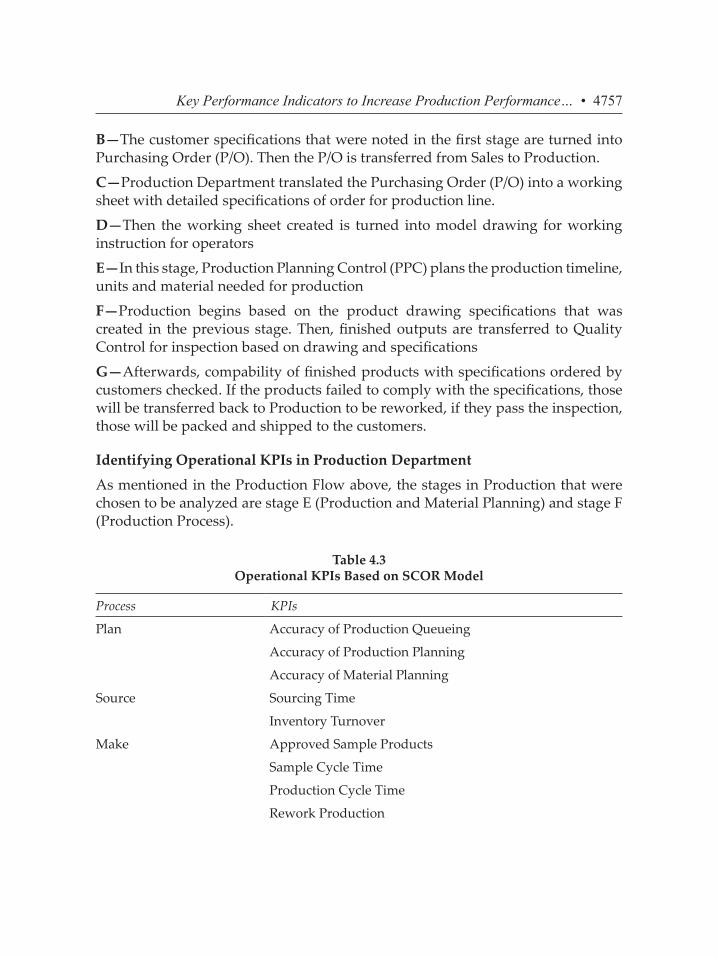
Identifying Operational KPIs in Production Department
As mentioned in the Production Flow above, the stages in Production that were chosen to be analyzed are stage E (Production and Material Planning) and stage F (Production Process).
Table 4.3 Operational KPIs Based on SCOR Model
Process KPIs
Plan Accuracy of Production Queueing
Accuracy of Production Planning
Accuracy of Material Planning
Source Sourcing Time
Inventory Turnover
Make Approved Sample Products
Sample Cycle Time
Production Cycle Time
Rework Production
Key Performance Indicators to Increase Production Performance… • 4757
Deliver On Time Delivery
Delivery Cycle Time
Cost of Delivery Ratio
Amount of Dead Stock
Return Return of Defective Products
Source: (Phong-arjarn, Jeenanunta, Suanmali, & Watcharapanyawong, Not Specified)
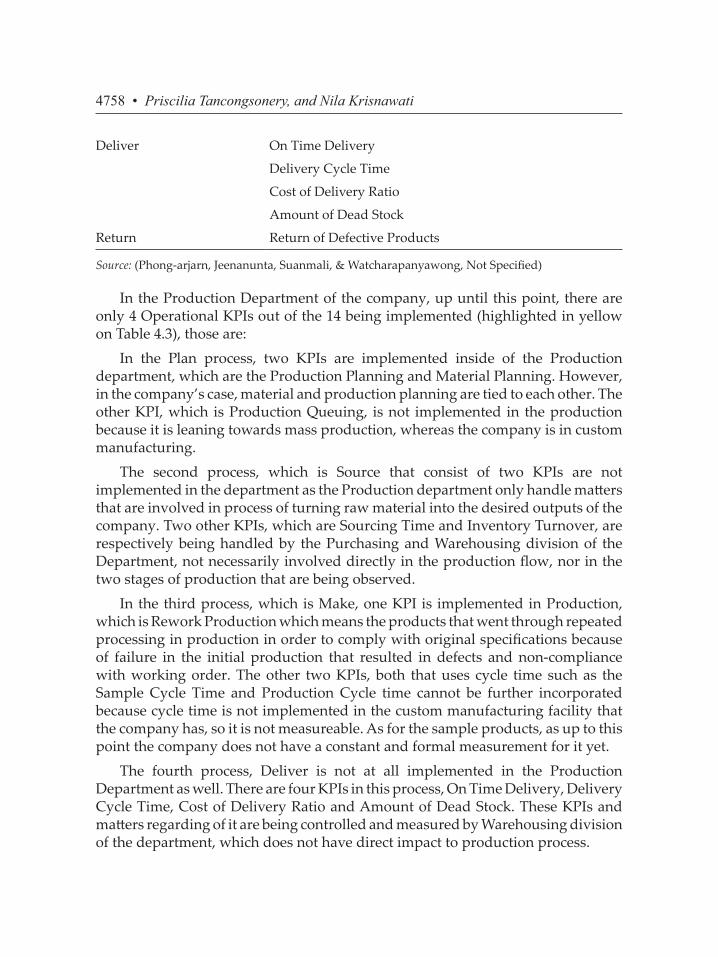
In the Production Department of the company, up until this point, there are only 4 Operational KPIs out of the 14 being implemented (highlighted in yellow on Table 4.3), those are:
In the Plan process, two KPIs are implemented inside of the Production department, which are the Production Planning and Material Planning. However, in the company’s case, material and production planning are tied to each other. The other KPI, which is Production Queuing, is not implemented in the production because it is leaning towards mass production, whereas the company is in custom manufacturing.
The second process, which is Source that consist of two KPIs are not implemented in the department as the Production department only handle matters that are involved in process of turning raw material into the desired outputs of the company. Two other KPIs, which are Sourcing Time and Inventory Turnover, are respectively being handled by the Purchasing and Warehousing division of the Department, not necessarily involved directly in the production flow, nor in the two stages of production that are being observed.
In the third process, which is Make, one KPI is implemented in Production, which is Rework Production which means the products that went through repeated processing in production in order to comply with original specifications because of failure in the initial production that resulted in defects and non-compliance with working order. The other two KPIs, both that uses cycle time such as the Sample Cycle Time and Production Cycle time cannot be further incorporated because cycle time is not implemented in the custom manufacturing facility that the company has, so it is not measureable. As for the sample products, as up to this point the company does not have a constant and formal measurement for it yet.
The fourth process, Deliver is not at all implemented in the Production Department as well. There are four KPIs in this process, On Time Delivery, Delivery Cycle Time, Cost of Delivery Ratio and Amount of Dead Stock. These KPIs and matters regarding of it are being controlled and measured by Warehousing division of the department, which does not have direct impact to production process.
4758 • Priscilia Tancongsonery, and Nila Krisnawati
The last process, Return consists of only one operational KPI, Return of Defective Products is currently measured in the Production Department. The operational KPI basically defines the number or percentage of defective products that are returned from customers back to the company.
Measuring Operational KPIs in Production Department
In this section, the operational KPIs that are derived from the SCOR model, that are currently implemented in the Production department which consist of Plan, Make and Return are measured in terms of their performance result. The framework for this model is taken from the previous research that was done (Phong-arjarn, Jeenanunta, Suanmali, & Watcharapanyawong, Not Specified).
In the whole assessment, the KPIs are actually divided into two categories, which consist of 7 Strategic KPIs and 14 Operational KPIs. In this research, as the Production Department is the one that is being analysed, only Operational KPIs are used. In this scoring measurement, 100 points are divided equally between Strategic and Operational KPIs. So, in the following table, 50 points are contributed by the Operational KPIs used in this research.
There are three levels of score for each KPI, 1 = poor, 2 = fair, 3 = good. The levels of the score according to the journal used as a guideline can be
justified with two approaches, one with expert opinion and the other with benchmarking. In this section, the measurement will be done by taking the expert opinion. In this case, through the in-depth interview with Head of Production Planning Control.
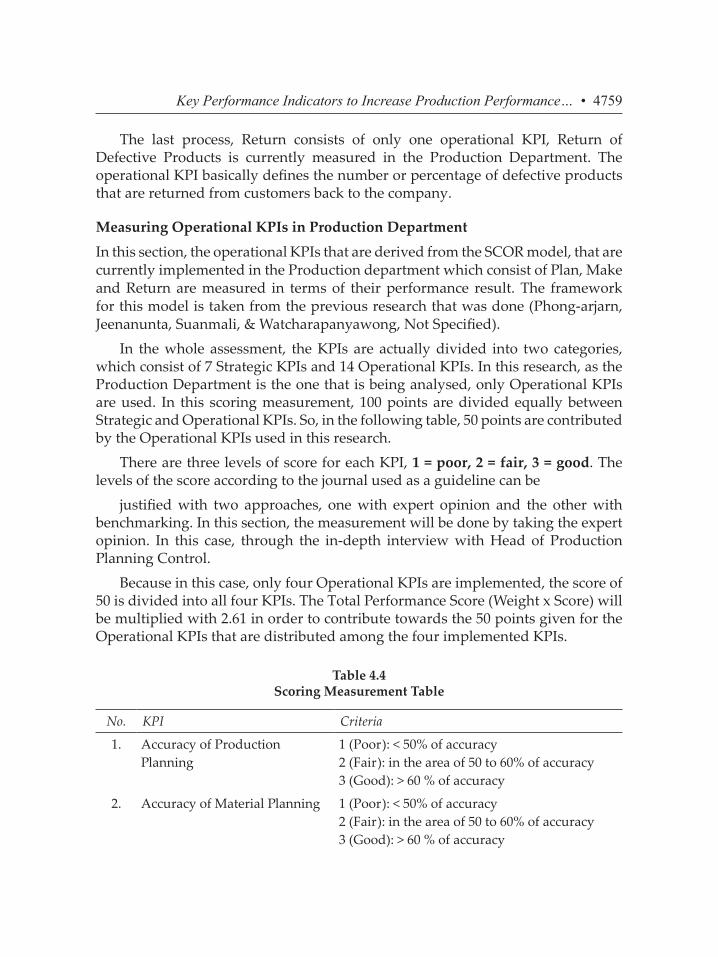
Because in this case, only four Operational KPIs are implemented, the score of 50 is divided into all four KPIs. The Total Performance Score (Weight x Score) will be multiplied with 2.61 in order to contribute towards the 50 points given for the Operational KPIs that are distributed among the four implemented KPIs.
Table 4.4 Scoring Measurement Table
No. KPI Criteria
1. Accuracy of Production Planning
1 (Poor): < 50% of accuracy2 (Fair): in the area of 50 to 60% of accuracy3 (Good): > 60 % of accuracy
2. Accuracy of Material Planning 1 (Poor): < 50% of accuracy2 (Fair): in the area of 50 to 60% of accuracy3 (Good): > 60 % of accuracy
Key Performance Indicators to Increase Production Performance… • 4759
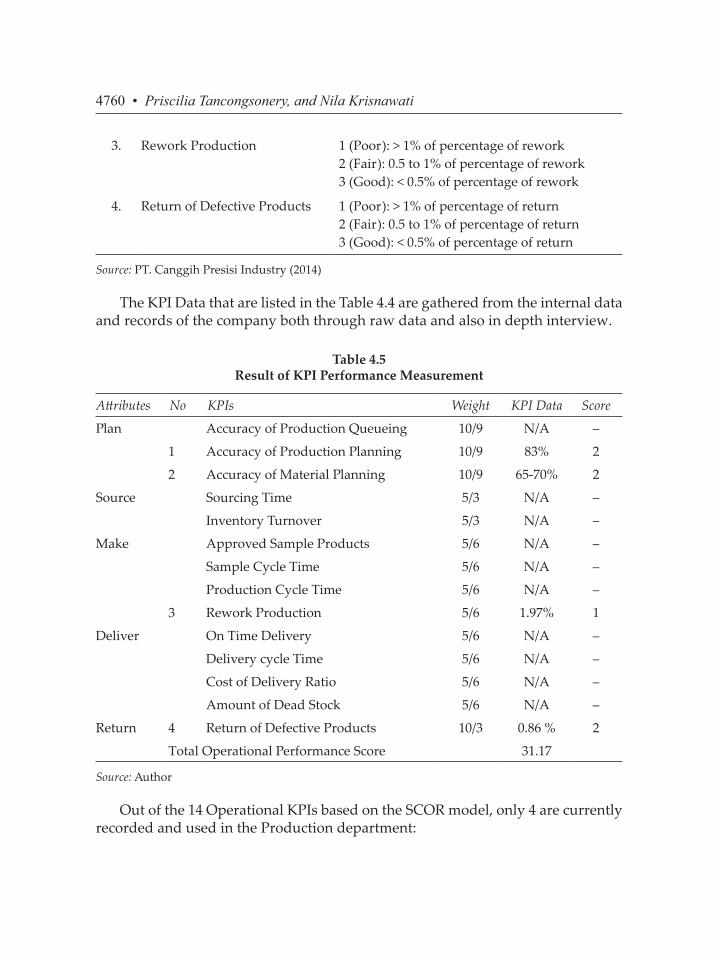
3. Rework Production 1 (Poor): > 1% of percentage of rework2 (Fair): 0.5 to 1% of percentage of rework3 (Good): < 0.5% of percentage of rework
4. Return of Defective Products 1 (Poor): > 1% of percentage of return2 (Fair): 0.5 to 1% of percentage of return3 (Good): < 0.5% of percentage of return
Source: PT. Canggih Presisi Industry (2014)
The KPI Data that are listed in the Table 4.4 are gathered from the internal data and records of the company both through raw data and also in depth interview.
Table 4.5 Result of KPI Performance Measurement
Attributes No KPIs Weight KPI Data Score
Plan Accuracy of Production Queueing 10/9 N/A –
1 Accuracy of Production Planning 10/9 83% 2
2 Accuracy of Material Planning 10/9 65-70% 2
Source Sourcing Time 5/3 N/A –
Inventory Turnover 5/3 N/A –
Make Approved Sample Products 5/6 N/A –
Sample Cycle Time 5/6 N/A –
Production Cycle Time 5/6 N/A –
3 Rework Production 5/6 1.97% 1
Deliver On Time Delivery 5/6 N/A –
Delivery cycle Time 5/6 N/A –
Cost of Delivery Ratio 5/6 N/A –
Amount of Dead Stock 5/6 N/A –
Return 4 Return of Defective Products 10/3 0.86 % 2
Total Operational Performance Score 31.17
Source: Author
Out of the 14 Operational KPIs based on the SCOR model, only 4 are currently recorded and used in the Production department:
4760 • Priscilia Tancongsonery, and Nila Krisnawati
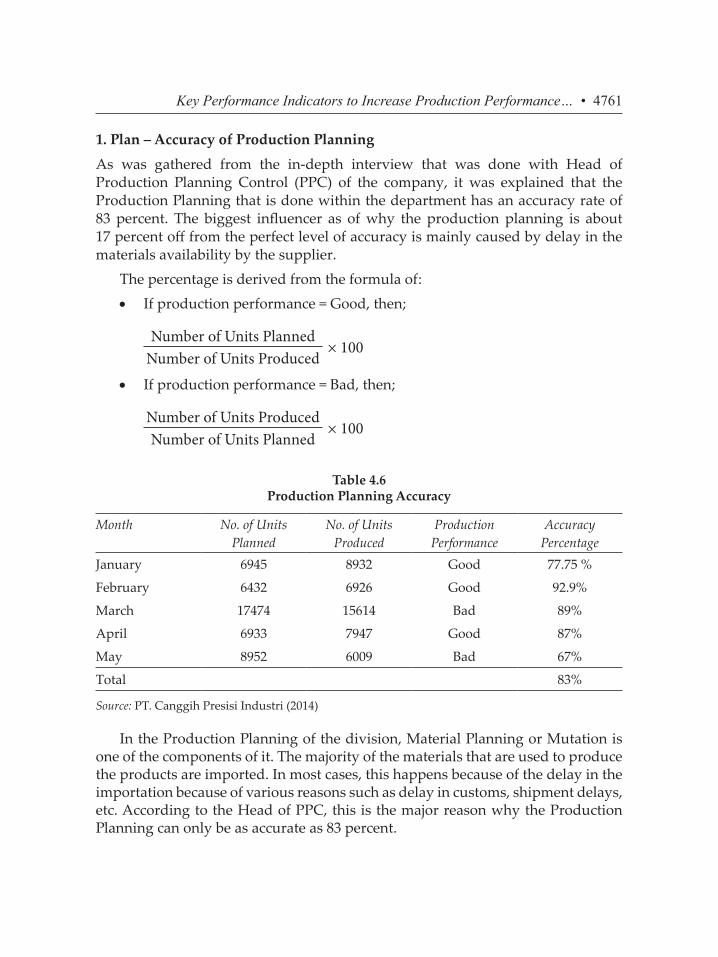
1. Plan – Accuracy of Production Planning
As was gathered from the in-depth interview that was done with Head of Production Planning Control (PPC) of the company, it was explained that the Production Planning that is done within the department has an accuracy rate of 83 percent. The biggest influencer as of why the production planning is about 17 percent off from the perfect level of accuracy is mainly caused by delay in the materials availability by the supplier.
The percentage is derived from the formula of:• If production performance = Good, then;
Number of Units Planned× 100
Number of Units Produced• If production performance = Bad, then;
Number of Units Produced× 100
Number of Units Planned
Table 4.6 Production Planning Accuracy
Month No. of Units Planned
No. of Units Produced
ProductionPerformance
Accuracy Percentage
January 6945 8932 Good 77.75 %
February 6432 6926 Good 92.9%
March 17474 15614 Bad 89%
April 6933 7947 Good 87%
May 8952 6009 Bad 67%
Total 83%
Source: PT. Canggih Presisi Industri (2014)
In the Production Planning of the division, Material Planning or Mutation is one of the components of it. The majority of the materials that are used to produce the products are imported. In most cases, this happens because of the delay in the importation because of various reasons such as delay in customs, shipment delays, etc. According to the Head of PPC, this is the major reason why the Production Planning can only be as accurate as 83 percent.
Key Performance Indicators to Increase Production Performance… • 4761
In this case, this KPI has gained a score of 2 = fair. It means, the accuracy of the production planning of the company cannot be categorized as poor because it is not so far off from perfect accuracy, however it still cannot be marked as good because this KPI obviously still does not have perfect accuracy.
2. Plan – Accuracy of Material Planning
In the Production department of PT. Canggih, Material Planning is tied together with Production Planning. In the Production Planning report of the company, it is called as Material Mutation. As mentioned previously in the first point, there are numerous times when the materials shipments or importations are delayed and this has also affected the accuracy of material planning in the division.
As seen in the table, the KPI data shows only about 65 to 70 percent level of accuracy of material planning. The main cause of this is mainly the same; the Head of PPC also mentioned that most of the time, the delay in the shipment of materials is caused by the unpredictability of the customs systems in the port here in Indonesia. So, the materials might not come when expected and that affected the level of the accuracy of the material planning.
This KPI earned a score of 2 = fair. The accuracy of the material planning in the department as mentioned by the Head of PPC, is still in the middle of the scale, which is around 65 to 70 percent, and it affects the Production Planning as well, so it cannot even be categorized as good. It needs a huge improvement in order to not only raise the accuracy in Material Planning, but also in Production Planning as they are both tied together
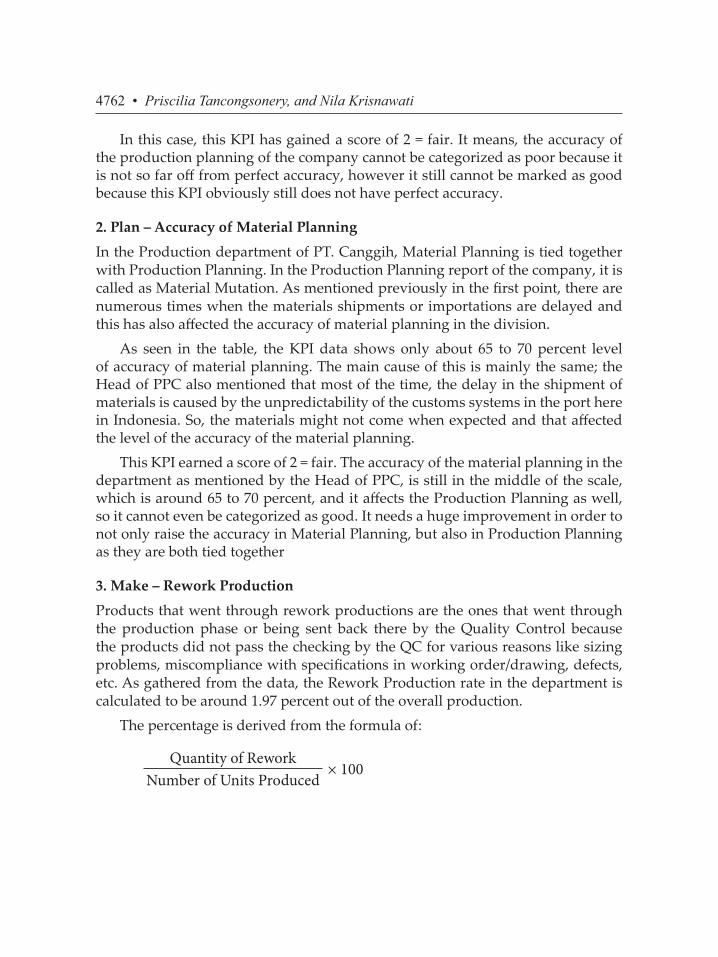
3. Make – Rework Production
Products that went through rework productions are the ones that went through the production phase or being sent back there by the Quality Control because the products did not pass the checking by the QC for various reasons like sizing problems, miscompliance with specifications in working order/drawing, defects, etc. As gathered from the data, the Rework Production rate in the department is calculated to be around 1.97 percent out of the overall production.
The percentage is derived from the formula of:
Quantity of Rework× 100
Number of Units Produced
4762 • Priscilia Tancongsonery, and Nila Krisnawati
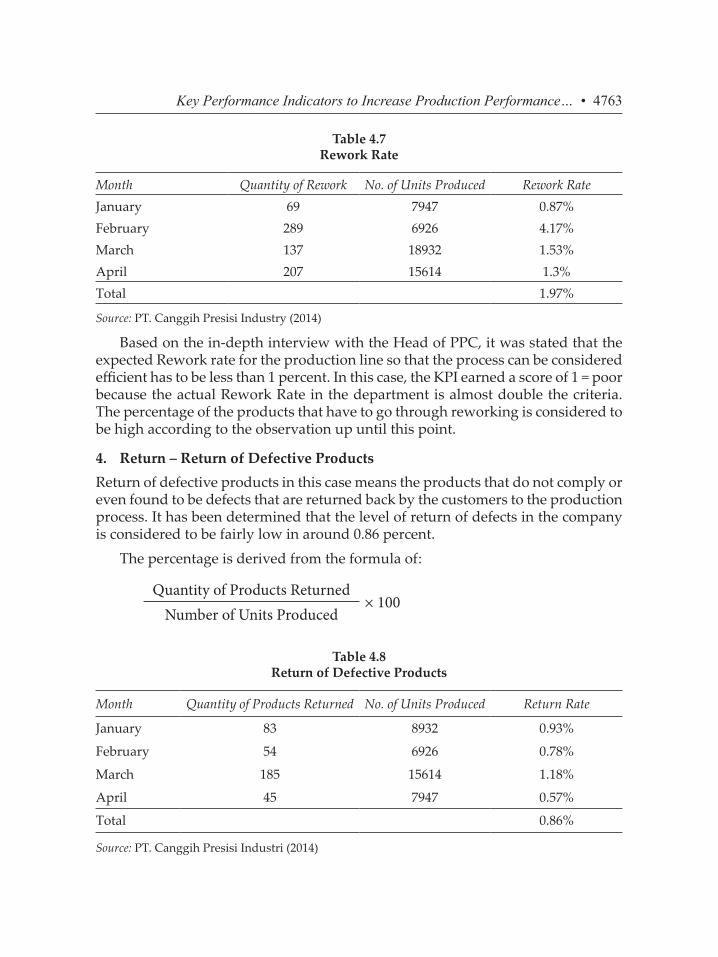
Table 4.7 Rework Rate
Month Quantity of Rework No. of Units Produced Rework RateJanuary 69 7947 0.87%February 289 6926 4.17%March 137 18932 1.53%April 207 15614 1.3%Total 1.97%
Source: PT. Canggih Presisi Industry (2014)
Based on the in-depth interview with the Head of PPC, it was stated that the expected Rework rate for the production line so that the process can be considered efficient has to be less than 1 percent. In this case, the KPI earned a score of 1 = poor because the actual Rework Rate in the department is almost double the criteria. The percentage of the products that have to go through reworking is considered to be high according to the observation up until this point.
4. Return – Return of Defective ProductsReturn of defective products in this case means the products that do not comply or even found to be defects that are returned back by the customers to the production process. It has been determined that the level of return of defects in the company is considered to be fairly low in around 0.86 percent.
The percentage is derived from the formula of:
Quantity of Products Returned× 100
Number of Units Produced
Table 4.8 Return of Defective Products
Month Quantity of Products Returned No. of Units Produced Return Rate
January 83 8932 0.93%
February 54 6926 0.78%
March 185 15614 1.18%
April 45 7947 0.57%
Total 0.86%
Source: PT. Canggih Presisi Industri (2014)
Key Performance Indicators to Increase Production Performance… • 4763
Similar to the Rework Production, the percentage of Return of Defective Products should ideally be below 1 percent. In this case, the performance of this particular KPI in the department has earned a score of 2 = average. The Head of PPC has mentioned that even though the percentage is considered to be quite good, in his opinion the percentage can be pressed even lower into a smaller percentage of Return of Defects.
Overall, as seen in Table 4.5, the four-implemented KPIs only scored 31.17 points out of the full 50 points distributed to the four Operational KPIs implemented in the department. It shows that there are still more rooms for improvement in terms of these found KPIs in the production process of PT. Canggih Presisi Industri in order for the Production department’s performance measured by the Operational KPIs to be running in full force.
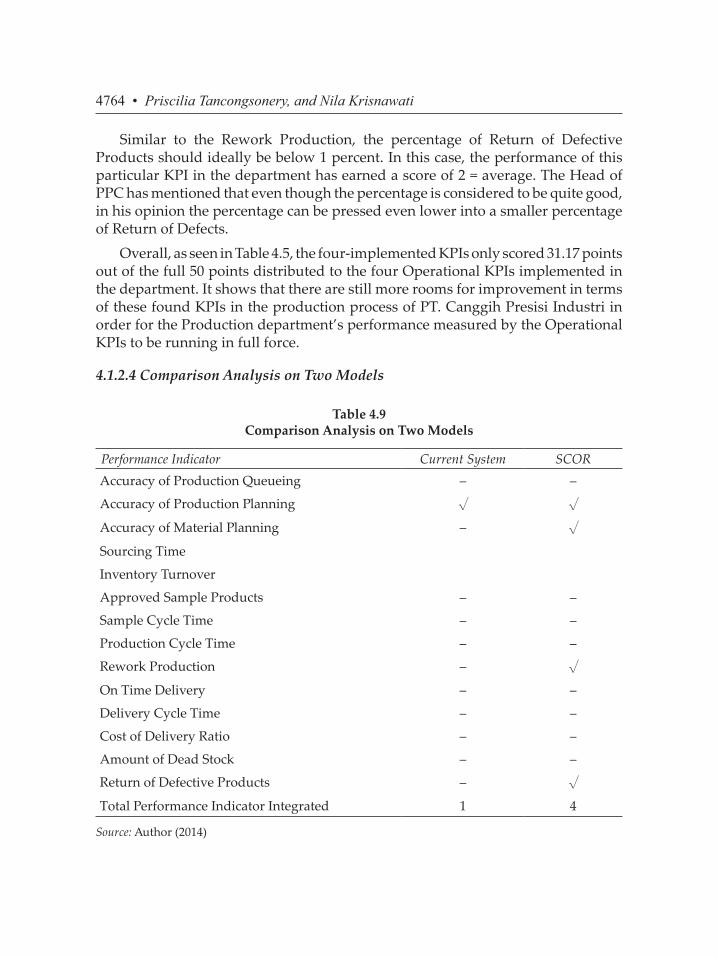
4.1.2.4 Comparison Analysis on Two Models
Table 4.9 Comparison Analysis on Two Models
Performance Indicator Current System SCORAccuracy of Production Queueing – –
Accuracy of Production Planning √ √Accuracy of Material Planning – √Sourcing Time
Inventory Turnover
Approved Sample Products – –
Sample Cycle Time – –
Production Cycle Time – –
Rework Production – √On Time Delivery – –
Delivery Cycle Time – –
Cost of Delivery Ratio – –
Amount of Dead Stock – –
Return of Defective Products – √Total Performance Indicator Integrated 1 4
Source: Author (2014)
4764 • Priscilia Tancongsonery, and Nila Krisnawati
As seen from Table 4.9 above, it is clearly shown that the Current Measurement System implemented in the company, only integrated one out of 14 Operational Performance Indicators that are listed above. The SCOR model in the other hand, integrated 4 out of the 14 Performance Indicators.
It is indicated that the Current Measurement System is simply inadequate to measure the production performance and to further help to increase it as it is only holding on to one Performance Indicator only. On the other hand, the SCOR model with the current condition of the company, is able to integrate more Performance Indicators, that are able to be used to measure production performance in the Production Department
3. CONCLUSION AND RECOMMENDATION
Conclusions
This study attempts to analyze the current performance measurement system and key performance indicators implemented in the Production department of PT. Canggih Presisi Industri and its implications towards production performance. The researcher used two aspects to analyze the KPIs implemented in the Production department through the SCOR Model and identifying influential factors that affects production performance. This study used data on the time frame of January 2014 to May 2014.To conclude, there are several results that have been obtained based on the findings. This research points out several conclusions:
The current performance measurement system in the department up until this point, only integrated one KPI out of the four existing Operational KPIs that have been identified in the department based on the analysis using the SCOR Model. The process of determining the level of performance of the production also only based on the comparison of the actual production to one single operational KPI.
The performance of the current Key Performance Indicators implemented in the department based on SCOR model shows an overall score of 31.17 out of the perfect score of 50 points. Meaning there are still improvements that still have to be made in implementation of the existing KPIs in the department in order to score the full points of KPI performance.
Recommendations
Based on the conclusions derived, there are several recommendations that were formulated:
The current performance measurement system that the company is currently implemented needs to be further improved and integrate all of the Operational
Key Performance Indicators to Increase Production Performance… • 4765
KPIs that have been found existing in the department based on the SCOR model analysis such as Material Planning and Rework Rate. This should be done in order to help in determining the level of performance of the production, so that the process of it will not be solely limited based on one single KPI only that is used as a comparison that will aid in improving the production performance of the department further.
The integration of the other Operational KPIs found in the department should also be optimized and controlled better on its implementation, so that the performance of those KPIs can fully come up to its full potential in helping the department improve its production performance, which in this case of SCOR model analysis is indicated by a full point of 50.
ReferencesAlegre, J. C. (2010, June None). Performance Measurement on Automotive Assembly Line.
Performance Measurement on Automotive Assembly Line. Porto, None, Portugal: Faculty of Engineering of University of Porto.
Bauer, K. (2004, October). Key Performance Indicators: The Multiple Dimensions. DM Review, 3.
Besic & Djordjevic. (2010). None. Role and Importance of Key Performance Indicators Measurement, 9.
Bora, A., Chiamsiri, S., & Krairit, D. (2004). Developing Key Performance Indicators for Performance Controlling of a Supply Chain. Fifth Asia Pacific Industrial Engineering and Management Systems Conference (p. 7). Pathumthani: APIEMS.
Bush, R., & Burns, A. (2006). Marketing Research. New Jersey: Pearson Prentice Hall.Dhiman, G. (Not Stated, Not Stated Not Stated). 6 Major Factors that Affect the Quality of
Manufactured Products. 6 Major Factors that Affect the Quality of Manufactured Products. None, None, None: none.
E. Amrina, & S. M. Yusof. (2011, None None). Key Performance Indicators for Sustainable Manufacturing Evaluation in Automotive Companies. Key Performance Indicators for Sustainable Manufacturing Evaluation in Automotive Companies. Padang/Johor, None, Indonesia/Malaysia: IEEM.
Hair, J., & et al. (2006). Multivariate Data Analysis. New Jersey: Pearson Prentice Hall.Hanugrani, N., Setyanto, N. W., & Efranto, R. Y. (Not Stated, None None). Performance
Measurement of Supply Chain Using SCOR Based on Analytical Hierarchy Process and Objective Matrix. Performance Measurement of Supply Chain Using SCOR Based on Analytical Hierarchy Process and Objective Matrix. Malang, Jawa Timur, Indonesia: Universitas Brawijaya.
Ilham, M. N. (2012, 05 21). Analisis Pengendalian Kualitas Produk dengan Menggunakan SPC. Analisis Pengendalian Kualitas Produk dengan Menggunakan SPC. Makassar, Sulawesi Selatan, Indonesia: None.
4766 • Priscilia Tancongsonery, and Nila Krisnawati
Ivan Cavalcante Araujo Junior, & Roberto Antonio Martins. (2009). Case Study on the Dimensions of Performance Measurement Systems Maturity. The 2009 Industrial Engineering Research Conference (pp. -). Sao Carlos: Federal University of Sao Carlos.
Kritzinger, J. A. (2009, None None). Determining the Effectiveness of Key Performance Indicators in a Steel Manufacturing Company. Determining the Effectiveness of Key Performance Indicators in a Steel Manufacturing Company, 53. Potchefstroom, None, South Africa: North-West University.
Kuncoro, B. (2007, None None). Productivity and Efficiency Analysis of Pharmaceutical Manufacturing Operations. Productivity and Efficiency Analysis of Pharmaceutical Manufacturing Operations. Tangerang, Banten, Indonesia: Swiss German University.
Lavasa, K. -M. (2009, None None). The Effects of Rework on Service Operations. The Effects of Rework on Service Operations. Chios, None, Greece: University of Aegean.
Lean Management Instituut. (2011, 06 Not Specified). Manufacturing’s Five Golden Metrics. Retrieved 06 05, 2014 from www.leaninstituut.nl: http://leaninstituut.nl/publications/1106/Manufacturing_Metrics.pdf
Leong, M. S., & Tilley, P. (2008). A Lean Strategy to Performance Measurment - Reducing Waste by Measuring ‘Next” Customers Needs’. 16th International Conference of the International Group for Lean Construction (p. None). Manchester: None.
Levine, D., & et al. (2008). Statistics for Managers. New Jersey: Pearson Prentice Hall.Misbah, M. (Not Stated, None None). What is The Importance of Material Planning in a
Production Process. Retrieved 06 15, 2014 from education.blurtit.com: http://education.blurtit.com/83511/what-is-the-importance-of-material-planning-in-a-production-process
Neely, A. (2011). Business Performance Measurement: Unifying Theory and Integrating Practive. Cambridge: Cambridge University Press.
O’Leary-Kelly, S., & Flores, B. (2002). The Integration of Manufacturing and Marketing/Sales Decisions: Impact on Organizational Performance. Journal of Operations Management, 221.
Oxford University Press. (None, None None). Oxford English Dictionary. Oxford English Dictionary, III. Oxford, None, Great Britain: Oxford University Press.
Parmenter, D. (2010). Key Performance Indicators: Developing, Implementing and Using Winning KPIs. New Jersey: John Wiley & Sons.
Phong-arjarn, E., Jeenanunta, C., Suanmali, S., & Watcharapanyawong, K. (Not Specified, None None). Key Performance Indicators for Measuring Supply Chain Performance in Thai Apparel Industry. None, None, Thailand: None.
Pujawan, I. (2005). Supply Chain Management. Surabaya: Guna Widya.Reason, J. (1997). Managing the Risks of Organizational Accidents. None: Ashgate.Santoso, S. (2010). SPSS Mengolah Data Statistik Secara Professional. Jakarta: PT. Elex Media
Komputindo - Kelompok Gramedia.Stan, L, Marascu - Klein, Neagoe, L, & Tecau, A. (2012). Key Performance Indicators for
Evaluating Employees on Industrial Production Lines. Key Performance Indicators for Evaluating Employees on Industrial Production Lines, 3.
Key Performance Indicators to Increase Production Performance… • 4767
Steiss, A. W. (2003). Strategic Management for Public and Nonprofit Organizations. New York: Mercel Dekker Inc.
Supply Chain Council. (2004, None None). Supply-Chain Operations Reference-model, SCOR Version 6.1 Overview. Supply-Chain Operations Reference-model, SCOR Version 6.1 Overview. Pittsburgh, Pennsylvania, USA: Supply Chain Council Inc.
The Supply Chain Council. (2008, None None). SCOR 9.0 Booklet. Retrieved November None, 2008 from www.supply-chain.org: www.supply-chain.org
Velimirovic, D., Velimirovic, M., & Stankovic, R. (2011). Role and Importance of Key Performance Indicators Measurement. Serbian Journal of Management, 9.
Widodo, I. (2011, None None). Analisa Kinerja Perusahaan dengan Balance Scorecard. Analisa Kinerja Perusahaan dengan Balance Scorecard. Semarang, Jawa Tengah: Universitas Diponegoro.
4768 • Priscilia Tancongsonery, and Nila Krisnawati