corporate travel management full year results 30 june … · cost effective travel management...
TRANSCRIPT
Full year results 30 June 2018.
Presented by: Jamie Pherous, Founder & Managing Director
Date: 22nd August, 2018
CORPORATE TRAVEL MANAGEMENT
For
per
sona
l use
onl
y

Disclaimer
The information in this presentation does not constitute personal investment advice. The presentation is not intended to be comprehensive or provide all
information required by investors to make an informed decision on any investment in Corporate Travel Management Limited ACN 131 207 611 (Company). In
preparing this presentation, the Company did not take into account the investment objectives, financial situation and particular needs of any particular
investor.
Further advice should be obtained from a professional investment adviser before taking any action on any information dealt with in the presentation. Those
acting upon any information without advice do so entirely at their own risk.
Whilst this presentation is based on information from sources which are considered reliable, no representation or warranty, express or implied, is made or
given by or on behalf of the Company, any of its directors, or any other person about the accuracy, completeness or fairness of the information or opinions
contained in this presentation. No responsibility or liability is accepted by any of them for that information or those opinions or for any errors, omissions,
misstatements (negligent or otherwise) or for any communication written or otherwise, contained or referred to in this presentation.
Accordingly, neither the Company nor any of its directors, officers, employees, advisers, associated persons or subsidiaries are liable for any direct, indirect or
consequential loss or damage suffered by any person as a result of relying upon any statement in this presentation or any document supplied with this
presentation, or by any future communications in connection with those documents and all of those losses and damages are expressly disclaimed.
Any opinions expressed reflect the Company’s position at the date of this presentation and are subject to change. No assurance is given by the Company
that any capital raising referred to in this presentation will proceed.
The distribution of this presentation in jurisdictions outside Australia may be restricted by law and you should observe any such restrictions. This presentation
may not be transmitted in the United States or distributed, directly or indirectly, in the United States or to any US persons, and does not constitute an offer to
sell, or a solicitation of an offer to buy, securities in the United States, and is not available to persons in the United States or to US persons.
PAGE 2
For
per
sona
l use
onl
y
CTM is an award-winning provider of innovative and
cost effective travel management solutions to the
corporate market. Its proven business strategy
combines personalised service excellence with client
facing technology solutions, to deliver a return on
investment to clients.
Headquartered in Australia, the company employs
approximately 2,350 FTE staff globally and the CTM
network provides localised service solutions to clients
in more than 70 countries globally.
Overview
PAGE 3
For
per
sona
l use
onl
y
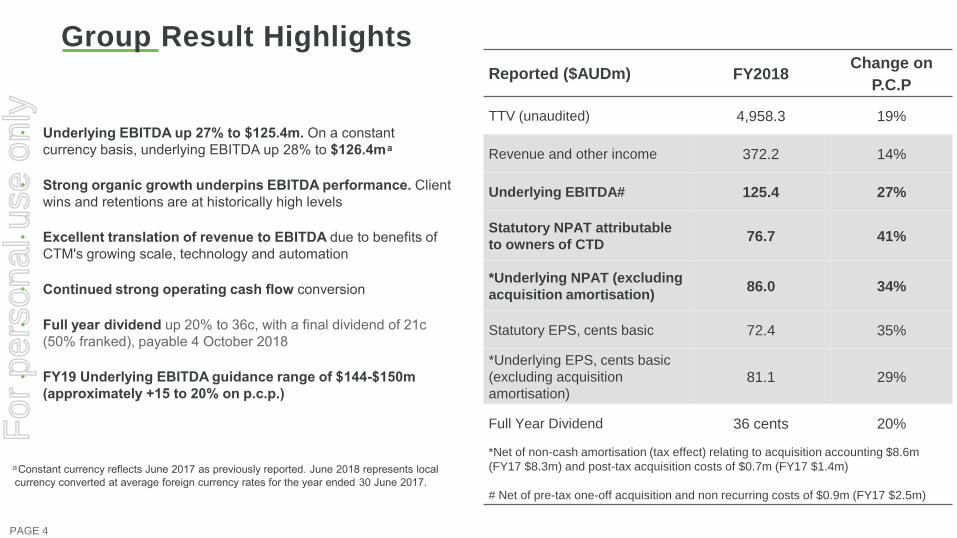
Group Result Highlights
Underlying EBITDA up • 27% to $125.4m. On a constant
currency basis, underlying EBITDA up 28% to $126.4m
Strong organic growth underpins EBITDA performance. • Client
wins and retentions are at historically high levels
Excellent translation of revenue to EBITDA • due to benefits of
CTM's growing scale, technology and automation
Continued strong operating cash flow • conversion
Full year dividend • up 20% to 36c, with a final dividend of 21c
(50% franked), payable 4 October 2018
FY• 19 Underlying EBITDA guidance range of $144-$150m
(approximately +15 to 20% on p.c.p.)
Reported ($AUDm) FY2018Change on
P.C.P
TTV (unaudited) 4,958.3 19%
Revenue and other income 372.2 14%
Underlying EBITDA# 125.4 27%
Statutory NPAT attributable
to owners of CTD76.7 41%
*Underlying NPAT (excluding
acquisition amortisation) 86.0 34%
Statutory EPS, cents basic 72.4 35%
*Underlying EPS, cents basic
(excluding acquisition
amortisation) 81.1 29%
Full Year Dividend 36 cents 20%
*Net of non-cash amortisation (tax effect) relating to acquisition accounting $8.6m
(FY17 $8.3m) and post-tax acquisition costs of $0.7m (FY17 $1.4m)
# Net of pre-tax one-off acquisition and non recurring costs of $0.9m (FY17 $2.5m)
PAGE 4
Constant currency reflects June 2017 as previously reported. June 2018 represents local
currency converted at average foreign currency rates for the year ended 30 June 2017.
For
per
sona
l use
onl
y

Growth profile. For
per
sona
l use
onl
y
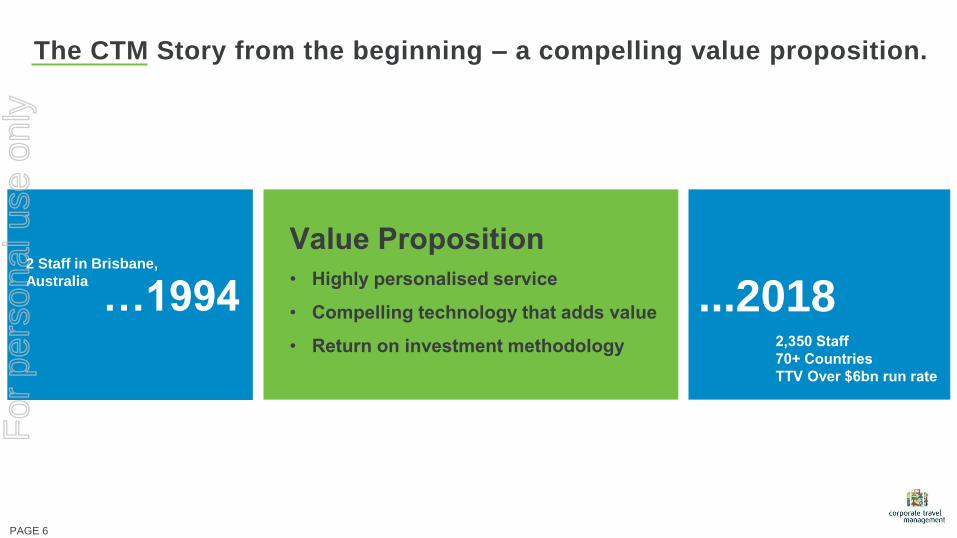
The CTM Story from the beginning – a compelling value proposition.
…1994 ...2018
2018 CLIENT SURVEY
Value Proposition
Highly personalised service•
Compelling technology that adds value •
Return on investment methodology•
2 Staff in Brisbane,
Australia
2,350 Staff
70+ Countries
TTV Over $6bn run rate
PAGE 6
For
per
sona
l use
onl
y
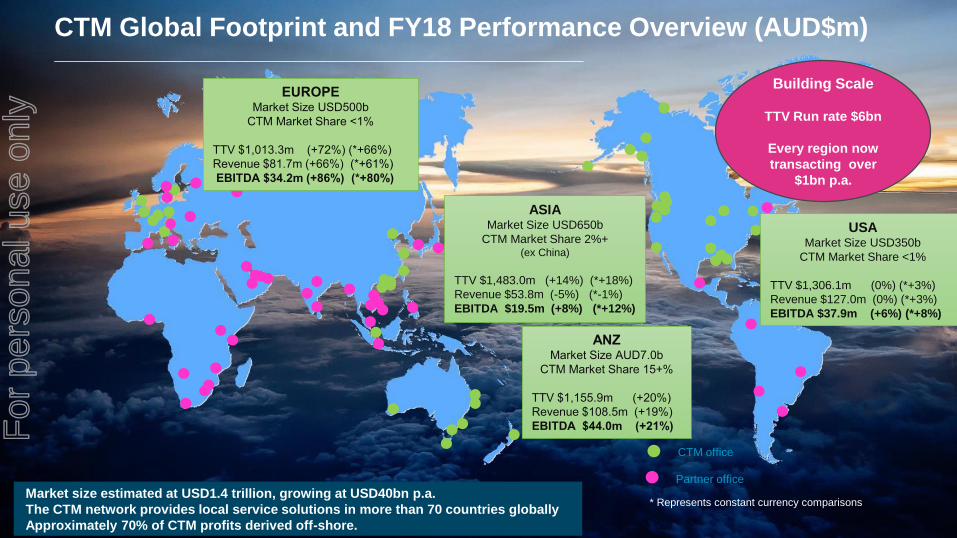
Market size estimated at USD1.4 trillion, growing at USD40bn p.a.
The CTM network provides local service solutions in more than 70 countries globally
Approximately 70% of CTM profits derived off-shore.
CTM office
Partner office
USAMarket Size USD350b
CTM Market Share <1%
TTV $1,306.1m (0%) (*+3%)
Revenue $127.0m (0%) (*+3%)
EBITDA $37.9m (+6%) (*+8%)
EUROPEMarket Size USD500b
CTM Market Share <1%
TTV $1,013.3m (+72%) (*+66%)
Revenue $81.7m (+66%) (*+61%)
EBITDA $34.2m (+86%) (*+80%)
ASIAMarket Size USD650b
CTM Market Share 2%+(ex China)
TTV $1,483.0m (+14%) (*+18%)
Revenue $53.8m (-5%) (*-1%)
EBITDA $19.5m (+8%) (*+12%)
ANZMarket Size AUD7.0b
CTM Market Share 15+%
TTV $1,155.9m (+20%)
Revenue $108.5m (+19%)
EBITDA $44.0m (+21%)
CTM Global Footprint and FY18 Performance Overview (AUD$m) _____________________________________________________
* Represents constant currency comparisons
Building Scale
TTV Run rate $6bn
Every region now
transacting over
$1bn p.a.
For
per
sona
l use
onl
y
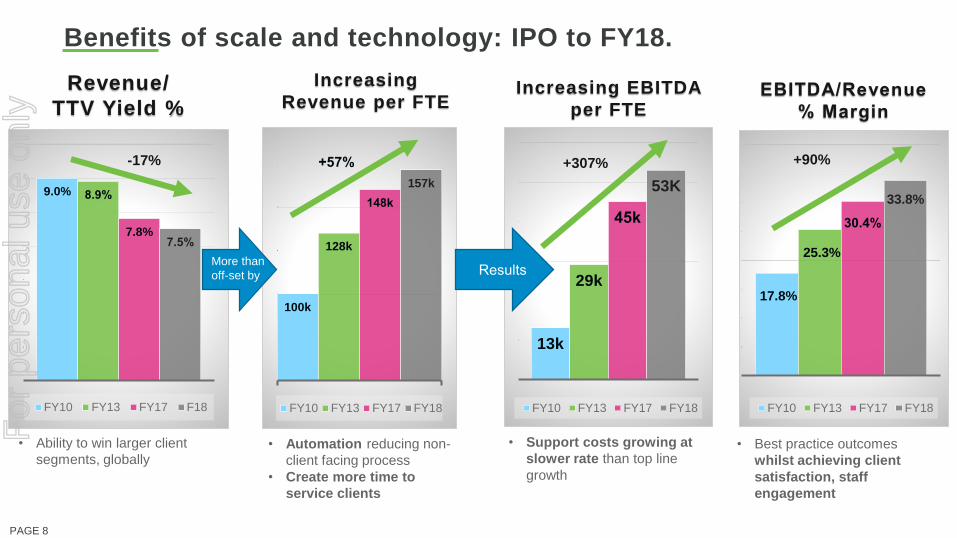
Benefits of scale and technology: IPO to FY18.
9.0% 8.9%
7.8%7.5%
FY10 FY13 FY17 F18
-17%
Revenue/
TTV Yield %
• Ability to win larger client
segments, globally
100k
128k
148k
157k
FY10 FY13 FY17 FY18
+57%
More than
off-set by
Increasing
Revenue per FTE
• Automation reducing non-
client facing process
• Create more time to
service clients
13k
29k
45k
53K
FY10 FY13 FY17 FY18
Results
Increasing EBITDA
per FTE
+307%
• Support costs growing at
slower rate than top line
growth
17.8%
25.3%
30.4%
33.8%
FY10 FY13 FY17 FY18
EBITDA/Revenue
% Margin
• Best practice outcomes
whilst achieving client
satisfaction, staff
engagement
+90%
PAGE 8
For
per
sona
l use
onl
y

Regional
performance.
For
per
sona
l use
onl
y
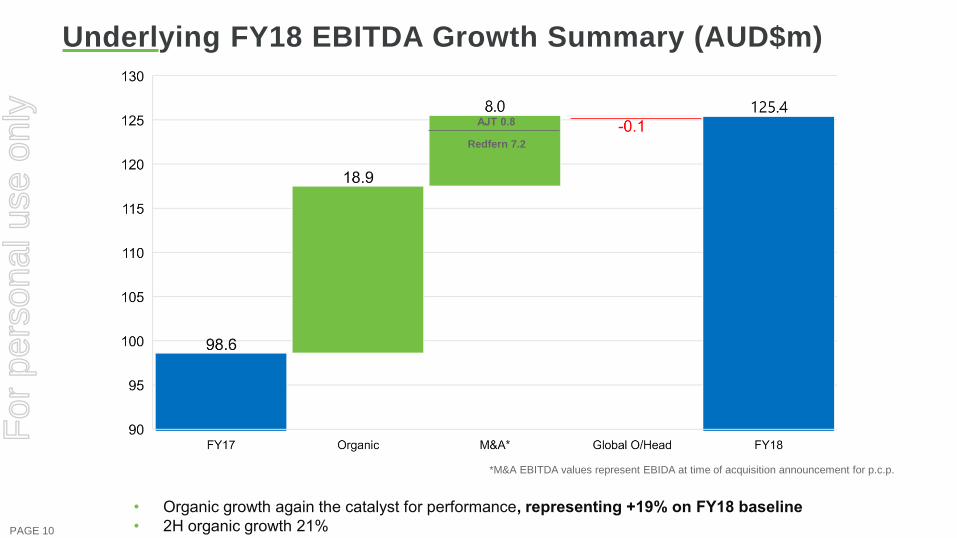
Underlying FY18 EBITDA Growth Summary (AUD$m)
Organic growth again the catalyst for performance• , representing +19% on FY18 baseline
• 2H organic growth 21%
*M&A EBITDA values represent EBIDA at time of acquisition announcement for p.c.p.
AJT 0.8
Redfern 7.2
PAGE 10
For
per
sona
l use
onl
y
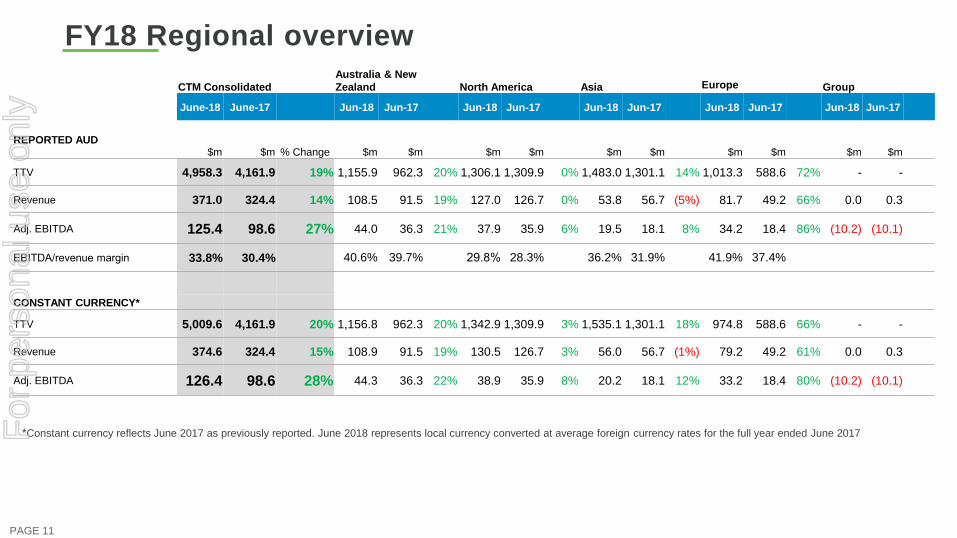
FY18 Regional overview
*Constant currency reflects June 2017 as previously reported. June 2018 represents local currency converted at average foreign currency rates for the full year ended June 2017
CTM Consolidated
Australia & New
Zealand North America Asia Europe Group
June-18 June-17 Jun-18 Jun-17 Jun-18 Jun-17 Jun-18 Jun-17 Jun-18 Jun-17 Jun-18 Jun-17
REPORTED AUD$m $m % Change $m $m $m $m $m $m $m $m $m $m
TTV 4,958.3 4,161.9 19% 1,155.9 962.3 20% 1,306.1 1,309.9 0% 1,483.0 1,301.1 14% 1,013.3 588.6 72% - -
Revenue 371.0 324.4 14% 108.5 91.5 19% 127.0 126.7 0% 53.8 56.7 (5%) 81.7 49.2 66% 0.0 0.3
Adj. EBITDA 125.4 98.6 27% 44.0 36.3 21% 37.9 35.9 6% 19.5 18.1 8% 34.2 18.4 86% (10.2) (10.1)
EBITDA/revenue margin 33.8% 30.4% 40.6% 39.7% 29.8% 28.3% 36.2% 31.9% 41.9% 37.4%
CONSTANT CURRENCY*
TTV 5,009.6 4,161.9 20% 1,156.8 962.3 20% 1,342.9 1,309.9 3% 1,535.1 1,301.1 18% 974.8 588.6 66% - -
Revenue 374.6 324.4 15% 108.9 91.5 19% 130.5 126.7 3% 56.0 56.7 (1%) 79.2 49.2 61% 0.0 0.3
Adj. EBITDA 126.4 98.6 28% 44.3 36.3 22% 38.9 35.9 8% 20.2 18.1 12% 33.2 18.4 80% (10.2) (10.1)
PAGE 11
For
per
sona
l use
onl
y
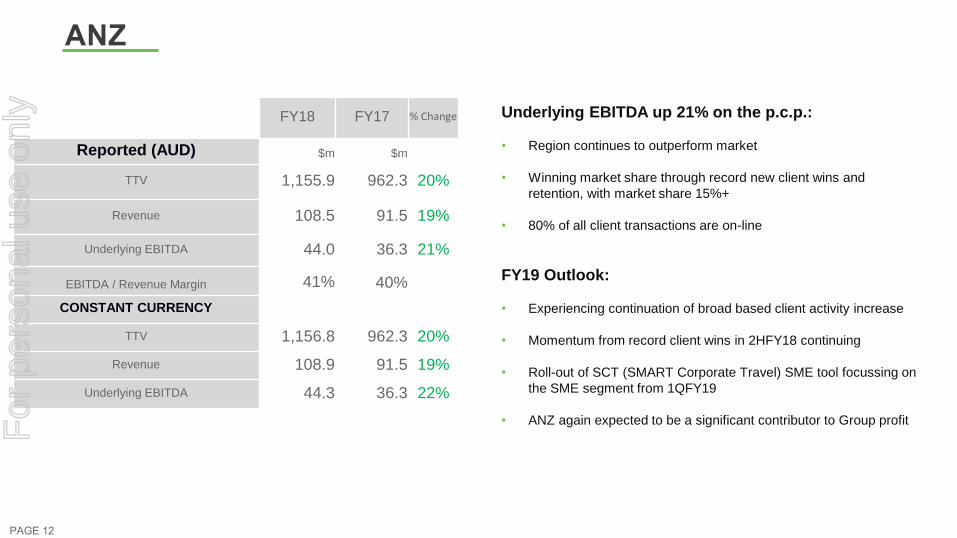
ANZ
FY18 FY17 % Change
Reported (AUD) $m $m
TTV 1,155.9 962.3 20%
Revenue 108.5 91.5 19%
Underlying EBITDA 44.0 36.3 21%
EBITDA / Revenue Margin 41% 40%
CONSTANT CURRENCY
TTV 1,156.8 962.3 20%
Revenue 108.9 91.5 19%
Underlying EBITDA 44.3 36.3 22%
Underlying EBITDA up 21% on the p.c.p.:
• Region continues to outperform market
• Winning market share through record new client wins and
retention, with market share 15%+
• 80% of all client transactions are on-line
FY19 Outlook:
• Experiencing continuation of broad based client activity increase
• Momentum from record client wins in 2HFY18 continuing
• Roll-out of SCT (SMART Corporate Travel) SME tool focussing on
the SME segment from 1QFY19
• ANZ again expected to be a significant contributor to Group profit
PAGE 12
For
per
sona
l use
onl
y
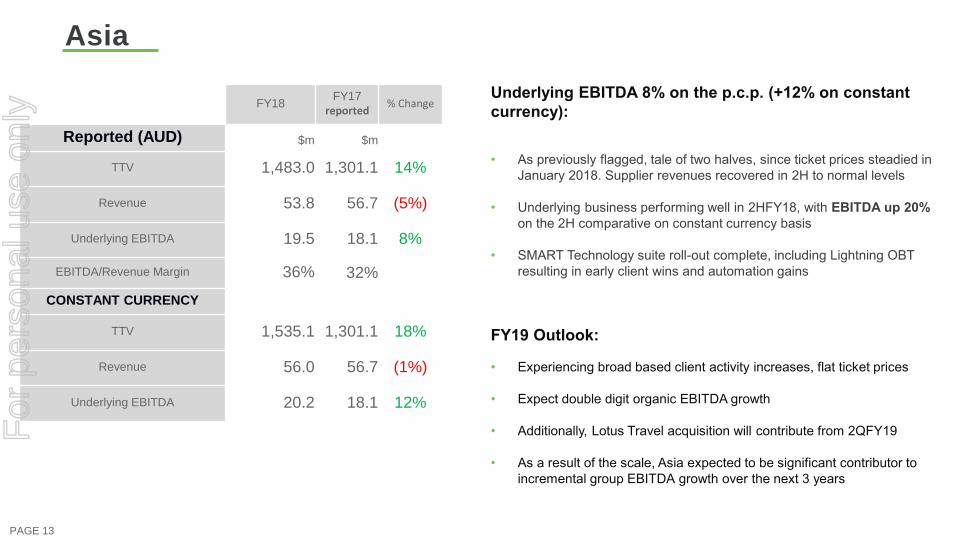
Asia
FY18FY17
reported% Change
Reported (AUD) $m $m
TTV 1,483.0 1,301.1 14%
Revenue 53.8 56.7 (5%)
Underlying EBITDA 19.5 18.1 8%
EBITDA/Revenue Margin 36% 32%
CONSTANT CURRENCY
TTV 1,535.1 1,301.1 18%
Revenue 56.0 56.7 (1%)
Underlying EBITDA 20.2 18.1 12%
Underlying EBITDA 8% on the p.c.p. (+12% on constant
currency):
As previously flagged, tale of two halves, since ticket prices steadied in •
January 2018. Supplier revenues recovered in 2H to normal levels
Underlying business performing well in • 2HFY18, with EBITDA up 20%
on the 2H comparative on constant currency basis
SMART Technology suite roll• -out complete, including Lightning OBT
resulting in early client wins and automation gains
FY19 Outlook:
Experiencing broad based client activity increases, flat ticket prices •
Expect double digit organic EBITDA growth•
Additionally, Lotus Travel acquisition will contribute from • 2QFY19
As a result of the scale, Asia expected to be significant contributor to •
incremental group EBITDA growth over the next 3 years
PAGE 13
For
per
sona
l use
onl
y
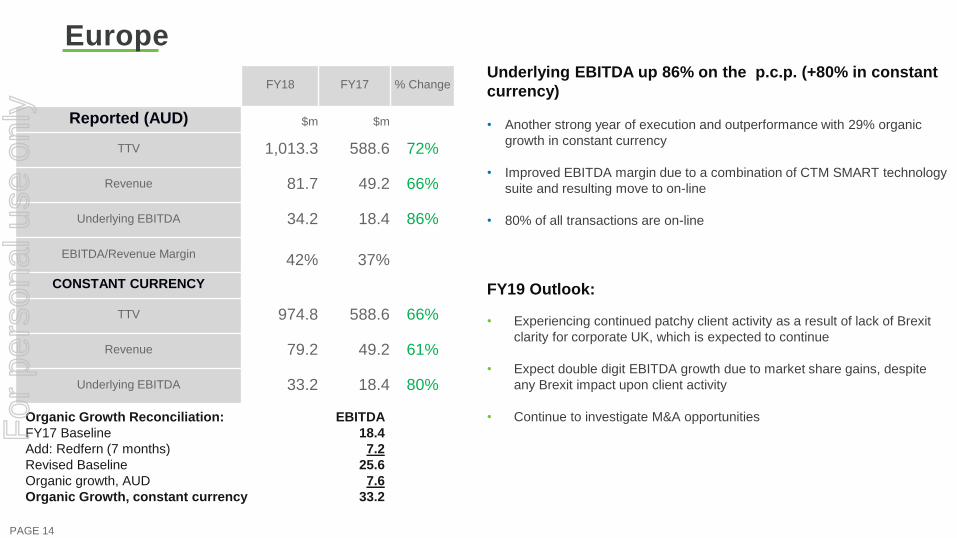
Europe
FY18 FY17 % Change
Reported (AUD) $m $m
TTV 1,013.3 588.6 72%
Revenue 81.7 49.2 66%
Underlying EBITDA 34.2 18.4 86%
EBITDA/Revenue Margin 42% 37%
CONSTANT CURRENCY
TTV 974.8 588.6 66%
Revenue 79.2 49.2 61%
Underlying EBITDA 33.2 18.4 80%
Underlying EBITDA up 86% on the p.c.p. (+80% in constant
currency)
• Another strong year of execution and outperformance with 29% organic
growth in constant currency
• Improved EBITDA margin due to a combination of CTM SMART technology
suite and resulting move to on-line
• 80% of all transactions are on-line
FY19 Outlook:
• Experiencing continued patchy client activity as a result of lack of Brexit
clarity for corporate UK, which is expected to continue
• Expect double digit EBITDA growth due to market share gains, despite
any Brexit impact upon client activity
• Continue to investigate M&A opportunitiesOrganic Growth Reconciliation:
FY17 Baseline
Add: Redfern (7 months)
Revised Baseline
Organic growth, AUD
Organic Growth, constant currency
EBITDA
18.4
7.2
25.6
7.6
33.2
PAGE 14
For
per
sona
l use
onl
y

North America
FY18 FY17 % Change
Reported (AUD) $m $m
TTV 1,306.1 1,309.9 0%
Revenue 127.0 126.7 0%
Underlying EBITDA 37.9 35.9 6%
EBITDA/Revenue Margin 30% 28%
CONSTANT CURRENCY
TTV 1,342.9 1,309.9 3%
Revenue 130.5 126.7 3%
Underlying EBITDA 38.9 35.9 8%
Underlying EBITDA up 6% on the p.c.p. (8% on constant
currency):
• Strong 2HFY18 wins, mostly global/regional, but delayed implementations
• Largest technology investment by CTM region, with SMART suite and Lightning
OBT on track for December 2018
• Management team in place to take the business forward over the longer term
FY19 Outlook:
• Experiencing broad based client activity increase. July and August 2018
revenue up 13% on the p.c.p., reflecting trade of prior year client wins
• Expecting strong top line growth through new client wins but weaker translation
to EBITDA growth, due to reliance on 3rd party technology (higher costs)
• CTM Technology investment will reduce reliance on 3rd party systems, and
expected to enhance client wins, productivity and profit translation, commencing
CY19 and into FY20.
• Single digit EBITDA growth expectations for FY19; flat 1H, stronger 2H
• Continue to investigate M&A opportunities
PAGE 15
For
per
sona
l use
onl
y

Group financial
performance.
For
per
sona
l use
onl
y
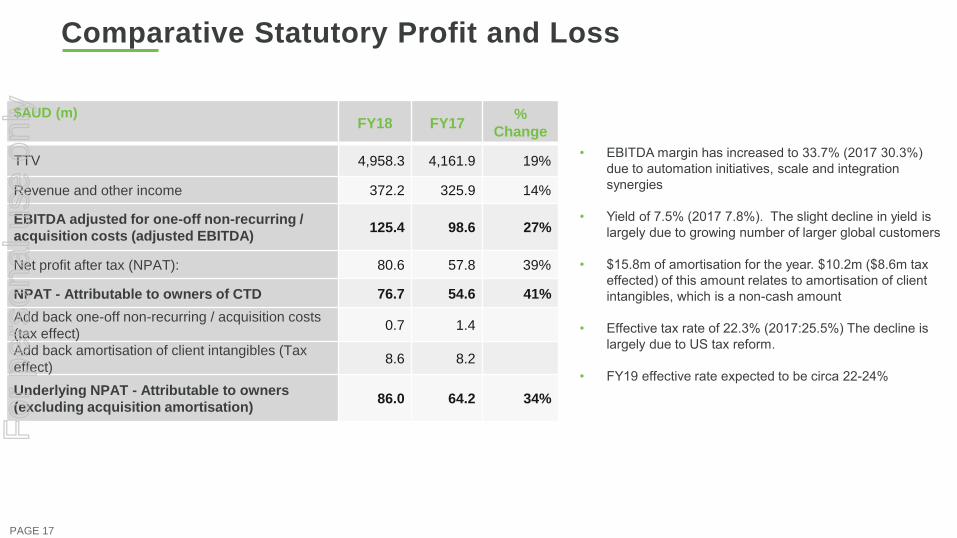
Comparative Statutory Profit and Loss
EBITDA margin has increased to • 33.7% (2017 30.3%)
due to automation initiatives, scale and integration
synergies
Yield• of 7.5% (2017 7.8%). The slight decline in yield is
largely due to growing number of larger global customers
• $15.8m of amortisation for the year. $10.2m ($8.6m tax
effected) of this amount relates to amortisation of client
intangibles, which is a non-cash amount
Effective tax rate of • 22.3% (2017:25.5%) The decline is
largely due to US tax reform.
FY• 19 effective rate expected to be circa 22-24%
$AUD (m)FY18 FY17
%
Change
TTV 4,958.3 4,161.9 19%
Revenue and other income 372.2 325.9 14%
EBITDA adjusted for one-off non-recurring /
acquisition costs (adjusted EBITDA)125.4 98.6 27%
Net profit after tax (NPAT): 80.6 57.8 39%
NPAT - Attributable to owners of CTD 76.7 54.6 41%
Add back one-off non-recurring / acquisition costs
(tax effect)0.7 1.4
Add back amortisation of client intangibles (Tax
effect)8.6 8.2
Underlying NPAT - Attributable to owners
(excluding acquisition amortisation)86.0 64.2 34%
PAGE 17
For
per
sona
l use
onl
y
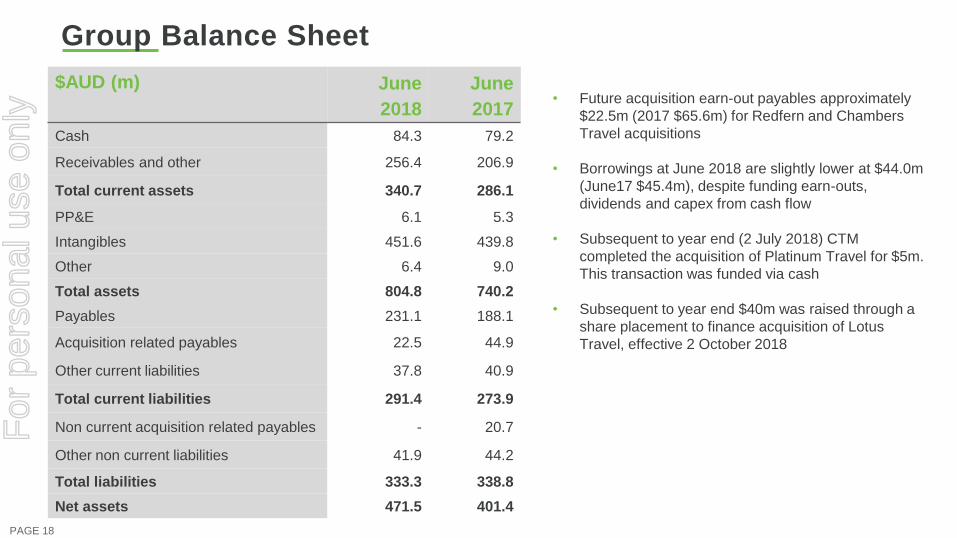
Group Balance Sheet
$AUD (m) June
2018
June
2017
Cash 84.3 79.2
Receivables and other 256.4 206.9
Total current assets 340.7 286.1
PP&E 6.1 5.3
Intangibles 451.6 439.8
Other 6.4 9.0
Total assets 804.8 740.2
Payables 231.1 188.1
Acquisition related payables 22.5 44.9
Other current liabilities 37.8 40.9
Total current liabilities 291.4 273.9
Non current acquisition related payables - 20.7
Other non current liabilities 41.9 44.2
Total liabilities 333.3 338.8
Net assets 471.5 401.4
PAGE 18
• Future acquisition earn-out payables approximately
$22.5m (2017 $65.6m) for Redfern and Chambers
Travel acquisitions
• Borrowings at June 2018 are slightly lower at $44.0m
(June17 $45.4m), despite funding earn-outs,
dividends and capex from cash flow
• Subsequent to year end (2 July 2018) CTM
completed the acquisition of Platinum Travel for $5m.
This transaction was funded via cash
• Subsequent to year end $40m was raised through a
share placement to finance acquisition of Lotus
Travel, effective 2 October 2018
For
per
sona
l use
onl
y
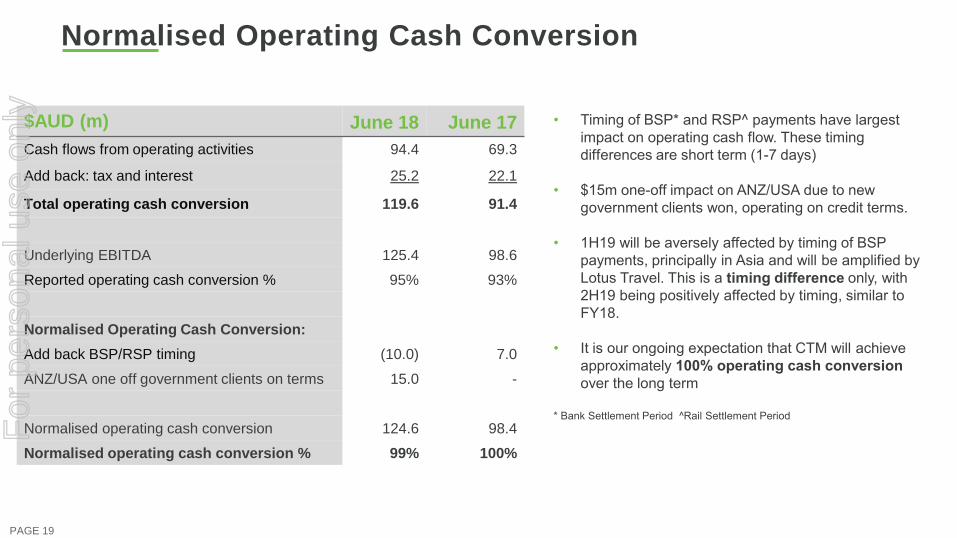
Normalised Operating Cash Conversion
Timing of BSP* and RSP^ payments have largest •
impact on operating cash flow. These timing
differences are short term (1-7 days)
• $15m one-off impact on ANZ/USA due to new
government clients won, operating on credit terms.
• 1H19 will be aversely affected by timing of BSP
payments, principally in Asia and will be amplified by
Lotus Travel. This is a timing difference only, with
2H19 being positively affected by timing, similar to
FY18.
It is our ongoing expectation that CTM will achieve •
approximately 100% operating cash conversion
over the long term
* Bank Settlement Period ^Rail Settlement Period
$AUD (m) June 18 June 17
Cash flows from operating activities 94.4 69.3
Add back: tax and interest 25.2 22.1
Total operating cash conversion 119.6 91.4
Underlying EBITDA 125.4 98.6
Reported operating cash conversion % 95% 93%
Normalised Operating Cash Conversion:
Add back BSP/RSP timing (10.0) 7.0
ANZ/USA one off government clients on terms 15.0 -
Normalised operating cash conversion 124.6 98.4
Normalised operating cash conversion % 99% 100%
PAGE 19
For
per
sona
l use
onl
y
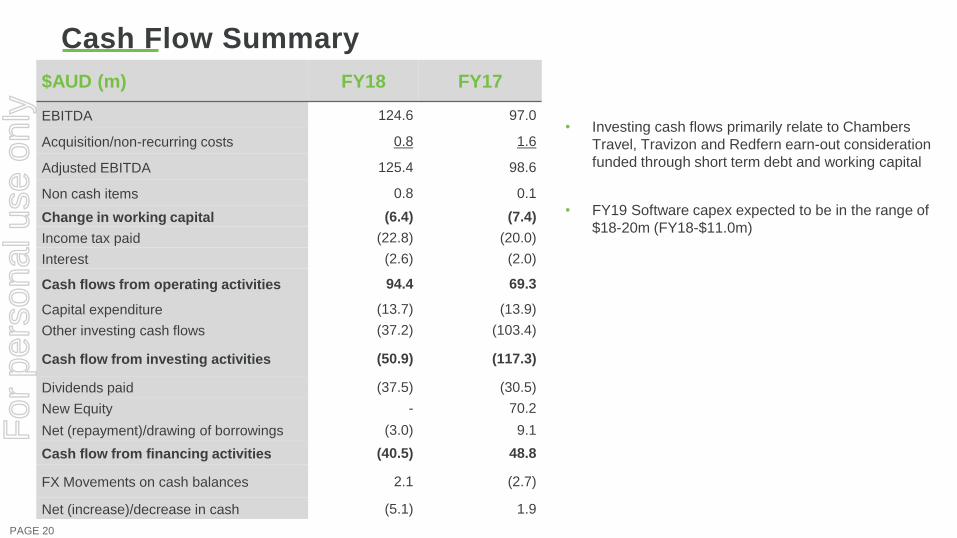
Cash Flow Summary
• Investing cash flows primarily relate to Chambers
Travel, Travizon and Redfern earn-out consideration
funded through short term debt and working capital
• FY19 Software capex expected to be in the range of
$18-20m (FY18-$11.0m)
$AUD (m) FY18 FY17
EBITDA 124.6 97.0
Acquisition/non-recurring costs 0.8 1.6
Adjusted EBITDA 125.4 98.6
Non cash items 0.8 0.1
Change in working capital (6.4) (7.4)
Income tax paid (22.8) (20.0)
Interest (2.6) (2.0)
Cash flows from operating activities 94.4 69.3
Capital expenditure (13.7) (13.9)
Other investing cash flows (37.2) (103.4)
Cash flow from investing activities (50.9) (117.3)
Dividends paid (37.5) (30.5)
New Equity - 70.2
Net (repayment)/drawing of borrowings (3.0) 9.1
Cash flow from financing activities (40.5) 48.8
FX Movements on cash balances 2.1 (2.7)
Net (increase)/decrease in cash (5.1) 1.9
PAGE 20
For
per
sona
l use
onl
y

Acquisition
update.
For
per
sona
l use
onl
y
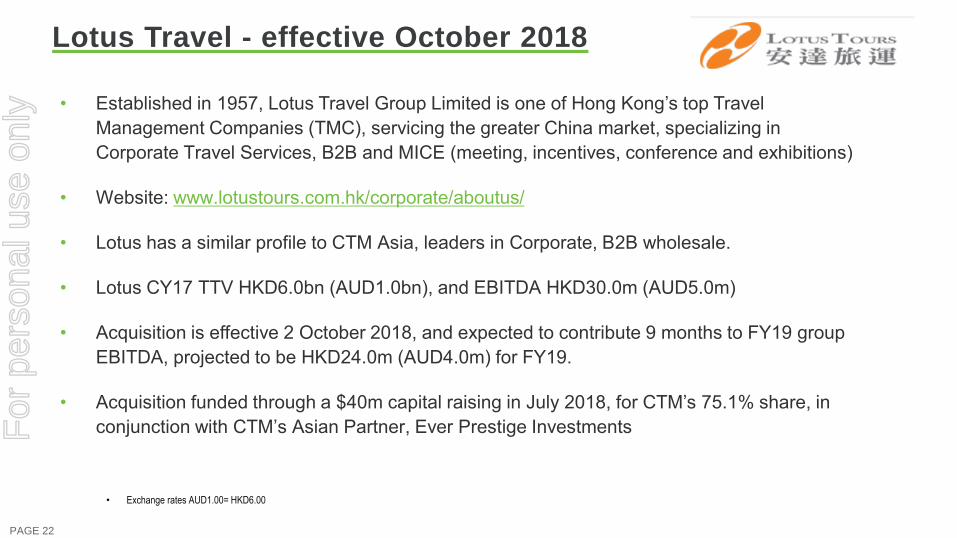
Lotus Travel - effective October 2018
Established in • 1957, Lotus Travel Group Limited is one of Hong Kong’s top Travel
Management Companies (TMC), servicing the greater China market, specializing in
Corporate Travel Services, B2B and MICE (meeting, incentives, conference and exhibitions)
Website: • www.lotustours.com.hk/corporate/aboutus/
Lotus has a similar profile to CTM Asia, leaders in Corporate, B• 2B wholesale.
Lotus CY• 17 TTV HKD6.0bn (AUD1.0bn), and EBITDA HKD30.0m (AUD5.0m)
Acquisition is effective • 2 October 2018, and expected to contribute 9 months to FY19 group
EBITDA, projected to be HKD24.0m (AUD4.0m) for FY19.
Acquisition funded through a $• 40m capital raising in July 2018, for CTM’s 75.1% share, in
conjunction with CTM’s Asian Partner, Ever Prestige Investments
• Exchange rates AUD1.00= HKD6.00
PAGE 22
For
per
sona
l use
onl
y
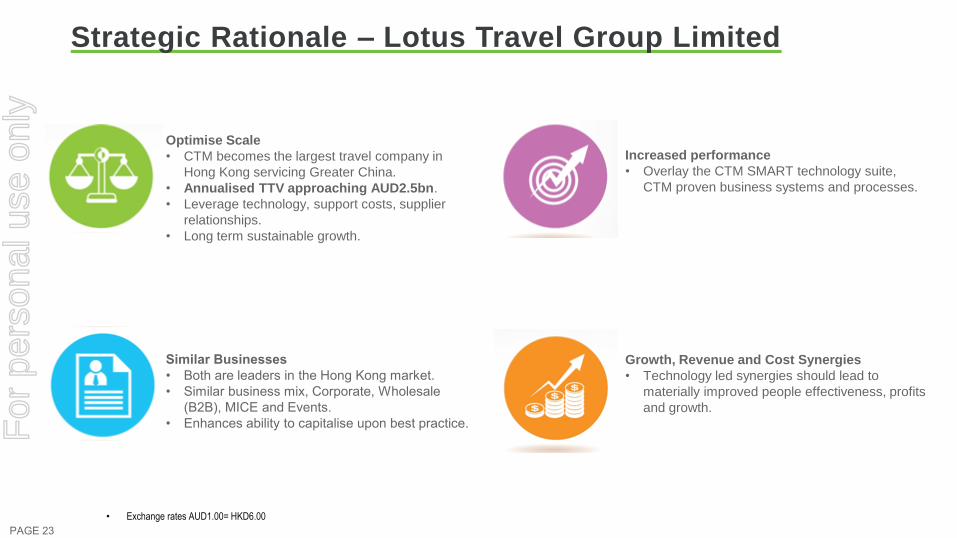
Strategic Rationale – Lotus Travel Group Limited
• Exchange rates AUD1.00= HKD6.00
PAGE 23
Optimise Scale
• CTM becomes the largest travel company in
Hong Kong servicing Greater China.
• Annualised TTV approaching AUD2.5bn.
• Leverage technology, support costs, supplier
relationships.
• Long term sustainable growth.
Similar Businesses
Both are leaders in the Hong Kong market.•
Similar business mix, Corporate, Wholesale •
(B2B), MICE and Events.
Enhances ability to capitalise upon best practice.•
Increased performance
• Overlay the CTM SMART technology suite,
CTM proven business systems and processes.
Growth, Revenue and Cost Synergies
• Technology led synergies should lead to
materially improved people effectiveness, profits
and growth.
For
per
sona
l use
onl
y

CTM SMART
Technology.
For
per
sona
l use
onl
y
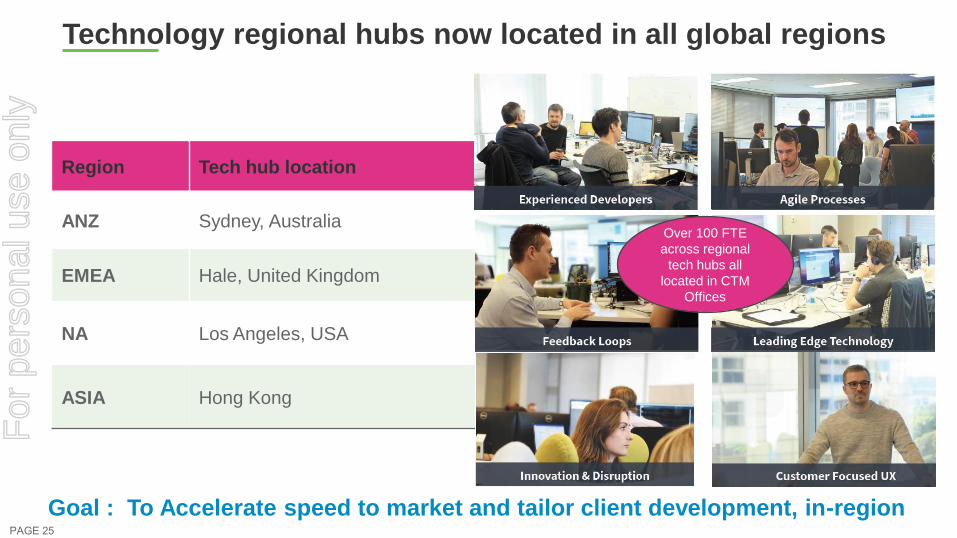
Technology regional hubs now located in all global regions
Goal : To Accelerate speed to market and tailor client development, in-region
Region Tech hub location
ANZ Sydney, Australia
EMEA Hale, United Kingdom
NA Los Angeles, USA
ASIA Hong Kong
PAGE 25
Over 100 FTE
across regional
tech hubs all
located in CTM
Offices
For
per
sona
l use
onl
y
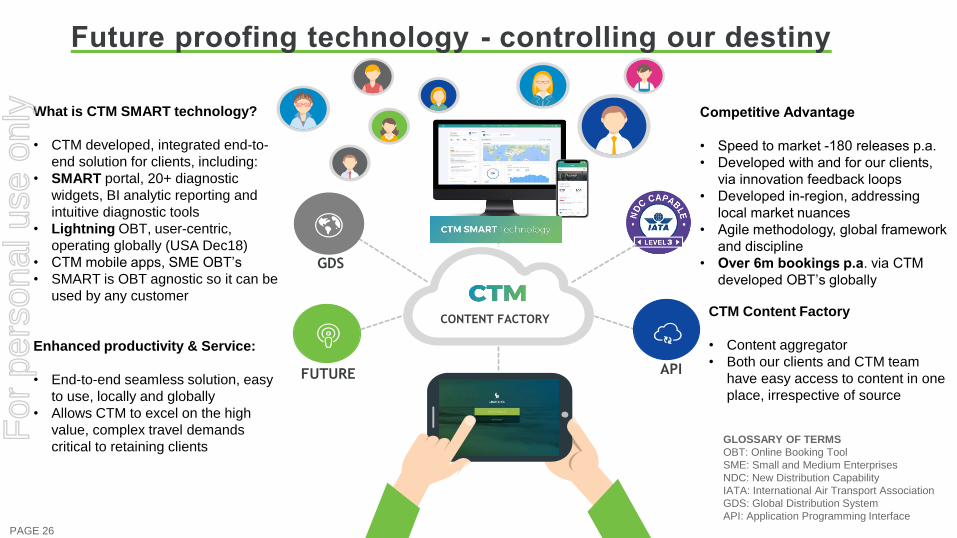
Future proofing technology - controlling our destiny
PAGE 26
CTM Content Factory
• Content aggregator
• Both our clients and CTM team
have easy access to content in one
place, irrespective of source
What is CTM SMART technology?
• CTM developed, integrated end-to-
end solution for clients, including:
• SMART portal, 20+ diagnostic
widgets, BI analytic reporting and
intuitive diagnostic tools
• Lightning OBT, user-centric,
operating globally (USA Dec18)
• CTM mobile apps, SME OBT’s
• SMART is OBT agnostic so it can be
used by any customer
Enhanced productivity & Service:
• End-to-end seamless solution, easy
to use, locally and globally
• Allows CTM to excel on the high
value, complex travel demands
critical to retaining clients
Competitive Advantage
Speed to market • -180 releases p.a.
Developed with and for our clients, •
via innovation feedback loops
Developed in• -region, addressing
local market nuances
Agile methodology, global framework •
and discipline
Over • 6m bookings p.a. via CTM
developed OBT’s globallyGDS
APIFUTURE
CONTENT FACTORY
GLOSSARY OF TERMS
OBT: Online Booking Tool
SME: Small and Medium Enterprises
NDC: New Distribution Capability
IATA: International Air Transport Association
GDS: Global Distribution System
API: Application Programming Interface
For
per
sona
l use
onl
y

FY19 Guidance
Update and
Strategy.
For
per
sona
l use
onl
y

FY19 Guidance update
FY19 underlying EBITDA range of AUD$144-150m (approximately +15%-20% growth on the p.c.p.).
Guidance Assumptions:
1. Foreign Currency cross-rates average USD0.76c/HKD6.00/ GBP0.56p during the year.
FX sensitivity upon EBITDA in FY19:
• For every +/- USD1c movement = approximately +/- AUD$1.1m FY19 EBITDA
• For every +/- GBP1p movement= approximately +/- AUD$0.7m FY19 EBITDA
2. Assume relatively flat client activity globally
3. Includes a 9 month contribution from Lotus Travel in FY19, effective 2 October 2018
4. Excludes any future potential acquisitions
PAGE 28
For
per
sona
l use
onl
y
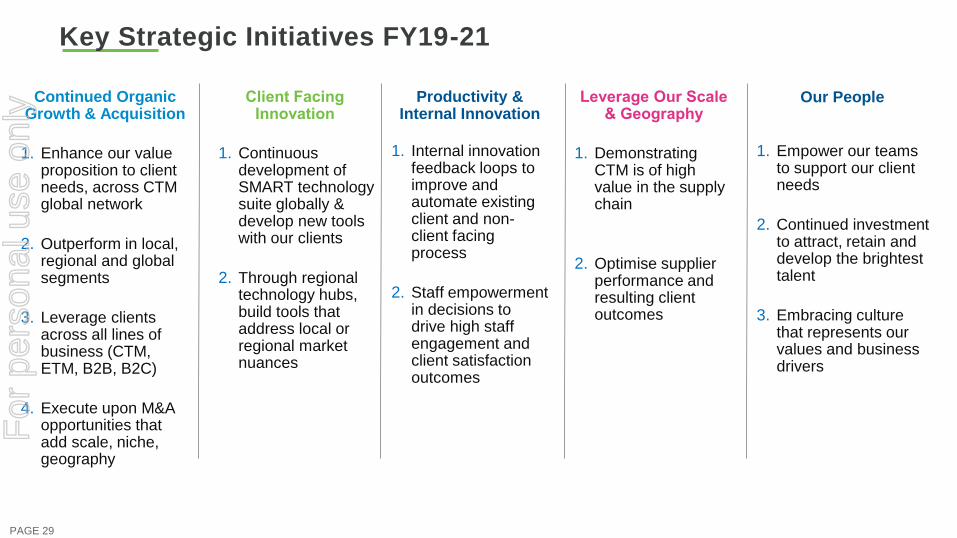
Key Strategic Initiatives FY19-21
PAGE 29
1. Enhance our value proposition to client needs, across CTM global network
2. Outperform in local, regional and global segments
3. Leverage clients across all lines of business (CTM, ETM, B2B, B2C)
4. Execute upon M&A opportunities that add scale, niche, geography
Continued Organic Growth & Acquisition
1. Continuous development of SMART technology suite globally & develop new tools with our clients
2. Through regional technology hubs, build tools that address local or regional market nuances
Client Facing Innovation
1. Demonstrating CTM is of high value in the supply chain
2. Optimise supplier performance and resulting client outcomes
Leverage Our Scale & Geography
1. Internal innovation feedback loops to improve and automate existing client and non-client facing process
2. Staff empowerment in decisions to drive high staff engagement and client satisfaction outcomes
Productivity & Internal Innovation
1. Empower our teams to support our client needs
2. Continued investment to attract, retain and develop the brightest talent
3. Embracing culture that represents our values and business drivers
Our People
For
per
sona
l use
onl
y

Questions? For
per
sona
l use
onl
y