corporate value chain (scope 3) accounting and … for stakeholder review – november 2010 3 1 1...
TRANSCRIPT

DRAFT FOR STAKEHOLDER REVIEW – NOVEMBER 2010
Corporate Value Chain (Scope 3) Accounting and Reporting Standard
Supplement to the GHG Protocol Corporate Accounting and Reporting Standard
DRAFT FOR STAKEHOLDER REVIEW
NOVEMBER 2010
Copyright © World Resources Institute & World Business Council for Sustainable Development, 2010
World Business Council for Sustainable Development

DRAFT FOR STAKEHOLDER REVIEW – NOVEMBER 2010
2
Table of Contents 1 Introduction .................................................................................................................................... 3
2 Accounting & Reporting Principles ........................................................................................... 12
3 Business Goals & Inventory Design .......................................................................................... 14
4 Overview of Scope 3 Emissions ................................................................................................. 17
5. Setting the Boundary ................................................................................................................... 37
6. Collecting Data ............................................................................................................................. 40
7 Allocating Emissions ................................................................................................................... 51
8 Accounting for Supplier Emissions ........................................................................................... 62
9 Setting a Reduction Target & Tracking Emissions Over Time ................................................ 69
10 Assurance ..................................................................................................................................... 78
11 Reporting ...................................................................................................................................... 90
Appendix A: Sample Scope 3 Reporting Form ...................................................................................... 92
Appendix B: Accounting for Emissions from Leased Assets .............................................................. 94
Appendix C: Guidance for Collecting Data from Suppliers .................................................................. 96
Appendix D: Uncertainty in Scope 3 Emissions .................................................................................. 101
Appendix E: Data Management Plan ..................................................................................................... 104
Glossary ................................................................................................................................................... 108
1

DRAFT FOR STAKEHOLDER REVIEW – NOVEMBER 2010
3
1 Introduction 1 2
The Greenhouse Gas Protocol Initiative is a multi-stakeholder partnership of businesses, non-governmental 3 organizations (NGOs), governments and others convened by the World Resources Institute (WRI), a U.S.-4 based environmental NGO, and the World Business Council for Sustainable Development (WBCSD), a 5 Geneva, Switzerland-based coalition of 200 international companies. Launched in 1998, the GHG Protocol’s 6 mission is to develop internationally accepted greenhouse gas accounting and reporting standards and 7 guidelines for business, and to promote their adoption worldwide. 8 9 The GHG Protocol Initiative has produced the following separate but complementary standards: 10 11
• GHG Protocol Corporate Accounting and Reporting Standard1
14
(2004): a step-by-step 12 methodology for companies to use to quantify and report their corporate GHG emissions 13
• GHG Protocol for Project Accounting (2005): a guide for quantifying reductions from GHG 15 mitigation projects 16 17
In 2008, the GHG Protocol launched an initiative to develop two new standards: 18 19
• GHG Protocol Corporate Value Chain (Scope 3) Accounting and Reporting Standard (to be 20 published in 2011)2
24
: a step-by-step methodology for companies to quantify and report their 21 corporate value chain (scope 3) related GHG emissions, and is intended to be used in conjunction 22 with the GHG Protocol Corporate Accounting and Reporting Standard 23
• GHG Protocol Product Accounting and Reporting Standard (to be published in 2011): a 25 methodology to quantify and report the greenhouse gas emissions associated with individual 26 products throughout their life cycle 27 28
29
30 31 32 33
1 The GHG Protocol Corporate Standard is sometimes referred to as “the GHG Protocol.” The term GHG Protocol is an umbrella term for the collection of standards, tools and other publications provided by the WRI/WBCSD GHG Protocol Initiative. 2 The GHG Protocol Corporate Value Chain (Scope 3) Accounting and Reporting Standard is also referred to as the GHG Protocol Scope 3 Standard.
GHG Protocol Corporate Value Chain (Scope 3) Accounting and
Reporting Standard
GHG Protocol Product
Accounting and Reporting Standard

DRAFT FOR STAKEHOLDER REVIEW – NOVEMBER 2010
4
The GHG Protocol Initiative has also published a number of sector-specific protocols and guidelines, 1 including: 2 3
• GHG Protocol for the U.S. Public Sector (2010): provides a step-by-step approach to measuring 4 and reporting emissions from public sector organizations, and complementary to the GHG Corporate 5 Protocol 6 7
• GHG Protocol Guidelines for Quantifying GHG Reductions from Grid-Connected Electricity 8 Projects (2007): explains how to quantify reductions in emissions that either generate or reduce the 9 consumption of electricity transmitted over power grids, and used in conjunction with the Project 10 Protocol 11
12 • GHG Protocol Land Use, Land-Use Change and Forestry Guidance for GHG Project 13
Accounting (2006): explains how to quantify and report reductions from Land Use, Land-Use 14 Change and Forestry, and used in conjunction with the Project Protocol 15
16 1.1 Standard Development Process 17 18 The GHG Protocol Initiative follows a broad, inclusive multi-stakeholder process to develop greenhouse gas 19 accounting and reporting standards with participation from businesses, government agencies, 20 nongovernmental organizations, and academic institutions from around the world. 21 22 The standard development process for the GHG Protocol Scope 3 Standard has occurred in parallel with the 23 process to develop the GHG Protocol Product Standard. This joint process includes active participation from 24 a large and diverse set of stakeholders and organizations. The process has several diverse stakeholder 25 groups that contribute to the development of the standards (see Process Structure below). The 25-member 26 Steering Committee provided strategic and technical direction to the process. Seven Technical Working 27 Groups, consisting of over 160 members, developed the first draft of the standards through frequent 28 consultations. A Stakeholder Advisory Group, comprised of more than 1,200 participants, provided feedback 29 on the first drafts of the standards. A Road Testing group of over 60 companies piloted one or both 30 standards within their organizations and provided feedback on the practicality and usability of the standards 31 based on their experiences. 32 33 This second draft of the Scope 3 Standard was developed between July 2010 and October 2010. Revisions 34 from the first draft (November 2009) were based on: 35 36
• Written comments from over 60 organizations in the stakeholder advisory group on the Draft for 37 Stakeholder Review (November 2009) 38
• Stakeholder comments received during five in-person stakeholder workshops, attended by over 350 39 participants (November – December 2009) 40
• Feedback from 35 road testing companies during an in-person road testing workshop (May 2010) 41 • Written feedback from 35 road testing companies on the Draft for Road Testing (July 2010) 42 • Feedback from the Steering Committee (June 2010) 43 • Feedback received from Technical Working Group members during two webinars (April 2010 and 44
August 2010) 45 46
The next steps to finalizing the Scope 3 Standard include: 47 48
• 30 day public comment period on the second draft of the Scope 3 Standard 49 • Revise the second draft based on feedback received 50 • Finalize requirements and key guidance of the standard by Winter 2011 51 • Publish the final standard by Spring/Summer 2011 52
53 54

DRAFT FOR STAKEHOLDER REVIEW – NOVEMBER 2010
5
Process Structure 1 2
3 4 Standard Development Timeline 5 6
Date Activity November 2007 Survey and consultations to assess need for new standards
September 2008 Steering Committee Meeting #1 (Washington DC) Technical Working Group Meeting #1 (London)
January 2009 Technical working groups begin drafting March 2009 Steering Committee Meeting #2 (Geneva) June 2009 Technical Working Group Meeting #2 (Washington DC) August 2009 Stakeholder webinar and comment period October 2009 Steering Committee Meeting #3 (Washington DC)
November - December 2009
First draft of standard released for stakeholder review Five stakeholder workshops held (in Berlin, Germany; Guangzhou,
China; Beijing, China; London, UK; Washington, DC, USA) Stakeholder comment period on first draft
January - June 2010 Road testing of draft standard by 30+ companies Road testing workshop (Washington DC)
June 2010 Steering Committee Meeting #4 (Oslo) July-October 2010 Revision of first drafts November 2010 Public comment period on second drafts December – January 2010
Revision of second drafts based on public comments and Steering Committee feedback
Winter 2011* Release final requirements and key guidance Spring/Summer 2011 Release final publications
*This date is subject to change based on the feedback received during the public comment period. 7

DRAFT FOR STAKEHOLDER REVIEW – NOVEMBER 2010
6
1.2 Purpose of the GHG Protocol Corporate Value Chain (Scope 3) Standard 1 2 Since the launch of the GHG Protocol Corporate Standard in 2001 and its revision in 2004, business 3 capabilities and needs in the field of greenhouse gas (GHG) accounting and reporting have grown 4 significantly. Corporate leaders are now adept at calculating emissions from GHG sources that they own or 5 control (i.e., scope 1 emissions) and emissions from the use of purchased energy (i.e., scope 2 emissions). 6 See Figure 1.1 for an overview of the scopes. 7 8 Figure 1.1: Overview of Scopes and Emissions Across the Value Chain 9 10
11 12 As GHG accounting expertise has grown, so has the realization that significant emission sources linked to 13 business activities are often outside scope 1 and scope 2. While a company’s scope 1 and scope 2 inventory 14 represents emissions related to the company’s operations, a company’s scope 3 inventory represents all 15 other indirect emissions that occur in the value chain of the reporting company, including both upstream and 16 downstream emissions. Scope 3 emissions include upstream activities such as the production of goods and 17 services purchased by the company, as well as downstream activities such as consumer use and disposal of 18 products sold by the company. 19 20 Scope 3 emissions are often the largest source of emissions for companies and therefore often represent the 21 largest opportunity for greenhouse gas reductions. A comprehensive approach to corporate GHG emissions 22 measurement, management and reporting – incorporating scope 1, scope 2, and scope 3 emissions – 23 enables companies to focus on the greatest opportunities to reduce emissions within the full value chain, 24 leading to more sustainable decisions about the products companies produce, buy, and sell. 25 26 As this awareness has grown, so has the need from businesses and other stakeholders for a common 27 approach to measuring and reporting scope 3 emissions. This standard provides a step-by-step approach 28 for companies to quantify and report their scope 3 GHG emissions. This standard is intended as a tool to 29 help businesses develop effective strategies to reduce their scope 3 emissions by making informed choices 30 about their value chain activities, as well as a standard framework to support consistent public reporting of 31 corporate value chain emissions according to a set of consistent reporting requirements. 32 33 This standard is designed to account for the emissions generated from corporate value chain activities during 34 the reporting period (usually a period of one year) and does not address the measurement of avoided 35

DRAFT FOR STAKEHOLDER REVIEW – NOVEMBER 2010
7
emissions or actions taken to compensate for or offset released emissions. It is also designed to account for 1 the absolute emissions of a company based on a physical or “attributional” accounting approach, rather than 2 a “consequential” approach to accounting that takes into account indirect or market effects. This standard 3 includes the six greenhouse gases covered by the Kyoto Protocol – carbon dioxide (CO2), methane (CH4), 4 nitrous oxide (N2O), hydrofluorocarbons (HFCs), perfluorocarbons (PFCs), and sulphur hexafluoride (SF6). 5 Companies may optionally account for additional greenhouse gases. 6 7 This standard is not designed to support comparisons between companies based on their scope 3 GHG 8 emissions. Differences in reported emissions may be a result of differences in inventory methodology or 9 differences in company structure or size. Additional measures are necessary to enable valid comparisons, 10 such as consistency in methodology and data used to calculate the inventory, and reporting of additional 11 information such as intensity ratios or performance metrics. 12 13 1.3 The business value of a Scope 3 inventory 14 15 Scope 3 emissions often represent the largest category of corporate GHG emissions, and therefore the 16 largest opportunity to reduce overall GHG impacts. Due to the complex and diverse nature of scope 3 17 activities, the standard was developed with the following objectives in mind: 18 19
• To help companies prepare a GHG inventory that represents a true and fair account of their scope 3 20 emissions, through the use of standardized approaches and principles 21
• To facilitate an understanding of scope 3 impacts that helps companies build effective strategies for 22 to managing and reducing scope 3 emissions and making informed choices about value chain 23 activities 24
• To simplify and reduce the costs of compiling a scope 3 inventory 25 • To increase consistency and transparency in GHG accounting and reporting among various 26
companies and GHG programs 27 28 See Chapter 3 (Business Goals & Inventory Design) for more information on various business goals 29 supported by a scope 3 inventory. 30 31 1.4 Relationship to the GHG Protocol Corporate Standard 32 33 This standard is a supplement to the GHG Protocol Corporate Accounting and Reporting Standard, Revised 34 Edition (2004) and is meant to be used in conjunction with the existing Corporate Standard. Under the 35 Corporate Standard, companies are required to report all scope 1 and scope 2 emissions, while reporting 36 scope 3 emissions is optional. This standard is designed to create further consistency in scope 3 inventories 37 through additional requirements and guidance for scope 3 accounting and reporting. 38 39 Companies reporting their corporate GHG emissions have two reporting options (see Table 1.1). 40 41 Table 1.1: Reporting Options for Users of the GHG Protocol 42
43 Reporting Option Scope 1 Scope 2 Scope 3
Report in conformance with the GHG Protocol Corporate Standard Required Required
Optional: Companies may report any scope 3 emissions the company chooses.
Report in conformance with the GHG Protocol Corporate Standard & the GHG Protocol Scope 3 Standard
Required Required
Required: Companies shall report scope 3 emissions following the requirements of the Scope 3 Standard.
44 Companies should make and apply decisions consistently across both standards. For example, the selection 45 of a consolidation approach (equity share, operational control or financial control) should be applied 46 consistently across scopes 1, 2 and 3. For more information on this, see Section 4.1 (Chapter 4). 47 48

DRAFT FOR STAKEHOLDER REVIEW – NOVEMBER 2010
8
1.5 Relationship to GHG Protocol Product Standard 1 2 The GHG Protocol Scope 3 Standard and GHG Protocol Product Standard both take a full value chain or life 3 cycle approach to GHG accounting. The Scope 3 Standard accounts for emissions at the corporate level, 4 while the Product Standard accounts for emissions at the individual product level. 5 6 Together, both standards provide a comprehensive approach to value chain GHG management based on a 7 company’s business goals. They allow a company to focus on emissions related to its operations and its 8 products, at both a corporate level and a product level. Companies should use both standards as part of a 9 comprehensive approach to GHG measurement and management. 10 11 The business goals of a company performing an inventory should drive the use of a particular GHG Protocol 12 accounting standard. The Product Standard and the Scope 3 Standard can help achieve many of the same 13 business goals including performance tracking, identifying reduction opportunities and supply chain 14 engagement. For companies looking to identify reduction opportunities, the Scope 3 Standard can achieve 15 this goal on a scope 3 activity level, helping a company identify areas with the greatest opportunities for 16 reductions across the entire corporate value chain. The Product Standard can help a company perform a 17 deeper analysis of individual products, potentially focusing on the products with the greatest potential for 18 reductions identified in the scope 3 assessment. The Product Standard will also be useful for companies 19 interested in achieving the objective of product differentiation. 20 21 Much of the same data is used to complete a scope 3 inventory and a product inventory since both 22 standards account for the value chain or life cycle impacts of a company’s products. Both standards also 23 involve collecting data from suppliers and other companies in the value chain. Since there can be overlap in 24 data collected for scope 3 and product inventories, companies may find added business value and 25 efficiencies in completing scope 3 and product inventories in parallel. 26 27 While each standard can be implemented without using the other, both standards are mutually supportive. 28 Before implementing the Product Standard, companies may find it useful to account for scope 3 emissions in 29 order to identify the individual product categories that contribute most to total value chain emissions. 30 Companies can conduct life cycle inventories for targeted products using the GHG Protocol Product 31 Standard, which can inform detailed GHG reduction strategies. Conversely, companies conducting scope 3 32 inventories may use product level GHG data based on the GHG Protocol Product Standard to calculate 33 upstream and downstream scope 3 emissions associated products. 34 35 Theoretically, the sum of the life cycle emissions of each of a company’s products should approximate the 36 company’s total corporate GHG emissions (i.e., scope 1 + scope 2 + scope 3), though a scope 3 inventory also 37 includes additional emissions categories such as business travel, employee commuting, and investments. In practice, 38 companies are not expected or required to calculate life cycle inventories for each product when calculating 39 scope 3 emissions. 40 41 Figure 1.2 illustrates the relationship between product life cycle inventories and a company’s scope 3 42 inventory. 43 44 45

DRAFT FOR STAKEHOLDER REVIEW – NOVEMBER 2010
9
Figure 1.2: Example of a scope 3 inventory for a manufacturing company 1 2
3 4 1.6 Who should use this standard? 5 6 This standard is written primarily from the perspective of a company developing a scope 3 GHG inventory. It 7 is intended to be used by companies of all sizes in all economic sectors. It can also be applied to other types 8 of organizations, such as government agencies, NGOs, and universities. Policymakers and designers of 9 GHG reporting or reduction programs can also use relevant parts of this standard to develop their own 10 accounting and reporting requirements. 11 12 1.7 GHG calculation tools and guidance 13 14 To complement the GHG Protocol Corporate Standard, several cross-sector and sector-specific calculation 15 tools are available on the GHG Protocol website (www.ghgprotocol.org). These calculation tools provide 16 step-by-step guidance together with electronic worksheets to help companies calculate GHG emissions from 17 specific sources or sectors. To help users implement the GHG Protocol Scope 3 Standard, new guidance for 18 calculating scope 3 emissions will also be provided on the GHG Protocol website. Any future sector-specific 19 tools or guidance will be made available on the GHG Protocol website as they are developed. 20 21 1.8 Terminology: Shall, should and may 22 23 The term “shall” is used in this standard to indicate what is required in order for a GHG inventory to be in 24 conformance with the GHG Protocol Scope 3 Standard. The term “should” is used to indicate a 25 recommendation, but not a requirement. The term “may” is used to indicate an option that is permissible or 26 allowable. The term “required” is used in the guidance to refer to requirements in the standard. “Needs”, 27 “can”, and “cannot” may be used to provide guidance on implementing a requirement or to indicate when an 28 action is or is not possible. 29 30 31
DRAFT FOR STAKEHOLDER REVIEW – NOVEMBER 2010
10
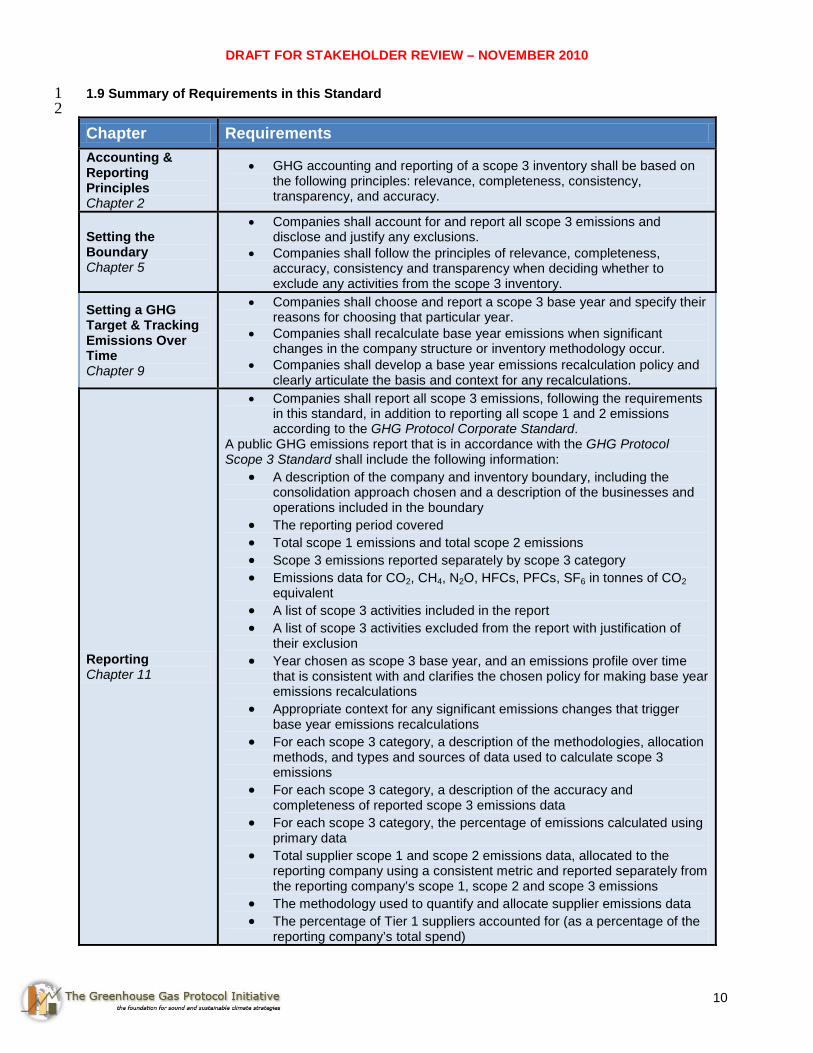
1.9 Summary of Requirements in this Standard 1 2 Chapter Requirements Accounting & Reporting Principles Chapter 2
• GHG accounting and reporting of a scope 3 inventory shall be based on the following principles: relevance, completeness, consistency, transparency, and accuracy.
Setting the Boundary Chapter 5
• Companies shall account for and report all scope 3 emissions and disclose and justify any exclusions.
• Companies shall follow the principles of relevance, completeness, accuracy, consistency and transparency when deciding whether to exclude any activities from the scope 3 inventory.
Setting a GHG Target & Tracking Emissions Over Time Chapter 9
• Companies shall choose and report a scope 3 base year and specify their reasons for choosing that particular year.
• Companies shall recalculate base year emissions when significant changes in the company structure or inventory methodology occur.
• Companies shall develop a base year emissions recalculation policy and clearly articulate the basis and context for any recalculations.
Reporting Chapter 11
• Companies shall report all scope 3 emissions, following the requirements in this standard, in addition to reporting all scope 1 and 2 emissions according to the GHG Protocol Corporate Standard.
A public GHG emissions report that is in accordance with the GHG Protocol Scope 3 Standard shall include the following information:
• A description of the company and inventory boundary, including the consolidation approach chosen and a description of the businesses and operations included in the boundary
• The reporting period covered • Total scope 1 emissions and total scope 2 emissions • Scope 3 emissions reported separately by scope 3 category • Emissions data for CO2, CH4, N2O, HFCs, PFCs, SF6 in tonnes of CO2
equivalent • A list of scope 3 activities included in the report • A list of scope 3 activities excluded from the report with justification of
their exclusion • Year chosen as scope 3 base year, and an emissions profile over time
that is consistent with and clarifies the chosen policy for making base year emissions recalculations
• Appropriate context for any significant emissions changes that trigger base year emissions recalculations
• For each scope 3 category, a description of the methodologies, allocation methods, and types and sources of data used to calculate scope 3 emissions
• For each scope 3 category, a description of the accuracy and completeness of reported scope 3 emissions data
• For each scope 3 category, the percentage of emissions calculated using primary data
• Total supplier scope 1 and scope 2 emissions data, allocated to the reporting company using a consistent metric and reported separately from the reporting company’s scope 1, scope 2 and scope 3 emissions
• The methodology used to quantify and allocate supplier emissions data • The percentage of Tier 1 suppliers accounted for (as a percentage of the
reporting company’s total spend)

DRAFT FOR STAKEHOLDER REVIEW – NOVEMBER 2010
11
1 Figure 1.3: Overview of Steps in Scope 3 Accounting and Reporting 2
3 Each of these steps is described in detail in the following chapters. 4 5
Review Principles
Chapter 2
Define Business
Goals
Chapter 3
Identify Scope 3
Activities
Chapter 4
Set the Boundary
Chapter 5
Collect Data
Chapter 6
Allocate Emissions
Chapter 7
Account for
Supplier Emissions
Chapter 8
Track Emissions Over Time
Chapter 9
Assure Emissions
Chapter 10
Report Emissions
Chapter 11

DRAFT FOR STAKEHOLDER REVIEW – NOVEMBER 2010
12
2 Accounting & Reporting Principles 1 2 Requirements in this chapter GHG accounting and reporting of a scope 3 inventory shall be based on the following principles: relevance, completeness, consistency, transparency, and accuracy. 3 As with financial accounting and reporting, generally accepted GHG accounting principles are intended to 4 underpin and guide GHG accounting and reporting to ensure the reported inventory represents a faithful, 5 true, and fair account of a company’s GHG emissions. The five principles, described below, are adapted 6 from the GHG Protocol Corporate Standard and are intended to guide the accounting and reporting of a 7 company’s scope 3 inventory. 8 9 GHG accounting and reporting of a scope 3 inventory shall be based on the following principles: 10 11 • Relevance: Ensure the GHG inventory appropriately reflects the GHG emissions of the company and 12
serves the decision-making needs of users – both internal and external to the company. 13 14 • Completeness: Account for and report on all GHG emission sources and activities within the inventory 15
boundary. Disclose and justify any specific exclusions. 16 17 • Consistency: Use consistent methodologies to allow for meaningful performance tracking of emissions 18
over time. Transparently document any changes to the data, inventory boundary, methods, or any other 19 relevant factors in the time series. 20
21 • Transparency: Address all relevant issues in a factual and coherent manner, based on a clear audit 22
trail. Disclose any relevant assumptions and make appropriate references to the accounting and 23 calculation methodologies and data sources used. 24
25 • Accuracy: Ensure that the quantification of GHG emissions is systematically neither over nor under 26
actual emissions, as far as can be judged, and that uncertainties are reduced as far as practicable. 27 Achieve sufficient accuracy to enable users to make decisions with reasonable assurance as to the 28 integrity of the reported information. 29
30 Guidance for Applying the Accounting and Reporting Principles 31 32 The primary function of these five principles is to guide the implementation of the GHG Protocol Scope 3 33 Standard, particularly when the application of the standard in specific issues or situations is ambiguous. 34 35 In practice, companies may encounter trade-offs between principles when completing a scope 3 inventory. 36 For example, a company may find that achieving the most complete scope 3 inventory requires using less 37 accurate data, compromising overall accuracy. Conversely, achieving the most accurate scope 3 inventory 38 may require excluding activities with low accuracy, compromising overall completeness. 39 40 Companies should balance tradeoffs between principles depending on their individual business goals (see 41 Chapter 3 for more information). For example, tracking performance toward a specific scope 3 reduction 42 target may require more accurate data. Over time, the trade-off between accuracy and completeness may 43 diminish as the accuracy and completeness of GHG data along the supply chain increases, enabling more 44 accurate, complete and consistent scope 3 inventories over time. 45
Relevance 46 For an organization’s GHG report to be relevant means that it contains the information that users – both 47 internal and external to the company – need for their decision making. Companies should use the principle of 48 relevance as a guide when selecting data sources. Companies should collect data of sufficient quality to 49 ensure that the inventory is relevant (i.e., that it appropriately reflects the GHG emissions of the company, 50 and serves the decision-making needs of users, both internal and external to the company). Selection of data 51

DRAFT FOR STAKEHOLDER REVIEW – NOVEMBER 2010
13
sources depends on a company’s individual business goals. More information on relevance and data 1 collection is provided in Chapter 6. 2 3 Companies should also use the principle of relevance when determining whether to exclude any activities 4 from the inventory boundary (see description of “Completeness” below). 5
Completeness 6 Companies should ensure that the scope 3 inventory appropriately reflects the GHG emissions of the 7 company, and serves the decision-making needs of users, both internal and external to the company. In 8 some situations, companies may be unable to estimate emissions due to a lack of data or other limiting 9 factors. Companies should not exclude any activities from the scope 3 inventory that would compromise the 10 relevance of the reported inventory. In the case of any exclusions, it is important that exclusions be 11 documented and justified. Assurance providers can determine the potential impact and relevance of the 12 exclusion on the overall inventory report. More information on completeness is provided in Chapter 5. 13
Consistency 14 Users of GHG information typically track emissions information over time in order to identify trends and 15 assess the performance of the reporting company. The consistent application of accounting approaches, 16 inventory boundary, and calculation methodologies is essential to producing comparable GHG emissions 17 data over time. GHG data for all scope 3 emissions within an organization’s inventory boundary needs to be 18 compiled in a manner that ensures the aggregate information for each scope 3 activity is consistent and 19 comparable over time. If there are changes to the inventory boundary (e.g., inclusion of previously excluded 20 activities), methods, data or other factors affecting emission estimates, they need to be transparently 21 documented and justified, and may warrant recalculation of base year emissions. More information on 22 consistency when tracking performance over time is provided in Chapter 9. 23
Transparency 24 Transparency relates to the degree to which information on the processes, procedures, assumptions and 25 limitations of the GHG inventory are disclosed in a clear, factual, neutral, and understandable manner based 26 on clear documentation and archives (i.e., an audit trail). Information should be recorded, compiled, and 27 analyzed in a way that enables internal reviewers and external assurance providers to attest to its credibility. 28 Specific exclusions or inclusions need to be clearly identified and justified, assumptions disclosed, and 29 appropriate references provided for the methodologies applied and the data sources used. The information 30 should be sufficient to enable a party external to the inventory process to derive the same results if provided 31 with the same source data. A transparent report will provide a clear understanding of the issues and a 32 meaningful assessment of performance of the scope 3 activities of the reporting company. An independent 33 third party assessment is a good way of ensuring transparency and determining that an appropriate audit trail 34 has been established and documentation provided. More information on reporting is provided in Chapter 11. 35
Accuracy 36 Data should be sufficiently accurate to enable intended users to make decisions with reasonable assurance 37 that the reported information is credible. It is important that any estimated data be as accurate as necessary 38 to guide the decision making needs of the company and ensure that the GHG inventory is relevant. GHG 39 measurements, estimates, or calculations should be systemically neither over nor under the actual emissions 40 value, as far as can be judged. The quantification process should be conducted in a manner that minimizes 41 uncertainty. Any uncertainties should be reduced as far as practicable and necessary to serve the decision 42 making needs of the company. Reporting on measures taken to ensure accuracy and improve accuracy over 43 time can help promote credibility and enhance transparency. More information on accuracy when collecting 44 data is provided in Chapter 6. 45 46 Case study to be provided
47

DRAFT FOR STAKEHOLDER REVIEW – NOVEMBER 2010
14
3 Business Goals & Inventory Design 1 2 Scope 3 emissions often represent the largest category of emissions for a company and include the activities 3 of many partners along the value chain. Compiling a scope 3 inventory allows companies to significantly 4 improve their understanding of their value chain GHG impacts, as a step toward value chain GHG 5 management and achieving GHG emissions reductions. 6 7 Before accounting for scope 3 emissions, companies should consider what goals the company intends to 8 achieve. Companies frequently cite the following business goals as reasons for compiling a scope 3 9 inventory: 10 11
• Understanding risks and opportunities associated with emissions in the entire value chain; 12 • Identifying GHG reduction opportunities, setting reduction targets, and tracking performance; 13 • Engaging suppliers and enabling supply chain GHG management; and 14 • Reporting to stakeholders and participating in GHG reporting programs. 15
16 Companies generally want their GHG inventory to serve multiple business goals. Companies should design 17 the process from the outset to provide information to a variety of stakeholders, both internal and external to 18 the company. This standard has been designed as a comprehensive accounting and reporting framework to 19 enable a company to gather information to serve any, or a combination of, the various business goals 20 outlined in Table 3.1. Scope 3 inventory data can be aggregated and disaggregated across various scope 3 21 activities, among Tier 1 suppliers, or among more specific purchased and sold product categories, enabling 22 companies to gather relevant data to achieve their business objectives and disclose information to their 23 stakeholders. 24 25 Table 3.1: Business goals served by a scope 3 GHG inventory 26 27 Business Goal Description Understand risks and opportunities associated with emissions in the entire value chain
• Identify climate-related risks in the value chain • Identify new market opportunities • Guide investment and procurement decisions
Identify GHG reduction opportunities, set reduction targets, and track performance
• Identify GHG hot spots and reduction opportunities and prioritize GHG reduction efforts across the value chain
• Set scope 3 GHG reduction targets • Measure and report GHG performance over time
Supply chain engagement and management
• Partner with companies in the value chain to achieve GHG reductions
• Expand GHG accountability, transparency, and management in the supply chain
• Enable greater transparency on companies’ efforts to engage suppliers
• Reduce energy use, costs, and risks in the supply chain and avoid future costs related to energy and emissions
Report to stakeholders and participate in GHG reporting programs
• Meet needs of stakeholders through public disclosure of GHG emissions and progress on GHG targets
• Participate in voluntary reporting programs to disclose GHG related information to stakeholder groups (e.g., investors)
• Report to government reporting programs at the international, national, regional or local level
• Improve corporate reputation and accountability through public disclosure
28 29

DRAFT FOR STAKEHOLDER REVIEW – NOVEMBER 2010
15
3.1 Business Goals of a Scope 3 Inventory 1 2 Understanding risks and opportunities associated with emissions in the entire value chain 3 4 GHG emissions from corporate activities are increasingly becoming a mainstream management issue for 5 business. Potential liabilities from GHG exposure arise from unstable resource costs, future resource 6 scarcity, environmental regulations (e.g., carbon taxes, emissions trading programs, energy efficiency 7 standards, product regulations, etc.), scrutiny from investors and shareholders, as well as reputational risk 8 from stakeholders (see Table 3.2 for examples of climate change related risks). By compiling a 9 comprehensive scope 3 inventory, companies are able to understand the overall emissions profile of its 10 upstream and downstream activities. This information provides companies with an understanding of where 11 potential climate-related risks lie in the value chain. 12 13 Future resource constraints and protection from energy price volatility may be a business driver for many 14 companies to undertake an assessment of their full value chain emissions. This information allows 15 companies to identify energy intensive impacts in the value chain and make adjustments to reduce the risk of 16 future resource scarcity or energy price fluctuations. 17 18 For some companies, compiling a scope 3 inventory may provide information on the sources of value chain 19 emissions needed to improve planning for potential future carbon regulations. For example, potential taxes 20 on energy or embedded carbon emissions in products, may significantly impact the cost of purchased goods 21 or components used in the manufacturing and production processes of a company. Understanding these 22 emissions helps companies plan for such potential policies and guide corporate procurement decisions and 23 product design. 24 25 Additionally, companies may find that their there is a reputational risk if they do not understand the impact of 26 their broader corporate value chain activities. By undertaking a scope 3 inventory and understanding where 27 their emissions are, companies can credibly communicate to their stakeholders their impacts and the actions 28 taken to reduce them. 29 30 Companies can also use the results of the scope 3 inventory to identify new market opportunities for 31 producing and selling goods and services with lower GHG emissions. As more companies in the value chain 32 measure and manage GHG emissions, demand will grow for new products that reduce emissions throughout 33 the value chain. 34 35 Table 3.2: Examples of climate change related risks related to scope 3 emissions 36 37 Type of Risk Examples
Regulatory Greenhouse gas emissions reduction laws or regulations introduced or pending in regions where the company, its suppliers, or its customers operate
Supply chain Suppliers passing higher energy or emissions-related costs to customers; Supply chain business interruption risk
Product and technology Decreased demand for products with relatively high greenhouse gas emissions; Increased demand for competitors’ products with relatively low emissions
Litigation Lawsuits directed at the company or an entity in the value chain charging negligence, public nuisance, etc.
Reputation Consumer backlash, stakeholder backlash, or negative media coverage about the company or activities or entities in the value chain
Physical Damage to assets in the company’s operations or value chain from drought, floods, storms, or other physical effects of climate change
38 39
DRAFT FOR STAKEHOLDER REVIEW – NOVEMBER 2010
16
Identifying GHG reduction opportunities, setting reduction targets, and tracking performance 1 2 Compiling a scope 3 inventory, according to a consistent framework, provides a quantitative tool for 3 companies to help identify emissions reduction opportunities along their corporate value chain. Scope 3 4 inventories provide detailed information on the relative size and scale of emission sources within and across 5 the various scope 3 categories. What gets measured gets managed. Therefore, this information may be used 6 to identify the largest emission sources (i.e., “hot spots”) and guide the most effective emission reduction 7 activities, often resulting in cost savings for companies. 8 9 Companies may use the inventory information to guide emissions reduction activities within and across 10 scope 3 activities. For example, a company whose largest source of value chain emissions is contracted 11 logistics may choose to optimize these operations through changes to product packaging to increase the 12 volume per shipment, or increase the number of low-carbon logistics providers. Additionally, companies may 13 utilize this information to change their procurement practices or improve product design or product efficiency, 14 resulting in reduced energy use. 15 16 Conducting a rigorous GHG inventory according to a consistent framework is also a prerequisite for setting 17 an internal or public GHG target. External stakeholders, including customers, investors, shareholders and 18 others are increasingly interested in measured and reported progress in emissions reductions by companies. 19 Therefore, identifying reduction opportunities, setting goals and reporting on progress to stakeholders may 20 help differentiate a company in an increasingly environmentally conscious marketplace. 21 22 Supply chain engagement 23 24 A company’s scope 3 emissions include the emissions of its suppliers, customers, and other value chain 25 partners. Therefore, conducting a scope 3 inventory should encourage the measurement and reporting of 26 emissions from various partners across the value chain. For many companies, a primary goal of compiling a 27 scope 3 inventory may be to engage with suppliers to encourage supplier GHG measurement and reduction, 28 and to report on supplier performance. For example, a company may engage with their largest suppliers to 29 obtain emissions information on the products they purchase from them, as well as information on suppliers’ 30 GHG measurement and reduction plans. Successful engagement with suppliers often requires a company to 31 work closely with their supply chain to build a common understanding of emissions-related information and 32 the benefits of achieving GHG reductions. Reporting on the progress of a company’s engagement with its 33 supply chain can be useful information for stakeholders external and internal to the reporting company. 34 35 Companies may also wish to engage with their customers by providing useful information on product use and 36 disposal. For example, a company may want to work with stakeholders such as retailers, marketers or 37 advertisers to convey information to customers on less energy intensive products, how to use a product more 38 efficiently, or to encourage re-use or recycling. A scope 3 inventory enables a company to understand where 39 the largest downstream hot spots are so that they can credibly engage with stakeholders to improve their 40 value chain impacts. 41 42 Participating in GHG reporting programs 43 44 As concerns over climate change grow, NGOs, investors, governments and other stakeholders are 45 increasingly calling for greater disclosure of corporate activities and GHG information. They are interested in 46 the actions companies are taking and in how companies are positioned relative to their competitors. For 47 many companies, responding to this stakeholder interest by disclosing information on corporate impacts and 48 reduction activities is a business objective of compiling a scope 3 inventory. This information is often 49 disclosed through stand-alone corporate sustainability reports, mandatory government registries, industry 50 groups, or through stakeholder-led reporting programs. 51 52 Mandatory and voluntary reporting programs often offer assistance for companies in setting GHG targets, 53 provide industry-specific benchmarking information, and provide information on corporate activities to a 54 specific stakeholder audience. An example of this is the global voluntary reporting program, The Carbon 55 Disclosure Project, which provides corporate GHG performance information to a community of investors. 56 Companies may also find that public reporting can also strengthen their standing with customers and 57 differentiate it from their competitors by being recognized for participating in voluntary GHG programs. 58

DRAFT FOR STAKEHOLDER REVIEW – NOVEMBER 2010
17
4 Overview of Scope 3 Emissions 1 2 This chapter provides an overview of scope 3 emissions, including the list of scope 3 categories and detailed 3 descriptions of each category. 4 5 4.1 Overview of the scopes 6 7 The GHG Protocol Corporate Standard divides a company’s emissions into direct and indirect emissions. 8 9
• Direct emissions are emissions from sources that are owned or controlled by the reporting 10 company. 11
12 • Indirect emissions are emissions that are a consequence of the activities of the reporting company, 13
but occur at sources owned or controlled by another company. 14 15 Direct and indirect emissions are categorized into three “scopes” (see Table 4.1) 16 17 Table 4.1: Overview of the Scopes 18 19 Emissions Type
Scope Definition Examples
Direct Emissions Scope 1
Emissions from operations that are owned or controlled by the reporting company
Emissions from combustion in owned or controlled boilers, furnaces, vehicles, etc.; emissions from chemical production in owned or controlled process equipment
Indirect Emissions
Scope 2
Emissions from the generation of purchased or acquired electricity, steam, heating or cooling consumed by the reporting company
Use of purchased electricity, steam, heating or cooling
Scope 3
All other indirect emissions that occur in the value chain of the reporting company, including both upstream and downstream emissions
Production of purchased products, transportation of purchased products, use of sold products
20 Scope 1, scope 2 and scope 3 are mutually exclusive, such that there is no double counting of emissions 21 between the scopes for the reporting company. A company’s scope 3 inventory does not include any 22 emissions already accounted for as scope 1 or 2 by the company. The aggregation of a company’s scope 1, 23 scope 2, and scope 3 emissions represent the reporting company’s total corporate GHG emissions, as 24 shown in Box 4.1. 25 26 Box 4.1: Total Corporate GHG Emissions 27 28
29 By definition, scope 3 emissions are released from sources owned and controlled by other entities in the 30 value chain, such as materials suppliers, third party logistics providers, waste management suppliers, travel 31 suppliers, lessees and lessors, franchisees, retailers, employees, and customers. 32 33 34

DRAFT FOR STAKEHOLDER REVIEW – NOVEMBER 2010
18
4.2 Organizational Boundaries and Scope 3 Emissions 1 2 The first step in accounting for corporate emissions is to define the company’s organizational boundary. As 3 detailed in the GHG Protocol Corporate Standard, companies have three options for defining their 4 organizational boundaries: 5 6 Table 4.2: Consolidation Approaches 7 8 Consolidation Approach Description
Equity share Under the equity share approach, a company accounts for GHG emissions from operations according to its share of equity in the operation. The equity share reflects economic interest, which is the extent of rights a company has to the risks and rewards flowing from an operation.
Financial control Under the financial control approach, a company accounts for 100 percent of the GHG emissions over which it has financial control. It does not account for GHG emissions from operations in which it owns an interest but does not have financial control.
Operational control Under the operational control approach, a company accounts for 100 percent of the GHG emissions over which it has operational control. It does not account for GHG emissions from operations in which it owns an interest but does not have operational control.
9 The selection of a consolidation approach affects which activities in the company’s value chain are 10 categorized as direct emissions and indirect emissions and which emissions are categorized as scope 1, 11 scope 2, and scope 3. Operations or activities in a company’s value chain that are excluded from its scope 1 12 and 2 inventory become relevant when accounting for scope 3 emissions (see Box 4.2). 13 14 See GHG Protocol Corporate Standard (Chapter 3, Setting Organizational Boundaries) for more information 15 on each of the consolidation approaches. 16 17 Box 4.2. Examples of how the selection of the organizational boundary affects scope 3 emissions 18 19 If a company selects the equity share approach, emissions from any asset the company partially or wholly 20 owns are included in its direct emissions (i.e., scope 1), but emissions from any asset the company controls 21 but does not partially or wholly own (e.g., a leased asset) are excluded from its direct emissions and should 22 be included in its scope 3 inventory 23 24 If a company selects the operational control approach, emissions from any asset the company controls are 25 included in its direct emissions (i.e., scope 1), but emissions from any asset the company wholly or partially 26 owns but does not control is excluded from its direct emissions and should be included in its scope 3 27 inventory. 28 29 Scope 3 includes: 30 31
• Emissions from activities in the value chain of the entities included in the company’s organizational 32 boundary; and 33
• Emissions from activities excluded from the company’s organizational boundary that the company 34 partially or wholly owns or controls, including leased assets, investments, and franchises (see Box 35 4.3). 36
37 Companies may optionally include emissions from activities in the value chain of entities excluded from the 38 organizational boundary (i.e., emissions that occur in the value chain of leased assets, investments and 39 franchises). 40 41

DRAFT FOR STAKEHOLDER REVIEW – NOVEMBER 2010
19
Box 4.3: Example of How the Consolidation Approach Affects the Scope 3 Inventory 1 2 The reporting company has an equity share in four entities (Entities A, B, C and D) and has operational 3 control over three of those entities (Entities A, B, and C). The company does not have operational control 4 over Entity D. The company selects the operational control approach to define its organizational boundary. 5 Emissions from Entity A, Entity B and Entity C are included in the company’s scope 1 and scope 2 inventory, 6 while emissions from Entity D are excluded from the company’s scope 1 and scope 2 inventory. Emissions in 7 the value chain of Entities A, B and C are included in the company’s scope 3 inventory. Emissions from the 8 operation of Entity D are included in the company’s scope 3 inventory in Category 10 (Investments) because 9 it is an equity investment not included in scope 1 or 2. 10 11 12 13 14 15 16 17 18 19 20 21 22 23 24 25 26 27 28 29 30 31 32 33 34 35 4.3 Introduction to Upstream and Downstream Scope 3 Emissions 36 37 This standard divides scope 3 emissions into upstream and downstream emissions. The distinction is based 38 on the financial transactions of the company. Upstream emissions are related to purchased goods and 39 services. Downstream emissions are related to sold goods and services. 40 41
• Upstream emissions include indirect GHG emissions from purchased or acquired goods and 42 services, up to the point of receipt by the reporting company; emissions from investments not 43 included in scope 1 or 2; and emissions from employee commuting.3
45 44
• Downstream emissions
48
include indirect GHG emissions from sold goods and services, subsequent 46 to sale by the reporting company. 47
49
3 While employee commuting is not always purchased or reimbursed by the reporting company, employee commuting is a type of service that enables company operations, so is included in upstream emissions along with purchased or acquired goods and services.
Entity A
Key: Scope 1 Scope 3
Entity B Entity C Entity D
Upstream Scope 3
Emissions
Downstream Scope 3 Emissions

DRAFT FOR STAKEHOLDER REVIEW – NOVEMBER 2010
20
4.4 Descriptions of Scope 3 Categories 1 2 This standard categorizes scope 3 emissions into 15 distinct categories, as detailed in Figure 4.1. The 3 categories are intended to provide companies with a systematic framework to organize, understand, and 4 report on the diversity of scope 3 activities within a corporate value chain. The categories are designed to be 5 mutually exclusive, such that there is no double counting of emissions between categories. 6 7 Table 4.3 includes summary descriptions of each of the 15 scope 3 categories. Table 4.3 also clarifies the 8 emissions included in each category (e.g., whether or not all cradle-to-gate emissions are included), in order 9 to standardize the limits of each category. Table 4.4 includes a description of supplier emissions, which are 10 reported in addition to, but separately from, scope 3 emissions. 11 12 Figure 4.1: Overview of Scopes and Emissions Across the Value Chain 13 14
15 16 17 18
19
DRAFT FOR STAKEHOLDER REVIEW – NOVEMBER 2010
21
Table 4.3: Description of Scope 3 Categories
Upstream Scope 3 Emissions
Category Category Description Emissions Included 1. Purchased
Goods & Services
• Extraction, production, and transportation of goods & services purchased or acquired by the reporting company in the reporting year, not otherwise included in Categories 2 - 9
• All upstream (cradle-to-gate) emissions of purchased goods & services
2. Capital Goods • Extraction, production, and transportation of capital goods
purchased or acquired by the reporting company in the reporting year
• All upstream (cradle-to-gate) emissions of purchased capital goods
3. Fuel- and Energy- Related Activities Not Included in Scope 1 or 2
• All activities related to fuel and energy consumed by the reporting company, not already accounted for in scope 1 or 2: A. Extraction, production, and transportation of fuels
consumed by the reporting company B. Extraction, production, and transportation of fuels
consumed in the generation of electricity, steam, heating and cooling consumed by the reporting company
C. Generation of electricity, steam, heating and cooling that is consumed (lost) in a T&D system (reported by end user)
D. Generation of electricity, steam, heating, and cooling that is purchased by the reporting company and sold to end users (reported by utility company or energy retailer)
A. All upstream (cradle-to-gate) emissions from raw material extraction up to the point of (but excluding) combustion
B. All upstream (cradle-to-gate) emissions from raw material extraction up to the point of (but excluding) combustion
C. Emissions from the combustion of purchased energy D. Emissions from the combustion of purchased energy
4. Transportation & Distribution (Upstream)
• Third-party transportation & distribution of products purchased by the reporting company in the reporting year, including transportation & distribution between a company’s Tier 1 suppliers and its own operations; between a company’s own facilities; and between a company and its customers (paid for by the reporting company)
• Any transportation & distribution services purchased by the reporting company (including inbound and outbound logistics)
• The scope 1 and scope 2 emissions that occur during use of vehicles and facilities (e.g., from energy use).
• Optional: The life cycle emissions associated with manufacturing vehicles, facilities, or infrastructure.
5. Waste Generated in Operations
• Third-party disposal/treatment of waste generated in the reporting company’s operations in the reporting year
• The scope 1 and scope 2 emissions that occur during disposal or treatment
6. Business Travel
• Transportation of employees for business-related activities in vehicles owned or operated by third parties
• The scope 1 and scope 2 emissions that occur during use of vehicles (e.g., from energy use).
• Optional: The life cycle emissions associated with manufacturing vehicles or infrastructure

DRAFT FOR STAKEHOLDER REVIEW – NOVEMBER 2010
22
7. Employee Commuting
• Transportation of employees between their homes and their worksites
• The scope 1 and scope 2 emissions that occur during use of vehicles (e.g., from energy use)
• Optional: Emissions from employee teleworking
8. Leased Assets (Upstream)
• Operation of assets leased by the reporting company in the reporting year and not included in scope 1 and 2 (reported by lessee)
• The scope 1 and scope 2 emissions that occur during operation of leased assets (e.g., from energy use)
• Optional: The life cycle emissions associated with manufacturing or constructing leased assets
9. Investments • Operation of investments not included in scope 1 and 2, including equity investments and debt investments
• The scope 1 and scope 2 emissions of the investee • Optional: The scope 3 emissions of the investee
Downstream Scope 3 Emissions
10. Transportation & Distribution (Downstream)
• Third-party transportation & distribution of sold products between the point of sale and the end consumer (not paid for by the reporting company), including retail and storage
• The scope 1 and scope 2 emissions that occur during use of vehicles and facilities (e.g., from energy use)
• Optional: The life cycle emissions associated with manufacturing vehicles, facilities, or infrastructure
11. Processing of Sold Products
• Processing of sold intermediate products by downstream value chain partners (e.g., manufacturers)
• The scope 1 and scope 2 emissions that occur during processing (e.g., from energy use)
12. Use of Sold Products
• Consumer use of goods and services sold by the reporting company in the reporting year
• The direct use phase emissions of sold products (i.e., the scope 1 and 2 emissions that occur during use – limited to products that directly consume energy (fuels or electricity) during use; fuels and feedstocks; and GHGs and products that contain GHGs that are emitted during use)
• Optional: The indirect use phase emissions of sold products
13. End-of-Life Treatment of Sold Products
• Waste disposal/treatment of products sold by the reporting company (in the reporting year) at the end of their life
• The scope 1 and scope 2 emissions that occur during disposal or treatment
14. Leased Assets (Downstream)
• Operation of assets owned by the reporting company and leased to other entities in the reporting year, not included in scope 1 and 2 (reported by lessor)
• The scope 1 and scope 2 emissions that occur during operation of leased assets (e.g., from energy use).
• Optional: The life cycle emissions associated with manufacturing or constructing leased assets
15. Franchises • Operation of franchises, not included in scope 1 and 2
(reported by franchisor) • The scope 1 and scope 2 emissions that occur during
operation of franchises (e.g., from energy use) • Optional: The life cycle emissions associated with
manufacturing or constructing franchises Table 4.4. Supplier Emissions
Supplier Emissions
Supplier Emissions • Scope 1 and 2 emissions of the reporting company’s relevant Tier 1 suppliers

DRAFT FOR STAKEHOLDER REVIEW – NOVEMBER 2010
23
1. Purchased Goods and Services 1 2 This category includes all upstream (i.e., cradle to gate) emissions from the production of products 3 purchased or acquired by the reporting company in the reporting year. Products include both goods (tangible 4 products) and services (intangible products). 5 6 This category includes emissions from: 7 8
• Extraction of raw materials; 9 • Agricultural activities; 10 • Land use and land use change; 11 • Manufacturing, production, and processing; 12 • Generation of electricity consumed by upstream activities; 13 • Disposal/treatment of waste generated by upstream activities; 14 • Transportation of materials and products between suppliers; and 15 • All other activities prior to acquisition by the reporting company 16
17 Emissions from the use or operation of purchased products by the reporting company are accounted for in 18 either scope 1 (e.g., for fuel use) or scope 2 (e.g., for electricity use), rather than scope 3. 19 20 This category includes emissions from all purchased goods and services that are not otherwise included in 21 the other categories of upstream scope 3 emissions in Table 4.3 (i.e., Category 2 through Category 9). 22 Specific categories of upstream emissions are separately reported to enhance the transparency and 23 consistency of scope 3 reports. 24 25 Companies may find it useful to differentiate between purchases of production-related and non-production-26 related products. Doing so may be aligned with existing procurement practices and therefore may be a useful 27 way to more efficiently organize and collect data (see Box 4.4). 28 29 Box 4.4: Production-Related and Non-Production-Related Procurement 30 31 A company’s purchases can be divided into two types:
• Production-related procurement • Non-production-related procurement
Production-related procurement (often called direct procurement) consists of purchased goods that are directly related to the production of a company’s products. Production-related procurement includes:
• Intermediate goods (e.g., materials, components and parts), which the company purchases to process, transform, or include in another product;
• Capital goods (e.g., plant, property and equipment), which the company uses to manufacture a product, provide a service, or sell, store, and deliver merchandise; and
• Final goods purchased for resale (for retail and distribution companies only).
Non-production-related procurement (often called indirect procurement) consists of purchased goods and services that are not integral to the company’s products, but are instead used to enable operations. Non-production-related procurement may include capital goods such as furniture, office equipment, and computers. Non-production-related procurement includes:
• Operations resource management (ORM): Products used in office settings such as office supplies, office furniture, computers, telephones, travel services, IT support, outsourced administrative functions, consulting services, and janitorial and landscaping services; and
• Maintenance, repairs and operations (MRO): Products used in manufacturing settings, such as spare parts and replacement parts.
32

DRAFT FOR STAKEHOLDER REVIEW – NOVEMBER 2010
24
Companies may also find it useful to differentiate between purchases of final products, intermediate 1 products, and capital goods (see Box 4.5). Scope 3 emissions from capital goods are reported in Category 2 2 (Capital Goods), rather than this category. 3 4 Box 4.5: Final Products, Intermediate Products and Capital Goods 5 6 Final products are goods and services that are consumed by the end user in their current form, without further processing, transformation, or inclusion in another product. Final products include not only products consumed by end consumers, but also:
• Products consumed by businesses in the current form (e.g., capital goods) • Products sold to retailers for resale to end consumers (e.g., consumer products)
Intermediate products are inputs to the production of other goods or services that require further processing, transformation, or inclusion in another product before use by the end consumer. Intermediate products are not consumed by the end user in their current form. Intermediate goods and capital goods are both inputs to the company’s operations. The distinction is that:
• Intermediate goods require further processing, transformation, or inclusion in another product before being used by the end consumer, while
• Capital goods are final goods that are not further processed by the company, but are instead used in their current form by the company to manufacture a product, provide a service, or sell, store, and deliver merchandise.
The distinction between intermediate goods and capital goods depends on the circumstance. As an example, if a company includes an electrical motor in another product (e.g., a motor vehicle), the motor is an intermediate good. If a company uses the electrical motor to produce other goods, the motor is a capital good consumed by the reporting company. 7 2. Capital Goods 8
9 This category includes all upstream emissions from the production of capital goods purchased or acquired by 10 the reporting company in the reporting year. Emissions from the use or operation of capital goods by the 11 reporting company are accounted for in either scope 1 (e.g., for fuel use) or scope 2 (e.g., for electricity use), 12 rather than scope 3. 13 14 Capital goods are final goods that are used by the company to manufacture a product, provide a service, or 15 sell, store, and deliver merchandise. Capital goods are not directly sold to a company’s consumers and have 16 an extended life. In financial accounting, capital goods are treated as fixed assets or plant, property and 17 equipment (PP&E). Examples of capital goods include equipment, machinery, buildings, facilities, and 18 vehicles. 19 20 In certain cases, there may be ambiguity over whether a particular purchased product is a capital good. 21 Companies should follow their own financial accounting procedures to determine whether to account for a 22 purchased product as a capital good in this category or as a purchased good or service in Category 1. 23 Companies should not double count emissions between Category 1 and Category 2. 24 25 Box 4.6 Accounting for Emissions from Capital Goods 26 27 In financial accounting, capital goods (sometimes called “capital assets”) are typically depreciated or amortized over the life of the asset. For purposes of accounting for scope 3 emissions companies should not depreciate, discount, or amortize the emissions from the production of capital goods over time. Instead companies should account for the total cradle-to-gate emissions of purchased capital goods in the year of acquisition the same way the company accounts for emissions from other purchased products in Category 1. 28
29

DRAFT FOR STAKEHOLDER REVIEW – NOVEMBER 2010
25
3. Fuel- and Energy-Related Emissions Not Included in Scope 1 or 2 1 2 This category includes emissions related to fuel and energy consumed by the reporting company in the 3 reporting year that are not already accounted for in scope 1, scope 2, or the separate memo item for direct 4 CO2 emissions from biomass combustion.4
7
Fuels include both fossil fuels (e.g., petroleum products, natural 5 gas, and coal) and biofuels. 6
Scope 1 includes emissions that occur from the combustion of fuels by sources owned or controlled by the 8 reporting company. Scope 2 includes the emissions that occur from the combustion of fuels to generate 9 electricity, steam, heating and cooling purchased and consumed by the reporting company. This category 10 excludes emissions from the combustion of fuels or electricity consumed by the reporting company, since 11 they are already included in scope 1 or 2. 12 13 This category includes emissions from four distinct activities (see Table 4.5). 14 15 Table 4.5: Activities Included in Category 3 16 17 Activity Applicability A. Extraction, production, and transportation of fuels consumed by the reporting company
Applicable to end users of fuels
B. Extraction, production, and transportation of fuels consumed in the generation of electricity, steam, heating and cooling that is consumed by the reporting company
Applicable to end users of electricity, steam, heating and cooling
C. Generation of electricity, steam, heating, and cooling that is consumed (i.e., lost) in a transmission and distribution (T&D) system (reported by end user)
Applicable to end users of electricity, steam, heating and cooling
D. Generation of electricity, steam, heating, and cooling that is purchased by the reporting company and sold to end users (reported by utility company or energy retailer).
Applicable only to utility companies and energy retailers.
18 19 Box 4.7: Example of Accounting for Emissions from the Sale and Purchase of Electricity 20 The following diagram illustrates an electricity value chain. A coal mining and processing company emits 6 21 tonnes of CO2e per year from its operations and sells coal to a power generator, which generates 100 MWh 22 of electricity and emits 100 tonnes of CO2e per year. A utility that owns and operates a transmission & 23 distribution (T&D) system purchases all of the generator’s electricity. The utility consumes 10 MWh (due to 24 T&D losses) and delivers the remaining 90 MWh to an end user, who consumes 90 MWh. 25
4 See the GHG Protocol Corporate Standard for more information on reporting direct CO2 from biomass combustion separately from the scopes (e.g., page 63).

DRAFT FOR STAKEHOLDER REVIEW – NOVEMBER 2010
26
1 The table below explains how each company accounts for scope 1, scope 2, and scope 3 emissions. In this 2 example, the emission factor of electricity sold by Company B is 1 t CO2e/MWh. All numbers in this example 3 are illustrative only. 4 5 Activity Scope 1 Scope 2 Scope 3 Coal Company (Company A)
5 t CO2e 0 100 t CO2e from the combustion of sold products (i.e, coal). Reported in Category 12 (Use of Sold Products)
Power Generator (Company B)
100 CO2e 0 5 t CO2e from the extraction, production, and transportation of fuels (i.e., coal) consumed by the reporting company Reported in Category 3 (Fuel- and Energy-Related Emissions Not Included in Scope 1 or 2) Note: The generator does not account for scope 3 emissions associated with sold electricity because the emissions are already accounted for in scope 1.
Utility (Company C)
0 10 t CO2e from the generation of electricity purchased and consumed by the reporting company
0.5 t CO2e (5t x 10% of electricity consumed) from the extraction, production, and transportation of fuels (i.e., coal) consumed in the generation of electricity consumed by the reporting company 90 t CO2e from the generation of electricity purchased by the reporting company and sold to end users Reported in Category 3 (Fuel- and Energy-Related Emissions Not Included in Scope 1 or 2)
End Consumer of Electricity (Company E)
0 90 t CO2e from the generation of electricity purchased and consumed by the reporting company
4.5 t CO2e (5t x 90% of electricity consumed) from the extraction, production, and transportation of fuels (i.e., coal) consumed in the generation of electricity consumed by the reporting company 10 t CO2e from the generation of electricity that is consumed (i.e., lost) in a T&D system Reported in Category 3 (Fuel- and Energy-Related Emissions Not Included in Scope 1 or 2)
6 7

DRAFT FOR STAKEHOLDER REVIEW – NOVEMBER 2010
27
4. Transportation & Distribution (Upstream) 1 2 This category includes emissions from the transportation and distribution of products purchased or acquired 3 by the reporting company (in the reporting year) in vehicles and facilities owned or operated by third parties, 4 as well as any other transportation and distribution services purchased by the reporting company (including 5 both inbound and outbound logistics). 6 7 Specifically, this category includes: 8 9
• Third party transportation and distribution between a company’s Tier 1 suppliers and its own 10 operations (including multi-modal shipping where multiple carriers are involved in the delivery of a 11 product); 12
• Third party transportation and distribution between a company’s own facilities, 13 • Third party transportation and distribution between a company’s operations and its customers (only 14
when paid for by the reporting company); and 15 • Any other third party transportation & distribution services contracted by the reporting company 16
(either directly or through an intermediary), including both inbound and outbound logistics. 17 18
Emissions from transportation and distribution may arise from: 19 20
• Air transport 21 • Rail transport 22 • Road transport 23 • Marine transport 24 • Storage of products in warehouses and distribution centers 25 • Storage of products in retail facilities 26
27 Table 4.6: Accounting for Emissions from Transportation & Distribution 28 29 Transportation & Distribution Activity in the Value Chain Accounting Guidance
• Transportation & distribution in vehicles/facilities owned or controlled by the reporting company
Account for emissions that occur during use of vehicles and facilities (e.g., from energy use) in Scope 1 (for fuel use) or Scope 2 (for electricity use).
• Transportation & distribution in vehicles/facilities leased by and operated by the reporting company (and not included in scope 1 or scope 2)
Account for emissions that occur during use in Scope 3, Category 8 (Leased Assets, Upstream)
• Third party transportation & distribution of purchased products, upstream of the reporting company’s Tier 1 suppliers (e.g., transportation between a company’s Tier 2 and Tier 1 suppliers)
Account for emissions that occur during use in Scope 3, Category 1 (Purchased Goods & Services), since emissions are embedded in the cradle-to-gate emissions of purchased products.
• Production of vehicles (e.g., ships, trucks, planes) purchased or acquired by the reporting company.
Account for the upstream (i.e., cradle-to-gate) emissions associated with manufacturing vehicles and facilities in Scope 3, Category 2 (Capital Goods)
• Third party transportation & distribution: o Between a company’s Tier 1 suppliers
and its own operations; o Between a company’s own facilities; and o Between a company and its customers
(paid for by the reporting company) • Any other third party transportation & distribution
services contracted by the reporting company (either directly or through an intermediary), including both inbound and outbound logistics
Account for emissions that occur during use in Scope 3, Category 4 (Transportation & Distribution, Upstream)

DRAFT FOR STAKEHOLDER REVIEW – NOVEMBER 2010
28
• Third party transportation & distribution of sold products between the point of sale and the end consumer (not paid for by the reporting company)
Account for emissions in Scope 3, Category 10 (Transportation & Distribution, Downstream)
1 A reporting company’s scope 3 emissions from transportation & distribution (upstream) are the scope 1 and 2 2 emissions of transportation companies. 3 4 5. Waste Generated in Operations 5 6 This category includes emissions from the third-party disposal/treatment of waste generated in the reporting 7 company’s owned or controlled operations in the reporting year. This category includes emissions from 8 disposal of both solid waste and wastewater and includes all future emissions that result from the quantity of 9 waste generated in the reporting year. Only waste treatment in facilities owned or operated by third parties is 10 included in scope 3. Waste treatment at facilities owned or controlled by the reporting company is accounted 11 for in scope 1. 12 13 Waste treatment methods include: 14 15
• Disposal in a landfill (without flaring or energy recovery) 16 • Disposal in a landfill with flaring 17 • Disposal in a landfill with landfill-gas-to-energy (LFGTE) (i.e., direct combustion of landfill gas to 18
generate electricity) 19 • Recycling 20 • Incineration 21 • Composting 22 • Waste-to-energy (WTE) or energy-from-waste (EfW) (i.e., direct combustion of municipal solid waste 23
(MSW) to generate electricity) 24 • Wastewater treatment 25
26 A reporting company’s scope 3 emissions from waste generated in operations are the scope 1 and 2 27 emissions of waste/wastewater management companies. 28 29 6. Business Travel 30
31 This category includes emissions from the transportation of employees for business-related activities in 32 vehicles owned or operated by third parties, such as aircraft, trains, buses, and passenger cars. 33 34 Emissions from transportation in vehicles owned or controlled by the reporting company are accounted for in 35 either Scope 1 (for fuel use) or Scope 2 (for electricity use). Emissions from leased vehicles operated by the 36 reporting company not included in Scope 1 or Scope 2 are accounted for in the “Leased Assets (Upstream)” 37 category of Scope 3. Emissions from transportation of employees to and from work are accounted for in the 38 “Employee Commuting” category of Scope 3. 39 40 Emissions from business travel may arise from: 41 42
• Air travel 43 • Rail travel 44 • Bus travel 45 • Automobile travel 46 • And other modes of travel 47
48 Companies may optionally include emissions from business travelers staying in hotels. 49 50 A reporting company’s scope 3 emissions from business travel are the scope 1 and 2 emissions of 51 transportation companies (e.g., airlines). 52 53 54

DRAFT FOR STAKEHOLDER REVIEW – NOVEMBER 2010
29
7. Employee Commuting 1 2
This category includes emissions from the transportation of employees5
5
between their homes and their 3 worksites. 4
Emissions from employee commuting may arise from: 6 7
• Automobile travel 8 • Bus travel 9 • Rail travel 10 • Air travel 11 • Other modes of transportation 12
13 Companies may include emissions from teleworking (i.e., employees working remotely) in this category. 14 15 A reporting company’s scope 3 emissions from employee commuting are the scope 1 and 2 emissions of 16 employees. 17 18 8. Leased Assets Not Included in Scope 1 and 2 (Upstream) 19 20 This category includes emissions from the operation of assets that are leased by the reporting company in 21 the reporting year and not already included in scope 1 or scope 2. This category is only applicable to 22 companies that operate leased assets (i.e., lessees). For companies that own and lease assets to others 23 (i.e., lessors), see “Leased Assets (Downstream).” 24 25 Leased assets may be included in a company’s scope 1 or scope 2 inventory depending on the type of lease 26 and the consolidation approach the company uses to define its organizational boundaries (see Section 4.2 27 “Organizational Boundaries and Scope 3 emissions” for more information). If leased assets are not included 28 in the company’s scope 1 or scope 2 inventory, emissions from leased assets are included in either this 29 category or Category 14 (Leased Assets, Downstream). 30 31 See Appendix B for more information on accounting for emissions from leased assets. 32 33 A reporting company’s scope 3 emissions from leased assets (upstream) are the scope 1 and 2 emissions of 34 lessors. 35 36 9. Investments Not Included in Scope 1 and 2 37 38 This category includes emissions associated with the reporting company’s investments in the reporting year, 39 not already included in scope 1 or scope 2. This category is applicable to all sectors, not only companies with 40 operations in the financial services sector (See Box 4.8 for more information on accounting for emissions 41 from investments and services in the financial services sector). Investments include both equity investments 42 and debt investments. 43 44 Investments may be included in a company’s scope 1 or scope 2 inventory depending on how the company 45 defines its organizational boundaries (see Section 4.2 “Organizational Boundaries and Scope 3 emissions” 46 for more information). If investments are not included in the company’s scope 1 or scope 2 emissions, 47 emissions from investments are included in scope 3, under this category. 48 49 This category includes emissions from: 50 51
• Equity investments in subsidiaries (or group companies), where the company has financial control 52 and typically has more than 50% ownership 53
5 “Employees” refers to employees of entities and facilities owned, operated, or leased by the reporting company. Companies may include employees of other relevant entities (e.g., franchises or outsourced operations) in this category, as well as consultants, contractors, and other individuals that are not employees of the company, but commute to facilities owned and operated by the company.

DRAFT FOR STAKEHOLDER REVIEW – NOVEMBER 2010
30
• Equity investments in associate companies (or affiliated companies), where the company has 1 significant influence but not financial control and typically has 20-50% ownership 2
• Equity investments in joint ventures (Non-incorporated joint ventures/partnerships/operations), where 3 partners have joint financial control 4
• Equity investments where the company has neither financial control nor significant influence and 5 typically has less than 20% ownership 6
• Corporate debt holdings, including corporate debt instruments (such as bonds or convertible bonds 7 prior to conversion) or commercial loans 8
• Other debt holdings or financial contracts (for example, securitized products, insurance contracts, 9 credit guarantees, credit default swaps, and other financial contracts) 10
• Project financing 11 12 Emissions from investments should be allocated to the reporting company based on the reporting company’s 13 proportional share of equity or debt investment in the investee. 14 15 Companies with operations in the financial services sector should refer to Box 4.8 to determine whether to 16 account for emissions from investments and services as scope 1, scope 2, or scope 3 (Category 10, 17 Investments) 18 19 A reporting company’s scope 3 emissions from investments are the scope 1 and 2 emissions of investees. 20 21 22

DRAFT FOR STAKEHOLDER REVIEW – NOVEMBER 2010
31
Box 4.8: Accounting for Emissions from Investments & Services in the Financial Services Sector 1 2 For purposes of GHG accounting, this section divides financial investments and services into four types:
• Proprietary investments where the financial institution has financial control or significant influence over the emitting entity;
• Proprietary investments where the financial institution has neither financial control nor significant influence over the emitting entity;
• Project finance; and • Managed investments and client services.
Financial Investment/ Service
Description GHG Accounting Guidance
Proprietary investments (with control or significant influence)
Equity investments made by a financial institution using the financial institution’s own capital and balance sheet, where the financial institution has financial control or significant influence over the emitting entity, including equity investments in: • Subsidiaries (or group companies) • Associate companies (or affiliated companies) • Joint ventures
Companies should account for emissions from proprietary investments in scope 1 and scope 2 (by following the equity share consolidation approach). For investments not included in scope 1 or scope 2, or when using a control consolidation approach: Account for emissions from investments that occur in the reporting year in scope 3, Category 10 (Investments)
Proprietary Investments (without control or significant influence)
Debt financing and equity investments not included in scope 1 or scope 2, including: • Equity investments made by a financial institution
using the financial institution’s own capital and balance sheet, where the financial institution has neither financial control nor significant influence over the emitting entity
• Corporate debt holdings, including corporate debt instruments (such as bonds or convertible bonds prior to conversion) or commercial loans
• Other debt holdings or financial contracts (e.g., securitized products, insurance contracts, credit guarantees, credit default swaps, and other financial contracts), excluding government and retail debt holdings
Account for emissions of the investee or associated asset that occur in the reporting year in scope 3, Category 10 (Investments)
Project Finance
Long term financing of projects (e.g., infrastructure and industrial projects) by equity investors (sponsors) and debt investors (financiers), based on the projected cash flows of the project rather than the balance sheet of the sponsors/lenders.
For initial sponsors or lenders of a project only: Account for the anticipated lifetime emissions of projects initially financed during the reporting year in scope 3, Category 10 (Investments)
Managed investments and client services
Investments managed on behalf of clients (using clients’ capital) or services provided to clients, including: • Investment and asset management (equity or
fixed income funds managed on behalf of clients) • Corporate underwriting and issuance for clients
seeking equity or debt capital • Financial advisory services for clients seeking
assistance with mergers and acquisitions or requesting other advisory services
May optionally account for indirect emissions from managed investments and client services in scope 3, Category 10 (Investments)

DRAFT FOR STAKEHOLDER REVIEW – NOVEMBER 2010
32
10. Transportation & Distribution (Downstream) 1 2 Third-party transportation & distribution of sold products between the point of sale and the end consumer 3 (not paid for by the reporting company), including retail and storage 4 5 This category includes emissions from the transportation and distribution of products sold by the reporting 6 company in the reporting year, between the point of sale and the end consumer in vehicles and facilities 7 owned or operated by third parties, including retail and storage. This category only includes transportation 8 and distribution services that are not contracted by the reporting company, but instead occur beyond the 9 point of sale. This category includes all transportation and distribution related emissions that occur after the 10 reporting company pays to produce and distribute its products. 11 12 Emissions from transportation and distribution (downstream) arise from: 13 14
• Air transport 15 • Rail transport 16 • Road transport 17 • Marine transport 18 • Storage of products in warehouses and distribution centers 19 • Storage of products in retail facilities 20
21 Emissions from transportation and distribution services contracted by the reporting company, including both 22 inbound and outbound logistics, are accounted for in the “Transportation & Distribution (Upstream)” category. 23 Outbound logistics are only included in “Transportation & Distribution (Downstream)” if the reporting 24 company does not pay for outbound logistics. 25 26 See Table 4.6 for guidance on accounting for emissions from transportation and distribution in leased assets 27 or that occur elsewhere in the value chain. 28 29 Companies may opt to include emissions from customers traveling to retail stores in this category. This 30 activity may be significant for companies that own or operate retail facilities. 31 32 A reporting company’s scope 3 emissions from transportation & distribution (downstream) are the scope 1 33 and 2 emissions of transportation companies. 34 35 11. Processing of Sold Intermediate Products 36 37 This category includes emissions from processing of sold intermediate products by third parties (e.g., 38 manufacturers), subsequent to sale by the reporting company. All intermediate products require further 39 processing, transformation, or inclusion in another product before use, and therefore result in emissions from 40 processing subsequent to sale by the reporting company and before use by the end consumer. Emissions 41 from processing should be allocated to the intermediate product. See Chapter 5 for guidance in cases where 42 downstream emissions associated with sold intermediate products are unknown. 43 44 A reporting company’s scope 3 emissions from processing of sold intermediate products are the scope 1 and 45 2 emissions of downstream value chain partners (e.g., manufacturers). 46 47 12. Use of Sold Products 48
49 This category includes emissions from consumer use of goods and services sold by the reporting company 50 in the reporting year. 51 52 This standard divides emissions from the use of sold products into two types: 53 54
• Direct use phase emissions 55 • Indirect use phase emissions 56
57

DRAFT FOR STAKEHOLDER REVIEW – NOVEMBER 2010
33
Direct use phase emissions arise from the following types of products: 1 2
• Products that directly consume energy (fuels or electricity) during use 3 • Fuels and feedstocks 4 • Greenhouse gases and products that contain GHGs that are emitted during use 5
6 Indirect use phase emissions result from products that indirectly consume fuels or electricity during use or 7 otherwise indirectly emit GHGs during use. 8 9 Table 4.7: Emissions from Use of Sold Products 10 11
Type of Emissions Product Type Examples
Direct use phase emissions
1. Products that directly consume energy (fuels or electricity) during use
Automobiles, aircraft, engines, motors, buildings, appliances, electronics, lighting, software
2. Fuels and feedstocks Petroleum products, natural gas, coal, biofuels, crude oil
3. Greenhouse gases and products that contain greenhouse gases that are emitted during use
CO2, CH4, N2O, HFCs, PFCs, SF6, aerosols, refrigerants, industrial gases, fire extinguishers
Indirect use phase emissions
4. Indirectly consumes energy (fuels or electricity) during use
Apparel (requires washing & drying), food (requires cooking & refrigeration), pots & pans (requires heating)
5. Other products that emit GHGs indirectly during use
12 Companies may include emissions associated with maintenance of sold products during use. 13 14 A reporting company’s scope 3 emissions from use of sold products are the scope 1 and 2 emissions of end 15 consumers. 16 17 Time Boundary 18 19 This category includes the total expected lifetime emissions from all relevant products sold in the reporting 20 year. By doing so, the scope 3 inventory accounts for a company’s total GHG impact associated with its 21 activities in the reporting year. 22 23 Product Lifetime and Durability 24 25 Because the Scope 3 inventory accounts for total lifetime emissions of sold products, companies that 26 produce more durable products with longer lifetimes could appear to be penalized because, as product 27 lifetimes increase, scope 3 emissions increase, all else constant. To reduce the potential for emissions data 28 to be misinterpreted, companies should also report relevant information such as product lifetimes and 29 emissions intensity metrics to demonstrate product performance over time. Relevant emissions intensity 30 metrics may include annual emissions per product, energy efficiency per product, emissions per hour of use, 31 emissions per kilometer driven, emissions per functional unit, etc. 32 33 Box 4.9: Example of Product Lifetime Emissions 34 35 Example: An automaker manufactures one million cars in 2010. Each car has an expected lifetime of ten 36 years. In 2011, the company reports the anticipated use phase emissions of the one million cars it produced 37 in 2010 over their ten year expected lifetime. The company also reports corporate average fuel economy (km 38 per liter) and corporate average kg CO2e/km as relevant emissions intensity metrics. 39
40

DRAFT FOR STAKEHOLDER REVIEW – NOVEMBER 2010
34
Box 4.10: Accounting for Avoided Emissions from the Use of Sold Products 1 2 Some companies are tracking not only the emissions that arise from the use of their products, but also the avoided emissions in society that result from the use of their products and solutions compared to other products and solutions. Scope 3 emissions from the use of sold products track only the emissions that occur during use. To reduce these emissions, companies may implement various GHG reduction strategies, such as redesigning products to be more efficient in the use phase or replacing existing product lines with new zero-emitting product lines. These reduction activities can be tracked by comparing a company’s scope 3 emissions inventory over time. A company’s products can also have broader impacts on GHG emissions in society when they provide the same or similar function as existing products in the marketplace but with significantly less GHG emissions. For example, a manufacturer of renewable energy technologies may be interested not only in tracking the emissions and reductions that occur during the use of its products, but also in assessing the reduction in society’s GHG emissions as a result of using renewable energy technologies compared to generating electricity by combusting fossil fuels. Examples of such products and solutions may include:
• Wind turbines or solar panels, compared to fossil fuel power plants • LED bulbs, compared to incandescent bulbs • Triple pane windows, compared to double or single pane windows • Insulation in a building, compared to no insulation • Online meeting software, compared to business travel
Developing new products and solutions that achieve GHG reductions in society compared to other products and solutions is an important component of corporate sustainability strategies and offers significant opportunities for achieving large scale GHG reductions. These reductions are accounted for in scope 3 emissions to the extent that they decrease a company’s emissions from the use of sold products over time, for example by redesigning products or replacing existing product lines with new product lines. Avoided emissions from the use of sold products compared to a baseline are not included in a company’s scope 3 emissions. Accounting for such reductions requires a different accounting methodology6
and poses several accounting challenges to ensuring that reduction claims are accurate and credible.
Challenges include how to: • Determine an appropriate baseline or business-as-usual scenario (e.g., which technologies to
compare against) • Determine the system boundaries (e.g., which emissions to include) • Determine the time period (e.g., how many years to include) • Accurately quantify reductions (e.g., estimate existing and future behavior) • Avoid cherry picking (e.g., account for both emissions increases and decreases across the entire
product portfolio) • Allocate reductions among multiple entities in a value chain (e.g., avoid double counting of
reductions between producers of intermediate goods, producers of final goods, retailers, etc.)
A widely agreed upon methodology for resolving these challenges has not yet been developed. If a company chooses to account for avoided emissions from the use of sold products, avoided emissions are not included in or deducted from the scope 3 inventory, but instead reported separately from scope 1, scope 2, and scope 3 emissions. Companies that report avoided emissions should also report the methodology and data sources used to calculate avoided emissions, the system boundaries, the time period considered, and the baseline (and baseline assumptions) used to make the comparison. 3 4
6 See the GHG Protocol for Project Accounting for information on accounting for GHG reductions from projects (www.ghgprotocol.org).

DRAFT FOR STAKEHOLDER REVIEW – NOVEMBER 2010
35
13. End-of-Life Treatment of Sold Products 1 2 This category includes emissions from the waste disposal/treatment of all products sold by the reporting 3 company (in the reporting year) at the end of their life. 4 5 This category includes the total expected end of life emissions from all products sold in the reporting year. By 6 doing so, the scope 3 inventory accounts for a company’s total GHG impact associated with its activities in 7 the reporting year. 8 9 A reporting company’s scope 3 emissions from end-of-life treatment of sold products are the scope 1 and 2 10 emissions of waste management companies. 11 12 14. Leased Assets (Downstream) 13
14 This category includes emissions from the operation of assets that are owned by the reporting company and 15 leased to other entities in the reporting year, not already included in Scope 1 or Scope 2. This category is 16 applicable to lessors (i.e., companies that receive payments from lessees). Companies that operate leased 17 assets (i.e., lessees) should refer to Category 8 (Leased Assets, Upstream). 18 19 Leased assets may be included in a company’s scope 1 or scope 2 inventory depending on the type of lease 20 and the consolidation approach the company uses to define its organizational boundaries (see Section 4.2 21 “Organizational Boundaries and Scope 3 emissions” for more information). If leased assets are not included 22 in the company’s scope 1 or scope 2 inventory, emissions from leased assets are included in either this 23 category or Category 8 (Leased Assets, Upstream). 24 25 A reporting company’s scope 3 emissions from leased assets (downstream) are the scope 1 and 2 emissions 26 of lessees. 27 28 See Appendix B for more information on accounting for emissions from leased assets. 29 30 15. Franchises (Downstream) 31
32 This category includes emissions from the operation of franchises not included in Scope 1 or Scope 2. A 33 franchise is a business operating under a license to sell or distribute another company’s goods or services 34 within a certain location. This category is applicable to franchisors (i.e., companies that grant licenses to 35 other entities to sell or distribute its goods or services, in return for payments, such as royalties for the use of 36 trademarks and other services). Franchisors should account for the scope 1 and scope 2 emissions from the 37 operation of franchises. 38 39 Franchisees (i.e., companies that operate franchises and pays fees to a franchisor) may optionally report 40 upstream Scope 3 emissions associated with the franchisor’s operations (i.e., the scope 1 and scope 2 41 emissions of the franchisor) in Category 1 (Purchased Goods & Services). 42 43 A reporting company’s scope 3 emissions from franchises (downstream) are the scope 1 and 2 emissions of 44 franchisees. 45 46 4.5 Supplier Emissions 47 48 Scope 3 accounting is focused on tracking the emissions associated with specific activities in the value 49 chain, such as the production of purchased products, transportation of purchased products, and use of sold 50 products. Many companies are also tracking the emissions of specific entities in their value chains. Engaging 51 value chain partners is a critical component of value chain GHG management for multiple purposes, 52 including collecting emissions data, tracking emissions performance, and reducing emissions. Supplier 53 emissions reflect the operational performance of a reporting company’s suppliers, rather than the cradle-to-54 gate emissions of the goods and services the reporting company purchases, which are accounted for in 55 Category 1, and other types of upstream emissions accounted for in Category 2 through Category 9. 56 57 Companies are required to report information about supplier emissions when reporting scope 3 emissions in 58

DRAFT FOR STAKEHOLDER REVIEW – NOVEMBER 2010
36
order to provide additional transparency on steps companies are taking to collect data from suppliers and 1 engage suppliers in GHG management (see Chapter 11, Reporting). Supplier emissions are reported 2 separately from the reporting company’s scope 3 emissions to avoid double counting between supplier 3 emissions and emissions from each of the upstream scope 3 categories (i.e., Category 1 through Category 4 9). 5 6 For purposes of scope 3 reporting, supplier emissions are limited to the scope 1 and 2 emissions of the 7 reporting company’s relevant Tier 1 suppliers. Tier 1 suppliers are companies with which the reporting 8 company has a purchase order for goods or services (e.g., materials, parts, components, etc.). 9 10 Suppliers may include contract manufacturers, materials and parts suppliers, capital equipment suppliers, 11 fuel suppliers, third party logistics providers, waste management companies, and other companies that 12 provide goods and services to the reporting company. Companies should consider tracking supplier 13 emissions from each upstream category in Table 4.3 (i.e., Category 1 through Category 9). 14 15 Chapter 8 “Accounting for Supplier Emissions” provides information on identifying suppliers, collecting data 16 from suppliers, allocating emissions, aggregating emissions, and reporting supplier emissions. 17 18

DRAFT FOR STAKEHOLDER REVIEW – NOVEMBER 2010
37
5. Setting the Boundary 1 2 Requirements in this chapter See Section 5.1 below. 3 Determining which scope 3 emissions to include in the inventory (i.e., setting the boundary) is a critical 4 decision in the inventory process. The GHG Protocol Corporate Standard allows companies flexibility in 5 choosing which, if any, scope 3 activities to include in the GHG inventory. By setting scope 3 boundary 6 requirements, this standard is designed to create additional completeness and consistency in scope 3 7 accounting and reporting. 8 9 5.1. Boundary Requirements 10 11 Companies shall account for and report all scope 3 emissions and disclose and justify any exclusions. 12 13 Companies shall follow the principles of relevance, completeness, accuracy, consistency and transparency 14 when deciding whether to exclude any activities from the scope 3 inventory. 15 16 5.2 Minimum Boundaries for Scope 3 Categories 17 18 See Table 4.3 for a description of the minimum boundaries of each scope 3 category. Companies may 19 include emissions from optional activities in each category. 20 21 5.3 Mapping the Value Chain 22 23 Companies should map the value chain as a first step toward identifying the scope 3 activities that are 24 included in the inventory. This step is an internal exercise to help companies identify scope 3 activities. A 25 process map is not required for reporting externally. To the extent possible, companies should create a 26 complete process map and/or complete list of activities in the company’s value chain that includes: 27 28
• Each of the scope 3 categories and activities included in Table 4.3; 29 • A list of purchased goods and services and a list of sold goods and services; and 30 • A list of suppliers and other relevant value chain partners7
32 (either by name, type, or spend category). 31
Because supply chains are dynamic and a company’s supply chain partners can change frequently 33 throughout the reporting year, companies may find it useful to choose a fixed point in time such as December 34 31 of the reporting year or use a representative average over the course of the reporting year. 35 36 Companies should strive for completeness in mapping the value chain, but it is acknowledged that achieving 37 100% completeness may not be feasible. Companies may establish their own policy for mapping the value 38 chain, which may include creating representative, rather than exhaustive, lists of purchased products, sold 39 products, suppliers, and other value chain partners. 40 41 5.4 Accounting for Downstream Emissions 42 43 The applicability of downstream scope 3 categories depends on whether products sold by the reporting 44 company are final products or intermediate products (see Box 4.5 for descriptions of final and intermediate 45 products). If a company produces an intermediate product (e.g., a motor), which becomes part of a final 46 product (e.g., an automobile), the company accounts for downstream emissions associated with the 47 intermediate product (the motor), not the final product (the automobile). Table 5.2 explains the applicability of 48 downstream scope 3 categories to final and intermediate products sold by the reporting company. 49 50 In certain cases, the eventual end use of sold intermediate products may be unknown. For example, a 51 company may produce an intermediate product with many potential downstream applications, each of which 52 7 Other relevant value chain partners may include contract manufacturers, lessors, lessees, franchisees, etc.

DRAFT FOR STAKEHOLDER REVIEW – NOVEMBER 2010
38
has a different GHG emissions profile, and be unable to reasonably estimate the downstream emissions 1 associated with the various end uses of the intermediate product. If such a case, companies may disclose 2 and justify the exclusion of downstream emissions in the report. Companies may also disclose and justify the 3 exclusion of downstream emissions associated with sold byproducts (see Section 7.5 for more information 4 on byproducts). 5 6 5.5 Disclosing & Justifying Exclusions 7 8 Some categories may not be applicable to all companies. For example, some companies may not have 9 leased assets or franchises. In such cases, companies should simply report zero emissions or “not 10 applicable” for categories that are not applicable. 11 12 In some situations, companies may have scope 3 emissions, but be unable to estimate the emissions due to 13 a lack of data or other limiting factors. Companies are required to follow the principles of relevance, 14 completeness, accuracy, consistency and transparency when deciding whether to exclude any activities from 15 the scope 3 inventory. 16 17 Companies should not exclude any activities from the scope 3 inventory that would compromise the 18 relevance of the reported inventory. Companies should ensure that the scope 3 inventory: 19 20
• Appropriately reflects the GHG emissions of the company, and 21 • Serves the decision-making needs of users, both internal and external to the company. 22
23 To ensure that the scope 3 inventory is relevant, companies should not exclude any activities that contribute 24 significantly to the company’s total anticipated scope 3 emissions (see Section 6.1 for more information) or 25 meet any other criteria for identifying relevant scope 3 activities provided in Table 5.1. 26 27 Companies are required to transparently disclose and justify any exclusions (see Chapter 11, Reporting). 28 29 Table 5.1: Criteria for identifying relevant scope 3 activities 30 31 Criteria Description Size They contribute significantly to the company’s total anticipated scope 3 emissions
(see Section 6.1).
Influence There are potential emissions reductions that could be undertaken or influenced by the company (see Box 5.1)
Risk They contribute to the company’s risk exposure (e.g., climate change related risks such as financial, regulatory, supply chain, product and technology, compliance/litigation, reputational and physical risks)
Stakeholders They are deemed critical by key stakeholders (e.g., customers, suppliers, investors or civil society)
Outsourcing They are outsourced activities previously performed in-house or activities outsourced by the reporting company that are typically performed in-house by other companies in the reporting company’s sector
Other They meet additional criteria developed by the company or industry sector
32 Box 5.1: Influence 33 34 By definition, scope 3 emissions occur from sources that are not owned or controlled by the reporting 35 company, but occur from sources owned and controlled by other entities in the value chain, (e.g., contract 36 manufacturers, materials suppliers, third party logistics providers, waste management suppliers, travel 37 suppliers, lessees and lessors, franchisees, retailers, employees, and customers). Nevertheless, scope 3 38 emissions are influenced by the activities of the reporting company, such that companies often have the 39 ability to influence GHG reductions upstream and downstream of their operations. Companies should 40 prioritize activities in the value chain where the reporting company has the potential to influence GHG 41 reductions. See Table 9.7 (Chapter 9) for illustrative examples of actions to influence scope 3 reductions. 42

DRAFT FOR STAKEHOLDER REVIEW – NOVEMBER 2010
39
Box 5.2: Example of Disclosing & Justifying Exclusions 1 2 After mapping its value chain, a company uses initial GHG estimation methods to estimate the emissions 3 from the various spend categories within Category 1 (Purchased Goods & Services) (see Section 6.1 for 4 information on initial estimation methods). The company finds that emissions from production-related 5 procurement are significant compared to its other sources of scope 3 emissions. The company determines 6 that emissions from non-production-related procurement are difficult to calculate and not expected to 7 contribute significantly to total scope 3 emissions. The company uses more accurate methods to calculate 8 emissions from production-related procurement, but decides to exclude emissions from non-production-9 related procurement. The company discloses and justifies the exclusion of non-production-related 10 procurement based on limited data availability and its insignificant contribution to total scope 3 emissions, 11 based on initial estimates. 12 13 Table 5.2: Applicability of Downstream Scope 3 Categories to Final & Intermediate Products Sold By 14 the Reporting Company 15
16 Scope 3 Category
Applicability to Final Products
Applicability to Intermediate Products
10. Transportation & Distribution of Sold Products
• Transportation and distribution of final
• Transportation and distribution of
products, between the point of sale by the reporting company to the end consumer, including retail and storage
intermediate products, between the point of sale by the reporting company and either: 1) the end consumer (if the eventual end use of the intermediate product is known), or 2) downstream value chain partners (if the eventual end use of the intermediate product is unknown)
11. Processing of Sold Products • Not applicable to final products
• Processing of sold intermediate products by downstream value chain partners (e.g., manufacturers)
12. Use of Sold Products
• The direct use phase emissions of sold final products by the end consumer (i.e., emissions resulting from the use of sold final
• Companies may optionally include the indirect use phase emissions of sold final products (see Table 4.7)
products that directly consume energy (fuel or electricity use) during use, fuels and feedstocks, and GHGs or products that contain GHGs that are released during use)
• The direct use phase emissions of sold intermediate products8 by the end consumer (i.e., emissions resulting from the use of sold intermediate
• Companies may optionally include the indirect use phase emissions of sold intermediate products (see Table 4.7)
products that directly consume energy (fuel or electricity use) during use, fuels and feedstocks, and GHGs or products that contain GHGs that are released during use)
13. End-of-Life Treatment of Sold Products
• Emissions from disposing of sold final
• Emissions from disposing of sold products at the end of
their life intermediate products at the end of their life
14. Leased Assets (Downstream)
• Unrelated to product type: Emissions from assets owned by the reporting company and leased to third parties
15. Franchises • Unrelated to product type: Emissions from franchises operated by third parties
8 In the case of a motor (an intermediate product) that becomes part of an automobile (a final product), the direct use phase emissions of the intermediate product by the end consumer are the emissions resulting from use of the motor, not the emissions resulting from use of the automobile.

DRAFT FOR STAKEHOLDER REVIEW – NOVEMBER 2010
40
6. Collecting Data 1 2 After a company has identified its activities included in the scope 3 boundary, the next step is to collect the 3 necessary data to calculate the company’s scope 3 emissions. 4 5 Overview 6 7 There are two main methods to quantify emissions, each requiring different types of data: 8 9
• Direct measurement; and 10 • Calculation (see Table 6.1). 11
12 Table 6.1: Quantification Methods 13 14
Quantification Method Description Relevant
Data Types
Direct measurement Quantification of GHG emissions using direct monitoring, mass balance or stoichiometry.
Direct emissions data
Calculation
Quantification of GHG emissions by multiplying activity data by an emission factor.
Activity data Emission factors
15 In practice, the calculation approach will be used most often to quantify scope 3 emissions, which requires 16 the use of activity data and emission factors. 17 18 Activity Data 19 20 Activity data is a quantitative measure of a level of activity that results in GHG emissions or removals. 21 Examples of activity data are provided in Table 6.2. 22 23 Table 6.2: Quantification Methods 24 25 Activity Data Type Examples Energy Activity Data Volume of fuel consumed
Kilowatt-hours of electricity consumed
Physical Activity Data
Quantity of material consumed Kilometers of distance traveled Hours of time elapsed Square meters of area occupied Tonnes of waste generated Tonnes of product produced
Financial Activity Data Quantity of money spent 26 Emission Factors 27 28 An emission factor is a factor that converts activity data into GHG emissions data (e.g., kg CO2e emitted per 29 liter of fuel consumed, kg CO2e emitted per kilometer traveled, kg CO2e emitted per tonne of waste 30 generated, etc.). 31
32

DRAFT FOR STAKEHOLDER REVIEW – NOVEMBER 2010
41
Companies should use emission factors that are: 1 2
• Geographically specific (e.g., country-specific for fuels, specific to the regional electric grid for 3 electricity) 4
• Up-to-date, and 5 • Otherwise complete, accurate, consistent, transparent and appropriate for the given activity 6
7 Companies are required to disclose the types of emission factors used to calculate the inventory (see 8 Chapter 11, Reporting). 9 10 Box 6.1: Energy Emission Factors 11 12 Two types of emission factors are used to convert energy activity data into emissions data:
• Combustion emission factors, which include only the emissions that occur from combusting the fuel, and
• Life cycle emission factors, which include not only the emissions that occur from combusting the fuel, but also all other emissions that occur in the life cycle of the fuel such as emissions from extraction, processing and transportation of fuels.
The GHG Protocol Corporate Standard uses combustion emission factors to calculate emissions for scope 1 emissions (in the case of fuels) and scope 2 emissions (in the case of electricity). The GHG Protocol Product Standard uses life cycle emission factors to calculate emissions for both fuels and electricity. Energy Emission Factors in Scope 1 and Scope 2 Accounting Companies should use combustion emission factors to calculate scope 1 and scope 2 emissions. Scope 1 and scope 2 are defined to avoid double counting by two or more companies of the same emission within the same scope. Use of life cycle emission factors to calculate scope 1 or scope 2 emissions is not in conformance with the definitions of scope 1 and scope 2 in the GHG Protocol Corporate Standard (see Box 4.1), results in double counting of scope 1 and 2 emissions between companies, and creates inconsistencies in scope 1 and 2 accounting and reporting. Energy Emission Factors in Scope 3 Accounting Where possible, companies should use life cycle emission factors for fuels and electricity (including biomass/biofuels) to calculate scope 3 emissions from each scope 3 category, except for the following two activities within Category 3 (Fuel- and Energy-Related Activities Not Included in Scope 1 or 2):
• Extraction, production, and transportation of fuels consumed by the reporting company • Extraction, production, and transportation of fuels consumed in the generation of electricity,
steam, heating and cooling that is consumed by the reporting company To calculate scope 3 emissions from the above activities within Category 3, companies should use cradle-to-gate emission factors that exclude emissions from combustion, since emissions from combustion are accounted for in scope 1 (in the case of fuels), in scope 2 (in the case of electricity), and in a separate memo item (in the case of direct CO2 emissions from combustion of biomass/biofuels). Direct CO2 emissions from the combustion of biomass/biofuels from sources owned or controlled by the reporting company are included in the public report, but reported in a separate memo item, separately from the scopes.9
CO2 emissions related to biomass/biofuels that do not occur at sources owned or controlled by the reporting company, but occur elsewhere in the value chain, are included in scope 3.
Companies should disclose the types of emission factors used to calculate the inventory, including whether any emission factors used to calculate the inventory include GHG removals in addition to GHG emissions.
9 See the GHG Protocol Corporate Standard for more information on reporting direct CO2 from biomass combustion separately from the scopes (e.g., page 63).
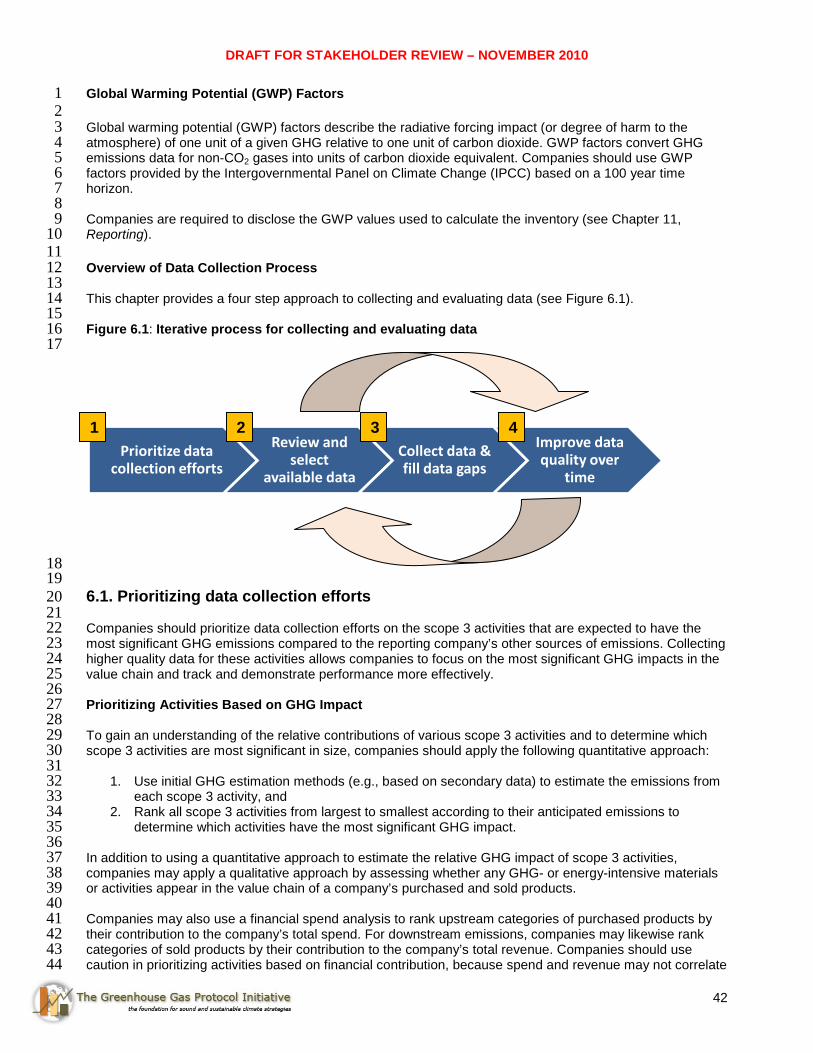
DRAFT FOR STAKEHOLDER REVIEW – NOVEMBER 2010
42
Global Warming Potential (GWP) Factors 1 2 Global warming potential (GWP) factors describe the radiative forcing impact (or degree of harm to the 3 atmosphere) of one unit of a given GHG relative to one unit of carbon dioxide. GWP factors convert GHG 4 emissions data for non-CO2 gases into units of carbon dioxide equivalent. Companies should use GWP 5 factors provided by the Intergovernmental Panel on Climate Change (IPCC) based on a 100 year time 6 horizon. 7 8 Companies are required to disclose the GWP values used to calculate the inventory (see Chapter 11, 9 Reporting). 10 11 Overview of Data Collection Process 12 13 This chapter provides a four step approach to collecting and evaluating data (see Figure 6.1). 14 15 Figure 6.1: Iterative process for collecting and evaluating data 16
17
18 19 6.1. Prioritizing data collection efforts 20 21 Companies should prioritize data collection efforts on the scope 3 activities that are expected to have the 22 most significant GHG emissions compared to the reporting company’s other sources of emissions. Collecting 23 higher quality data for these activities allows companies to focus on the most significant GHG impacts in the 24 value chain and track and demonstrate performance more effectively. 25 26 Prioritizing Activities Based on GHG Impact 27 28 To gain an understanding of the relative contributions of various scope 3 activities and to determine which 29 scope 3 activities are most significant in size, companies should apply the following quantitative approach: 30 31
1. Use initial GHG estimation methods (e.g., based on secondary data) to estimate the emissions from 32 each scope 3 activity, and 33
2. Rank all scope 3 activities from largest to smallest according to their anticipated emissions to 34 determine which activities have the most significant GHG impact. 35
36 In addition to using a quantitative approach to estimate the relative GHG impact of scope 3 activities, 37 companies may apply a qualitative approach by assessing whether any GHG- or energy-intensive materials 38 or activities appear in the value chain of a company’s purchased and sold products. 39 40 Companies may also use a financial spend analysis to rank upstream categories of purchased products by 41 their contribution to the company’s total spend. For downstream emissions, companies may likewise rank 42 categories of sold products by their contribution to the company’s total revenue. Companies should use 43 caution in prioritizing activities based on financial contribution, because spend and revenue may not correlate 44
Prioritize data collection efforts
Review and select
available data
Collect data & fill data gaps
Improve data quality over
time
4 3 2 1

DRAFT FOR STAKEHOLDER REVIEW – NOVEMBER 2010
43
well with emissions. For example, some activities have a high market value, but contribute insignificantly to 1 total emissions. Conversely, some activities have a low market value, but have a significant GHG impact. 2 3 Box 6.2: Example of Prioritizing Emissions from Purchased Goods and Services (Category 1) 4 5 Before collecting data for purchased goods and services, a company estimates the emissions associated with each spend category. In the figure below, a company identifies the seven purchase categories (categories A-G) that collectively account for 80% of total anticipated emissions from purchased products.
6 Prioritizing Activities Based on Other Criteria 7 8 In addition to prioritizing data collection efforts on activities expected to contribute significantly to total scope 9 3 emissions, companies should also consider additional criteria. Companies should prioritize any activities 10 expected to be most relevant for the company or its stakeholders, including activities that: 11 12
• The company has influence over; 13 • Contribute to the company’s risk exposure; 14 • Stakeholders deem critical; 15 • Have been outsourced or are typically performed in-house by other companies in the sector; or 16 • Meet any additional criteria developed by the company or industry sector (see Table 5.1 for more 17
information). 18 19 6.2. Review and select available data 20 21 The quality of the scope 3 inventory depends on the quality of the data used to calculate emissions. After 22 prioritizing the most relevant scope 3 activities, companies should review and assess available data sources. 23 The appropriate level of data quality depends on the company’s business goals. Companies should ensure 24 that the data quality of the scope 3 inventory is sufficient to ensure that the inventory is relevant – both 25 internally and for a company’s stakeholders – and supports effective decision making. 26 27 Data Types 28 29 Companies may use two types of data to calculate scope 3 emissions: 30 31
• Primary data; and 32 • Secondary data (see Table 6.3). 33
34 Table 6.3: Types of Data 35 36 Data Type Description Primary Data Data from specific activities within a company's value chain.
Secondary Data Data that is not from specific activities within a company's value chain. 37
80% 20%
Purchased Goods & Services
I H
G
F
E
D
C
B
A
J K L M N O P Q R S T U V W X Y Z
GHG

DRAFT FOR STAKEHOLDER REVIEW – NOVEMBER 2010
44
Primary data includes specific data provided by suppliers or other companies in the value chain related to the 1 reporting company's activities, including primary activity data and emissions data that is calculated using 2 primary activity data (e.g., primary activity data combined with a secondary emission factor). Primary data 3 does not include financial data (e.g., spend) used to calculate emissions. 4 5 Secondary data includes industry-average data (e.g., from published databases, government statistics, 6 literature studies, and industry associations), financial data, proxy data, and other generic data. In certain 7 cases, companies may use specific data from one activity in the value chain to estimate emissions for 8 another activity in the value chain. This type of data (i.e., proxy data) is considered secondary data, since it is 9 not specific to the activity being calculated. 10 11 Table 6.6 provides examples of primary and secondary data by scope 3 category. 12 13 Primary data and secondary data each have advantages. For example, primary data best enables 14 performance tracking of individual value chain partners and supply chain GHG management, while 15 secondary data can be a useful tool for prioritizing investments in primary data collection and tracking 16 emissions from minor sources (see Table 6.4). Each type of data also supports different GHG management 17 strategies (see Table 6.5). See Table 6.6 for examples of primary data and secondary data by scope 3 18 category. 19 20 Table 6.4: Advantages of Primary Data and Secondary Data 21 22 Data Type Advantages
Primary Data (e.g., supplier data)
• Enables a variety of GHG reduction strategies, including supply chain GHG management and performance tracking of individual value chain partners
• Reflects operational changes from actions taken to reduce emissions at individual facilities and companies (whereas secondary data does not reflect operational changes undertaken by value chain partners)
• Expands GHG transparency and management throughout the supply chain to the companies that have control over emissions
• Allows companies to better track progress toward GHG reduction goals by enabling performance tracking of company- and product-specific improvements (see Chapter 9)
Secondary data (e.g., from databases)
• Allows companies to calculate emissions when primary data is unavailable or of insufficient quality
• Enables estimation of GHG impacts further upstream and downstream of a company’s operations (whereas primary data is difficult to obtain beyond a company’s Tier 1 or Tier 2 suppliers)
• Allows companies to understand the relative magnitude of various scope 3 activities, identify hot spots, and prioritize investments in primary data collection, supplier engagement, and GHG reduction efforts
23 Table 6.5: Data Type and GHG Management 24 25 Data Type Type of GHG Management Supported
Primary Data (e.g., supplier data)
• Improve Supplier/Partner Performance
•
: Allows companies to: 1) distinguish between suppliers and partners in the same sector based on GHG performance; 2) work with suppliers and partners to improve GHG performance (e.g., through energy efficiency improvements), and 3) track the operational efficiency of suppliers and partners over time. Improve Reporting Company Efficiency
• (see description below)
Improve Product Design (see description below)
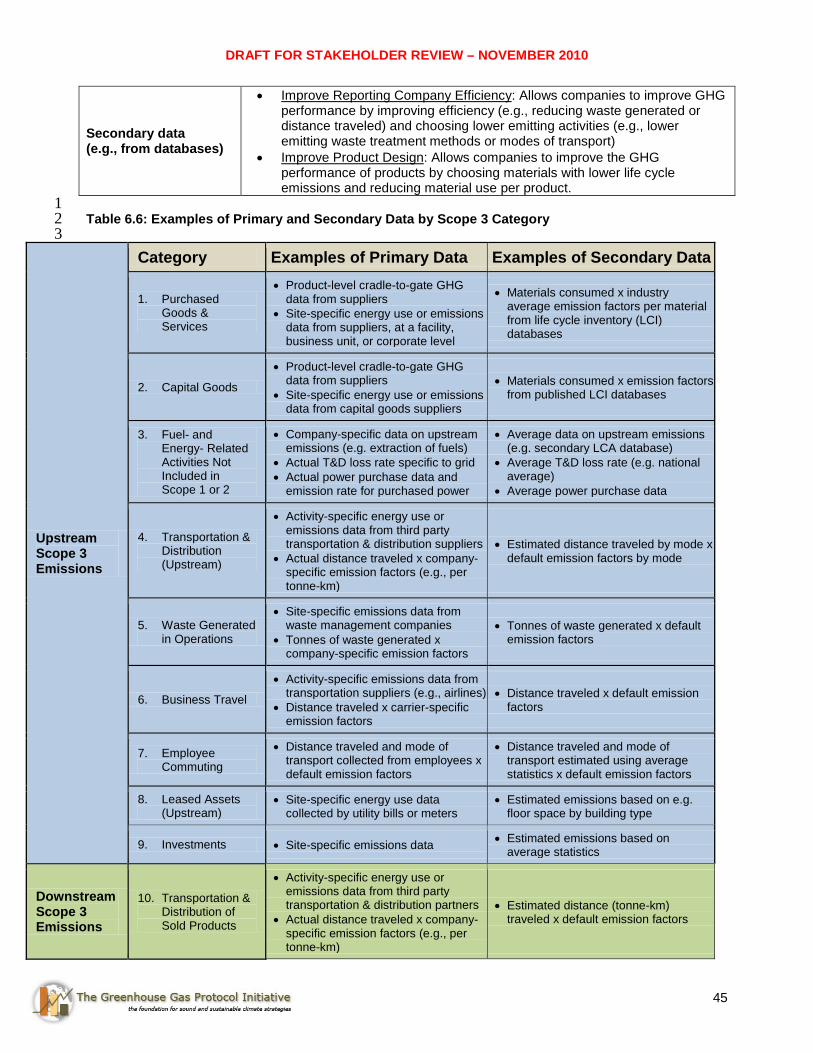
DRAFT FOR STAKEHOLDER REVIEW – NOVEMBER 2010
45
Secondary data (e.g., from databases)
• Improve Reporting Company Efficiency
•
: Allows companies to improve GHG performance by improving efficiency (e.g., reducing waste generated or distance traveled) and choosing lower emitting activities (e.g., lower emitting waste treatment methods or modes of transport) Improve Product Design: Allows companies to improve the GHG performance of products by choosing materials with lower life cycle emissions and reducing material use per product.
1 Table 6.6: Examples of Primary and Secondary Data by Scope 3 Category 2 3
Upstream Scope 3 Emissions
Category Examples of Primary Data Examples of Secondary Data
1. Purchased Goods & Services
• Product-level cradle-to-gate GHG data from suppliers
• Site-specific energy use or emissions data from suppliers, at a facility, business unit, or corporate level
• Materials consumed x industry average emission factors per material from life cycle inventory (LCI) databases
2. Capital Goods
• Product-level cradle-to-gate GHG data from suppliers
• Site-specific energy use or emissions data from capital goods suppliers
• Materials consumed x emission factors from published LCI databases
3. Fuel- and Energy- Related Activities Not Included in Scope 1 or 2
• Company-specific data on upstream emissions (e.g. extraction of fuels)
• Actual T&D loss rate specific to grid • Actual power purchase data and
emission rate for purchased power
• Average data on upstream emissions (e.g. secondary LCA database)
• Average T&D loss rate (e.g. national average)
• Average power purchase data
4. Transportation & Distribution (Upstream)
• Activity-specific energy use or emissions data from third party transportation & distribution suppliers
• Actual distance traveled x company-specific emission factors (e.g., per tonne-km)
• Estimated distance traveled by mode x default emission factors by mode
5. Waste Generated in Operations
• Site-specific emissions data from waste management companies
• Tonnes of waste generated x company-specific emission factors
• Tonnes of waste generated x default emission factors
6. Business Travel
• Activity-specific emissions data from transportation suppliers (e.g., airlines)
• Distance traveled x carrier-specific emission factors
• Distance traveled x default emission factors
7. Employee Commuting
• Distance traveled and mode of transport collected from employees x default emission factors
• Distance traveled and mode of transport estimated using average statistics x default emission factors
8. Leased Assets (Upstream)
• Site-specific energy use data collected by utility bills or meters
• Estimated emissions based on e.g. floor space by building type
9. Investments • Site-specific emissions data • Estimated emissions based on average statistics
Downstream Scope 3 Emissions
10. Transportation & Distribution of Sold Products
• Activity-specific energy use or emissions data from third party transportation & distribution partners
• Actual distance traveled x company-specific emission factors (e.g., per tonne-km)
• Estimated distance (tonne-km) traveled x default emission factors

DRAFT FOR STAKEHOLDER REVIEW – NOVEMBER 2010
46
11. Processing of Sold Products
• Site-specific energy use or emissions from downstream value chain partners
• Estimated energy use based on industry average statistics
12. Use of Sold Products
• Data collected from consumers • Industry/national average statistics on product use
13. End-of-Life Treatment of Sold Products
• Data collected from consumers on disposal rates • Industry/national average statistics on
disposal rates
14. Leased Assets (Downstream)
• Site-specific energy use data collected by utility bills or meters
• Estimated emissions based on e.g. floor space by building type
15. Franchises • Site-specific energy use data collected by utility bills or meters
• Estimated emissions based on e.g. floor space by building type
1 Supplier Emissions Supplier Emissions
• Site-specific scope 1 and scope 2 emissions data from Tier 1 suppliers (see Section 8.2)
• Not applicable (see Section 8.2)
2 3 Select Data Sources 4 5 Selection of data sources depends on business goals. Depending on individual goals, companies may 6 prioritize data collection that best enables: 7 8
• Developing the highest quality scope 3 inventory for internal GHG management and public reporting; 9 • Setting scope 3 reduction goals and tracking performance of scope 3 emissions over time; 10 • Engaging suppliers and enabling supply chain GHG management; or 11 • Achieving other business goals. 12
13 In general, companies should collect high quality, primary data for activities prioritized in Section 6.1. 14 However, companies may find that for a given activity, secondary data is of higher quality than the available 15 primary data. If the company’s primary goal is to maximize the data quality of the scope 3 inventory, the 16 company should select secondary data. If the company’s primary goal is to set reduction targets and track 17 performance from specific operations within the value chain, or to engage suppliers, the company should 18 select primary data. 19 20 Companies should use secondary data for: 21 22
• Activities not prioritized in Section 6.1; 23 • Activities for which primary data is not available (e.g., for downstream activities, for upstream 24
activities beyond a company’s Tier 1 or Tier 2 suppliers where primary data is not likely to be 25 collected, or other cases where a value chain partner is unable to provide data); or 26
• Activities for which the quality of secondary data is higher than primary data (e.g., when a value 27 chain partner is unable to provide data of sufficient quality)10
29 28
Companies are required to report the types of data used to calculate the inventory (see Chapter 11, 30 Reporting). 31 32 Data Quality 33 34 Scope 3 emissions are by definition emissions from activities not under the ownership or control of the 35 reporting entity. Companies are likely to face additional challenges related to data quality and accuracy for 36 scope 3 activities than for activities under the reporting company’s ownership or control. Additional scope 3 37
10 For example, process-specific secondary data may be higher quality than corporate-level primary data received from a supplier.

DRAFT FOR STAKEHOLDER REVIEW – NOVEMBER 2010
47
calculation challenges include reliance on value chain partners to provide data, lesser degree of influence 1 over data collection and management, broader need for secondary data, and broader need for assumptions 2 and modeling (e.g., for downstream emissions). As a result, uncertainty is an inherent aspect of scope 3 3 accounting. 4 5 Higher uncertainty for scope 3 calculations is acceptable as long as the data quality of the inventory is 6 sufficient to support the company’s goals and ensures that the scope 3 inventory is relevant. Companies 7 should collect data of sufficient quality to ensure that the inventory: 8 9
• Appropriately reflects the GHG emissions of the company, and 10 • Serves the decision-making needs of users, both internal and external to the company. 11
12 For example, companies may seek to ensure that data quality is sufficient to understand the relative 13 magnitude of scope 3 activities across the value chain and enable consistent tracking of scope 3 emissions 14 over time. 15 16 To ensure transparency and avoid misinterpretation of data, companies are required to report the methods 17 and data sources used to calculate the inventory (see Chapter 11, Reporting). See Appendix D for more 18 information on uncertainty. 19 20 Data Quality Indicators 21 22 When selecting data sources, companies should use the data quality indicators in Table 6.7 as a guide to 23 obtaining the highest quality data available for a given emissions activity. The data quality indicators describe 24 the representativeness of data (in terms of technology, time, and geography) and the quality of data 25 measurements (i.e., completeness and precision of data). All five data quality indicators should be used to 26 assess primary data, while technological, temporal and geographic representativeness should be used to 27 assess secondary data. Companies should select data that are the most representative in terms of 28 technology, time, and geography; most complete; and most precise. 29 30 Table 6.7: Data Quality Indicators11
32 31
Criteria Description Guidance Technological representativeness
The degree to which the data set reflects the actual technology(ies) used
Companies should select data that is technologically specific.
Temporal representativeness
The degree to which the data set reflects the actual time (e.g., year) or age of the activity
Companies should select data that is temporally specific.
Geographical representativeness
The degree to which the data set reflects the actual geographic location of the activity ( e.g., country or site)
Companies should select data that is geographically specific.
Completeness (for measurements only)
The degree to which the data is statistically representative of the relevant activity. Completeness includes the percentage of locations for which data is available and used out of the total number that relate to a specific activity. Completeness also addresses seasonal and other normal fluctuations in data.
Companies should select data that is the most complete.
Precision (for measurements only)
Measure of the variability of the values used to derive the data from an activity (e.g., low variance = high precision).
Companies should select data that is the most precise.
Companies should determine the most useful method for applying the data quality indicators when selecting 33 data and evaluating data quality. One example of applying the data quality indicators is presented in Box 6.3. 34 35 36
11 Adapted from Weidema and Wesnaes (1996)

DRAFT FOR STAKEHOLDER REVIEW – NOVEMBER 2010
48
Box 6.3: Example of Criteria to Evaluate the Data Quality Indicators12
2 1
A qualitative approach to data quality assessment uses rating descriptions for each of the data quality indicators on direct emissions data, activity data, and emission factors as applicable. This rating system has elements of subjectivity. For example, some fuel emission factors have not changed significantly in many years. Therefore, a fuel emission factor that is over 10 years old, which would be assigned a temporal score of poor with the data quality in the table below, may not be different than a factor less than 6 years old (a temporal rating of good). Companies should consider the individual circumstances of the data when using the data quality results as a basis for collecting new data or evaluating data quality.
Score Representativeness to the activity in terms of:
Technology Time Geography Completeness Precision
Very Good
Data generated using the same technology
Data with less than 3 years of difference
Data from the same area
Data from all relevant sites over an adequate time period to even out normal fluctuations
Data has less than ±5 percent standard deviation
Good
Data generated using a similar by different technology
Data with less than 6 years of difference
Data from a similar area
Data from more than 50 percent of sites for an adequate time period to even out normal fluctuations
Data has less than ±20 percent standard deviation
Fair
Data generated using a different technology
Data with less than 10 years of difference
Data from a different area
Data from less than 50 percent of sites for an adequate time period to even out normal fluctuations OR more than 50 percent of site but for shorter time period
Data has less than ±50 percent standard deviation
Poor
Data where technology is unknown
Data with more than 10 years of difference OR the age of the data are unknown
Data from an area that is unknown
Data from less than 50 percent of sites for shorter time period OR representativeness is unknown
Data has more than ±50 percent standard deviation
3 6.3. Collecting data and filling data gaps 4 5 Collecting data to calculate scope 3 emissions is likely to require wider engagement within the reporting 6 company as well as with suppliers and partners outside of the company than is needed to calculate scope 1 7 and scope 2 emissions. To collect data, companies may need to engage several internal divisions, such as 8 procurement, manufacturing, marketing, research and development, product design, logistics, and 9 accounting. 10 11 To facilitate quality assurance and quality control, companies should develop a data management plan, 12 which documents the GHG inventory process and the internal quality assurance and quality control (QA/QC) 13 procedures in place to enable the preparation of the inventory from its inception through to final reporting. 14 For more information, see Appendix E (Data Management Plan). 15 16 17
12 Adapted from Weidema and Wesnaes (1996)

DRAFT FOR STAKEHOLDER REVIEW – NOVEMBER 2010
49
Collecting Primary Data 1 2 Primary activity data may be obtained through meter readings, purchase records, and utility bills; use of 3 engineering models; direct monitoring, mass balance or stoichiometry; or other methods for obtaining data 4 from specific sources in the company’s value chain. 5 6 When collecting primary data from value chain partners, companies should obtain the most product-specific 7 data available, according to the following hierarchy: 8 9
1. Product-level data 10 2. Process-level data 11 3. Facility-level data 12 4. Business unit-level data 13 5. Corporate-level data 14
15 See Chapter 8 (Accounting for Supplier Emissions) and Appendix C (Guidance for Collecting Data from 16 Suppliers) for guidance on collecting primary data from suppliers. 17 18 Collecting Secondary Data 19 20 When using secondary databases, companies should prioritize databases and publications that are 21 internationally recognized, provided by national governments, or peer-reviewed. A list of available sources of 22 data will be provided on the GHG Protocol website (www.ghgprotocol.org) in early 2011. 23 24 Methods to Fill Data Gaps 25 26 Companies should use the guidance in Section 6.2 to assess the quality of available data. When primary or 27 secondary data of sufficient quality are not available, the following estimation methods may be used to fill 28 data gaps: 29 30
• Use of extrapolated data; and 31 • Use of proxy data (see Table 6.8 and Box 6.4). 32
33 Table 6.8: Estimation Methods to Fill Data Gaps 34 35 Estimation Method Description Examples
Extrapolated Data
Data from a similar process or activity that is used as a stand-in for the given process or activity, and has been customized to be more representative of the given process or activity
There is secondary data available for electricity in Ukraine but not for electricity in Moldova. A company customizes the data for electricity in Ukraine to make it more representative of electricity in Moldova (e.g., by modifying the electricity generation mix).
Proxy Data
Data from a similar process or activity that is used as a stand-in for the given process or activity without being customized to be more representative of the given process or activity
There is secondary data available for electricity in Ukraine but not for electricity in Moldova. A company uses the data for electricity from Ukraine without modification as a proxy for electricity in Moldova.
36 37

DRAFT FOR STAKEHOLDER REVIEW – NOVEMBER 2010
50
Box 6.4: Extrapolated Data and Proxy Data 1 2 Using extrapolated data Extrapolation is the adaptation or customization of an existing dataset to the conditions of the inventory being undertaken. Extrapolating data requires knowledge of both the existing situation and those for the current inventory. Extrapolation is expected to yield more accurate results than the use of proxy data. Extrapolation can vary in the degree of customization applied. For example, adaptation of an existing dataset may be limited to changing the electricity mix to match the country in which an input/product is being manufactured. Alternatively more extensive adaptation may be applied where the key emissions attributes of the product impact are identified (e.g. for a laptop, these may include weight, area of printed circuit board, screen size, hard drive size, etc). An algorithm can subsequently be developed to apportion impacts related to those attributes. Identifying the key emissions attributes and the subsequent algorithm developed should be based on other relevant inventories for similar activities or stakeholder input where inventories do not exist. Using proxy data Proxy data refers to a similar (but not representative) input, process, or activity to the one in the inventory. Where data gaps exist, data relating to ‘similar’ activities can be used as ‘proxy’ or ‘surrogate’ data to fill these gaps. There are two ways to generate proxy data:
• Data transfer, which is the application of data obtained in one situation to a different but similar situation. The key issue is how to define “similar” (e.g., use of GHG emissions data from apple production for pears)
• Data generalization, which is generalizing specific product datasets to more generic product types, (e.g., generalizing apples and oranges data to fruit)
3 6.4. Improve Data Quality Over Time 4 5 Collecting data, assessing data quality, and improving data quality is an iterative process. Companies should 6 first assess data quality when selecting data sources (see Section 6.2), then review the quality of data used 7 in the inventory after data has been collected, using the same data quality assessment approach provided in 8 Section 6.2. In the initial years of scope 3 data collection, companies may need to use data of relatively low 9 quality due to limited data availability. Over time, companies should seek to improve the data quality of the 10 inventory. In particular, companies should prioritize data quality improvement for activities that have: 11 12
• Relatively low data quality (based on the data quality guidance in Section 6.2), and 13 • Relatively high emissions. 14
15 For these priority areas, companies should seek to replace low quality data with higher quality data and use 16 improved methods for data collection and calculation to improve data quality over time. 17 18 Companies are required to provide a description of the accuracy and completeness of reported scope 3 19 emissions data to ensure transparency and avoid misinterpretation of data (see Chapter 11, Reporting). 20 Refer to Chapter 2 for descriptions of accuracy and completeness; Section 6.2 for guidance on describing 21 data quality; and Appendix D for guidance on uncertainty. 22

DRAFT FOR STAKEHOLDER REVIEW – NOVEMBER 2010
51
7 Allocating Emissions 1 2 7.1 Introduction 3 4 Companies may need to allocate emissions when calculating scope 3 emissions, especially when receiving 5 primary data from suppliers or other value chain partners. Likewise, companies may need to allocate 6 emissions when providing primary data to customers that are accounting for their scope 3 emissions. 7 8 Allocation is the process of partitioning GHG emissions from a single facility or other system13
11
among its 9 various outputs. Allocation is necessary when: 10
• A single facility or other system produces multiple outputs, and 12 • Emissions are only measured for the entire facility or system as a whole 13
14 In such a case, emissions from the shared facility or other system need to be allocated to (or divided 15 between) the various outputs (see Figure 7.1). 16 17 Figure 7.1: The Need for Allocation 18 19
20
For example, a single production facility may produce many different products and co-products, while activity 21 data (used to calculate GHG emissions) is measured at the plant as a whole. In this case, the facility’s 22 energy use and emissions need to be allocated to facility’s various outputs. 23 24 Similarly, a company may purchase components from a supplier that manufactures a wide variety of 25 products for many different customers. In this case, the supplier’s activity data or emissions data need to be 26 allocated among the various products so its customers know the emissions attributable to the specific 27 products they buy, based on the fraction of total supplier production that is related to the customer’s 28 purchases. 29 30 Allocation is not typically necessary when using secondary data to calculate scope 3 emissions (e.g., 31 calculating emissions from third party transportation by multiplying distance traveled by an emission factor). 32
When using primary data, allocation is not necessary if: 33
13 In this chapter, the term “system” is used to refer to any source of emissions (e.g., a company, business unit, facility, vehicle, etc.)
DRAFT FOR STAKEHOLDER REVIEW – NOVEMBER 2010
52
• A facility or other system produces only one output; or 1 • Emissions from producing each output are separately measured. 2
3 This chapter provides guidance on allocating emissions from facilities, business units, corporations, vehicles, 4 and other systems – not individual processes. For guidance on allocating emissions from individual 5 processes, see the GHG Protocol Product Standard. 6 7 7.2 Avoid Allocation if Possible 8 9 When using primary data to calculate scope 3 emissions, companies should avoid allocation if possible. 10 Allocation adds uncertainty to the emissions estimates because it assumes that the GHG intensity of multiple 11 products produced by a given facility or system are the same. This assumption is especially inaccurate when 12 the process or facility produces a wide variety of products that differ significantly in their GHG contribution. 13 Therefore, allocation should be used only when more accurate data is not available. 14 Companies should avoid allocation by either: 15 16
• Obtaining product-level GHG data from value chain partners following the GHG Protocol Product 17 Standard;14
• Separately sub-metering energy use and other activity data (e.g., at the production line level); 18
15
• Using engineering models to separately estimate emissions related to each product produced. or 19
16
21 20
7.3 Allocation Methods 22 23 If avoiding allocation is not possible, companies should first determine total facility or system emissions, then 24 determine the most appropriate method for allocating emissions. Either the reporting company or its 25 suppliers can allocate supplier emissions to the reporting company (see Box 7.2). 26 27 This standard does not prescribe the use of any single allocation method due to the wide variety of 28 circumstances companies are likely to encounter when calculating scope 3 emissions. The most appropriate 29 allocation method for a given activity depends on individual circumstances. Companies should select the 30 allocation approach that: 31 32
• Best reflects the causal relationship between the production of the outputs and the resulting 33 emissions; 34
• Results in the most accurate and credible emissions estimates; 35 • Best supports effective decision-making and GHG reduction activities; and 36 • Otherwise adheres to the principles of relevance, accuracy, completeness, consistency and 37
transparency. 38 39 Different allocation methods may yield significantly different results. Companies that have a choice between 40 multiple methods for a given activity should evaluate multiple allocation methods to determine the range of 41 possible results before selecting a single method (i.e., conduct a sensitivity analysis). 42 43 Companies may use a combination of different allocation methods to estimate emissions from the various 44 activities in the scope 3 inventory. However, for each individual facility or system, a single, consistent 45 allocation approach should be used to allocate the emissions from each output of the facility or system. The 46 use of multiple allocation methods for a single system can result in over-counting or under-counting of total 47 emissions from the system. 48 49
14 Product-level data refers to the “cradle-to-gate” GHG emissions of an individual product, including emissions from the very start of the product’s origination (e.g., the extraction of raw material to make the goods) through to delivery to the customer. 15 Separately sub-metering a production line allows a company to read an energy meter first before the line starts and again when the run of a product finishes. Sub-metering yields the quantity of the energy used to a specific product without the need for allocation. 16 Avoiding allocation by subdividing a process is called “process subdivision” in the GHG Protocol Product Standard.

DRAFT FOR STAKEHOLDER REVIEW – NOVEMBER 2010
53
As a general rule, companies should follow the decision tree in Figure 7.2 when selecting an allocation 1 approach. Table 7.1 provides a list of allocation methods. 2 3 Companies are required to disclose and justify all relevant allocation choices in the public report (see 4 Chapter 11, Reporting). Companies should disclose the range of results obtained through sensitivity analysis 5 and the allocation methods used. 6 7 To allocate emissions from a facility or other system, multiply total emissions by the reporting company’s 8 purchases as a fraction of total production (see Box 7.1). 9 10 Box 7.1: Equation for Allocating Emissions 11
12
Where both “Quantity of Products Purchased” and “Total Quantity of Products Produced” are measured in the 13 same units (e.g., mass, volume, market value, or number of products) 14 15 Box 7.2: Two Approaches to Allocating GHG Emissions from Suppliers 16 17 Companies have two basic approaches for collecting and allocating GHG emissions from suppliers:
• Supplier Allocation
: Individual suppliers report pre-allocated emissions data to the reporting company and disclose the allocation metric used.
• Reporting Company Allocation
: The reporting company allocates supplier emissions by obtaining two types of data from individual suppliers: 1) total supplier GHG emissions data (e.g., at the facility or business unit level), and 2) the reporting company’s share of the supplier’s total production, based on either physical factors (e.g., units of production, mass, volume, or other metrics) or economic factors (e.g., revenue, spend)
Reporting company allocation is likely to ensure more accurate and consistent data quality for the reporting company (including consistency and transparency in calculation methods and emission factors), while the supplier allocation approach may be more practical for suppliers by avoiding the need to report confidential business information. 18

DRAFT FOR STAKEHOLDER REVIEW – NOVEMBER 2010
54
Figure 7.2. Decision Tree for Selecting an Allocation Approach 1
2
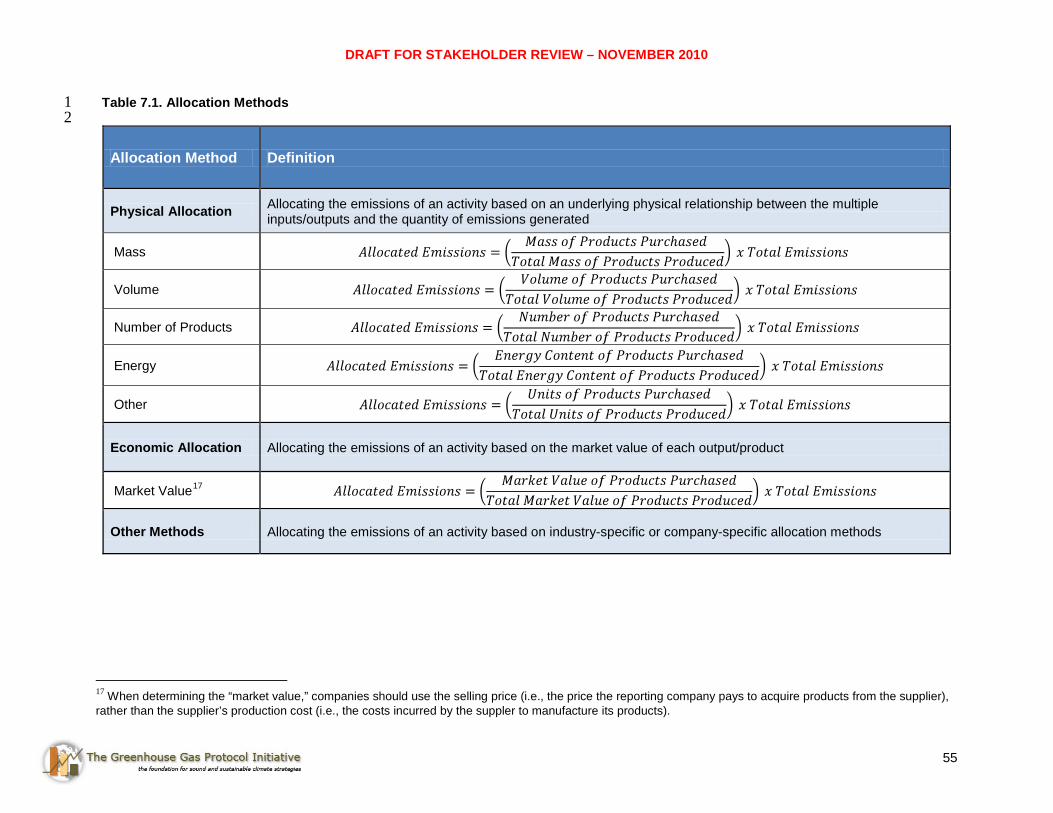
DRAFT FOR STAKEHOLDER REVIEW – NOVEMBER 2010
55
Table 7.1. Allocation Methods 1 2
Allocation Method Definition
Physical Allocation Allocating the emissions of an activity based on an underlying physical relationship between the multiple inputs/outputs and the quantity of emissions generated
Mass
Volume
Number of Products
Energy
Other
Economic Allocation Allocating the emissions of an activity based on the market value of each output/product
Market Value17
Other Methods Allocating the emissions of an activity based on industry-specific or company-specific allocation methods
17 When determining the “market value,” companies should use the selling price (i.e., the price the reporting company pays to acquire products from the supplier), rather than the supplier’s production cost (i.e., the costs incurred by the suppler to manufacture its products).

DRAFT FOR STAKEHOLDER REVIEW – NOVEMBER 2010
56
7.5 Examples of Allocating Emissions 1 2 This section provides examples and guidance for determining the most appropriate allocation method to use 3 for various situations. The most appropriate method for a given activity is the one that best reflects the causal 4 relationship between the production of the product and the resulting emissions, and depends on individual 5 circumstances. Companies should establish a consistent policy for allocating emissions using physical 6 allocation or economic allocation for various activities in the value chain. Table 7.3 provides guidance on 7 choosing allocation methods for each scope 3 category. 8 9 7.5.1. Using Physical Allocation 10 11 Physical allocation is expected to yield more representative emissions estimates in several situations, 12 outlined below. 13 14 Manufacturing 15 16 A manufacturing facility may produce multiple products, which require similar energy and material inputs to 17 produce, but differ significantly in market value (e.g., due to higher brand value of one product than another). 18 While the market value of the products differs, the physical quantity of emissions resulting from the 19 production of each product is similar. 20 21 In such a case, physical factors are more closely correlated with emissions and better approximate actual 22 emissions associated with producing each product. Companies should select the physical factor that most 23 closely correlates to emissions, which may include units of production, mass, volume, energy, or other 24 metrics. Companies should consider multiple physical factors when selecting the factor that is most 25 appropriate. 26 27
Case study to be provided 28 29 Transportation 30 31 Allocating emissions from the transportation of cargo (or freight) occurs when: 32 33
• A single vehicle (e.g., ship, aircraft, train, or truck) transports multiple products, 34 • Activity data is collected at the vehicle level, and 35 • A company chooses to estimate emissions by allocating total vehicle emissions to one or more of 36
the products shipped. 37 38
Companies should allocate emissions using physical allocation, since physical factors are expected to best 39 reflect the causal relationship between the transportation of products and the resulting emissions. 40 Companies should allocate using either mass/weight or volume, depending on whether the capacity of the 41 vehicle is limited by mass/weight or volume. The limiting factor differs by mode of transportation (road, rail, 42 air, or marine transport). For example, ocean going vessels tend to be limited by volume, while trucks tend to 43 be limited by weight. 44 45 Box 7.3: Equation for Allocating Emissions from a Vehicle Using Volume 46
Companies may also calculate emissions without allocating emissions by using secondary data (e.g., 47 industry average emission factors based on tonne-km traveled). 48 49
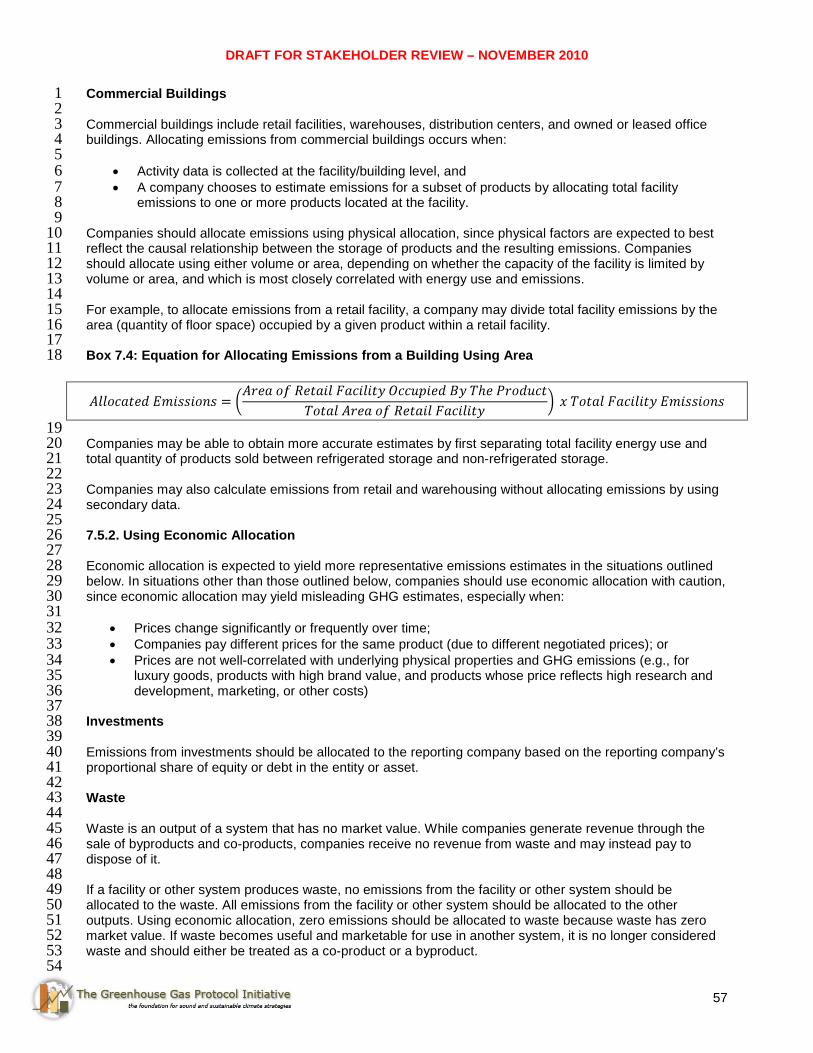
DRAFT FOR STAKEHOLDER REVIEW – NOVEMBER 2010
57
Commercial Buildings 1 2 Commercial buildings include retail facilities, warehouses, distribution centers, and owned or leased office 3 buildings. Allocating emissions from commercial buildings occurs when: 4 5
• Activity data is collected at the facility/building level, and 6 • A company chooses to estimate emissions for a subset of products by allocating total facility 7
emissions to one or more products located at the facility. 8 9
Companies should allocate emissions using physical allocation, since physical factors are expected to best 10 reflect the causal relationship between the storage of products and the resulting emissions. Companies 11 should allocate using either volume or area, depending on whether the capacity of the facility is limited by 12 volume or area, and which is most closely correlated with energy use and emissions. 13 14 For example, to allocate emissions from a retail facility, a company may divide total facility emissions by the 15 area (quantity of floor space) occupied by a given product within a retail facility. 16 17 Box 7.4: Equation for Allocating Emissions from a Building Using Area 18
19 Companies may be able to obtain more accurate estimates by first separating total facility energy use and 20 total quantity of products sold between refrigerated storage and non-refrigerated storage. 21 22 Companies may also calculate emissions from retail and warehousing without allocating emissions by using 23 secondary data. 24 25 7.5.2. Using Economic Allocation 26 27 Economic allocation is expected to yield more representative emissions estimates in the situations outlined 28 below. In situations other than those outlined below, companies should use economic allocation with caution, 29 since economic allocation may yield misleading GHG estimates, especially when: 30 31
• Prices change significantly or frequently over time; 32 • Companies pay different prices for the same product (due to different negotiated prices); or 33 • Prices are not well-correlated with underlying physical properties and GHG emissions (e.g., for 34
luxury goods, products with high brand value, and products whose price reflects high research and 35 development, marketing, or other costs) 36
37 Investments 38 39 Emissions from investments should be allocated to the reporting company based on the reporting company’s 40 proportional share of equity or debt in the entity or asset. 41 42 Waste 43 44 Waste is an output of a system that has no market value. While companies generate revenue through the 45 sale of byproducts and co-products, companies receive no revenue from waste and may instead pay to 46 dispose of it. 47 48 If a facility or other system produces waste, no emissions from the facility or other system should be 49 allocated to the waste. All emissions from the facility or other system should be allocated to the other 50 outputs. Using economic allocation, zero emissions should be allocated to waste because waste has zero 51 market value. If waste becomes useful and marketable for use in another system, it is no longer considered 52 waste and should either be treated as a co-product or a byproduct. 53 54

DRAFT FOR STAKEHOLDER REVIEW – NOVEMBER 2010
58
Emissions from waste generated in the reporting company’s operations are accounted for in “Category 5: 1 Waste Generated in Operations”. Emissions from waste treatment in this category should not be allocated, 2 unless primary data is collected from a waste treatment facility and partitioned amongst the various 3 companies that generated the waste. 4 5 Emissions from the end-of-life treatment of sold products are accounted for in “Category 13: End-of-Life 6 Treatment of Sold Products,” and are not expected to require allocation. 7
For guidance on allocating emissions from recycling or energy recovery (e.g., waste-to-energy or landfill gas 8 to energy), refer to the GHG Protocol Product Standard. 9
Byproducts 10
A byproduct is an incidental output from a process with a minor market value, rather than the primary product 11 being produced or a co-product (see Table 7.2). Production of certain products naturally results in 12 byproducts. 13
In such cases, economic allocation may best reflect the causal relationship between the production of the 14 outputs and the resulting emissions. By allocating emissions based on the relative market values of the 15 outputs, economic allocation allocates more emissions to the primary product and fewer emissions to 16 byproducts, which more closely reflects the primary motivation for production (since byproducts are 17 incidental outputs). 18
If economic allocation is used to allocate emissions for a byproduct of a system, economic allocation should 19 also be used to allocate emissions to all other outputs of the system. The use of multiple allocation methods 20 for a single system can result in over-counting or under-counting of total emissions. 21
For purposes of allocating emissions, companies should establish a consistent policy for determining 22 whether an output is a byproduct or a co-product (e.g., based on their relative market value). 23
Case study to be provided 24 25 Table 7.2. Co-products, Byproducts and Waste 26 27 Output Type Description Co-Product An output of a system with a significant market value in another system.
Byproduct An incidental output from a process with a minor market value, rather than the primary product being produced or a co-product.
Waste An output of a process that has no market value. 28
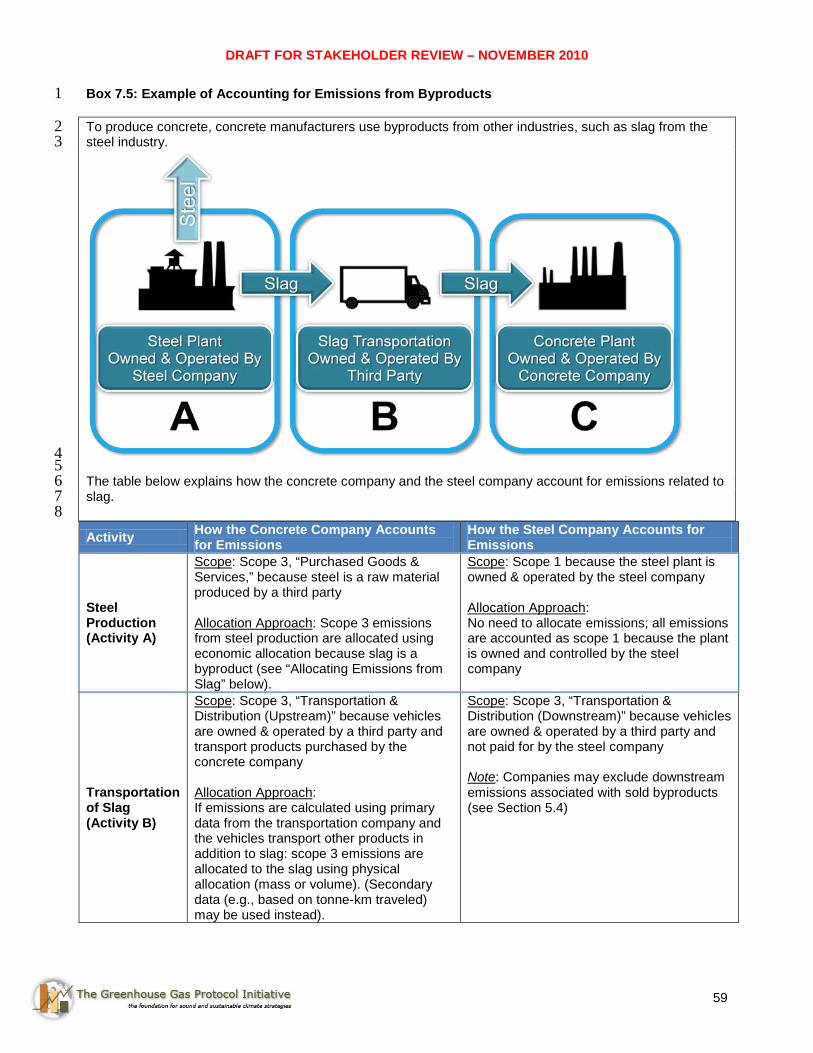
DRAFT FOR STAKEHOLDER REVIEW – NOVEMBER 2010
59
Box 7.5: Example of Accounting for Emissions from Byproducts 1
To produce concrete, concrete manufacturers use byproducts from other industries, such as slag from the 2 steel industry. 3
4 5 The table below explains how the concrete company and the steel company account for emissions related to 6 slag. 7 8 Activity How the Concrete Company Accounts
for Emissions How the Steel Company Accounts for Emissions
Steel Production (Activity A)
Scope
: Scope 3, “Purchased Goods & Services,” because steel is a raw material produced by a third party
Allocation Approach: Scope 3 emissions from steel production are allocated using economic allocation because slag is a byproduct (see “Allocating Emissions from Slag” below).
Scope
: Scope 1 because the steel plant is owned & operated by the steel company
Allocation ApproachNo need to allocate emissions; all emissions are accounted as scope 1 because the plant is owned and controlled by the steel company
:
Transportation of Slag (Activity B)
Scope
: Scope 3, “Transportation & Distribution (Upstream)” because vehicles are owned & operated by a third party and transport products purchased by the concrete company
Allocation ApproachIf emissions are calculated using primary data from the transportation company and the vehicles transport other products in addition to slag: scope 3 emissions are allocated to the slag using physical allocation (mass or volume). (Secondary data (e.g., based on tonne-km traveled) may be used instead).
:
Scope
: Scope 3, “Transportation & Distribution (Downstream)” because vehicles are owned & operated by a third party and not paid for by the steel company
Note: Companies may exclude downstream emissions associated with sold byproducts (see Section 5.4)

DRAFT FOR STAKEHOLDER REVIEW – NOVEMBER 2010
60
Concrete Production (Activity C)
Scope
: Scope 1 because the concrete plant is owned & operated by the concrete company
Allocation ApproachNo need to allocate emissions; all emissions are accounted as scope 1 because the plant is owned and controlled by the concrete company
:
Scope
: Scope 3, “Processing of Sold Products,” because it is an intermediate product sold by the steel company
Note: Companies may exclude downstream emissions associated with sold byproducts (see Section 5.4)
1 Allocating Emissions from Slag 2 3 Allocating emissions from the steel plant depends on whether slag is a waste product, byproduct, or co-4 product of steel production. The table below explains how to account for the emissions from Activity A in 5 each scenario. A single allocation approach should be applied to all outputs from Activity A. The example 6 assumes that steel and slag are the only two outputs of Activity A. In each case, 100% of the emissions from 7 Activity A are accounted for between the two outputs to avoid undercounting or over-counting of emissions. 8 9 Scenario Allocation Approach If slag is waste (i.e., slag has no market value and the concrete manufacturer receives the slag at no cost)
Zero emissions are allocated to slag because slag is a waste product. 100% of emissions from Activity A are allocated to the steel.
If slag is a byproduct (i.e., slag has a minor market value)
Economic allocation is used to allocate emissions from Activity A. In this example, assume that slag accounts for 1% of the total market value of all outputs from Activity A and steel accounts for 99%. 99% of emissions from Activity A are allocated to the steel and 1% of emissions from Activity A are allocated to the slag. Together, emissions allocated to the two outputs account for 100% of emissions from Activity A (99% + 1% = 100%).
If slag is a co-product (i.e., slag has a substantial market value)
Physical allocation is used to allocate emissions from Activity A. In this example, assume that slag accounts for 10% of the total mass of all outputs from Activity A and steel accounts for 90%. 90% of emissions from Activity A are allocated to the steel. 10% of emissions from Activity A are allocated to the slag. Together, emissions allocated to the two outputs account for 100% of emissions from Activity A (90% + 10% = 100%).
10 11 12 13
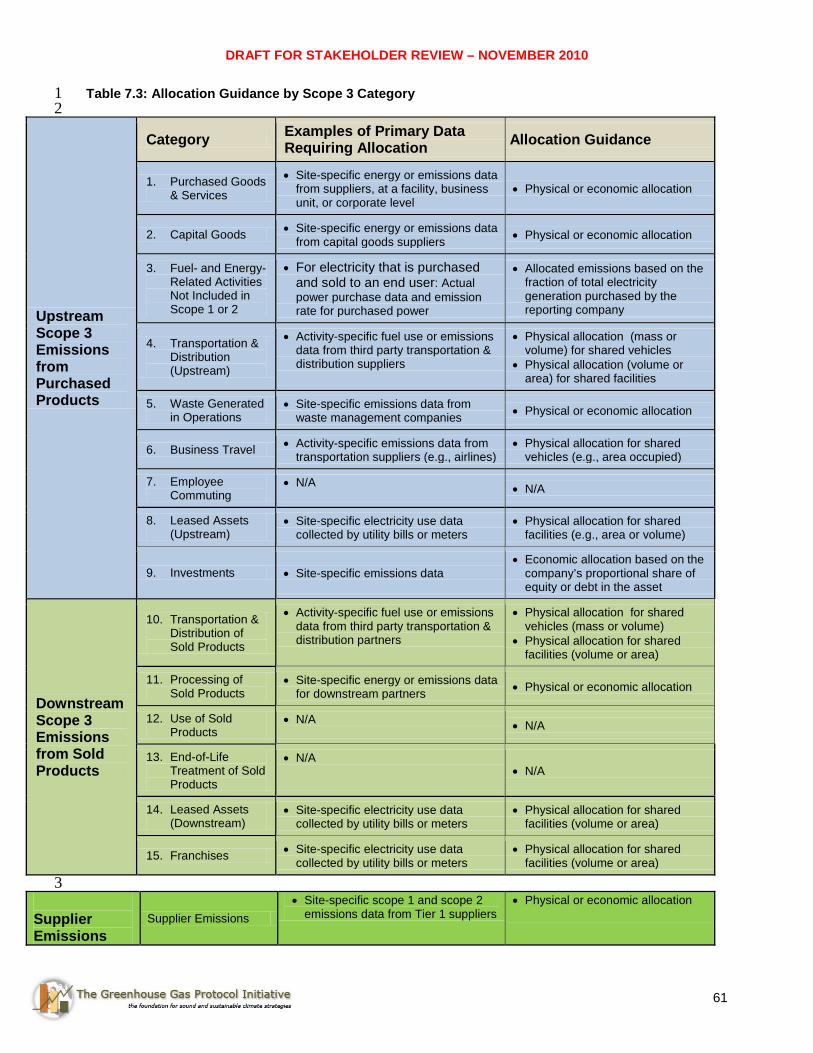
DRAFT FOR STAKEHOLDER REVIEW – NOVEMBER 2010
61
Table 7.3: Allocation Guidance by Scope 3 Category 1 2
Upstream Scope 3 Emissions from Purchased Products
Category Examples of Primary Data Requiring Allocation Allocation Guidance
1. Purchased Goods & Services
• Site-specific energy or emissions data from suppliers, at a facility, business unit, or corporate level
• Physical or economic allocation
2. Capital Goods • Site-specific energy or emissions data from capital goods suppliers • Physical or economic allocation
3. Fuel- and Energy- Related Activities Not Included in Scope 1 or 2
• For electricity that is purchased and sold to an end user: Actual power purchase data and emission rate for purchased power
• Allocated emissions based on the fraction of total electricity generation purchased by the reporting company
4. Transportation & Distribution (Upstream)
• Activity-specific fuel use or emissions data from third party transportation & distribution suppliers
• Physical allocation (mass or volume) for shared vehicles
• Physical allocation (volume or area) for shared facilities
5. Waste Generated in Operations
• Site-specific emissions data from waste management companies • Physical or economic allocation
6. Business Travel • Activity-specific emissions data from transportation suppliers (e.g., airlines)
• Physical allocation for shared vehicles (e.g., area occupied)
7. Employee Commuting
• N/A • N/A
8. Leased Assets (Upstream)
• Site-specific electricity use data collected by utility bills or meters
• Physical allocation for shared facilities (e.g., area or volume)
9. Investments • Site-specific emissions data • Economic allocation based on the
company’s proportional share of equity or debt in the asset
Downstream Scope 3 Emissions from Sold Products
10. Transportation & Distribution of Sold Products
• Activity-specific fuel use or emissions data from third party transportation & distribution partners
• Physical allocation for shared vehicles (mass or volume)
• Physical allocation for shared facilities (volume or area)
11. Processing of Sold Products
• Site-specific energy or emissions data for downstream partners • Physical or economic allocation
12. Use of Sold Products
• N/A • N/A
13. End-of-Life Treatment of Sold Products
• N/A • N/A
14. Leased Assets (Downstream)
• Site-specific electricity use data collected by utility bills or meters
• Physical allocation for shared facilities (volume or area)
15. Franchises • Site-specific electricity use data collected by utility bills or meters
• Physical allocation for shared facilities (volume or area)
3 Supplier Emissions
Supplier Emissions • Site-specific scope 1 and scope 2
emissions data from Tier 1 suppliers • Physical or economic allocation

DRAFT FOR STAKEHOLDER REVIEW – NOVEMBER 2010
62
8 Accounting for Supplier Emissions 1 2 Scope 3 accounting is focused on tracking the emissions associated with specific activities in the value 3 chain, such as the production of purchased products, transportation of purchased products, and use of sold 4 products. Many companies are also tracking the emissions of specific entities in their value chains. Engaging 5 value chain partners is a critical component of value chain GHG management for multiple purposes, 6 including collecting emissions data, tracking emissions performance, and reducing emissions. Supplier 7 emissions reflect the operational performance of a reporting company’s suppliers, rather than the cradle-to-8 gate emissions of the goods and services the reporting company purchases, which are accounted for in 9 Category 1, and other types of upstream emissions accounted for in Category 2 through Category 9. 10 11 Companies are required to report information about supplier emissions when reporting scope 3 emissions in 12 order to provide additional transparency on steps companies are taking to collect data from suppliers and 13 engage suppliers in GHG management (see Chapter 11, Reporting). Supplier emissions are reported 14 separately from the reporting company’s scope 3 emissions to avoid double counting between supplier 15 emissions and emissions from each of the upstream scope 3 categories (i.e., Category 1 through Category 16 9). 17 18 For purposes of scope 3 reporting, supplier emissions are limited to the scope 1 and 2 emissions of the 19 reporting company’s relevant Tier 1 suppliers. Tier 1 suppliers are companies with which the reporting 20 company has a purchase order for goods or services (e.g., materials, parts, components, etc.). Tier 2 21 suppliers are companies with which Tier 1 suppliers have a purchase order for goods and services (see 22 Figure 8.1). 23 24 Suppliers may include contract manufacturers, materials and parts suppliers, capital equipment suppliers, 25 fuel suppliers, third party logistics providers, waste management companies, and other companies that 26 provide goods and services to the reporting company. Companies should consider tracking supplier 27 emissions from each upstream category in Table 4.3 (i.e., Category 1 through Category 9). 28 29 To account for and report supplier emissions, companies should follow these steps: 30 31
1. Identify and select relevant Tier 1 suppliers 32 2. Collect emissions data from suppliers 33 3. Allocate supplier emissions to the reporting company 34 4. Aggregate emissions data across all Tier 1 suppliers 35 5. Report supplier emissions 36
Figure 8.1: Tier 1 Suppliers in a Supply Chain 37 38
39 40
Reporting Company
Tier 1 Supplier
Tier 2 Supplier
Tier 2 Supplier
Tier 1 Supplier
Tier 2 Supplier
Tier 1 Supplier
Tier 2 Supplier
Tier 2 Supplier
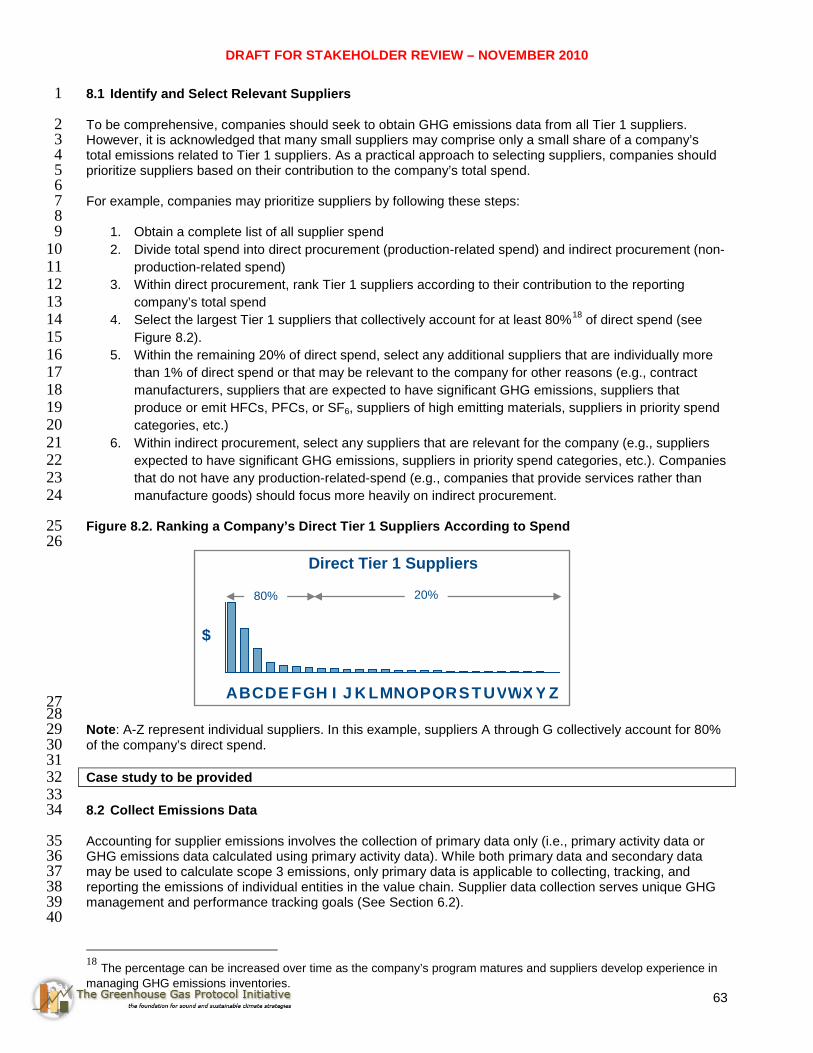
DRAFT FOR STAKEHOLDER REVIEW – NOVEMBER 2010
63
8.1 Identify and Select Relevant Suppliers 1
To be comprehensive, companies should seek to obtain GHG emissions data from all Tier 1 suppliers. 2 However, it is acknowledged that many small suppliers may comprise only a small share of a company’s 3 total emissions related to Tier 1 suppliers. As a practical approach to selecting suppliers, companies should 4 prioritize suppliers based on their contribution to the company’s total spend. 5 6 For example, companies may prioritize suppliers by following these steps: 7 8
1. Obtain a complete list of all supplier spend 9 2. Divide total spend into direct procurement (production-related spend) and indirect procurement (non-10
production-related spend) 11 3. Within direct procurement, rank Tier 1 suppliers according to their contribution to the reporting 12
company’s total spend 13 4. Select the largest Tier 1 suppliers that collectively account for at least 80%18
5. Within the remaining 20% of direct spend, select any additional suppliers that are individually more 16 than 1% of direct spend or that may be relevant to the company for other reasons (e.g., contract 17 manufacturers, suppliers that are expected to have significant GHG emissions, suppliers that 18 produce or emit HFCs, PFCs, or SF6, suppliers of high emitting materials, suppliers in priority spend 19 categories, etc.) 20
of direct spend (see 14 Figure 8.2). 15
6. Within indirect procurement, select any suppliers that are relevant for the company (e.g., suppliers 21 expected to have significant GHG emissions, suppliers in priority spend categories, etc.). Companies 22 that do not have any production-related-spend (e.g., companies that provide services rather than 23 manufacture goods) should focus more heavily on indirect procurement. 24
Figure 8.2. Ranking a Company’s Direct Tier 1 Suppliers According to Spend 25 26
27 28 Note: A-Z represent individual suppliers. In this example, suppliers A through G collectively account for 80% 29 of the company’s direct spend. 30 31 Case study to be provided 32 33 8.2 Collect Emissions Data 34
Accounting for supplier emissions involves the collection of primary data only (i.e., primary activity data or 35 GHG emissions data calculated using primary activity data). While both primary data and secondary data 36 may be used to calculate scope 3 emissions, only primary data is applicable to collecting, tracking, and 37 reporting the emissions of individual entities in the value chain. Supplier data collection serves unique GHG 38 management and performance tracking goals (See Section 6.2). 39 40
18 The percentage can be increased over time as the company’s program matures and suppliers develop experience in managing GHG emissions inventories.
80% 20%
Direct Tier 1 Suppliers
$
I H
G
F
E
D
C
B
A
J K L M N O P Q R S T U V W X Y Z

DRAFT FOR STAKEHOLDER REVIEW – NOVEMBER 2010
64
Company should determine the type and level of data to request from suppliers. 1 2 Type of Data 3 4 Companies should send questionnaires to each supplier selected in Step 1 requesting: 5 6
• Scope 1 and scope 2 emissions data19 for the reporting year,20
• A description of the methodologies used to quantify and allocate emissions data and a description of 9 the data sources used (including emission factors and GWP factors)
following the GHG Protocol 7 Corporate Standard 8
21
Companies may also ask suppliers for scope 3 emissions data following the GHG Protocol Scope 3 11 Standard and/or product life cycle GHG emissions data following the GHG Protocol Product Standard. 12
10
13 Level of Data 14 15 Activity data and emissions data may be collected at varying levels of detail and granularity (see Table 8.1). 16 In general, companies should seek activity data or emissions data from suppliers that is as specific as 17 possible to the product purchased from the supplier, following the hierarchy in Table 8.1. For example, if 18 process level data is not available, suppliers should try to provide data at the facility level. If facility level data 19 is not available, suppliers should try to provide data at the business unit level, and so on. 20 21 Collecting more granular data is especially important from diversified suppliers that produce a wide variety of 22 products (see Box 8.1). 23 24 Table 8.1: Levels of Data (Ranked In Order of Specificity) 25 26 Data Type Description
1. Process or Production Line Level Data
GHG emissions and/or activity data for the processes or production lines that produce the product of interest
2. Facility Level Data GHG emissions and/or activity data for the facilities or operations that produce the product of interest
3. Business Unit Level Data GHG emissions and/or activity data for the business units that produce the product of interest
4. Corporate Level Data GHG emissions and/or activity data for the entire corporation
27 28 29
19 Scope 1 and scope 2 emissions data should include emissions of CO2, CH4, N2O, HFCs, PFCs, and SF6, and may be aggregated to units of carbon dioxide equivalent rather than separately reported by individual greenhouse gas. 20 Some suppliers may collect data on a fiscal year basis, while others collect data on a calendar year basis. To the extent possible, reporting companies should collect or adjust data to reflect a consistent 12-month period. 21 To the extent possible, companies should encourage consistent accounting and calculation of emissions using consistent sources of emission factors and GWP factors.

DRAFT FOR STAKEHOLDER REVIEW – NOVEMBER 2010
65
Box 8.1: Level of Data and Supplier Type 1 2 The need to collect granular data from a supplier depends in part on the variety and diversity of products the supplier produces. Collecting data at the facility or business unit level is more important for diversified companies than for relatively homogenous companies. Below are two examples: A) a homogenous supplier with relatively uniform emissions throughout its operations, and B) a diversified supplier where GHG intensity varies widely between business units and facilities.
Key: The reporting company purchases the same type of professional services from both suppliers. The reporting company needs to decide whether collecting corporate level emissions from the suppliers will accurately reflect emissions related to the purchased product. For Supplier A, the reporting company decides to use corporate level data to estimate emissions from the purchased service, because the supplier only produces professional services, each of which has a similar GHG intensity. For Supplier B, however, the reporting company decides not to use corporate level emissions data, because the company is diversified and has business units in both professional services and manufacturing, which have widely different GHG intensities. As a result, using corporate level data would not accurately reflect emissions from the purchased service. 3 See Appendix C (Guidance for Collecting Data from Suppliers) for more information. 4 5 Quality of Data 6 7 The quality of supplier data may vary widely and be difficult to determine. Companies should assess the 8 accuracy and completeness of supplier data and request that suppliers provide supporting documentation to 9 explain their methodology and data sources used (see Chapter 6 for guidance on assessing data quality). 10 Companies may consider first-party or third-party assurance of supplier data to ensure the accuracy and 11 completeness of reported data. 12 13 See Table 8.2 for a list of challenges and guidance for collecting primary data from suppliers. 14
A. Homogenous Supplier B. Diversified Supplier
Corporation
Business Unit A: Professional Services
Facility A: Office Bldg
Business Unit B: Professional Services
Facility B: Office Bldg
Facility C: Office Bldg
Corporation
Business Unit A: Professional Services
Facility A: Office Bldg
Business Unit B: Manufacturing
Facility B: Office Bldg
Facility C: Manufacturing
Intermediate Emissions
Low Emissions
High Emissions

DRAFT FOR STAKEHOLDER REVIEW – NOVEMBER 2010
66
Table 8.2: Challenges and Guidance for Collecting Primary Data from Value Chain Partners 1 2
Challenges Guidance Large number of suppliers
• Target most relevant suppliers based on spend and/or anticipated emissions impact
• Target suppliers where the reporting company has an existing relationship and a higher degree of influence (e.g., contract manufacturers or suppliers where the reporting company accounts for a significant share of the supplier’s total sales)
Lack of supplier knowledge and experience with GHG inventories and accounting
• Target suppliers with prior experience with GHG inventories • Identify the correct subject matter expert contact at the company • Explain the business value of investing in GHG data collection • Request data suppliers already have collected, such as energy use data,
rather than emissions data • Provide clear instructions and guidance with the data request • Provide training, support, and follow-up
Lack of supplier capacity and resources
• Make the data request as simple as possible • Use a simple, user-friendly, standardized data template/questionnaire • Provide a clear list of data required and where to find data (e.g., utility bills) • Use an automated online data collection system to streamline data entry • Consider use of a third party database to collect data • Coordinate GHG data request with other requests • Follow up with suppliers
Lack of transparency in the quality of supplier data
• Request documentation on methodology and data sources used, inclusions, exclusions, assumptions, etc.
• Minimize errors by requesting activity data (e.g., kWh electricity used, kg of fuels used) and calculating GHG emissions separately
• Consider third-party assurance Confidentiality concerns of suppliers
• Protect suppliers’ confidential/proprietary information (e.g., through nondisclosure agreements, firewalls, etc.)
• Assure suppliers that data will not be misused • Ask supplier to obtain third-party assurance rather than providing detailed
activity data to avoid providing confidential data Language barriers • Translate the questionnaire and communications into local languages 3 8.3 Allocate Supplier Data 4 5 See Chapter 7 for guidance on allocating emissions data from suppliers. Companies may use physical 6 allocation or economic allocation, depending on business goals and data availability. Companies should 7 allocate supplier emissions to the reporting company using a consistent metric. 8 9 Either the reporting company or its suppliers can allocate supplier emissions to the reporting company (see 10 Box 8.3). To allocate supplier emissions, multiply total supplier emissions (at the facility, business unit, or 11 corporate level) by the reporting company’s fraction of the supplier’s total production (see Box 8.2). 12 13 Box 8.2: Equation for Allocating Supplier Emissions 14
Where both “Reporting Company’s Purchases From the Supplier” and “Supplier’s Production” are measured 15 in the same units (e.g., revenue/spend of products, number of products, mass of products, etc.) 16

DRAFT FOR STAKEHOLDER REVIEW – NOVEMBER 2010
67
Box 8.3: Two Approaches to Allocating GHG Emissions from Suppliers 1 2 Companies have two basic approaches for collecting and allocating GHG emissions from suppliers:
• Supplier Allocation
: Individual suppliers report pre-allocated emissions data to the reporting company and disclose the allocation metric used.
• Reporting Company Allocation
: The reporting company allocates supplier emissions by obtaining two types of data from individual suppliers: 1) total supplier GHG emissions data (e.g., at the facility or business unit level), and 2) the reporting company’s share of the supplier’s total production, based on either physical factors (e.g., units of production, mass, volume, or other metrics) or economic factors (e.g., revenue, spend)
Reporting company allocation is likely to ensure more accurate and consistent data quality for the reporting company (including consistency and transparency in calculation methods and emission factors), while the supplier allocation approach may be more practical for suppliers by avoiding the need to report confidential business information. If neither of the approaches above is possible and if suppliers are publicly traded companies, companies may estimate allocated supplier emissions by obtaining the supplier’s annual revenue from publicly available data, obtaining the reporting company’s annual spend with that supplier from internal procurement records, and dividing company spend by the supplier’s revenue to derive the reporting company’s fraction of the supplier’s total revenue.22
3 8.4 Aggregate Supplier Data 4
Once supplier emissions have been allocated to the reporting company, companies should aggregate scope 5 1 and scope 2 emissions data across all relevant Tier 1 suppliers to derive a single estimate of supplier 6 emissions. 7 8 Total supplier emissions (MTCO2e) are equal to the sum across all relevant Tier 1 suppliers of the allocated 9 scope 1 and 2 emissions of each supplier (see Box 8.4). 10 11 Box 8.4: Equation for Aggregating Supplier Emissions 12 13 Total 14 15 It is acknowledged that in most cases companies will not receive GHG data from 100% of their suppliers. 16 Companies should not “scale up” the supplier emissions data they receive to estimate total supplier 17 emissions based on a 100% response rate. Instead, reported supplier emissions should only reflect the 18 actual data received from the subset of suppliers that provided data to the reporting company. Improvements 19 in supplier engagement over time are reflected in an increased percentage of suppliers accounted for over 20 time. 21 22 8.5 Report Emissions 23
Companies are required to report the following information (see Chapter 11, Reporting). 24 25
• Total supplier scope 1 and scope 2 emissions data, allocated to the reporting company using a 26 consistent metric and reported separately from the reporting company’s scope 1, scope 2 and scope 27 3 emissions; 28
• The methodology used to quantify and allocate supplier emissions data; and 29
22 For consistency, companies should use either gross revenue and gross spend or net revenue and net spend. Net sales are gross sales minus sales returns, sales allowances for damaged or missing goods, and sales discounts. Net sales are typically reported on a company’s income statement. Revenue may also be referred to as sales or turnover.
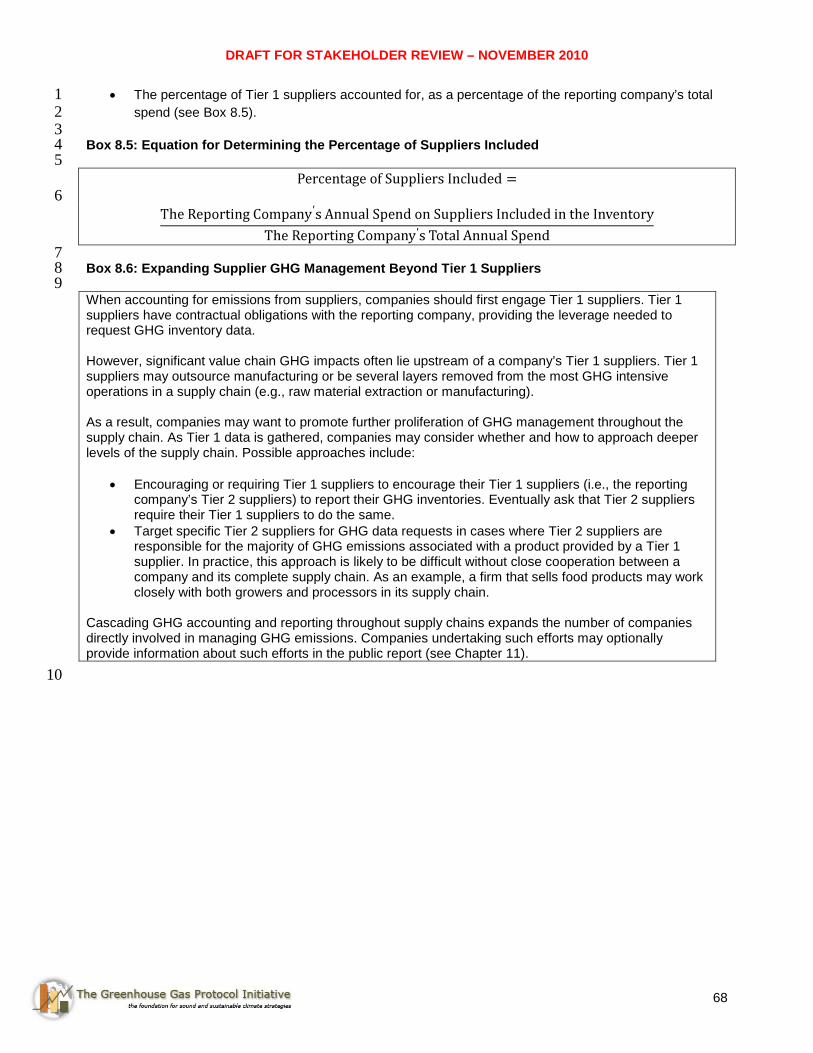
DRAFT FOR STAKEHOLDER REVIEW – NOVEMBER 2010
68
• The percentage of Tier 1 suppliers accounted for, as a percentage of the reporting company’s total 1 spend (see Box 8.5). 2 3
Box 8.5: Equation for Determining the Percentage of Suppliers Included 4 5
6
7 Box 8.6: Expanding Supplier GHG Management Beyond Tier 1 Suppliers 8 9 When accounting for emissions from suppliers, companies should first engage Tier 1 suppliers. Tier 1 suppliers have contractual obligations with the reporting company, providing the leverage needed to request GHG inventory data. However, significant value chain GHG impacts often lie upstream of a company’s Tier 1 suppliers. Tier 1 suppliers may outsource manufacturing or be several layers removed from the most GHG intensive operations in a supply chain (e.g., raw material extraction or manufacturing). As a result, companies may want to promote further proliferation of GHG management throughout the supply chain. As Tier 1 data is gathered, companies may consider whether and how to approach deeper levels of the supply chain. Possible approaches include:
• Encouraging or requiring Tier 1 suppliers to encourage their Tier 1 suppliers (i.e., the reporting company’s Tier 2 suppliers) to report their GHG inventories. Eventually ask that Tier 2 suppliers require their Tier 1 suppliers to do the same.
• Target specific Tier 2 suppliers for GHG data requests in cases where Tier 2 suppliers are responsible for the majority of GHG emissions associated with a product provided by a Tier 1 supplier. In practice, this approach is likely to be difficult without close cooperation between a company and its complete supply chain. As an example, a firm that sells food products may work closely with both growers and processors in its supply chain.
Cascading GHG accounting and reporting throughout supply chains expands the number of companies directly involved in managing GHG emissions. Companies undertaking such efforts may optionally provide information about such efforts in the public report (see Chapter 11). 10

DRAFT FOR STAKEHOLDER REVIEW – NOVEMBER 2010
69
9 Setting a Reduction Target & Tracking Emissions Over Time 1 2 Requirements in this chapter
• Companies shall choose and report a scope 3 base year and specify their reasons for choosing that particular year.
• Companies shall recalculate base year emissions when significant changes in the company structure or inventory methodology occur.
• Companies shall develop a base year emissions recalculation policy and clearly articulate the basis and context for any recalculations.
3 9.1 Introduction 4
5 Greenhouse gas accounting and reporting allows companies to track GHG performance over time and 6 demonstrate performance to stakeholders. Companies may track scope 3 emissions over time in response to 7 a variety of business goals, including: 8 9
• Public reporting 10 • Establishing GHG reduction targets and demonstrating performance toward achieving them 11 • Managing risks and opportunities 12 • Addressing the needs of investors and other stakeholders 13
14 This chapter is organized according to the steps a company should follow in tracking scope 3 performance 15 over time: 16 17
1. Choosing a base year and determining base year emissions 18 2. Setting scope 3 reduction goals 19 3. Recalculating and updating base year emissions 20 4. Accounting for scope 3 emissions and reductions over time 21
22 In addition to tracking performance of scope 3 emissions over time, companies may have multiple 23 complementary goals related to scope 3 emissions, such as: 24 25
• Improving inventory completeness over time (see Chapter 5, “Setting the Boundary”) 26 • Improvement data quality over time (see Chapter 6, “Collecting Data”) 27 • Improving supplier engagement over time (see Chapter 8, “Accounting for Supplier Emissions”) 28
29 Each of these complementary goals is an important step toward the ultimate goal of managing and reducing 30 scope 3 emissions. To track performance toward meeting these complementary goals, see the above 31 references as well as Chapter 11 (“Reporting Emissions”) for information on reporting performance. 32 33 9.2 Choosing a base year and determining base year emissions 34
35 Companies shall choose and report a scope 3 base year and specify their reasons for choosing that 36 particular year. A meaningful and consistent comparison of emissions over time requires that companies 37 establish a base year against which to track performance. 38 39 Companies should establish a single base year for scope 1, scope 2, and scope 3 emissions to enable 40 comprehensive and consistent tracking of total corporate GHG performance across all three scopes. 41 Companies that have already established a base year for scope 1 and scope 2 emissions may choose a 42 more recent year for the scope 3 base year (e.g., the first year for which companies have complete and 43 reliable scope 3 emissions data). 44 45 Once the base year is chosen, companies should determine base year emissions by following the 46 requirements and guidance contained in the other chapters of this standard. 47 48

DRAFT FOR STAKEHOLDER REVIEW – NOVEMBER 2010
70
9.3 Setting scope 3 reduction goals 1 2
Any robust business strategy requires setting targets for revenues, sales, and other core business indicators, 3 as well as tracking performance against those targets. Likewise, effective GHG management involves setting 4 a GHG target. 5 6 Companies should consider several questions when setting a scope 3 GHG reduction target (see Table 9.1). 7 8 Table 9.1: Considerations when setting a GHG reduction target 9 10 Issue Description
Target boundary Which scope 3 categories and activities to include in the reduction target
Target type Whether to set an absolute or intensity target Target completion date The duration of the target
Target level The numerical value of the reduction target 11 Target Boundary 12 13 Companies may set a variety of scope 3 reduction goals, including: 14 15
• Separate reduction targets for individual scope 3 categories 16 • A single reduction target for total scope 3 emissions 17 • A single reduction target for total scope 1 + scope 2 + scope 3 emissions 18 • A combination of targets, for example a target for total scope 1 + 2 + 3 emissions as well as targets 19
for individual scope 3 categories. 20 21 Each approach has advantages and disadvantages (see Table 9.2). 22 23 Table 9.2. Advantages and disadvantages of different types of scope 3 reduction goals 24 25 Goal type Advantages Disadvantages
A single reduction target for total scope 1 + scope 2 + scope 3 emissions
• Ensures more comprehensive management of emissions across the entire value chain (i.e., all three scopes)
• Simpler to communicate to stakeholders
• Does not require base year recalculation for outsourcing or insourcing
• May provide less transparency for each scope 3 category
• Requires base year recalculations for adding additional scope 3 categories to the inventory
Separate reduction targets for individual scope 3 categories
• Allows customization of targets for different scope 3 categories based on different circumstances
• Provides more transparency for each scope 3 category
• Provides additional metrics to track progress
• Does not require base year recalculations for adding additional scope 3 categories to the inventory
• May result in less comprehensive GHG management
• More complicated to communicate to stakeholders
• Requires base year recalculation for outsourcing or insourcing
26 Regardless of the type(s) of reduction targets set, companies should establish a single target base year for 27 all scope 3 categories. A single target base year for all scope 3 categories simplifies scope 3 performance 28

DRAFT FOR STAKEHOLDER REVIEW – NOVEMBER 2010
71
tracking, avoids cherry picking of base years (or the perception thereof), and allows clearer communication 1 of GHG performance to stakeholders. 2 3 Target Type 4 5 Companies set either absolute targets, intensity targets, or a combination of absolute and intensity targets. 6 An absolute target is expressed as a reduction in GHG emissions to the atmosphere over time in units of 7 tonnes of CO2-e. An intensity target is expressed as a reduction in the ratio of GHG emissions relative to a 8 business metric, such as output, production, sales or revenue. Advantages and disadvantages of each type 9 of target are provided in Table 9.3. 10 11 To ensure transparency, companies using an intensity target should also report the absolute emissions from 12 sources covered by the target. Companies may find it most useful and credible to implement both absolute 13 and intensity targets – for example, an absolute target at the corporate level and a combination of intensity 14 targets at lower levels of the company, or an absolute target for total scope 3 emissions and a combination of 15 intensity targets for individual scope 3 categories. 16 17 Table 9.3. Comparing Absolute Targets and Intensity Targets 18 19
20 For more information on setting targets, see the GHG Protocol Corporate Standard (Chapter 11, “Setting a 21 GHG Target”). 22 23 Case study to be provided 24 25 26
Target type Advantages Disadvantages
Absolute Target
• Designed to achieve a reduction in a specified quantify of GHGs emitted to the atmosphere
• Environmentally robust as it entails a commitment to reduce GHGs by a specified amount
• Transparently addresses stakeholder concerns about the need to manage absolute emissions
• Most credible to stakeholders
• Does not allow comparisons of GHG intensity/efficiency
• Recognizes a company for reducing GHGs by decreasing production or output (i.e., organic decline)
Intensity Target
• Reflects GHG performance improvements independent of organic growth or decline
• May increase the comparability of GHG performance among companies
• No guarantee that GHG emissions to the atmosphere will be reduced (absolute emissions may rise if intensity decreases and output increases)
• Companies with diverse operations may find it difficult to define a single common metric
• If a monetary metric is used, such as dollar of revenue or sales, recalculation may be necessary for changes in product prices and inflation

DRAFT FOR STAKEHOLDER REVIEW – NOVEMBER 2010
72
9.4 Recalculating and updating base year emissions 1 2 To consistently track scope 3 emissions over time, companies shall recalculate base year emissions when 3 significant changes in the company structure or inventory methodology occur. In such cases, recalculating 4 base year emissions is necessary to maintain consistency over time to enable meaningful comparisons of 5 “like with like” over time. 6 7 Recalculating base year emissions is imperative in scope 3 reporting because steps taken to better manage 8 scope 3 emissions may have the apparent effect of increasing reported emissions over time if base year 9 emissions are not recalculated. Such steps include: 10 11
• Improving the accuracy and quality of the scope 3 inventory over time 12 • Engaging more suppliers and value chain partners and increasing the use of primary data in the 13
scope 3 inventory over time 14 • Improving the completeness of the scope 3 inventory over time by accounting for more scope 3 15
categories and activities over time 16 17 While each of these actions is a step toward improved scope 3 GHG management, each could also increase 18 reported scope 3 emissions. To avoid this unintended discrepancy, companies should recalculate base year 19 emissions so the inventory reflects an apples-to-apples comparison over time. 20 21 Companies are required to retroactively recalculate base year emissions when the following changes occur, 22 have a significant impact on base year emissions, and would compromise the consistency and relevance of 23 the reported GHG emissions data: 24 25
• Significant structural changes in the reporting organization, such as mergers, acquisitions, 26 divestments, outsourcing, and insourcing; 27
• Significant changes in calculation methodologies, improvements in data accuracy, or discovery of 28 significant errors; or 29
• Significant changes in the categories or activities included in the scope 3 inventory. 30 31 Companies shall recalculate base year emissions for both GHG emissions increases and decreases. 32 Significant changes result not only from single large changes, but also from several small changes that are 33 cumulatively significant. 34 35 Establishing a base year recalculation policy 36 37 Companies shall develop a base year emissions recalculation policy and clearly articulate the basis and 38 context for any recalculations. If applicable, the policy shall state any “significance threshold” applied for 39 deciding on recalculating historic emissions. A “significance threshold” is a qualitative and/or quantitative 40 criterion used to define any significant change to the data, inventory boundaries, methods, or any other 41 relevant factors. Companies shall establish and disclose the “significance threshold” that triggers base year 42 emissions recalculations. 43 44 Once a company has determined its policy on how it will recalculate base year emissions, the company shall 45 apply the policy in a consistent manner. 46 47 Recalculations for structural changes in ownership or control 48 49 Companies are required to retroactively recalculate base year emissions when significant structural changes 50 occur in the reporting organization, such as mergers, acquisitions, or divestments. 51 52 53

DRAFT FOR STAKEHOLDER REVIEW – NOVEMBER 2010
73
Recalculations for outsourcing or insourcing 1 2 Scope 3 emissions include outsourced activities. If a company is reporting comprehensively on scope 1, 3 scope 2 and scope 3, a change in ownership or control will have the effect of shifting emitting activities 4 between the scopes. 5 6 If a company outsources an activity to a third party, the activity shifts from scope 1 to scope 3. Conversely, a 7 company may shift emissions from scope 3 to scope 1 by performing operations in-house that were 8 previously performed by a third party. 9 10 Whether the outsourcing or insourcing of an activity triggers a base year emissions recalculation depends on 11 whether: 12 13
• The company previously reported scope 3 emissions from the activity 14 • The company has a single base year and GHG target for all scopes or separate base years and 15
GHG targets for each scope 16 • The outsourced or insourced activity contributes significantly to the company’s emissions 17
18 See Table 9.4 for guidance on whether a recalculation of base year emissions is necessary. 19 20 Table 9.4: Criteria for determining whether to recalculate base year emissions due to changes in outsourcing 21 or insourcing 22 23
The company previously reported scope 3 emissions from the activity
The company did not previously report emissions from the activity
The company has a single base year and GHG target for total scope 1 + 2 + 3 emissions
No Recalculation Recalculate If Significant*
The company has separate base years and GHG targets for individual scope 3 categories
Recalculate If Significant* Recalculate If Significant*
24 * Recalculation is necessary if the cumulative effect of outsourcing or insourcing is significant. 25 26 Recalculations for changes in the scope 3 activities included in the inventory over time 27 28 Companies may add new activities or change the activities included in the scope 3 inventory over time. 29 Whether changing the scope 3 activities included in the inventory triggers a base year emissions 30 recalculation depends on whether the company has established: 31 32
• A single base year and GHG target for total scope 3 emissions, or 33 • Separate base years and GHG targets for individual scope 3 categories 34
35 See Table 9.5 for guidance on whether a recalculation of base year emissions is necessary. 36 37

DRAFT FOR STAKEHOLDER REVIEW – NOVEMBER 2010
74
Table 9.5: Criteria for determining whether to recalculate base year emissions for adding or changing the 1 categories or activities included in the scope 3 inventory 2
3
Add Entire Categories Add or Change Activities Within Categories
The company has a single base year and GHG target for total scope 3 emissions
Recalculate If Significant*
Recalculate If Significant*
The company has separate base years and GHG targets for individual scope 3 categories
No Recalculation Recalculate If Significant*
4 * Recalculation is necessary if the cumulative effect of adding or changing scope 3 categories or activities is 5 significant. If significant, the company should include the new categories or activities in the base year 6 inventory and backcast data for the base year based on available historical activity data (e.g., bill of materials 7 data, spend data, product sales data, etc.). 8 9 Recalculations for changes in calculation methodology or improvements in data accuracy over time 10 11 A company might report the same sources of GHG emissions as in previous years, but measure or calculate 12 them differently over time. For example, in its third year of reporting scope 3 emissions, a company may 13 significantly improve its data quality by collecting more data from suppliers and increasing the accuracy and 14 precision of emissions estimates. The company should ensure that changes in the inventory over time are a 15 result of actual emissions increases or decreases, not changes in methodology, so that the company tracks 16 like with like over time. 17 18 If changes in methodology or data result in significant differences in emissions estimates, companies are 19 required to recalculate base year emissions applying the new data and/or methodology. 20 21 Sometimes the more accurate data input may not reasonably be applied to all past years or new data points 22 may not be available for past years. The company may then have to backcast these data points, or the 23 change in data source may simply be acknowledged without recalculation. This acknowledgment should be 24 made in the report each year in order to enhance transparency and avoid misinterpretation of data by users 25 of the report. 26 27 Any changes in emission factors of activity data that reflect real changes in emissions (i.e., changes in fuel 28 type of technology) do not trigger a recalculation. 29
30 No recalculation for organic growth or decline 31 32 Base year emissions and any historic data are not recalculated for organic growth and decline. Organic 33 growth/decline refers to increases or decreases in production output, changes in product mix, and closures 34 and openings of operating units that are owned or controlled by the company. The rationale for this is that 35 organic growth or decline results in a change of emissions to the atmosphere and therefore needs to be 36 accounted as an increase or decrease in the company’s emissions profile over time. 37
38 39

DRAFT FOR STAKEHOLDER REVIEW – NOVEMBER 2010
75
9.5 Accounting for scope 3 emissions and reductions over time 1 2
Methodology 3 4 There are two basic approaches for accounting for GHG reductions (see Table 9.6). This standard uses the 5 inventory method to account for changes in emissions over time (see Box 9.1). 6 7 Table 9.6: Methods for Accounting for GHG Reductions 8 9 Method Description Relevant GHG Protocol
Publication
Inventory Method Accounts for GHG reductions by comparing changes in the company’s actual emissions inventory over time relative to a base year
GHG Protocol Corporate Standard
Project Method Accounts for GHG reductions by quantifying impacts from individual GHG mitigation projects relative to a baseline
GHG Protocol for Project Accounting
10 Box 9.1: Quantifying Changes in Scope 3 Emissions Over Time 11 12 13
14 15 In addition to reporting comprehensive scope 3 GHG performance using the inventory method, companies 16 may additionally use the project method to quantify scope 3 GHG reductions from discrete scope 3 GHG 17 mitigation projects (such as those listed in Table 9.7), but any project-based reductions must be reported 18 separately from the company’s scope 1, scope 2, and scope 3 emissions. For more information on 19 quantifying project-based GHG reductions, refer to the GHG Protocol for Project Accounting.23
21 20
Data Types 22 23 The data types used to quantify scope 3 emissions affect the ability of companies to track performance over 24 time. To effectively track performance, companies should use primary data collected from suppliers and 25 other value chain partners for scope 3 activities targeted for achieving GHG reductions. For more 26 information, see Section 6.2. 27 28 9.6 Addressing double counting of scope 3 reductions among multiple entities in a value chain 29
30 Scope 3 emissions are by definition the direct emissions of another entity. Multiple entities in a value chain 31 influence both emissions and reductions, including raw material suppliers, manufacturers, distributors, 32 retailers, consumers, and others. As a result, changes in emissions are not easily attributable to any single 33 entity. 34 35 Double counting occurs when two or more companies claim ownership for a single GHG reduction within the 36 same scope. The GHG Protocol Corporate Standard defines scope 1 and scope 2 to ensure that two or more 37 companies do not account for the same emission within the same scope (for more information, see the GHG 38 Protocol Corporate Standard, Chapter 4, “Setting Operational Boundaries”). By properly accounting for 39 emissions as scope 1, scope 2, and scope 3, companies avoid double counting within scope 1 and scope 2. 40 41 Double counting within scope 3 occurs when two entities in the same value chain account for the scope 3 42 emissions from a single emission source – for example, if a manufacturer and a retailer both account for the 43 scope 3 emissions resulting from the third party transportation of goods between them. This type of double 44 counting is an inherent part of scope 3 accounting. Each entity in the value chain has some degree of 45 influence over emissions and reductions. Scope 3 accounting facilitates the simultaneous action of multiple 46 23 Available online at www.ghgprotocol.org.

DRAFT FOR STAKEHOLDER REVIEW – NOVEMBER 2010
76
entities to reduce emissions throughout society. Because of this type of double counting, scope 3 emissions 1 should not be aggregated across companies. 2 3 Companies may find double counting within scope 3 to be acceptable for purposes of reporting scope 3 4 emissions to stakeholders, driving reductions in value chain emissions, and tracking progress toward a 5 scope 3 reduction target. Companies should acknowledge any double counting when making claims about 6 scope 3 reductions to ensure transparency and avoid misinterpretation of data. For example, a company 7 may claim that the company is working jointly with partners to reduce emissions, rather than taking exclusive 8 credit for scope 3 reductions. 9 10 If GHG reductions take on a monetary value or receive credit in a GHG reduction program, companies 11 should avoid any double counting of reductions within scope 3. To avoid double counting, companies should 12 specify exclusive ownership of reductions through contractual agreements. 13 14 Table 9.7 provides an illustrative list of actions that companies can take to influence reductions in the value 15 chain. 16 17 Table 9.7: Illustrative Examples of Actions to Influence Scope 3 Reductions 18 19
Upstream Scope 3 Emissions from Purchased Products
Category Examples of Actions to Influence Reductions
1. Purchased Goods & Services
• Substitute away from high GHG emitting raw materials toward low GHG emitting raw materials
• Implement low-GHG procurement/purchasing policies • Encourage Tier 1 suppliers to engage their Tier 1 suppliers (i.e., the reporting
company’s tier 2 suppliers) and disclose these scope 3 emissions to the customer in order to propagate GHG reporting through the supply chain
2. Capital Goods • Substitute away from high GHG emitting capital goods toward low GHG emitting capital goods
3. Fuel- and Energy- Related Activities Not Included in Scope 1 or 2
• Reduce energy consumption • Change energy source • Generate energy on-site using renewable sources
4. Transportation & Distribution (Upstream)
• Reduce distance between supplier and customer • Source materials from nearer locations if leads to net GHG reductions • Optimize efficiency of transportation and distribution • Shift away from higher emitting transportation modes (e.g. air transport) and
toward lower emitting transportation modes (e.g. marine transport) • Shift toward lower-emitting fuel sources
5. Waste Generated in Operations
• Reduce quantity of waste generated in operations • Implement re-use and recycling measures that lead to net GHG reductions • Implement less-emitting waste treatment methods
6. Business Travel
• Reduce the amount of business travel (e.g., encourage video conferencing and web-based meetings as an alternative to in-person meetings)
• Encourage more efficient travel • Encourage less-emitting modes of travel (e.g., rail instead of plane)
7. Employee Commuting
• Reduce commuting distance (e.g., locate offices/facilities near urban centers and public transit facilities)
• Create disincentives for commuting by car (e.g., parking policies) • Provide incentives for use of public transit, bicycling, carpooling, etc. • Implement teleworking/telecommuting programs • Reduce number of days worked per week (e.g., 4x10 schedule instead of 5x8)
8. Leased Assets (Upstream)
• Increase energy efficiency of operations • Shift toward lower-emitting fuel sources

DRAFT FOR STAKEHOLDER REVIEW – NOVEMBER 2010
77
9. Investments • Increase energy efficiency of operations • Substitute toward lower-emitting fuel sources
Downstream Scope 3 Emissions from Sold Products
10. Transportation & Distribution of Sold Products
• Reduce distance between supplier and customer • Source materials from nearer locations if leads to net GHG reductions • Optimize efficiency of transportation and distribution • Shift away from higher emitting transportation modes (e.g. air transport) and
toward lower emitting transportation modes (e.g. marine transport) • Shift toward lower-emitting fuel sources
11. Processing of Sold Products
• Improve efficiency of processing • Use lower-GHG energy sources
12. Use of Sold Products
• Develop new low- or zero-emitting products • Increase the energy efficiency of energy-consuming goods or eliminate the
need for energy use • Shift away from products that contain GHGs • Reduce the quantity of GHGs contained/released by products • Decrease the use phase GHG intensity of the reporting company’s entire
product portfolio • Change the user instructions to promote efficient use of products
13. End-of-Life Treatment of Sold Products
• Make products recyclable if leads to net GHG reductions • Implement product packaging measures that lead to net GHG reductions (e.g.,
decrease amount of packaging in sold products. develop new GHG saving packaging materials, etc.)
• Implement re-use and recycling measures that lead to net GHG reductions
14. Leased Assets (Downstream)
• Increase energy efficiency of operations • Shift toward lower-emitting fuel sources
15. Franchises • Increase energy efficiency of operations • Shift toward lower-emitting fuel sources
1
Supplier Emissions
Supplier Emissions
• Partner with suppliers to increase energy efficiency in their operations • Give preference to low GHG emitting suppliers over high GHG emitting
suppliers • Include GHG reduction targets and policies in contractual agreements • Organize low-carbon supply chain partnerships, involving the whole value
chain 2 3

DRAFT FOR STAKEHOLDER REVIEW – NOVEMBER 2010
78
10 Assurance 1 2 Having assurance over a company's scope 3 inventory provides confidence to users, including the reporting 3 company, that the reported information represent a fair, reasonable, and accurate presentation of a 4 company's GHG emissions. 5 6 10. 1 Introduction 7 8 Assurance is an evidence-gathering process whereby an assurer obtains sufficient and appropriate evidence 9 that is used to express a conclusion concerning an outcome of an evaluation or measurement. The nature 10 and extent of assurance procedures can vary widely depending on whether the assurance engagement is 11 designed to obtain reasonable or limited assurance (as defined below in section 3.1). 12 13 In this standard, the term assurance is used in place of the term verification, which is used in Chapter 10 of 14 the GHG Protocol Corporate Accounting and Reporting Standard. Assurance refers to a broad review of 15 scope 3 inventories and is aligned with financial accounting processes and terminology. The term 16 “verification” is more narrowly defined as the assessment of the accuracy and completeness of reported 17 GHG information against pre-established GHG accounting and reporting principles. 18 19 A company completing a scope 3 inventory should conduct internal assurance or have an independent third 20 party conduct assurance. An assurance engagement, whether internal assurance performed within the 21 company or third party assurance, has similar elements, including: 22 23
1. Planning and scoping (e.g., determine risks, materiality) 24 2. Identifying processes and emissions data , as applicable 25 3. Executing the assurance process (e.g., test of controls, test of details, re-perform data collection 26
procedures, gathering evidence, performing analytics, testing of details, testing of controls, etc.) 27 4. Evaluating results 28 5. Determining conclusions and issuing reports. 29
30 Providing assurance on scope 3 emissions may be challenging. Emissions data relies on a mixture of data 31 sources and assumptions. Inventory uncertainty for upstream and downstream emissions may affect the 32 quality of the GHG inventory. Companies should consider the state of scope 3 data collection systems and 33 the integrity of the underlying data and assumptions for the assurance process. 34 35 Companies should perform a pre-assessment of the state of readiness for assurance before deciding to 36 obtain assurance externally. This assessment can be performed internally or by an external service provider. 37 See Section 10.2 for information on preparing for assurance. 38 39 This chapter uses specific terminology related to assurance. See Box 10.1 for terms and definitions. 40 41 Box 10.1: Terms and definitions related to assurance 42 43
• Assurer is a competent individual or body who is conducting the assurance process, whether 44 internally within the company or externally. 45
• Assertion is a written representation that evaluates or measures the subject matter against the 46 criteria. An assertion is a statement about the GHG emissions of a product or organization. 47
• Conclusion is an expression of the results of the assurer’s evaluation of the company’s written 48 assertion or a statement that a conclusion cannot be expressed. In the event that the assurer 49 determines that a conclusion cannot be expressed, the statement should cite the reason. 50
• Criteria are the benchmarks used to evaluate or measure the subject matter, including how the 51 subject matter is reported and prepared 52
• Subject matter is the information supporting the inventory report and associated assertion(s). 53 54 55 56

DRAFT FOR STAKEHOLDER REVIEW – NOVEMBER 2010
79
10.2 Overview of the Assurance Process 1 2 Figure 10.1 provides an overview of the assurance process. Each concept is explored throughout this 3 chapter. 4 5 Figure 10.1: Overview of the assurance process 6 7
8 9 Relationships of parties in the assurance process 10 11 Three key parties are involved in the assurance process: 1) the company undergoing assurance that is 12 making an assertion about its emissions (i.e., the reporting company), 2) an intended user and 3) an assurer. 13 The key parties may assume multiple roles depending on the type of assurance being provided. 14 15 • When the company making the assertion also performs the assurance, this is known as internal 16
assurance. 17 • When a party other than the company making the assertion or the intended user performs the 18
assurance, the assurer is considered to be an external third party assurer (see Table 10.1). 19 20 Table 10.1: Types of assurance 21 22 Type of Assurer Description Recommended
independence mechanism
Internal assurance Person(s) from within the company but independent of the GHG inventory determination process conducts internal assurance.
Different lines of reporting are key for ensuring independence
External assurance (Third Party)
Person(s) from a certification or assurance body independent of the GHG inventory determination process conducts assurance
Different business entity than the reporting company or intended user
23 Assurance providers, whether internal or external to the company, should be sufficiently independent of any 24 involvement in the determination of the scope 3 inventory or development of any declaration and have no 25
Criteria
•Accounting & reporting principles•Quantification methodologies•Nature of subject matter reported•Boundaries of subject matter reported
Subjectmatter
• Information in inventory report (e.g., 15,200 tonnes CO2e from business travel)•Controls over data collection and reporting
Assertion
•Our scope 3 emissions from business travel of 15,200 tonnes CO2e are presented in accordance with the GHG Protocol Scope 3 Standard and in accordance with our internal policies, as further described in Note X
Conclusion•Assurer's conclusion on the reporting company's assertion

DRAFT FOR STAKEHOLDER REVIEW – NOVEMBER 2010
80
conflicts of interests, such that they can exercise objective and impartial judgment. Inherently, assurance 1 provided by a third-party offers a higher degree of objectivity and independence. 2 3 Independence should be apparent to the intended user in fact and in appearance. Some typical threats to 4 independence may include financial and other conflicts of interest or lack of segregation between the 5 reporting company and the assurer. These threats should be assessed throughout any assurance process. 6 Assurers should perform an assessment based on their individual facts and circumstances to ensure 7 independence has been maintained. 8 9 Preparing for assurance 10 11 Preparing for assurance is a matter of ensuring that the evidence that the assurer requires is available or 12 easily accessed. The type of evidence requested will depend on the subject matter, the industry and the 13 type of assurance being sought. Maintaining documentation of the inventory process through the use of a 14 data management plan is helpful for ensuring the evidence needed for data or model assurance is available 15 (see Appendix E). 16 17 Evidence is: 18 19 • Physical observations, such as site tours to confirm the existence and completeness of the sources 20 • Assurer’s calculations, such as recalculation of aggregated emissions across GHG inventory 21 • Statements by independent parties, such as an interview of a courier about the driving training 22
received and routes taken to the reporting company. 23 • Statements by the reporting company, such as interview of the production manager about production 24
capacity and delivery in last period. 25 • Documents prepared by an independent party, such as invoices 26 • Documents prepared by the reporting company, such as procedures used to check sales receipts 27 • Data interrelationships, such as the emissions generated by a supplier and the production rate. 28 29 Timing of assurance 30 31 Assurance is conducted before the public release of the written assertion and inventory report by the 32 reporting company. This allows for material misstatements to be corrected prior to the release of the opinion 33 and assertion. The work should be initiated far enough in advance of the inventory report release so that the 34 assurance work is useful in improving the inventory when applicable. An example timeline is shown in Figure 35 10.2. The period for assurance is dependent on the nature and complexity of the subject matter, level of 36 assurance, and geographical spread of the evidence. 37 38 Figure 10.2: Timing of Assurance 39 40
41
Inventory Period Written assertion, assurance statement & scope 3 inventory report are released
Assurance process
commences Planning Phase Execution
Phase Completion Phase
Assurance

DRAFT FOR STAKEHOLDER REVIEW – NOVEMBER 2010
81
Selecting an assurance provider 1 2 Selecting an appropriate assurance provider is critical in ensuring that the assurance statement has the 3 credibility needed from the intended user. There are three key characteristics that a reporting company 4 should look for in their assurance provider, whether internal or external: 5 6
1. Independence mechanisms: internal mechanisms in-place to communicate requirements for 7 personnel, identify threats to independence and breaches of independence, and to monitor and 8 report the independence status of personnel 9
2. Competence of the assurance team: knowledge of GHG issues, requirements of the standard, and 10 the company's industry (see Figure 10.3) 11
3. Infrastructure of the assurer: appropriate training protocols, project management systems, and 12 systems to document and retain results of the work performed 13
14 For companies performing internal assurance, the personnel should be independent of those undertaking the 15 GHG inventory accounting and reporting process. Both internal and external assurance should follow similar 16 procedures and processes. For external stakeholders, third-party assurance is likely to increase the 17 credibility of the GHG inventory. However, internal assurance can also provide valuable assurance over the 18 reliability of information and can be a worthwhile learning experience for a company prior to commissioning 19 external assurance. It can also provide third-party assurance providers with useful information. 20 21 A credible and competent GHG inventory assurance provider has: 22 23
• Deep assurance expertise and proven previous experience under recognized assurance 24 frameworks. 25
• Robust assurance methodologies 26 • Ability to assess the emission sources and the magnitude of potential errors, omissions and 27
misrepresentations. 28 • Knowledge of the company's activities, industry sector, suppliers and products and understanding of 29
scope 3 requirements and guidance concepts and principles 30 • Objectivity, impartiality, credibility, independence and professional skepticism to challenge data and 31
information. 32 33 Figure 10.3: Competencies of the Assurance Team 34
35 36
Industry Expertise • Processes • Performance • Measurements
WRI/WBCSD Standard • Quantification
standards • Reporting and
Disclosure standards
Assurance Methods • Risk Analysis • Evidence
Gathering • Conclusion
Subject Matter • Emissions and
Removals • Science of
emissions and removals
• GWP
DRAFT FOR STAKEHOLDER REVIEW – NOVEMBER 2010
82
10.3 Types of assurance 1 2 This standard recognizes two main types of assurance: data assurance and model assurance. Each 3 assurance type differs in their conclusions and in the level of assurance it provides. 4 5 Data assurance includes the inventory data, calculations, processes and other subject matter. Model 6 assurance is only provided on the calculation methodology, data assumptions and standard requirements, 7 not the inventory emissions results. 8 9 Data assurance 10 11 Data assurance is expressed over historical data and the adherence to a specified quantification 12 methodology and reporting standard (i.e. the scope 3 standard). 13 14 Typically, data assurance requires an in-depth understanding of the subject matter and the underlying 15 systems that generate the assertion. This type of assurance is risked-based. Analytical procedures are a 16 basic tool of providing data assurance. Analytics require independently measured parameters for processes 17 with known relationships and continuous data. For example, a company’s monthly electrical utility bills are 18 independently measured and continuous to undergo analytical procedures. 19 20 The internal control environment that supports the processes and systems around the emissions data is an 21 important aspect of the company's internal reporting framework. A control environment is properly designed if 22 it is sufficient to detect and prevent a material misstatement. The assurer may perform controls testing, as 23 part of the data assurance process, to increase the efficiency of the assurance process. Controls testing is 24 only available to the assurer when a relatively robust data management system is in place. Controls 25 assessment offers more certainty about the environment in which the subject matter exists and the written 26 assertion is generated. 27 28 Model assurance 29 30 Model assurance reviews the boundaries, calculations and other assumptions used to generate a written 31 assertion to ensure the standard requirements were followed and the assumptions are reasonable. Model 32 assurance offers confidence over models, methodological decisions, and assumptions used to generate the 33 assertion, but not assurance over the written assertion itself (i.e. inventory results). When a model calculates 34 future emissions the assurer should evaluate the model’s assumptions. 35 36 Model assurance is an option when data assurance is not practical due to limitations and uncertainty related 37 to the data. Model assurance should be considered for use when an inventory contains a substantial amount 38 of assertions relying on modeling. 39 40 Modular approach to assurance 41 42 Modular assurance is an implementation approach for both data and model assurance. It is available when 43 a supplier or vendor obtains assurance on their operations or products they sell to or purchase from the 44 reporting company. The assurer for the reporting company may be able to rely on the work of another 45 assurer to increase the scope of their assurance but not necessarily to increase the level of their assurance 46 (i.e., limited or reasonable). 47 48 The reporting company's assurer should consider the following before relying on the work of another assurer: 49 50
• Independence and competence of the assurer 51 • Design, nature and results of the component assurance procedures 52 • The risks of misstatement in the supplier’s assertion 53 • The relative contribution of the supplier’s assertion to the reporting company’s assertion 54 • The boundaries of the modular opinion and written assertion 55

DRAFT FOR STAKEHOLDER REVIEW – NOVEMBER 2010
83
Box 10.2: Site / supply chain visits 1
2 Levels of assurance: Limited and reasonable assurance 3 4 The level of assurance refers to the degree of confidence the intended user of the assurance conclusion can 5 gain from the outcome of the assurance evaluation. 6 7 There are two levels of assurance: limited and reasonable. Both levels of assurance can be performed for 8 data and model assurance types. Model assurance cannot achieve limited or reasonable levels of assurance 9 over an assertion, but it can achieve limited or reasonable assurance over the assumptions underlying the 10 models used to generate the assertion. 11 12 The level of assurance requested will determine the amount of evidence required. The highest level of 13 assurance that can be provided is a reasonable level of assurance. Absolute assurance is never provided as 14 100% of inputs to the GHG inventory are not tested; testing at such a level by the assurer is neither feasible, 15 practical nor cost efficient. 16 17 The thoroughness with which the assurance evidence is obtained is less rigorous and more circumscribed in 18 limited assurance than with reasonable assurance. Table 10.2 provides examples of limited and reasonable 19 assurance opinions for an assertion of scope 3 business travel emissions. 20 21 22
Site/supply chain visits are conducted when they are the most efficient and effective way to collect evidence. They are also commonly employed because evidence gathering procedures are very relevant (e.g., direct observation of the completeness and validity of the GHG inventory) and the quantity of evidence needed is less compared to other methods. However, site / supply chain visits can be challenging to conduct for scope 3 emissions because of access and location issues. Alternate assurance procedures can be applied; however, the objectives of the assurance procedures, and the sufficiency and appropriateness of the alternate evidence will need to be assessed. Site/supply chain visits are typically not used in model assurance. Table 10.7: Examples of Alternative Procedures to Site Visit Based Procedures Assurance procedure objective
Typical site visit assurance procedure
Potential alternative procedures (not a comprehensive list)
Confirm sources in the inventory
Conduct site tour and compare visual inspection of sources and sinks to GHG inventory list
• Review “as-built” process flow diagrams with identified sources in the process.
• Review capital asset list or maintenance list • Identify sources based on interviews about the process
and understanding of the industry • Identify sources based on third party sources (e.g.,
aerial photographs, insurance records, leasing lists, etc.)
Confirm calibration of measurement devices
Obtain a sample of calibration records
• Obtain a third party report on the calibration • Review operational data for changes in calibration • Obtain a third party measurement for the same
measurement point (e.g., sales receipt volume and inventory acceptance volume)
Understand the operation practices and limits
Interview production manager in person Review operational records
• Interview production manager over the phone • Interview a specialist about the operational practices • Review engineering references (e.g., operation
manual, product text books, etc) • Conduct analytical testing on the production
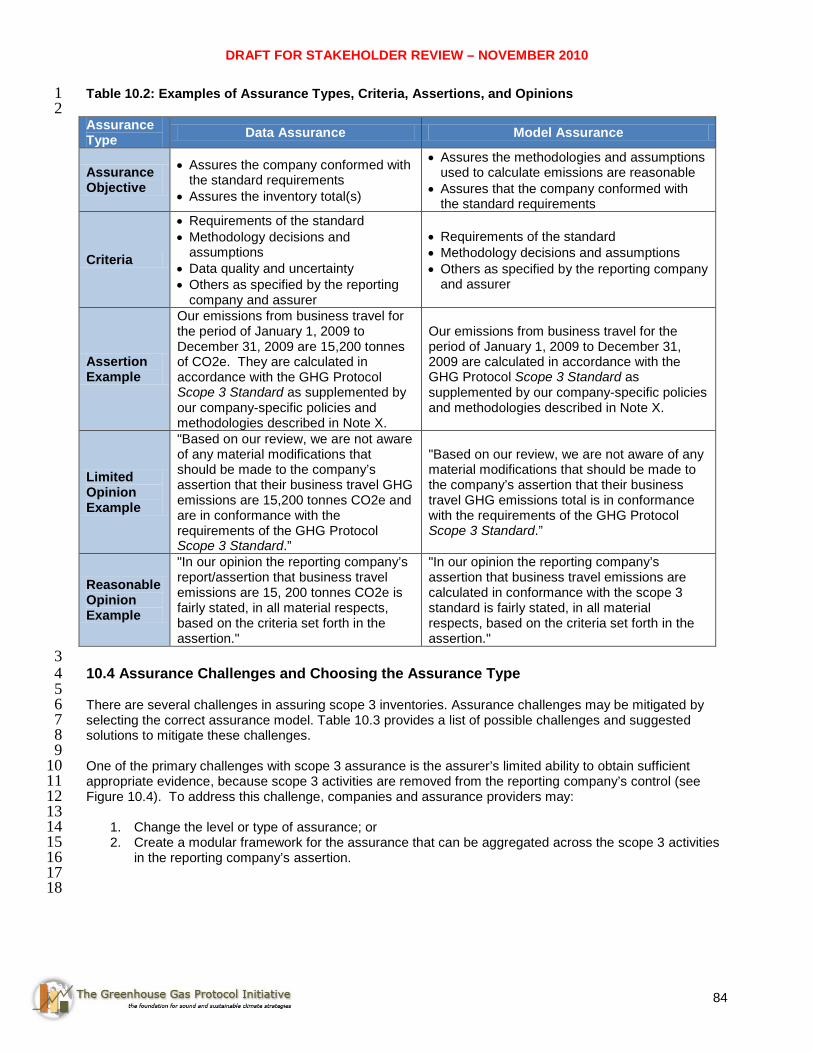
DRAFT FOR STAKEHOLDER REVIEW – NOVEMBER 2010
84
Table 10.2: Examples of Assurance Types, Criteria, Assertions, and Opinions 1 2
Assurance Type Data Assurance Model Assurance
Assurance Objective
• Assures the company conformed with the standard requirements
• Assures the inventory total(s)
• Assures the methodologies and assumptions used to calculate emissions are reasonable
• Assures that the company conformed with the standard requirements
Criteria
• Requirements of the standard • Methodology decisions and
assumptions • Data quality and uncertainty • Others as specified by the reporting
company and assurer
• Requirements of the standard • Methodology decisions and assumptions • Others as specified by the reporting company
and assurer
Assertion Example
Our emissions from business travel for the period of January 1, 2009 to December 31, 2009 are 15,200 tonnes of CO2e. They are calculated in accordance with the GHG Protocol Scope 3 Standard as supplemented by our company-specific policies and methodologies described in Note X.
Our emissions from business travel for the period of January 1, 2009 to December 31, 2009 are calculated in accordance with the GHG Protocol Scope 3 Standard as supplemented by our company-specific policies and methodologies described in Note X.
Limited Opinion Example
"Based on our review, we are not aware of any material modifications that should be made to the company’s assertion that their business travel GHG emissions are 15,200 tonnes CO2e and are in conformance with the requirements of the GHG Protocol Scope 3 Standard.”
"Based on our review, we are not aware of any material modifications that should be made to the company’s assertion that their business travel GHG emissions total is in conformance with the requirements of the GHG Protocol Scope 3 Standard.”
Reasonable Opinion Example
"In our opinion the reporting company’s report/assertion that business travel emissions are 15, 200 tonnes CO2e is fairly stated, in all material respects, based on the criteria set forth in the assertion."
"In our opinion the reporting company’s assertion that business travel emissions are calculated in conformance with the scope 3 standard is fairly stated, in all material respects, based on the criteria set forth in the assertion."
3 10.4 Assurance Challenges and Choosing the Assurance Type 4 5 There are several challenges in assuring scope 3 inventories. Assurance challenges may be mitigated by 6 selecting the correct assurance model. Table 10.3 provides a list of possible challenges and suggested 7 solutions to mitigate these challenges. 8 9 One of the primary challenges with scope 3 assurance is the assurer’s limited ability to obtain sufficient 10 appropriate evidence, because scope 3 activities are removed from the reporting company’s control (see 11 Figure 10.4). To address this challenge, companies and assurance providers may: 12 13
1. Change the level or type of assurance; or 14 2. Create a modular framework for the assurance that can be aggregated across the scope 3 activities 15
in the reporting company’s assertion. 16 17 18

DRAFT FOR STAKEHOLDER REVIEW – NOVEMBER 2010
85
Figure 10.4: Emission Scopes, Activities, and Distance from Reporting company 1 2
3 4 5 Table 10.3: Common Assurance Challenges and Assurance Type Solutions 6 7 Theme Challenges Example Possible Assurance
Types The subject matter may be removed from the reporting company’s control
• Determining reasonable estimates over a subject matter when the reporting company does not have information (e.g., estimates for distances by third party transportation carriers)
• Establishing whether the evidence originates from an adequate control environment (e.g., determining the data management system)
• Accessing information and documentation from downstream activities (e.g., a television manufacturer may make assumptions about consumers’ use of its products)
• Accessing information and documentation from upstream activities information that is contractually restricted (e.g., a supplier may be unwilling or unable to provide the reporting company with reliable evidence)
Manufacture of silicon chips in Taiwan for televisions assembled and sold in North America
Modular assurance allows for a television company's assurer to rely on another assurer's conclusion on the emissions of the silicon chip supplier.
Model assurance allows for an assessment of the assumptions that underlie the emissions calculations for the manufacturer of the silicon chips
Scope 1 Emissions
Scope 2 Emissions
Upstream Downstream
Reporting company

DRAFT FOR STAKEHOLDER REVIEW – NOVEMBER 2010
86
Scope 3 activities may be diverse and dynamic, and consistent assurance criteria may be difficult to apply
• Identifying and consistently evaluating calculation models against the assurance criteria (e.g., the product boundary of LCA data)
• Developing suitable criteria for all types of scope 3 emissions
• The calculations methods to determine the scope 3 emissions may be unknown or highly uncertain
Distribution networks for materials to the reporting company change significantly over the reporting period due to economic conditions
Model assurance allows for an assessment of the assumptions that underlie the emissions for distribution networks
A waste and recycling company uses incinerator to dispose of multiple waste stream, of which the composition changes on a daily basis
Model assurance allows for an assessment of the assumptions that underlie the emissions for the incinerator
Scope 3 inventories may include emissions based on estimations
• The calculations methods to determine the scope 3 emissions may be unknown or highly uncertain
Emissions from operating an automobile for a car manufacturer
Model assurance allows for assertions on future events
Confidentiality of the criteria needs to be maintained for competitive reasons
• The calculation methods may be proprietary or confidential (e.g., calculation of emissions for highly technical products (e.g., catalysts, electronic components, etc.) supplied to the reporting company).
Emissions from a supplier’s operations
Modular assurance allows for the supplier’s emissions to be assured by an assurer independent of the scope 3 inventory
1 Combining types of assurance 2 3 Companies should use one model of assurance for all of the reporting company’s scope 3 emissions to ease 4 reporting and the understanding of intended users; however, this may not be feasible in all situations. When 5 a combination of models of assurance are used, it should be made clear in the assurance report the scope of 6 application of the assurance models and the assurance provided. 7 In most cases, model assurance will be an appropriate type for scope 3 emissions assurance. 8 9 10.4 Preconditions for assurance 10 11 Assurance requires certain conditions to be in place in order for a conclusion to be expressed. Illustrated 12 below are the challenges in providing assurance over scope 3 emissions. In particular, Table 10.3 describes 13 different types of assurance that the reporting company may select in order to address these challenges. 14 15 There are preconditions for assurance, which apply regardless of whether the assurance provided is internal 16 or external to the company, including: 17 18
• The company’s written assertion(s) 19 • An appropriate subject matter 20 • Suitable criteria that are sufficiently complete and measurable to permit assurance and available to 21
the intended users 22 • Access to sufficient and appropriate evidence (i.e., invoices, bills of sale, etc.) 23
24 Reporting company’s written assertion(s) 25 26 The reporting company is responsible for the assertion, but the reporting company might not be responsible 27 for the subject matter itself. 28 29 If assurance is performed, it should be provided on total scope 1, 2, and 3 emissions. 30

DRAFT FOR STAKEHOLDER REVIEW – NOVEMBER 2010
87
The reporting company prepares the written assertion and is thus is also responsible for: 1 2
• Designing, implementing and maintaining controls relevant to the preparation and presentation of the 3 written assertion; 4
• Selecting and applying appropriate quantification methods; and 5 • Making reasonable emissions calculations 6
7 Table 10.2 provides examples of written assertions for different assurance types and levels. 8 9 Appropriate subject matter 10 11 Once a company determines the activities included in its scope 3 boundary, appropriate subject matter can 12 be determined. The components of the inventory report (data, calculation methodologies, etc.) and inventory 13 quality control mechanisms may be appropriate subject matter. The type of assurance performed will 14 determine which subject matter(s) should be assessed. The data management plan contains information on 15 subject matter assurers may review (see Appendix E). The data management plan should be made available 16 to assurers at the start of the assurance process. 17
18 If the subject matter is not capable of consistent measurement or does not have procedures designed to 19 gather sufficient appropriate evidence, it would be inappropriate to render an assurance conclusion. 20 21 Suitable assurance criteria 22 23 Just as this standard follows GHG accounting and reporting principles (i.e., relevance, completeness, 24 consistency, transparency and accuracy), assurance providers often rely on suitable assurance criteria that 25 are measurable and based on similar principles (i.e., relevant, complete, reliable, neutral and 26 understandable).24
28 27
Appropriate evidence 29 30 There needs to be sufficient appropriate evidence for the reporting company to make an assertion and for 31 the assurer to support their conclusion. 32 33 Sufficiency is the measure of the quantity of evidence. Sufficient evidence is a question about how much 34 evidence is necessary and how it is evaluated based on professional judgment. If another person could 35 reach the same conclusion on the same evidence, then it is likely that the evidence is sufficient. 36 37 Appropriateness is the measure of the quality of evidence; that is, its relevance and its reliability. For 38 evidence to be relevant, it needs to assist in achieving the objectives of the assurance. The reliability of 39 evidence is influenced by its source and nature. 40 41 While recognizing that exceptions may exist, the following is an illustrative hierarchy of the reliability of 42 suitable evidence which the company needs to consider as it compiles data for the inventory report: 43 44
• Evidence is more reliable when it is obtained from knowledgeable independent sources outside the 45 company (e.g., actual utility invoices vs. internally estimated based on square footage). 46
• Evidence that is generated internally is more reliable when it is corroborated by other data generated 47 from independent systems. 48
• Evidence that is generated internally is more reliable when there are effective related controls. 49 • Evidence obtained directly by the assurer (e.g., observation of the application of controls) is more 50
reliable than evidence obtained indirectly (e.g., inquiry about the application of controls). 51 • Evidence is more reliable when it is based on standardized processes and controls, and documented 52
at the same time it is generated (e.g. employee expense reports for miles traveled vs. asking 53 employees to estimate mileage). 54 55
24 International Federation of Accountants

DRAFT FOR STAKEHOLDER REVIEW – NOVEMBER 2010
88
10.5 The concept of materiality 1 2 Materiality refers to the risk that errors, omissions and misrepresentations can affect the accuracy or validity 3 of an assertion. 4 5 Materiality has both quantitative and qualitative aspects and thresholds are typically set by the assurer. A 6 misstatement may be quantitatively material in isolation or in aggregate. A material misstatement is a 7 broader concept than that of a material discrepancy as a misstatement can occur as a result of qualitative 8 disclosures in addition to the quantitatively disclosed subject matter. 9 10 Quantitative materiality is typically calculated as a percentage of the inventory (in total or on an individual line 11 item basis). In determining the quantitative materiality benchmark, assurers should contemplate the risk (the 12 likelihood and magnitude of a potential misstatement) and the history of previous restatements. 13 Qualitative misstatements tend to be those that have immaterial quantitative effects but could materially 14 affect the reporting company’s emissions in the future and those that mislead the intended user. 15 16 The assurer should also consider qualitative misstatements during the evaluation of the evidence and the 17 decisions made about the assurance statement. The assurer should be alert throughout the assurance for 18 qualitative misstatements. 19 20 The concept of uncertainty is not addressed here as it is not a known error, rather an indicator of how well 21 the data represents the scope 3 emission sources. 22 23 Factors that could contribute to potential material misstatements include: 24 25
• A lack of a well controlled data management system for GHG emissions 26 • A non-disclosure of the reason behind emission changes (e.g., change in calculation methodologies 27
vs. change in actual emissions) 28 • Disclosure of emissions but not the individual activities that comprise the emissions to the assurer. 29
30 The assurer and reporting company should determine an appropriate threshold or benchmark of materiality 31 during the assurance process. This threshold or benchmark should be disclosed in the assurance 32 conclusion. 33 34 10.6 Assurer’s written conclusion 35 36 The assurer's conclusion conveys the assurance obtained about the subject matter and may take different 37 forms depending on whether the company is conducting internal assurance and also depending on the third 38 party assurance provider's professional standards and requirements. It should be noted however that the 39 written conclusion related to the assurance of the company's assertions should generally include the 40 following but the format may vary: 41 42 Introduction 43 44
• An identification and description of the subject matter information and the period of time to which the 45 evaluation or measurement of the subject matter relates 46
• A reference the reporting company’s assertion that is available to the intended users 47 • Identification of the criteria 48
49 50

DRAFT FOR STAKEHOLDER REVIEW – NOVEMBER 2010
89
Description of Assurance Process 1 2
• Description of the reporting company's and assurer’s responsibilities 3 • The standard to which the assurance was performed 4 • A summary of the work performed (including the type and level of assurance ) 5
6 Conclusion Paragraph 7 8
• The assurer's conclusion regarding the results of the assurance over the company's assertion with 9 any additional details regarding exceptions noted or issues encountered in performing the 10 assurance. 11 12
The assurance criteria should be made available in the report. The main method of disclosure of the criteria 13 is to cite a standard (e.g., the GHG Protocol Scope 3 Standard) or to provide the criteria in the assertion. 14 The relative detail of the criteria will depend on the relative size or importance of the emissions associated 15 with the criteria. 16 17 When there are material departures in the assertion from the criteria, the reporting company should disclose: 18 19
• That the assertion is presented fairly 20 • It has complied with the criteria with the exception those noted The specific criteria that it has 21
departed from, the nature of the departure, including the treatment that the criteria would require, the 22 reason why that treatment would be so misleading, and the treatment adopted; and 23
• The effect of the departure 24 25
DRAFT FOR STAKEHOLDER REVIEW – NOVEMBER 2010
90
11 Reporting 1 2 Requirements in this chapter See Section 11.1 below. 3 A credible corporate GHG emissions report presents relevant information that is complete, consistent, 4 accurate and transparent. A public GHG report should: 5 6
• Be based on the best data available at the time of publication, while being transparent about its 7 limitations 8
• Communicate any material discrepancies identified in previous years 9 • Report any exclusions made, along with the justification for exclusions 10 • Report the company’s emissions and sinks separately 11 • Report the inventory results for the chosen inventory boundary separate from and independent of 12
any GHG trades engaged in. 13 14 11.1 Required information 15 16 Companies shall report all scope 3 emissions, following the requirements in this standard, in addition to 17 reporting all scope 1 and 2 emissions according to the GHG Protocol Corporate Standard. 18 19 A public GHG emissions report that is in accordance with the GHG Protocol Scope 3 Standard shall include 20 the following information: 21 22
• A description of the company and inventory boundary, including the consolidation approach chosen 23 and a description of the businesses and operations included in the boundary 24
• The reporting period covered 25 • Total scope 1 emissions and total scope 2 emissions 26 • Scope 3 emissions reported separately by scope 3 category 27 • Emissions data for CO2, CH4, N2O, HFCs, PFCs, SF6 in tonnes of CO2 equivalent 28 • A list of scope 3 activities included in the report 29 • A list of scope 3 activities excluded from the report with justification of their exclusion 30 • Year chosen as scope 3 base year; rationale for choosing the base year; an emissions profile over 31
time that is consistent with and clarifies the chosen policy for making base year emissions 32 recalculations; and appropriate context for any significant emissions changes that trigger base year 33 emissions recalculations 34
• For each scope 3 category, a description of the methodologies, allocation methods, and types and 35 sources of data used to calculate scope 3 emissions (including emission factors and GWP values) 36
• For each scope 3 category, a description of the accuracy and completeness of reported scope 3 37 emissions data (see Chapter 2 for guidance on accuracy and completeness; Section 6.2 for 38 guidance on data quality; and Appendix D for guidance on uncertainty) 39
• For each scope 3 category, the percentage of emissions calculated using primary data 40 • Total supplier scope 1 and scope 2 emissions data, allocated to the reporting company using a 41
consistent metric and reported separately from the reporting company’s scope 1, scope 2 and scope 42 3 emissions 43
• The methodology used to quantify and allocate supplier emissions data 44 • The percentage of Tier 1 suppliers accounted for (as a percentage of the reporting company’s total 45
spend) 46 47 11.2 Optional information 48 49 A public GHG emissions report should include, when applicable, the following additional information: 50 51

DRAFT FOR STAKEHOLDER REVIEW – NOVEMBER 2010
91
• Emissions data further disaggregated within scope 3 categories where this adds relevance and 1 transparency (e.g., reporting by different categories of purchased materials or product types) 2
• Qualitative information about emission sources not quantified 3 • Additional qualitative explanations to provide context to the data 4 • Quantitative assessments of data quality or uncertainty 5 • The percentage of total anticipated scope 3 emissions that has been accounted for and reported 6 • Relevant performance indicators and intensity ratios 7 • Information on the company’s GHG management and reduction activities, including supplier 8
engagement strategies, product GHG reduction initiatives, etc. 9 • Information on avoided emissions from the use of sold products 10 • Information on purchases of GHG reduction instruments, such as emissions allowances and offsets, 11
from outside the inventory boundary 12 • Information on reductions at sources inside the inventory boundary that have been sold/transferred 13
as offsets to a third party 14 • An outline of any assurance provided and an assurance statement of the reported emissions data 15
16 Optional information on supplier/partner engagement and performance 17 18 Because scope 3 emissions include the scope 1 and 2 emissions of a company’s partners in the value chain 19 (including suppliers, customers, service providers, etc.), reporting on a company’s efforts to engage their 20 partners in the value chain provides additional transparency on a company’s scope 3 management and 21 reduction activities. 22 23 A public GHG emissions report should include, when applicable, the following additional information: 24 25
• Partner engagement metrics, such as the number and percentage of suppliers and other partners 26 that have: 27
o Received a request from the reporting company to provide primary GHG emissions data 28 o Provided primary GHG emissions data to the reporting company 29 o Publicly reported entity-wide GHG emissions 30 o Established a publicly available entity-wide GHG reduction target 31
• Partner performance metrics, including the GHG emissions performance of suppliers and other 32 partners over time 33
• Other relevant information 34 35 Optional information on product performance 36 37 A public GHG emissions report should include, when applicable, the following additional information: 38 39
• Information on the GHG emissions and energy efficiency of a company’s product portfolio 40 • Product performance metrics and intensity ratios such as the fuel efficiency of sold vehicles, the 41
energy efficiency of sold appliances and electronics, the GHG intensity of sold fuels, etc. 42 • The percentage of sold products that are compliant with energy efficiency standards, regulations, 43
and certifications, where applicable 44 • Other relevant information 45
46 11.3 Uncertainty in scope 3 reporting 47 48 Companies should describe the level of uncertainty of reported data to ensure transparency and avoid 49 misinterpretation of data. In cases where data uncertainty is high, companies should also describe efforts to 50 address uncertainty. See Appendix D for more information on uncertainty. 51 52 See Appendix A for a sample reporting form.53

92
Appendix A: Sample Scope 3 Reporting Form 1 2 This sample reporting form illustrates the reporting requirements of the Scope 3 Standard. Companies 3 may use any format to report emissions, provided that it contains all of the reporting requirements of the 4 Scope 3 Standard. 5 6 7 Part 1: Descriptive Information 8 9
Descriptive Information Company Response Company name Description of the company Chosen consolidation approach (equity share, operational control or financial control)
Description of the businesses and operations included in the company’s organizational boundary
The reporting period covered A list of scope 3 activities included in the report A list of scope 3 activities excluded from the report with justification of their exclusion
Year chosen as scope 3 base year and rationale for choosing the base year An emissions profile over time that is consistent with and clarifies the chosen policy for making base year emissions recalculations, and context for any significant emissions changes that trigger base year emissions recalculations
10 Part 2: Greenhouse Gas Emissions Data
Greenhouse Gas Emissions Metric tons CO2e
Scope 1: Direct Emissions from Owned/Controlled Operations Scope 2: Indirect Emissions from the Use of Purchased Electricity, Steam, Heating & Cooling Scope 3: Other Indirect Emissions Upstream Scope 3 Emissions
1. Purchased Goods & Services 2. Capital Goods 3. Fuel- and Energy-Related Activities (Not Included in Scope 1 or 2) 4. Transportation & Distribution 5. Waste Generated in Operations 6. Business Travel 7. Employee Commuting 8. Leased Assets (Not Included in Scope 1 or 2) 9. Investments (Not Included in Scope 1 or 2)
Other Downstream Scope 3 Emissions
10. Transportation & Distribution of Sold Products 11. Processing of Sold Products 12. Use of Sold Products 13. End-of-Life Treatment of Sold Products 14. Leased Assets (Not Included in Scope 1 or 2) 15. Franchises (Not Included in Scope 1 or 2)
Other CO2 from Biomass Combustion
Supplier Greenhouse Gas Emissions Supplier emissions (metric tonnes CO2e) Percentage of all Tier 1 suppliers accounted for (as a percentage of the reporting company’s total spend)
Description of methodology used to quantify and allocate supplier emissions data

93
Part 3: Description of Methodologies and Data Used
Information on Methodologies and Data Used in the Scope 3 Inventory
Description of methodologies and types and sources of data used to calculate emissions
Description of the accuracy and completeness of reported emissions data
Percentage of emissions calculated using primary data
Upstream Scope 3 Emissions 1. Purchased Goods & Services 2. Capital Goods 3. Fuel- and Energy-Related Activities (Not Included in Scope 1 or 2)
4. Transportation & Distribution (Upstream) 5. Waste Generated in Operations 6. Business Travel 7. Employee Commuting 8. Leased Assets (Not Included in Scope 1 or 2) 9. Investments (Not Included in Scope 1 or 2) Other Downstream Scope 3 Emissions 10. Transportation & Distribution of Sold Products
11. Processing of Sold Products 12. Use of Sold Products 13. End-of-Life Treatment of Sold Products
14. Leased Assets (Not Included in Scope 1 or 2)
15. Franchises (Not Included in Scope 1 or 2)
Other
Supplier Emissions

DRAFT FOR STAKEHOLDER REVIEW – NOVEMBER 2010
94
Appendix B: Accounting for Emissions from Leased Assets 1 2 Introduction25
4 3
Many companies either lease some of their assets (e.g., buildings, vehicles) to other entities, or lease assets 5 from other entities. This appendix explains whether to account for emissions from leased assets as scope 1 6 emissions, scope 2 emissions, scope 3 emissions in Category 9 (Leased Assets, Upstream), or scope 3 7 emissions in Category 14 (Leased Assets, Downstream). 8 9 How emissions from leased assets are accounted for in a company’s GHG inventory depends on the 10 company’s selected organizational boundary approach (i.e., equity share, financial control or operational 11 control), and the type of lease. This guidance has been designed to ensure that the categorization of 12 emissions from leased assets does not lead to any double-counting of emissions in scopes 1 and 2. 13 14 Differentiating Types of Leased Assets 15 16 The first step in determining how to categorize emissions from leased assets is to understand the two 17 different types of leases: finance or capital leases and operating leases. One way to determine the type of 18 lease is to check the company’s audited financial statements. 19 20
• Finance or capital lease: This type of lease enables the lessee to operate an asset and also gives 21 the lessee all the risks and rewards of owning the asset. Assets leased under a capital or finance 22 lease are considered wholly owned assets in financial accounting and are recorded as such on the 23 balance sheet. 24
• Operating lease: This type of lease enables the lessee to operate an asset, like a building or vehicle, 25 but does not give the lessee any of the risks or rewards of owning the asset. Any lease that is not a 26 finance or capital lease is an operating lease.26
28 27
Lessee’s Perspective: Categorizing Emissions from Leased Assets 29 30 The next step is to determine whether the emissions associated with the leased assets are categorized as 31 direct (scope 1) emissions or indirect (scope 2 or 3) emissions in the company’s operational boundary. 32 Proper categorization of emissions from leased assets by lessors and lessees ensures that emissions in 33 scopes 1 and 2 are not double-counted. For example, if a lessee categorizes emissions from the use of 34 purchased electricity as scope 2, the lessor categorizes the same emissions as scope 3, and vice versa. 35 36
• Finance or capital lease. Under a finance or capital lease, the lessee is considered to have 37 ownership and both financial and operational control of the leased asset. Therefore, emissions 38 associated with fuel combustion27
• Operating lease. Under an operating lease, the lessee is considered not to have ownership or 42 financial control but to have operational control of the leased asset. Therefore, the categorization of 43 emissions as direct or indirect depends on the organizational boundary approach selected. If the 44 lessee uses the equity share or a financial control approach, the emissions associated with fuel 45 combustion as well as with the use of purchased electricity are always categorized as scope 3 46 (indirect). But if the lessee uses the operational control approach, emissions associated with fuel 47 combustion are categorized as scope 1 (direct), and emissions associated with the use of purchased 48 electricity are categorized as scope 2 (indirect) (see Table B.1). 49
are categorized as scope 1 (direct), and emissions associated with 39 use of purchased electricity are categorized as scope 2 (indirect), regardless of the organizational 40 boundary approach selected (see Table B.1). 41
50 25 This text is adapted from Appendix F to the GHG Protocol Corporate Accounting and Reporting Standard – Revised Edition, June 2006, Version 1.0, provided on the GHG Protocol website, at www.ghgprotocol.org. 26 Financial Accounting Standards Board, Statement of Financial Accounting Standards, no. 13, “Accounting for Leases” (1976). 27 For simplicity, this appendix uses fuel combustion as shorthand for all direct emissions. There are other sources of direct emissions (e.g., emissions from industrial processes and fugitive emissions). For other sources of direct emissions, companies should follow the leasing guidance described for fuel combustion.

DRAFT FOR STAKEHOLDER REVIEW – NOVEMBER 2010
95
Indirect emissions from the use of purchased electricity may sometimes be categorized as scope 3 instead of 1 scope 2. This is the case when a leased building is held under an operating lease and the organizational 2 boundary approach used is either equity share or financial control. 3 4 Table B.1: Emissions from Leased Assets: Leasing Agreements and Boundaries (Lessee’s 5 Perspective) 6 7
Type of Leasing Arrangement Finance/Capital Lease Operating Leased
Equity Share or Financial Control Approach Used
Lessee does have ownership and financial control, therefore emissions associated with fuel combustion are scope 1 and use of purchased electricity are scope 2.
Lessee does not have ownership or financial control, therefore emissions associated with fuel combustion and use of purchased electricity are scope 3 (Leased Assets, Upstream).
Operational Control Approach Used
Lessee does have operational control, therefore emissions associated with fuel combustion are scope 1 and use of purchased electricity are scope 2.
Lessee does have operational control, therefore emissions associated with fuel combustion are scope 1 and use of purchased electricity are scope 2.28
8 Lessor’s Perspective: Categorizing Emissions from Leased Assets 9 10 Some companies may lease assets to other companies, for example, real estate companies that lease office 11 or retail space or vehicle companies that lease vehicle fleets. Whether emissions from these assets are 12 categorized by the lessor as direct (scope 1) or indirect (scope 2 or 3) depends on the organizational 13 boundary approach and the type of leasing arrangement. 14 15
• Finance or capital lease. The lessor does not have ownership or financial or operational control of 16 these assets. Therefore, the associated emissions always are scope 3 (indirect) for the lessor, 17 regardless of the type of organizational boundary approach used (see Table B.2). 18
• Operating lease. The lessor has ownership and financial control of these assets but not operational 19 control. Therefore, if the equity share or a financial control approach is used, the emissions 20 associated with fuel combustion are categorized as scope 1 (direct), and the emissions associated 21 with the use of purchased electricity are categorized as scope 2 (indirect) for the lessor. However, if 22 the operational control approach is used, emissions from fuel combustion and the use of purchased 23 electricity will always be scope 3 (indirect) for the lessor (see Table B.2). 24
25 Table B.2: Emissions from Leased Assets: Leasing Agreements and Boundaries (Lessor’s 26 Perspective) 27 28
Type of Leasing Arrangement Finance/Capital Lease Operating Lease
Equity Share or Financial Control Approach Used
Lessor does not have ownership or financial control, therefore emissions associated with fuel combustion and use of purchased electricity are scope 3 (Leased Assets, Downstream).
Lessor does have ownership and financial control, therefore emissions associated with fuel combustion are scope 1 and use of purchased electricity are scope 2.
Operational Control Approach Used
Lessor does not have operational control, therefore emissions associated with fuel combustion and use of purchased electricity are scope 3 (Leased Assets, Downstream).
Lessor does not have operational control, therefore emissions associated with fuel combustion are and use of purchased electricity are scope 3 (Leased Assets, Downstream).29
28 Some companies may be able to demonstrate that they do not have operational control over a leased asset held under an operating lease. In this case, the company may report emissions from the leased asset as scope 3 as long as the decision is disclosed and justified in the public report. 29 Some companies may be able to demonstrate that they do have operational control over an asset leased to another company under an operating lease, especially when operational control is not perceived by the lessee. In this case, the

DRAFT FOR STAKEHOLDER REVIEW – NOVEMBER 2010
96
Appendix C: Guidance for Collecting Data from Suppliers 1 2 This appendix provides: 3 4
• Internal planning guidance on key decisions to make prior to engaging with suppliers, and 5 • Guidance on working with suppliers to collect GHG data. 6
7 Internal Planning Guidance 8 9 Collecting scope 3 greenhouse gas (GHG) inventory data from suppliers can be a major undertaking. 10 Companies should develop an internal strategy for collecting GHG emissions data from its value chain 11 partners. The internal strategy should address the following key components: 12 13
1. Identify the internal departments relevant to data collection 14 2. Identify and categorize suppliers 15 3. Engage the procurement staff 16 4. Select a method for managing supplier GHG data 17
18 Each step is described in more detail below. 19 20 1. Identify the Internal Departments Relevant to Data Collection 21 22 Companies should determine if the company is currently surveying its supply chain on other environmental 23 or social responsibility aspects of their business. If an assessment program is already in place, it is helpful to 24 coordinate the GHG inventory collection program with existing activities to ensure a consistent, coordinated 25 approach throughout the supply chain and to minimize the burden for suppliers. It is also important to work 26 with the executives of suppliers that are responsible for their environmental and/or social responsibility report 27 to get their support for the scope 3 data collection process. 28 29 Companies should first identify the internal organizations that are critical to the success of the data collection 30 process. This may be the procurement organization, but companies may also need the support and 31 involvement of individual business units or lines of business. Typically, environmental survey activities 32 originate in the Environmental Affairs, Environmental Health & Safety, or Social Responsibility group within a 33 company. While one of these groups may originate the program, the program itself may be best executed 34 through and with the support of the procurement organization, as they typically have the responsibility for 35 managing the supply chain. In some companies, the procurement organization has assigned an individual or 36 department to manage environmental and material issues in the supply chain. This individual or group could 37 be valuable to the success of the effort. 38 39 There are two possible organizational approaches by which companies can execute this program: 40 41
• Place responsibility for coordinating the program with the environmental or social responsibility staff 42 and have them manage and coordinate the program through the procurement staff, or 43
• Assign a program manager in the procurement organization with responsibility to interface with the 44 environmental team and manage the program across the procurement organization. 45
46 There may also be other project management approaches that are more suitable for an organization. 47 Regardless of the approach chosen to execute this effort, it is essential to get a strong executive sponsor 48 within the procurement organization to secure and maintain organizational support for the process to collect 49 GHG inventories from a company’s suppliers. 50 2. Identify and Categorize Suppliers 51 52 To best manage supplier selection, the first step is to get a comprehensive supplier list that details the 53 supplier name, address, procurement contact; supplier type (production-related or non-production-related), 54 commodity or service type, and the annual spend with that supplier. Ideally, this full range of data is 55 lessor may report emissions from fuel combustion as scope 1 and emissions from the use of purchased electricity as scope 2 as long as the decision is disclosed and justified in the public report.

DRAFT FOR STAKEHOLDER REVIEW – NOVEMBER 2010
97
available, but it may be that only a subset of the listed data is available. Consulting with the procurement 1 agents responsible for the suppliers may allow for filling in some or all of the missing data. The less data that 2 is available, the more difficult it may be to develop a supplier selection process. For some companies, 3 depending on the number of suppliers and availability of supplier information, creating a comprehensive list 4 may be feasible. If the task becomes time- or cost-prohibitive, companies should list suppliers by function 5 and collect information for the top suppliers according to spend within each function. 6 7 As a company gathers data over time, it will gain an understanding of the GHG inventories of different 8 commodity and service types and the ability of different parts of the supply chain to provide GHG inventory 9 data. This information will allow a company to determine what parts of the supply chain need assistance in 10 compiling their GHG inventories and direct them to appropriate resources to assist them in their efforts. 11 12 3. Engage Procurement Staff 13 14 Once the preliminary supplier selection is completed, the procurement staff responsible for the chosen 15 commodity types should assess the chosen list of suppliers for appropriateness and applicability. They will 16 be aware of plans to add or remove specific suppliers or modify supply agreements which will make it 17 inadvisable to query some suppliers and necessary to include others. In addition, this assessment allows the 18 procurement team to have input in the supplier selection process and ensure their buy-in to the process. 19 20 As part of this assessment process, it is important to educate the procurement team on the program, 21 explaining the reasons the survey is important, the mechanics of the data collection process, tips for dealing 22 with suppliers (including a list of frequently asked questions), and the importance of clearly explaining the 23 program to the supplier. Companies should also communicate that there is executive support for the 24 program. Having the understanding and support of the procurement team is important to achieving a 25 successful data collection program. 26 27 4. Select a Method to Manage Supplier GHG Data 28 29 Selecting a data collection method is a critical piece of implementing a business process to collect supply 30 chain GHG data. There are several options available for collecting and managing data: 31
32 1. Create an internal data collection system through an internally designed spreadsheet, an online 33
system, or through the use of a commercially available GHG management software package. 34 Chapter 6 details data types and formatting for a collection system. 35
2. Work with an industry consortium to develop or use a data collection methodology and system to 36 collect data for that industry group (see Example). 37
3. Work through an existing GHG reporting/disclosure program 38 39
While a spreadsheet system provides a simple, easily implementable survey tool, it may be an inefficient 40 approach for suppliers that have to fill out multiple surveys for their customers. A spreadsheet system also 41 does not lend itself to analysis unless it is designed to be exported into a database tool for easy data 42 manipulation and reporting. 43 44 Implementing an automated or web-based system for data management will benefit both the reporting 45 company and its suppliers. Partnering with suppliers and customers to use a common system will allow 46 companies to collect the data once and use it many times, enabling optimization of the data collection and 47 analysis process. 48 49 50

DRAFT FOR STAKEHOLDER REVIEW – NOVEMBER 2010
98
Box C.1: Collecting Data Using Standardized Formats 1 2 Companies should establish robust data collection formats that document the data sources to ensure the activity data is collected on an approved, consistent basis to allow year on year and partner to partner comparability. A standardized format reduces the risk of errors and provides transparent documentation to enable consistent recalculations. The data collection format should include:
• Description of emission sources and scope • Boundary details • Reporting period • Comparability with previous years • GHG calculation methodologies • Details of emission factors and data sources • Discussion of uncertainties • Trends evident in data (if applicable) • Progress towards targets (if applicable) • Description of events affecting data (if applicable) • Ratio indicators needed for allocation (see Chapter 8) • And any other relevant information
3 Box C.2: Managing Confidential and Proprietary Data 4 5 When collecting emissions data from value chain partners, companies may encounter situations where certain data are considered confidential or proprietary by the data provider. While some companies may provide data without any use restrictions, others may require that the data provided be protected from disclosure and not used for any purpose other than the purpose specified by the data provider. To allow use of data considered confidential, the parties may enter into “confidentiality” or “non-disclosure” agreements that define terms of data use and disclosure. Such agreements protect data since violating use and disclosure provisions in legally binding documents have legal consequences, particularly if harm to the data provider can be demonstrated as a result of unauthorized disclosure. Whenever data representing a specific organization are used to calculate a scope 3 inventory, companies should consult with the data provider to determine if there are any restrictions regarding data use and disclosure. Companies should also inform the data provider how data will be used and ask for written permission to use the data for that purpose. Companies should also be aware of legal regimes concerning anti-competitiveness. A company may have multiple suppliers for similar components of products and similar services. Each supplier’s data should be given the applicable standard of protection. Both the reporting company and the value chain partner should have in place and enforce:
• Applicable standards of data protection for their information assets • Sound privacy practices that protect the data of its employees, customers, suppliers, and others • Applicable standards that enable compliance with anti-competitiveness laws in the relevant
countries
6 7

DRAFT FOR STAKEHOLDER REVIEW – NOVEMBER 2010
99
Guidance for Working with Suppliers 1 2 A critical aspect of working with suppliers is communicating the importance and requirements of the program 3 to the supply chain. These communications should take place throughout the data collection process. There 4 are several key steps. 5 6
1. Announce the program to the supply chain before sending any survey forms. 7 2. Provide a training or information session on the data collection methodology. 8 3. Check-in periodically with suppliers regarding their progress on completing the survey. 9 4. Determine the consequences for suppliers that choose not to respond. 10 5. Assess data quality and follow up with suppliers to resolve data questions and thank them for 11
participating. 12 13 Each step is described in more detail below. 14 15 1. Announce the program to the supply chain before sending suppliers any survey forms. This 16
communication can have three or more parts. 17 18
a. Prior to sending the survey or data collection form, the procurement team should send a letter to 19 their supplier counterparts explaining the program, its importance and any consequences 20 associated with not participating, how the data will be collected and used and assurance that 21 data will be kept confidential, available resources to assist in the response to the survey, and the 22 survey schedule. The letter should request the name of the individual responsible for preparing 23 and disclosing the supplier’s emissions data. Identification of this individual at the beginning of 24 the process will enable companies to direct the survey to the responsible person at the supplier, 25 avoiding delays in the survey process. The letter should also offer a phone call with the 26 appropriate member(s) of the environmental staff if the supplier wishes to further discuss the 27 program details. 28 29
b. Send a letter from the appropriate procurement executive to their executive counterpart at the 30 supplier. This should provide an explanation of the program and its importance to the company 31 and request the supplier’s participation in the survey effort. 32 33
c. During any supplier forums, present a module on the GHG inventory program, explaining the 34 reasons for the program and the mechanics of the survey process. 35 36
2. Provide a training or information session on the data collection methodology. 37 38
a. A letter and information packet should be sent to the person identified as the GHG inventory 39 contact for each supplier with a copy to the supplier contact. 40 41
b. Companies should schedule one or more training or information sessions on the reporting 42 spreadsheet or software tool. This session should be designed to familiarize the supplier’s 43 representative with the data collection process and provide them the information they need to 44 undertake the data reporting. Suppliers vary widely in knowledge of GHG accounting. Some 45 suppliers are unfamiliar with GHG inventories while other suppliers have already been tracking 46 energy and emissions data. Additional guidance may be required for suppliers who are reporting 47 for the first time. It is best to schedule sessions that align with the working hours of the supplier’s 48 representative. 49
50 c. Maintain a “Help Desk” or Help Person to whom inquiries about the system can be directed. 51
Having a contact that is responsive and knowledgeable about data collection tools and 52 processes will be critical to the success of the program. 53 54
3. Have the procurement team periodically query the suppliers regarding their progress on completing the 55 survey and any questions they may have. This part of the process is simplified by using a web-based or 56 online reporting system that allows the tracking of supplier progress. Regular follow-up underlines the 57 importance the company places on getting the inventory completed. 58

DRAFT FOR STAKEHOLDER REVIEW – NOVEMBER 2010
100
1 4. Companies should have a clear strategy for dealing with suppliers that choose not to respond to the 2
survey, including consequences and follow-up actions for suppliers and requirements that they provide 3 data in the future, so a clear message is communicated across the supply chain. Failure to communicate 4 clear consequences for not participating will dilute the value of the data collection process and make it 5 more difficult to get data collected in subsequent years. 6
7 5. When the data is completed, take the time to assess each supplier’s input for quality against the data 8
quality indicators. If questions arise, follow up with the supplier to resolve them, and where data is 9 complete, send the supplier a note indicating that the company has reviewed the data, found it complete 10 and thanking them for their efforts. In addition, it is advisable to send a follow-up letter from the 11 procurement executive. There should be one letter thanking those who supplied data and a letter to 12 those that did not complete the survey requesting assurances that the supplier will be prepared to 13 provide data in the next year. 14
15 Clear, concise and regular communication with the supplier is integral to the success in gathering a 16 meaningful scope 3 inventory from the supply chain. If the reporting company does not show committed 17 interest in the program, its supply chain will not take the program seriously. Even with a committed effort to 18 drive the program, it is likely to take several years to get the completeness and quality of the overall 19 inventory to a high level of confidence. Regular communications with and feedback to the supply chain on 20 the process and its results will help accelerate the relevance and quality of the inventory. 21
22

DRAFT FOR STAKEHOLDER REVIEW – NOVEMBER 2010
101
Appendix D: Uncertainty in Scope 3 Emissions 1 2 The appendix provides an overview of concepts and procedures for evaluating sources of uncertainty in a 3 scope 3 inventory. 4 5 1. Introduction 6 7 Understanding uncertainty can be crucial for properly interpreting scope 3 inventory results. Uncertainty of a 8 measurement characterizes the dispersion of values that could reasonably be attributed to the result of that 9 measurement.30
15
Documenting sources of uncertainty can assist companies in understanding the steps 10 required to help improve the inventory quality and the level of confidence users should have in the inventory 11 results. Because the audience for a GHG inventory report is diverse, companies should make a thorough yet 12 practical effort to communicate the level of confidence and key sources of uncertainty in the inventory 13 results. 14
2. Guide to the Uncertainty Assessment Process 16 17 Uncertainty assessment can be used within the GHG inventory process as a tool for ensuring the suitability 18 of data and guiding data quality improvements, as well as a tool for reporting uncertainty results. Companies 19 should identify and track key uncertainty sources throughout the inventory process and iteratively check 20 whether the confidence level of the results is adequate for the intended application. Identifying, assessing, 21 and managing uncertainty is most effective when done during the inventory process. 22 23 Companies may choose a qualitative and/or quantitative approach to uncertainty assessment. Quantitative 24 uncertainty assessment is not required, but can provide a more robust result that assists companies in 25 prioritizing data improvement efforts on the sources that contribute most to uncertainty and adding 26 transparency on uncertainty to users of the public report. Companies may wish to present both qualitative 27 and quantitative uncertainty information in the inventory report. Companies may also describe their efforts to 28 reduce uncertainty in future revisions of the inventory. 29 30 3. Overview of Uncertainty Types 31
32 Uncertainty is divided into three categories: parameter uncertainty, scenario uncertainty and model 33 uncertainty. Table D.1 illustrates these types of uncertainties and how each type can be represented. 34
Table D.1: Types of uncertainties, corresponding sources and representation 35 36 Types of Uncertainty Examples Representation in a Report
Parameter Uncertainty Uncertainty in Activity Data Represented as probability
distributions/range and/or as qualifications Uncertainty in Emission Factors
Scenario Uncertainty Uncertainty in Methodologies Represented as multiple
outcomes, probability distributions/range, and/or as qualifications
Uncertainty in Situations
Model Uncertainty Limitations of Models Represented as qualifications 37
Parameter Uncertainty 38 Parameter uncertainty is uncertainty regarding whether a value used in the inventory accurately represents 39 the activity in the company’s value chain. If parameter uncertainty can be determined, it can typically be 40 represented as a probability distribution of possible values which include the chosen value used in the 41 inventory results. In assessing the uncertainty of a result, parameter uncertainties can be propagated within 42
30 International Organization for Standardization. ISO/IEC Guide 98:1995. Guide to the expression of uncertainty in measurement

DRAFT FOR STAKEHOLDER REVIEW – NOVEMBER 2010
102
a model to provide a quantitative measure (also as a probability distribution) of uncertainty in the final 1 inventory result. 2
Single Parameter Uncertainty 3 Single parameter uncertainty refers to incomplete knowledge about the true value of a parameter. Parameter 4 uncertainty addresses how well data used to represent a parameter fits a given activity. Measurement errors, 5 inaccurate approximation, and how the data was modeled to fit the conditions of the activity influence 6 parameter uncertainty. For example, two data points of similar measurement accuracy may result in very 7 different levels of uncertainty depending on the points represent the given activity’s context. 8 9 EXAMPLE
15
: An emission factor for the production of plastic used in a toner cartridge is 4.5 kg of CO2 10 per kg of plastic resin produced. The emission factor data might be based on a limited sampling of 11 producers of such resin and may source from an older timeframe or different geography than that in 12 which the resin in question is being produced. Therefore, there is parameter uncertainty in the emission 13 factor value being used. 14
Single parameter uncertainty can arise in three data types: direct emissions data, activity data, and emission 16 factors. Components of these data may have uncertainties associated with them; it is recommended that 17 those uncertainties be considered in the overall parameter uncertainty of the data points than in their own 18 regard. 19 20 Parameter uncertainty can be quantified based on one or more of the following: 21
• Measurement uncertainty (represented by standard deviations); 22 • The pedigree matrix approach31
• Default uncertainty parameters defined for specific activities or industry data and reported in 24 literature sources or elsewhere;
, based on data quality indicators (see Chapter 6); 23 32
• Probability distributions in databases or other data sources for data they contain; and 26 25
• Other approaches reported by literature 27
Propagated Parameter Uncertainty 28 Propagation of uncertainty is the combined effect of each parameters’ uncertainty on the uncertainty of the 29 total computed result. Methods are available to propagate parameter uncertainty from single data points 30 There are two prominent methods applied to propagation of parameter uncertainty: by random sampling 31 (such as in the Monte Carlo method) and by analytical formulas (such as in the Taylor Series expansion 32 method). 33 34 EXAMPLE
Scenario Uncertainty 42
: A company estimates total scope 3 emissions from business travel to be 155,000 tonnes 35 CO2e.The activity data, emission factor data and GWPs applied in this calculation each have a level of 36 parameter uncertainty. This uncertainty is determined based on the total effect of all of the single 37 parameter uncertainties. The propagated parameter uncertainty assessment shows that there is a 95% 38 confidence that the true value of business travel emissions is between 140,000 and 170,000 tonnes 39 CO2e. This can also be presented as the inventory total is 155,000 tonnes CO2e (+/-15,000 tonnes 40 CO2e). 41
While parameter uncertainty is a measure of how close the data and calculated emissions are to the true 43 (though unknown) actual data and emissions, scenario uncertainty refers to variation in calculated emissions 44 based on methodological choices. To identify the influence of these selections on results, parameters (or 45 combinations of parameters) are varied in an exercise known as scenario analysis or sensitivity analysis. 46 Scenario analysis can reveal differences in the inventory results due to different modeling approaches, 47 allocation procedures, and product use or end-of-life modeling choices. 48 49
31 Weidema, BP, 1996, Data quality management of life cycle inventories-an example of using data quality indicators Assessment 32 See, for example, Lloyd, SM. 2007, Characterizing, Propagating, and Analyzing Uncertainty in Life-Cycle Assessment (page 173)

DRAFT FOR STAKEHOLDER REVIEW – NOVEMBER 2010
103
Methodological Uncertainty 1 Methodological uncertainty stems from various methodological choices made by the reporting company that 2 can affect the inventory results. When there are multiple methodological choices available in the standard 3 (e.g., the selection of appropriate allocation methods), methodological uncertainty is created. The use of 4 standards results in a reduction in methodological uncertainty by constraining choices the user may make in 5 their methodology. For example, the boundary setting requirements standardize the inventory approach for 6 all companies. 7 8
Situational Uncertainty 9 Situational uncertainty arises from various situations that may occur within the company’s value chain. 10 Rather than a measure of the confidence in the result within the scenarios defined in the inventory, 11 situational uncertainty is the impact of potential situations other than the conditions and assumptions made in 12 the inventory results and report. 13 14
A company may choose to allocate facility electricity consumption between toner production and other 16 production lines using physical allocation (e.g., the number of units produced). Using this factor, 30% 17 of electricity consumption is allocated to the toner production process. However, using economic 18 allocation, 40% of electricity consumption is allocated to the toner production process. 19
EXAMPLES 15
Model Uncertainty 20 Model uncertainty arises from limitations in the ability of the modeling approaches used to reflect the real 21 world. Simplifying the real world into a numeric model always introduces some inaccuracies. Model 22 uncertainty can be distinguished from methodological uncertainty by considering model uncertainty to be an 23 inherent limitation in the modeling techniques used, whereas methodological uncertainty addresses the 24 variation among methods that are available in the inventory. In many cases, model uncertainties can be 25 represented, at least in part, through the parameter or scenario approaches described above. However, 26 some aspects of model uncertainty might not be captured by those classifications and are otherwise very 27 difficult to quantify. 28 29
In representing the transport of materials to the site of toner cartridge manufacture, a model is used 31 that predicts transport distances and modes based on known transport networks, likely routes, and 32 speeds of travel. The model cannot perfectly predict the true transport logistics and so there is 33 uncertainty regarding the true modes and distances that are used. 34
EXAMPLES 30
A model of soy production is involved in predicting emissions from the production of the cartridge’s soy-35 based ink. Emissions of N2O due to application of nitrogen fertilizers are based on a linear modeling of 36 interactions of the fertilizer with the soil and plant systems, which are in fact more complicated 37 processes than represented, leading to uncertainty regarding the emissions information resulting from 38 this model. 39
40 4. Reporting Uncertainty 41 42 Uncertainty can be reported in many ways, including qualitative descriptions of uncertainty sources, as well 43 as quantitative depictions, such as error bars, histograms, probability density functions, etc. It is useful to 44 provide as complete a disclosure of uncertainty information as is possible. Users of the information may then 45 weigh the total set of information provided in judging their confidence in the information. 46 47

DRAFT FOR STAKEHOLDER REVIEW – NOVEMBER 2010
104
Appendix E: Data Management Plan 1 2 A data management plan documents the GHG inventory process and the internal quality assurance and 3 quality control (QA/QC) procedures in place to enable the preparation of the inventory from its inception 4 through to final reporting. The data management plan is a valuable tool to manage data and track progress 5 of the inventory over time. Companies may already have similar procedures in place for other data collection 6 efforts to guide their inventory process to meet the accounting requirements of the GHG Protocol, or for ISO 7 standards. Where possible, these processes should be aligned to reduce data management burdens. 8 9 The data management plan can also be useful as an assurance readiness measure as it contains much of 10 the data that an assurance provider needs to perform assurance. The plan should be made available to 11 assurance providers (internal or external to the reporting company), as a helpful tool to guide the assurance 12 process. 13 14 The data management plan should be divided into two portions, quality control (QC) and quality assurance 15 (QA), explained below. 16 17 The quality control portion of the data management plan outlines a system of routine technical activities to 18 determine and control the quality of the inventory data and the data management processes. The purpose is 19 to ensure that the inventory does not contain misstatements, including identifying and reducing errors and 20 omissions; providing routine checks to maximize consistency in the accounting process; and facilitating 21 internal and external inventory review and assurance. 22 23 The quality assurance portion of the data management plan involves peer review and audits to assess the 24 quality of the inventory. Peer review involves reviewing the documentation of the product accounting 25 methodology and results but does not rigorously review the data used or the references. This review aims to 26 reduce or eliminate any inherent error or bias in the process used to develop the inventory and assess the 27 effectiveness of the internal quality control procedures. The audit evaluates whether the inventory complies 28 with the quality control specifications outlined in the data management plan. Peer review and audits should 29 be conducted by someone not involved in the development of the product inventory. 30 31 At a minimum the data management plans should contain: 32 33
• Description of the scope 3 categories and activities included in the inventory 34 • Information on the entity(ies) or person(s) responsible for measurement and data collection 35
procedures 36 • Criteria used to determine when a product inventory is re-evaluated 37 • Data collection procedures 38 • Data sources and the results of any data quality assessment performed 39 • Calculation methodologies 40 • Length of time the data should be archived 41 • Data transmission, storage and backup procedures 42 • All QA/QC procedures for data collection, input and handling activities, data documentation and 43
emissions calculations. 44 45 The process of setting up a data management system should involve establishing standard procedures to 46 address all of the data management activities, including the quality control and quality assurance aspects of 47 developing a product inventory. 48
Creating a Data Management Plan 49 To develop a data management plan, the following steps should be undertaken and documented. 50 51
1. Establish a GHG accounting quality person/team. This person/team should be responsible for 52 implementing and maintaining the data management plan, continually improving the quality of the 53 inventory, and coordinating internal data exchanges and external interactions (such as with 54 suppliers, reporting programs and assurance providers). 55

DRAFT FOR STAKEHOLDER REVIEW – NOVEMBER 2010
105
1 2. Develop Data Management Plan. The data management plan should cover the components outlined 2
in the section above and in Table E.1. Documenting this information should assist with updating the 3 inventory, and assessing and improving the quality of the inventory over time. 4 5
3. Development of the data management plan should begin before any data is collected to ensure all 6 relevant information about the inventory is documented as it proceeds. The plan should evolve over 7 time as data collection and processes are refined. 8
9 4. Perform generic data quality checks based on data management plan. Checks should be applied to 10
all aspects of the inventory process, focusing on data quality, data handling, documentation, and 11 calculation procedures (see 12
5. Table E.2 for data control activities). 13 14
6. Perform specific data quality checks. More in-depth checks should be made for those sources, 15 processes and/or activities that are significant to the inventory and/or have high levels of uncertainty 16 (see Appendix D for information on assessing uncertainty). 17
18 7. Review final inventory and report. Review procedures should be established that match the purpose 19
of the inventory and the type of assurance that will be performed. Internal reviews should be 20 undertaken in preparation for the assurance process by the appropriate department within a 21 company, such as an internal audit or accounting department. 22
23 8. Establish formal feedback loops to improve data collection, handling and documentation processes. 24
Feedback loops can improve the quality of the product inventory over time and to correct any errors 25 or inconsistencies identified in the review process. 26
27 9. Establish reporting, documentation and archiving procedures. Establish record-keeping processes 28
for what information should be documented to support data collection and calculation methodologies, 29 and how the data should be stored over time. The process may also involve aligning or developing 30 relevant database systems for record keeping. Systems may take time to develop and it is important 31 to ensure that all relevant information is collected prior to the establishment of the system and then 32 transferred to the system once it is operational. 33
34 The data management plan is likely to be an evolving document that is updated as data sources change, 35 data handling procedures are refined, calculation methodologies improve, inventory responsibilities change 36 within a company, or the business objectives of the inventory are updated. 37 38 The data management plan checklist in Table E.1 outlines what components should be included in a Data 39 Management Plan and can be used as a guide for creating a plan or for pulling together existing documents 40 to constitute the plan. 41 42
Table E.1: Data Management Plan Checklist 43
Component Information Rationale 1. Responsibilities Name and contact details of persons
responsible for: • Management of GHG inventory • Data collection for each process • Internal audit procedures • External audit procedures
This ensures institutional knowledge is maintained and allows relevant person(s) to be identified for: • Confirming and checking information
during any internal or external audit procedures
• Producing consistent future GHG inventories

DRAFT FOR STAKEHOLDER REVIEW – NOVEMBER 2010
106
2. Boundary & Inventory Description
• Description of the boundary decision based on the GHG Protocol Corporate Standard
• Description of what Scope 3 categories and activities are included in the inventory
• Description of what categories are excluded and why (as the company may begin including these, as data becomes available, for example)
To provide internal auditors, assurance providers, and those doing future GHG inventories, sufficient information on the activities and categories included in the corporate inventory.
3. Data Summary • Data collection procedures, including data sources for each process
• Records all data sources and allows others to locate data sources (for audit and updates to inventory). Also provides information on which suppliers have been approached for data.
• Quality of data collected for each process and if and how a data quality assessment was undertaken
• Enables data quality to be tracked over time and improved
• Data sources where better quality data is preferable and plan for how to improve that data
• Identifies where data sources should be improved over time, including those suppliers who were asked to provide data and those that were not
• Information on how the use profile of sold products was determined, if included in the inventory
• Allows internal auditors, assurance providers, and those doing future inventories sufficient information on how the use profile was developed, and identifies how this information may be improved
• Information on criteria used to determine when an inventory is to be re-evaluated, including the relevant information needed to be tracked, and how this should be tracked over time.
• This allows data and information sources to be tracked and compared overtime. It may also involve identifying a system (e.g., document tracking and identification system) to ensure data and information is easily located and under what conditions this information/data was used or collected
4. Emissions Calculations
• Calculation methodologies used (and references).
• Note areas where calculation methodologies are needed for the inventory but not available
• Provides internal auditors, assurance providers, and those doing future product inventories details on how emissions were calculated
• Changes in calculation methodologies over time
• Noting methodological changes should allow discrepancies between inventories to be checked and ensures that the most updated methodologies are used
5. Data Storage Procedures
• How and where data is stored • Allows information to be easily located
• Length of time data is archived • Keeps a record of how long information is stored to prevent looking for information that is no longer kept
• Backup procedures • Ensures backup procedures are implemented

DRAFT FOR STAKEHOLDER REVIEW – NOVEMBER 2010
107
6. QA/QC Procedures
• QA/QC procedures used (see Table E.2 for detailed guidance)
• Ensures that adequate processes are in place to check data collection, input and handling, data documentation, and emissions calculations.
1 Table E.2: Quality Assurance/Quality Control Procedures 2 3
Activity Procedure Data collection, input and handling activities Transcription errors in primary and secondary data
• Check a sample of input data in each process (both direct measures and calculated estimations) for transcription errors
Uncertainty estimates • Check that any calculated uncertainties are complete and calculated correctly
Data Documentation Transcription errors in references and storage of all references used
• Confirm bibliographical data references are properly cited • Ensure all relevant references are archived
Storing information on data and data quality
• Check that emissions categories, boundaries, GHGs included, allocation methodology uses, data sources and any relevant assumptions are documented and archived
• Check that all data quality indicators are described, documented and archived for each process
Recording parameter and unit information
• Check that all units are appropriately labeled in calculation sheets • Check all units are correctly transferred through all calculations and
aggregation of emissions in all processes • Check conversion factors are correct
Recording calculation methodologies
• Check that all calculation methodologies are documented • Check that any changes to calculation methodologies are documented
Database/calculation sheet integrity
• Ensure all fields and their units are labeled in database/calculation sheet • Ensure database/calculation sheet is documented and the structure and
operating details of the database/calculations sheets are archived Review of internal documentation and archiving
• Check there is sufficient internal documentation to support the estimates and enable the reproduction of the emissions and data quality assessment, and uncertainty estimations
• Check all data, supporting data and records are archived and stored to facilitate a detailed review
• Check that the archive is securely stored Calculating emissions and checking calculations Aggregation of emissions
• Ensure that the aggregation of emissions from all emissions activities is correct
Emissions trends • Where possible compare emissions from each activity to previous estimates. If significant departures, check data inputs, assumptions and calculation methodologies
Calculation methodology(ies)
• Reproduce a sample set of emissions and removals calculations to cross-check application of calculation methodologies
• Where possible, cross-check calculation methodologies used against more or less complex methodologies to ensure similar results are achieved
4 5

DRAFT FOR STAKEHOLDER REVIEW – NOVEMBER 2010
108
Glossary 1 2 Term Definition
Activity data
A quantitative measure of a level of activity that results in GHG emissions or removals. Activity data is multiplied by an emissions factor to derive the GHG emissions associated with a process or an operation. Examples of activity data include kilowatt-hours of electricity used, volume of fuel used, output of a process, hours a piece of equipment is operated, distance travelled, and area of a building.
Allocation The process of partitioning GHG emissions from a single facility or other system (e.g., vehicle, business unit, corporation) among its various outputs.
Assurance When an assurance provider expresses a conclusion designed to enhance the degree of confidence of the intended users (other than the preparer of the GHG inventory report) over the measurement of the GHG inventory and the scope 3 emissions included therein against defined criteria.
Audit trail Well organized and transparent historical records documenting how an inventory was compiled.
Business travel Transportation of employees for business-related activities.
Byproduct An incidental output from a process with a minor market value, rather than the primary product being produced or a co-product.
Capital Good
A final good that is used by a company to manufacture a product, provide a service, or sell, store, and deliver merchandise. Capital goods are not directly sold to a company’s consumers and have an extended life. In financial accounting, capital goods are treated as fixed assets or plant, property and equipment (PP&E). Capital goods include equipment, machinery, buildings, facilities, vehicles, etc.
CO2 equivalent (CO2e)
The universal unit of measurement to indicate the global warming potential (GWP) of each greenhouse gas, expressed in terms of the GWP of one unit of carbon dioxide. It is used to evaluate releasing (or avoiding releasing) different greenhouse gases against a common basis.
Component An intermediate product. Consumer The end consumer or final user of a product.
Control
The ability of a company to direct the policies of another operation. More specifically, it is defined as either operational control (the organization or one of its subsidiaries has the full authority to introduce and implement its operating policies at the operation) or financial control (the organization has the ability to direct the financial and operating policies of the operation with a view to gaining economic benefits from its activities).
Co-Product An output of a system with a significant market value in another system.
Cradle-to-Gate All emissions that occur in the life cycle of purchased products, up to the point of receipt by the reporting company (excluding emissions from sources that are owned or controlled by the reporting company)
Customer An entity that purchases or acquires the products of another entity (i.e., a supplier). A customer may be a business customer or an end consumer.
Direct Emissions Emissions from sources that are owned or controlled by the reporting company. Downstream emissions
Downstream emissions include indirect GHG emissions from sold goods and services, subsequent to sale by the reporting company.
Economic Allocation
Allocating the emissions of an activity based on the market value of each output/product.
Emission factor A factor that converts activity data into GHG emissions data (e.g., kg CO2-e emitted per liter of fuel consumed, kg CO2-e emitted per kilometer traveled, etc.).
Emissions The release of greenhouse gases into the atmosphere. Employee commuting Transportation of employees between their homes and their worksites.
Equity Share Approach
A consolidation approach whereby a company accounts for GHG emissions from operations according to its share of equity in the operation. The equity share reflects economic interest, which is the extent of rights a company has to the risks and rewards flowing from an operation.

DRAFT FOR STAKEHOLDER REVIEW – NOVEMBER 2010
109
Extrapolated data Data from a similar process or activity that is used as a stand-in for the given process or activity, and has been customized to be more representative of the given process or activity.
Final product
Goods and services that are consumed by the end user in their current form, without further processing, transformation, or inclusion in another product. Final products include not only products consumed by end consumers, but also products consumed by businesses in the current form (e.g., capital goods) and products sold to retailers for resale to end consumers (e.g., consumer products).
Financial Control Approach
A consolidation approach whereby a company accounts for 100 percent of the GHG emissions over which it has financial control. It does not account for GHG emissions from operations in which it owns an interest but does not have financial control.
Franchise A business operating under a license (granted by a franchisor) to sell or distribute the franchisor’s goods or services within a certain location.
Franchisee An entity that operates a franchise and pays fees to a company (i.e., the franchisor) for the license to sell or distribute the franchisor’s goods or services.
Franchisor A company that grants licenses to other entities (i.e., franchisees) to sell or distribute its goods or services, and in return receives payments, such as royalties for the use of trademarks and other services.
Good A tangible product. Global Warming Potential (GWP)
A factor describing the radiative forcing impact (degree of harm to the atmosphere) of one unit of a given GHG relative to one unit of CO2.
Greenhouse gas inventory A quantified list of an organization’s GHG emissions and sources.
Greenhouse gases (GHG)
For the purposes of this standard, GHGs are the six gases listed in the Kyoto Protocol: carbon dioxide (CO2); methane (CH4); nitrous oxide (N2O); hydrofluorocarbons (HFCs); perfluorocarbons (PFCs); and sulphur hexafluoride (SF6).
Indirect Emissions
Emissions that are a consequence of the activities of the reporting company, but occur at sources owned or controlled by another company.
Intermediate product
Goods that are inputs to the production of other goods or services that require further processing, transformation, or inclusion in another product before use by the end consumer. Intermediate products are not consumed by the end user in their current form.
Leased Asset Any asset that is leased (e.g., facilities, vehicles, etc.)
Lessee An entity that has the right to use an asset through a contract with the owner of the asset (i.e., the lessor).
Lessor An entity that owns an asset and leases it to a third party (i.e., the lessee).
Life cycle Consecutive and interlinked stages of a product system, from raw material acquisition or generation of natural resources to end of life.
Life cycle assessment
Compilation and evaluation of the inputs, outputs and the potential environmental impacts of a product system throughout its life cycle.
Material discrepancy
An error (for example, from an oversight, omission, miscalculation or fraud) that results in a reported quantity or statement being sufficiently different from the true value or meaning to influence a user’s decisions.
Non Production Related Procurement
Purchased goods and services that are not integral to the company’s products, but are instead used to enable operations (also called indirect procurement).
Operational boundaries
The boundaries that determine the direct and indirect emissions associated with operations owned or controlled by the reporting company.
Operational Control
A consolidation approach whereby a company accounts for 100 percent of the GHG emissions over which it has operational control. It does not account for GHG emissions from operations in which it owns an interest but does not have operational control.
Organizational boundaries
The boundaries that determine the operations owned or controlled by the reporting company, depending on the consolidation approach taken (equity or control approach).
Outsourcing The contracting out of activities to other businesses.

DRAFT FOR STAKEHOLDER REVIEW – NOVEMBER 2010
110
Physical Allocation
Allocating the emissions of an activity based on an underlying physical relationship between the multiple inputs/outputs and the quantity of emissions generated.
Primary data Data from specific activities within a company's value chain. Product Any good or service. Production Related Procurement
Purchased goods that are directly related to the production of a company’s products (also called direct procurement).
Proxy data Data from a similar process or activity that is used as a stand-in for the given process or activity without being customized to be more representative of the given process or activity.
Reporting Presenting data to internal management and external users such as regulators, shareholders, the general public or specific stakeholder groups.
Reporting Year The year for which emissions are reported. Scope 1 Emissions Emissions from operations that are owned or controlled by the reporting company.
Scope 2 Emissions
Emissions from the generation of purchased or acquired electricity, steam, heating or cooling consumed by the reporting company.
Scope 3 Emissions
All other indirect emissions that occur in the value chain of the reporting company, including both upstream and downstream emissions.
Scope 3 Activity An individual source of emissions included in a scope 3 category. Scope 3 Category One of the 15 types of scope 3 emissions.
Secondary data Data that is not from specific activities within a company's value chain. Service An intangible product. Supplier An entity that provides or sells products to another entity (i.e., a customer).
Supply chain A network of organizations (e.g., manufacturers, wholesalers, distributors and retailers) involved in the production, delivery, and sale of a product to the consumer.
Tier 1 supplier A supplier that provides or sells products directly to the reporting company. A Tier 1 supplier is a company with which the reporting company has a purchase order for goods or services.
Tier 2 supplier A supplier that provides or sells products directly to the reporting company’s Tier 1 supplier. A Tier 2 supplier is a company with which the reporting company’s Tier 1 supplier has a purchase order for goods and services.
Uncertainty
1. Quantitative definition: Measurement that characterizes the dispersion of values that could reasonably be attributed to a parameter. 2. Qualitative definition: A general and imprecise term that refers to the lack of certainty in data and methodology choices, such as the application of non-representative factors or methods, incomplete data on sources and sinks, lack of transparency etc.
Upstream emissions
Upstream emissions include indirect GHG emissions from purchased or acquired goods and services, up to the point of receipt by the reporting company; emissions from investments not included in scope 1 or 2; and emissions from employee commuting.
Value chain emissions
Emissions from the upstream and downstream activities associated with the operations of the reporting company.
Waste An output of a process that has no market value.
1 2