corporate waste reduction strategy - winnipeg · overall corporate reduction target -- 2% 5% 10%...
TRANSCRIPT
Tetra Tech EBA Inc.Oceanic Plaza, 9th Floor, 1066 West Hastings Street
Vancouver, BC V6E 3X2 CANADA
Tel 604.685.0275 Fax 604.684.6241
PRESENTED TO
City of Winnipeg
CITY OF WINNIPEGCORPORATE WASTE REDUCTION STRATEGY
DECEMBER 2014
ISSUED FOR USE
ENVSWM03102-01
City of Winnipeg Corporate Waste Reduction Strategy
This page intentionally left blank.

CITY OF WINNIPEG - CORPORATE WASTE REDUCTION STRATEGY
ENVSWM03102-01 | DECEMBER 2014 | ISSUED FOR USE
i
City of Winnipeg Corporate Waste Reduction Strategy
EXECUTIVE SUMMARY
The City of Winnipeg (the City) retained Tetra Tech EBA Inc. (operating as Tetra Tech) to develop a Corporate
Waste Reduction Strategy that outlines how to implement a program with pragmatic and aspirational (e.g., zero
waste) targets for waste minimization. The Strategy development is part of an ongoing effort to pursue waste
reduction and recycling in the City. It was estimated in 2011 that city operations account for 7% of the total
unsorted material collected at the Brady Road Resource Management Facility. Since 2011 the total quantity of
solid waste disposed has shown a year over year increase, averaging 7% per year over the past three years,
compared to an average increase in the City population of 3%, and increase in the number of employees of 2%.
The Strategy has been developed through a series of approaches including: a) best practice review of corporate
polices, diversion targets and waste related data at a number of high performing municipalities in North America;
b) review of existing policies and management systems in the City of Winnipeg; c) establishment of facility
categories and recommend suitable waste generation measurement approaches; d) the provision of waste
auditing services at two representative City facilities; and e) interviews with key managers, staff and building tours
to understand current recycling and waste management processes, and get a clear understanding of current
practices, barriers, and successes to build upon.
The Strategy implementation plan included in this report has three important stages that guide the process from
policy setting to execution with measurement and accountability built in. The primary stages to the strategy
implementation are defined as:
Commitment – These includes setting targets and policies that each department can commit to adopting, and
show that they as a department are following through on their commitment to adopt the principles of zero waste in
compliance with the corporate strategy. This would include determining key policies that need to be adopted to
make commitment and programs happen.
Implementation – Examples of how each department is implementing policies and practices to support the
strategy. For example, in the short term this can include pilot and field testing of system changes such as new
waste container setups in buildings to achieve maximum capture of recyclable materials.
Accountability – Indicators that each department has mechanisms in place to measure and report on program
performance.
Corporate facilities have been grouped to reflect common functionality and solid waste systems. This approach
will ensure that project outcomes including recommendations for program measurement, waste reduction and
diversion targets, and material streams are practical and applicable to the broad range of municipal facilities and
operations that comprise corporate facilities. This ensures that each aspect of the solid waste management
system is adequately assessed to inform successful implementation and system change.
Waste audit data showed that City Hall is currently achieving a 61% diversion rate, and an organics program
would be needed to further increase the diversion rate. However with a fully implemented organics collection
program, a 90% diversion rate could be achieved. A similar target of 90% is observed at a number of other offices
and cities that were researched in the best practice review. Waste audit data showed that the public venue—the
Cindy Klassen Recreation Complex—is currently achieving a 13% diversion rate. There were a number of
recyclables in the garbage, and if all recyclable material was placed in the current recycling streams available, a
diversion rate of up to 42% could be achieved. With a fully implemented organics program a diversion rate of up
to 79% could be achieved.

CITY OF WINNIPEG - CORPORATE WASTE REDUCTION STRATEGY
ENVSWM03102-01 | DECEMBER 2014 | ISSUED FOR USE
ii
City of Winnipeg Corporate Waste Reduction Strategy
Table A provides a phased breakdown of waste diversion targets by facility category, and overall reduction target
to achieve the goals of this program. The interim step in 2015 reflects the higher potential for diversion and
reduction in the short term, but also the greater difficulty of reducing waste as the remaining amount gets smaller.
Medium term targets assume that some facilities that are high organics producers would begin to pilot and
implement organics diversion programs, and long term programs would need full organic diversion programs in all
offices that produce organic materials. This Strategy has adopted pragmatic and aspirational targets for waste
minimization and an implementation strategy to achieve them. This goal will complement the City’s concurrent
effort to increase diversion of residential waste to at least 50%, and to minimize waste in other sectors. An overall
corporate target of 42% diversion by 2017 is recommended.
Table A: Waste Reduction and Diversion Targets
Facility Category Diversion Rate Waste Diversion Targets
Current(Estimated)
Short Term2015-2017
Medium Term2017-2020
Long Term2025
Corporate Office 40% 50% 65% 90%
Public Recreation, Community Service andCultural Venues
15% 30% 45% 70%
Operations and Maintenance Yards 30% 50% 65% 80%
Green Spaces 80% 85% 90% 100%
Public Use Waste Containers 5% 20% 30% 40%
Public Service 30% 40% 50% 60%
Overall Corporate Diversion Target1 29% 42% 52% 65%
Overall Corporate Reduction Target -- 2% 5% 10%
1Weighted average is calculated taking into account the current total tonnage of waste disposed as presented in Table A.
As the program develops, various departments and individual programs will move through the three stages of the
process. A number of the strategies will help the City build capacity within departments and help with
cross-functional governance and team building. The implementation plan included in this report seeks continuous
improvement and explores innovative, cost-effective opportunities for system improvements over time, taking
advantage of opportunities for continuous learning and knowledge sharing as programs are developed. This
should enable the City to improve waste reduction and diversion efforts and meet the 50% diversion goal by 2020
aligned with the City’s current residential sector diversion targets.
Significant first steps required in realizing the strategy include adopting waste diversion targets and a corporate
zero waste philosophy to show commitment to continuously strive to reduce waste going to landfill through
policies the support the waste reduction hierarchy. To make change effectively, the City will needs a staff member
that is responsible for driving and overseeing change and become the knowledgeable resource to implement new
programs, monitor performance, and identify efficiencies and best practices.
Funding opportunities are available through The Waste Reduction and Pollution Prevention (WRAPP) Fund which
supports waste reduction, pollution prevention, and integrated waste management related projects. Municipal
corporations and local governments are eligible to submit project proposals. Opportunities also exist with external
partners including the Canadian Beverage Container Recycling Association (CBCRA) who has set a plan to meet
the government-mandated target of recovering 75% of beverage containers sold in Manitoba.

CITY OF WINNIPEG - CORPORATE WASTE REDUCTION STRATEGY
ENVSWM03102-01 | DECEMBER 2014 | ISSUED FOR USE
iii
City of Winnipeg Corporate Waste Reduction Strategy
TABLE OF CONTENTS
EXECUTIVE SUMMARY ........................................................................................................................ i
1.0 INTRODUCTION.......................................................................................................................... 1
1.1 Approach and Methodology...................................................................................................................1
1.2 Scope of the Study ................................................................................................................................2
1.3 Building and Facility Categories ............................................................................................................2
2.0 INFORMATION GATHERING...................................................................................................... 4
2.1 City Documents......................................................................................................................................4
2.2 Case Studies for Municipal Facilities and Diversion Targets ................................................................5
2.3 Provincial Programs...............................................................................................................................8
2.3.1 Waste Reduction and Pollution Prevention Fund.....................................................................8
2.3.2 Waste Reduction and Recycling Support .................................................................................9
2.4 Canadian Beverage Container Recycling Association ..........................................................................9
3.0 CURRENT WASTE MANAGEMENT SYSTEMS........................................................................ 10
4.0 WASTE COMPOSITION ............................................................................................................ 12
4.1 Methodology ........................................................................................................................................12
4.2 Public Recreation – Cindy Klassen Recreation Complex....................................................................12
4.2.1 Discussion...............................................................................................................................16
4.3 Corporate Office - City Hall..................................................................................................................16
4.3.1 Discussion...............................................................................................................................19
5.0 SITE INTERVIEWS BY FACILITY CATEGORY......................................................................... 20
5.1 Corporate Offices.................................................................................................................................20
5.2 Public Recreation, Community Service, and Cultural Venues ............................................................21
5.3 Operations and Maintenance Yards ....................................................................................................23
5.4 Green Space and Landscaping ...........................................................................................................24
5.5 Streets and Outdoor Public Use Waste Containers ............................................................................25
5.6 Other City Division Interviews..............................................................................................................26
5.6.1 Solid Waste Services Division ................................................................................................26
5.6.2 Materials Management Division - Contracts and Procurement ..............................................27
5.6.3 Corporate Support Services Department ...............................................................................28
6.0 STRATEGY, RECOMMENDATIONS, AND IMPLEMENTATION APPROACH ......................... 29
6.1 Interim Targets.....................................................................................................................................29
6.2 Implementation Approach Recommendations.....................................................................................31
6.2.1 Phased Implementation Approach .........................................................................................31
6.2.2 Zero Waste Manager ..............................................................................................................31
6.2.3 Pursue Zero Waste.................................................................................................................32
6.2.4 Measure Service and Performance Accurately ......................................................................33
6.2.5 Engagement and Education ...................................................................................................33
6.2.6 Target Priority Recycling Areas ..............................................................................................34
6.2.7 Infrastructure Assessments ....................................................................................................35

CITY OF WINNIPEG - CORPORATE WASTE REDUCTION STRATEGY
ENVSWM03102-01 | DECEMBER 2014 | ISSUED FOR USE
iv
City of Winnipeg Corporate Waste Reduction Strategy
6.2.8 Staff Engagement ...................................................................................................................35
6.3 Strategies and Implementation Plan....................................................................................................36
7.0 CLOSURE.................................................................................................................................. 42
LIST OF TABLES IN TEXT
Table 1: Proposed Facility Categories .................................................................................................. 3
Table 2: References Summary Table.................................................................................................... 4
Table 3: Case Studies for Municipal Facilities and Office Buildings....................................................... 6
Table 4: Public Space Case Studies for Waste Reduction .................................................................... 7
Table 5: Quantity of Waste Disposed and Number of Employees ........................................................ 10
Table 6: Garbage composition - Cindy Klassen Recreation Complex ................................................. 13
Table 7: Recycling Composition – Cindy Klassen Recreation Complex .............................................. 14
Table 8: Overall Material Diversion Rate – Cindy Klassen Recreation Complex ................................. 15
Table 9: Diversions Rates of Recyclables – Cindy Klassen Centre..................................................... 15
Table 10: Garbage Composition – City Hall ........................................................................................ 16
Table 11: Recycling Composition – City Hall....................................................................................... 17
Table 12: Overall Material Diversion Rate – City Hall.......................................................................... 18
Table 13: Diversions Rates of Recyclables – City Hall ........................................................................ 19
Table 14: Procurement Waste Reduction Initiatives............................................................................ 27
Table 15: Waste Reduction and Diversion Targets ............................................................................. 30
Table 16: Strategy and Implementation Plan ...................................................................................... 38
LIST OF FIGURES IN TEXT
Figure 1: City of Winnipeg Corporate Waste Reduction Strategy Planning Framework......................... 1
Figure 2: Tonnes of Corporate Solid Waste Disposed - Measured and Estimated 2007 - 2013 .......... 11
Figure 3: Percent Composition of the Garbage Stream – Cindy Klassen Recreation Complex ........... 13
Figure 4: Percent Composition of the Recycling Stream – Cindy Klassen Recreation Complex.......... 14
Figure 5: Percent Composition of the Garbage Stream – City Hall...................................................... 17
Figure 6: Percent Composition of the Recycling Stream – City Hall .................................................... 18
APPENDIX SECTIONS
APPENDICES
Appendix A
Appendix B
Appendix C
Appendix D
Tetra Tech EBA’s General Conditions
Waste Audit Photo Log
Copy of site visit questions
Copy of Site Visit Questions
CITY OF WINNIPEG - CORPORATE WASTE REDUCTION STRATEGY
ENVSWM03102-01 | DECEMBER 2014 | ISSUED FOR USE
v
City of Winnipeg Corporate Waste Reduction Strategy
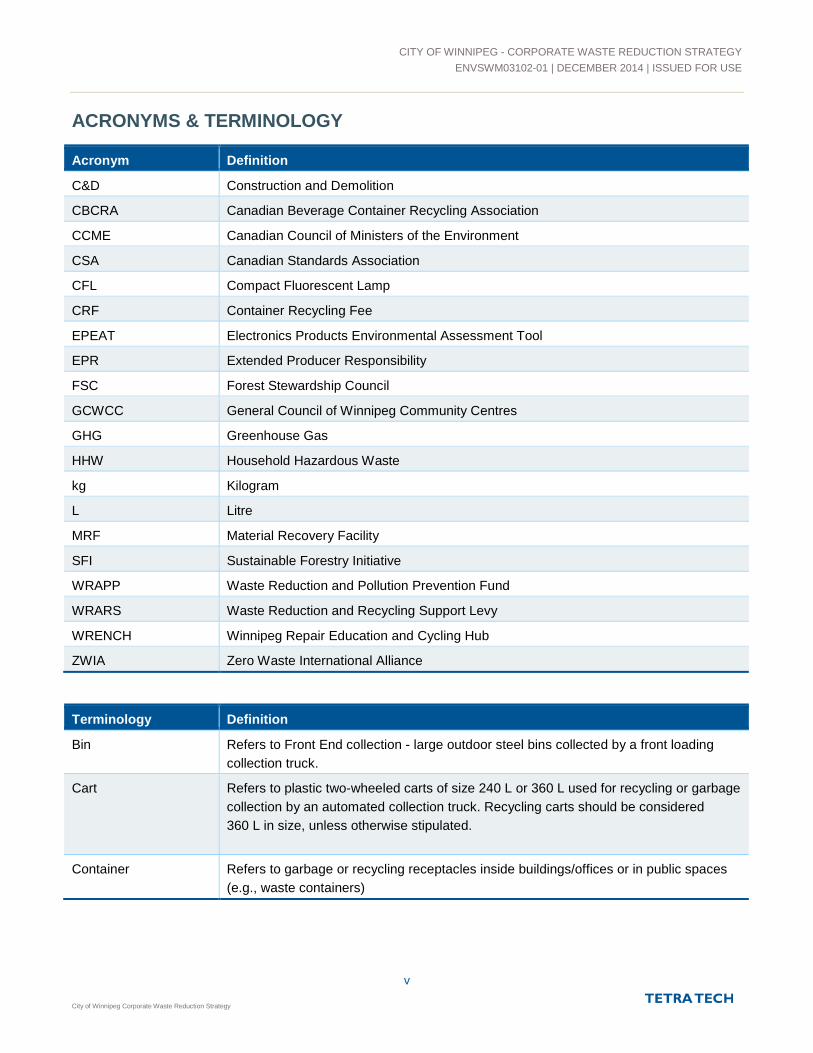
ACRONYMS & TERMINOLOGY
Acronym Definition
C&D Construction and Demolition
CBCRA Canadian Beverage Container Recycling Association
CCME Canadian Council of Ministers of the Environment
CSA Canadian Standards Association
CFL Compact Fluorescent Lamp
CRF Container Recycling Fee
EPEAT Electronics Products Environmental Assessment Tool
EPR Extended Producer Responsibility
FSC Forest Stewardship Council
GCWCC General Council of Winnipeg Community Centres
GHG Greenhouse Gas
HHW Household Hazardous Waste
kg Kilogram
L Litre
MRF Material Recovery Facility
SFI Sustainable Forestry Initiative
WRAPP Waste Reduction and Pollution Prevention Fund
WRARS Waste Reduction and Recycling Support Levy
WRENCH Winnipeg Repair Education and Cycling Hub
ZWIA Zero Waste International Alliance
Terminology Definition
Bin Refers to Front End collection - large outdoor steel bins collected by a front loading
collection truck.
Cart Refers to plastic two-wheeled carts of size 240 L or 360 L used for recycling or garbage
collection by an automated collection truck. Recycling carts should be considered
360 L in size, unless otherwise stipulated.
Container Refers to garbage or recycling receptacles inside buildings/offices or in public spaces
(e.g., waste containers)

CITY OF WINNIPEG - CORPORATE WASTE REDUCTION STRATEGY
ENVSWM03102-01 | DECEMBER 2014 | ISSUED FOR USE
vi
City of Winnipeg Corporate Waste Reduction Strategy
LIMITATIONS OF REPORT
This report and its contents are intended for the sole use of the City of Winnipeg and their agents. Tetra Tech EBA Inc.
(operating as Tetra Tech) does not accept any responsibility for the accuracy of any of the data, the analysis, or the
recommendations contained or referenced in the report when the report is used or relied upon by any Party other than the City
of Winnipeg, or for any Project other than the proposed development at the subject site. Any such unauthorized use of this
report is at the sole risk of the user. Use of this report is subject to the terms and conditions stated in Tetra Tech EBA Inc.’s
Services Agreement. Tetra Tech’s General Conditions are provided in Appendix A of this report.
The waste audit samples collected and audited for this study are “snapshots” in time, meaning the reported quantities are
estimates and only represent the conditions for the period of time in which they were collected. Seasonal and annual
variability, weather, and other factors can affect the amount and composition of waste, organics and recyclables generated at
any given time. Even with combined educational, regulatory and financial initiatives the reader should not assume that it is
necessarily easy, practical, or economical to recover a substantial portion of a disposed material from a mixed waste stream or
at its source.
CITY OF WINNIPEG - CORPORATE WASTE REDUCTION STRATEGY
ENVSWM03102-01 | DECEMBER 2014 | ISSUED FOR USE
1
City of Winnipeg Corporate Waste Reduction Strategy
1.0 INTRODUCTION
Tetra Tech EBA Inc. (operating as Tetra Tech) was retained by the City of Winnipeg (the City) to develop a
Corporate Waste Reduction Strategy (Strategy) that outlines how to implement a program with pragmatic and
aspirational (e.g., zero waste) targets for waste minimization.
The Strategy development is part of an ongoing effort to pursue waste reduction and recycling in the City.
In 2011, a Comprehensive Integrated Waste Management Plan1 was developed to address waste diversion
across the City. Strategies for corporate waste were noted, including tactics such as city operations developing
green procurement policies and an online materials exchange site to improving collection services and awareness
of diversion initiatives. The 2011 report estimated that waste generated from city operations is 7% of the total
unsorted material collected at the Brady Road Resource Management Facility.
This Strategy has adopted pragmatic and aspirational targets for waste minimization and an implementation
strategy to achieve them. This goal will complement the City’s concurrent endeavour to increase diversion of
residential waste to at least 50%, and to minimize waste in other sectors.
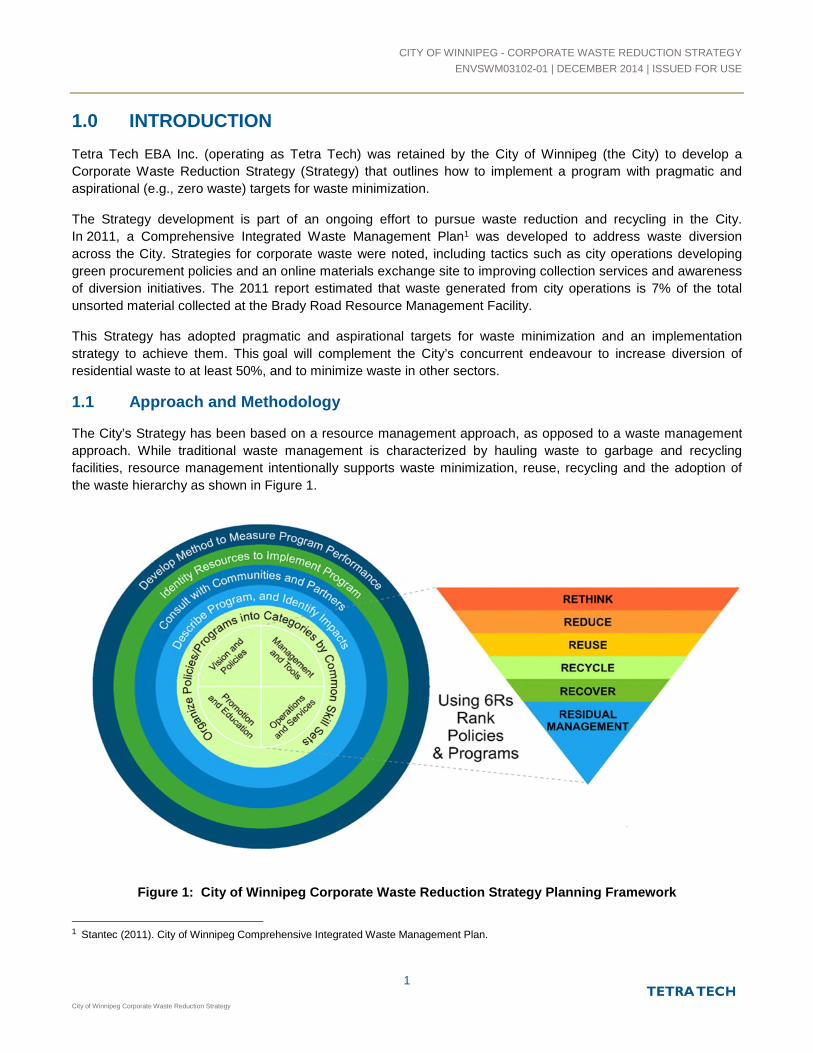
1.1 Approach and Methodology
The City’s Strategy has been based on a resource management approach, as opposed to a waste management
approach. While traditional waste management is characterized by hauling waste to garbage and recycling
facilities, resource management intentionally supports waste minimization, reuse, recycling and the adoption of
the waste hierarchy as shown in Figure 1.
Figure 1: City of Winnipeg Corporate Waste Reduction Strategy Planning Framework
1 Stantec (2011). City of Winnipeg Comprehensive Integrated Waste Management Plan.

CITY OF WINNIPEG - CORPORATE WASTE REDUCTION STRATEGY
ENVSWM03102-01 | DECEMBER 2014 | ISSUED FOR USE
2
City of Winnipeg Corporate Waste Reduction Strategy
Information gathering, interviews, waste audits, and building tours and assessments, and recommendations have
been developed within the planning framework with the groupings noted in Figure 1. This ensures that each
aspect of the solid waste management system is adequately assessed to inform successful implementation and
system change. It also reinforces use of the pollution prevention hierarchy to prioritize waste minimization and
then recycling and composting. The core focus of this strategy is identifying the policies and programs by the
common skill sets and organizational responsibilities including:
Vision and strategic policies;
Management systems and tools;
Operational infrastructure and services; and
Zero waste promotion and education programs.
1.2 Scope of the Study
The Strategy had several objectives, which are addressed in the following sections:
Section 1.3 – Establish facility categories and recommend suitable waste generation measurement
approaches;
Section 2.0 and 3.0 – Review existing policies, waste-related data and recycling programs;
Section 4.0 – The provision of waste auditing services at two representative City facilities;
Section 5.0 – Characterize corporate waste streams, diversion rates, and current management practices; and
Section 6.0 – The development of program alternatives, including the development of realistic, phased-in
waste reduction targets, to be considered by an Interdepartmental Advisory Committee.
The project outcomes included a number of program recommendations that will be considered and incorporated
into the City’s next phase, the development of future pilot projects.
1.3 Building and Facility Categories
Corporate facilities have been grouped to reflect common functionality and solid waste systems. This approach
will ensure that project outcomes including recommendations for program measurement, waste reduction and
diversion targets, and material streams are practical and applicable to the broad range of municipal facilities and
operations that comprise corporate facilities.
Defining building categories that group the many facilities owned and/or operated by the City, based on
similarities, can inform the estimation of solid waste generated at each facility. The groupings focus on the types
of activities and day to day operations and inform what materials are generated by category. Groupings also help
to hone in on opportunities for reducing the quantity of waste. The following table group’s facilities based on
similar waste management generating activities and other functional reasons to allow for the extrapolation of
waste management activities that occur on site. When these categories are confirmed, previous information
collected and tabulated—including the number of buildings and the current waste management contract types and
service responsibilities for these facilities—will be grouped as noted in Table 1 below. The data on the number of
buildings can be used to identify opportunities to expand what types of materials are collected within each facility
category, and determine other opportunities for system improvement.

CITY OF WINNIPEG - CORPORATE WASTE REDUCTION STRATEGY
ENVSWM03102-01 | DECEMBER 2014 | ISSUED FOR USE
3
City of Winnipeg Corporate Waste Reduction Strategy
Table 1: Proposed Facility Categories
Facility Category Examples DescriptionUnit Measurement
for Waste Generation
Corporate Office
City Hall, Planning Property &
Development, Police, and
Administration
Comparable administration and
office servicesStaff
Public Recreation,
Community Service
and Cultural Venues
Community Centre/Sports Venues
and Arena/Pools, Library, Museums
and Theatre
Mixed cerebral/physical
pursuits and city services
Visitors/
Membership
Operations and
Maintenance Yards
Transit Facilities, Garages and other
Maintenance/Construction areas
and projects
Unique waste stream for
equipment/vehicle maintenance
and construction
Bays/Equipment
Green SpacesParks, Green Spaces, Golf Course,
Cemeteries, and Tree Removal
Unique waste stream with
trees, woodchips, and
yard/garden trimmings
Area
Open Spaces
Public Use Waste Containers
(Street-side, Parks, Transit Stops,
Parking Lots, etc.)
Many public waste containers
that are managed through the
City
Containers
Public ServiceFire and Rescue Stations, Police,
DaycareGeneral living
Staff, Residents and/or
Students
An additional level of detail determined during the site interviews was who manages the building operations and
maintenance (custodial operations). It varies by building and can be City staff or contracted staff. In some
buildings, the City does not administer the operations and it is up to the building lease holder to obtain and
provide the waste and recycling services.
Currently there are at least six different collection contracts based on a range of service pickups for waste and
recycling collection from the City-run facilities. Contract language is typically limited to collection/disposal of bins,
with additional terms related to the reliability of the collection vehicles and servicing of the bins. There are no
specific mandates, targets, goals, or requirements to provide data to the City with respect to tonnage collected
that can be found in performance based and resource management-based contract types. There are penalties
built into these contracts to address improper disposal, but these conditions are reportedly difficult to
monitor/enforce.

CITY OF WINNIPEG - CORPORATE WASTE REDUCTION STRATEGY
ENVSWM03102-01 | DECEMBER 2014 | ISSUED FOR USE
4
City of Winnipeg Corporate Waste Reduction Strategy
2.0 INFORMATION GATHERING
Relevant waste management-related background information reviewed included: policies; bylaws; reports;
memos; purchasing records; waste disposal invoices; and current practices and contracts (janitorial and waste
hauler). A table of targets, and reported metrics at a number of high performing municipalities in North America
were also researched to further inform Strategy development and goal setting.
2.1 City Documents
Existing policies are essential to understand, since they set the framework for current and future initiatives.
Through policy analysis, relevant gaps can be identified and adjusted to empower management to prioritize waste
reduction and diversion opportunities for implementation.
Background data is also critical to inform the planning process. By understanding waste composition data, waste
generation, existing hauler contracts, and other aspects of a waste management system, current practices can be
assessed and a metrics baseline can be set to measure future success.
Table 2 provides a list of all documents reviewed as part of the project.
Table 2: References Summary Table
Reference Summary – How Relates to Project
POLICY AND PLANS
Materials Management Policy Provides governance of materials management including procurement policy. Stipulates
that other Council policies may be applicable to this Materials Management Policy
including but not limited to:
(a) The Purchasing Policy with Respect to Sustainable Development and Environmental
Issues adopted by Council on November 21, 1990
http://winnipeg.ca/finance/findata/matmgt/policy/policy.pdf
Purchasing Policy with respectto Sustainable Developmentand Environmental Issues
Corporate waste reduction is currently a goal within the policy including selecting
products that have the least harm to the environment.
http://www.winnipeg.ca/finance/findata/matmgt/policy/Sustainable%20Development%20
and%20Environmental%20Issues%20Policy.pdf
Our Winnipeg: A SustainableWinnipeg – Direction 05-02 and09-03
Direction 05-02 states: “Incorporate sustainable practices into internal civic operations,
programs and services” and contains the specific enabling strategy “create a corporate
waste diversion strategy for the organization, including baselines and benchmarks.”
Direction 09-03 calls for the establishment of long range goals for waste reduction within
the Winnipeg Public Service.
http://speakupwinnipeg.com/wp-
content/uploads/2011/07/aSustainableWinnipeg.July_.12.2011.WEB_.RGB_.pdf
Comprehensive IntegratedWaste Management Strategy(Stantec, 2011)
Provides direction for the City‘s waste management system with recommendations to:
improve current waste diversion programs, make progress towards zero waste and
address waste processing and disposal needs. The integrated waste management plan
defines that 7% of waste is generated from city operations.
CITY OF WINNIPEG - CORPORATE WASTE REDUCTION STRATEGY
ENVSWM03102-01 | DECEMBER 2014 | ISSUED FOR USE
5
City of Winnipeg Corporate Waste Reduction Strategy
Reference Summary – How Relates to Project
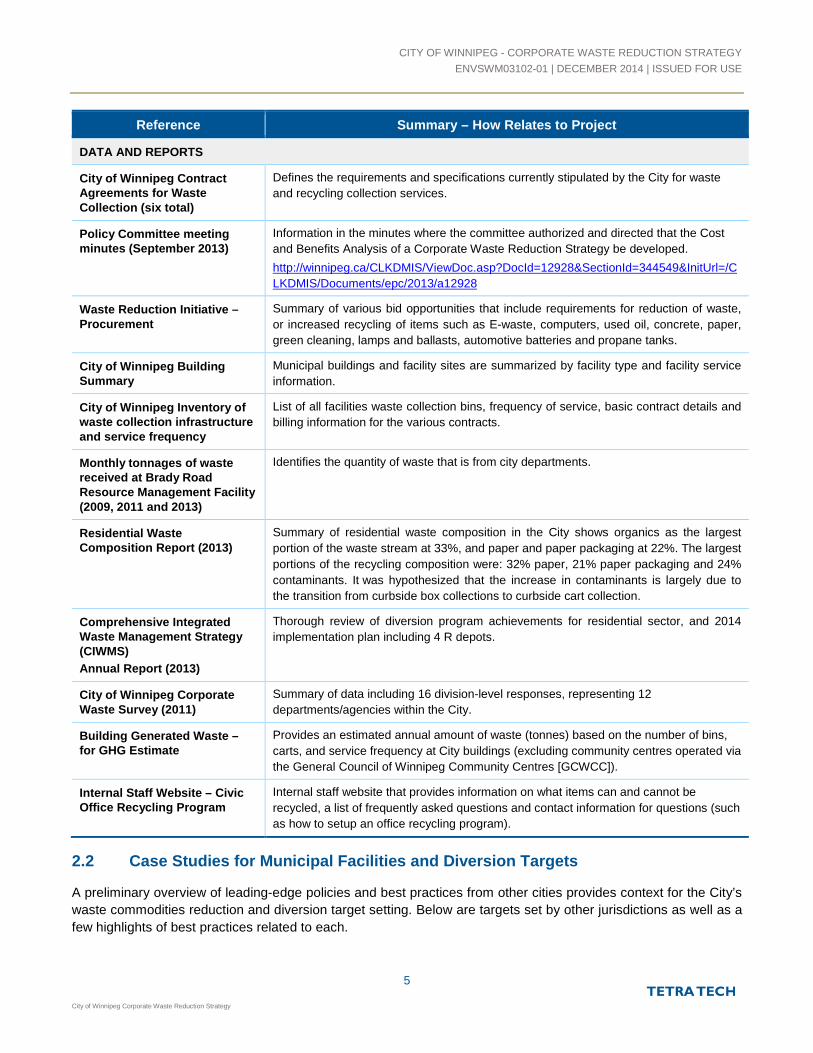
DATA AND REPORTS
City of Winnipeg ContractAgreements for WasteCollection (six total)
Defines the requirements and specifications currently stipulated by the City for waste
and recycling collection services.
Policy Committee meetingminutes (September 2013)
Information in the minutes where the committee authorized and directed that the Cost
and Benefits Analysis of a Corporate Waste Reduction Strategy be developed.
http://winnipeg.ca/CLKDMIS/ViewDoc.asp?DocId=12928&SectionId=344549&InitUrl=/C
LKDMIS/Documents/epc/2013/a12928
Waste Reduction Initiative –Procurement
Summary of various bid opportunities that include requirements for reduction of waste,
or increased recycling of items such as E-waste, computers, used oil, concrete, paper,
green cleaning, lamps and ballasts, automotive batteries and propane tanks.
City of Winnipeg BuildingSummary
Municipal buildings and facility sites are summarized by facility type and facility service
information.
City of Winnipeg Inventory ofwaste collection infrastructureand service frequency
List of all facilities waste collection bins, frequency of service, basic contract details and
billing information for the various contracts.
Monthly tonnages of wastereceived at Brady RoadResource Management Facility(2009, 2011 and 2013)
Identifies the quantity of waste that is from city departments.
Residential WasteComposition Report (2013)
Summary of residential waste composition in the City shows organics as the largest
portion of the waste stream at 33%, and paper and paper packaging at 22%. The largest
portions of the recycling composition were: 32% paper, 21% paper packaging and 24%
contaminants. It was hypothesized that the increase in contaminants is largely due to
the transition from curbside box collections to curbside cart collection.
Comprehensive IntegratedWaste Management Strategy(CIWMS)
Annual Report (2013)
Thorough review of diversion program achievements for residential sector, and 2014
implementation plan including 4 R depots.
City of Winnipeg CorporateWaste Survey (2011)
Summary of data including 16 division-level responses, representing 12
departments/agencies within the City.
Building Generated Waste –for GHG Estimate
Provides an estimated annual amount of waste (tonnes) based on the number of bins,
carts, and service frequency at City buildings (excluding community centres operated via
the General Council of Winnipeg Community Centres [GCWCC]).
Internal Staff Website – CivicOffice Recycling Program
Internal staff website that provides information on what items can and cannot be
recycled, a list of frequently asked questions and contact information for questions (such
as how to setup an office recycling program).
2.2 Case Studies for Municipal Facilities and Diversion Targets
A preliminary overview of leading-edge policies and best practices from other cities provides context for the City’s
waste commodities reduction and diversion target setting. Below are targets set by other jurisdictions as well as a
few highlights of best practices related to each.

CITY OF WINNIPEG - CORPORATE WASTE REDUCTION STRATEGY
ENVSWM03102-01 | DECEMBER 2014 | ISSUED FOR USE
6
City of Winnipeg Corporate Waste Reduction Strategy
Table 3: Case Studies for Municipal Facilities and Office Buildings
Location Diversion Target Best Practices Highlights
City of
Vancouver
Corporate Offices
80% by 2015
90% by 2020
Public Facilities
60% by 2015
70% by 2020
Waste reduction target:
10% by 2020
Developed a full time position: Corporate Zero Waste Coordinator.
Three key levels of engagement: 1) Waste hauler contract and equipment, 2)
Internal communications and equipment, and 3) Janitor engagement and
equipment.
Waste hauler contract and equipment included:
Weigh all waste streams;
Provide monthly reports;
Right-size all equipment; and
Pay tipping fee on actual weight of garbage.
Clear and easy signage and programs developed to align with residential
messaging for recycling and food scraps collection.
Focus on recycling stations, organics collection, and elimination of solo
garbage cans.
City of Vancouver is on track to meet all the targets.
Diversion rates are up to 91% in city facilities with the new systems.
Key success elements are engagement of all levels including executive staff,
janitors, waste haulers, and office staff. In particular, staff members have
accepted the removal of desk-side garbage cans and are taking responsibility
for managing their waste and using the zero waste stations.
Markham,
Ontario2
85% Passed Zero Waste policies to drive civic site waste reduction initiatives,
including promoting recyclable and compostable food service ware.
Went from over 500 solo garbage containers in Civic Centre to 45 central
stations without litter management issues over time.
Each employee is responsible for work area recycling and waste; the cleaning
contract was adjusted accordingly. Each employee gets a Workstation Kit with
reusable water bottle, mug, and paper recycle container.
All paper towels in washrooms switched to compostable stream.
Reusable cutlery and china are used in ‘Zero Waste Café’; other items are
compostable as specified by a food sense policy.
Extensive outreach campaign to staff, leadership, and public to highlight cost
savings, stewardship, and different purchasing approach.
Changed out garbage large bins with locked totes.
Victoria
Region,
Australia
90% Standardized wasted commodity streams in buildings for paper/cardboard,
organics, bottles and cans, and packaging/plastics; no ‘landfill containers’ at
desk side.
Non-working equipment sent for repair or arranged for proper disassembly
and recycling.
Signage refreshed on recycling containers to promote correct recycling
practices.
Conduct wasted commodity audit/assessment for standard measurement and
report findings to senior management team and staff.
2 Markham Targets Zero Waste: http://www.fcm.ca/Documents/presentations/2009/webinars/Zero_Waste_Markham_Facilities_EN.pdf.
CITY OF WINNIPEG - CORPORATE WASTE REDUCTION STRATEGY
ENVSWM03102-01 | DECEMBER 2014 | ISSUED FOR USE
7
City of Winnipeg Corporate Waste Reduction Strategy
Location Diversion Target Best Practices Highlights
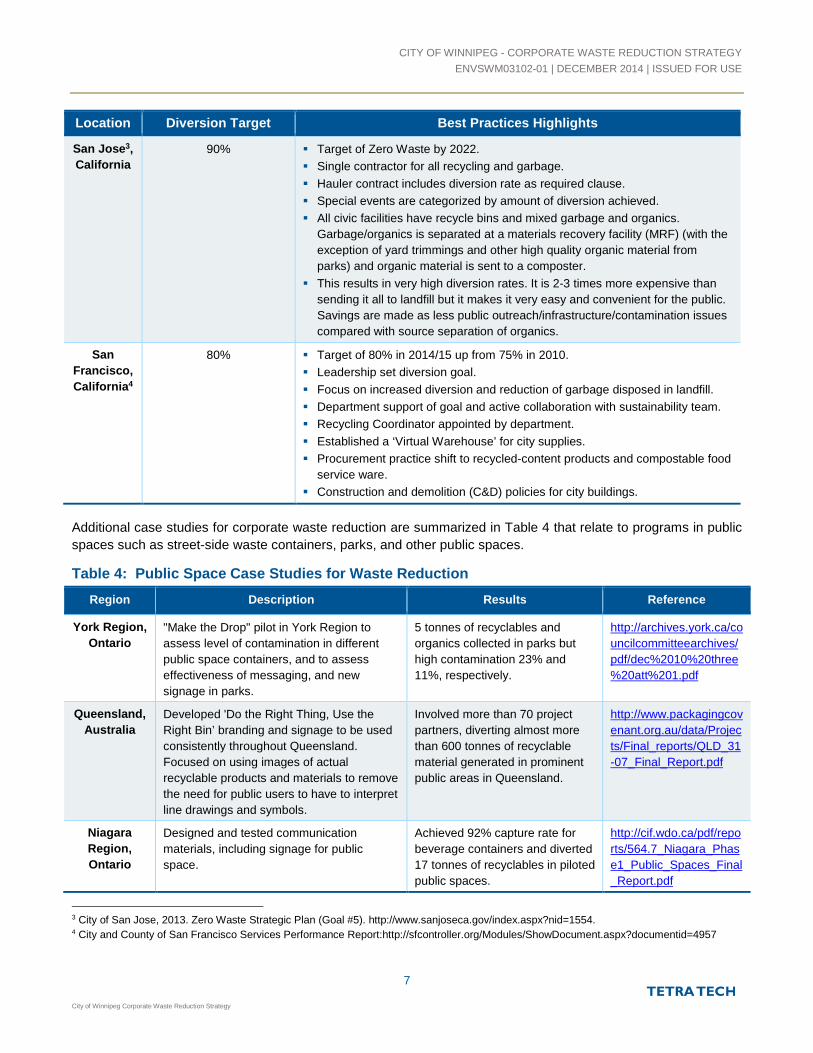
San Jose3,
California
90% Target of Zero Waste by 2022.
Single contractor for all recycling and garbage.
Hauler contract includes diversion rate as required clause.
Special events are categorized by amount of diversion achieved.
All civic facilities have recycle bins and mixed garbage and organics.
Garbage/organics is separated at a materials recovery facility (MRF) (with the
exception of yard trimmings and other high quality organic material from
parks) and organic material is sent to a composter.
This results in very high diversion rates. It is 2-3 times more expensive than
sending it all to landfill but it makes it very easy and convenient for the public.
Savings are made as less public outreach/infrastructure/contamination issues
compared with source separation of organics.
San
Francisco,
California4
80% Target of 80% in 2014/15 up from 75% in 2010.
Leadership set diversion goal.
Focus on increased diversion and reduction of garbage disposed in landfill.
Department support of goal and active collaboration with sustainability team.
Recycling Coordinator appointed by department.
Established a ‘Virtual Warehouse’ for city supplies.
Procurement practice shift to recycled-content products and compostable food
service ware.
Construction and demolition (C&D) policies for city buildings.
Additional case studies for corporate waste reduction are summarized in Table 4 that relate to programs in public
spaces such as street-side waste containers, parks, and other public spaces.
Table 4: Public Space Case Studies for Waste Reduction
Region Description Results Reference
York Region,
Ontario
"Make the Drop" pilot in York Region to
assess level of contamination in different
public space containers, and to assess
effectiveness of messaging, and new
signage in parks.
5 tonnes of recyclables and
organics collected in parks but
high contamination 23% and
11%, respectively.
http://archives.york.ca/co
uncilcommitteearchives/
pdf/dec%2010%20three
%20att%201.pdf
Queensland,
Australia
Developed 'Do the Right Thing, Use the
Right Bin’ branding and signage to be used
consistently throughout Queensland.
Focused on using images of actual
recyclable products and materials to remove
the need for public users to have to interpret
line drawings and symbols.
Involved more than 70 project
partners, diverting almost more
than 600 tonnes of recyclable
material generated in prominent
public areas in Queensland.
http://www.packagingcov
enant.org.au/data/Projec
ts/Final_reports/QLD_31
-07_Final_Report.pdf
Niagara
Region,
Ontario
Designed and tested communication
materials, including signage for public
space.
Achieved 92% capture rate for
beverage containers and diverted
17 tonnes of recyclables in piloted
public spaces.
http://cif.wdo.ca/pdf/repo
rts/564.7_Niagara_Phas
e1_Public_Spaces_Final
_Report.pdf
3 City of San Jose, 2013. Zero Waste Strategic Plan (Goal #5). http://www.sanjoseca.gov/index.aspx?nid=1554.4 City and County of San Francisco Services Performance Report:http://sfcontroller.org/Modules/ShowDocument.aspx?documentid=4957

CITY OF WINNIPEG - CORPORATE WASTE REDUCTION STRATEGY
ENVSWM03102-01 | DECEMBER 2014 | ISSUED FOR USE
8
City of Winnipeg Corporate Waste Reduction Strategy
2.3 Provincial Programs
In addition to the City’s waste reduction initiatives, the Province of Manitoba’s Waste Reduction Act5 regulates
several products through extended producer responsibility (EPR) programs. These products include electronic
waste, various hazardous materials (including used oil and tires), packaging and printed paper, and beverage
containers.
The Province of Manitoba has developed the Tomorrow Now Manitoba’s Green Plan6 and is currently undergoing
community input to develop a waste prevention and reduction strategy for the province, including setting diversion
targets for organics and C&D waste. A new aggressive Manitoba Waste Reduction and Prevention Strategy will
report on provincial waste reduction and prevention efforts and outline specific goals to enhance the province’s
performance. The strategy will focus on the following objectives:
Reducing the volume of waste generated and disposed;
Separating hazardous from non-hazardous waste; and
Improving waste management practices.
Through the Strategy, the Manitoba government has indicated that there will be a focus on organics diversion,
and will support municipal and community composting programs to achieve province-wide composting programs.
Current and planned future programs have been assessed for applicability to the corporate waste reduction
initiatives.
2.3.1 Waste Reduction and Pollution Prevention Fund
The Waste Reduction and Pollution Prevention (WRAPP) Fund supports waste reduction, pollution prevention,
and integrated waste management practices-related projects. Municipal corporations and local governments are
eligible to submit project proposals. Priority areas for funding include organics management and composting,
C&D waste management, pollution prevention, and integrated waste management planning and local government
partnerships to maximize the diversion of waste from landfill. The maximum grant available under this priority area
will usually not exceed $25,000, but grants up to $50,000 can be awarded.
A similar funding source that may be available from the Province is the Manitoba Composts program. It could be
suitable for City projects, such as piloting an organics collection program at City Hall. Projects that may be eligible
for funding include projects that have the potential to meet or exceed 50% diversion of waste from landfill,
promote green procurement and environmentally sound production practices, or implement institutional and
commercial organic wastes programs. Departments within the city can create project plans that can be eligible for
funding.
All project proposals are submitted using the WRAPP Fund application process. The WRAPP application
guideline is available at www.gov.mb.ca/conservation/pollutionprevention/wrapp/wrappfund.html. All projects
submitted will be evaluated through the WRAPP project review process.
5 Pollution Prevention Branch, Province of Manitoba.6 Manitoba Conservation and Water Stewardship, Tomorrow Now Manitoba’s Green Plan 2nd Edition (2014). Accessed online
www.manitoba.ca/conservation/tomorrownowgreenplan/

CITY OF WINNIPEG - CORPORATE WASTE REDUCTION STRATEGY
ENVSWM03102-01 | DECEMBER 2014 | ISSUED FOR USE
9
City of Winnipeg Corporate Waste Reduction Strategy
2.3.2 Waste Reduction and Recycling Support
Commencing July 1, 2009, Manitoba introduced the Waste Reduction and Recycling Support (WRARS) Levy of
$10 per tonne on waste disposed at Manitoba landfills. The WRARS Levy is intended to help discourage waste
generation and encourage increased recycling and waste diversion activities province-wide. As of
January 1, 2011, all Class 1, Class 2, and Class 3 landfills were required to remit the Levy to Green Manitoba.
All WRARS Levy revenues are deposited in the WRARS Fund. With the WRARS fund, Green Manitoba provides
an 80% municipal recycling support (WRARS Rebate) and retains the remaining 20% to fund provincial waste
program priorities. The provincial priorities identified in 2012 Tomorrow Now Green Plan were two-fold: organics
and C&D waste.
Through the WRARS fund the City of Winnipeg has an opportunity to reduce its waste bill through enhanced
diversion. That is to say the WRARS program provides an increased financial reward through enhanced
recycling/diversion. All waste diversion activities (e.g., wood chipping, composting, and recycling) are exempt
from the WRARS Levy.
2.4 Canadian Beverage Container Recycling Association
The Canadian Beverage Container Recycling Association (CBCRA) is a not-for-profit, industry-funded
organization whose membership includes beverage brand owners and distributors. CBCRA has set a plan to
meet the government-mandated target of recovering 75% of beverage containers sold in Manitoba. CBCRA
started collecting a $0.02 Container Recycling Fee (CRF) based on producer sales of sealed ready-to-serve
beverage containers holding soft drink, water, and juice beverages. This fee is used to pay for the cost of
collecting and processing beverage containers wherever they are generated.
Municipal partners, including a number of divisions at the City of Winnipeg, have been involved with CBCRA over
the past two years. At this point, over 100 municipal partnerships have been signed and most of them have
containers in place. CBCRA has been in contact with all City departments about opportunities to install beverage
container recycling containers around the City and in public facilities. CBCRA has been offering to install long
lasting beverage container recycling containers at no cost. However the City becomes responsible for the
servicing and emptying of the container, and must contract and cover the cost for the collection of the materials
placed in the bin. Beverage container recycling containers installed are generally paired with garbage cans;
however there is no consistent plan to determine their placement and installation and use within the City.
For public and government buildings a plan has been developed in partnership with Green Manitoba for the
assessment, roll-out, and measurement of beverage container recovery (pre and post waste audits).
Current and future programs should capitalize on opportunities to work with CBCRA towards the mutual goal of
enhanced waste diversion. However, it is important for the City to determine a strategy for working with CBCRA
as costs for the programs are shared. The City is responsible for collection and currently brings all collected
material to the single stream Emterra MRF that accepts all recyclable materials, not just beverage containers.
Therefore it would be of benefit to the City to work with CBCRA to develop signage and a program that accepts all
recyclables containers and further optimizes the existing infrastructure to maximize diversion.

CITY OF WINNIPEG - CORPORATE WASTE REDUCTION STRATEGY
ENVSWM03102-01 | DECEMBER 2014 | ISSUED FOR USE
10
City of Winnipeg Corporate Waste Reduction Strategy
3.0 CURRENT WASTE MANAGEMENT SYSTEMS
The information presented in Table 5 is the total quantity of waste disposed at the Brady Road Resource
Management Facility. The tonnages are based on the City’s tracking system where waste is identified and applied
a specific item coding number when it arrives. However this would only include waste that arrives in City operated
trucks and not necessarily City waste that arrives at the landfill via contracted service providers. Additional waste
that is collected by private haulers at City buildings has been estimated to develop the annual greenhouse gas
inventory for the City. These numbers are shown below in Table 5 and also included in Figure 2.
Table 5: Quantity of Waste Disposed and Number of Employees
Method Item Material Description 2009 2011 2013 Units
Scale RecordsCity Refuse – City Depts. (Zoo,
Streets, etc.)5,991 7,781 11,453
Tonnes Disposed at Brady
Road Resource
Management Facility
Scale Records Construction / Demolition – City 896 2,852 1,414
Tonnes Disposed at Brady
Road Resource
Management Facility
Total Measured Corporate Solid Waste 6,887 10,633 12,867 Tonnes Disposed
Estimated based on
inventory of bins and
frequency of service
Estimated waste collected from
City facilities 3,200 3,200 3,841 Estimated Tonnes Disposed
Total Measured and Estimated Corporate Solid Waste 10,087 13,833 16,708 Tonnes Disposed
Number of Employees at the City 8,420 8,673 8,843Full time equivalent
employees
City of Winnipeg Population 664,960 677,830 699,346 City Estimated Population
The “estimated waste collected from City facilities” category is derived from the corporate-generated solid waste
totals used in the annual report on the Corporate Climate Change Action Plan and related GHG inventory. This
calculation is estimated based on bin/cart sizes and pick-up frequency for waste collected at city buildings
(excluding community centres operated via the GCWCC).
In total there are 164 buildings included in this inventory list, of which 140 have their bins/carts and pickup
frequency tracked. There are 24 buildings with no information on the number of bins/carts and pickup frequency.
The total tonnes of corporate waste disposed indicate:
Approximately 23% of the total is from the City facilities;
Approximately 67% is waste collected from park and street bins by City staff; and
The remainder of the total includes primarily C&D waste.

CITY OF WINNIPEG - CORPORATE WASTE REDUCTION STRATEGY
ENVSWM03102-01 | DECEMBER 2014 | ISSUED FOR USE
11
City of Winnipeg Corporate Waste Reduction Strategy
Additionally based on the City inventory list, there are 165 buildings that receive garbage service, with 24 of them
listed as receiving private collection which is not included in the presented data. In addition, there are a number of
City departments that operate out of leased buildings where the property manager is responsible for providing
waste services to the building. This waste generation would be included in the commercial waste category at the
landfill, and not tracked in the numbers presented.
Figure 2: Tonnes of Corporate Solid Waste Disposed - Measured and Estimated 2007 - 2013
It is unknown when the existing building inventory of waste bins/carts was last updated. As of September 2014
this list is in the process of being updated. An application form will be distributed to all City properties asking for
confirmation on the number of bins, type of bins (carts vs bins), and address other concerns related to waste and
recycling services so that the inventory can be updated and confirmed.
Other than a decrease in 2009, the total quantity of solid waste disposed at the city shows a year over year
increase, averaging 7% per year over the past three years, compared to an average increase in the City
population of 3%, and increase in the number of employees of 2%. The quantity of waste is growing proportionally
faster than both the City estimated population, and the size of the City workforce.
The City has recycling areas within municipal buildings, diverting blue box materials, and paper from the waste
stream. However there is no information related to the quantity of recycling collected as this is not currently
tracked and therefore all composted/recycled materials are excluded from current measurement data. Only
landfilled waste and City landscaping waste is scaled and directly measured as a separate category. City
landscaping waste including wood waste from diseased elm trees accounts for nearly 5,000 Tonnes per year.
This city landscaping waste which is mostly diseased elm trees is chipped and is being stockpiled within the
landfill for future use (e.g., bulking agent for composting operations).
0
2,000
4,000
6,000
8,000
10,000
12,000
14,000
16,000
18,000
2007 2008 2009 2010 2011 2012 2013
To
nn
es
of
La
nd
fill
ed
Ga
rba
ge
at
Bra
dy
La
nd
fill
Measured City Refuse - City Departments Measured Construction / Demolition Waste - City
Estimate Waste Collected from City Facilities

CITY OF WINNIPEG - CORPORATE WASTE REDUCTION STRATEGY
ENVSWM03102-01 | DECEMBER 2014 | ISSUED FOR USE
12
City of Winnipeg Corporate Waste Reduction Strategy
4.0 WASTE COMPOSITION
The two facilities included in the waste composition study were identified in conjunction with City staff to provide a
representative sample for the Office and Public Recreation categories. These audits also provide a sense of
waste and recycling behaviour across the overall corporate sector. The waste audits provide baseline waste
composition data that help inform the overall Strategy.
This section presents the waste composition and recycling composition results by sorting stream. A summary of
the total amounts of garbage, recyclables, stewarded materials through EPR programs, and compostable
organics found in the garbage and recycling streams are provided for each facility; outcomes are tabulated and
the weighted means are presented in a corresponding pie chart. The section concludes with waste generation by
material per facility. Weighted percentages and composition by secondary categories can be found in the tables in
Appendix B.
The study was conducted from July 28, 2014 to July 31, 2014 and took place at two facilities being audited;
510 Main Street (City Hall) and 999 Sargent Avenue (Cindy Klassen Recreation Complex). The City Hall audit
included one garbage sample and one recycling sample, each representing one-day of waste and recycling
generation. The Cindy Klassen Recreation Complex audit included two garbage samples and one recycling
sample, representing two days of waste and three days of recycling generation. During site visits, materials were
tracked from origin to the point of removal from the facility as programs were assessed.
4.1 Methodology
This section provides an overview of how garbage and recycling was collected and sampled, and outlines other
key factors and considerations for the study. The Tetra Tech team prepared a sampling plan customized for this
study taking into consideration data completeness, scheduling, safety, and budgetary constraints. The audit
categories were chosen to represent the waste composition, and took into account the way each category of
material can be managed at the City including recyclable, compostable, products handled through product
stewardship programs, and garbage. Sampling and sorting was conducted in a statistically defensible manner in
accordance with the methodology set out in the Recommended Waste Characterization Methodology for Direct
Waste Analysis Studies in Canada (Canadian Council of Ministers of Environment [CCME] 1999).
The City and the Tetra Tech site supervisor worked closely with the facility site supervisors to coordinate selection
of the samples with minimal interruption of daily operations. Sorting areas were provided on-site at the facility and
the audits were conducted by two Tetra Tech employees who are trained on safety and material sorting
procedures. Personal protective equipment was used by staff to the specifications of Tetra Tech’s Health and
Safety Plan.
The garbage and recycling samples were stored on-site. The samples sorted were 100% of the garbage/recycling
generated between pick up days and depending on the location represented a one, two, or three day period.
Sorting containers were weighed in advance to determine the tare weight. The 45 categories of solid waste were
then sorted and weighed using a calibrated electronic scale and then disposed of as appropriate. Photos were
taken to document each load and provide a representative cross section of materials. Data collection logs were
reviewed at the end of the sort to ensure accuracy, and then scanned and compiled manually at the end of the
field work.
4.2 Public Recreation – Cindy Klassen Recreation Complex
The Cindy Klassen Recreation Complex offers a variety of amenities including the West End Library, a small
restaurant/café, a 50 metre competitive pool and 25 metre lap area with viewing area, a 186 metre indoor sport

CITY OF WINNIPEG - CORPORATE WASTE REDUCTION STRATEGY
ENVSWM03102-01 | DECEMBER 2014 | ISSUED FOR USE
13
City of Winnipeg Corporate Waste Reduction Strategy
track, a large weight room fully equipped with free weights, universal multi-gym stations, a cardio room, and a
multi-purpose room with mirrors. There are also four offices located on-site. The outdoor grounds area includes a
lawn bowling area and track. In the winter, the track becomes an outdoor ¼ mile Speed Skating Oval. There is
parking for approximately 170 cars, and the facility is well used year round.
The Complex has a 4.5 yard front-end garbage bin that is located behind the facility near the service entrance for
maintenance vehicles. The garbage bin is emptied twice a week through the city contract with BFI. There are ten,
360 L recycling carts that are located by the front entrance of the Complex. Recycling carts are emptied once a
week through the city contract with Emterra. Custodial staff members are responsible for emptying all of the
garbage and recycling containers throughout the building and putting the material into the garbage bin or
recycling carts.
Two garbage samples were sorted at the Cindy Klassen Recreation Complex which together made up all the
garbage generated over a two-day period. The data was summarized and is presented in Table 6. The first
sample was from garbage bags that were left outside the front-end bin in the equipment parking area, and the
second sample was the material that was put into the front-end bin. The total weight of the samples was 175.8
kilograms (kg).
Table 6: Garbage Composition - Cindy Klassen Recreation Complex
Material Stream Weight (kg) Composition
Garbage 43.4 24.7%
Recyclable 57.2 32.5%
Compostable 75.2 42.8%
Stewarded Materials 0 0%
TOTAL 175.8 100.0%
Figure 3: Percent Composition of the Garbage Stream – Cindy Klassen Recreation Complex
The largest portion of the garbage stream by weight was compostable organics, averaging 43%. This was
primarily soiled paper (paper towels from the wash rooms, change rooms, and from wiping off gym equipment
after each use), food waste (from the cafe), and yard and garden waste (primarily weeds and small shrub
Garbage25%
Recyclables32%
CompostableOrganics
43%

CITY OF WINNIPEG - CORPORATE WASTE REDUCTION STRATEGY
ENVSWM03102-01 | DECEMBER 2014 | ISSUED FOR USE
14
City of Winnipeg Corporate Waste Reduction Strategy
pruning’s). The second largest portion of the garbage stream by weight was recyclables, averaging 33%. This
was primarily a large quantity of cardboard (41.0 kg) with some mixed paper and recyclable containers such as
beverage containers (water bottles), food packing, drinks cartons, and empty shampoo and personal care product
containers. The large quantity of cardboard was from the front-end garbage bin. The cardboard was large
cardboard boxes that were flattened but did not easily fit into the recycling carts on-site. The cardboard was likely
placed in the front-end garbage bin as it was more convenient and easier than having to flatten and maneuver it
into the recycling carts.
The recycling sample sorted at the Cindy Klassen Recreation Complex was generated over a three day period.
The total weight of the samples was 27.0 kg and the data is summarized in Table 7. Recyclables made up 95% of
the recycling stream by weight, and the remaining 5% was considered contamination. The contamination included
some paper towel, disposable cups (i.e., polycoated paper), a metal piece of gym equipment, and non-recyclable
plastics such as films (plastic bags and cellophane wraps).
Table 7: Recycling Composition – Cindy Klassen Recreation Complex
Material Stream Weight (kg) Composition
Recyclable 25.7 95.4%
Contamination – Garbage 1.2 4.3%
Contamination – Compostable 0.1 0.4%
Contamination – Stewarded Materials 0 0%
TOTAL 27.0 100.0%
Figure 4: Percent Composition of the Recycling Stream – Cindy Klassen Recreation Complex
Using the weight of both the garbage and recycling collected over the two or three day period the overall diversion
rate for the Cindy Klassen Recreation Complex was calculated to be 13.3% (see Table 8). For material that can
go in the recycling stream, there is a diversion rate of 32.1%. As seen in Table 6, the diversion for the facility was
impacted because of the high quantities of recyclable materials and especially cardboard found in the garbage.
The amount of recyclables found in the garbage was more than double the amount in the recycling. In addition,
compostable organics which make up 37% of the total waste composition represent a large portion of the garbage
Garbage4%
Recyclables95%
CompostableOrganics
1%

CITY OF WINNIPEG - CORPORATE WASTE REDUCTION STRATEGY
ENVSWM03102-01 | DECEMBER 2014 | ISSUED FOR USE
15
City of Winnipeg Corporate Waste Reduction Strategy
stream and a big opportunity to increase diversion if the material were source separated. If all recyclable material
was placed in the recycling, a diversion rate of up to 42% could be achieved, and if all recyclables and
compostable materials were diverted, a diversion rate of up to 79% could be achieved.
Table 8: Overall Material Diversion Rate – Cindy Klassen Recreation Complex
Material StreamWeight From
Recycling Bins (kg)
Weight From
Garbage Bins (kg)
Combined Recycling
and Garbage (kg)
Apparent
Diversion1 (%)
Garbage - 43.4 43.4 -
Recyclable 27.0 57.2 84.2 32.1%
Compostable - 75.2 75.2 -
Stewarded Materials2 - 0 0 -
TOTAL 27.0 175.8 202.8 13.3%1 Apparent diversion is the total mass of waste in the recycling bin, as a proportion of the total mass of waste generated.2 Stewarded Materials include only items found in recycling or garbage bins. There are a number of stewarded materials that are collected and
handled separately from the recycling and garbage stream and their total is not included in this waste audit.
The diversion rate for different recyclable materials was broken down by secondary category type. For the full
description of the different categories, refer to the tables in Appendix B. Glass and paper have the highest
diversion rates at 90.2% and 51.7% respectively. Metal and plastic beverage containers have a diversion rate of
approximately 40%, and glass beverage containers have a diversion rate of over 90%.
Table 9: Diversions Rates of Recyclables – Cindy Klassen Centre
Material StreamWeight From
Recycling Bins (kg)
Weight From
Garbage Bins (kg)
Combined Recycling
and Garbage (kg)
Actual
Diversion2 (%)
Paper - fine, officemagazines, newsprint 7.7 7.2 14.9 51.7%
Clean Old CorrugatedCardboard 8.6 41.8 50.4 17.1%
Drink box - Juice Boxes 0.1 0.7 0.8 6.7%
Drink box - Dairy 0.1 0.3 0.4 14.3%
Plastic BeverageContainers (Non-Diary) 2.6 3.8 6.4 40.6%
Rigid plastic containersand packaging with arecycling triangle #1-7
1.7 2.3 4.0 42.5%
Metal Beveragecontainers 0.4 0.5 0.9 47.1%
Food Containers alltypes - 0.1 0.1 -
Glass beveragecontainers 4.6 0.5 5.1 90.2%
Food containers - - - -
TOTAL 25.7 57.2 82.9 31.0 %2 Actual diversion is the total mass of waste in the recycling bin, minus contamination, as a proportion of the total mass of waste generated.

CITY OF WINNIPEG - CORPORATE WASTE REDUCTION STRATEGY
ENVSWM03102-01 | DECEMBER 2014 | ISSUED FOR USE
16
City of Winnipeg Corporate Waste Reduction Strategy
4.2.1 Discussion
During the site tour, it was observed that there were many locations that had a garbage container only.
For example in the lobby area, there were eight garbage containers and one recycling container. This was also
the case in other areas including the workout area upstairs by the track, and in the change rooms. To achieve a
high diversion rate or recyclables, recycling containers should be as convenient, if not the more convenient option
for users of the facility. All garbage containers should be accompanied by a recycling container. It would be
recommended that a number of waste containers be removed from the facility, and all locations where garbage
containers remain have both garbage and recycling containers. In addition there are a number of best practices
around the use of container placement, and clear and consistent signage on the recycling that can help improve
the recycling diversion rate.
Other recycling programs that were observed included the Call2Recycle Battery Recycling at the information
desk, where a special recycling box existed where users of the facility can dispose of batteries and cell phones.
All pool chemicals containers are taken back by the supplier when new chemicals are delivered.
Staff at the facility also mentioned that a number of residents bring recycling to the complex and deposit it in the
blue carts that are at the front entrance to the facility. They believe the residents are from the apartments in the
neighbourhood who do not have recycling services. On a typical week, staff commented that all of the recycling
carts would be full and sometimes overflowing with recycling on collection day. It is positive to see residents
desire to recycle, however, it creates additional demand on the resources at the complex. This may indicate that
the number of carts are inadequate or may need to be resized and replaced with a recycling bin.
4.3 Corporate Office - City Hall
City Hall includes approximately 500 offices in the main building and 50 offices in the council building. Each office
floor has a small kitchen area for staff to use. There is a restaurant/café on-site.
City hall has two 2.25 yard front-end garbage bins that are located by the service ramp in the maintenance
entrance. The garbage bins are emptied six times a week through the city contract with BFI. There are eight,
360 L recycling carts in the same area. They are emptied twice a week through the city contract with Emterra.
Custodial staff are responsible for empting all garbage and recycling containers in all the offices and meeting
rooms and bringing the material to the main waste area each day. The restaurant is responsible for bringing their
waste and recycling generated in the café.
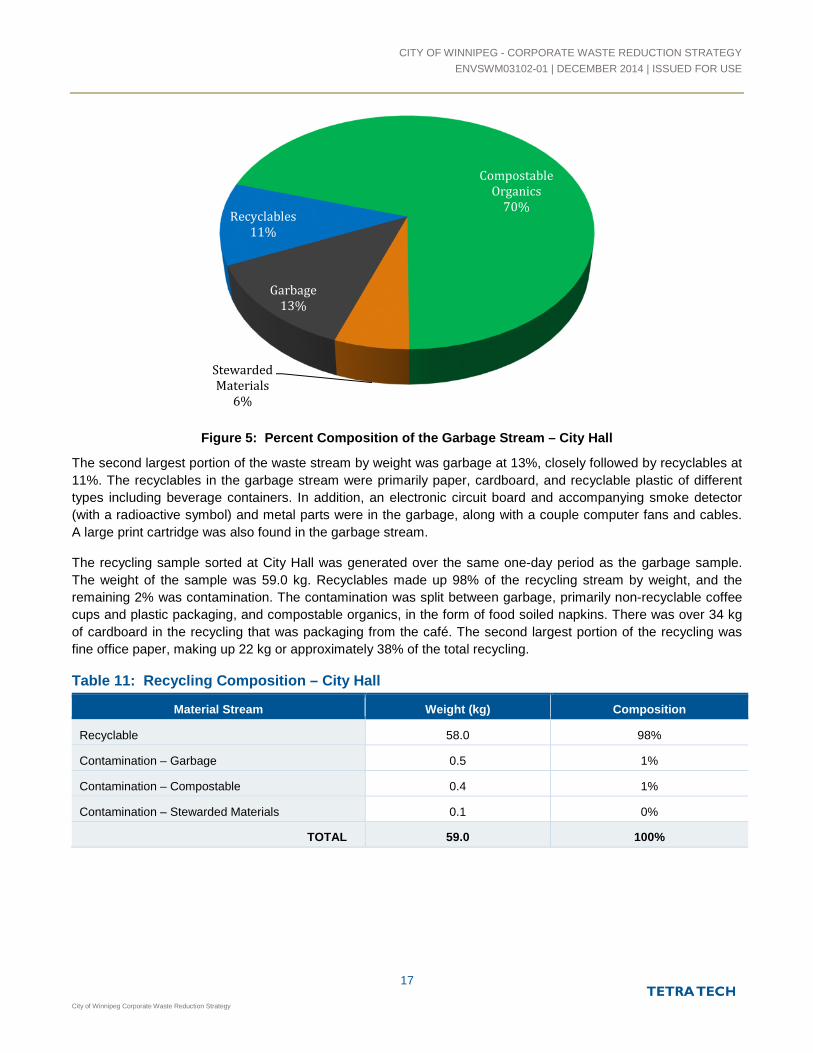
The garbage sample sorted at City Hall was generated over a one-day period. The total weight of the sample was
54.6 kg. The largest portion of the waste stream by weight was compostable organics, at 70%. This was primarily
food waste (27 kg) and food soiled paper and paper towel (10 kg). The food waste was predominantly restaurant
food waste from the on-site café, including food scraps from the kitchen prep area.
Table 10: Garbage Composition – City Hall
Material Stream Weight (kg) Composition
Garbage 7.0 13%
Recyclable 6.2 11%
Compostable 38.3 70%
Stewarded Materials 3.1 6%
TOTAL 54.6 100%
CITY OF WINNIPEG - CORPORATE WASTE REDUCTION STRATEGY
ENVSWM03102-01 | DECEMBER 2014 | ISSUED FOR USE
17
City of Winnipeg Corporate Waste Reduction Strategy
Figure 5: Percent Composition of the Garbage Stream – City Hall
The second largest portion of the waste stream by weight was garbage at 13%, closely followed by recyclables at
11%. The recyclables in the garbage stream were primarily paper, cardboard, and recyclable plastic of different
types including beverage containers. In addition, an electronic circuit board and accompanying smoke detector
(with a radioactive symbol) and metal parts were in the garbage, along with a couple computer fans and cables.
A large print cartridge was also found in the garbage stream.
The recycling sample sorted at City Hall was generated over the same one-day period as the garbage sample.
The weight of the sample was 59.0 kg. Recyclables made up 98% of the recycling stream by weight, and the
remaining 2% was contamination. The contamination was split between garbage, primarily non-recyclable coffee
cups and plastic packaging, and compostable organics, in the form of food soiled napkins. There was over 34 kg
of cardboard in the recycling that was packaging from the café. The second largest portion of the recycling was
fine office paper, making up 22 kg or approximately 38% of the total recycling.
Table 11: Recycling Composition – City Hall
Material Stream Weight (kg) Composition
Recyclable 58.0 98%
Contamination – Garbage 0.5 1%
Contamination – Compostable 0.4 1%
Contamination – Stewarded Materials 0.1 0%
TOTAL 59.0 100%
Garbage13%
Recyclables11%
CompostableOrganics
70%
StewardedMaterials
6%

CITY OF WINNIPEG - CORPORATE WASTE REDUCTION STRATEGY
ENVSWM03102-01 | DECEMBER 2014 | ISSUED FOR USE
18
City of Winnipeg Corporate Waste Reduction Strategy
Figure 6: Percent Composition of the Recycling Stream – City Hall
Using the weight of the garbage, recycling, and shredded paper collected over the one-day period the overall
diversion rate for the City Hall was calculated to be 61% (see Table 12). For material that can go in the recycling
stream, there is a diversion rate of 90.5%. As seen in Table 12, the diversion for the facility was impacted
because of the high quantities of organics in the garbage. Garbage only makes up 6% of the total waste
generated at City Hall.
Compostable organics made up 34% of the total waste composition, and represent a large portion of the garbage
stream and the largest opportunity to increase diversion if the material were source separated. If all recyclable
material was placed in the recycling, a diversion rate of up to 67% could be achieve, and if all recyclables and
compostable materials were diverted, along with stewarded materials managed properly a diversion rate of up to
95% could be achieved. It should be noted that not all material in these categories could be easily composted or
recycled. The most common example was the high number of single use disposable coffee pods (Tassimo),
where the coffee is sealed in a small plastic cup with a foil top. All materials are compostable or recyclables, but
generally users of the coffee pods do not take the time to separate the materials into the appropriate waste
streams.
Table 12: Overall Material Diversion Rate – City Hall
Material StreamWeight From
Recycling Bins (kg)
Weight From
Garbage Bins (kg)
Combined Recycling
& Garbage (kg)
Apparent
Diversion1 (%)
Garbage - 7.0 7.0 -
Recyclable 59.0 6.2 65.2 90.5%
Compostable - 38.3 38.3 -
Stewarded Materials2 - 3.1 3.1 -
Secure Shredded Paper3 26.0 - 26.0 100%
TOTAL 85.0 54.6 139.6 61.0%1 Apparent diversion is the total mass of waste in the recycling bin, as a proportion of the total mass of waste generated.2 Stewarded Materials include only items found in recycling or garbage bins. There are a number of stewarded materials that are collected and
handled separately from the recycling and garbage stream and their total is not included in this waste audit.3 Secure Shredded Paper weight for the one-day period was estimated based on the total July 2014 weight provided by AllMOVE
Garbage1%
Recyclables98%
CompostableOrganics
1%

CITY OF WINNIPEG - CORPORATE WASTE REDUCTION STRATEGY
ENVSWM03102-01 | DECEMBER 2014 | ISSUED FOR USE
19
City of Winnipeg Corporate Waste Reduction Strategy
The diversion rate for different recyclable materials was then broken down by secondary category type. Paper
and Cardboard have the highest diversion rates at 89.3% and 97.5% respectively. These two categories are
driving the overall recycling diversion rate since combined they made up 92% of all recyclable material generated
in the City Hall audit sample.
Table 13: Diversions Rates of Recyclables – City Hall
Material StreamWeight From
Recycling Bins (kg)
Weight From
Garbage Bins (kg)
Combined Recycling
& Garbage (kg)
Actual
Diversion2 (%)
Paper - fine, officemagazines, newsprint 21.8 2.6 24.4 89.3%
Secure Shredded Paper 26.0 - 26.0 100%
Clean Old CorrugatedCardboard 34.4 0.9 35.3 97.5%
Drink box - Juice Boxes 0.1 0.1 0.2 33.3%
Drink box - Dairy 0.3 0.1 0.4 75.0%
Plastic Beverage Containers(Non-Diary) 0.5 0.5 1.0 50.0%
Rigid plastic containers andpackaging with a recyclingtriangle #1-7
0.5 1.0 1.5 33.3%
Metal Beverage containers 0.4 0.5 0.9 44.4%
Food Containers all types 0.1 0.5 0.6 9.1%
Glass beverage containers 0 0 0 -
Food containers 0 0 0 -
TOTAL 84.0 6.2 138.6 61.0%2 Actual diversion is the total mass of waste in the recycling bin, minus contamination, as a proportion of the total mass of waste generated.
Because garbage makes up such a low proportion of the waste stream, only 6%, City Hall would need to capture
close to 100% of all recyclables and compostable organics to achieve a 90% diversion rate; 90% would be an
achievable diversion rate for buildings where users are predominantly City staff who can easily be engaged in a
zero waste program. This target could be achieved by providing separate organics bins, improving signage, and
educating staff with a particular focus on organics, paper, and cardboard as they make up the largest portion of
recyclable and compostable materials found in the garbage.
4.3.1 Discussion
During the site tour, it was observed that there were a few locations in meeting rooms that had a garbage
container only. The capacity of the garbage containers in each office was the same as the recycling containers.
Analysing the data from the waste composition, it can be seen that more recycling is produced than garbage
throughout the building, and that the capacity of garbage containers should be smaller than the capacity of
recycling containers. This change can also help foster a change in behaviour as it prioritizes and shows the
importance of recycling over garbage. Items such as beverage containers saw a lower diversion rate overall and
this could be because recycling containers are not as common as garbage containers throughout the building.
Additionally improved signage and information could improve the usage of recycling containers at City Hall.

CITY OF WINNIPEG - CORPORATE WASTE REDUCTION STRATEGY
ENVSWM03102-01 | DECEMBER 2014 | ISSUED FOR USE
20
City of Winnipeg Corporate Waste Reduction Strategy
Some staff at the facility had concerns that the recycling collected by the custodial staff would end up in the
garbage stream. It was observed that the carts used by custodial staff to collect garbage and recycling only have
one spot for a large garbage bag, and staff need to tie a second separate bag to the service cart for the recycling.
This would not be seen by staff and would lead to the concern that recyclables were just being dumped into the
garbage. Better equipment such as service carts that have the proper compartments and space to separate
recyclables would help all parties identify the importance and method used to collect recycling at City Hall.
5.0 SITE INTERVIEWS BY FACILITY CATEGORY
Tetra Tech reviewed the current recycling system through questionnaires and site visit surveys to get a clear
understanding of current practices, barriers, and successes to build upon. Detailed site visits, where materials
were tracked from origin to the point of removal from the facility, were conducted at two facilities to examine
current procedures for recycling and garbage collection. In addition, parks, street side containers, golf courses,
and a number of city offices were visited and interviews were conducted. A description and analysis of site visits
are described in Section 5.0 and a photo log can be found in Appendix C.
To supplement this background research, interviews with key City management and facilities staff were
undertaken during the week of July 28, 2014. The Tetra Tech project team conducted 12 in person interviews with
departments across the range of facility categories and additional services. This included City staff from custodial,
operational, administration and management. In addition, a phone interview was conducted with the Corporate
Information Technology Department. A copy of the general questions covered during the interviews is included in
Appendix D.
5.1 Corporate Offices
The majority of City operated office buildings have recycling collection provided through a City wide waste and
recycling hauling contract. Recycling collection is single stream, the same as the residential program in the City,
which allows specific items to be mixed into one cart including paper, cardboard, plastics, metal, and glass.
There are also a number of City offices that are in leased building space, where the lease holders are responsible
for providing waste and recycling collection for the building.
Facilities are serviced by in-house building or contract service workers. About 40% of custodial work is done by
City staff, and 60% is contracted out. There are also leased buildings that are primarily cleaned by contract
service workers. Custodial contracts include collection of garbage or recycling in buildings. The aquatics and
recreation centers have contracted hourly staff, and police have a mixture of some city and some contracted staff
for building services. Custodial staff empties all containers in every office (every day) and all restrooms,
boardrooms, and kitchen areas. If there are private businesses in the building such as restaurants, the business is
responsible for their own cleaning and removal of waste and recycling to the garbage bins on-site.
During the building tour of City Hall, it was found that most/all offices had blue containers (that were the same size
as the garbage containers). Recycling containers were typically unlined, and garbage containers were lined.
Some meeting rooms and hallways only had solo garbage containers, and the kitchen recycling containers were
often not labeled and were a different type and/or colour in some kitchens. Generally recycling containers were
not labeled and the colour of the container (blue) was relied upon to differentiate between the recycling and the
garbage container. Small shredders were located throughout the office to handle confidential paper, which was
then sent for recycling and managed through a separate paper shredding contract. Several kitchens had water
coolers, reusable dishware and cutlery, and most areas had dishwashers. To support paper waste reduction,
copiers were set to print double-sided default and desktop printers have been phased out. Council chambers also
have computer work stations at all locations allowing paperless agendas for council meetings.

CITY OF WINNIPEG - CORPORATE WASTE REDUCTION STRATEGY
ENVSWM03102-01 | DECEMBER 2014 | ISSUED FOR USE
21
City of Winnipeg Corporate Waste Reduction Strategy
The City currently has some staff champions who are leading the way in developing waste reduction and
diversion programs. In the period from May to September 2014, an office composting program being piloted by
approximately 50 employees in the Urban Planning Division has diverted over 150 kg of organic waste.
Areas for Improvement
No consistency in container placement, container style/colour/type, and signage for recycling in hallways,
kitchen areas, and meeting rooms.
Every office has large garbage and recycling containers that are emptied daily. The capacity of the garbage
container and frequency of service is higher than necessary for a typical office.
Lack of knowledge about what is allowed in the recycling containers.
Staff do not know who to ask if there were questions about the program or for unique items such as batteries,
cell phones, etc.
No formal program for stewarded items such as cell phones, batteries, other potentially hazardous waste
such as paints, CFLs, etc.
Desire for food scraps containers in kitchens.
Restaurant produces majority of food scraps that go in the garbage.
Communication is difficult – issues with waste and recycling pickup or service are supposed to be reported
through 311 – and often requires a call back and communication with various levels of staff before a problem
can be identified and solved.
Overall, staff utilized recycling systems that are in place and would like to see them expand. There is a general
lack of communication and knowledge about what is acceptable in the recycling containers, or who to ask if there
are questions about the program or for unique items.
5.2 Public Recreation, Community Service, and Cultural Venues
The majority of City operated community centres and libraries have recycling collection provided through a waste
and recycling hauling contract with the City. Recycling collection is single stream, the same as the residential
program in the City which allows specific items to all be mixed into one cart including paper, cardboard, plastics,
metal, and glass.
Some facilities such as Cindy Klassen Recreation Complex are serviced by in-house building or contract service
workers. Other facilities such as libraries are cleaned by contracted staff through the City custodial contracts.
There are also leased buildings that are primarily cleaned by contract service workers. Custodial contracts include
collection of garbage or recycling in buildings. Custodial staff empty all containers in hallways, restrooms,
entranceways, and any other location on-site each day. If there are private businesses in the building such as
restaurants, the business is responsible for their own cleaning and removal waste and recycling to the garbage
bins on-site.
During the building tour of the Cindy Klassen Recreation Complex there were a number of solo garbage
containers throughout the building. Many areas had four to five garbage containers within view, but at most one
recycling container. The recycling containers were typically CBCRA provided containers that were blue and had
stickers that say “Recycle Everywhere” and “beverage containers only”. The opening of the container was a round
hole to promote beverage container recycling. Recycling containers are typically unlined, and garbage containers

CITY OF WINNIPEG - CORPORATE WASTE REDUCTION STRATEGY
ENVSWM03102-01 | DECEMBER 2014 | ISSUED FOR USE
22
City of Winnipeg Corporate Waste Reduction Strategy
are lined. All maintenance associated with the pool and pool chemical containers are kept in the same storage
location and the empty containers are picked up when new chemicals are delivered. The recycling carts are
located by the front entrance of the building, and staff noted that the carts are filled with recyclables dropped off
by the public, likely from people who live in apartments in the area who do not have access to recycling collection
in their buildings.
All libraries have become public drop spots for the Call2Recycling battery and cell phone recycling program.
This program is free of charge where each facility has registered with Call2Recycle, and they provided a
cardboard box and signs for the program. The boxes already have a paid courier shipping invoice on them and
the facility can simply call a courier company to pick up the full box and drop off a new empty box.
All libraries also benefited from the launch of the CBCRA recycling program by receiving a large number of blue
containers from CBCRA. However they ensured that they had stickers to cover the "beverage containers only"
portion of the label so that they could be used and advertised as recycling container for all single stream
recyclables.
The City has a partnership with the Winnipeg Repair Education and Cycling Hub (WRENCH) to keep bicycles out
of Brady landfill and repair them for reuse. WRENCH has reported that in 2013, through continuing support from
the City, the WRENCH has recovered over 2,600 discarded bicycles and parts from the landfill, which helped
provide community health programming across the city. This represents over 26 Tonnes of material diverted from
landfill.
Areas for Improvement
Elimination of solo garbage containers – ensure that locations which have garbage containers also have a
recycling container;
Lack of clear consistent signage for recycling containers, and confusing signage that says “beverage
containers only” when all recyclables would be allowed in the container;
No consistency in container placement, container style/colour/type, and signage for recycling in hallways,
change rooms, etc.;
Lack of knowledge about what is allowed in the recycling containers;
No formal program for stewarded items such as cell phones, batteries, other potentially hazardous waste
such as paints, CFLs, etc. (except for libraries which are running a battery recycling program and public drop
spot);
No program for yard waste generated from the cleanup of the grounds/outdoor areas;
The responsibility for stewarded items often unknown and inconsistent. Stockpiles in some buildings, no clear
program champion; and
Communication is difficult – issues with waste and recycling pickup or service are supposed to be reported
through 311 – and often requires a call back and communication with various levels of staff before a problem
can be identified and solved.
While recycling containers are somewhat utilized, they are not always the most convenient option; there is often a
garbage container that is closer and more accessible than a recycling container. In general, there is an
oversupply of garbage containers and lack of recycling containers. There is a general lack of communication and

CITY OF WINNIPEG - CORPORATE WASTE REDUCTION STRATEGY
ENVSWM03102-01 | DECEMBER 2014 | ISSUED FOR USE
23
City of Winnipeg Corporate Waste Reduction Strategy
knowledge about what is acceptable in the recycling containers, or who to ask if there are questions about the
program or for unique items.
5.3 Operations and Maintenance Yards
The City operates three repair shops and service yards for the City’s 2,024 vehicles, and two repair and
maintenance shops for the City’s 600 buses. Fleet maintenance crews handle all waste generated on-site through
the maintenance shops. The garbage and recycling collection is provided through the same contract as many
other facilities in the City. Office garbage and recycling is handled by custodial staff, and is external to the
department and done through a separate custodial contract. It was noted at the maintenance buildings that they
do have recycling in the office; however, they have no recycling cart collection on-site. It is the responsibility of
custodial/cleaning staff that cleans the office buildings to collect the recycling and bring it to another location for
recycling collection. There is no other information reported back about this process.
Some maintenance buildings have recently started up their own initiative – they have set up a number of large
cardboard bins as they wanted to divert a large quantity of cardboard. Additionally all yards have scrap metal bins
for metal, aluminum, and other metals that have value such as copper. Special programs exist for large items and
end of life items including selling buses and vehicles to scrap yards for recycling. A City wide contract exists with
Envirowest for the pickup of all waste oil, used oil filters, antifreeze, empty oil and anti-freeze containers, oily rags,
floor dry sweep, and other hazardous waste as required. Additionally, lead-acid batteries and tires are picked up
by suppliers when new products are delivered. Some unique waste, such as used superbrooms from street
sweepers, is given to farms for grooming horse and cattle.
At the bus maintenance yards each bus is cleaned out every day. Buses are cleaned with a cyclone that blows
everything out of them in less than a minute; this waste is mainly newspapers, beverage containers, food scraps,
sand, and grit. The materials are collected in a large filter and put in the garbage. About three years ago a news
publication starting handing out free papers at stations downtown and also put stacks of newspapers on the bus.
This now makes up the majority the waste that is cleaned out of the bus at the end of the day. If not cleaned out
before the buses are cycloned, newspapers are found blowing around near bus stops and become litter.
The transit division is also responsible for emptying 80 garbage cans at bus shelters across the City. They use a
regular cube van to empty the 80 garbage cans as this is the most efficient vehicle they have to service the
containers; they do not have a proper waste truck for emptying the containers. These containers also contain
significant hazardous waste, in particular used needles present a significant worker safety concern.
Areas for Improvement
Facilities need external support to identify waste reduction and recycling programs. Currently programs are
happening independently – for example, maintenance ordered their own cardboard bins after a staff
champion decided too much was thrown in the garbage bins each week.
Transit staff collect trash but have no proper equipment and space/time to empty more containers or add
additional recycling containers to the 80 transit stops. It would be beneficial to coordinate pickup of waste
from bus shelters with public works or another department that has proper equipment and space to service
the containers and add recycling infrastructure.
Need a consistent decision-making process and system to determine proper placement of containers,
especially around bus shelters to avoid multiple garbage containers being placed in close proximity to each
other.

CITY OF WINNIPEG - CORPORATE WASTE REDUCTION STRATEGY
ENVSWM03102-01 | DECEMBER 2014 | ISSUED FOR USE
24
City of Winnipeg Corporate Waste Reduction Strategy
At maintenance yards, there are generally a large number of garbage containers, whereas recycling
containers for metal and other recyclable material are more spread out and less accessible.
A process should be developed to ensure newspapers are collected and recycled each day prior to buses
being cycloned.
There is a desire for additional education and awareness of opportunities. The only signs they have were
developed in-house. Staff could use more containers and put them in better spots but ultimately it is not high
on the priority list and there is limited staff time and expertise to change current waste management system.
Concerns from staff who believed they observed custodial services putting the recycling in the garbage and
they are not sure what is done with the recycling that is separated. Need for better measurement and
communication to ensure all parties that the proper processes are being followed.
Opportunity for a corporate ‘green team’ where different departments work together and share
ideas/programs that are working well.
More communication, such as a monthly newsletter/email with sustainability tips and info about recycling and
other City green programs.
5.4 Green Space and Landscaping
Green space and landscaping includes operations such as parks, green spaces, sports fields, and City golf
courses. The parks and open spaces division includes the urban forestry, naturalist services and insect control
branches. Across all parks there are over 3,000 garbage containers, generally caged bins with no liners, which
are emptied by crews with 1-ton compactor style garbage trucks. Additionally there are some Molok containers in
dog parks that require specialized equipment to empty. The Parks Division is also responsible for boulevards on
the P1 (arterial) and P2 (collector) streets in the City. Currently there is a pilot project with 80 recycling containers
being trialed at Kildonan Park. Assiniboine Park is the only other park that has recycling containers where
approximately 80% of the garbage containers are paired with recycling containers. The key objective of the pilot
at Kildonan Park is to design and implement a recycling trial that does not cost any additional money or require
additional staff time to service the bins. The funding for the pilot, along with new equipment and a trailer to haul
the recycling has been paid for by CBCRA. This includes blue containers which say “Recycle Everywhere –
Beverage Containers Only”. However, these containers are serviced by the City and the material is brought to the
Emterra MRF which accepts all recyclable materials mixed together, the same as for the residential recycling
program.
In addition to containers centralized park services remove old play structures, replace benches and picnic tables,
and these contribute to different forms of wood waste.
Forestry services include tree removal in the City, and an extensive program for the removal of Dutch elm
diseased trees on public and private property. Over the last five years about 5,000 elm trees have been removed
per year by the forestry team (about 80% private property and 20% public property) because of Dutch elm
disease.
Overall there are between 600 to 700 seasonal labourers and staff for parks and open spaces operations. In
addition, some parks and 18 soccer fields are leased to private companies for operation and maintenance;
Assiniboine Park is one example. The City has four golf courses, two 18-hole and two 9-hole courses. Eight other
golf courses in the City are leased out and run by contract staff. Courses have concession stands or a main
restaurant/clubhouse.
CITY OF WINNIPEG - CORPORATE WASTE REDUCTION STRATEGY
ENVSWM03102-01 | DECEMBER 2014 | ISSUED FOR USE
25
City of Winnipeg Corporate Waste Reduction Strategy
Generally all lawn cutting and mowing in the City is left in place, or at a few sites, small amounts that are collected
(such as on golf course greens) are put into unmanaged green areas nearby for composting. The golf courses
ensure that all operation based materials (grass clippings, leaves, etc.) are put in the bush to compost naturally,
and are not collected for removal. Tree and branch removal is done by the Urban Forestry branch; all wood debris
is chipped and most is used on pathways in parks and playgrounds. Any unused wood chips are sent to Brady
Road Resource Management Facility. Some wood is left whole and sent to Brady Road Resource Management
Facility where an independent contractor (Wood Anchor) cuts trees into lumber to be made into furniture.
Landscaping material from flower beds is either composted in situ or removed by works crews and sent to Brady
Road Resource Management Facility. Some organic waste is burned if it is not practical to get heavy machines to
area to move it out (on river banks/dykes, grasslands, etc.).
Recently, possibly as a result of climate change, ash disease has been seen in the City; there may upwards of
280,000 additional trees that need to be removed in the next five years if the disease continues to spread. This
would be over ten times the number of trees which have been removed annually because of Dutch elm disease.
Areas for Improvement
Elimination of solo garbage containers, and ensure locations where garbage containers remain also have a
recycling container; (For example, at golf courses there are CBCRA beverage container recycling cans every
few holes, and a garbage container at every hole);
Elimination of some garbage containers in public spaces, and addition of recycling containers;
Lack of clear consistent signage for recycling containers, and confusing signage that says “beverage
containers only” when all recyclables are allowed in the container;
No consistency in bin placement, some parks and open spaces were observed to have numerous containers
in close proximity to each other;
Work with Solid Waste and Brady Road Resource Management Facility to improve reporting and tracking of
landscaping material and the final end uses of the material at the Facility. This includes improved
communication about what material is accepted in the existing composting operations to ensure Parks crews
have systems to more easily divert all landscaping material produced (i.e., minimize mixed loads of
landscape debris and garbage); and
Some trees removal services are contracted out; ensure procurement policies are developed to help guide
the inclusion of specifications for proper reuse/diversion.
5.5 Streets and Outdoor Public Use Waste Containers
Public Works, street services division is responsible for road operations including collection from street side
containers, loose litter on streets, illegal dumping near streets, street sweeping, and street maintenance and
construction. There are about 1,000 street side garbage containers in total (these are the old aggregate
containers). In 2003, through Take Pride Winnipeg there were 423 dual stream (garbage/recycling) stations
installed in various locations around the City that are serviced through a collection contract with BFI. There are
also three-stream street side containers with advertising panels that are fully serviced by OMG marketing group
who has a five year contract extension until 2018.
Other core programs that generate waste include street sweepings which generate about 160 tonnes per year.
This material is either disposed of or used as landfill cover. In the past they have tried to implement a sand
recovery program to reuse sand on the streets. However the sand was only 15-20% recoverable as it breaks
CITY OF WINNIPEG - CORPORATE WASTE REDUCTION STRATEGY
ENVSWM03102-01 | DECEMBER 2014 | ISSUED FOR USE
26
City of Winnipeg Corporate Waste Reduction Strategy
down easily and becomes too fine to use again. The cost was also 20 times the cost of new clean sand. Currently
they are trialling use of a black chip additive to improve the quality and allow for re-use. The Streets division also
recycles tires and asphalt shingles and old cold patch in paving operations. They are also testing the use of beet
juice instead of calcium magnesium concentrate on roads in winter. These programs are both to increase quality
of materials used and decrease the overall quantity of resources and raw materials used in operations year to
year.
The Street Services Division has an internal vision to reduce litter and take care of recyclables by increasing the
number of recycling containers. They want to ensure City services are always available to keep the City looking
clean and tidy at all times. They would like to ensure that all street garbage locations also have a recycling bin. To
try and accomplish this they have been partnering with business districts and associations. However, it is time
consuming and tough to get to a final service agreement. CBCRA is providing money to purchase and install
recycling containers (which can be $1,100 per recycling bin), however they do not cover any costs to service and
empty the bins. As part of this process they are working with a number of groups to research best practices for
street side container design (marketing, district groups, businesses, service agencies). CBCRA has carried out
some audits to measure effectiveness of street side bins and overall approximately 20% to 30% of the garbage is
recyclable.
There is no measurement of the quantity of waste generated from street side bins. However this summer (2014)
there is a trial in the Exchange District and business districts. With support from CBCRA, they are weighing all
recyclables generated and collected.
Areas for Improvement
Desire to set a target for number of recycling containers available in the City, and make it happen.
Container placement is a big issue, working with business areas, transit, public works, and city councillors
who all have an opinion on where they should go. If every request was fulfilled there would be a garbage
container ever two meters on the street. Need a consistent decision-making process and system to determine
proper place to put bins to avoid multiple garbage bins being placed in close proximity to each other.
Utilize opportunity for shared use of on-site containers installed on properties in new and re-developed
buildings instead of separate street side containers.
The blue containers for recycling should consistently allow the same recyclable materials anywhere in the
City. The “beverage containers only” sign can be misleading and confusing as all recyclables can be placed in
the containers.
5.6 Other City Division Interviews
5.6.1 Solid Waste Services Division
The Solid Waste Services Division is the service provider for corporate waste and provide service to most city
facilities and is responsible for administering the garbage and recycling collection contracts. The City owns and
supplies the bins and carts for both recycling and garbage. Recycling collection is provided through Emterra for
carts and BFI for bins. The Solid Waste Services Division also oversees the operation of Brady Road Resource
Management Facility, which includes a leaf and yard waste composting program. Additionally, a biosolids
composting pilot and organics diversion strategy are underway.
The solid waste services division provides the collection service, and it is up to each client facility to determine
what level of service they want and how to setup a recycling system within the building. Currently, 311 is used to

CITY OF WINNIPEG - CORPORATE WASTE REDUCTION STRATEGY
ENVSWM03102-01 | DECEMBER 2014 | ISSUED FOR USE
27
City of Winnipeg Corporate Waste Reduction Strategy
communicate issues with collection or request service changes, bin size changes, or additional carts. 311
requests would then come to the solid waste services division. Communication materials about the programs and
services available to corporate buildings have not been a high priority since 2006 when they had a summer
student that helped inform city staff about the new multi-material recycling program available in offices and city
facilities. Currently, an updated inventory of garbage and recycling service at all corporate buildings is being
planned, which will include getting up to date contact information so that communication materials can be passed
on to each building.
Currently, there is no real time system to track bins/carts and how often they are serviced. The Division is looking
into the potential for the GPS tracking of bins/carts with additional data collection through radio frequency tags
and truck scales. No information is tracked for the tonnage or quantity of material that is picked up from corporate
buildings.
Promotion and communication efforts can be done through their division, ideally with a summer student who could
help with proper bin sizing and service levels to building. However, this is would need the proper resources to
make sure it happens. These programs would only work for buildings that are operated by the City; leased
buildings would need to be targeted in another way through specific agreements as each leased building has their
own service.
5.6.2 Materials Management Division - Contracts and Procurement
The Materials Management Division is responsible for all city purchases over $5,000. Primarily they assist in
creating standing order contracts for materials and services used by the City. A green procurement policy was
passed in 1990 which led to the development of a purchasing policy with respect to sustainable development and
environmental issues. However this policy is not directly used in typical day to day procurement decisions and has
not been reviewed or updated since its creation in 1990.
A summary of currently tracked waste reduction initiatives that procurement has helped to implement are outlined
in Table 14. There are more opportunities for stewarded and hazardous items such as fluorescent light bulbs,
however, it is a challenge to find staff that are knowledgeable enough to develop and grade criteria for waste
related decisions. There is a need to understand the additional costs versus the waste reduction potential and to
determine how to incorporate this into decisions. Initially, there is a need for departmental buy-in as the materials
management division is not generally asked to look into greener procurement options. It is not a priority of most
departments and would need to be formalized in a policy and built in at the front end of contract setup or it will be
missed.
Table 14: Procurement Waste Reduction Initiatives
Bid Opportunities Environmental Progress to Date
862-2013 Bid Opportunity
expires March 31, 2015
Paper preference for chlorine-free process
Minimum standard 30% post-consumer waste paper
One of three certifications – FSC, SFI, or CSA certified forest
405-2014 Bid OpportunityGreen Cleaning Products – in support of Lake Friendly Initiative all cleaning products
must be EcoLogo or Green Seal certified.
447-2012 Bid Opportunity
expires May 31, 2014
Used Concrete from street reconstruction, building demolition, etc. goes to crushing
company for reuse in new concrete.
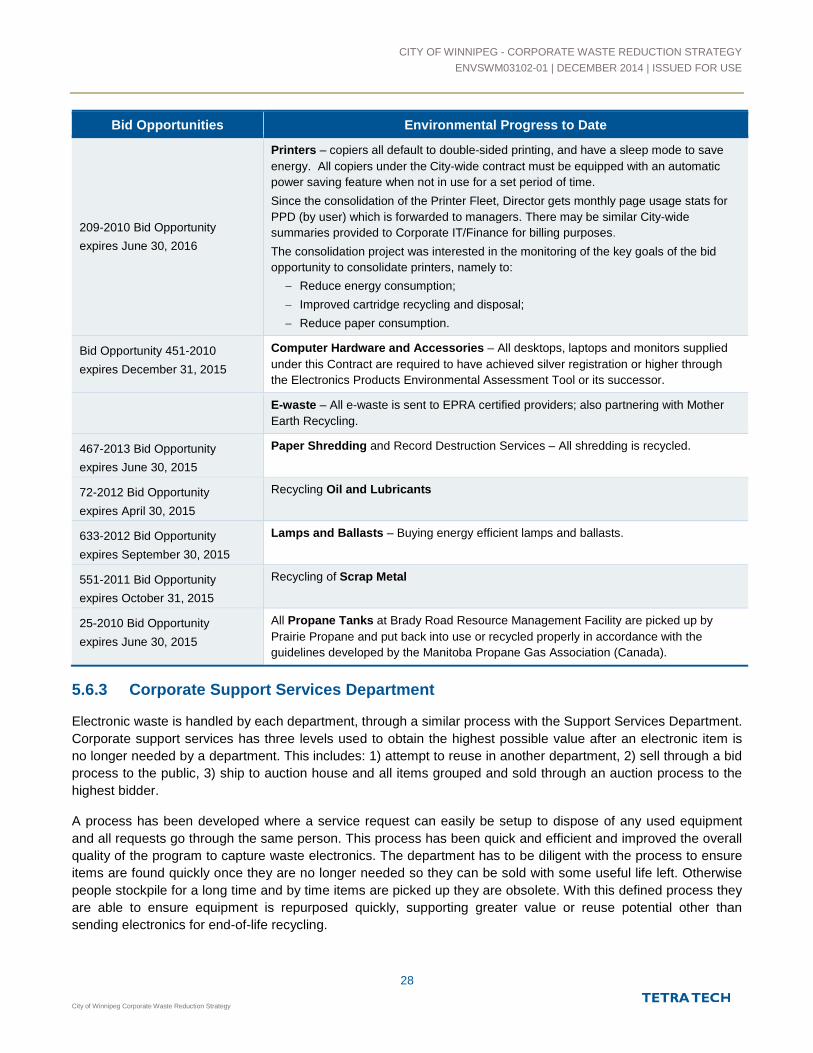
CITY OF WINNIPEG - CORPORATE WASTE REDUCTION STRATEGY
ENVSWM03102-01 | DECEMBER 2014 | ISSUED FOR USE
28
City of Winnipeg Corporate Waste Reduction Strategy
Bid Opportunities Environmental Progress to Date
209-2010 Bid Opportunity
expires June 30, 2016
Printers – copiers all default to double-sided printing, and have a sleep mode to save
energy. All copiers under the City-wide contract must be equipped with an automatic
power saving feature when not in use for a set period of time.
Since the consolidation of the Printer Fleet, Director gets monthly page usage stats for
PPD (by user) which is forwarded to managers. There may be similar City-wide
summaries provided to Corporate IT/Finance for billing purposes.
The consolidation project was interested in the monitoring of the key goals of the bid
opportunity to consolidate printers, namely to:
Reduce energy consumption;
Improved cartridge recycling and disposal;
Reduce paper consumption.
Bid Opportunity 451-2010
expires December 31, 2015
Computer Hardware and Accessories – All desktops, laptops and monitors supplied
under this Contract are required to have achieved silver registration or higher through
the Electronics Products Environmental Assessment Tool or its successor.
E-waste – All e-waste is sent to EPRA certified providers; also partnering with Mother
Earth Recycling.
467-2013 Bid Opportunity
expires June 30, 2015
Paper Shredding and Record Destruction Services – All shredding is recycled.
72-2012 Bid Opportunity
expires April 30, 2015
Recycling Oil and Lubricants
633-2012 Bid Opportunity
expires September 30, 2015
Lamps and Ballasts – Buying energy efficient lamps and ballasts.
551-2011 Bid Opportunity
expires October 31, 2015
Recycling of Scrap Metal
25-2010 Bid Opportunity
expires June 30, 2015
All Propane Tanks at Brady Road Resource Management Facility are picked up by
Prairie Propane and put back into use or recycled properly in accordance with the
guidelines developed by the Manitoba Propane Gas Association (Canada).
5.6.3 Corporate Support Services Department
Electronic waste is handled by each department, through a similar process with the Support Services Department.
Corporate support services has three levels used to obtain the highest possible value after an electronic item is
no longer needed by a department. This includes: 1) attempt to reuse in another department, 2) sell through a bid
process to the public, 3) ship to auction house and all items grouped and sold through an auction process to the
highest bidder.
A process has been developed where a service request can easily be setup to dispose of any used equipment
and all requests go through the same person. This process has been quick and efficient and improved the overall
quality of the program to capture waste electronics. The department has to be diligent with the process to ensure
items are found quickly once they are no longer needed so they can be sold with some useful life left. Otherwise
people stockpile for a long time and by time items are picked up they are obsolete. With this defined process they
are able to ensure equipment is repurposed quickly, supporting greater value or reuse potential other than
sending electronics for end-of-life recycling.

CITY OF WINNIPEG - CORPORATE WASTE REDUCTION STRATEGY
ENVSWM03102-01 | DECEMBER 2014 | ISSUED FOR USE
29
City of Winnipeg Corporate Waste Reduction Strategy
6.0 STRATEGY, RECOMMENDATIONS, AND IMPLEMENTATIONAPPROACH
The Strategy has been developed by referencing baseline generation rates, incorporating tracking systems,
including targets that optimize and expand the type of materials collected, and building on education programs
that promote waste minimization and behaviour change. The Strategy has three important stages which are
commitment, implementation, and ongoing measurement that guide the process from policy setting to
implementation with measurement and accountability built in. As the program develops, various departments and
individual programs will move through the stages of the process. A number of the strategies will help the City build
capacity within departments and help with cross-functional governance and team building. The implementation
plan seeks continuous improvement and explores innovative, cost-effective opportunities for system
improvements over time, taking advantage of opportunities for continuous learning and knowledge sharing as
programs are developed. This should enable the City to improve waste reduction and diversion efforts and meet
the 50% diversion goal that aligns with the City’s current residential sector goal.
6.1 Interim Targets
Based on pursuing the zero waste goal set in the Strategy, it is recommended that City adopt waste reduction and
diversion targets. The targets below are set against a baseline established using data from other jurisdictions, and
can be adjusted regularly as waste composition by sector shifts and new EPR programs are adopted and organic
diversion programs are developed. As specific programs are implemented, interim targets can be developed to
target recyclable and compostable materials in the existing waste stream by building type or city department.
GHG savings can also be quantified based on the lower carbon footprint for processing recyclables and
compostable rather than disposing of them as garbage.
In this context, waste reduction is defined as the garbage tonnage going down (i.e., not being purchased in the
first place), while diversion is defined as materials and product being sent for reuse and recycling rather than
disposal.
Organizations serious about waste reduction and diversion set short and long term goals. Goals range from 40%
to 75% in the short-term and up to 90% (zero waste) in the long term. Methods of measuring results vary from
organization to organization but this measurement is key in determining an organization’s successful
accomplishment of its goals and the satisfaction of its customers. Methods to measure tonnage include having
requirements in hauling contracts for haulers to provide the weight collected from each building, or have staff at
each building weigh materials for a period of time using portable scales. Important measures are:
Tonnage or volume of waste; and,
Tonnages or volumes of each of the diverted categories (recycling, cardboard, organics, other specialty
programs).
Current aspirational waste reduction targets in the City include increasing the residential diversion rate from 15%
in 2009, improving by roughly 5% a year in the short term to achieve a 30% diversion rate by 2015 and a 50%
diversion rate by 2019. Additionally, for residential waste in the City, an initial target for waste reduction is a
minimum of 1% per annum decrease in per capita waste generation (around 5 kg per person per year). The
Province of Manitoba wants to increase the per capita diversion rate for organics from 30 kg in 2013 to 85 kg in
2020.
Currently there is no tonnage data available for recycling collected, and the tonnage data available for waste
produced by city operations is aggregated into three categories (operations, C&D, and landscaping), and

CITY OF WINNIPEG - CORPORATE WASTE REDUCTION STRATEGY
ENVSWM03102-01 | DECEMBER 2014 | ISSUED FOR USE
30
City of Winnipeg Corporate Waste Reduction Strategy
additionally there are carts/bins that are collected in combination with the residential contracts. To get a better
indication about what is currently occurring targeted waste audits were completed.
Waste audit data showed that City Hall is currently achieving a 52% diversion rate, and an organics program
would be needed to further increase the diversion rate. With a fully implemented organics collection program a
90% diversion rate could be achieved. A similar target of 90% is observed at a number of other offices and cities
in the best practice review in Section 2.2.
Waste audit data showed that the public venue—the Cindy Klassen Recreation Complex—is currently achieving a
13% diversion rate. There were a number of recyclables in the garbage, and if all recyclable material was placed
in the current recycling streams available, a diversion rate of up to 42% could be achieved. With a fully
implemented organics program a diversion rate of up to 79% could be achieved.
Table 15 provides a phased breakdown of waste reduction and diversion targets by facility category to achieve
the above noted goals. The interim step in 2015 reflects the higher potential for diversion and reduction in the
early years, but also the greater difficulty of reducing waste as the remaining amount gets smaller. Medium term
targets assume that some facilities that are high organics producers would begin to pilot and implement organics
diversion programs, and long term programs would need full organic diversion programs in all offices that produce
organic waste.
In the previous sections, it was determined that unit generation rates by category were spurious for the most part
and that further research and new measurement data and tracking systems would be needed to gain the
information needed to develop better correlations and actual diversion rates. Because of the inability to identify
relatively accurate unit generation rates at this stage without more research, developing an overall estimate of
garbage going to the landfill and a diversion rate in 2013 was not feasible. The majority of information provided to
date from facilities has been included in the table. This includes interim and final targets for diversion by facility
category, and for corporate operations in the City. The targets are in line with the residential diversion targets that
have been set in the Comprehensive Integrated Waste Management Strategy.
Table 15: Waste Reduction and Diversion Targets
Facility Category Diversion Rate Waste Diversion Targets
Current (Estimated)Short Term2015-2017
Medium Term2017-2020
Long Term2025
Corporate Office 40% 50% 65% 90%
Public Recreation, Community Service andCultural Venues
15% 30% 45% 70%
Operations and Maintenance Yards 30% 50% 65% 80%
Green Spaces 80% 85% 90% 100%
Public Use Waste Containers 5% 20% 30% 40%
Public Service 30% 40% 50% 60%
Overall Corporate Diversion Target1 29% 42% 52% 65%
Overall Corporate Reduction Target -- 2% 5% 10%
1 Weighted average is calculated taking into account the current total tonnage of waste disposed as presented in Table 15.

CITY OF WINNIPEG - CORPORATE WASTE REDUCTION STRATEGY
ENVSWM03102-01 | DECEMBER 2014 | ISSUED FOR USE
31
City of Winnipeg Corporate Waste Reduction Strategy
An overall goal of 42% diversion by 2017 is recommended. This target reflects the higher potential for reduction
and diversion in the early years by enhancing recycling collection and ensuring that all landscaping debris is
diverted. In addition, a waste reduction target of a minimum of 1% per annum decrease in per capita waste
generation should be adopted to encourage both waste reduction and waste diversion programs.
6.2 Implementation Approach Recommendations
The City has laid the foundation with its Our Winnipeg: Sustainable Winnipeg Direction Strategy, which includes a
direction to develop an overarching corporate waste management strategy for the organization, including
baselines and benchmarks. By establishing waste-specific staff experts, policies and projects, the City will be able
to implement this strategy with targets and goals reducing its environmental impact, creating healthy communities,
and encouraging sustainability awareness and action among its employees and residents. Key implementation
approach recommendations that the City should consider are summarized below.
6.2.1 Phased Implementation Approach
To implement the Strategy to achieve short term and long term targets, a phased approach to implementation is
required. The Corporate Waste Reduction Strategy would be followed up by an Implementation plan that would
be developed by an internal working group management team. Table 16 includes a detailed list of strategies and
implementation priories that would need to be achieved or enacted to reach the long term targets stated in this
Strategy. Selecting key priority areas would provide a framework for this phased approach. Initial implementation
should target corporate waste streams in the following order:
1. Achieve zero waste goals through effective diversion and management of landscape waste.
2. Focus on waste reduction in office facilities. This may include strategies such as better signage, education
about unique waste streams such as electronics and batteries, janitorial training, creating waste stations
(instead of every office having a garbage bin), and pilot an organics program in City Hall.
3. Waste reduction in operations and maintenance yards. Examples include developing a waste management
system for mercury-containing lamps, which are not currently sent for proper recycling.
4. Enhance recycling systems in community centres by removing excess waste bins, pairing containers and
increase recycling signage.
5. Finally, and the most challenging aspect of the waste stream, identify ways to reduce waste in public spaces
(especially street side and in parks). This would include planning for optimal placement of bins and assigning
responsibility for their servicing to one department, and providing better recycling services in parks and open
spaces.
6.2.2 Zero Waste Manager
Put Someone in Charge. To make change effectively, the City needs a staff member that is responsible for
driving and overseeing change. This person can be responsible for “knowing the waste”, developing programs,
monitoring and measuring results, adjusting targets, being a resource for site managers and procurement staff,
understanding solid waste programs in other regions and municipalities, assisting with community engagement
and education programs, assessing infrastructure requirements, and building on operational efficiencies that
further promote diversion.
Solid waste services on City properties are provided to over 160 various buildings, plus an additional 5,500 street
side and park waste containers are emptied. Service levels, systems, and corporate responsibility for various

CITY OF WINNIPEG - CORPORATE WASTE REDUCTION STRATEGY
ENVSWM03102-01 | DECEMBER 2014 | ISSUED FOR USE
32
City of Winnipeg Corporate Waste Reduction Strategy
containers exist in a number of independent departments including public works, water and waste, and transit.
This has led to varied approaches to container placement, collection, and servicing which creates a
non-consistent system across the City with different programs which can lead to user confusion, varying
opportunities for waste diversion, and ultimately lower participation and higher costs to run the program. If the City
plans to adopt a sustainable approach for waste management, it requires a champion or leader who would be
responsible for driving and overseeing change. Some of the potential responsibilities of this person include the
following:
Knowing the waste streams and the waste management practices by maintaining a database;
Assisting in tracking waste management costs and developing service contracts for waste disposal and waste
diversion services;
Being a resource for City staff to provide them with the tools and support that they need;
Connecting different division managers, to share lessons learnt and best practice and diffuse knowledge to
City leaders;
Developing metrics that gauge the effectiveness of solid waste management programs and regularly
monitoring the materials and waste systems;
Understanding waste management programs in various cities, municipalities, and with the province;
Tracking new waste management initiatives/changes that could impact the City (such as Provincial targets
and new EPR programs) and lobbying for solutions that are in-line with the Cities goals;
Assisting with community engagement and education programs; and
Assessing solid waste infrastructure and service levels.
This staff member should also lead by example and have the vision and drive to develop, implement, and monitor
programs and to gauge how well the City is progressing. It is also important to include goal-specific tasks in the
job description so that they know that waste reduction and diversion is a critical part of their responsibility.
6.2.3 Pursue Zero Waste
Zero waste is a concept that continues to gain traction. It has been adopted by a number of jurisdictions and is
being used for planning by many local governments. The Zero Waste International Alliance definition7 is the
current gold standard:
“Zero Waste is a goal that is ethical, economical, efficient, and visionary, to guide people in changing their
lifestyles and practices to emulate sustainable natural cycles, where all discarded materials are designed
to become resources for others to use.
Zero Waste means designing and managing products and processes to systematically avoid and
eliminate the volume and toxicity of waste and materials, conserve and recover all resources, and not
burn or bury them.
7 Zero Waste International Alliance, 2013. http://zwia.org/standards/zw-definition/
CITY OF WINNIPEG - CORPORATE WASTE REDUCTION STRATEGY
ENVSWM03102-01 | DECEMBER 2014 | ISSUED FOR USE
33
City of Winnipeg Corporate Waste Reduction Strategy
Implementing Zero Waste will eliminate all discharges to land, water, or air that are a threat to planetary,
human, animal or plant health.”
Zero waste can be used as a target or way of planning for waste reduction. Communities that reduce their waste
or divert it by over 90% (from both landfill and waste incineration) are considered to have met the goal. Having a
clear definition of zero waste can be helpful when organizations are evaluating options. Zero waste does not
mean that no waste will be land filled or produced, but that the City will continuously strive to reduce waste going
to landfill through policies the support the waste reduction hierarchy.
6.2.4 Measure Service and Performance Accurately
Developing an in depth data base to track key program components and performance measures critical to ensure
success of a waste reduction and diversion program over time. Measuring performance will need to include those
who interact with the waste system the most including the janitorial services and the haulers. The following items
are important to consider for inclusion in a database:
Contact information (property manager, lead site contact for waste and recycling, etc.);
Building information (offices, floors, cafe, other services etc.);
Recycling and garbage collection program information (number and type of containers, collection days, etc.);
Site plan details (collection points, loading areas, etc.);
Other relevant image files (site plan, photos, etc.);
Record communications with the property (email, letters, and calls);
Promotion and education, and outreach activity log (last poster run, resident meetings, etc.); and
Site inspection results (recycling performance indicators, contamination reports, etc.).
Along with cost, hauler contract information, and tonnage data, these components can be used to track program
progress, seek harmonization and other efficiencies across programs, build on program success by replicating
successful initiatives, and update targets and goals. These efforts should extend to City-owned buildings, leased
building space, and other corporate operations.
Working with the waste and recycling haulers, systems can be developed and language added to the waste and
recycling hauling contracts to ensure all materials that are collected from corporate operations are weighed and
monthly reports provided. This information is extremely valuable to track performance and help determine where
to focus energy for right-sizing equipment or program improvements over time.
6.2.5 Engagement and Education
What can be done or needs to be done to make waste diversion programs effective:
Use Community-based social marketing techniques to develop public and staff focus campaigns. Focus
groups can be used to ask staff and the public what barriers and benefits they perceive to performing certain
behaviour such as collecting food scraps or recycling. These programs help to build community, identify
barriers, build a sense that the norm is to recycle, allows staff and residents to share tips and ideas, and can
improve recycling. Consider placing “We Recycle” or “Zero Waste Facility” stickers on building entrances to
reinforce recycling norms; collect pledges that can be posted in a public space or staff rooms, or even built

CITY OF WINNIPEG - CORPORATE WASTE REDUCTION STRATEGY
ENVSWM03102-01 | DECEMBER 2014 | ISSUED FOR USE
34
City of Winnipeg Corporate Waste Reduction Strategy
into leases, to reinforce commitment to waste prevention, reduction, and diversion. It is also important to
provide regular feedback on progress, which can be done in creative ways such as using a publically posted
thermometer-style progress indicator.
Involve and actively train staff and management. Develop and deliver training programs to building staff
and owners on how to promote and operate the recycling program – supportive and engaged building
supervisors and managers are key to the success of the program. Offer incentives to building managers to
increase waste reduction and diversion, and build in a specific number of staff engagement reminders and/or
activities per year.
Narrow the focus. Education should focus on materials most commonly found in the waste (e.g., paper,
paper packaging and cardboard, beverage containers, etc.).
Communicate recycling fundamentals. Work with managers to provide recycling program information to
new staff and include the information in staff onboarding.
Develop signage that is clearly and consistently displayed. Use visual images rather than words
whenever possible. Have garbage and recycling containers distinguished from one another by color, size, or
shape. Ensure a consistent program and brand is used across the City to create a program that staff and
residents can recognize and rely upon that the recycling option is always available wherever they are.
Provide regular staff education. Current staff should be reminded about recycling via newsletters, signage,
and email information updates. Communications could include feedback about recycling or composting rates,
successes, or new programs starting in the City. To increase interest in waste diversion, consider hosting
recycling contests or competitions between buildings, such as the program the libraries started in 2013 for a
friendly competition for battery recycling.
Consider grouping buildings. Connect buildings with similar profiles with high and low diversion rates to
enable building managers to learn from each other’s challenges and successes.
Monitor recycling, food scraps and garbage containers frequently. Work with garbage, food scraps, and
recycling haulers to make sure building managers are informed when contamination occurs. The manager
and maintenance staff should be held responsible for monitoring the contamination in the recycling and food
scraps containers. Signage in the garbage collection areas should indicate that monitoring is ongoing.
Develop staff champions. Mentor interested and engaged staff as recycling champions – at least one or two
champions per building.
Build on small successes. As interim goals are reached – build on these successes to gain staff support.
From conversations with building managers these initiatives would be looked upon more favourably by staff if they
were perceived to be city lead directives and programs rather than initiatives coming from individual departments.
6.2.6 Target Priority Recycling Areas
The recent waste composition study defines what recyclables are still in the garbage and identified organics as a
diversion priority. In addition to recycling, recent audits revealed the existing waste stream consists of organics
(43% to 70%) and recyclables (11% to 32%). Adding a compostable organics recycling stream will be a significant
for increasing diversion, and this is being recognized as a focus area for increased diversion across levels of
government.

CITY OF WINNIPEG - CORPORATE WASTE REDUCTION STRATEGY
ENVSWM03102-01 | DECEMBER 2014 | ISSUED FOR USE
35
City of Winnipeg Corporate Waste Reduction Strategy
6.2.7 Infrastructure Assessments
Often one of the largest barriers to diverting waste is insufficient or inadequate infrastructure or service levels.
This includes not having waste diversion options, insufficient capacity (i.e., overflowing bins), poorly marked or
labeled facilities and bins, and inconvenient locations or layout. Providing waste diversion infrastructure
assessments should assist in determining whether the waste and recycling area is adequate and whether capital
improvements should be considered to enhance waste diversion capabilities.
Important considerations for infrastructure assessments include the following:
Correct Size Containers by Material Stream. Ensure the size of material bins are the correct size for the
amount of garbage and recycling generated at a building and the collection frequency. Confirm with solid waste
that the existing waste collection service is adequate for the types of materials generated at the property.
Waste and Recycling Area. Consider the space required for waste, recycling and organic collection containers
and bins when assessing the area or planning for future site changes. As waste disposal rates decrease, smaller
containers in offices and collection bins can be used, freeing up space for recycling and organics collection. In
addition to various bins and containers, the area should also be laid out in a manner that makes waste diversion
more convenient than waste disposal. These are aspects that should also be applied to all new buildings and
renovations.
Bin Configuration. The configuration of the waste and recycling area should make waste diversion activities
more convenient or accessible than garbage. Containers and bins should be organized so that the diversion
options are next to or closer to the entrance than the garbage option.
Standard and Colour-Code Signage. Work with key partners such as EPR stewards to standardize signage for
waste diversion activities. Consider the tips in the Best Practices such as colour coding of signage and containers
and use of icons against dark backgrounds. Provide waste reduction tips, literature, and signage for use in waste
and recycling areas. Details on the most effective approaches can be determined through pilot projects and
building on the knowledge gained from other sites and jurisdictions.
6.2.8 Staff Engagement
Previous projects found that on-site support is necessary to effectively make change. The City has motivated staff
that can help building users and other staff members reduce waste and increase diversion. Considerations for
staff are summarized below.
Educate, Empower, and Inspire Staff to Effect Behaviour Changes. Have site staff review the waste/recycling
and other material collection services and data for capacity to determine if the numbers are accurate and if the
service is appropriate (considering if other activities occur on site or if there are some building specific
considerations).
Staff Can Provide Feedback. Check bins to ensure collection service invoices are correct, to ensure right level
of service most of the time (occasional extra pickups may be needed at peak times), to see contamination levels
and to see if any changes occur as a result of engagement programs or new waste diversion options.
Staff Can Provide Information. Keeping staff informed about upcoming changes in their region will be helpful,
even if it may not impact their site directly as their tenants may hear of the changes in the community and have
questions on any changes to their systems (such as switching to every other week garbage collection or the
addition of organics collection).

CITY OF WINNIPEG - CORPORATE WASTE REDUCTION STRATEGY
ENVSWM03102-01 | DECEMBER 2014 | ISSUED FOR USE
36
City of Winnipeg Corporate Waste Reduction Strategy
Staff Can Inspire. Staff engagement should be part of the engagement processes. Staff engagement is also
important for building operations and custodial teams so staff members have pride in waste reduction efforts as
they get more involved with
6.3 Strategies and Implementation Plan
The primary stages to strategy implementation can be defined as:
Commitment – These includes setting targets and policies that each department can commit to adopting, and
show that they as a department are following through on their commitment to adopt the principles of zero waste in
compliance with the corporate strategy. This would include determining key policies that need to be adopted to
make commitment and programs happen.
Implementation – Examples of how each department is implementing policies and practices to support the
strategy. For example, in the short term this can include pilot and field testing of system changes such as new
waste container setups in buildings to achieve maximum capture of recyclable materials.
Accountability – Indicators that each department has mechanisms in place to measure and report on program
performance.
Generally over the lifespan of a particular project, commitment will give way to implementation. Accountability
will need to be in place to show progress and create opportunities for refinement of programs to achieve original
commitments.
The Resource Planning (Table 16) was developed to outline selected strategies, pre-requisites, noteworthy
considerations, capital and operational general resource requirements, and proposed roles and responsibilities for
staff and partners.
As strategies are operationalized, it is recommended that key stakeholders through the managerial zero waste
working groups convene to clearly specify how action items are to be implemented. This more in depth
implementation process will include identifying and securing resources, developing and implementing pilot
projects to field test and asses new programs, allocating budgets, finalizing how performance measure elements
are to be executed, and setting out a detailed implementation schedule.

CITY OF WINNIPEG - CORPORATE WASTE REDUCTION STRATEGY
ENVSWM03102-01 | DECEMBER 2014 | ISSUED FOR USE
37
City of Winnipeg Corporate Waste Reduction Strategy
Table 16: Strategy and Implementation Plan
Strategies Action Highlights Pre-requisite Timeframe Noteworthy Considerations
Resource Requirements Roles and
Responsible
Departments
Prevention
Hierarchy
LevelDedicated
Staff
Budgets (Capital
and/or Operational)
A. VISION AND STRATEGIC POLICIES
1Waste Reduction
Targets
Adopt clear targets (short-term and long-
term) that provide corporate operations
with goals and options for moving forward
First step as
planning is
followed by action
items
2014-2015
Commitment that outlines the direction for
corporate operations
0.5 FTE to
advocate for strong
policy framework in
first two years of
implementation
$37,500 based
on $75,000 @
1.3 to include
benefits
($57,690 Salary)
Centralized to
one
department:
Solid Waste
or Urban
Planning
Rethink
2Zero Waste
Commitment
Adopt a commitment to pursue zero waste
in City operations
Having a clear definition of zero waste canbe helpful when organizations areevaluating options
3
A Sustainable
Winnipeg – Direction
05 02
Existing plan that can support the corporate
waste management strategy
Guidance for solid waste management
goals and targets
Policy informs
other solid waste
components
Complete
Existing policy framework that solid waste
management plans and strategy can build
on
4
Corporate Solid
Waste Management
Plan (Annual Report)
Solid waste management plan for
corporate activities that include
procurement policies and diversion
initiatives – updated yearly
Actively assess, collaborate and advocate
as pertains to provincial and municipal solid
waste programs, carbon offset
opportunities and other waste-related
policy issues
Ongoing
Opportunity to lead by example and
incorporate waste diversion initiatives into
corporate operations
Assesses implementation priorities and
opportunities for pilots and new programs
in upcoming year(s)
Used as a tool to inform policy decisions
5
Materials
Management Policy
and Purchasing
Policy
Harmonized and update polices to ensure
they are in align with the corporate vision
and targets set for waste reduction and
diversion
Ensure janitorial contracts and other
contracted services have the necessary
terms that are in line with the waste
diversion strategy.
Ongoing
Keeping abreast of new initiatives that can
affect City operations and mandates
Improve contracts to include more
sustainability requirements that align with
the waste diversion targets
Require quarterly meetings within contract
periods to build in system efficiencies to
promote diversion
6Partner and Grant
Funding
Develop partnership models with
Stewardship programs and provincial
programs for waste diversion programs Shift Responsibility to Industry to
Encourage Environmental Design and Endof Life Management of Materials
Industry and
Provincial
partners
2015
Steward programs such as CBCRA and the
province have programs to achieve
diversion targets and are actively looking to
work with municipalities to achieve the
targets

CITY OF WINNIPEG - CORPORATE WASTE REDUCTION STRATEGY
ENVSWM03102-01 | DECEMBER 2014 | ISSUED FOR USE
38
City of Winnipeg Corporate Waste Reduction Strategy
Table 16: Strategy and Implementation Plan
Strategies Action Highlights Pre-requisite Timeframe Noteworthy Considerations
Resource Requirements Roles and
Responsible
Departments
Prevention
Hierarchy
LevelDedicated
Staff
Budgets (Capital
and/or Operational)
B. MANAGEMENT SYSTEMS AND TOOLS
1 Zero Waste Manager
Driving force who can oversee changes, be
a knowledgeable resource, implement new
programs, monitor performance and
identify efficiencies and best practices
Identify opportunities for new diversion
programs for stewarded items or
procurement changes
Develop pilot projects and field tests to
inform program role out
Requirement for
policy backing as
relevant
2014,
Ongoing
Point of contact for senior management
and working group to assess waste
reduction goals and program costs Create Programs for Corporate
Operations to Utilize 4R Winnipeg Depots
0.25 FTE to build
management
systems and tools
for garbage
reduction
efficiencies and
corresponding
monitoring systems
$17,500 based
on $75,000 @
1.3 to include
benefits
($57,690 Salary)
Centralized to
on
department
that can work
with others –
Solid Waste
or Urban
Planning
Rethink
2
Managerial Zero
Waste Working
Group
Develop a terms of reference for a
manager level cross division working group
that develops programs to meet targets
and develop consistent programs across all
divisions
Accountable for specific actions and targets
being met
Have working group report to the Chief
Administrative Officer on progress towards
targets
Determine priority recycling streams to
focus commitments over time
Actively collaborate with stakeholders to
identify challenges and devise solutions
that further promote diversion
Rethink
3
Performance
Measurement and
Monitoring
Metrics to monitor waste reduction and
progress towards targets and goals (e.g.
tonnage or volume for both garbage and
recycling materials)
Results maintained and evaluated in
database
Instrumental in determining progress andwhere more support is required
Work with haulers and janitorial staff todevelop realistic solutions to weigh andtrack all materials generated on anongoing basis
Reduce and
Recycle
4
Streetscape/
Outdoor Public
Space Container
Systems
Develop consistent placement strategy inhigh traffic areas and avoid having sologarbage cans and oversupply ofcontainers cluttering up streetscapes andpathways.
2015-2017
Coordinate between departments overallresponsibility to manage bins and developa planned streetscape and public wasteexperience that fits with the vision andzero waste goals for the City
Recycle
5Infrastructure
Assessments
Develop recommended waste and
recycling area standards for building
properties (both those serviced by the city,
and for inclusion in leased building space
contracts); use these standards in new
building design and lease contracts
Standards for assessing capital
improvements at waste and recycling area,
optimal bin sizing and service frequency
given diversion efforts
2015-2017
Undertaken in conjunction with operations
and steward programs, best practices and
standards for waste management. Support Opportunistic Changes Where
FeasibleRecycle
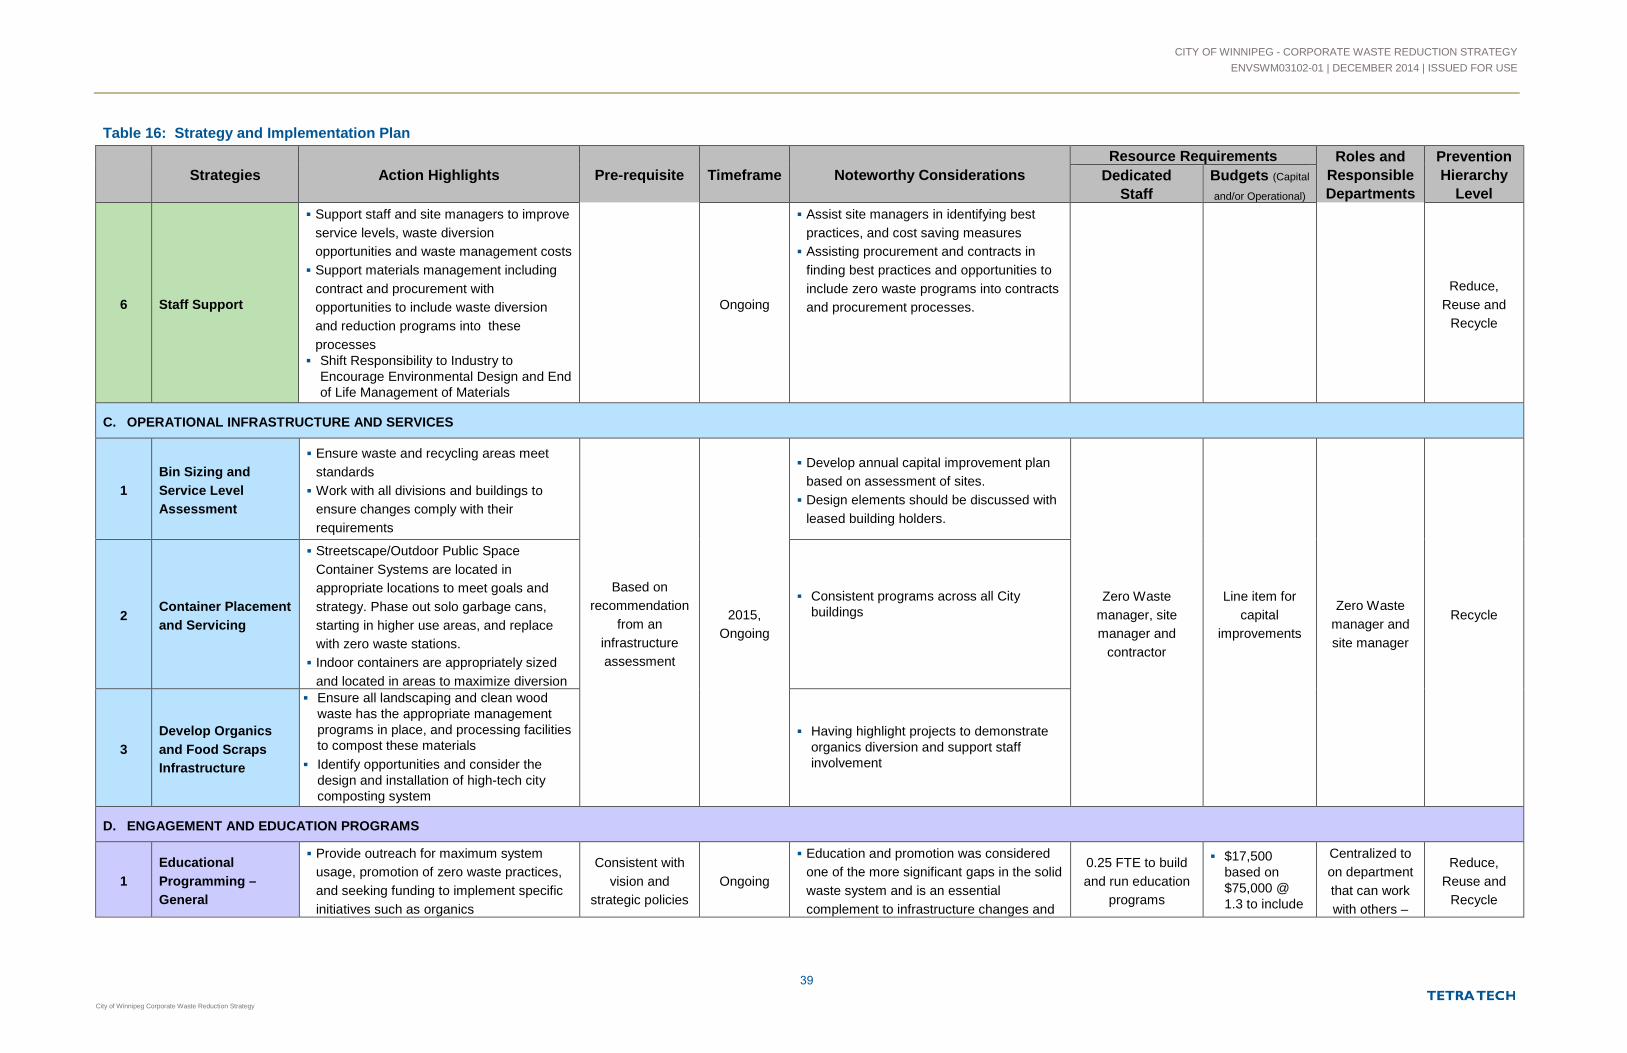
CITY OF WINNIPEG - CORPORATE WASTE REDUCTION STRATEGY
ENVSWM03102-01 | DECEMBER 2014 | ISSUED FOR USE
39
City of Winnipeg Corporate Waste Reduction Strategy
Table 16: Strategy and Implementation Plan
Strategies Action Highlights Pre-requisite Timeframe Noteworthy Considerations
Resource Requirements Roles and
Responsible
Departments
Prevention
Hierarchy
LevelDedicated
Staff
Budgets (Capital
and/or Operational)
6 Staff Support
Support staff and site managers to improve
service levels, waste diversion
opportunities and waste management costs
Support materials management including
contract and procurement with
opportunities to include waste diversion
and reduction programs into these
processes Shift Responsibility to Industry to
Encourage Environmental Design and Endof Life Management of Materials
Ongoing
Assist site managers in identifying best
practices, and cost saving measures
Assisting procurement and contracts in
finding best practices and opportunities to
include zero waste programs into contracts
and procurement processes.
Reduce,
Reuse and
Recycle
C. OPERATIONAL INFRASTRUCTURE AND SERVICES
1
Bin Sizing and
Service Level
Assessment
Ensure waste and recycling areas meet
standards
Work with all divisions and buildings to
ensure changes comply with their
requirements
Based on
recommendation
from an
infrastructure
assessment
2015,
Ongoing
Develop annual capital improvement plan
based on assessment of sites.
Design elements should be discussed with
leased building holders.
Zero Waste
manager, site
manager and
contractor
Line item for
capital
improvements
Zero Waste
manager and
site manager
Recycle2Container Placement
and Servicing
Streetscape/Outdoor Public Space
Container Systems are located in
appropriate locations to meet goals and
strategy. Phase out solo garbage cans,
starting in higher use areas, and replace
with zero waste stations.
Indoor containers are appropriately sized
and located in areas to maximize diversion
Consistent programs across all Citybuildings
3
Develop Organics
and Food Scraps
Infrastructure
Ensure all landscaping and clean woodwaste has the appropriate managementprograms in place, and processing facilitiesto compost these materials
Identify opportunities and consider thedesign and installation of high-tech citycomposting system
Having highlight projects to demonstrateorganics diversion and support staffinvolvement
D. ENGAGEMENT AND EDUCATION PROGRAMS
1
Educational
Programming –
General
Provide outreach for maximum system
usage, promotion of zero waste practices,
and seeking funding to implement specific
initiatives such as organics
Consistent with
vision and
strategic policies
Ongoing
Education and promotion was considered
one of the more significant gaps in the solid
waste system and is an essential
complement to infrastructure changes and
0.25 FTE to build
and run education
programs
$17,500based on$75,000 @1.3 to include
Centralized to
on department
that can work
with others –
Reduce,
Reuse and
Recycle

CITY OF WINNIPEG - CORPORATE WASTE REDUCTION STRATEGY
ENVSWM03102-01 | DECEMBER 2014 | ISSUED FOR USE
40
City of Winnipeg Corporate Waste Reduction Strategy
Table 16: Strategy and Implementation Plan
Strategies Action Highlights Pre-requisite Timeframe Noteworthy Considerations
Resource Requirements Roles and
Responsible
Departments
Prevention
Hierarchy
LevelDedicated
Staff
Budgets (Capital
and/or Operational)
2
Education
Programming –
Prevention Focus
Promote waste prevention through
initiatives such as business cases for hand
dryers versus paper towel, procurement
changes, onsite composting (where
applicable) etc.
meeting targets benefits($57,690Salary)Promotionalmaterials asrelevant toprojects
Solid Waste or
Urban Planning
3Staff Engagement
and Green Teams
Coordinate with zero waste manager to
develop programs to meet staff needs
and/or improve participation in waste
diversion program
Educate, Empower and Inspire Staff to
Effect Behaviour Changes
Partner with organizations that can assist in
developing successful programs
Involve staff who will ultimately become
staff champions that will be necessary to
ensure program success and find new
opportunities for waste diversion and
reduction.
As required based
on a planVolunteers
Reduce,
Reuse and
Recycle

CITY OF WINNIPEG - CORPORATE WASTE REDUCTION STRATEGY
ENVSWM03102-01 | DECEMBER 2014 | ISSUED FOR USE
41
City of Winnipeg Corporate Waste Reduction Strategy
7.0 CLOSURE
We trust this report meets your present requirements. If you have any questions or comments, please contact the
undersigned.
Respectfully submitted,
Tetra Tech EBA Inc.
Prepared by: Reviewed by:
Avery Gottfried, ME, P.Eng. Tamara Shulman, BA
Solid Waste Planning Engineer Environmental Planner – Waste Management
Environment Practice Environment Practice
Direct Line: 604.685.0017 x322 Direct Line: 604.685.0017 x300
[email protected] [email protected]
Prepared by: Reviewed by:
Jessica Frank, MSc. Shaun Spalding CET EP
Project Manager – Waste Management Solid Waste Planning Lead
Environment Practice Environment Practice
Direct Line: 604.685.0017 x349 Direct Line: 403.723-1545
CITY OF WINNIPEG - CORPORATE WASTE REDUCTION STRATEGY
ENVSWM03102-01 | DECEMBER 2014 | ISSUED FOR USE
City of Winnipeg Corporate Waste Reduction Strategy
APPENDIX ATETRA TECH’S GENERAL CONDITIONS

GENERAL CONDITIONS
1
GEOENVIRONMENTAL REPORT
This report incorporates and is subject to these “General Conditions”.
1.0 USE OF REPORT AND OWNERSHIP
This report pertains to a specific site, a specific development, and a
specific scope of work. It is not applicable to any other sites, norshould it be relied upon for types of development other than those
to which it refers. Any variation from the site or proposed
development would necessitate a supplementary investigation andassessment.
This report and the assessments and recommendations contained
in it are intended for the sole use of Tetra Tech EBA’s client. TetraTech EBA does not accept any responsibility for the accuracy of
any of the data, the analysis or the recommendations contained or
referenced in the report when the report is used or relied upon byany party other than Tetra Tech EBA’s Client unless otherwise
authorized in writing by Tetra Tech EBA. Any unauthorized use of
the report is at the sole risk of the user.
This report is subject to copyright and shall not be reproduced either
wholly or in part without the prior, written permission of Tetra TechEBA. Additional copies of the report, if required, may be obtained
upon request.
2.0 ALTERNATE REPORT FORMAT
Where Tetra Tech EBA submits both electronic file and hard copy
versions of reports, drawings and other project-related documentsand deliverables (collectively termed Tetra Tech EBA’s instruments
of professional service), only the signed and/or sealed versions
shall be considered final and legally binding. The original signedand/or sealed version archived by Tetra Tech EBA shall be deemed
to be the original for the Project.
Both electronic file and hard copy versions of Tetra Tech EBA’sinstruments of professional service shall not, under any
circumstances, no matter who owns or uses them, be altered by
any party except Tetra Tech EBA. The Client warrants that TetraTech EBA’s instruments of professional service will be used only
and exactly as submitted by Tetra Tech EBA.
Electronic files submitted by Tetra Tech EBA have been prepared
and submitted using specific software and hardware systems. Tetra
Tech EBA makes no representation about the compatibility of thesefiles with the Client’s current or future software and hardware
systems.
3.0 NOTIFICATION OF AUTHORITIES
In certain instances, the discovery of hazardous substances or
conditions and materials may require that regulatory agencies andother persons be informed and the client agrees that notification to
such bodies or persons as required may be done by Tetra Tech
EBA in its reasonably exercised discretion.
4.0 INFORMATION PROVIDED TO TETRA TECH EBA BY
OTHERS
During the performance of the work and the preparation of the
report, Tetra Tech EBA may rely on information provided bypersons other than the Client. While Tetra Tech EBA endeavours to
verify the accuracy of such information when instructed to do so by
the Client, Tetra Tech EBA accepts no responsibility for theaccuracy or the reliability of such information which may affect the
report.

CITY OF WINNIPEG - CORPORATE WASTE REDUCTION STRATEGY
ENVSWM03102-01 | DECEMBER 2014 | ISSUED FOR USE
City of Winnipeg Corporate Waste Reduction Strategy
APPENDIX BWASTE AUDIT RAW SORT DATA

Sorting Log Form WASTE AUDIT – CITY OF WINNIPEG
FILE: 704-ENVSWM03102-01 | December 2014 | ISSUED FOR USE
EBA Sample Number
Sample Source
Material Stream
Waste Generation Period (# Days)
Date Material was Collected (MM/DD/YY)
Sorting Team
Notes
Net Weight (kg)* Comments**
1 R Fine, office (envelopes, receipts), magazines, flyers,
boxboard (cereal boxes, toilet paper tubes), books,
newsprint, telephone directories, moulded pulp
2 R Clean OCC (Old Corrugated Cardboard)
3 C Waxed OCC and other non-recyclable OCC
4 R Drink box / Aseptic (Tetra) and Gable Top - Juice Boxes
(Non-Diary)
5 R Drink box / Aseptic (Tetra) and Gable Top - Diary
6 C Food soiled paper (Napkins, Paper Plates, etc.)
7 G Other paper packaging - polycoated (Coffee cups, Frozen
Juice Containers, Ice Cream Paper Containers, Takeout
paper softdrink cups)
8 G Other Paper - Gift wrap, laminated paper
9 R Plastic Beverage Containers (Non-Diary)
10 R Rigid plastic containers with a recycling triangle #1-7
(e.g., bottles, pails, tubs, jugs), Plastic packaging with a
recycling triangle #1-7
11 G All Plastic Film - bags, plastic wrap, cellophane, etc.
12 G Styrofoam (Polystyrene) - foam cups, foam food
containers, foam egg cartons, foam meat trays, other
foam packaging
13 G Plastics without a recycling triangle - Other rigid plastic
products and/or plastic films including durable plastic
products, toys, dishware, hoses, plastic cutlery, straws,
CD/DVD cases, Large HDPE & PP Pails and Lids (>20L)
14 R Metal Beverage containers
15 TB Metal Deposit (Beer)
16 R Food Containers all types (aluminum, steel)
17 G Other Metals, aluminum foil, foil pie plates, foil food
containers, pots and pans
18 R Glass beverage containers (Non-Diary)
19 TB Glass Deposit (Beer)
20 R Food containers
21 G Other glass, ceramics, dishware, mirrors, incandescent
light bulbs,
METALS
GLASS
Material Category
PAPER and PAPER PACKAGING
PLASTIC
1 of 2

Sorting Log Form WASTE AUDIT – CITY OF WINNIPEG
FILE: 704-ENVSWM03102-01 | December 2014 | ISSUED FOR USE
22 C Yard and Garden - grass, plants, branches
23 C Food Waste - vegetable peelings, meat, bread, leftover
food
24 C Clean Wood (non-painted lumber)
25 G Treated or Painted Wood
26 TB Rubber Tires, bike tubes, rubber
27 G Textiles - All types - clothing, shoes, blankets, etc.
28 G Gypsum/drywall/plaster, masonry, rock porcelain, carpet,
underlay, fibreglass etc.
29 TB Computer and IT Equipment
30 TB Telecom Equipment
31 TB TV and Audio Equipment
32 TB Small Kitchen Appliances
33 TB All other with a power cord or that can take batteries
(electrical cords, battery powered toys, power tools,
electric toothbrush, etc.)
34 TB Batteries (small/personal)
35 TB Batteries (automotive)
36 TB Compact fluorescent lights and tubes
37 TB Stains/preservatives, paint, aerosols
38 TB Motor oil, Oil Filters, Antifreeze, Other Petroleum Based
Products (includes empty container), Solvent and
Flammable Liquids, Pesticides
39 G HHW (product &/or container) including Nail Polish, Make-
up, Health and beauty aids, Sunscreen, Bug Spray, items
with skull and crossbones including fertilizer
40 TB Mercury Containing Items - Thermostats and switches,
Compact fluorescent light bulbs and tubes
41 TB Pharmaceuticals
42 G Diapers, Other (sanitary napkins, tampons)
43 G Pet Waste (animals feces, bedding, cat litter)
44 G Furniture, white goods
45 G Fines
** Describe and weigh separately items that significantly affect the total weight measured for a material category (e.g. a magazine collection)
R = Recyclable; C = Compostable; TB = Take Back Program; G = Garbage
* Show individual weights for each material category, not just the sum. Record multiple weights as follows: e.g. "85.15 + 25.25".
BULKY OBJECTS
OTHER
BUILDING MATERIAL
ELECTRONIC WASTE
SPECIAL WASTE - HAZARDOUS
HOUSEHOLD HYGIENE
COMPOSTABLE ORGANICS
NON-COMPOSTABLE ORGANICS and TEXTILES
2 of 2
CITY OF WINNIPEG - CORPORATE WASTE REDUCTION STRATEGY
ENVSWM03102-01 | DECEMBER 2014 | ISSUED FOR USE
City of Winnipeg Corporate Waste Reduction Strategy
APPENDIX CWASTE AUDIT PHOTO LOG
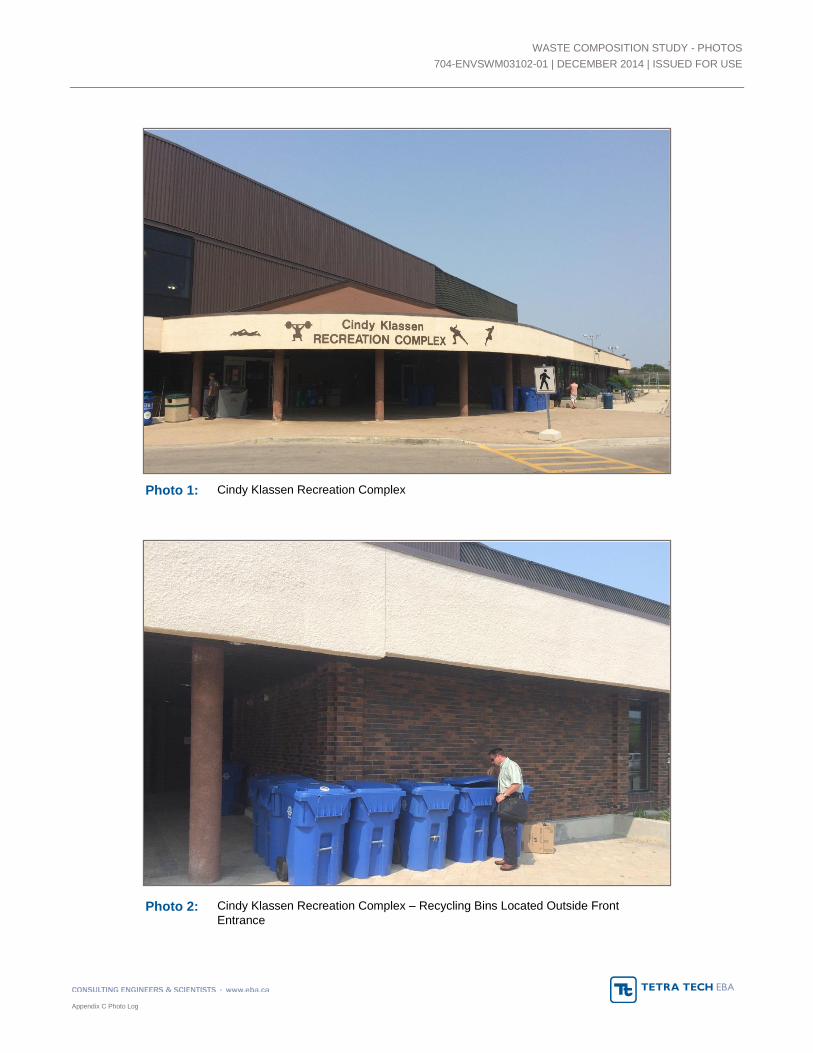
WASTE COMPOSITION STUDY - PHOTOS
704-ENVSWM03102-01 | DECEMBER 2014 | ISSUED FOR USE
Appendix C Photo Log
Photo 1: Cindy Klassen Recreation Complex
Photo 2: Cindy Klassen Recreation Complex – Recycling Bins Located Outside Front Entrance
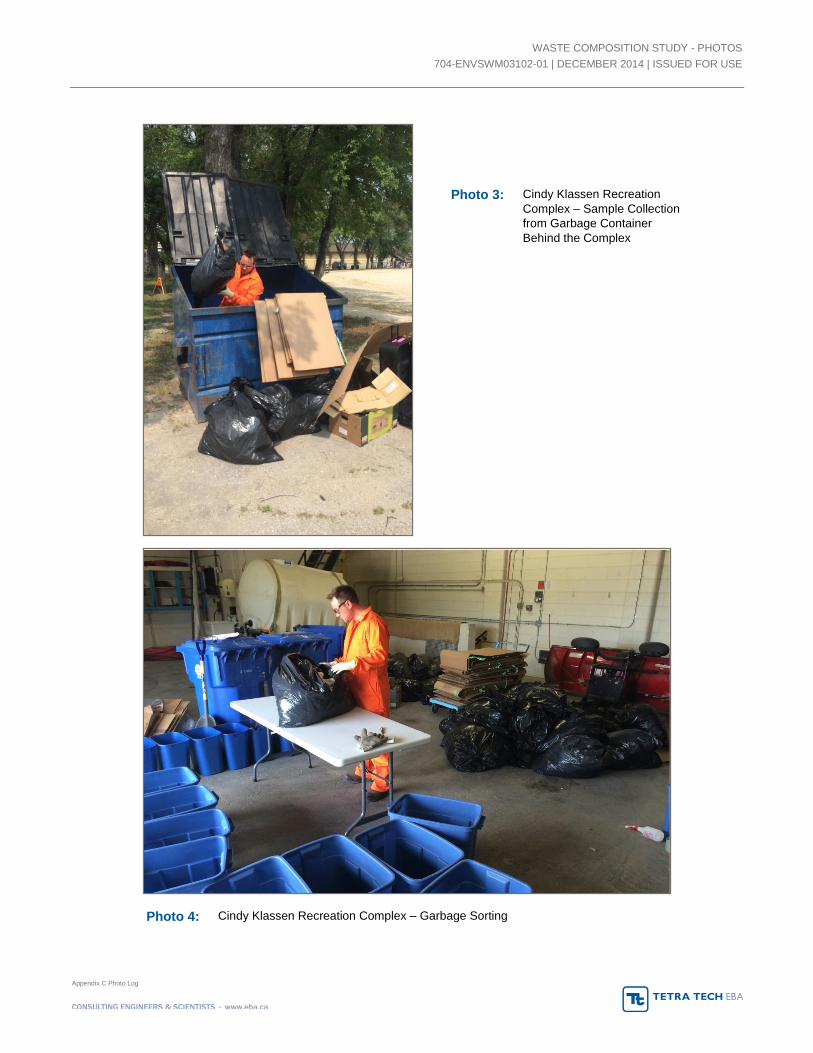
WASTE COMPOSITION STUDY - PHOTOS
704-ENVSWM03102-01 | DECEMBER 2014 | ISSUED FOR USE
Appendix C Photo Log
Photo 4: Cindy Klassen Recreation Complex – Garbage Sorting
Photo 3: Cindy Klassen Recreation Complex – Sample Collection from Garbage Container Behind the Complex

WASTE COMPOSITION STUDY - PHOTOS
704-ENVSWM03102-01 | DECEMBER 2014 | ISSUED FOR USE
Appendix C Photo Log
Photo 6: Cindy Klassen Recreation Complex – Two Bags of Yard Waste in the Garbage
Photo 5: Cindy Klassen Recreation Complex – Typical Garbage Bag with Paper Towel, Water Bottles, Milk Carton, and Scrap Paper
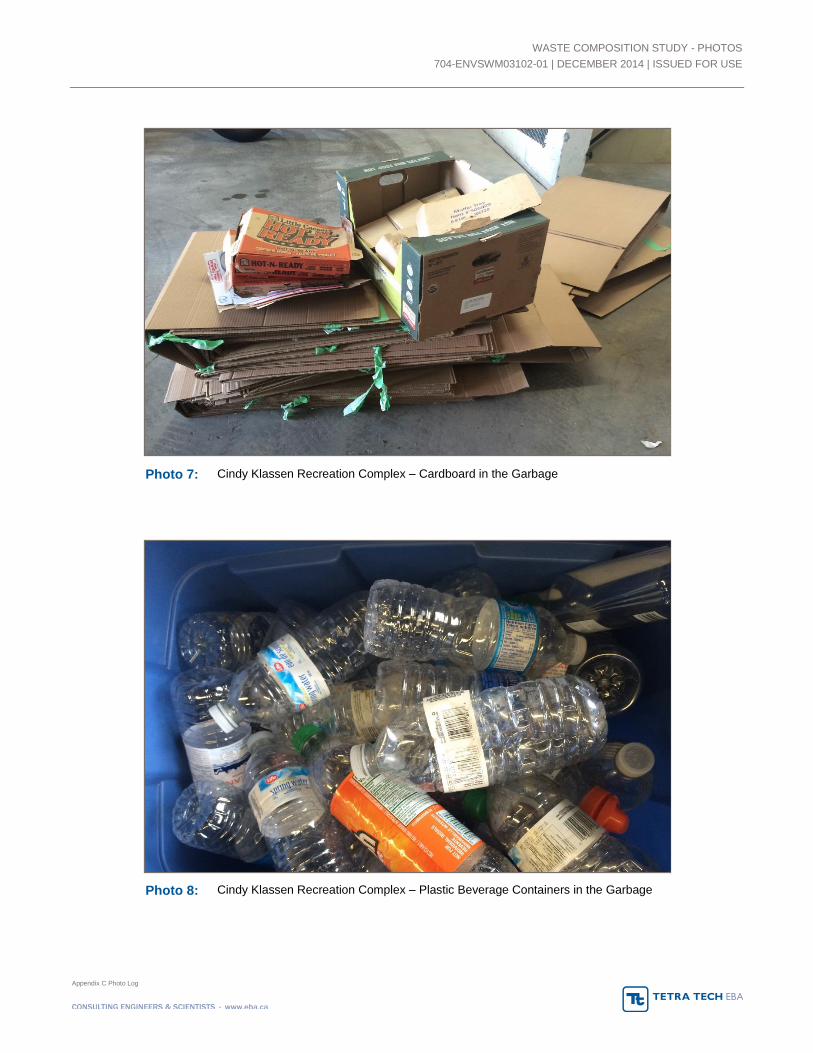
WASTE COMPOSITION STUDY - PHOTOS
704-ENVSWM03102-01 | DECEMBER 2014 | ISSUED FOR USE
Appendix C Photo Log
Photo 7: Cindy Klassen Recreation Complex – Cardboard in the Garbage
Photo 8: Cindy Klassen Recreation Complex – Plastic Beverage Containers in the Garbage

WASTE COMPOSITION STUDY - PHOTOS
704-ENVSWM03102-01 | DECEMBER 2014 | ISSUED FOR USE
Appendix C Photo Log
Photo 9: Cindy Klassen Recreation Complex – Rigid Plastic Containers in the Garbage
Photo 10: Cindy Klassen Recreation Complex – Food Scraps in the Garbage
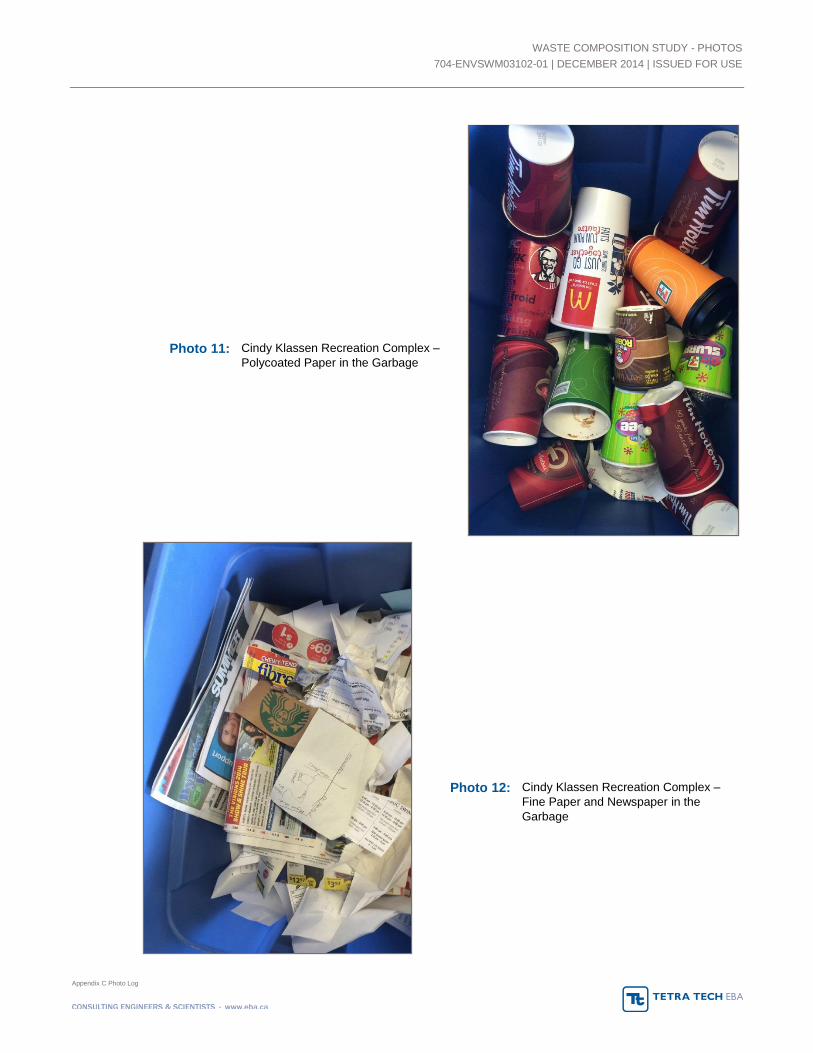
WASTE COMPOSITION STUDY - PHOTOS
704-ENVSWM03102-01 | DECEMBER 2014 | ISSUED FOR USE
Appendix C Photo Log
Photo 12: Cindy Klassen Recreation Complex – Fine Paper and Newspaper in the Garbage
Photo 11: Cindy Klassen Recreation Complex – Polycoated Paper in the Garbage
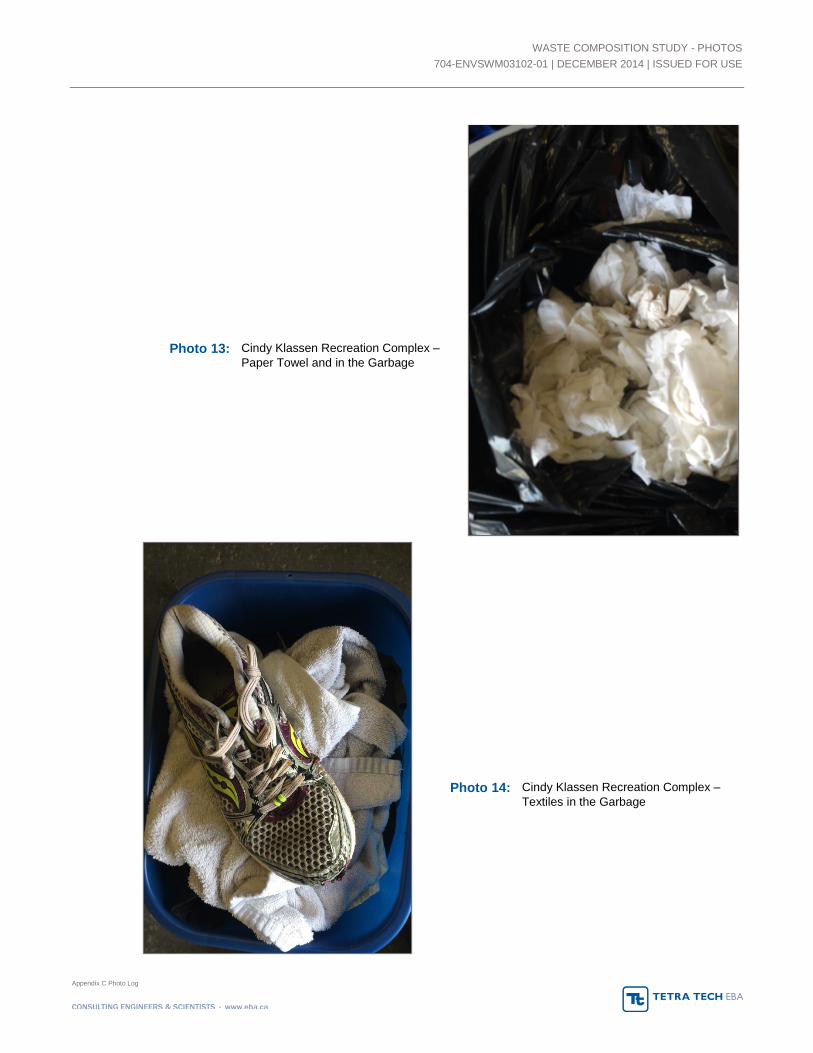
WASTE COMPOSITION STUDY - PHOTOS
704-ENVSWM03102-01 | DECEMBER 2014 | ISSUED FOR USE
Appendix C Photo Log
Photo 14: Cindy Klassen Recreation Complex – Textiles in the Garbage
Photo 13: Cindy Klassen Recreation Complex – Paper Towel and in the Garbage

WASTE COMPOSITION STUDY - PHOTOS
704-ENVSWM03102-01 | DECEMBER 2014 | ISSUED FOR USE
Appendix C Photo Log
Photo 15: City Hall – Garbage Containers
Photo 16: City Hall – Recycling Containers

WASTE COMPOSITION STUDY - PHOTOS
704-ENVSWM03102-01 | DECEMBER 2014 | ISSUED FOR USE
Appendix C Photo Log
Photo 17: City Hall – Garbage and Recycling Area and Waste Sorting Station Setup
Photo 18: City Hall – Recycling and Garbage Stockpiled to be Sampled

WASTE COMPOSITION STUDY - PHOTOS
704-ENVSWM03102-01 | DECEMBER 2014 | ISSUED FOR USE
Appendix C Photo Log
Photo 20: City Hall – Plastic Beverage Containers in the Garbage
Photo 19: City Hall – Typical Cart Used by Custodial Staff to Collect All Garbage and Recycling in the Building
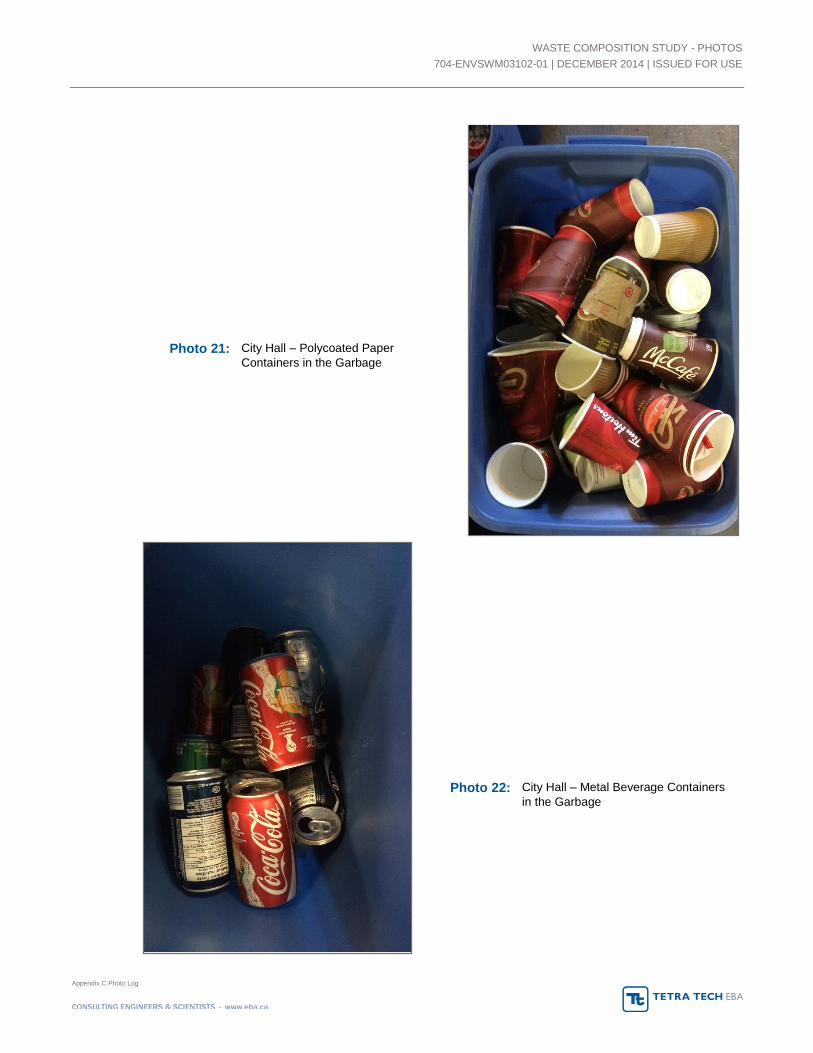
WASTE COMPOSITION STUDY - PHOTOS
704-ENVSWM03102-01 | DECEMBER 2014 | ISSUED FOR USE
Appendix C Photo Log
Photo 22: City Hall – Metal Beverage Containers in the Garbage
Photo 21: City Hall – Polycoated Paper Containers in the Garbage

WASTE COMPOSITION STUDY - PHOTOS
704-ENVSWM03102-01 | DECEMBER 2014 | ISSUED FOR USE
Appendix C Photo Log
Photo 24: City Hall – Metal Food Containers in the Garbage
Photo 23: City Hall – Drink Box Containers in the Garbage
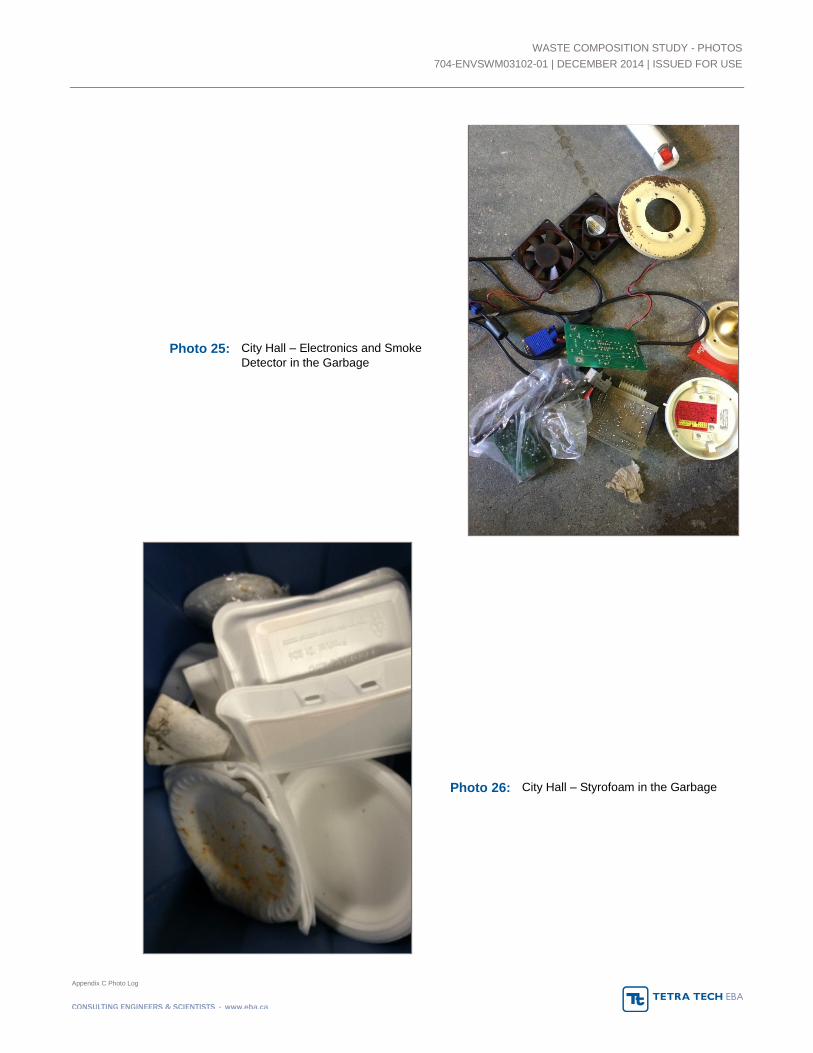
WASTE COMPOSITION STUDY - PHOTOS
704-ENVSWM03102-01 | DECEMBER 2014 | ISSUED FOR USE
Appendix C Photo Log
Photo 26: City Hall – Styrofoam in the Garbage
Photo 25: City Hall – Electronics and Smoke Detector in the Garbage
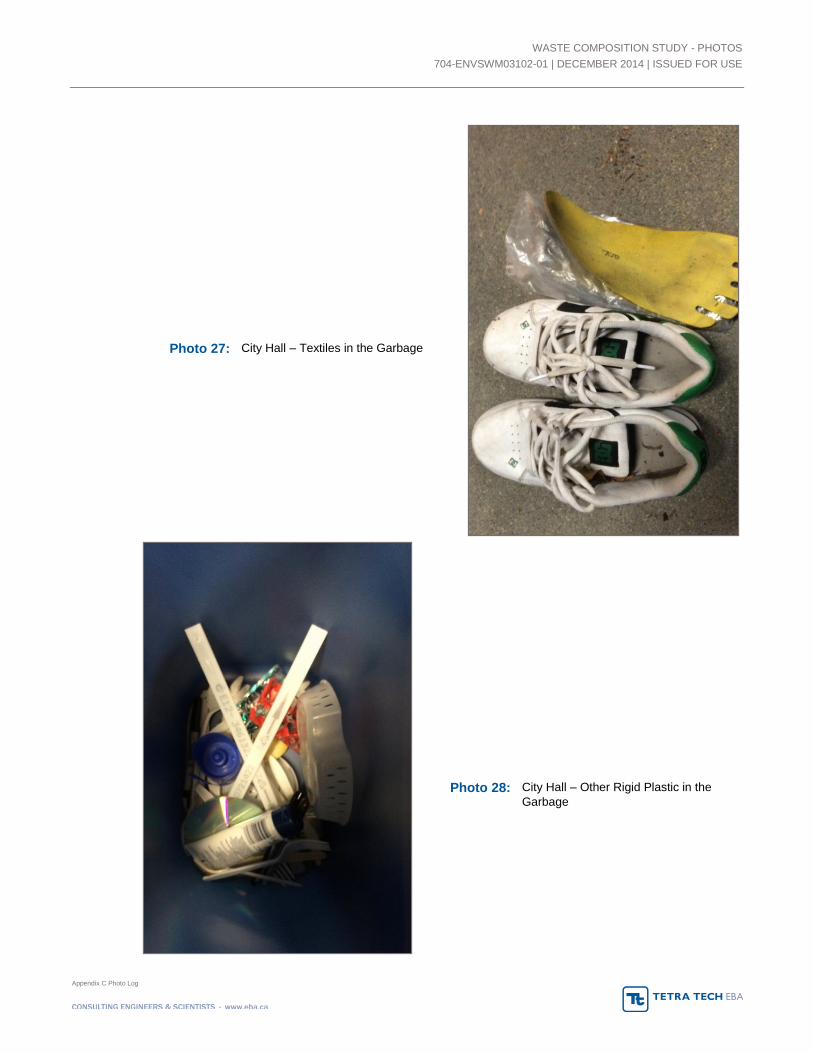
WASTE COMPOSITION STUDY - PHOTOS
704-ENVSWM03102-01 | DECEMBER 2014 | ISSUED FOR USE
Appendix C Photo Log
Photo 28: City Hall – Other Rigid Plastic in the Garbage
Photo 27: City Hall – Textiles in the Garbage

WASTE COMPOSITION STUDY - PHOTOS
704-ENVSWM03102-01 | DECEMBER 2014 | ISSUED FOR USE
Appendix C Photo Log
Photo 29: City Hall – Fine Paper, Newspaper and Cardboard in the Garbage
Photo 30: City Hall – Food Scraps in the Garbage
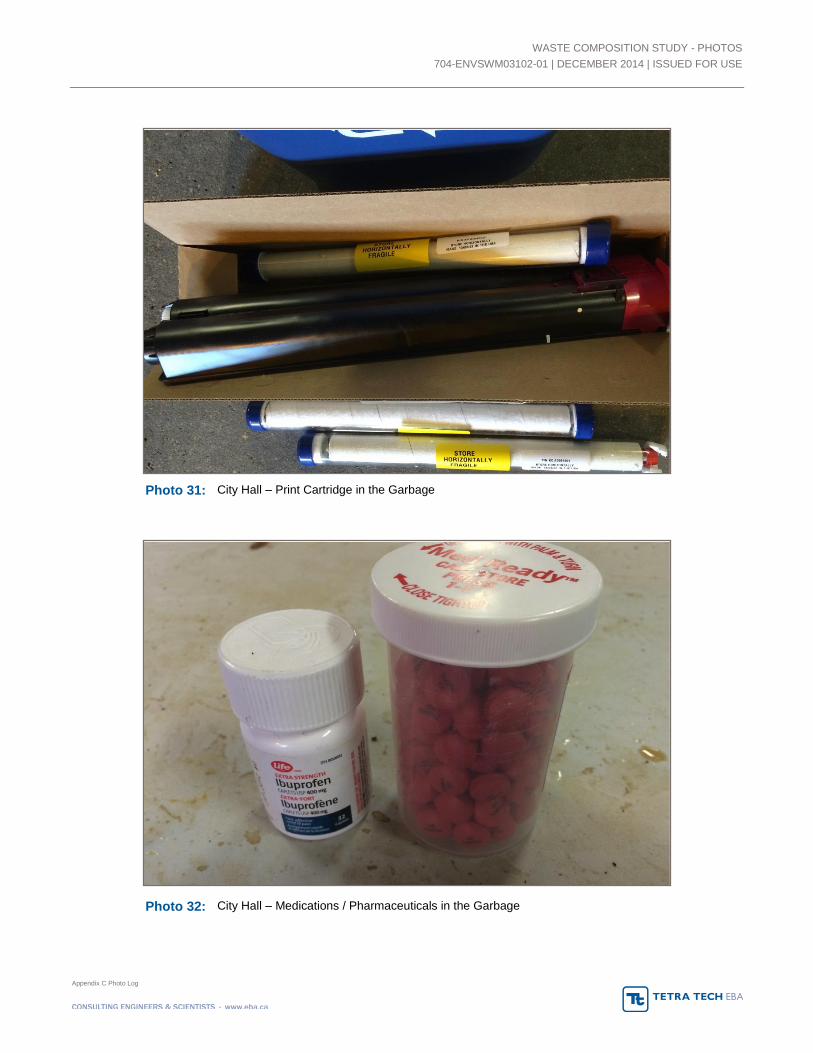
WASTE COMPOSITION STUDY - PHOTOS
704-ENVSWM03102-01 | DECEMBER 2014 | ISSUED FOR USE
Appendix C Photo Log
Photo 31: City Hall – Print Cartridge in the Garbage
Photo 32: City Hall – Medications / Pharmaceuticals in the Garbage
CITY OF WINNIPEG - CORPORATE WASTE REDUCTION STRATEGY
ENVSWM03102-01 | DECEMBER 2014 | ISSUED FOR USE
2
City of Winnipeg Corporate Waste Reduction Strategy
APPENDIX DCOPY OF SITE VISIT QUESTIONS

1 Corporate Waste Reduction - Site Visit Questions
City of Winnipeg – Corporate Waste Reduction Strategy
Facility Questionnaire – Site Visit (Facility/Building Specific)
The purpose of this questionnaire is to include the City of Winnipeg facility managers in the planning process for
waste reduction and diversion in municipal facilities.
Ensure that a separate form is completed for each type of facility (as defined in question No. 1) that the manager is
responsible for.
Your perspective and insights are critical to understanding existing collection systems and determining
improvements to those systems over time. Thank you for your participation.
Name:
Title:
Describe Your Responsibilities:
Email Address:
Phone:
Facility Name/Address:
Please answer the following questions and provide any additional comments you feel are appropriate.
1. Place a checkmark beside the type of facility that is being audited:
Corporate Office (City Hall, Planning Property & Development, Police, and Administration)
Public Recreation (Community Centre/Sports Venues & Arena/Pools)
Commercial/Residential (Fire & Rescue Stations/Non-Market Housing/Police Facilities/Daycare)
Operations and Maintenance Yards (including Transit Facilities, Garages, and Stations)
Community Service and Cultural Venues (Library, Museums, and Theatre)
Parks, Open Spaces, and Golf Courses (including cemetery operations)

CITY OF WINNIPEG INTERVIEWS
FILE: ENVSWM03102-01 | DECEMBER 2014 | ISSUED FOR USE
2 Corporate Waste Reduction - Site Visit Questions
Miscellaneous (concessions, parking lots, etc.)
2. Describe the day to day activities/operations that take place at the facility including number of
visitors/employees.
3. Who is responsible for ensuring waste is properly managed at the facility:
a) Who provides the waste hauling services to the facility?
b) Who is responsible for managing waste on site and ensuring it is put into the proper waste bins and
managed properly?
c) Who manages the overall waste collection system – including determining if the service is adequate and
the proper bins and services are available, and how are decisions made about the waste management
setup at the facility.

CITY OF WINNIPEG INTERVIEWS
FILE: ENVSWM03102-01 | DECEMBER 2014 | ISSUED FOR USE
3 Corporate Waste Reduction - Site Visit Questions
4. Name up to five (5) opportunities to reduce material use through reduce or reuse strategies (e.g., change
purchasing practices, add reusable items over single use disposable, etc.)
5. Below is a chart of some items that are part of the Province of Manitoba’s product stewardship programs, so
industry is responsible for taking back these items after they have been used. Note which items are generated
on site, and if there is a collection method.
Waste Reduction and Prevention – Producer Responsibility Programs
Generated On Site? (Y, N, ?)
Collected for Recycling? (Y, N, and described how is it collected and
managed)
Beverage Containers
Packaging and Printed Paper (Glass, Metal,
Plastic, and Paper)
Electronics
Rechargeable Batteries and Single Use Batteries
(Small/Personal)
Fluorescent Lights and Tubes
Household Hazardous Waste (Flammable or
combustible products like solvents, reactive
products such as pool chemicals, corrosive
products like some cleaners, toxic products like
pesticides)
Paint

CITY OF WINNIPEG INTERVIEWS
FILE: ENVSWM03102-01 | DECEMBER 2014 | ISSUED FOR USE
4 Corporate Waste Reduction - Site Visit Questions
Waste Reduction and Prevention – Producer Responsibility Programs
Generated On Site? (Y, N, ?)
Collected for Recycling? (Y, N, and described how is it collected and
managed)
Pharmaceuticals/Sharps and Syringes
Used Oil, Oil Filters, Oil Containers, Antifreeze,
and Antifreeze Containers
Lead-acid Batteries
Tires
Commercial and Farm Pesticide Containers
Mercury-containing Thermostats
Other: Please Describe
Other: Please Describe
6. Using the information above, identify up to five (5) opportunities to establish and/or better utilize stewardship
programs and related collection systems.

CITY OF WINNIPEG INTERVIEWS
FILE: ENVSWM03102-01 | DECEMBER 2014 | ISSUED FOR USE
5 Corporate Waste Reduction - Site Visit Questions
7. What are the most important items should your facility be recycling? Note any waste generated that represents
large quantities on site.
8. Does the facility generate organic waste? What are the main sources of organic waste and specify what is done
with yard waste at the facility (grass, leaves, branches, plants, etc.), and if there is any program for food
scraps/composting.
9. Are there any managers and/or staff champions go the extra distance to initiate and maintain waste reduction
and diversion strategies. Please describe and list names and titles of staff for further follow up.
10. What opportunities exist for measuring the quantity of materials diverted/recycling? What
measurement/evaluation systems would you like to see in place to monitor waste reduction and diversion rates
over time? (e.g., hauler tracking weights, volume estimates, and invoices)

CITY OF WINNIPEG INTERVIEWS
FILE: ENVSWM03102-01 | DECEMBER 2014 | ISSUED FOR USE
6 Corporate Waste Reduction - Site Visit Questions
11. Below is a list of barriers identified as potential reason for low diversion rates. Please rate their significance
from 1 to 5, with 5 being the most significant barrier. Also note any additional barriers that prevent waste
reduction and recycling initiatives.
Barrier Rating System
1 – Not a Barrier 5 – Significant Barrier
Not knowing about opportunities to reduce/divert materials 1 2 3 4 5
Lack of green purchasing/procurement options 1 2 3 4 5
Systems are not in place to deliver items to recycling facilities 1 2 3 4 5
Suitable containers for source separation are not available 1 2 3 4 5
Recycling collection containers are not conveniently located 1 2 3 4 5
No capacity/staff time to manage the programs 1 2 3 4 5
No budget provision for programs 1 2 3 4 5
No budget provision for green procurement 1 2 3 4 5
Additional barriers, please describe:
12. What are the most important waste-related issues you would like to see addressed in your building(s)?
13. What are the most common general comments you hear within your workplace about waste collection, waste
reduction and diversion practices?

CITY OF WINNIPEG INTERVIEWS
FILE: ENVSWM03102-01 | DECEMBER 2014 | ISSUED FOR USE
7 Corporate Waste Reduction - Site Visit Questions
14. Would the information provided in this questionnaire be similar for all other facilities of similar type as defined
in question No. 1 or do different programs exist in different buildings? Please Describe:
15. Any other comments?