correction for instrumental drift in flame photometry · t he procedure to fl ame photometric...
TRANSCRIPT
-------_.
Journal of Resea rch of the National Bureau of Standards Vol. 6 1, No.6, December 1958 Research Paper 2918
Correction for Instrumental Drift in Flame Photometry Barry W . Mulligan and Alan F. Haught
The application of the principles of experimental design to corrcct for drift in instrum ental measurements, specifically in flam e photometry, is described. Based on the procedure proposed by Youden, samples and reference standards may be m easured in combinations of pairs in a mann er s uch that errors caused by drift can be minimized a nd the actual am.ount of drift can be de termined . Where t he drift is dependent on t he magnit ude of t he quantity m easured, grouping b y magnit ude prior to final measuremen t is necessary. Application of t he procedure to fl ame photometric determination of a lka li elements, under condit ions of severe drift, resulted in improving coefficient s of variation from an original range of 2.0 to 3.5 to a range of 0.6 to 1.2.
1. Introduction
In any series of measuremen ts, drift in the respon se of the measUl'ing instrumen t may in troduce appreciable errors. Although the errors may be reduced by improved adjustment or design of the instrumen t, some drift may be inevi table. ~ 'An unusual example of drift was encountered in measurements with a flame pho tometer. Replace~ men t of the detector, a photomultiplier tube, was later found to overcome mos t of the drift ; however, the possibility of compensating for drif t by appropriate design of t he expcriment in t his and similar cases was cxplored .
Youden I proposed a design and sta tistical treatment of data usin g a method of incomplete blocks to minimize errors caused by instrumental drift, and at the same time, to measure t he magnitude of this effect. The applicabiliLy of his procechu'e to this drift problem was examined .
2 . Experimental Procedures
DUl'ing the developmen t of a me thod for determining the alkali metals with a Beckman model DU 2 flame photometer wi th photomultiplier attachment, it was no ted that the readings of the instrumen t were shifting with time. The determinations were being made on a long series of solutions, so that a shift in readings would seriously affect the results.
In Youden's method to compensate for drift, l the object;; to be measured (here tbe sample and standard solu tions) are arrangrd in an appropriate sequen ce. Specifically, the objects arc grouped in pall's, so that each obj ect appears in a pair wit h every other obj ect. For example, 5 objects are grouped in 10 pairs, as shown in table 1, the sequence of the pairs being immaterial. The objrcts are then measured on the instrument in a mann er such tha t the time between measmemen ts on t he objects in a pair is small in comparison to the time between pairs.
The rigorous method of Youden for computing the drift involves long ari t bmetic calculations. A simplified, yet accurate, alternate method, sugges ted later by Youden, will be described here. No difference was found in the values computed by the
1 W . J. YOl1del1. Science 120, No. 3121, 627 (1954) . 2 lI. lI. Carey and A. O. Beckman, J . Opt. Soc. Am. 31, 682 (1941).
499
T ABLE 1. Design of ex periment
P aiL ________________ I 2 3 4 5 ObjecL _____________ AB DE BC EA CD Pair ___ -- - ---- 6 7 8 9 10 ObjecL _ --- --- Ell AC IlD CE D A
two methods, within Lhe accuracy of the data. The meLhod involves, first, the determination of caleulated, or correeted, value for the measurements on the objects, A, B , 0 , etc., and second, the computation of drif t using the observed values and cal~ culated values of the objects.
A calculated value for each obj ect is determined as is shown by the steps in table 2. In the table, Al represents the measured value of object A in pair 1, 0 7 the measured value of object 0 in pair 7, etc. The differences between A and the obj ect with which it appears are summed, + A and - A are added to the left side of t he equat ion, the equa~ tion is divided by five, and everyth ing bu t A is transposed to the right side. Since the expression (A + B I + 0 7+ D lO+ E 4)/5 will be approximately equal to the average o[ the 20 measurements, (that is, four each on A, B , 0 , D , and E , divided by 20), the last equa tion is obtained. A similar computation is performed to obtain Lhe Cfllclllatcd values [or t he other objects, B , 0, D , and E.
In addition to correction for drif t, the method also provides a measure of t he drif t. Table 3 shows the method of computing t he average drift for each pair. The diA'erences between the observed values and the calculated values of t he two objects in the pair arc averaged, and the result represents the average drift for the pair. The drift for t he pairs is then plot ted as the deviat ion from tb e mean drift. It should be noted that the validity of the statistical method rests on the assumptions tltat the objects do no t change in the course of the measurements and that the drift is independent of the magni t ude of the measurements made.
T ABLE 2. Calculated value f or object .r1
A,-B ,= X, A,-C,= X , AIO- D ,o=X3 A4-E 4= X 4
A = Avrragc of all measurements + :!:tx; 5
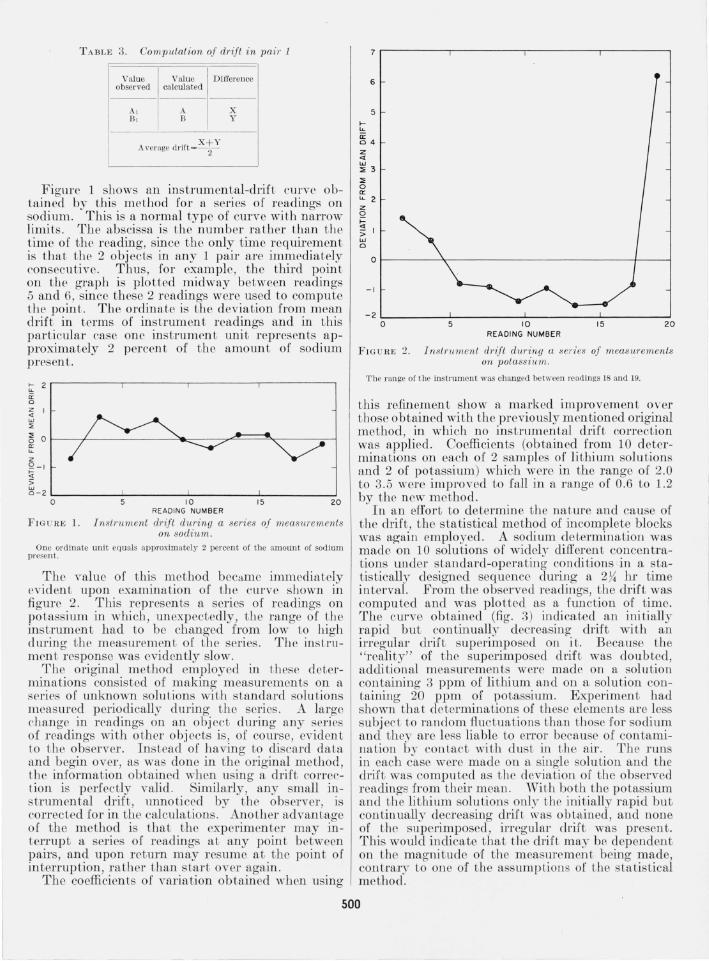
TABLE 3. Computation of d1'ift in pail' 1
Value Value Difference observed calculated
A I A X HI 13 Y
. X+Y Average dl'lft-- 2-
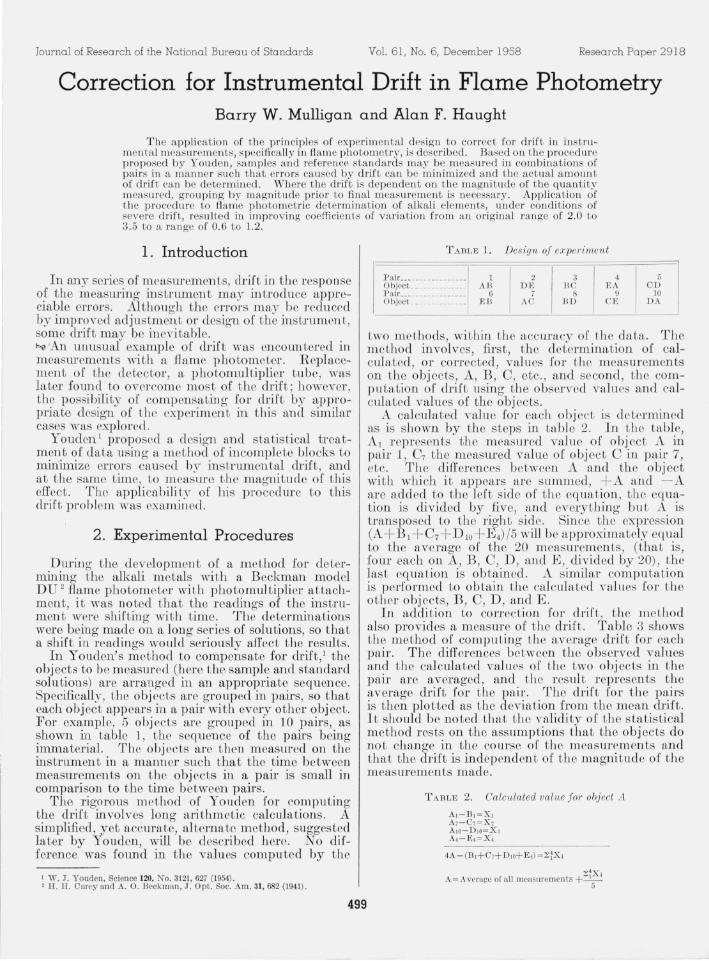
Figure 1 shows an instrumental-drift C\ll've obtained by th is method for a series of readi.ngs on sodium. This is a normal type of curve with narrow limits. The abscissa is the number rather than the time of the reading, since the only time requirement is that the 2 objects in any 1 pair are immediately consecutive. Thus, for example, the third point on the graph is plotted midway between readings 5 and 6, since these 2 readings were used to compute the point. The ordinate is the deviation from mean drift in terms of instrument readings and in this particular case one instrument unit represents approximately 2 percent of the amount of sod ium prescnt.
~ 2 ,---------,---------,----------,----------,
'" ir o Z I
" "' ::;,
~ o~--~------------~~--~~~==~------~ 0:
'" Z Q-I ~ ;; "' o-2 L-________ ~ ________ ~ ________ ~ ________ ~
o 10 READING NUMBER
15 20
FIGuRE 1. I nslrwnent drift during a series of measurements on sodittm.
One ordinate unit equals approximately 2 percent of the amoun t of sodium present.
The value of this method beeame immediately ryident upon examination of the eurve shown in figure 2. This represents a series of readings on potassium in which, unexpectedly, the range of the instrument had to be changed from low to high during the measurement of the series. The instru ment response was evidently slow.
The original method employed in these determinations consisted of making measurements on a series of unlmown solutions with standard solutions measured periodically during the series. A large change in readings on an object during any sel'irs of readings with other objects is , of course, evident to the observer. Instead of having to discard data and begin over, as was done in the original method, the information obtained when using a drift correetion is perfectly valid . Similarly, any small instrumental drift, unnoticed by the observer, is rorrected for in the calculations. Another advantage of the method is that the experimenter may interrupt a series of readings at any point between pairs, and upon return mny resume at the point of interruption, rather than start over again.
The coefficients of variation obtained when using
7 r---------,----------,----------,----------,
lLL
6
5
ti: 04 z "" w ::;; 3 ::;; o a: '" 2 z '2 I-
~I w o
Or-------~~--------------------------r_--_1
-I
-2~0--------~5----------~IO----------~15--------~20
READING NUMBER
FIGURE :!. In strum ent dTifl dW'ing a series of me as UTe men Is on potassium.
1'he range of Lhc instrument was changed bet,,"ccn readings 18 and 19.
this refinement show a markcd improvement over those 0 btained with the previously mentioned original method, in which no instrumental drift correction was applied. Coefficients (obtained from 10 determinations on each of 2 samples of lithium solutions and 2 of potassium) which were in the range of 2.0 to 3.5 were improved to fall in a range of 0.6 to l.2 by the new method.
In an effort to determine the nature and cause of the drift, the statistical method of incomplete blocks was again employed. A sodium determination was made on 10 solutions of widely different concentrations undeI' standard-operating conditions in a statistically designed sequence during a 2X hI' time interval. From the observed readings, the drift was computed and was plotted as a function of time. The curve obtained (fig . 3) indicated an initially rapid but continually decreasing drift with an irregular drift superimposed on it. Because the "reality" of the superimposed drift was doubted, additional measurements were made on a solution containing 3 ppm of lithium and on a solution containing 20 ppm of potassium. Experiment had shown that determinations of these elements arc less subj ect to random fluctuations than those for sodium and they are less liable to error because of contamination by contact with dust in the ail'. The runs in each case were made on a single solution and the drift was computed as t he deviation of the observed readings from their mean. With both the potassium and the lithium solutions only the initially rapid but continually decreasing drift was obtained, and none of the superimposed, irregular drift was present. This would indicate that the drift may b p, dependent on the magnitude of the measurement being made, contrary to one of the assumptions of the statistical method.
500
14
12
>-- 10 u. a: 8 0
z « 6 w ::;;
4 ::. 0 a: 2 u. z 0 0
~ -2 > ~ - 4
-6
- 8 0 5 10 15 20 25 30 35 4 0 4 5
READING NUMBER
FIGURE 3. InstTument dTift obtained when measuring a series of 10 sodium solutions havin(! widely di.O·eTent concentmlions.
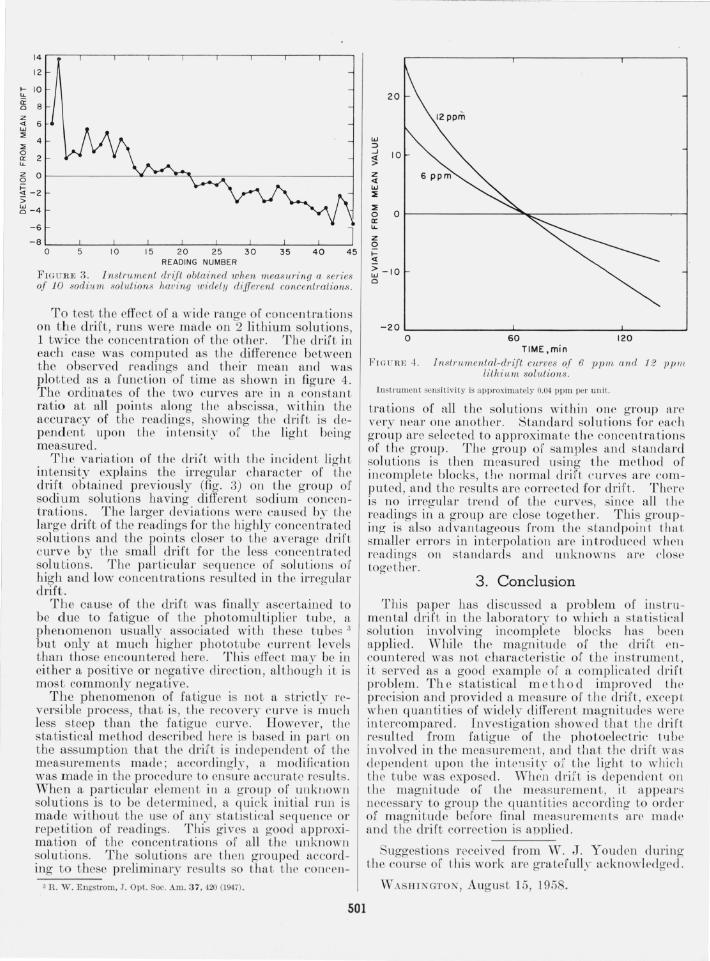
To test the effect of a wide range of co ncentratioJl s on the drift, runs were made on 2 lithium solutions, 1 twice the co ncentration of tbe other. The drift in each case was computed as the difference between the observed readings and their mean and was plotted as a function of time as shown in figure 4. The ordinates of the two curves are in a constant ratio at all points along the abscissa, wi thin the accuracy of the readings, showing the drift-. is dependent upon the intens i t~r of t he light bcing measured.
The variation of the dria witll tbe incide ll t light intensity explains the irregular character of the drift obtained previously (fig. 3) on the group of sodium solutions having different sodium concentrations. The larger deviations were ca used by the large drift of the readings for the hig hly cO ll centmLed solutions and the points closer to the average drift curve by the small drift for tbe less co ncen tratcd solu tions. The particular sequence of solutions of high and low concentrations resulted in the irregular drift .
The cause of the drift was finally ascertained to be due to fatigue of the photomultiplier tube, a phenomenon usually associated wi th these tubes 3
but only at much higher phototube current levels than those encountered here. This effect mav be ill either a positive or negative direction, although it is most commonly negative.
The phenomenon of fatigue is not a strictly reversible process, that is, t he recovery curve is much less steep than the fatigue curve. However, the statis tical method described here is based in part on the assumption that the drift is independent of the measurements made; aecordingl)' , a modification was made in the procedure to eJl sure accurate results. 'Vhen a particular elemenL in a gro up of unkilown solutions is to be determined, a quick illitial rull is made without tbe usc of any statistical sequeJl ce or repetition of readings. This gives a good approximation of t be concen trat.ion s of all tbe unknown solutions. The solutions are t hen grouped according to these preliminary results so Lhat the concen-
3 R. W. Engstrom, .J. Opt. Soc. Am. 37, 420 (1947).
501
w :> ...J
~ Z <I: w ~
~
20
10
o Or----------------3~------------------~__l a:: u. z o >-« G:; -10 o
-20~ ______________ ~ ______________ ~ ______ __J
o 60 120 TIME , min
F IGu RE -I. Tn81r umental-drift curves oJ 6 ppm and 12 pplll lithi (un solutions.
Instru ment sensit ivit.y is approximately 0.04 ppm PCI' u nit.
tratiolls of all the solutioll s within olle group are very near one another. Standard solut,ions for each group arc selected to approximate t he co ncentrations of the group. Tbe group of samples and standard solutions is then measured using the method of incompleLe blocks, tlte normal dr ift curves are computed, and the res ults arc correcLed for drift. T here is no irregular trend of the curves, since all til(' readings in a group are close together. This grouping is also advanLageous from Lhc standpoill t thaL smaller errors in interpolation arr inLrodLlcecl whell readings on s tandards and unk:nown s arc close toge1.hrr.
3 . Conclusion
This paper has discussed a problem of illsL ru mrntal drift in the laboratory to which a sta listieal solution involving in complete blocks has beell applied. While the magnitude of the drift enco un tered was not characteristic of t he instr umen t , it served as a good example of a complicated clrifl problem. Th e statistical method improved lhl' precision and provided a measure of the drift, excepl when quantities of wielely difl'rrent magnitudes were in tcrcompared . Investigation showed tha t the drift resulted from fatigue of the photoelectric lube involved in t he meas urement, and thal- the drift was clependent upon tbe inten si t~· 01 the light to which the t ube was exposed. When drift is dependelll 0 11
lhe magnitude of the measurement, it appears necessary to gro up the qun,n ti ties according to order of magnitude before final measuremcnts arc made and the drift correction is appli ed.
Suggestions received from W. J. You dell during the course of lhis work are gratcfull)- acknowledged.
' VASHINGTON, August 15, 1958.