corsa coal corp investor presentation - miningdataonline.com · corsa coal –overview 2 company...
TRANSCRIPT
May 2017
Corsa Coal Corp Investor Presentation
Pit Excavation at the Acosta Deep MineSomerset County, Pennsylvania
Forward-looking Statements
1
Certain statements and information set forth in this presentation constitute "forward-looking statements" and "forward-looking information" under applicable securities laws (collectively, "forward-looking statements"). Except for statements of historical fact, certain information contained herein constitutes forward-looking statements which include management's assessment of future plans and operations and are based on current internal expectations, estimates, projections, assumptions and beliefs, which may prove to be incorrect. Some of the forward-looking statements include, but is not limited to, statements regarding the pro forma projections and information for Corsa and future oriented financial information. When used in this presentation, forward-looking statements may be identified by words such as "estimates", "expects" "anticipates", "believes", "projects", "plans", "pro forma" and similar expressions. These statements are not guarantees of future performance and undue reliance should not be placed on them. Such forward-looking statements necessarily involve known and unknown risks and uncertainties, many of which are beyond Corsa's control and may cause Corsa's actual performance and financial results in future periods to differ materially from any projections of future performance or results expressed or implied by such forward-looking statements. These risks and uncertainties include, but are not limited to: liabilities inherent in coal mine development and production; geological, mining and processing technical problems; inability to obtain required mine licenses, mine permits and regulatory approvals or renewals required in connection with the mining and processing of coal; unexpected changes in coal quality and specification; risks that the coal preparation plants will not operate at production capacity during the relevant period; variations in the coal preparation plants' recovery rates; dependence on third party coal transportation systems; competition for, among other things, capital, acquisitions of reserves, undeveloped lands and skilled personnel; incorrect assessments of the value of acquisitions; changes in commodity prices and exchange rates; changes in the regulations in respect to the use, mining and processing of coal; changes in regulations on refuse disposal; the effects of competition and pricing pressures in the coal market; the oversupply of, or lack of demand for, coal; currency and interest rate fluctuations; various events which could disrupt operations and/or the transportation of coal products, including labor stoppages and severe weather conditions; the demand for and availability of rail, port and other transportation services; and management's ability to anticipate and manage the foregoing factors and risks. The forward-looking statements and information contained in this presentation are based on certain assumptions regarding, among other things, coal sales being consistent with expectations; future prices for coal; future currency and exchange rates; Corsa's ability to generate sufficient cash flow from operations and access capital markets to meet its future obligations; the regulatory framework representing royalties, taxes and environmental matters in the countries in which Corsa conducts business; coal production levels; and Corsa's ability to retain qualified staff and equipment in a cost-efficient manner to meet its demand. While these assumptions, risks and uncertainties do not represent a complete list of factors which may cause events to be materially different than those expressed or implied by forward-looking statements in this presentation, they should be considered carefully. There can be no assurance that forward-looking statements will prove to be accurate, as actual results and future events could differ materially from those anticipated in such statements. The forward looking statements will not be updated unless required by law. The reader is cautioned not to place undue reliance on forward-looking statements. Unless otherwise specifically indicated, all references in this presentation to dollars or to "$" or "$USD" are to the currency of the United States, and all references to "$CAD" are to the currency of Canada.
Corsa Coal – Overview
2
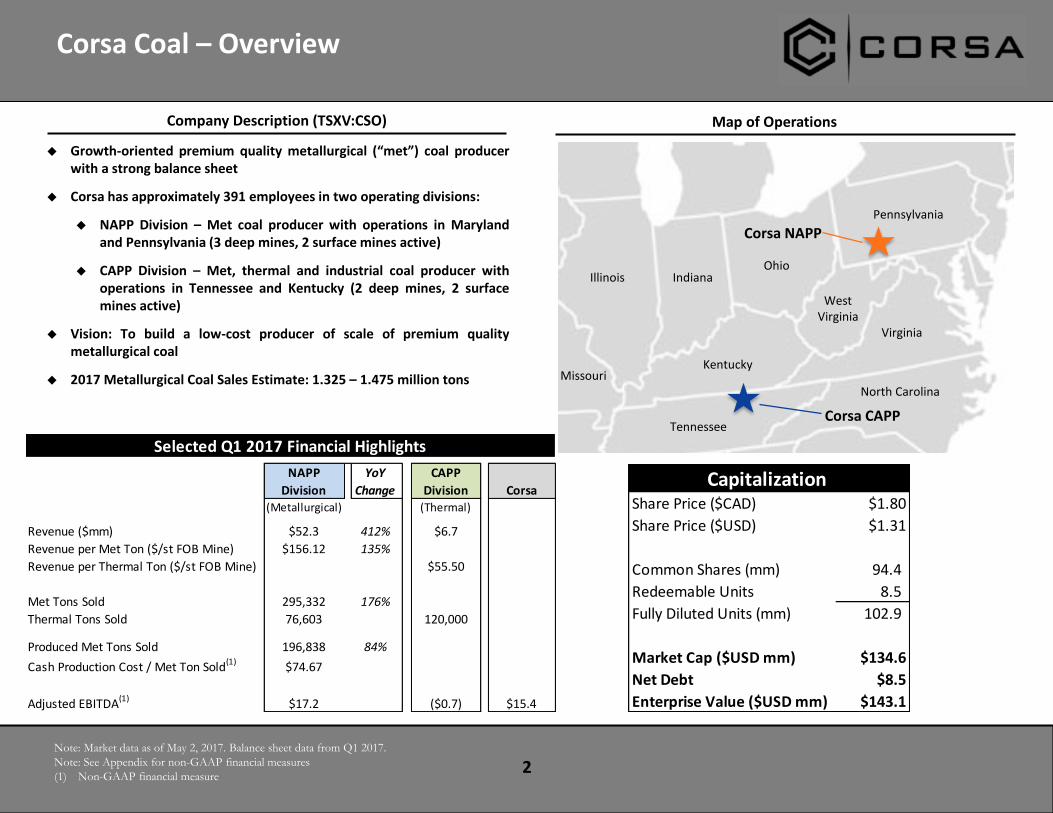
Company Description (TSXV:CSO)
Growth-oriented premium quality metallurgical (“met”) coal producerwith a strong balance sheet
Corsa has approximately 391 employees in two operating divisions:
NAPP Division – Met coal producer with operations in Marylandand Pennsylvania (3 deep mines, 2 surface mines active)
CAPP Division – Met, thermal and industrial coal producer withoperations in Tennessee and Kentucky (2 deep mines, 2 surfacemines active)
Vision: To build a low-cost producer of scale of premium qualitymetallurgical coal
2017 Metallurgical Coal Sales Estimate: 1.325 – 1.475 million tons
Corsa NAPP
Corsa CAPP
Map of Operations
Note: Market data as of May 2, 2017. Balance sheet data from Q1 2017.
Note: See Appendix for non-GAAP financial measures
(1) Non-GAAP financial measure
Ohio
Pennsylvania
West Virginia
Virginia
Kentucky
IndianaIllinois
Tennessee
North CarolinaMissouri
Capitalization Share Price ($CAD) $1.80
Share Price ($USD) $1.31
Common Shares (mm) 94.4
Redeemable Units 8.5
Fully Diluted Units (mm) 102.9
Market Cap ($USD mm) $134.6
Net Debt $8.5
Enterprise Value ($USD mm) $143.1
Selected Q1 2017 Financial Highlights
NAPP
Division
YoY
Change
CAPP
Division Corsa(Metallurgical) (Thermal)
Revenue ($mm) $52.3 412% $6.7
Revenue per Met Ton ($/st FOB Mine) $156.12 135%
Revenue per Thermal Ton ($/st FOB Mine) $55.50
Met Tons Sold 295,332 176%
Thermal Tons Sold 76,603 120,000
Produced Met Tons Sold 196,838 84%
Cash Production Cost / Met Ton Sold(1)
$74.67
Adjusted EBITDA(1)
$17.2 ($0.7) $15.4
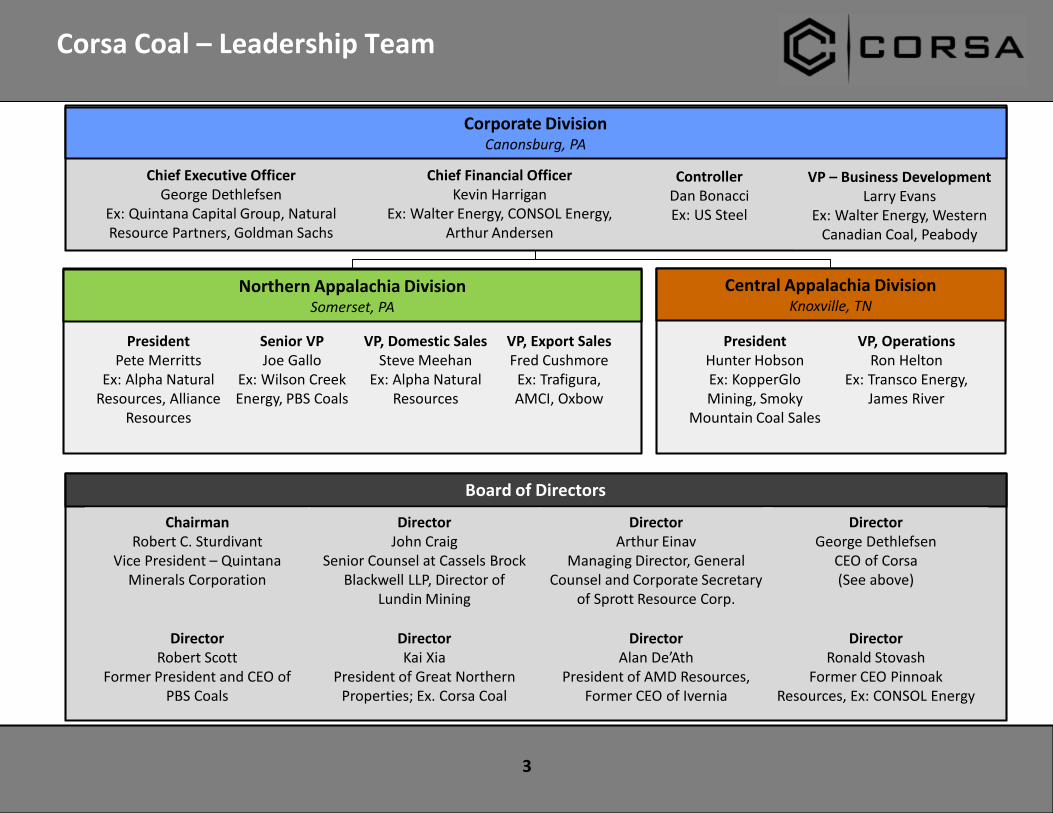
Corsa Coal – Leadership Team
3
Corporate DivisionCanonsburg, PA
Chief Executive OfficerGeorge Dethlefsen
Ex: Quintana Capital Group, Natural Resource Partners, Goldman Sachs
Chief Financial OfficerKevin Harrigan
Ex: Walter Energy, CONSOL Energy, Arthur Andersen
ControllerDan Bonacci Ex: US Steel
Northern Appalachia DivisionSomerset, PA
PresidentPete Merritts
Ex: Alpha Natural Resources, Alliance
Resources
Senior VPJoe Gallo
Ex: Wilson Creek Energy, PBS Coals
VP, Domestic SalesSteve Meehan
Ex: Alpha Natural Resources
Central Appalachia DivisionKnoxville, TN
PresidentHunter HobsonEx: KopperGlo Mining, Smoky
Mountain Coal Sales
VP, OperationsRon Helton
Ex: Transco Energy, James River
Board of Directors
DirectorArthur Einav
Managing Director, General Counsel and Corporate Secretary
of Sprott Resource Corp.
DirectorKai Xia
President of Great Northern Properties; Ex. Corsa Coal
DirectorRobert Scott
Former President and CEO of PBS Coals
DirectorRonald Stovash
Former CEO Pinnoak Resources, Ex: CONSOL Energy
ChairmanRobert C. Sturdivant
Vice President – Quintana Minerals Corporation
DirectorJohn Craig
Senior Counsel at Cassels Brock Blackwell LLP, Director of
Lundin Mining
DirectorAlan De’Ath
President of AMD Resources, Former CEO of Ivernia
DirectorGeorge Dethlefsen
CEO of Corsa(See above)
VP, Export SalesFred Cushmore
Ex: Trafigura, AMCI, Oxbow
VP – Business DevelopmentLarry Evans
Ex: Walter Energy, Western Canadian Coal, Peabody
$0
$50
$100
$150
$200
$250
$300
$350
$400
2005 2006 2007 2008 2009 2010 2011 2012 2013 2014 2015 2016
$ /
Met
ric
Ton
4
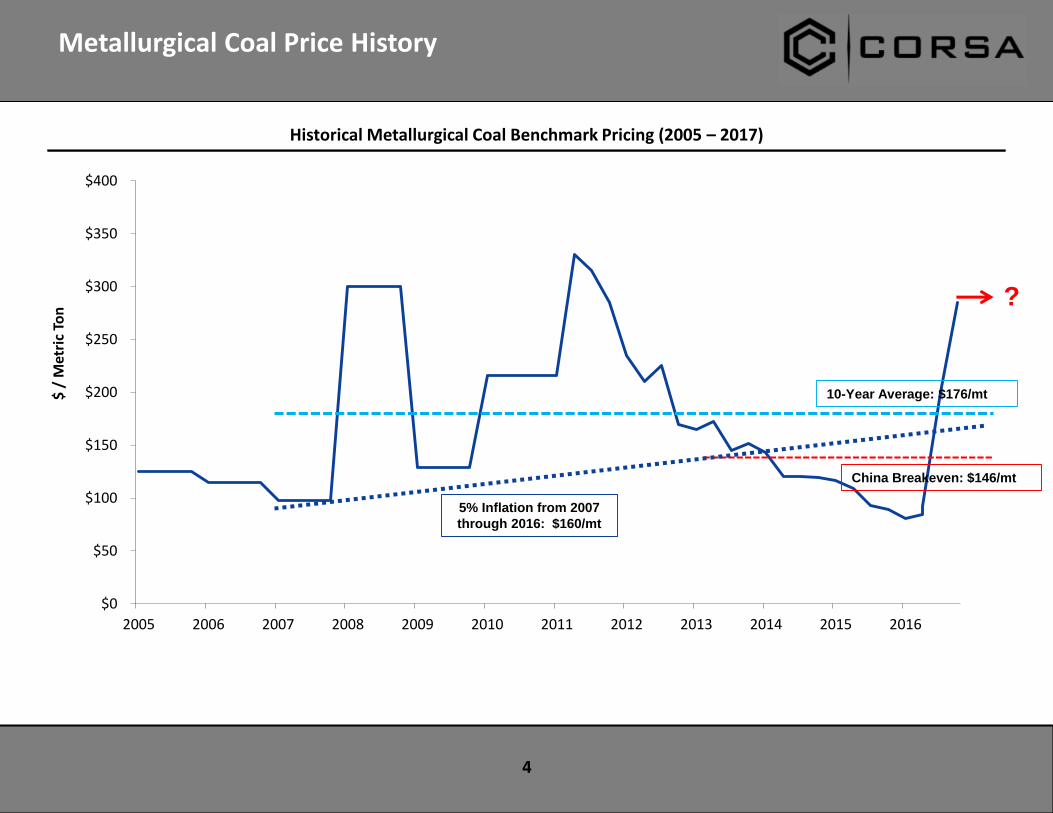
Metallurgical Coal Price History
Historical Metallurgical Coal Benchmark Pricing (2005 – 2017)
10-Year Average: $176/mt
?
China Breakeven: $146/mt
5% Inflation from 2007
through 2016: $160/mt
Met Coal Fundamentals and Pricing Catalysts
5
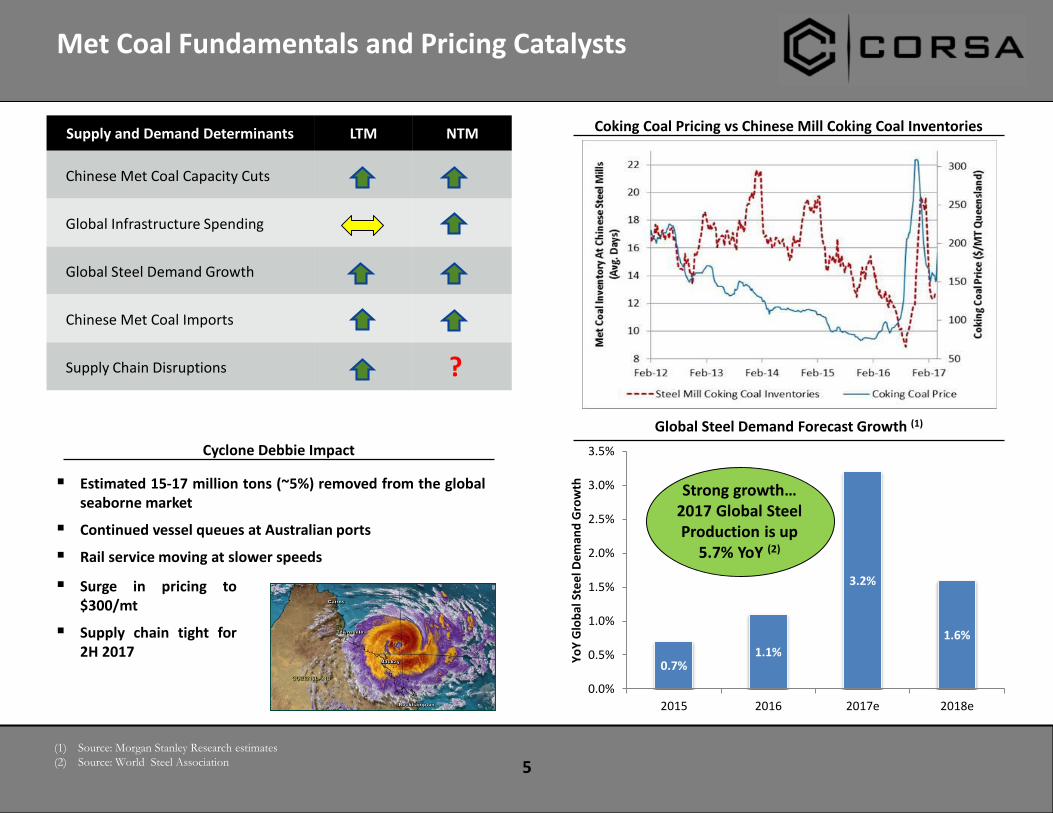
Supply and Demand Determinants LTM NTM
Chinese Met Coal Capacity Cuts
Global Infrastructure Spending
Global Steel Demand Growth
Chinese Met Coal Imports
Supply Chain Disruptions ?
Coking Coal Pricing vs Chinese Mill Coking Coal Inventories
0.7%1.1%
3.2%
1.6%
0.0%
0.5%
1.0%
1.5%
2.0%
2.5%
3.0%
3.5%
2015 2016 2017e 2018e
Yo
Y G
lob
al S
tee
l De
man
d G
row
th
Global Steel Demand Forecast Growth (1)
(1) Source: Morgan Stanley Research estimates
(2) Source: World Steel Association
Strong growth…2017 Global SteelProduction is up
5.7% YoY (2)
Cyclone Debbie Impact
Estimated 15-17 million tons (~5%) removed from the globalseaborne market
Continued vessel queues at Australian ports
Rail service moving at slower speeds
Surge in pricing to$300/mt
Supply chain tight for2H 2017
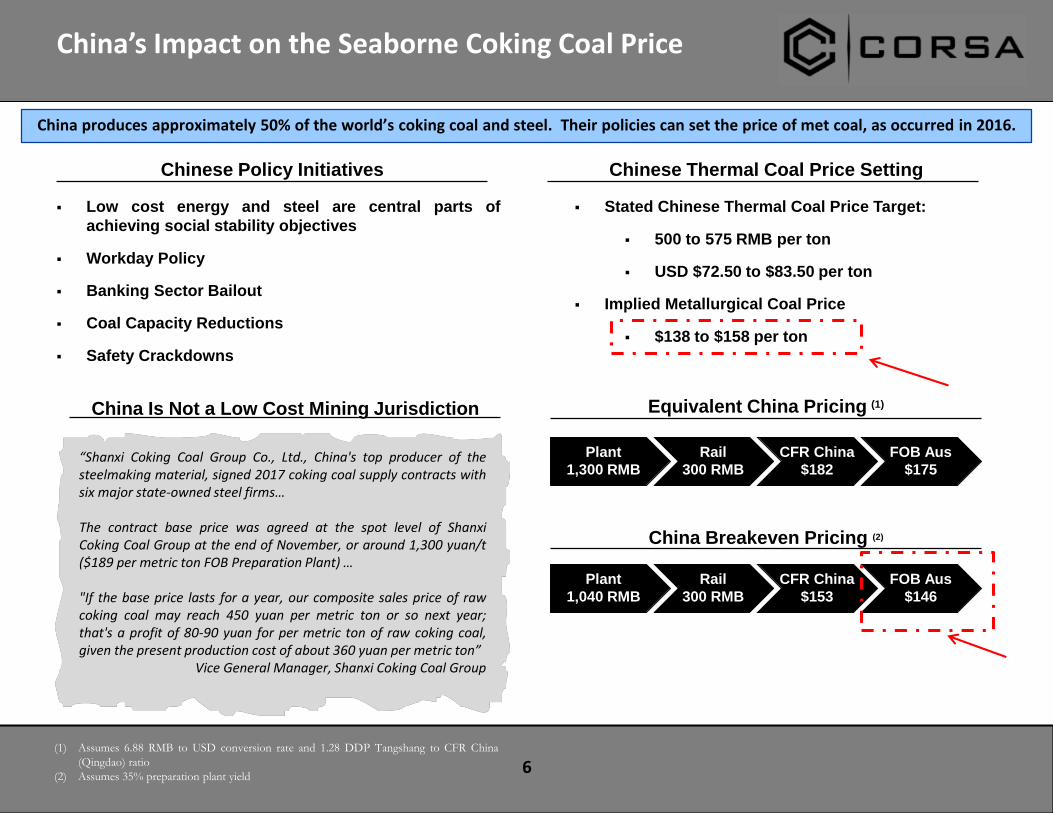
China’s Impact on the Seaborne Coking Coal Price
6
“Shanxi Coking Coal Group Co., Ltd., China's top producer of thesteelmaking material, signed 2017 coking coal supply contracts withsix major state-owned steel firms…
The contract base price was agreed at the spot level of ShanxiCoking Coal Group at the end of November, or around 1,300 yuan/t($189 per metric ton FOB Preparation Plant) …
"If the base price lasts for a year, our composite sales price of rawcoking coal may reach 450 yuan per metric ton or so next year;that's a profit of 80-90 yuan for per metric ton of raw coking coal,given the present production cost of about 360 yuan per metric ton”
Vice General Manager, Shanxi Coking Coal Group
Equivalent China Pricing (1)
Plant
1,300 RMB
Rail
300 RMB
CFR China
$182
FOB Aus
$175
China Breakeven Pricing (2)
Plant
1,040 RMB
Rail
300 RMB
CFR China
$153
FOB Aus
$146
(1) Assumes 6.88 RMB to USD conversion rate and 1.28 DDP Tangshang to CFR China
(Qingdao) ratio
(2) Assumes 35% preparation plant yield
Chinese Thermal Coal Price SettingChinese Policy Initiatives
Low cost energy and steel are central parts of
achieving social stability objectives
Workday Policy
Banking Sector Bailout
Coal Capacity Reductions
Safety Crackdowns
China Is Not a Low Cost Mining Jurisdiction
Stated Chinese Thermal Coal Price Target:
500 to 575 RMB per ton
USD $72.50 to $83.50 per ton
Implied Metallurgical Coal Price
$138 to $158 per ton
China produces approximately 50% of the world’s coking coal and steel. Their policies can set the price of met coal, as occurred in 2016.
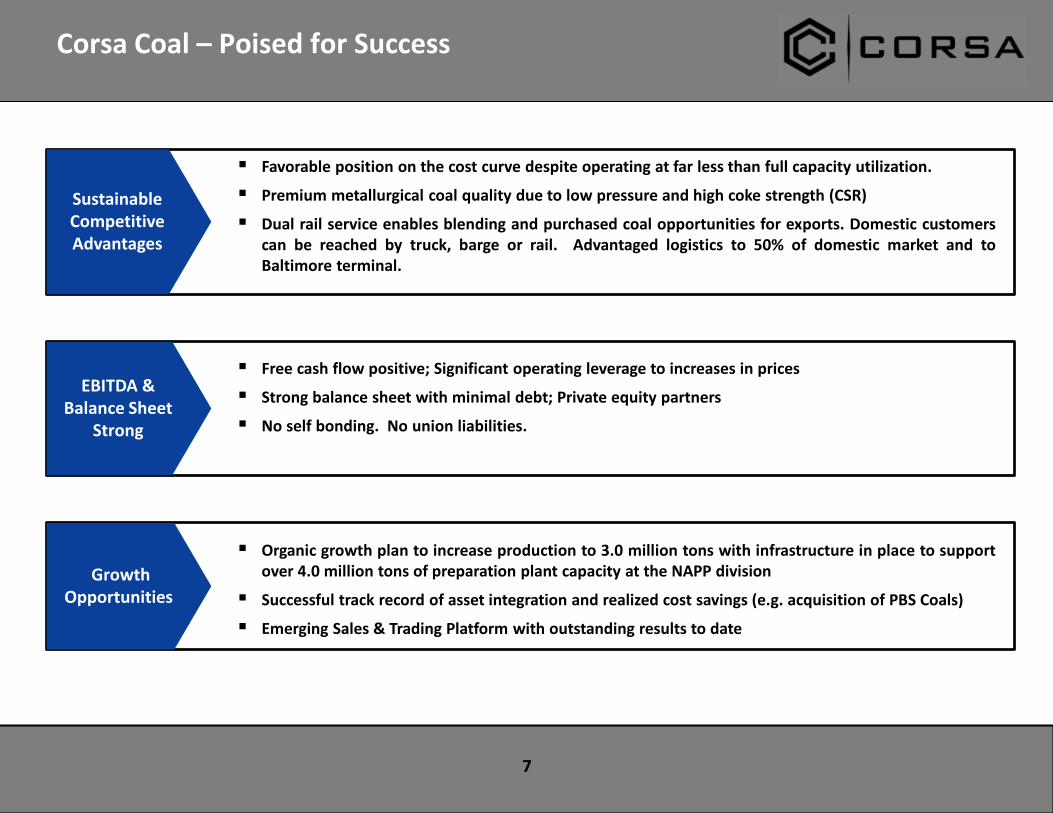
Corsa Coal – Poised for Success
7
Sustainable Competitive Advantages
Favorable position on the cost curve despite operating at far less than full capacity utilization.
Premium metallurgical coal quality due to low pressure and high coke strength (CSR)
Dual rail service enables blending and purchased coal opportunities for exports. Domestic customerscan be reached by truck, barge or rail. Advantaged logistics to 50% of domestic market and toBaltimore terminal.
Free cash flow positive; Significant operating leverage to increases in prices
Strong balance sheet with minimal debt; Private equity partners
No self bonding. No union liabilities.
EBITDA &Balance Sheet
Strong
Organic growth plan to increase production to 3.0 million tons with infrastructure in place to supportover 4.0 million tons of preparation plant capacity at the NAPP division
Successful track record of asset integration and realized cost savings (e.g. acquisition of PBS Coals)
Emerging Sales & Trading Platform with outstanding results to date
Growth Opportunities
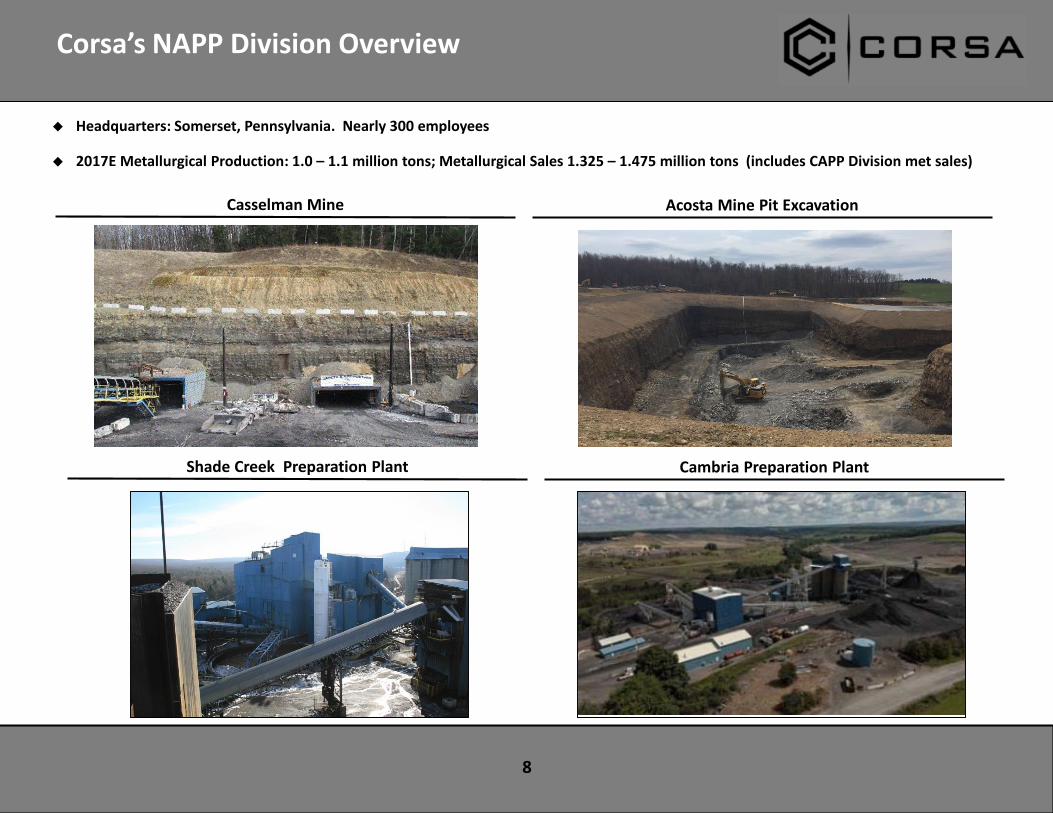
Corsa’s NAPP Division Overview
8
Cambria Preparation Plant
Headquarters: Somerset, Pennsylvania. Nearly 300 employees
2017E Metallurgical Production: 1.0 – 1.1 million tons; Metallurgical Sales 1.325 – 1.475 million tons (includes CAPP Division met sales)
Shade Creek Preparation Plant
Acosta Mine Pit ExcavationCasselman Mine
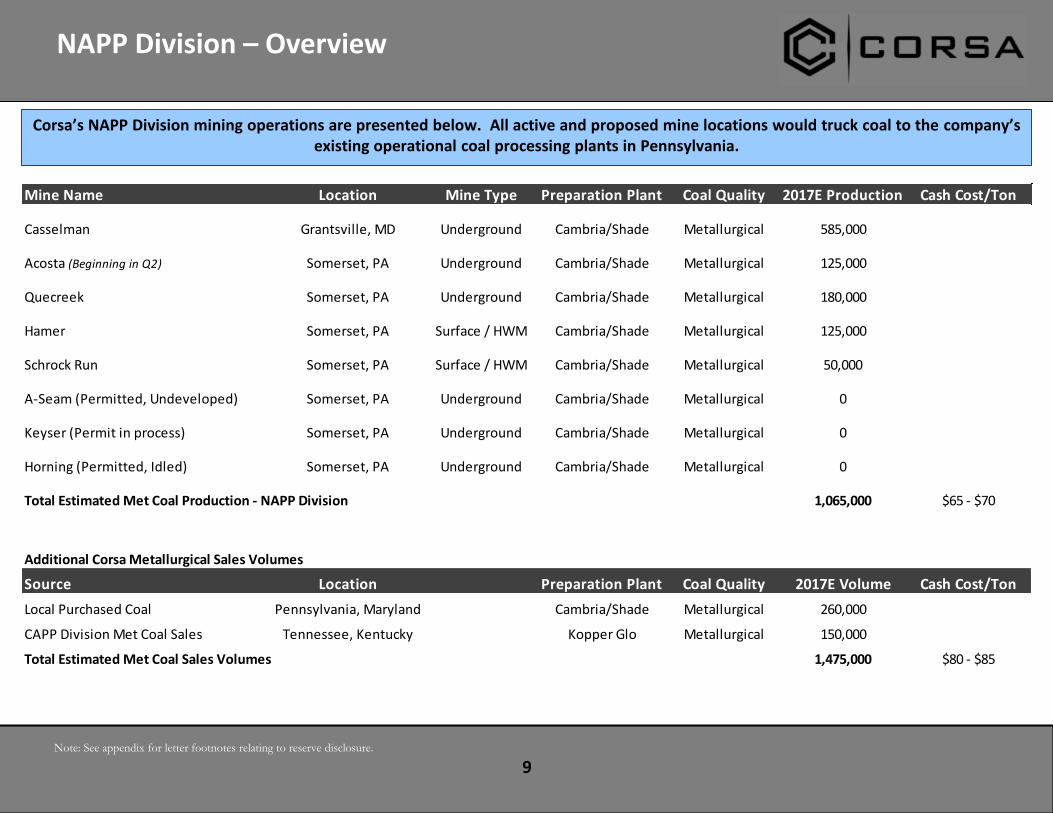
NAPP Division – Overview
9Note: See appendix for letter footnotes relating to reserve disclosure.
Corsa’s NAPP Division mining operations are presented below. All active and proposed mine locations would truck coal to the company’s existing operational coal processing plants in Pennsylvania.
Mine Name Location Mine Type Preparation Plant Coal Quality 2017E Production Cash Cost/Ton
Casselman Grantsville, MD Underground Cambria/Shade Metallurgical 585,000
Acosta (Beginning in Q2) Somerset, PA Underground Cambria/Shade Metallurgical 125,000
Quecreek Somerset, PA Underground Cambria/Shade Metallurgical 180,000
Hamer Somerset, PA Surface / HWM Cambria/Shade Metallurgical 125,000
Schrock Run Somerset, PA Surface / HWM Cambria/Shade Metallurgical 50,000
A-Seam (Permitted, Undeveloped) Somerset, PA Underground Cambria/Shade Metallurgical 0
Keyser (Permit in process) Somerset, PA Underground Cambria/Shade Metallurgical 0
Horning (Permitted, Idled) Somerset, PA Underground Cambria/Shade Metallurgical 0
Total Estimated Met Coal Production - NAPP Division 1,065,000 $65 - $70
Additional Corsa Metallurgical Sales Volumes
Source Location Preparation Plant Coal Quality 2017E Volume Cash Cost/Ton
Local Purchased Coal Pennsylvania, Maryland Cambria/Shade Metallurgical 260,000
CAPP Division Met Coal Sales Tennessee, Kentucky Kopper Glo Metallurgical 150,000
Total Estimated Met Coal Sales Volumes 1,475,000 $80 - $85
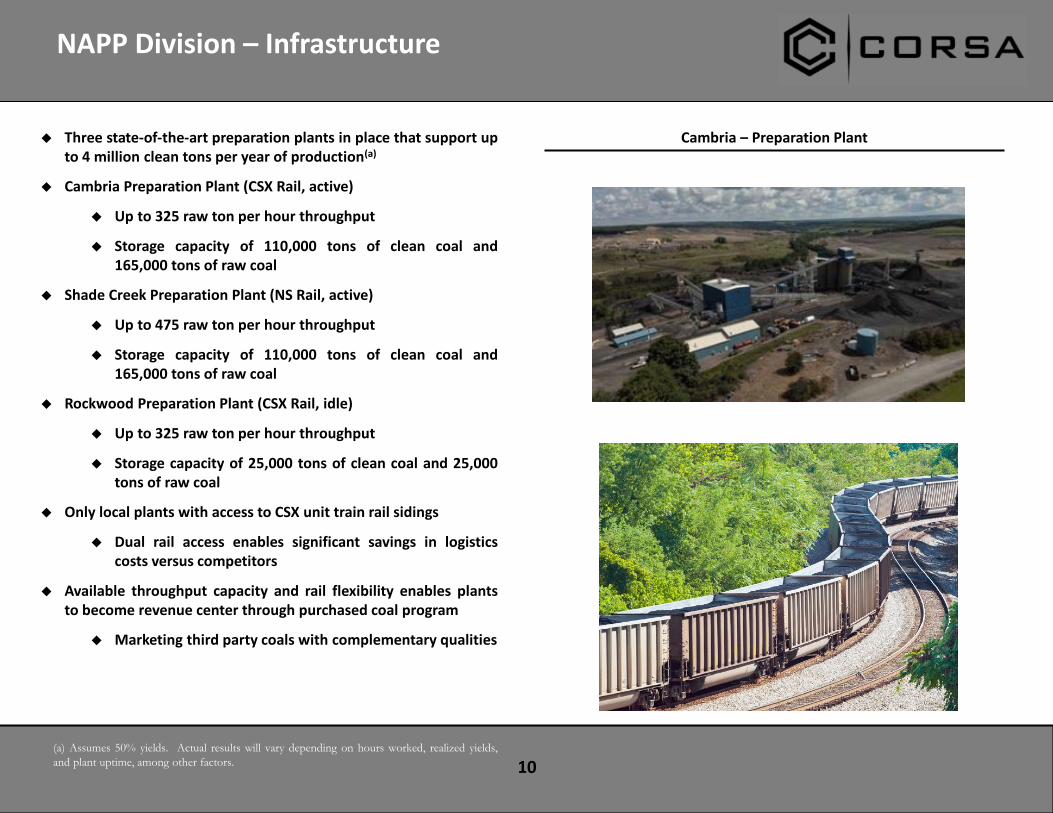
NAPP Division – Infrastructure
10
Three state-of-the-art preparation plants in place that support upto 4 million clean tons per year of production(a)
Cambria Preparation Plant (CSX Rail, active)
Up to 325 raw ton per hour throughput
Storage capacity of 110,000 tons of clean coal and165,000 tons of raw coal
Shade Creek Preparation Plant (NS Rail, active)
Up to 475 raw ton per hour throughput
Storage capacity of 110,000 tons of clean coal and165,000 tons of raw coal
Rockwood Preparation Plant (CSX Rail, idle)
Up to 325 raw ton per hour throughput
Storage capacity of 25,000 tons of clean coal and 25,000tons of raw coal
Only local plants with access to CSX unit train rail sidings
Dual rail access enables significant savings in logisticscosts versus competitors
Available throughput capacity and rail flexibility enables plantsto become revenue center through purchased coal program
Marketing third party coals with complementary qualities
(a) Assumes 50% yields. Actual results will vary depending on hours worked, realized yields,
and plant uptime, among other factors.
Cambria – Preparation Plant
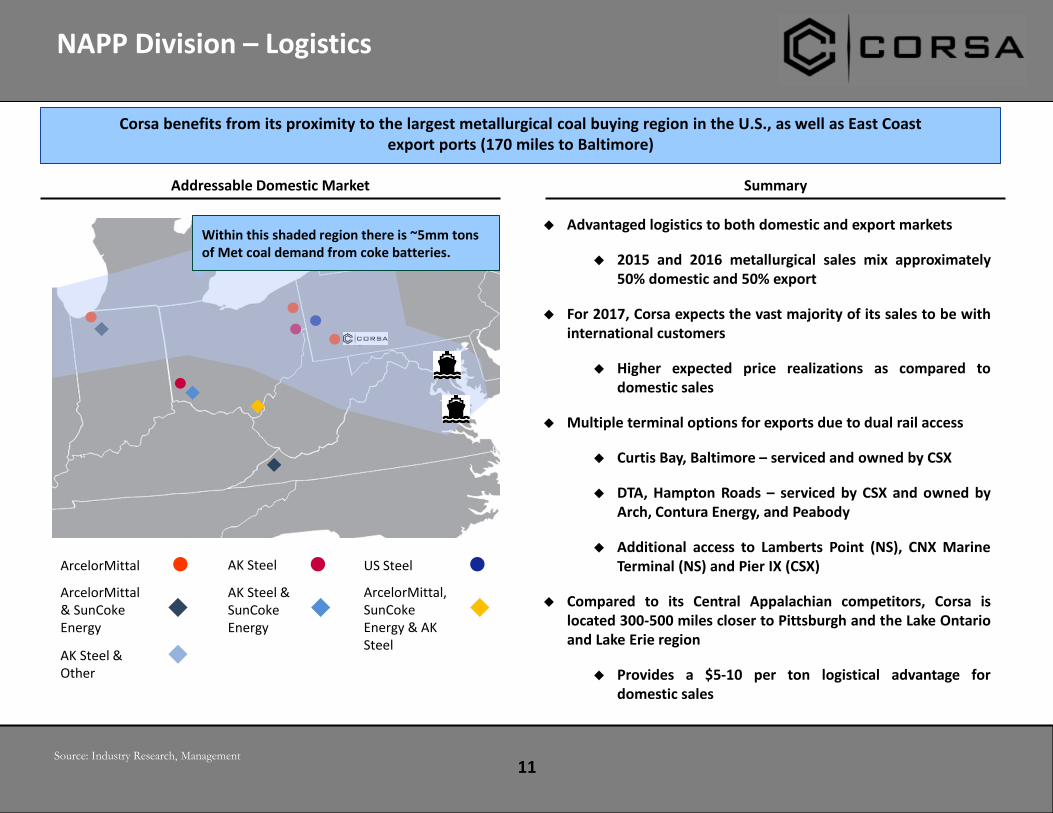
NAPP Division – Logistics
11
Summary
Corsa benefits from its proximity to the largest metallurgical coal buying region in the U.S., as well as East Coast export ports (170 miles to Baltimore)
Advantaged logistics to both domestic and export markets
2015 and 2016 metallurgical sales mix approximately50% domestic and 50% export
For 2017, Corsa expects the vast majority of its sales to be withinternational customers
Higher expected price realizations as compared todomestic sales
Multiple terminal options for exports due to dual rail access
Curtis Bay, Baltimore – serviced and owned by CSX
DTA, Hampton Roads – serviced by CSX and owned byArch, Contura Energy, and Peabody
Additional access to Lamberts Point (NS), CNX MarineTerminal (NS) and Pier IX (CSX)
Compared to its Central Appalachian competitors, Corsa islocated 300-500 miles closer to Pittsburgh and the Lake Ontarioand Lake Erie region
Provides a $5-10 per ton logistical advantage fordomestic sales
Source: Industry Research, Management
Addressable Domestic Market
ArcelorMittal US SteelAK Steel
ArcelorMittal & SunCoke Energy
ArcelorMittal, SunCoke Energy & AK Steel
AK Steel & SunCoke Energy
AK Steel & Other
Within this shaded region there is ~5mm tons of Met coal demand from coke batteries.
Sales & Trading Platform
12
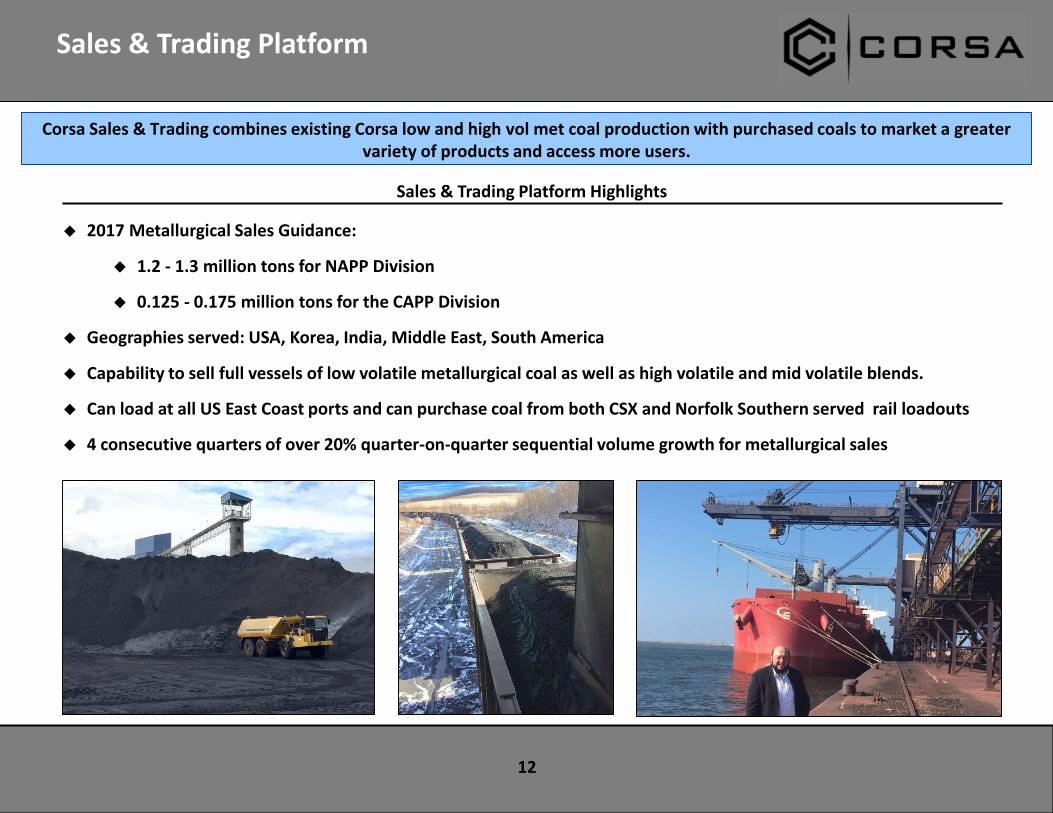
Sales & Trading Platform Highlights
2017 Metallurgical Sales Guidance:
1.2 - 1.3 million tons for NAPP Division
0.125 - 0.175 million tons for the CAPP Division
Geographies served: USA, Korea, India, Middle East, South America
Capability to sell full vessels of low volatile metallurgical coal as well as high volatile and mid volatile blends.
Can load at all US East Coast ports and can purchase coal from both CSX and Norfolk Southern served rail loadouts
4 consecutive quarters of over 20% quarter-on-quarter sequential volume growth for metallurgical sales
Corsa Sales & Trading combines existing Corsa low and high vol met coal production with purchased coals to market a greater variety of products and access more users.
Corsa Sales & Trading
13
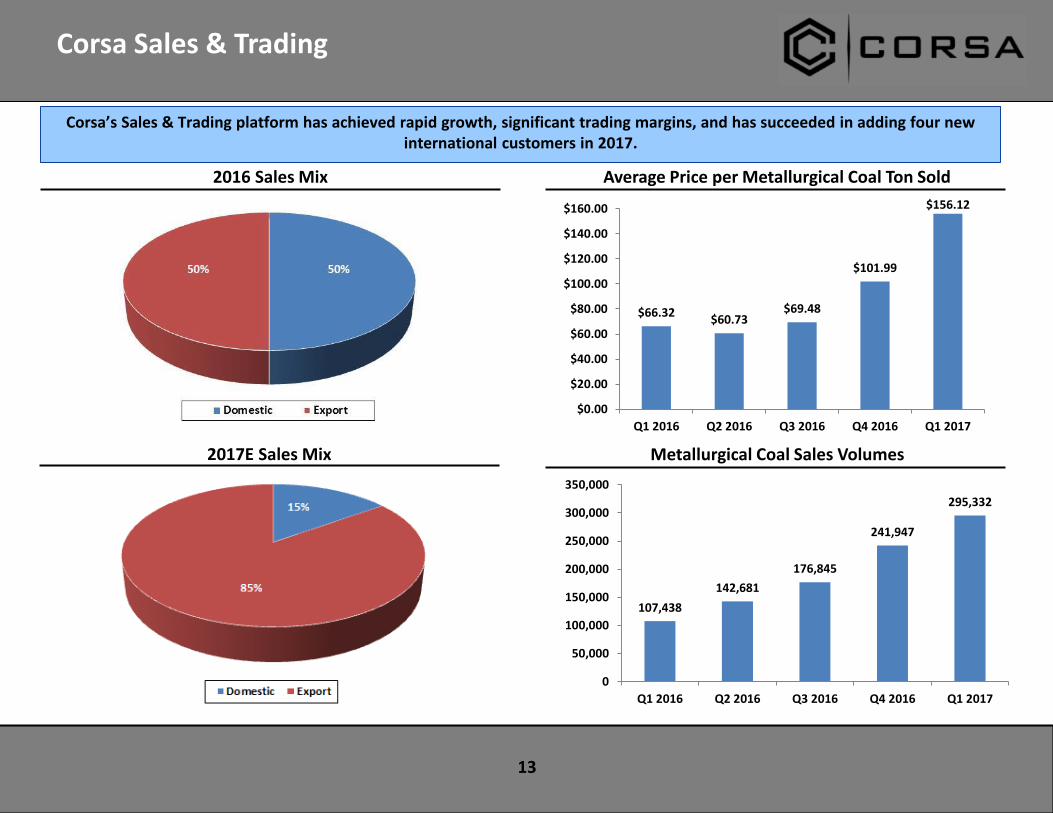
Average Price per Metallurgical Coal Ton Sold2016 Sales Mix
2017E Sales Mix Metallurgical Coal Sales Volumes
Corsa’s Sales & Trading platform has achieved rapid growth, significant trading margins, and has succeeded in adding four newinternational customers in 2017.
107,438
142,681
176,845
241,947
295,332
0
50,000
100,000
150,000
200,000
250,000
300,000
350,000
Q1 2016 Q2 2016 Q3 2016 Q4 2016 Q1 2017
$66.32$60.73
$69.48
$101.99
$156.12
$0.00
$20.00
$40.00
$60.00
$80.00
$100.00
$120.00
$140.00
$160.00
Q1 2016 Q2 2016 Q3 2016 Q4 2016 Q1 2017
Four-Part Growth Strategy
14
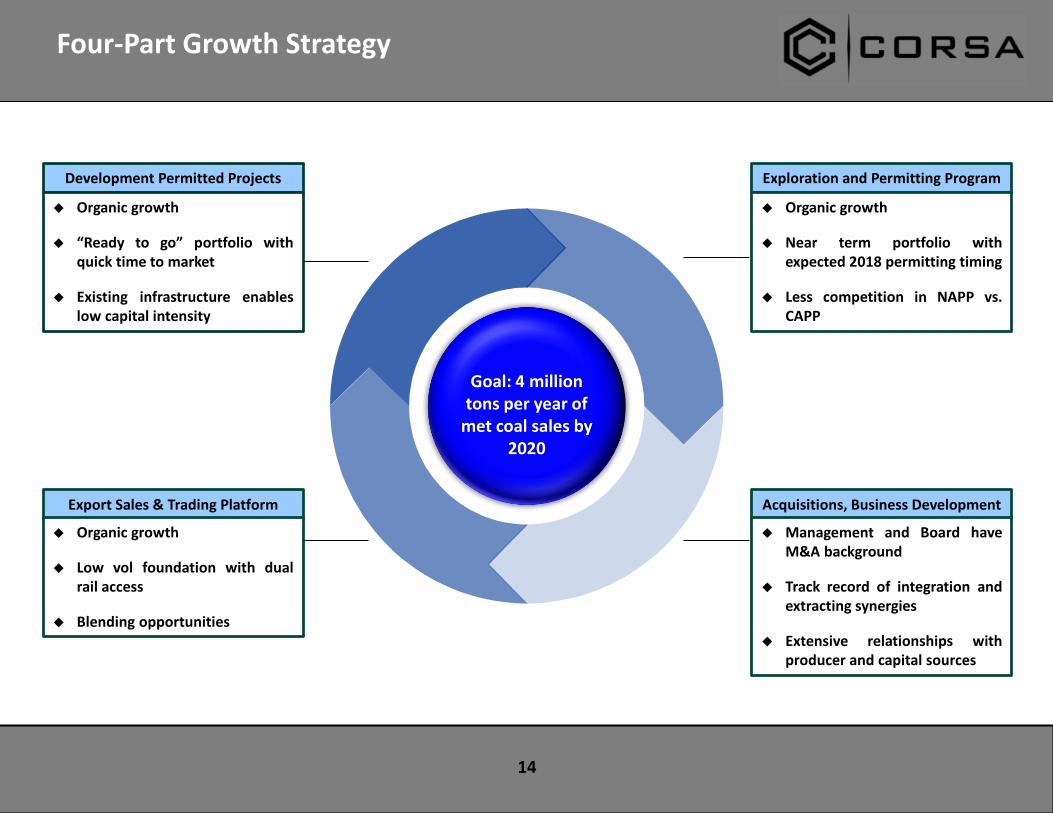
Goal: 4 million tons per year of
met coal sales by 2020
Development Permitted Projects
Organic growth
“Ready to go” portfolio withquick time to market
Existing infrastructure enableslow capital intensity
Exploration and Permitting Program
Organic growth
Near term portfolio withexpected 2018 permitting timing
Less competition in NAPP vs.CAPP
Export Sales & Trading Platform
Organic growth
Low vol foundation with dualrail access
Blending opportunities
Acquisitions, Business Development
Management and Board haveM&A background
Track record of integration andextracting synergies
Extensive relationships withproducer and capital sources
15(1) Production and sales are contingent upon future market conditions.
NAPP Division Organic Growth Forecast
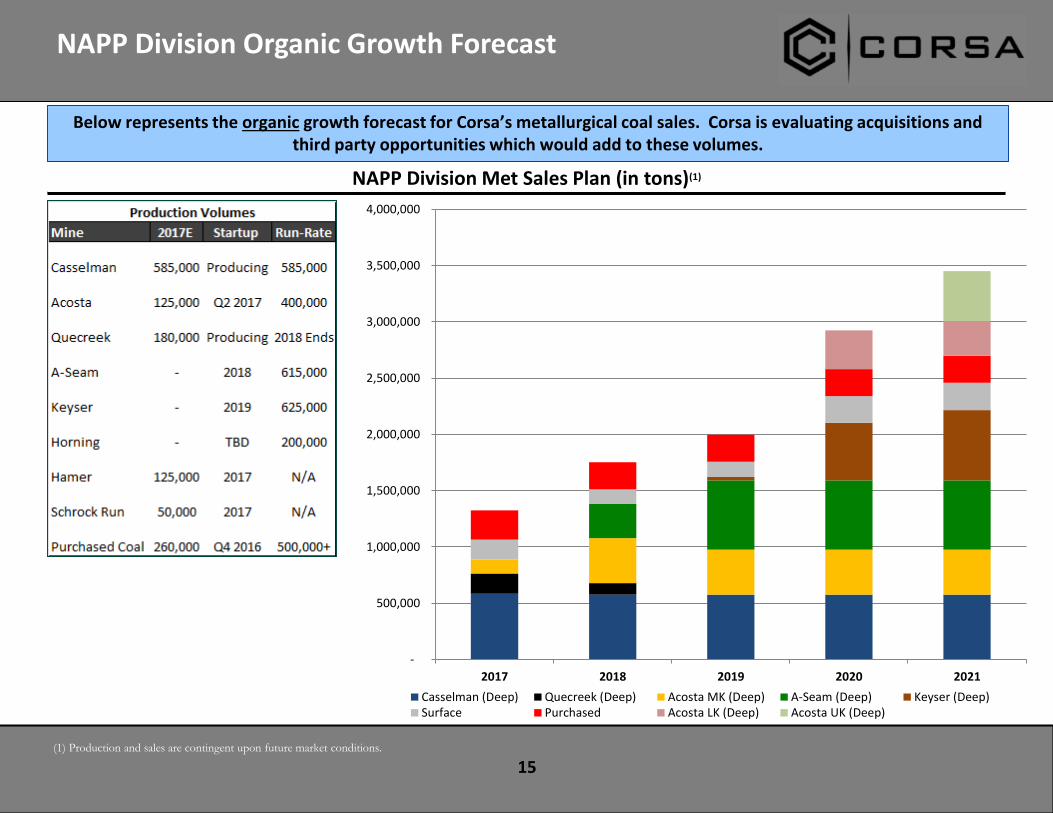
NAPP Division Met Sales Plan (in tons)(1)
-
500,000
1,000,000
1,500,000
2,000,000
2,500,000
3,000,000
3,500,000
4,000,000
2017 2018 2019 2020 2021
Casselman (Deep) Quecreek (Deep) Acosta MK (Deep) A-Seam (Deep) Keyser (Deep)Surface Purchased Acosta LK (Deep) Acosta UK (Deep)
Below represents the organic growth forecast for Corsa’s metallurgical coal sales. Corsa is evaluating acquisitions and third party opportunities which would add to these volumes.
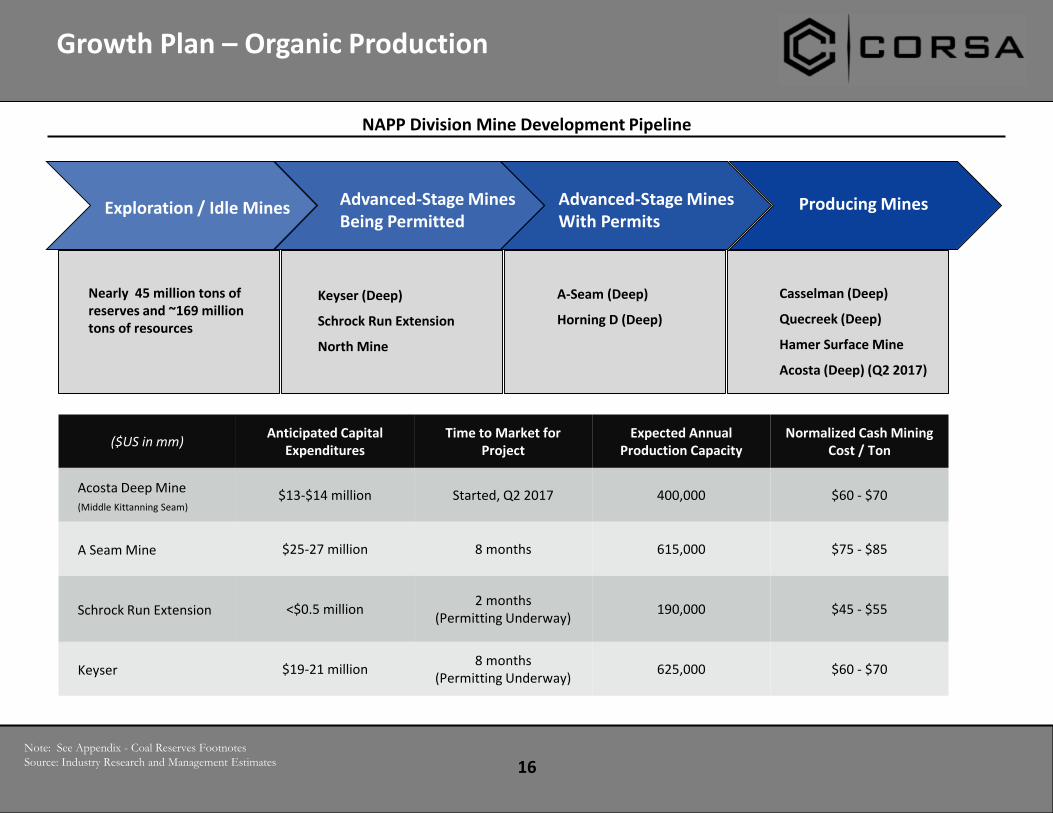
16
Producing MinesAdvanced-Stage Mines With Permits
Casselman (Deep)
Quecreek (Deep)
Hamer Surface Mine
Acosta (Deep) (Q2 2017)
A-Seam (Deep)
Horning D (Deep)
Keyser (Deep)
Schrock Run Extension
North Mine
Advanced-Stage Mines Being Permitted
NAPP Division Mine Development Pipeline
Exploration / Idle Mines
Nearly 45 million tons of reserves and ~169 million tons of resources
($US in mm)Anticipated Capital
ExpendituresTime to Market for
ProjectExpected Annual
Production CapacityNormalized Cash Mining
Cost / Ton
Acosta Deep Mine(Middle Kittanning Seam)
$13-$14 million Started, Q2 2017 400,000 $60 - $70
A Seam Mine $25-27 million 8 months 615,000 $75 - $85
Schrock Run Extension <$0.5 million2 months
(Permitting Underway)190,000 $45 - $55
Keyser $19-21 million8 months
(Permitting Underway)625,000 $60 - $70
Note: See Appendix - Coal Reserves Footnotes
Source: Industry Research and Management Estimates
Growth Plan – Organic Production
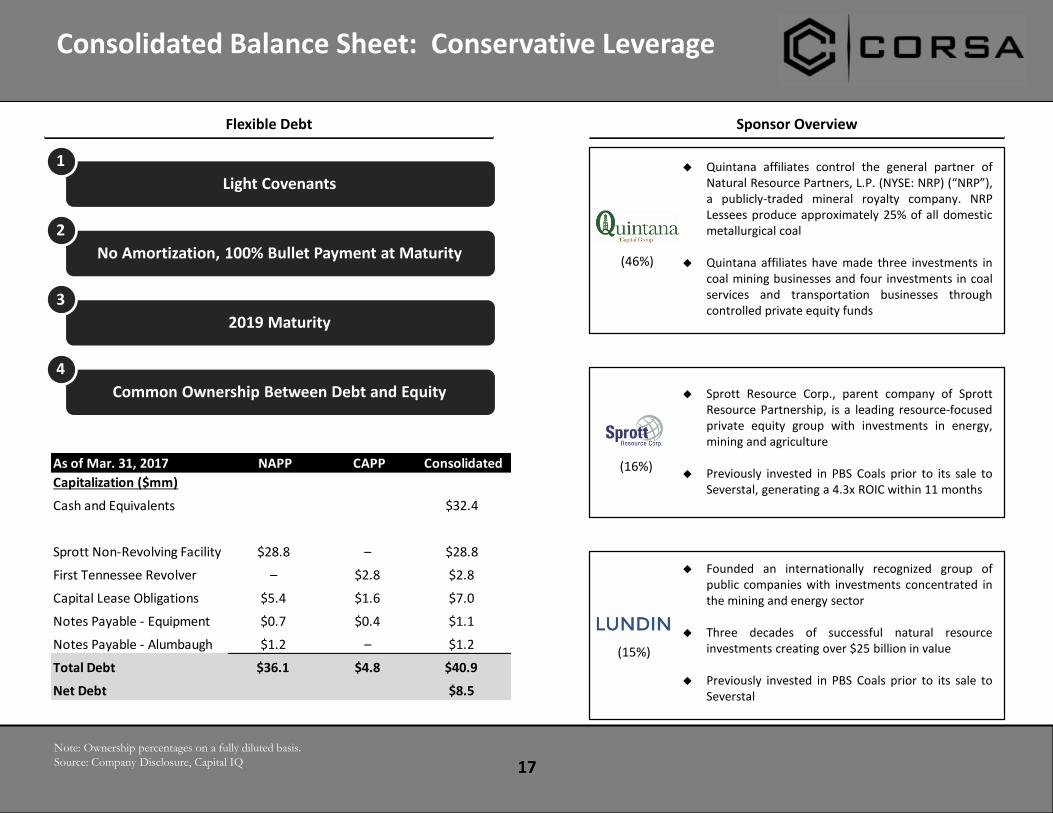
Consolidated Balance Sheet: Conservative Leverage
17Note: Ownership percentages on a fully diluted basis.
Source: Company Disclosure, Capital IQ
Light Covenants
1
No Amortization, 100% Bullet Payment at Maturity
2
2019 Maturity
3
Common Ownership Between Debt and Equity
4
Sponsor OverviewFlexible Debt
Quintana affiliates control the general partner ofNatural Resource Partners, L.P. (NYSE: NRP) (“NRP”),a publicly-traded mineral royalty company. NRPLessees produce approximately 25% of all domesticmetallurgical coal
Quintana affiliates have made three investments incoal mining businesses and four investments in coalservices and transportation businesses throughcontrolled private equity funds
(46%)
Sprott Resource Corp., parent company of SprottResource Partnership, is a leading resource-focusedprivate equity group with investments in energy,mining and agriculture
Previously invested in PBS Coals prior to its sale toSeverstal, generating a 4.3x ROIC within 11 months
(16%)
Founded an internationally recognized group ofpublic companies with investments concentrated inthe mining and energy sector
Three decades of successful natural resourceinvestments creating over $25 billion in value
Previously invested in PBS Coals prior to its sale toSeverstal
(15%)
As of Mar. 31, 2017 NAPP CAPP Consolidated
Capitalization ($mm)
Cash and Equivalents $32.4
Sprott Non-Revolving Facility $28.8 – $28.8
First Tennessee Revolver – $2.8 $2.8
Capital Lease Obligations $5.4 $1.6 $7.0
Notes Payable - Equipment $0.7 $0.4 $1.1
Notes Payable - Alumbaugh $1.2 – $1.2
Total Debt $36.1 $4.8 $40.9
Net Debt $8.5
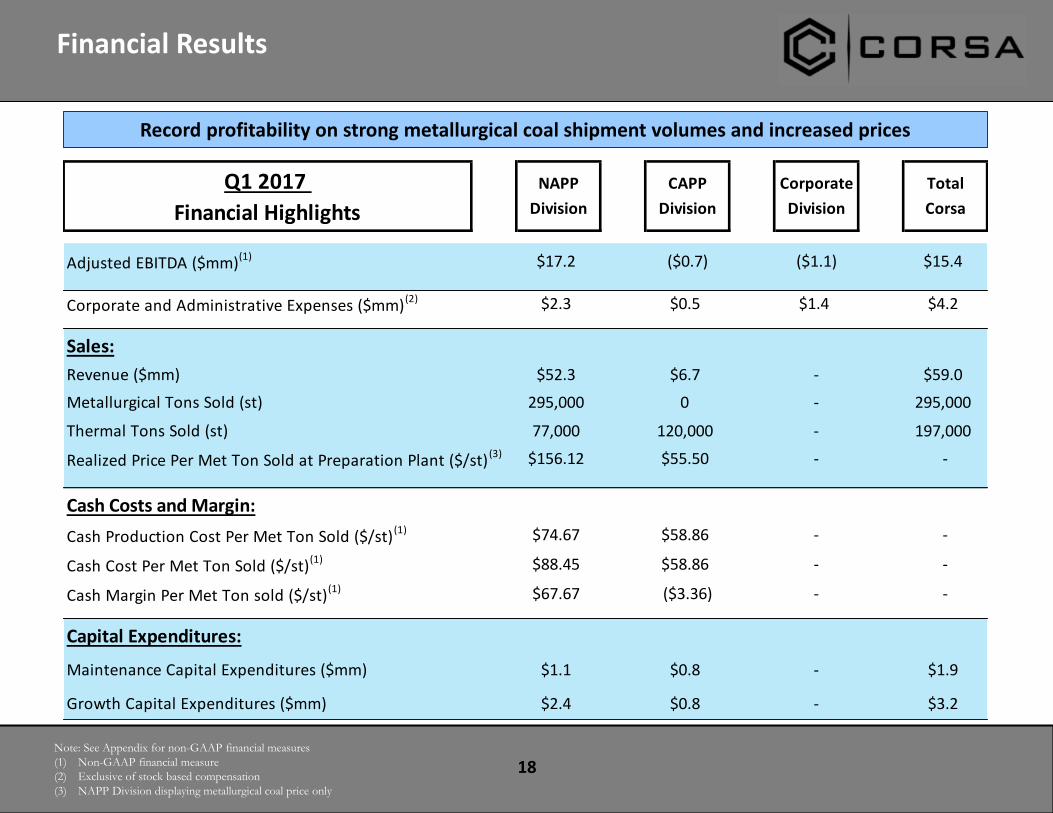
Financial Results
18Note: See Appendix for non-GAAP financial measures
(1) Non-GAAP financial measure
(2) Exclusive of stock based compensation
(3) NAPP Division displaying metallurgical coal price only
Q1 2017 NAPP CAPP Corporate Total
Financial Highlights Division Division Division Corsa
Adjusted EBITDA ($mm)(1) $17.2 ($0.7) ($1.1) $15.4
Corporate and Administrative Expenses ($mm)(2) $2.3 $0.5 $1.4 $4.2
Sales:
Revenue ($mm) $52.3 $6.7 - $59.0
Metallurgical Tons Sold (st) 295,000 0 - 295,000
Thermal Tons Sold (st) 77,000 120,000 - 197,000
Realized Price Per Met Ton Sold at Preparation Plant ($/st) (3) $156.12 $55.50 - -
Cash Costs and Margin:
Cash Production Cost Per Met Ton Sold ($/st)(1) $74.67 $58.86 - -
Cash Cost Per Met Ton Sold ($/st)(1) $88.45 $58.86 - -
Cash Margin Per Met Ton sold ($/st)(1) $67.67 ($3.36) - -
Capital Expenditures:
Maintenance Capital Expenditures ($mm) $1.1 $0.8 - $1.9
Growth Capital Expenditures ($mm) $2.4 $0.8 - $3.2
Record profitability on strong metallurgical coal shipment volumes and increased prices
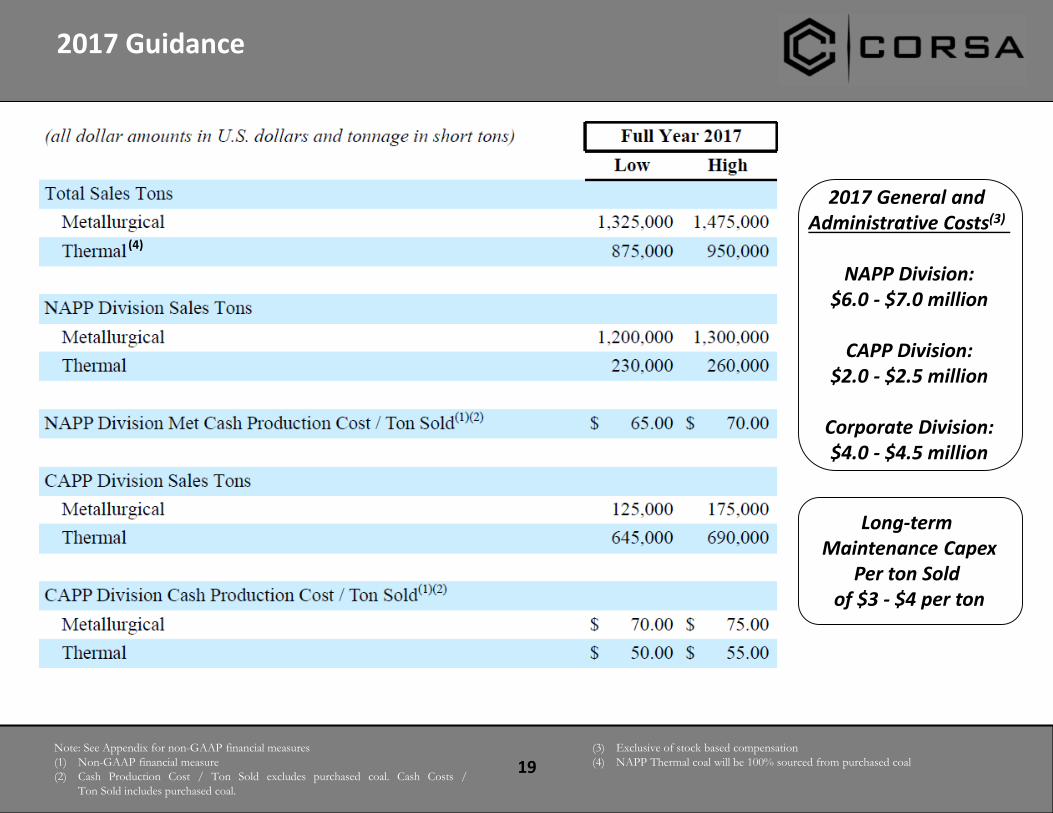
2017 Guidance
19Note: See Appendix for non-GAAP financial measures
(1) Non-GAAP financial measure
(2) Cash Production Cost / Ton Sold excludes purchased coal. Cash Costs /
Ton Sold includes purchased coal.
(3) Exclusive of stock based compensation
(4) NAPP Thermal coal will be 100% sourced from purchased coal
Long-term Maintenance Capex
Per ton Sold of $3 - $4 per ton
2017 General and Administrative Costs(3)
NAPP Division:$6.0 - $7.0 million
CAPP Division:$2.0 - $2.5 million
Corporate Division:$4.0 - $4.5 million
(4)
($15,000)
($5,000)
$5,000
$15,000
$25,000
$35,000
$45,000
$55,000
$65,000
$75,000
2012SVS PBS
2013SVS PBS
2014SVS PBS
2015CSO NAPP
2016CSO NAPP
2017 Q1Annualized
NA
PP
Seg
men
t EB
ITD
A (
$ in
00
0's
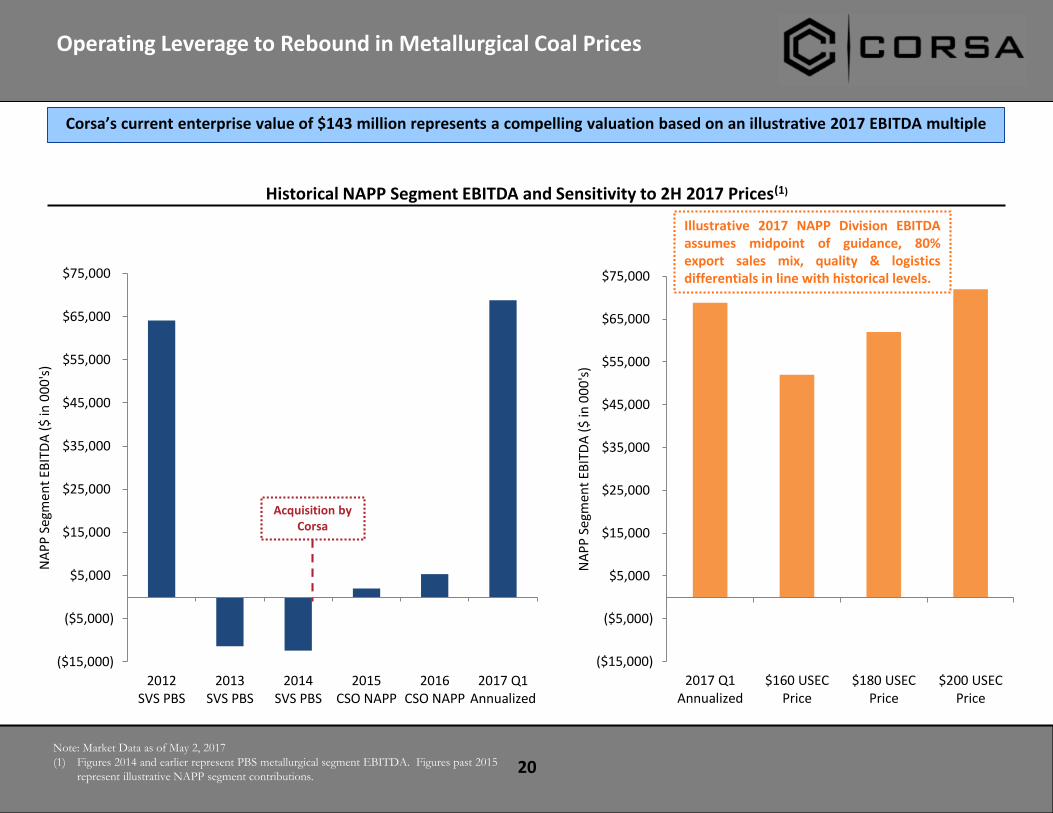
)Operating Leverage to Rebound in Metallurgical Coal Prices
20
Historical NAPP Segment EBITDA and Sensitivity to 2H 2017 Prices(1)
Note: Market Data as of May 2, 2017
(1) Figures 2014 and earlier represent PBS metallurgical segment EBITDA. Figures past 2015
represent illustrative NAPP segment contributions.
Acquisition by Corsa
Illustrative 2017 NAPP Division EBITDAassumes midpoint of guidance, 80%export sales mix, quality & logisticsdifferentials in line with historical levels.
Corsa’s current enterprise value of $143 million represents a compelling valuation based on an illustrative 2017 EBITDA multiple
($15,000)
($5,000)
$5,000
$15,000
$25,000
$35,000
$45,000
$55,000
$65,000
$75,000
2017 Q1Annualized
$160 USECPrice
$180 USECPrice
$200 USECPrice
NA
PP
Seg
men
t EB
ITD
A (
$ in
00
0's
)
Appendix – Coal Reserves Footnotes
21
(A) The mineral reserve and resource estimates relating to NAPP Division properties, which are effective as of December 31, 2016, have been prepared by Marshall Miller& Associates, Inc. (“MM&A”) under the supervision of Justin S. Douthat, P.E., M.B.A., Michael G. McClure, C.P.G., Kirt Suehs, C.P.G., and Gerard J. Enigk, P.E. each aqualified person, as such term is defined in National Instrument 43-101 – Standards of Disclosure for Mineral Projects (“NI 43-101”). MM&A is independent of Corsaand its subsidiaries. For a complete description of the mines and projects relating to the NAPP Division Properties, see the report prepared pursuant to NI 43-101 byMM&A under Corsa’s profile at www.sedar.com entitled “Technical Report on the Coal Resource and Coal Reserve Controlled by Corsa Coal Corp., Pennsylvania, USA -Prepared in Accordance with National Instrument 43-101 Standards for Disclosure for Mineral Projects Effective December 31, 2016.”
(B) Reserves are clean recoverable tons.
(C) Resources are in-place tons inclusive of proven and probable reserves.
(D) The mineral reserve and resource estimates relating to the Kopper Glo properties of the CAPP Division, which are effective as of December 31, 2016, have beenprepared by Marshall Miller & Associates, Inc. (“MM&A”) under the supervision of Justin S. Douthat, P.E., M.B.A. and John W. Eckman, C.P.G., each a qualified person,as such term is defined in NI 43-101 – Standards of Disclosure for Mineral Projects (“NI 43-101”). MM&A is independent of Corsa and its subsidiaries. For a completedescription of the mines and projects relating to the Kopper Glo Properties, see the report prepared pursuant to NI 43-101 by MM&A under Corsa’s profile atwww.sedar.com entitled “Technical Report on the Coal Reserve and Coal Resource Controlled by Kopper Glo Mining, LLC, Tennessee, USA - Prepared in Accordancewith National Instrument 43-101 Standards for Disclosure for Mineral Projects Effective December 31, 2016.”
Cautionary Statement Regarding Estimates of Mineral ReservesThis presentation sets forth certain estimates of “reserves” and “resources”. While Corsa believes that the estimates were based on methodologies acceptable in Canadapursuant to NI 43-101 such estimates are not compliant with the United States Securities and Exchange Commission (“SEC”) Industry Guide 7 as discussed below.NI 43-101 is a rule developed by the Canadian Securities Administrators that establishes standards for all public disclosure an issuer makes in Canada of scientific andtechnical information concerning mineral projects. Of note to U.S. investors, these standards differ significantly from the requirements of the SEC (including under itsIndustry Guide 7).
Under U.S. standards, mineralization may not be classified as a “reserve” unless the determination has been made that the mineralization could be economically andlegally produced or extracted at the time the reserve determination is made. U.S. investors are cautioned not to assume that all or any part of historical estimates of“reserves” in this Presentation will ever be converted into reserves, or if converted, what actual poundage and grade they may have. Accordingly, information concerningdescriptions or mineralization, “resources” and “reserves” contained in this presentation are not comparable to information made public by U.S. companies subject to thereporting and disclosure requirements of the SEC.
Appendix – Non-GAAP Financial Measures
22
This presentation reports certain financial measures, not recognized under International Financial Reporting Standards (“IFRS” or “GAAP”), as used by management and readers of this presentation to evaluate the historical performance of Corsa. Since certain non-GAAP financial measures may not have a standardized meaning and may not be comparable to similar measures presented by other companies, the non-GAAP financial measures are clearly defined, quantified and reconciled with their nearest GAAP measure in Management’s Discussion and Analysis dated March 31, 2107.
Certain financial measures referred to in this presentation, namely EBITDA (earnings before deductions for interest, taxes, depreciation and amortization); Adjusted EBITDA (EBITDA adjusted for change in estimate of reclamation provisions for non-operating properties, impairment and write-off of mineral properties and advance royalties, gain (loss) on sale of assets and other costs, stock-based compensation, non-cash finance expenses and other non-cash adjustments); realized price per ton sold (net coal sales divided by tons of coal sold); cash production cost per ton sold (cash production costs of sales divided by tons of coal sold), cash cost per ton sold (cash production costs of sales including purchased coal costs divided by tons of coal sold) and cash margin per ton sold (difference between realized price per ton sold and cash cost per ton sold), are not measures recognized by GAAP.
Management uses EBITDA; Adjusted EBITDA; realized price per ton sold, cash production cost per ton sold, cash cost per ton sold and cash margin per ton sold as internal measurements of operating performance for Corsa’s mining and processing operations. Management believes these non-GAAP measures provide useful information for investors as they provide information in addition to the GAAP measures to assist in their evaluation of the operating performance of Corsa.
Appendix – Coal Reserve Quality
23
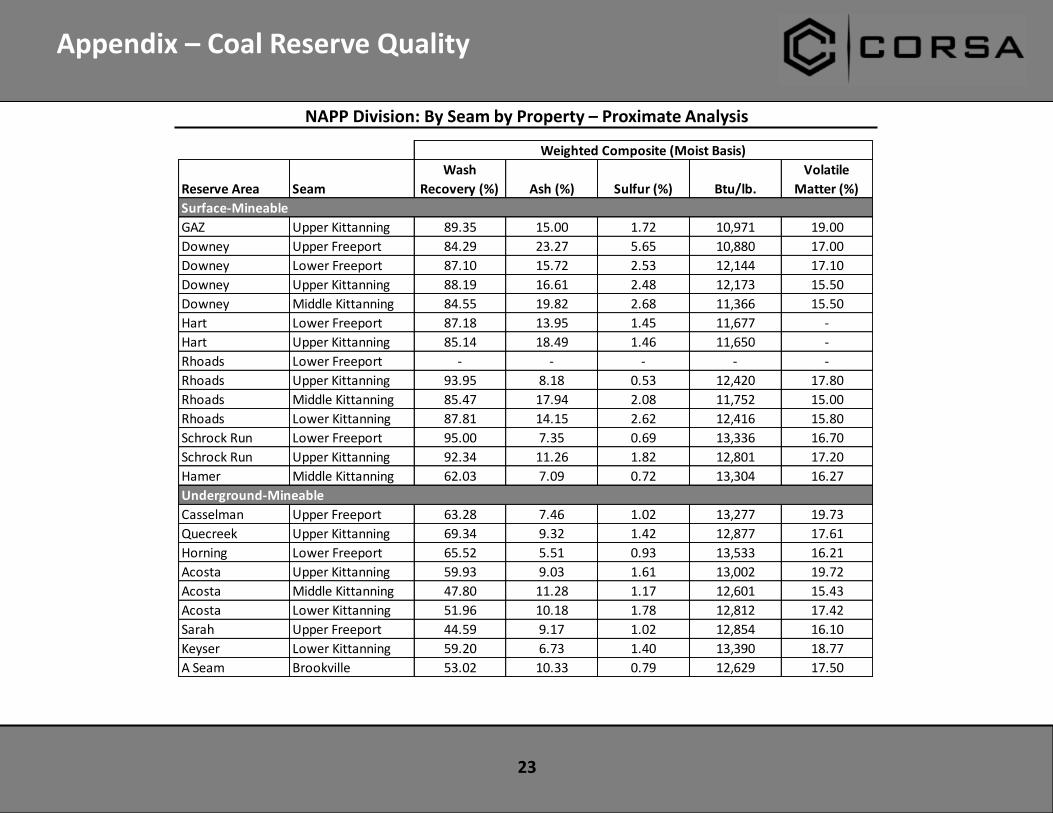
NAPP Division: By Seam by Property – Proximate Analysis
Weighted Composite (Moist Basis)
Reserve Area Seam
Wash
Recovery (%) Ash (%) Sulfur (%) Btu/lb.
Volatile
Matter (%)
Surface-Mineable
GAZ Upper Kittanning 89.35 15.00 1.72 10,971 19.00
Downey Upper Freeport 84.29 23.27 5.65 10,880 17.00
Downey Lower Freeport 87.10 15.72 2.53 12,144 17.10
Downey Upper Kittanning 88.19 16.61 2.48 12,173 15.50
Downey Middle Kittanning 84.55 19.82 2.68 11,366 15.50
Hart Lower Freeport 87.18 13.95 1.45 11,677 -
Hart Upper Kittanning 85.14 18.49 1.46 11,650 -
Rhoads Lower Freeport - - - - -
Rhoads Upper Kittanning 93.95 8.18 0.53 12,420 17.80
Rhoads Middle Kittanning 85.47 17.94 2.08 11,752 15.00
Rhoads Lower Kittanning 87.81 14.15 2.62 12,416 15.80
Schrock Run Lower Freeport 95.00 7.35 0.69 13,336 16.70
Schrock Run Upper Kittanning 92.34 11.26 1.82 12,801 17.20
Hamer Middle Kittanning 62.03 7.09 0.72 13,304 16.27
Underground-Mineable
Casselman Upper Freeport 63.28 7.46 1.02 13,277 19.73
Quecreek Upper Kittanning 69.34 9.32 1.42 12,877 17.61
Horning Lower Freeport 65.52 5.51 0.93 13,533 16.21
Acosta Upper Kittanning 59.93 9.03 1.61 13,002 19.72
Acosta Middle Kittanning 47.80 11.28 1.17 12,601 15.43
Acosta Lower Kittanning 51.96 10.18 1.78 12,812 17.42
Sarah Upper Freeport 44.59 9.17 1.02 12,854 16.10
Keyser Lower Kittanning 59.20 6.73 1.40 13,390 18.77
A Seam Brookville 53.02 10.33 0.79 12,629 17.50
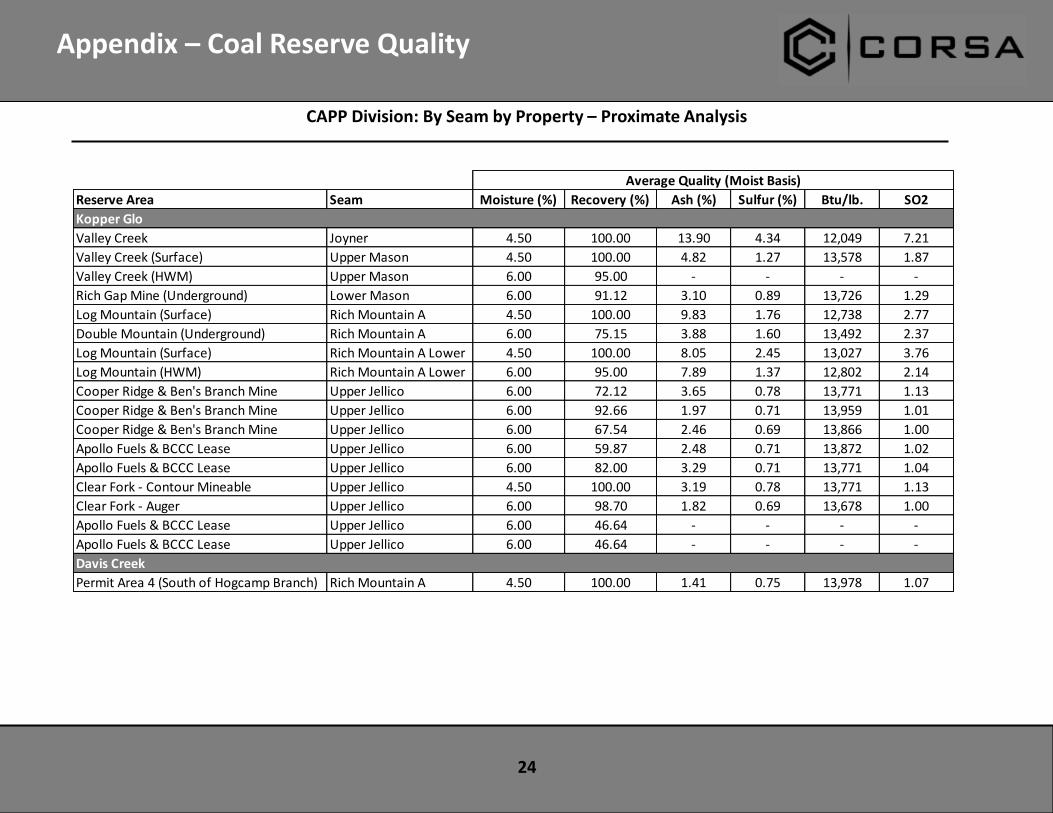
Appendix – Coal Reserve Quality
24
CAPP Division: By Seam by Property – Proximate Analysis
Average Quality (Moist Basis)
Reserve Area Seam Moisture (%) Recovery (%) Ash (%) Sulfur (%) Btu/lb. SO2
Kopper Glo
Valley Creek Joyner 4.50 100.00 13.90 4.34 12,049 7.21
Valley Creek (Surface) Upper Mason 4.50 100.00 4.82 1.27 13,578 1.87
Valley Creek (HWM) Upper Mason 6.00 95.00 - - - -
Rich Gap Mine (Underground) Lower Mason 6.00 91.12 3.10 0.89 13,726 1.29
Log Mountain (Surface) Rich Mountain A 4.50 100.00 9.83 1.76 12,738 2.77
Double Mountain (Underground) Rich Mountain A 6.00 75.15 3.88 1.60 13,492 2.37
Log Mountain (Surface) Rich Mountain A Lower 4.50 100.00 8.05 2.45 13,027 3.76
Log Mountain (HWM) Rich Mountain A Lower 6.00 95.00 7.89 1.37 12,802 2.14
Cooper Ridge & Ben's Branch Mine Upper Jellico 6.00 72.12 3.65 0.78 13,771 1.13
Cooper Ridge & Ben's Branch Mine Upper Jellico 6.00 92.66 1.97 0.71 13,959 1.01
Cooper Ridge & Ben's Branch Mine Upper Jellico 6.00 67.54 2.46 0.69 13,866 1.00
Apollo Fuels & BCCC Lease Upper Jellico 6.00 59.87 2.48 0.71 13,872 1.02
Apollo Fuels & BCCC Lease Upper Jellico 6.00 82.00 3.29 0.71 13,771 1.04
Clear Fork - Contour Mineable Upper Jellico 4.50 100.00 3.19 0.78 13,771 1.13
Clear Fork - Auger Upper Jellico 6.00 98.70 1.82 0.69 13,678 1.00
Apollo Fuels & BCCC Lease Upper Jellico 6.00 46.64 - - - -
Apollo Fuels & BCCC Lease Upper Jellico 6.00 46.64 - - - -
Davis Creek
Permit Area 4 (South of Hogcamp Branch) Rich Mountain A 4.50 100.00 1.41 0.75 13,978 1.07