cost and time models for road haulage and intermodal...
TRANSCRIPT

IAME 2013 Conference
July 3-5 – Marseille, France
Paper ID 156
Cost and time models for road haulage and intermodal transport using Short Sea Shipping in the North Sea Region
Alba Martínez-López1
Jacob Kronbak1
Liping Jiang1
1Unit for Maritime Research, Department of Environmental and Business Economics
Niels Bohrs Vej 9, DK-6700 Esbjerg, Denmark
Southern Denmark University
Abstract
This paper is framed in the context of the EU Interreg IVB North Sea Region project Food
Port. In line with this project, this paper aims to define mathematically cost and time models
able to provide realistic information about the performances of road haulage and of
intermodal chains using Short Sea Shipping (SSS) in the North Sea Region (NSR). The
models integrate the necessary variables to establish the impact of different fleets and SSS
features on the competitiveness of intermodal chains for the movement of food related goods.
The models were applied to evaluate the opportunities for the success of intermodal chains
using the Rosyth-Zeebrugge route. The results obtained validate the utility of the models and
they suggest possible changes to the current operation of this SSS service in order to increase
the marked potential possibilities for the intermodal chains through Rosyth-Zeebrugge.
Keywords: Transportation Cost, Short Sea Shipping Transport, Ro-Ro Transport, Container
Feeder Transport, Intermodal transport.
1. Introduction
In 2011, the European Commission published a new White Paper on transport, Roadmap to a
Single European Transport Area – Towards a competitive and resource efficient transport
system (Commission of the European Communities, 2011), which will lead European
transport policy in the coming years. This policy mainly addresses a reduction of the transport
sectors use of fossil combustibles, reducing atmospheric emissions (60% in 2050), and

An integration cost model for Short Sea Shipping in the North Sea Region
ID156
IAME 2013 Conference, July 3-5– Marseille, France 2
alleviating congestion on European roads by promoting the principle that users of transport
infrastructure must pay for the cost of it. The absolute predominance of road use compared to
all other transport alternatives in Europe had already been identified as a relevant problem in
the first European White Paper on transport of 1992 (Commission of the European
Communities, 1992). Since then, first short sea shipping (SSS) and then Motorways of the
Sea (MoS) concept, which linked European ports with high frequency and efficiency, were
proposed as the most attractive solutions for intra-European transport, due to the low energy
consumption per tonne transported. Thus, the integration of these new concepts of maritime
transport in intermodal chains (road or railroad combined with maritime transport) offered
possible alternatives for ´door to door´ transport. As a result, the promotion of SSS has
become a permanent objective of European transport policy from the 1990s to today. Since
then, numerous studies and projects have been financed by the European Union (EU) and by
country members with the intention of solving the weak points of intermodality, especially by
boosting those maritime routes with the greatest possibility of success in articulating
intermodal routes against unimodal road use. Hence, remarkable efforts have been made to
identify the most promising potential corridors in which to establish short sea shipping
services: in 2003, as a consequence of the Van Miert Report, the European Commission
reviewed the extension of TEN-T (the Trans-European Transport Network) pointing to the
development of the MoS as a priority project (this should be finished before 2020). On this
occasion, four corridors were again highlighted, one of them was the Occidental European
corridor included the articulation of the North Sea region with the rest of the countries of
Atlantic Europe. In addition, in recent years, to improve the competitiveness of maritime
transport, the EU has tried to eliminate the traditional protectionism towards maritime
transport through different regulations, the most recent of which, Council Regulation (EC) No
1419/2006 (Council of the European Union, 2006), came into force in October 2008.
2. The problems and the aim
Despite all the efforts made by European Administrations, it is commonly accepted that the
current development of SSS has not been as successful as expected (EC, 2002). The reasons
are numerous but two arguments relating to the activity of intermodal transport must be noted:
the low frequency, slow speeds of the service (Paixao and Marlow, 2001; Musso and
Marchese, 2002) and lacks of efficiency of freight transitions between transportation modes
(Chlomoudis and Pallis, 2002).Aditionally, many of the studies that had analysed modal
choice concluded that this depends highly on the characteristics of the load (value added of
the freight, size of the cargo unit and the type of the loader company) and the influence of the
locality of the origins, destinations and ports (Garcia-Menendez and Feo-Valero, 2009).
Therefore, each intermodal route is characterized by a combination of operative features,
customer requirements and geographic characteristics, which provide a complex transport
service with a relative competitiveness unimodal transport (Baird A., 2004). On the other

An integration cost model for Short Sea Shipping in the North Sea Region
ID156
IAME 2013 Conference, July 3-5– Marseille, France 3
hand, the imbalance in the internalization of external costs between SSS and the road has led
to the EU transferring the responsibility for the success of intermodal transport to private
initiatives (Gese and Baird, 2010; Romana et al, 2010). Hence, those shipping companies
which are willing to deal with SSS services have to cope with the new problem of the absence
of protectionism in the sector, assume a position of initial disadvantage with regard to road
transport, and take decisions about the operative and technical characteristics of the fleet
(Woxenius, 2010), all of which influence the features of the intermodal service. This reality
can be seen in the evolution of some SSS routes in the last years. In the case of Rosyth-
Zeebrugge (between Scotland and Belgium), for instance, from 2002 to date the route has
been covered by many different kinds of fleets (two fast ferries, one fast ferry, one small fast
ferry, one ferry, two Ro-Ro vessels and one Ro-Ro vessel) which offered different conditions
of service (a daily service, four calls per week, and three calls per week). Despite this, the
competitiveness studies for multimodal transport through SSS have seldom considered as
variable elements: the features of the intermodal transport network and the technical features
of the vessels simultaneously. Thus, the aim is usually the selection or analysis of the most
suitable route for a fixed fleet (Koi Yu Ng A. 2009, Perez-Mesa et al.,2010) or the technical
adaptation of vessels to a rigid maritime route (Ametller,2007). This has already been studied
as a combined problem by other authors (Hsu and Hsieh, 2007; Martínez de Osés et al., 2011)
but without taking into account intermodal networks or different kinds of vessels,
respectively. In this context, the EU project Food Port (INTERREG IV B-North Sea Region
Programme) aims to define efficient corridors for the transport of food products among the
countries of the North Sea Region (NSR). This work attempts to provide cost and time models
for unimodal and intermodal transport in order to evaluate their relative competitiveness in
NSR. Due to the significant effects on the route competitiveness of the technical and operative
conditions of the fleet, the geographical locality of the routes and features of the cargo unit,
all these aspects were first introduced in the formulation as variables. Thus, the models are not
only useful to quickly evaluate the consequences of technical or operative modifications to the
fleet on the competitiveness of the intermodal chains but also in understanding the impact on
their competitiveness when there exists a change in the demand or in the configuration of the
initial intermodal transport network. Once the method and models have been introduced, in
order to enable understanding of their performance, models are applied to a real case of
intermodal transport in the NSR. This is carried out through an analysis of the Rosyth-
Zeebrugge maritime route, by considering both the current service and possible service
alternatives. Finally, obtained findings and future research lines are discussed.
3. The method
Although the selection of transport mode by decision-makers is dependent on many factors
(Culligane and Toy, 2000; Garcia-Menendez and Feo-Valero, 2009), two of these are core –
the time and the cost – although with different relative importance according to, among other

An integration cost model for Short Sea Shipping in the North Sea Region
ID156
IAME 2013 Conference, July 3-5– Marseille, France 4
aspects, the nature of the load (De Jong, 2000; Bergantino and Bolis, 2004). However, the
analysis of these variables in the choice of transport modes requires that the possible ´door to
door´ transport networks for both the unimodal (road) and the intermodal (Road/SSS/Road)
cases must firstly be defined (Paixao et al, 2010; Romana et al, 2010). In order to provide a
realistic comparison, the same volume per cargo unit, the same frequency needs and the same
number of nodes was assumed for the unimodal transport (road haulage) and for the
intermodal transport. A ´many to many´ transport model (Daganzo, 2005) was adopted as a
transport network (see figure1), where the network nodes were the origins (z) and destinations
(d) of the routes and the hubs were the consolidation terminals, in this case, the loading port
(m) and the unloading port (k) or vice-versa. Each maritime route (DM) along with pre- and
post-haulages by road (capillary hauls: DRb
zm DRb
kd) generated different intermodal transport
routes, the results of which in terms of the time and cost were compared with the alternative
road haulage (DRazd) for every pair of nodes. In order to simplify the study, the number of
nodes considered was limited to three for each coast and the relative probability of receiving
or delivering a cargo unit (Xz, Xd) responded to a population criteria (Koi Yu Ng, 2009) due
to the kind of the cargo considered in this case, namely food (a perishable load).
Figure 1-Transport networks
Most studies on the competitiveness of SSS suggest from a qualitative point of view that Ro-
Ro vessels are the most suitable for SSS traffic (Paixao and Marlow, 2002; Woxenius, 2010;
among others). However, some comparative studies based on quantitative methods indicate
that container vessels can be more competitive (Mbiydzenyuy et al, 2010) and able to
articulate more competitive intermodal routes than road haulage on certain routes (Koi Yu
Ng, 2009). Indeed, in the North Sea Region, SSS services are provided by feeder container
vessels (e.g. the Unifeeder shipping company), Ro-Ro vessels and Ro-Pax vessels (e.g. the
DFDS shipping company). Due to the impact on costs, it is also interesting to point out that
the average age of the fleet is eight years from acquisition (2005); however, while most of the
container vessels were purchased as new builds, the Ro-Ro and Ro-Pax vessels were often
incorporated into the fleets from the second-hand market with an initial age of five years.
Considering the above and intending to provide models able to cover all the possible
alternatives in the NSR, three kinds of fleet, TBq (TB1: feeder container vessels; TB2: Ro-Ro

An integration cost model for Short Sea Shipping in the North Sea Region
ID156
IAME 2013 Conference, July 3-5– Marseille, France 5
vessels; TB3: Ro-Pax vessels), and their respective cargo units, TEU and a 5-axle truck with
an average cargo capacity of 12.5 t (P1) and 24 t (P2) respectively, were considered. Taking
into account the high influence of loading strategies for Ro-Ro traffic on the competitiveness
of the intermodal transport service (Morales-Fusco et al, 2012), the models assumed for all
cases accompanied cargoes for trucks but without drivers (Paixao and Marlow, 2002) and the
most unfavourable situation – first in, last out – for all cargo units. Thus, in order to permit the
comparison of results in terms of costs, these were calculated in euros per transported tonne.
In addition, other variables were incorporated in the models (see Table 1) to analyse their
impact on the competitiveness and to consider additional criteria in relation to modal choice
(such as the frequency or the service Ntrips, or the necessary cargo volume per trip α). As most
of the cost and time items in the models are related to the different technical features of the
vessels, to simplify the evaluation of the different alternatives of fleets, all these
characteristics were integrated simply through the gross tonnage (GT) and the service speed
of the vessel (Vb). For this, Clarkson’s World Fleet Register database was used to obtain the
necessary relations among the technical features through regressions.
Table 1: Main variables of the models
GT Gross Tonnage DM Maritime route
(Km) α
Utilization ratio
of vessel (%) δ
Profit of
shipping
company (%)
Vb Speed of vessels
(Kn) NB
Number of
vessels Ee
Purchase age of
vessels Ntrips
Number of
stoppages/year
4. The times model
Times were measured in all cases as hours per cargo unit and trip (´door to door´). The time of
the intermodal transport (Tmt) is the sum of the time invested in the trunk haul at sea (Tm) and
the capillary hauls at land (T1, T2) of a ´many to many´ transport model (see figure 1). For
the calculation of the times consumption on all the road stretches – road haulage (TVU) and
the capillary hauls – the following assumptions were made: continuous traffic and the
application of European Directives relating to speed limiting (92/24/CE and 92/6/CE),
maximum daily driving times and minimum driving rests (Regulation CE 561/2006), and a
hypothetical ´many to many´ transport model (see figure 1):
(1)
(2)
T1 = (Xz ×
3
z=1
[𝐸 𝐸
DRbzm
9 × 𝑉3 × 0.75 +
DRbzm
𝑉3
9 × 24 +
𝐸
DRbzm
9 × 𝑉3) × 0.75 +
DRbzm
𝑉3
9 − 𝐸
𝐸 DRbzm
9 × 𝑉3 × 0.75 +
DRbzm
𝑉3
9
× 9])
T2 = (Xd ×
3
d=1
[𝐸 𝐸
DRbkd
9 × 𝑉3 × 0.75 +
DRbkd
𝑉3
9 × 24 +
𝐸
DRbkd
9 × 𝑉3) × 0.75 +
DRbkd
𝑉3
9 − 𝐸
𝐸 DRbkd
9 × 𝑉3 × 0.75 +
DRbbkd
𝑉3
9
× 9])
An integration cost model for Short Sea Shipping in the North Sea Region
ID156
IAME 2013 Conference, July 3-5– Marseille, France 6
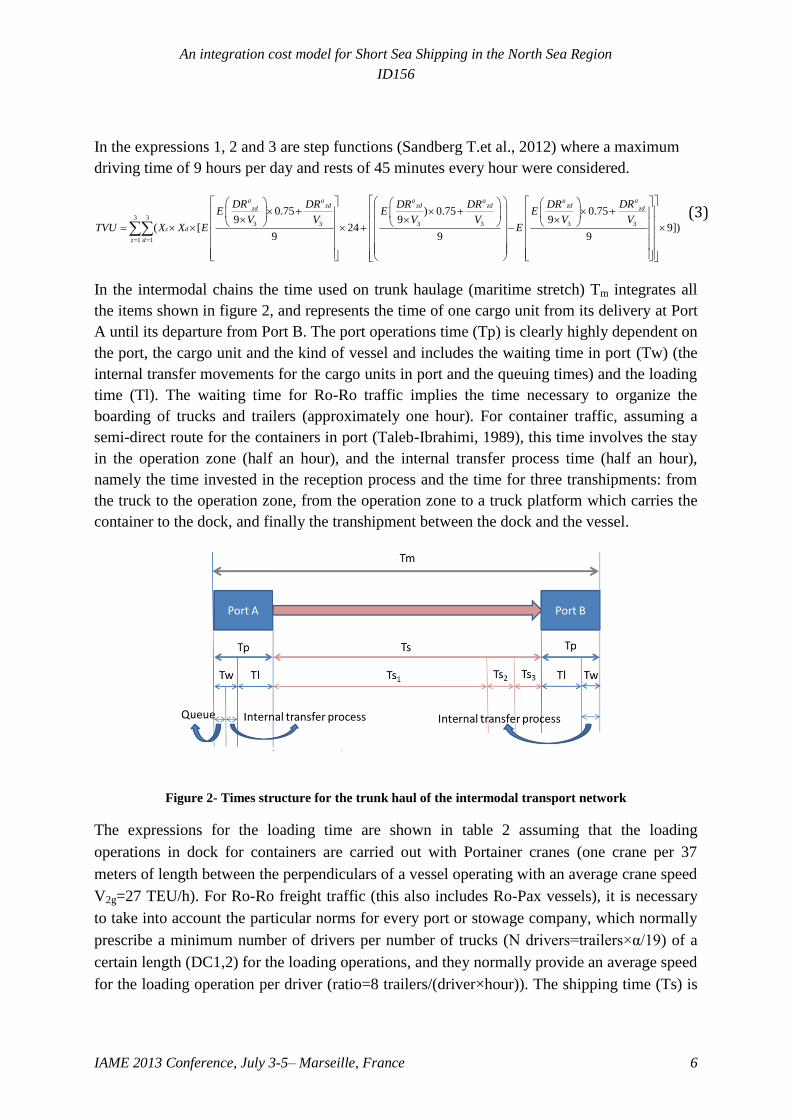
In the expressions 1, 2 and 3 are step functions (Sandberg T.et al., 2012) where a maximum
driving time of 9 hours per day and rests of 45 minutes every hour were considered.
3 33 3 3 3 3 3
1 1
0.75 ) 0.75 0.759 9 9
( [ 24 9])9 9 9
a aa a a azd zd zd zdzd zd
z d
z d
DR DRDR DR DR DRE E E
V V V V V VTVU X X E E
(3)
In the intermodal chains the time used on trunk haulage (maritime stretch) Tm integrates all
the items shown in figure 2, and represents the time of one cargo unit from its delivery at Port
A until its departure from Port B. The port operations time (Tp) is clearly highly dependent on
the port, the cargo unit and the kind of vessel and includes the waiting time in port (Tw) (the
internal transfer movements for the cargo units in port and the queuing times) and the loading
time (Tl). The waiting time for Ro-Ro traffic implies the time necessary to organize the
boarding of trucks and trailers (approximately one hour). For container traffic, assuming a
semi-direct route for the containers in port (Taleb-Ibrahimi, 1989), this time involves the stay
in the operation zone (half an hour), and the internal transfer process time (half an hour),
namely the time invested in the reception process and the time for three transhipments: from
the truck to the operation zone, from the operation zone to a truck platform which carries the
container to the dock, and finally the transhipment between the dock and the vessel.
Figure 2- Times structure for the trunk haul of the intermodal transport network
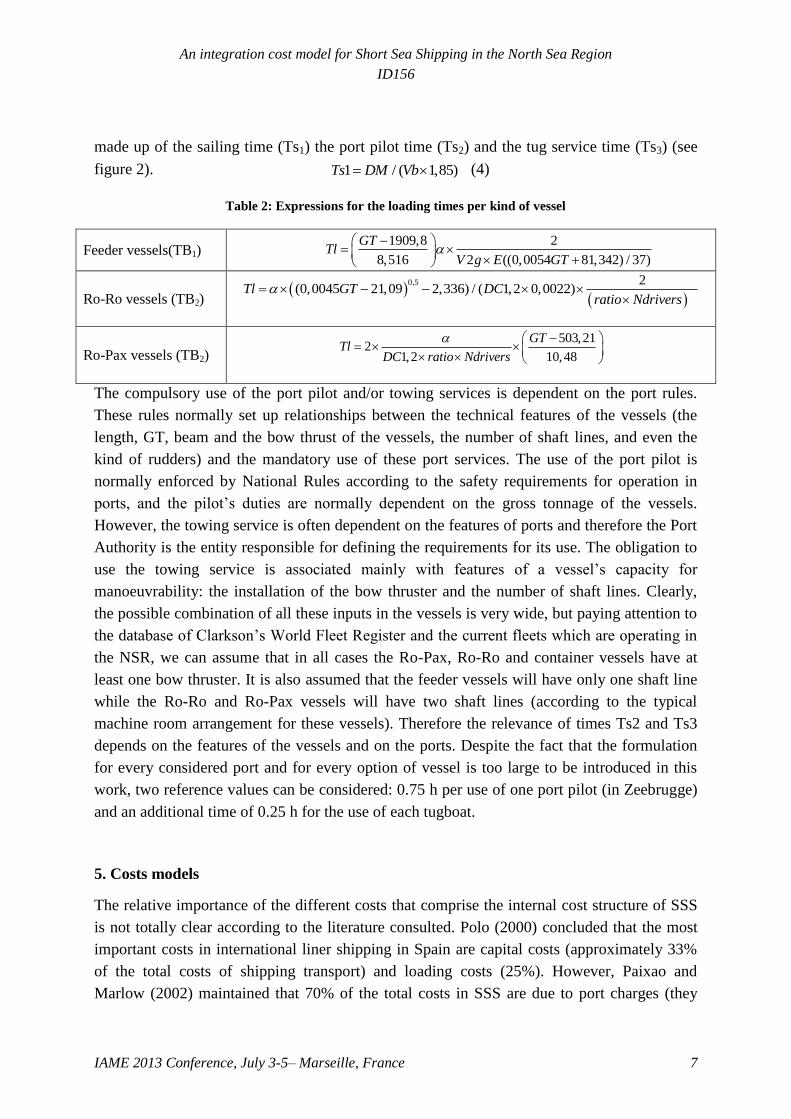
The expressions for the loading time are shown in table 2 assuming that the loading
operations in dock for containers are carried out with Portainer cranes (one crane per 37
meters of length between the perpendiculars of a vessel operating with an average crane speed
V2g=27 TEU/h). For Ro-Ro freight traffic (this also includes Ro-Pax vessels), it is necessary
to take into account the particular norms for every port or stowage company, which normally
prescribe a minimum number of drivers per number of trucks (N drivers=trailers×α/19) of a
certain length (DC1,2) for the loading operations, and they normally provide an average speed
for the loading operation per driver (ratio=8 trailers/(driver×hour)). The shipping time (Ts) is
An integration cost model for Short Sea Shipping in the North Sea Region
ID156
IAME 2013 Conference, July 3-5– Marseille, France 7
made up of the sailing time (Ts1) the port pilot time (Ts2) and the tug service time (Ts3) (see
figure 2). 1 / ( 1,85)Ts DM Vb (4)
Table 2: Expressions for the loading times per kind of vessel
Feeder vessels(TB1) 1909,8 2
8,516 2 ((0,0054 81,342) / 37)
GTTl
V g E GT
Ro-Ro vessels (TB2)
0,5 2
(0,0045 21,09 2,336) / ( 1,2 0,0022)
Tl GT DCratio Ndrivers
Ro-Pax vessels (TB2)
503,212
1,2 10,48
GTTl
DC ratio Ndrivers
The compulsory use of the port pilot and/or towing services is dependent on the port rules.
These rules normally set up relationships between the technical features of the vessels (the
length, GT, beam and the bow thrust of the vessels, the number of shaft lines, and even the
kind of rudders) and the mandatory use of these port services. The use of the port pilot is
normally enforced by National Rules according to the safety requirements for operation in
ports, and the pilot’s duties are normally dependent on the gross tonnage of the vessels.
However, the towing service is often dependent on the features of ports and therefore the Port
Authority is the entity responsible for defining the requirements for its use. The obligation to
use the towing service is associated mainly with features of a vessel’s capacity for
manoeuvrability: the installation of the bow thruster and the number of shaft lines. Clearly,
the possible combination of all these inputs in the vessels is very wide, but paying attention to
the database of Clarkson’s World Fleet Register and the current fleets which are operating in
the NSR, we can assume that in all cases the Ro-Pax, Ro-Ro and container vessels have at
least one bow thruster. It is also assumed that the feeder vessels will have only one shaft line
while the Ro-Ro and Ro-Pax vessels will have two shaft lines (according to the typical
machine room arrangement for these vessels). Therefore the relevance of times Ts2 and Ts3
depends on the features of the vessels and on the ports. Despite the fact that the formulation
for every considered port and for every option of vessel is too large to be introduced in this
work, two reference values can be considered: 0.75 h per use of one port pilot (in Zeebrugge)
and an additional time of 0.25 h for the use of each tugboat.
5. Costs models
The relative importance of the different costs that comprise the internal cost structure of SSS
is not totally clear according to the literature consulted. Polo (2000) concluded that the most
important costs in international liner shipping in Spain are capital costs (approximately 33%
of the total costs of shipping transport) and loading costs (25%). However, Paixao and
Marlow (2002) maintained that 70% of the total costs in SSS are due to port charges (they

An integration cost model for Short Sea Shipping in the North Sea Region
ID156
IAME 2013 Conference, July 3-5– Marseille, France 8
also asserted that the inefficiency of port operations has been become, in the main,
responsible for the lack of competitiveness of SSS). On the other hand, Sauri (2006) obtained
results quite similar to those of Polo (2000), so for him the most representative costs for SSS
traffic are mainly related to capital costs and port operation costs. Grosso et al (2008)
identified the most important costs in SSS as firstly fuel costs and then the depreciation costs
of the assets. Nevertheless, they concluded that the inputs responsible for the great variation
in the freight prices among the different shipping companies were the fuel price and the
benefit margin applied by the company (regulated by the competitiveness of the market on a
concrete maritime route). The significant increase of fuel prices in 2007 and 2008 with respect
to previous years could partially motivate these results but obviously the fuel cost is highly
dependent on the different maritime distances considered for the different studies.
Additionally, Grosso et al (2008) pointed out the independence of shipping costs and the final
prices offered to the market (even over similar distances and with similar demands); among
other factors, the utilization ratio of the vessels and the shipments should be noted. The
Realise project (2004) concluded that the most important costs were firstly the depreciation of
the vessels and then the fuel costs. However, except in a very few cases, where cost functions
are developed considering the features of the fleets and of the service (Ametller, 2007; Sauri
and Spunch, 2009), cost estimations tend to be based on generalized cost models applied to
different maritime distances and relate to only one kind of vessel (Koi Yu Ng, 2009). These
models are often developed using market information or interviews (Grosso et al, 2008) of a
particular SSS service. This limits the possibility of comparing the performance of other kinds
of fleet (number of vessels, kind of ships) or SSS services (frequency). The utilization of
general cost models for intermodal transport, understood as a combination of rail and road, is
especially typical of the analysis of competitiveness against road haulage (Janic, 2007;
Sandberg Hanssen et al, 2012). Nevertheless, as previously stated, intermodal transport using
SSS is highly conditioned by the features of the fleet, which determine the service conditions.
On the other hand, many authors (Sauri, 2006; Perez-Mesa et al, 2010; Morales-Fusco et al,
2012) include in their analyses the concept of inventory costs, i.e. the costs associated with
the maintenance of the cargo unit during the waiting time of the cargo units in port for the
modal shift and the time associated with the trip by ship. The importance of inventory costs
have also been mentioned by Paixao and Marlow (2002) who indicated the relevant impact of
the average utilization rate of the vessels on the freight cost. In the following expressions, the
cost models for road haulage (CU) and for the land stretch (CMU1) of intermodal transport
(CMU) made up of capillary hauls (CMU1,1; CM1,2) in the intermodal transport are shown,
considering the addition of inventory costs (CM1,3) and the profit of the transport company (µ)
in the total cost of all land stretches (CU1). Road transport costs are calculated considering a
unitary cost per kilometre (C4,q), which integrates the different cost items (Deliverable 5,
Recordit Project, 2001; Koi Yu Ng, 2009; Perez-Mesa et al, 2010) and a unitary cost per time
(β1) for the inventory cost (CU2). In addition, the weight of the cargo units (Pp) is considered
for all possibilities P=1,2 (TEUs and trucks) as the results are given in euros per tonne.
An integration cost model for Short Sea Shipping in the North Sea Region
ID156
IAME 2013 Conference, July 3-5– Marseille, France 9
1 2 (1 )CU CU µ CU (5)
3 34,
1
1 1
( ) ( ( ))q a
z d zdq z d
CCU X X DR
P
p P (6)
2 1p
TVUCU
P p P (7)
1 2CMU CMU CMU (8)
1 1, 1 1, 2 1, 3CMU CMU CMU CMU (9)
1,
34
1
1,
( ) ( ( )q b
z zmq z
CC U X R
PM D
p P (10)
34,
1, 2
1
( ) ( ( )q b
d kd
dq
CCMU X DR
P
p P (11)
1 21, 3
( )1
p
T TCMU
P
p P (12)
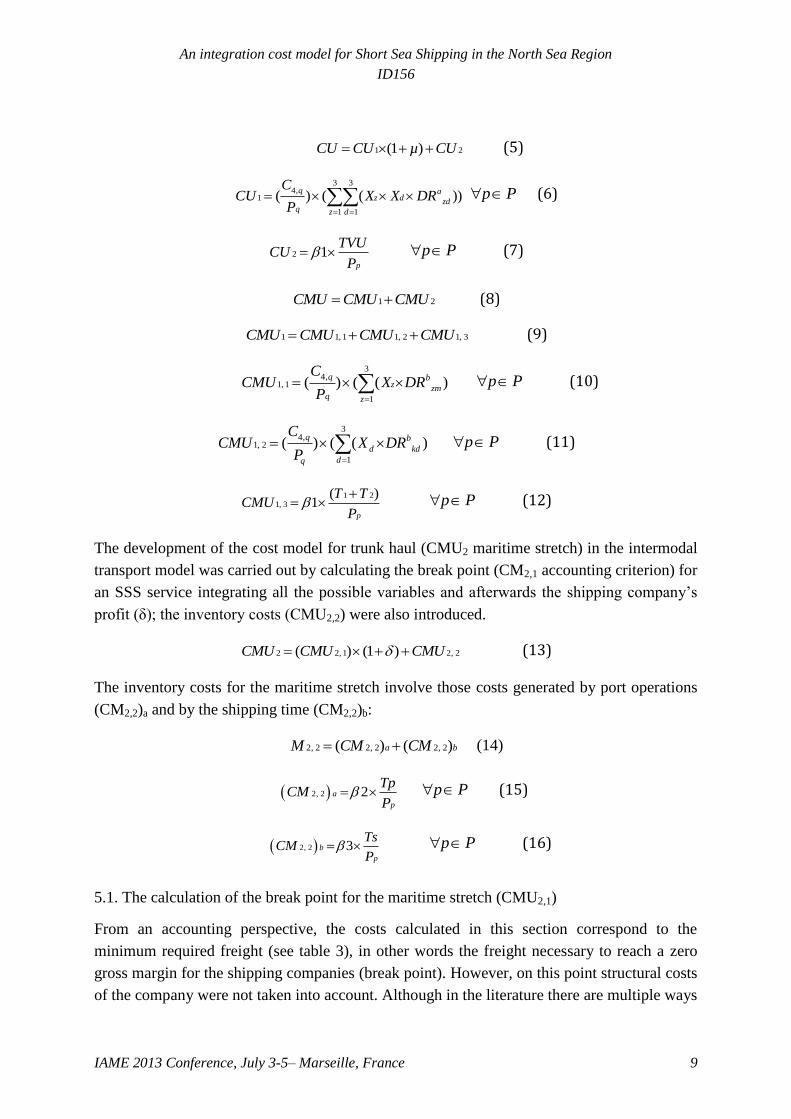
The development of the cost model for trunk haul (CMU2 maritime stretch) in the intermodal
transport model was carried out by calculating the break point (CM2,1 accounting criterion) for
an SSS service integrating all the possible variables and afterwards the shipping company’s
profit (δ); the inventory costs (CMU2,2) were also introduced.
2 2, 1 2, 2( ) (1 )CMU CMU CMU (13)
The inventory costs for the maritime stretch involve those costs generated by port operations
(CM2,2)a and by the shipping time (CM2,2)b:
2, 2 2, 2 2, 2( ) ( )a bM CM CM (14)
2, 2 2a
p
TpCM
P p P (15)
2, 2 3b
p
TsCM
P p P (16)
5.1. The calculation of the break point for the maritime stretch (CMU2,1)
From an accounting perspective, the costs calculated in this section correspond to the
minimum required freight (see table 3), in other words the freight necessary to reach a zero
gross margin for the shipping companies (break point). However, on this point structural costs
of the company were not taken into account. Although in the literature there are multiple ways

An integration cost model for Short Sea Shipping in the North Sea Region
ID156
IAME 2013 Conference, July 3-5– Marseille, France 10
to group different cost items associated with maritime transport (CTc), these items are
essentially the same in all studies focused uniquely on the yearly operating costs of the vessels
for the shipping company (Hunt and Butman,1995; Watson, 2002; Xie et al, 2008; Sauri and
Spunch,2009; Stopford,2009).
Table 3: Minimum required freight expressions (€/Tn) for different kinds of vessels
Feeder
vessels
(TB1)
12
2,1
1
1( ) ( )
1909,8
8,516
c
c
q
CMU CTGT
P Ntrip
p P
Ro-Ro
vessels
(TB2)
12
2,1 0,51
1( ) ( )
(0,0045 21,09 2,336) / ( 1,2 0,0022)c
q c
CMU CTGT DC P Ntrip
p P
Ro-
Pax
vessels
(TB2)
12
2, 1
1
1( ) ( )
503,21
1,2 10,48
c
cq
CMU CTGT
P NtripDC
p P
These kinds of study try to determine costs corresponding to the break-even point or the
minimum required freight (as in the case of this study) through the definition of the following
yearly costs: capital costs as the integration of amortization costs (CT1) and financing costs
(CT2). Continuing with the accounting approach, these last costs relate to the interest costs of
the naval mortgage. Direct fixed costs involve insurance (CT3), maintenance (CT4) and crew
costs (CT5).Variable costs are combustible costs (CT6) and operational port costs; the latter
are very dependent on the port and on stowage companies and integrate ship duties (CT7),
load duties (CT8), pilot duties (CT9), towing duties (CT10), mooring duties (CT11) and loading
costs (CT12).
5.1.1. Capital costs
Attending to the classical accounting criterion, this item integrates the financial costs of the
naval mortgage and the amortization of the ship value (Hunt and Butman, 1995; Wijnolst and
Wergeland, 2009; among others), or of the chart payment according to the operating regime
of the shipping company. In liner services, the shipping companies are often the ship owners
(Sauri and Spunch, 2009) so this situation was assumed in this study. Additionally, hire costs
and capital costs were considered equivalent due to their influence on the shipping account
(Grosso et al, 2008). The inclusion of the amortization cost is usually limited by national rules
(through the national general accounting plan). These limitations normally extend to the
maximum time permitted for the annotation of the amortization of one vessel (A2 around 20
years, CT1=0 if Ee>A2) and a maximum amortization ratio per year (around 10%). Although
different amortization systems exist, it seems reasonable to take a straight-line system
(Watson, 2002) as the majority of countries accept it. Thus:
11
2
(100% )CC CC RCT NB
A
if Ee≤A2 (17)

An integration cost model for Short Sea Shipping in the North Sea Region
ID156
IAME 2013 Conference, July 3-5– Marseille, France 11
This amortization is related to the purchase cost of the ship (CC) and the residual value of the
vessel (R1) at the end of its amortization period, in other words, the percentage of the worth of
the vessel regarding the current value of a new ship on the market at that moment. Clearly,
this is highly dependent on the depreciation tendency of the vessel on the market and on the
temporal situation of the second-hand market for freight shipping. Considering the features
assumed for the NSR fleet (purchase year 2005 and building years 2000 and 2005) and the
information provided by Clarkson’s World Fleet Register and Clarkson Research Studies, the
expressions shown in table 4 were obtained. Regarding the financial costs, probably one of
the most commonly used naval loans is the mortgage-backed loan (Stopford, 2009) covering a
percentage of the vessel’s worth (R4, around 80%).
Table 4-Purchase cost (CC), depreciation ratio (R1) and building cost (BC) per kind of vessels
Feeder
vessels
(TB1)
CC(€) 6
8 2 104 10 0,0029 2,5447
1,29GT GT
R1(%) ( 11 2 62( 5 1 0 10 0,0249)GT GT A
BC(€) 6
8 2 104 10 0,0029 2,5447
1,29GT GT
Ro-Ro
vessels
(TB2)
CC(€) 6
70,0019 0,463 10
(100% ( 10 0,0067) 5)1,29
GTGT
R1(%) 72(5 10 0,073)GT A
BC(€) 60,0019 0,463 10
1,29
GT
Ro-Pax
vessels
(TB2)
CC(€) 610
0,0023 18,8471,29
GT
R1(%) 62(1 10 0,0575)GT A
BC(€) 610
0,0023 18,8471,29
GT
In order to simplify the calculation, an arithmetical capital amortization is assumed, and
therefore the capital repayments are constant over the period of repayment (A1, normally eight
years), while the interest payments (with an interest ratio R2) decrease (see expression 18).
2 4 4 1 2[( ) ( 1) ( ) / ]eCT R CC E CC R A R NB if Ee≤A1 (18)
5.1.2. Direct fixed costs
Naval insurance predominantly involves protection against damages to hull and machinery
(H&M insurance) and insurance for third party claims: protection and indemnity (P&I).
According to Stopford (2009) two thirds of the insurance tariff is due to H&M insurance and
that is very dependent on the size of the vessel and its service time (A). The insurance history
of the shipping company also has an effect on the insurance tariff. In order to estimate these
costs (CT3), data published by Wijnolst and Wergeland (2009) were considered for different
kinds and size of vessel (see table 5). The maintenance expenses (CT4) primarily involve the

An integration cost model for Short Sea Shipping in the North Sea Region
ID156
IAME 2013 Conference, July 3-5– Marseille, France 12
stores, spares and periodic repairs/surveys demanded by the Flag Authorities and by the
Classification Society (to keep the class stay). These costs are mainly related to the utilization,
age and size of vessels (Kavussanos et al, 2004).
2
41,20 25,10 194,24
1 0,82 /100 100
A ACT NB BC
(19)
In order to simplify the expression of the maintenance costs (see expression 19) and to include
the size of the vessels, we generalized the approach of Sauri and Spunch (2009) for old
vessels (Ee) and for all kinds of vessel. We also considered the increase over the service time
of the vessels from the time of their construction (A, eight years for feeder vessels and
thirteen for other vessels in the NSR), according to Hunt and Butman (1995).
Table 5: Insurance costs (CT3) and personnel costs (CT5)
Feeder vessels
(TB1)
CT3(€) 1000
0,0134 52,4341,29
NB GT
CT5(€) 43 3
53 47(5 10 14,981)
100 100
a bC C NB GT
Ro-Ro vessels
(TB2)
CT3(€) 1000
0,0153 76,281,29
NB GT
CT5(€) 3
3 344 56
(1 10 8,9461)100 100
a bC C NB GT
Ro-Pax vessels
(TB2)
CT3(€) 1000
0,0228 455,481,29
NB GT
CT5(€) 33 3
35 65(1,5 10 3,4165)
100 100
a bC C NB GT
To define the personnel costs (CT5, see table 5), it is first necessary to define the number of
persons in the crew (NTR). The relationship between the vessel size and its crew is not direct;
in fact it is more dependent on the building year (Stopford, 2009) and on the kind of machine
room (unmanned or not). This discrepancy regarding the crew and the cargo capacity for
container vessels was also noted by Wijnolst and Wergeland (2009). Despite this, in order to
have a reference point, the crews were estimated from the information provided by Clarkson’s
database. Staff costs usually include the salary costs considering the staff rotation costs
(rotation index=0.33). In addition to the costs of the salaries (Wijnolst and Wergeland, 2009)
for the officers (C3a) and ratings (C3
b), the crew distribution between them was estimated from
the information provided by Wijnolst and Wergeland (2009) for Ro-Ro and container vessels,
and by Sauri and Spunch (2009) for Ro-Pax vessels.
5.1.3. Variable costs
Authors such as Grosso et al (2008) and the results obtained in the Realise Project (2004)
show the relevance of combustible costs (CT6) for the operating accounts of SSS traffic.
Combustible costs are primarily related to the operation of the main engines, and therefore are
An integration cost model for Short Sea Shipping in the North Sea Region
ID156
IAME 2013 Conference, July 3-5– Marseille, France 13
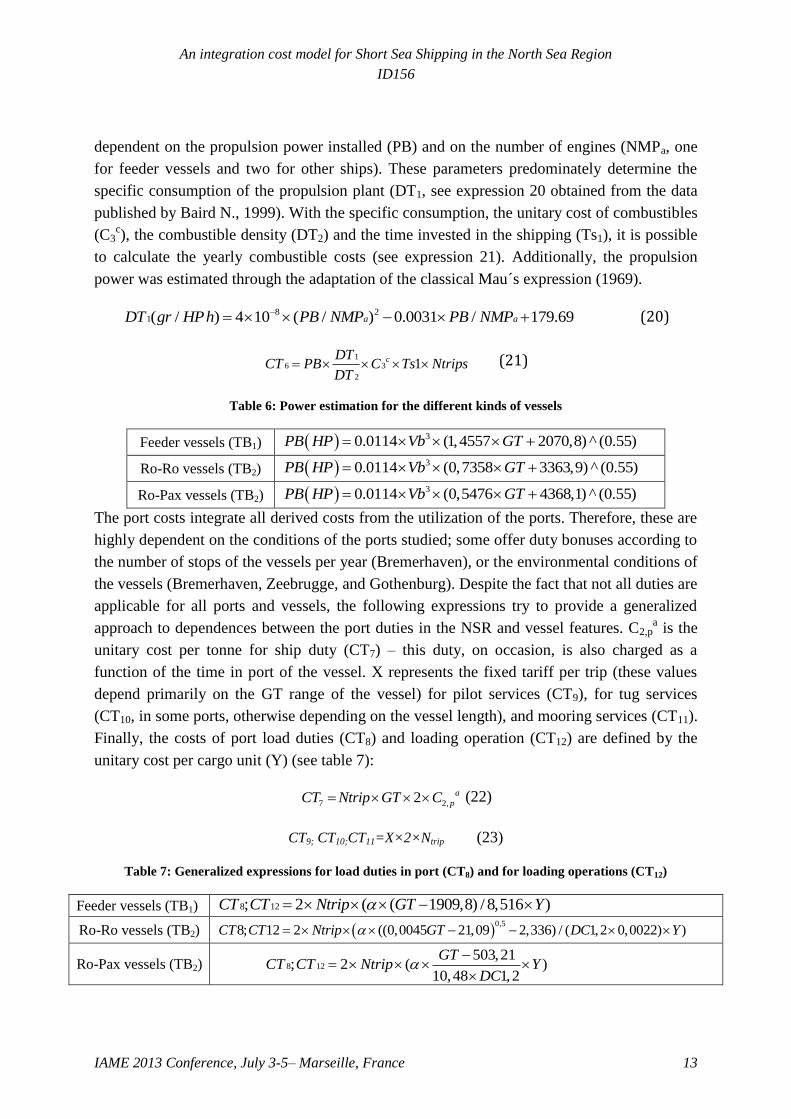
dependent on the propulsion power installed (PB) and on the number of engines (NMPa, one
for feeder vessels and two for other ships). These parameters predominately determine the
specific consumption of the propulsion plant (DT1, see expression 20 obtained from the data
published by Baird N., 1999). With the specific consumption, the unitary cost of combustibles
(C3c), the combustible density (DT2) and the time invested in the shipping (Ts1), it is possible
to calculate the yearly combustible costs (see expression 21). Additionally, the propulsion
power was estimated through the adaptation of the classical Mau´s expression (1969).
8 21( / ) 4 10 ( / ) 0.0031 / 179.69a aDT gr HPh PB NMP PB NMP (20)
16 3
2
1cDTCT PB C Ts Ntrips
DT (21)
Table 6: Power estimation for the different kinds of vessels
Feeder vessels (TB1) 3 0.0114 (1,4557 2070,8) ^ (0.55)PB HP Vb GT
Ro-Ro vessels (TB2) 3 0.0114 (0,7358 3363,9) ^ (0.55)PB HP Vb GT
Ro-Pax vessels (TB2) 3 0.0114 (0,5476 4368,1) ^ (0.55)PB HP Vb GT
The port costs integrate all derived costs from the utilization of the ports. Therefore, these are
highly dependent on the conditions of the ports studied; some offer duty bonuses according to
the number of stops of the vessels per year (Bremerhaven), or the environmental conditions of
the vessels (Bremerhaven, Zeebrugge, and Gothenburg). Despite the fact that not all duties are
applicable for all ports and vessels, the following expressions try to provide a generalized
approach to dependences between the port duties in the NSR and vessel features. C2,pa is the
unitary cost per tonne for ship duty (CT7) – this duty, on occasion, is also charged as a
function of the time in port of the vessel. X represents the fixed tariff per trip (these values
depend primarily on the GT range of the vessel) for pilot services (CT9), for tug services
(CT10, in some ports, otherwise depending on the vessel length), and mooring services (CT11).
Finally, the costs of port load duties (CT8) and loading operation (CT12) are defined by the
unitary cost per cargo unit (Y) (see table 7):
2,7 2 a
pNtrip GCT T C (22)
CT9; CT10;CT11=X×2×Ntrip (23)
Table 7: Generalized expressions for load duties in port (CT8) and for loading operations (CT12)
Feeder vessels (TB1) 8 12; 2 ( ( 1909,8) / 8,516 ) CT CT Ntrip GT Y
Ro-Ro vessels (TB2) 0,5
8; 12 2 ((0,0045 21,09 2,336) / ( 1,2 0,0022) )CT CT Ntrip GT DC Y
Ro-Pax vessels (TB2) 8 12503,21
; 2 ( )10,48 1,2
GTCT CT Ntrip Y
DC

An integration cost model for Short Sea Shipping in the North Sea Region
ID156
IAME 2013 Conference, July 3-5– Marseille, France 14
6. Practical application to the NSR: the maritime route Rosyth-Zeebrugge
From the Food Port Project findings (Work Package 5: Market knowledge), two ports are
highlighted due to their potential for food transportation in the NSR: Zeebrugge, with six
possible different destinations identified as relevant (in England, Sweden, Norway and
Scotland) and Bremerhaven with three relevant destinations in Denmark and Norway.
Nevertheless, of all the possible maritime routes from Zeebrugge in the NSR, the Rosyth-
Zeebrugge (DM=750 km of maritime distance) was selected as the base case due to the
continuous changes in the SSS conditions provided by the operators on this route. Thus,
through the analysis of the competitiveness of the possible intermodal chains against the
unimodal road haulage, not only did we attempt to obtain realistic costs and times for the
transport modes (ensuring the best possible performance of the models), but also to determine
whether the current SSS is competitive and to know, under ideal conditions (sufficient
demand), which option of SSS service (of those applied up to-date on this route) was the most
appropriate in terms of competitiveness. The main food goods moved from Scotland are fish,
whisky and retail (Food Port project) and their main destinations are Germany, France and the
Benelux zone. Thus, one city (d) per zone was chosen as a node on the continental coast (see
figure 1): Dusseldorf, Lille and Brussels (with population relative weights: X1=31%, X2=12%,
and X3=58%, respectively). On the Scottish coast, the nodes (z) were selected by population
criteria: Glasgow, Aberdeen and Edinburgh (X1=48%, X2=18%, and X3=34%). Thus, with the
transport networks obtained, the average distance for road haulage is 1100 km (DRazd), and
for the capillary hauls in the intermodal transport 70.92km (DRb
zm), and 163.61km (DRbkd).
Currently one Ro-Ro vessel (GT=11,530t and VB=20kn) covers this route offering an SSS
service with three departures per week (Ntrips=245); this SSS service serves as the base case.
However, previously this route was covered by two Ro-Ro vessels with four weekly
departures (option 1), one large Ro-Ro vessel (option 2), and two fast Ro-Pax vessels offering
a daily service (option 3). Additionally the option of covering the route with one container
vessel (with the features of the fleet used by Koi Yu Ng, 2009) with the frequency of 2 calls
per week was also considered (option 4). All these options for the SSS service were evaluated
under ideal conditions (the maximum cargo capacity offered by every alternatives of SSS
service will be always covered by the demand) and their characteristics are shown in the table
8. Additionally table 8 shows the competitiveness results for the intermodal transport
articulated through all these four options and the base case. According to the results obtained
for the base case, the transport price for one accompanied truck on this maritime stretch is
1,076.10€ (assuming all full trucks) or 1,348€ (all trucks were 80% loaded in weight), while
the price for the road haulage alternative is €1,708.70 (1,100 km) for a refrigerated truck (24
t). These values are quite close to real observations, so it can be accepted that these models
obtain realistic values to study the competitiveness of intermodal transport in the NSR. On the
other hand, looking at table 8 we can confirm that the current SSS service is not able to offer
competitive intermodal chains (with the assumptions established) against road haulage in

An integration cost model for Short Sea Shipping in the North Sea Region
ID156
IAME 2013 Conference, July 3-5– Marseille, France 15
terms of time (2.17 h of difference). In addition, the advantage in terms of the cost (13.03€/t)
is not sufficient to attract perishable loads away from road haulage as, considering the
transport of fresh fish for example, one hour’s delay would only be compensated at a rate of
10.30€/t (Sandberg-Hanssen et al. 2012). Taking into account the rest of the options on this
maritime route, it can be concluded that only option 3 (the first strategy introduced in relation
to this route) could offer a competitive alternative to road haulage. This is based on the
difference in time (3.27 h of advantage) and of the cost saving (11.36€/t). Regarding option 4,
this offers the most competitive intermodal route in terms of costs but it is important to bear in
mind that in this option the evaluation was based on another cargo unit of lower weight: one
refrigerated TEU (12.5 t).
Table 8: Competitiveness results for the unimodal and intermodal transport obtained with different SSS
services for the route Rosyth-Zeebrugge
Features Base
Case Option1 Option2 Option3 Option4
Gross Tonnage (GT) 11530 11530 12189 30285 4500
TBq (1= Feeder;2=Ro-Ro;3=RoPax) 2 2 2 3 1
Vessel Speed Vb (Kn) 20 20 17 27.1 18
Maritim distance DM(Km) 750 750 750 750 750
Number of vessels (Nb) 1 2 1 2 1
Number of trips(Ntrip) 245 326 214 524 165
Occupation ratio α (%) 0.8 0.8 0.8 0.8 0.8
Purchase age of vessels (Ee) 8 8 8 8 8
Profit of shipping company δ(%) 0.1 0.1 0.1 0.1 0.1
Results
TIMES
Unimodal transport (h) 27.96 27.96 27.96 27.96 27.96
Intermodal transport (h) 30.13 30.13 33.24 24.69 37.22
Time invested in land stretches(T1) 0.79 0.79 0.79 0.79 0.79
Time invested in land stretches (T2) 1.82 1.82 1.82 1.82 1.82
Port Times (h) 5.75 5.75 5.29 5.63 10.59
Shipping time (h) 21.77 21.77 25.35 16.46 24.02
COSTS
Unimodal transport (€/Tn) 71.20 71.20 71.20 71.20 136.7
Intermodal transport
Zeebrugge(€/Tn) 58.17 62.51 52.85 59.84 56.28
Costs of the land stretches(€/Tn) 13.69 13.69 13.69 13.69 26.29
Maritime transport(€/Tn) 44.47 48.82 39.16 46.15 29.99
Cost of the maritime transport
(inventory)(€/Tn) 1.84 1.84 2.03 1.50 4.58
Costs of maritime transport in the
break point (€/Tn) 38.76 42.70 33.76 40.59 23.10
NECESSARY DEMAND AND FREQUENCY
Yearly Cargo units (trailers/TEUS) 22,540 29,992 21.400 94.844 40,095
Maximum Yearly Tones 540,960 719,808 513,600 2,276,256 501,188
Frequency (weakly
departures/direction) 3 4 2 and 3 6 and 7 2

An integration cost model for Short Sea Shipping in the North Sea Region
ID156
IAME 2013 Conference, July 3-5– Marseille, France 16
Despite this advantage, this option leads to the intermodal transport is not feasible for the
transportation of food due to the great difference in transport time between it and road haulage
(9.26 h). Up to this point, previous analyses were undertaken under ideal conditions; in other
words, they assumed that the demand and frequency required by the shippers coincided
absolutely with those provided by the service. Nevertheless, significant differences between
the maximum yearly Tones and frequency provided by the base case and the best option
(option 3) necessitated a deeper analysis concerning the less demanding option (the base
case). Hence, a demand reduction of 23.01% involves a significant increase in the cost per
tonne of 22.39% but also a light decrease for the intermodal transport time (1.71%). This is
mainly due to the time invested in port load operations, which is based on step functions (N
drivers=trailers×α/19, see figure 3).
Figure 3-Competitiveness consequences of modifications of the occupation ratio and the speed of the vessel
in the base case.
Thus, the time reduction for this motive would not be sufficient (29.61 h against 27.96 h for
road haulage) to attract new loads. These results suggest that there are wide possibilities for
the improvement of the operation and sizing of the fleet in this route. For example, through an

An integration cost model for Short Sea Shipping in the North Sea Region
ID156
IAME 2013 Conference, July 3-5– Marseille, France 17
increase of 12.30% of the current speed of the vessel (see figure3) would lead to the same
competitiveness in terms of the time for the intermodal transport as for the road haulage with
a total time reduction for the first one of 7.18%. With this new situation, the intermodal cost
would increase 6.36% and cost difference between both transport systems would be 9.33€/t
being this favorable to the intermodal chain. Hence, this new operation could be interesting
for the transport of perishable goods; nevertheless, this new strategy implies a higher
frequency for the service and hence a higher yearly required demand from shippers (587,328t
against 540,960t) to keep the aforementioned advantage in terms of costs.
7. Conclusions
Despite the great efforts made by the EU from the 1990s onwards, the success of intermodal
transport through SSS has not been reached. The relative competitiveness of the road and
intermodal transport is a consequence of the combination of numerous technical-operative
variables of transport systems, cargo units and the localization of nodes and hubs within the
transport network. For this reason the utilization of general expressions to predict the
intermodal transport performance through SSS is not adequate. Thereby, this study which was
developed in the Food Port project framework, aimed to determine detailed time and cost
models for unimodal and intermodal transport. These models should be able to provide
realistic information about competitiveness of these transport systems in the NSR for the
transportation of perishable loads. It was thus necessary that, the models observed all the
possible main variables in order to permit the analysis of different combinations of alternative
transport. Consequently, to evaluate the relevant influence of SSS operation and the
characteristics of their fleets regarding the intermodal transport performance, the models
developed included the following variables: the kind of vessel and cargo unit, the GT of
vessels and their utilization rate, the number of available vessels for one route, the profits
applied by the company, the frequency of the SSS line, the speed of the vessels and the
distances for every stretch of the transport modes. The transport network assumed to be
operating was a ‘many to many’ model where the ports were identified as hubs and nodes as
the extreme points of the lines (population criterion). With the intention of testing the correct
performance of the models, these were applied to a particular case in the NSR: possible
intermodal transport networks through the Rosyth-Zeebrugge maritime route. From this
analysis, we can conclude that the models are not only useful to provide realistic information
about the transport systems operation, but also to evaluate the influence of different SSS
scenarios (fleets, services, operation, transport demand, etc) on the success of intermodal
transport. Hence, in the case of the application of Rosyth-Zeebrugge, the results obtained
from the analysis of different SSS possibilities for this maritime route indicated that the initial
strategy carried out for its operation (the daily operation of two fast ferries) enabled the
establishment of intermodal routes with the highest possibilities of success against the road
haulage if the service demand was sufficient. Despite the fact that the current SSS service did
not seem to provide competitive intermodal routes for perishable goods within the transport

An integration cost model for Short Sea Shipping in the North Sea Region
ID156
IAME 2013 Conference, July 3-5– Marseille, France 18
networks assumed, there exist wide improvement´s possibilities through the correct adaptation
of the service operation and fleets. As suggested before, simple modifications to the speed of
vessels and their frequency can create competitive intermodal chains, but with very close
conditions to those of road haulage. Hence, to offer wider perspectives for the analysis of the
scenarios carried out with these models, future studies should focus on the introduction of the
externalities in the models for both transport systems, such as emission levels. This would
allow, in line with the main aim of European White Paper on transport (2011), the evaluation
not just of the consequences of an eventual modification of the modal split in terms of the
time and costs for the transport systems, but also of the potential environmental impact on
citizens.
References
AMETLLER X.. 2007. Optimización del transporte de mercancías mediante tráfico marítimo
de corta distancia.Minor Thesis. Polytechnic University of Cataluya.
BAIRD A. 2004 Investigating the feasibility of fast sea transport services. Maritime
Economics and Logistics 6(3) :252-269
BAIRD. N.. 1999. Marine engines and Propulsion systems. Baird Publications. London
BERGANTINO. A.and BOLIS. S.. 2004. An analysis of maritime ro-ro freight transport
service attributes through adaptive stated preference: an application to a sample of freight
forwarders. European Transport. vol.25-26:33-51.
CHLOMOUDIS. C. and PALLIS A. 2002. European Union port Policy: the movement
towards a Long-Term Strategy. (Cheltenham: Edward Elgar).
CLARKSON RESEARCH STUDIES. World shipyard monitor. February. 2004 Vol.11.N2
CLARKSON RESEARCH STUDIES. World shipyard monitor. December. 2008 Vol.15.N12
CLARKSON WORLD FLEET REGISTER: http://www.clarksons.net/wfr/Login.
COMMISSION OF THE EUROPEAN COMUNITIES. 1992. White Paper on the future
development of the common transport policy. COM (92) 494 final
COMMISSION OF THE EUROPEAN COMINITIES. White Paper: towards a competitive
and resource efficient transport system. COM(2011) 144 final
COUNCIL OF EUROPEAN UNION. 2006. Council Regulation (EC) No 1419/2006 of 25
September 2006 repealing Regulation (EEC) No 4056/86 laying down detailed rules for the
application of Articles 85 and 86 of the Treaty to maritime transport. and amending
Regulation (EC) No 1/2003 as regards the extension of its scope to include cabotage and
international tramp services.

An integration cost model for Short Sea Shipping in the North Sea Region
ID156
IAME 2013 Conference, July 3-5– Marseille, France 19
CULLIGANE K. TOY N.. 2000 Identifying influential attributes in freight route/mode choice
decisions: a content analysis Transport Research. Part E..36: 41-53.
DAGANZO C. 2005. Logistic systems Analysis. Berlin Springer
EC. 2002. Seaports: Gateways to Sea Transport Growth (Brussels: Directorate General for
Energy and Transport. European Commission).
GARCIA-MENENDEZ. L. and FEO-VALERO M.. 2009. ‘European Common Transport
Policy and Short Sea Shipping: Empirical evidence Based on Modal Choice Models’.
Transport reviews. 29 (2): 239-259.
GESE X.and BAIRD A..2010. Motorways of the sea policy in Europe.Proceedings of the
2010 Conference of the International Association of Maritime Economics. Lisbon.
GROSSO M.. LYNCE A..SILLA A..and VAGGELAS G..2008. Parameters influencing short
sea shipping pricing scheme: Italian operator’s point of view. Proceedings of 8th Swiss
Transport Research Conference (STRC). October 2008. Ascona.
HSU CH.and HSIEH Y.2007.Routing, ship size and sailing frequency decision making for a
maritime hub-and-spoke container network. Mathematical and computer
modeling,45(2007):899-916
HUNT E. and BUTMAN B..1995. Marine engineering economics and Cost Analysis. Cornell
Maritime Press. Maryland
JANIC M.. 2007. Modelling the full costs of an intermodal and road freight transport
network. Transportation research part D 12 (2007): 33-44
JONG DE. G.. 2000 Value of freight travel time savings. in: D. Hensher and K. Button (Eds)
Handbook of Transport Modeling. pp. 553-563 (Oxford-Elsevier)
KAVUSSANOS MANOLIS G. BITROS GEORGE C. KIOUKIS DIMITRIS SARRIS
IOANNIS 2004. A cross sectional analysis of ship maintenance expenses. 10th World
Conference on Transport Research. Istambul (Turkey)
KOI YU NG A. 2009 Competitiveness of short sea shipping and the role of port: the case of
North Europe. Maritime Policy and Management 36(4):337-352
MARTINEZ DE OSES FX., CASTELLS I SANABRA M. and RODRIGUEZ NUEVO M,
2011. Development of a cost simulator to assess new maritime trade routes. International
Journal on Marine Navigation and Safety of sea transportation 5(3):311-314
MAU J.1969 La rapport de deplacement au port en lourd des cargoes pour merchandises
generals. Bulletin du Bureau Veritas. April 1969

An integration cost model for Short Sea Shipping in the North Sea Region
ID156
IAME 2013 Conference, July 3-5– Marseille, France 20
MBIYDZENYUY G.. PERSSON J..and HENESEY L. 2010.A decisión support Method for
analysisng a short sea shipping link from a port infraestructura perspective’. Proceedings of
2010 Annual Conference of the International Association of Maritime Economists.Lisbon.
MORALES-FUSCO P.. SAURI S..and LAGO A. 2012. Potential freight distribution
improvements using motorways of the sea. Journal of Transport Geography 24(2012) pp:1-11
MUSSO E. and MARCHESE U. 2002.Economics of short sea shipping. in: C.Grammenos
(Ed.) The handbook of Maritime economics ans Bussiness pp. 280-304 (London:Lloyds of
London Press)
PAIXAO A. and MARLOW P. 2001. A review of the European Union shipping Policy.
Maritime Policy and Management 28(2): 187-198.
PAIXAO A.C..and MARLOW P.B.. 2002. Strengths and weaknesses of short sea shipping.
Marine Policy 26 (2002): 167-178.
PAIXAO A.C..CARVALHO S. and OLIVEIRA M..2010.Port choice in the European short
sea ship-ping market: the viewpoint of port authorities. Proceedings of the 2010 Conference
of the International Association of Maritime Economics. Lisbon.
PEREZ-MESA J.. CESPEDES-LORENTE J. and SALINAS-ANDUJAR J.2010.Feasibility
study for Motorways of the sea (MoS) between Spain and France: Application to the
Transportation of Perishable Cargo. Transport Reviews vol 30(4): 451-471.
POLO SANCHEZ G.. 2000. Sobre la estructura de costes en el transporte marítimo en
España. Estudios e investigaciones marinas. 1(1):27-45.
REALISE Project.2004 Regional action for logistical integration of shipping across Europe.
Deliverable 4:Multi modal transport pricing and costing analysis. Task 4.2:EU countries
comparative report.
RECORDIT project. 2006 Real cost reduction of door to door intermodal transport. Final
report. Centre for Logistics and transportation. Cranfield. United Kingdom.
ROMANA F..PELS E. and TRUJILLO L..2010. Incentive mechanisms for the development
of short sea shipping. Proceedings of the 2010 Conference of the International Association of
Maritime Economics. Lisbon.
SANDBERG HANSSEN T..ANDREAS MARTHISEN T. and FORGENSEN F..2012
Generalized transport costs in intermodal freight transport. Compendium of papers of Energy
Efficient Transportation Networks. September 2012. Paris
SAURI S..2006 Cost structure in a Short Sea Shipping line. Journal of Maritime Research
Vol.III N2: 53-66.
An integration cost model for Short Sea Shipping in the North Sea Region
ID156
IAME 2013 Conference, July 3-5– Marseille, France 21
SAURI. S. and SPUNCH. B. 2009. Long‐Run Marginal Cost in the Ro-Ro Industry.
Proceedings of 88th TRB Annual Meeting. Washington.
STOPFORD. M.. 2009. Maritime economics. Third edition. Routledge.London
TALEB-IBRAHIMI. M. 1989. Modeling and Analysis of Container Storage in Ports. Ph. D.
Thesis. University of California. Berkeley.
WATSON D.. 2002 Paractical Ship Design. Elsevier. Oxford
WIJNOLST N.. and WERGELAND T.. 2009. Shipping Innovation. Delft University Press.
IOS Press.Netherlands
WOXENIUS J. 2010.Flexivility vs. specialization in European short sea shipping’.
Proceedings of 2010 Conference of the International Association of Maritime Economics.
Lisbon
XINLIAN XIE. 2008. Ship selection using a Multi-criteria synthesis approach. J.March. Sci.
Technol. (2008) 13: 50-62 DOI 10.1007/s00773-007-0259-4.