cost benefit analysis and economic impact analysis of the ... · kir mtc cba and eia, final may...
TRANSCRIPT

KIR MTC CBA and EIA, FINAL May 2013
1
Cost Benefit Analysis and
Economic Impact Analysis
of the
Kiribati Marine Training Centre
Nimmo-Bell &
Market Economics
Final
21 May 2013

KIR MTC CBA and EIA, FINAL May 2013
2
A report prepared by:
Dr Brian Bell
Director
Nimmo-Bell & Company Ltd
and
Dr Garry McDonald
Director
Market Economics Limited
Disclaimer
While all due care has been taken to ensure the accuracy of information in this report no
responsibility or liability is accepted for any errors or omissions of fact or opinion, or for any loss or
damage resulting from reliance on, or the use of, the information it contains. Nimmo-Bell and
Market Economics have relied upon information provided to them, and assumed without
independent verification that the information is accurate and complete. This report is not intended
for general circulation or publication, and may not be relied upon by any party, other than the party
to whom it is addressed, without Nimmo-Bell and Market Economics' express written approval. The
report has been prepared for the specific purpose stated, and any party that relies on it for any other
purpose, without Nimmo-Bell and Market Economics' express written approval, does so at its own
risk.

KIR MTC CBA and EIA, FINAL May 2013
3
Contents Page
Executive Summary 4
1. Introduction 6
1.1 Rationale for the Analysis 6
1.2 The Kiribati Economy 6
1.3 Aim and Scope 6
2. Cost Benefit Analysis 7
2.1 Trainee Numbers 7
2.2 CBA Assumptions 9
2.3 Benefits 9
2.4 Costs 10
2.5 Results 12
2.6 Limitations of the Analysis 13
3. Economic Impact Analysis 15
3.1 Economic Impact of the MTC 15
3.2 Methodology 15
3.2.1Input-Output Analysis 15
3.2.2 Multiplier Analysis 15
3.3 Key Assumptions 17
3.4 Results 17
References 21
Appendix 1. Technical Construction of I-O Tables for Kiribati 22
Tables
1. Results of the CBA 13
2. Cashflows of Operations 195-2012 14
Figures
1. Trainees Attending and Graduating 8
2. Numbers Graduating from Special Courses 8
3. Remittances 10
4. Cost of running the MTC by Main Contributor 11
5. Annual Costs per Trainee Graduating 11
6. Benefits and Costs 11

KIR MTC CBA and EIA, FINAL May 2013
4
Executive Summary 1. As the Kiribati Marine Training Centre nears its 50th anniversary it is timely to assess the impact it
has had on the Kiribati economy. Since its inception in 1967 the Centre has provided education
and skill development for seafarers providing much needed employment on foreign merchant
ships. It is by far the most important source of private sector employment for I-Kiribati
generating significant foreign exchange earnings.
2. Since 1984 almost 3,500 trainees have entered courses with 2,100 graduating representing a
pass rate of 60%. This has created over 27,000 jobs1 with the German shipping line South Pacific
Maritime Service (SPMS) with an average of 936 jobs filled per year.
3. The Kiribati government and people can be justly proud of the Centre as it has the distinction of
being the only institution in the Pacific to achieve White List status under the Maritime Labour
Convention 2006, thus facilitating future employment opportunities for seafarers.
4. New Zealand has been a long running supporter of the Centre through provision of a continuous
source of aid since 1984. Over the period 1995 to 2012 New Zealand has invested A$9.1 million
(in the 2012 money terms) representing 25% of the total cost of running the Centre over that
time frame. Other major funding has come from the Government of Kiribati (51%), SPMS (20%)
and the Australian government (4%).
5. Remittances from wages earned while overseas provide a much needed source of foreign
exchange for the economy and support to the extended families and communities of seafarers.
On average over the last 18 years seafarers have earned in wages A$10.2 million per year in
2012 money terms, much of which is remitted home.
6. Wages paid by SPMS to seafarers peaked in 2002 at $201214.7 million2 since declining to reach
$6.2 million in 2012. This decline is largely due to an overall decline in ship positions and intense
competition for positions on ships from other nations.
7. A cost benefit analysis shows that the net benefit to the economy in Net Present Value terms at
a discount rate of 5% over the 18 years is A$32.7 million. Discounted gross benefits amount to
A$56.3 million and total cost A$23.7 million, representing a benefit to cost ratio of 2.4. This
represents an excellent return on the investment in the MTC with a return of $2.4 for every $1
invested.
8. Input-output analysis is used to measure the economic impact of the MTC on the Kiribati the
economy over the period 1995 to 2012. A marine training sector was constructed within the
model to measure the impact of expenditure by the MTC and the impact of seafarer remittances
on the economy. The combined value added of remittances and the operation of the MTC
amounted to 3.4% of Kiribati’s GDP. This is a very significant contribution given that much of the
money economy is based on aid flows.
9. In strict economic impact terms, remittances, which embody the facilitated effects of the MTC
through employment training, have a significantly larger economic effect which is 6.75 times
greater than the impact and the operational impacts of the Centre itself.
10. The MTC’s cumulative undiscounted value added impact for Kiribati is estimated as $93 million
(equivalent to contribution to GDP). This equates to an average value added impact of $2.4
million per year. Importantly, of the total value added impact estimated for the study period, 8%
1 In this case a job is a contract position on a ship of up to one year
2 $2012 refers to dollars in 2012 terms i.e. years prior to 2012 figures are indexed up for inflation to 2012 values

KIR MTC CBA and EIA, FINAL May 2013
5
is derived from the operational and capital expenditures of the MTC itself, and the remaining
92% comes from remittances that are facilitated by the MTC.
11. When benefits and costs are discounted in the future and inflated in the past, taking into
account of the time value of money, the cumulative value added at a discount rate of 5% is $116
million and the average annual value added is $3.0 million. Given the very limited opportunity
for employment outside the public sector this represents an important contribution to the
economy.
12. The type I multiplier (direct and indirect effect) for the Kiribati economy is 1.98. Thus for every
one dollar of value-added generated by remittance expenditure and expenditure by the MTC an
additional $0.98 of value-added is generated in the Kiribati economy as a result of upstream
supply chains. Taking into account direct, indirect effects and also induced effects as increased
wages are spent on consumer goods (type II multiplier) gives a multiplier of 2.07. This means
that for every $1 generated through the operation of the MTC and remittances that flow directly
from the jobs created on overseas ships there is a $2.07 boost to the economy through the
indirect and induced effects as described above. These multipliers appear on the low side
because much of domestic consumption is derived from imported goods rather than goods
created in the economy.
13. The MTC fills a vital role in the Kiribati economy by providing highly skilled graduates who earn
overseas funds that are remitted back to families and communities. By supplementing the
government’s expenditure on the Centre New Zealand, SPMS and Australia ensure that the
Centre has the resources it needs to maintain a high standard of training and provide
opportunities for future employment of E-Kiribati seafarers.
14. The current merger of MTC and the Kiribati Fisheries Training Centre signals a new era for the
future prosperity of Kiribati by extending the range of opportunities for trainees in the maritime
industry.

KIR MTC CBA and EIA, FINAL May 2013
6
1. Introduction
1.1 Rationale for the analysis Kiribati is a country facing numerous economic, social, demographic and environmental challenges.
It is a country with limited natural resources. Infertile soils, severely restricted land and water
resources coupled with limited economic prospects renders Kiribati a developing nation. Kiribati’s
population are geographically spread across 32 dispersed and isolated atolls and one raised coral
island. Increased urbanization and internal migration from the outer islands are creating their own
problems in terms of provisioning and increased crowding. Permanent overseas migration, while
offering economic opportunities does not solve the development needs of Kiribati. Temporary
overseas migration, such as through seasonal migrant work programs and employment
opportunities on foreign owned sea vessels, allows for remittances to enter the Kiribati economy.
Such remittances, along with development aid play an important role, making significant
contributions to the Kiribati economy.
The Marine Training Centre (MTC) at Betio, Tarawa is instrumental in the preparation of graduates in
obtaining employment on sea vessels. A gap in information on the economic contribution of the
MTC to the Kiribati economy was identified. It is also timely that such an analysis be done with the
approach of the 50th anniversary of the opening of the MTC.
1.2 The Kiribati economy With a Gross Domestic Product (GDP) of AU2010$148m, Kiribati is classified by the United Nations as a
least developed country. This GDP figure includes the formal or monetary sector and the informal or
subsistence sector, which is an important component of the economy (National Statistics Office,
2011; ADB, 2009). All references to GDP in this report refer to both formal and informal sectors.
Kiribati traditionally exports fish, copra and seaweed, but the value of total exports is dwarfed by the
value of imports. The negative balance of payments highlights the current dependence of Kiribati on
outside sources. There is little manufacturing undertaken on the island, signifying an undiversified
base to the economy.
The remittances obtained from Kiribati’s living overseas and working on the seas provide benefits to
families and communities at home (Borovnik, 2006). In particular, the MTC, founded in 1967,
educate and train young men (and in recent times some young women) for seafaring careers, and is
seen as a critical institution for Kiribati. The Centre holds the distinction of the only institution in the
Pacific to achieve Germanischer Lloyd (GL) Certification of Compliance to confirm International
Maritime Organisation (IM0) White List status, under the Maritime Labour Convention 2006, and ISO
Standards. Now that the Kiribati Fisheries Training Centre (FTC) is to be merged with the MTC, which
takes place in 2013, it is timely to conduct an analysis of the impact of the MTC on the Kiribati
economy.
1.3 Aim and Scope of the study The aim of this report is twofold: firstly, to determine the extent to which the benefits of running the
MTC exceed the costs using a Cost Benefit Analysis framework and secondly, to measure the impact
of the MTC in terms of economic activity – as measured by value added, which is equivalent to Gross

KIR MTC CBA and EIA, FINAL May 2013
7
Domestic Product. This impact results from both a ‘core’ impact - the MTC operation itself, which is a
net addition to the economy; and a ‘facilitated’ impact - the MTC enables its graduates to secure
employment and wages which enter the Kiribati economy in the form of remittances.
For its part, the New Zealand Ministry of Foreign Affairs and Trade is interested in the efficiency and
effectiveness of its aid to Kiribati3. It requested a cost benefit analysis (CBA) and Economic Impact
Analysis (EIA) of New Zealand’s assistance to the Marine Training Centre and its contribution to the
economy of Kiribati. As New Zealand is not the only contributor to the running of the Centre it is not
possible to single out New Zealand’s contribution. Instead, the analysis looks at all the costs of
running the Centre against the benefits derived from remittances of seafarers who have been
trained at the Centre, the Cost Benefit Analysis. The results of this analysis are presented as the Net
Present Value (NPV) of discounted benefits minus costs. The cashflows of the CBA are then used in
the EIA to generate the economic multipliers, Gross Output and Value added for the wider economy.
Initially the assignment was to undertake the analysis from 1984 until the present day (the period of
New Zealand’s assistance) however lack of data led to a revision of the project life to the period from
1995 to 2012. Prior to 1995 manual record keeping meant that most of the information required had
been lost or difficult to retrieve within the timeframe allowed.
2. Cost Benefit Analysis
2.1 Trainee Numbers During the period of New Zealand’s assistance from 1984 to 2012 the number of seafarers starting
mainstream courses at MTC has totalled 3,562. In any one year trainee numbers have averaged 127
and varied from a low of 39 in 1986 to a high of 202 in 1997. Over the same period the number of
graduates has totalled 2,127, which is a pass rate of 60%. The average number passing per year is 76,
with a low of zero in 2001 and a high of 155 in 2002. Figure 1 highlights the trends over time. While
numbers graduating grew strongly over the period from 1984 to 1997 since then average numbers
have remained relatively constant although year-to-year variation is quite large.
The number of trainees per staff member varies from around 4 to 6 based on a core staffing level of
36.
3 Efficiency relates to the monetary returns from the investment in aid, while effectiveness relates to how well
the assistance has delivered on its objectives.

KIR MTC CBA and EIA, FINAL May 2013
8
Figure 1. Trainees attending4 and graduating from the mainstream courses
Source: MTC
In addition to the main courses, from 2003 a number of special courses have been run for stewards,
both male and female and refresher courses (see Figure 2).
Figure 2. Numbers of trainees Graduating from Special courses run by MTC
Source: MTC
4 Seafarers refers to the number of trainees starting training
KIR MTC CBA and EIA, FINAL May 2013
9
2.2 CBA Assumptions The approach used is to compare the marginal benefits provided by remittances from seafarers
trained at the Centre with the marginal costs of running the Centre. The full costs of running the
Centre are taken into account in the cash flows over the period 1995 to 2012 including the Kiribati
government’s contribution through the national budget, New Zealand’s assistance over the period,
Australia’s more recent assistance from 2009 to 2012 and the assistance provided by South Pacific
Marine Services (SPMS), the German shipping line which employs the graduates from the Centre on
merchant ships throughout the world.
2.3 Benefits The approach to estimating marginal benefits is to assume that the average time in service of a
graduate from the Centre is 20 years5. This allows the estimation of marginal benefits by taking an
estimate of the total remittances each year based on a proportion of the annual aggregate wages of
seafarers employed by SPMS who have been trained over the period 1995 to 2012. Thus for
graduates of the 1995 year there are no benefits in 1995. In 1996 the benefit from those graduates
is equal to 1/20 of total remittances. In 1997 the marginal benefit is 1/20 of those who graduated in
1995 plus 1/20 of those who graduated in 1996. In 1998 marginal benefit is 1/20 of those who
graduated in 1995, plus 1/20 of those who graduated in 1996, and 1/20 of those who graduated in
1997.
This process continues until 2014 when it is assumed that the seafarers who graduated in 1995
retire. In each succeeding year remittances decline by 1/20 until the graduates of 2012 are assumed
to have retired, which is in 2033. Annual remittances for the period from 2013 to 2033 are assumed
to equal remittances in 2012 in real terms. The difference between total seafarer remittances and
the marginal benefit is that remittances from seafarers trained prior to 1995 and after 2012 are not
counted. In a similar way the costs of running the Centre prior to 1995 and after 2012 are also not
counted.
Figure 3 shows the total remittances recorded by the Department of Statistics, aggregate wages paid
by SPMS and estimated annual remittances of seafarers. The difference between total remittances
and remittances from seafarers is assumed to be remittances from other categories including fishers
on overseas fishing vessels, people working in the region including people on seasonal employment
in Australia and New Zealand.
5 This estimate is based on records from SPMS on the number of active seamen in service by age group.

KIR MTC CBA and EIA, FINAL May 2013
10
Figure 3. Remittances (AU$’000 in 2012 money terms)
Source: Kiribati Department of Statistics, SPMS, study estimates
In addition to official figures on remittances provided by the Kiribati Statistics Office there are end of
contract payments plus cash and gifts bought back by seafarers at the end of each contract. These
amounts are estimated to be about 20% of official annual remittances based on anecdotal evidence
provided to Maria Borovnik (2006) and study team undertaking the feasibility design for New
Zealand’s assistance to the MTC (NZMS and APMI 2003). As seafarer contracts are less than one
year, it would seem reasonable to add 20% to the official remittances figure each year to take
account of these benefits to the Kiribati economy. However, we have not been able to reconcile the
amounts produced this way with the total amount of wages paid by SPMS, which is the main
employer of MTC trainees. Given this, the estimates of remittances due to MTC trainees may be
conservative, but there is no quantitative evidence to support this view as there are no records of
trainees employed by other shipping lines or other employers such as on fishing boats.
Seafarers will no doubt retain some of their wages for out-of-pocket expenses while overseas. Again,
there is no quantitative information as to how much this would be on average or are people in the
industry prepared to hazard a guess as to what this is likely to be. In the absence of information,
quantitative or anecdotal, the assumption is made that on average 90% of wages is remitted back to
Kiribati .
The MTC has also been receiving revenue from course fees associated with refresher courses since
2007 and these are added to the benefits.
2.4 Costs
The total cost of running the MTC, including both operating and capital expenditure over
the period 1995 to 2012 has been $36.0m in 2012 dollar terms of which $18.3m (51%) was

KIR MTC CBA and EIA, FINAL May 2013
11
contributed by the Kiribati Government, $9.1m (25%) by the New Zealand Government,
$7.3m by SPMC (20%) and $1.3m (4%) by the Australian Government (see Figure 4).
Figure 4. Cost of Running the MTC by Main Contributor 1995-2012 (2012 AU$’000)
Source: Governments of Kiribati, New Zealand and Australia plus SPMS
The average cost per trainee graduating amounts to $25,723 per year (in 2012 dollar terms).
Overall costs each year varies significantly depending on whether there is an injection for
refurbishment or capital improvements (see Figure 5).
Figure 5. Annual cost per Trainee Graduating (AU$ Nominal and 2012 dollar terms)
Source: MTC, Governments of Kiribati, New Zealand and Australia plus SPMS

KIR MTC CBA and EIA, FINAL May 2013
12
The profile of the cost and benefit cashflows is shown in Figure 6. This shows how benefits build up
over time peaking in 2006 and then declining from 2016 to 2033. On the other hand costs are
relatively stable throughout the period until 2008 when large injections of capital were made under
the New Zealand program. Note that costs are counted from 1995 to 2012, while benefits start from
a very small base in 1996 and rise over the next 20 years from the steady stream of new graduates
entering the workforce. After 2015 the benefits start to decline as seafarers graduating since 1995
begin to retire. By 2033 all graduates trained between 1995 and 2012 have retired. Costs incurred
after 2012 will have a benefit for future generations of graduates and are not counted in this
analysis.
Figure 6. Benefits and Costs AU$’000 (nominal and 2012 dollar terms)
Source: MTC, Governments of Kiribati, New Zealand and Australia plus SPMS
2.5 Results Total costs (in 2012 dollar terms) over the period amount to $36.0 million with the total benefits
amounting to $120.2 million resulting in a net benefit of $84.1 million and a benefit cost ratio of 3.3.
When the benefit and cost cashflows are discounted to take into account of the time value of
money, at a 5% discount rate, total costs amount to $23.7 million and total benefits $56.3 million
brought resulting in a net benefit (NPV) of $32.7 million and a benefit cost ratio of 2.4. Discount
rates of 2%, 5% and 8% have been used to straddle a range moving from a social discount rate to
one that is more attuned to the return expected on capital investments in the private sector (see
Table 1).

KIR MTC CBA and EIA, FINAL May 2013
13
The Kiribati government provided 51% of total costs, New Zealand government 25%, SPMS 20% and
the Australian government 4%.
Table 1. Result of the CBA at varying discount rates (A$m, 2012 prices)
Discount rate 0% 2% 5% 8%
Total costs 36.0 30.1 23.7 19.1
Total Benefits 120.2 86.7 56.3 38.8
NPV 84.1 56.6 32.7 19.6
B/C ratio 3.3 2.9 2.4 2.0
The criterion of a positive net benefit to the economy is that the NPV is greater than zero and the
benefit cost ratio is greater than one. Clearly the MTC has a positive net benefit to the economy. The
cost benefit analysis provides an indicator of the efficient use of scarce resources. In contrast the
economic impact analysis highlights where in the benefits and costs are distributed in the economy.
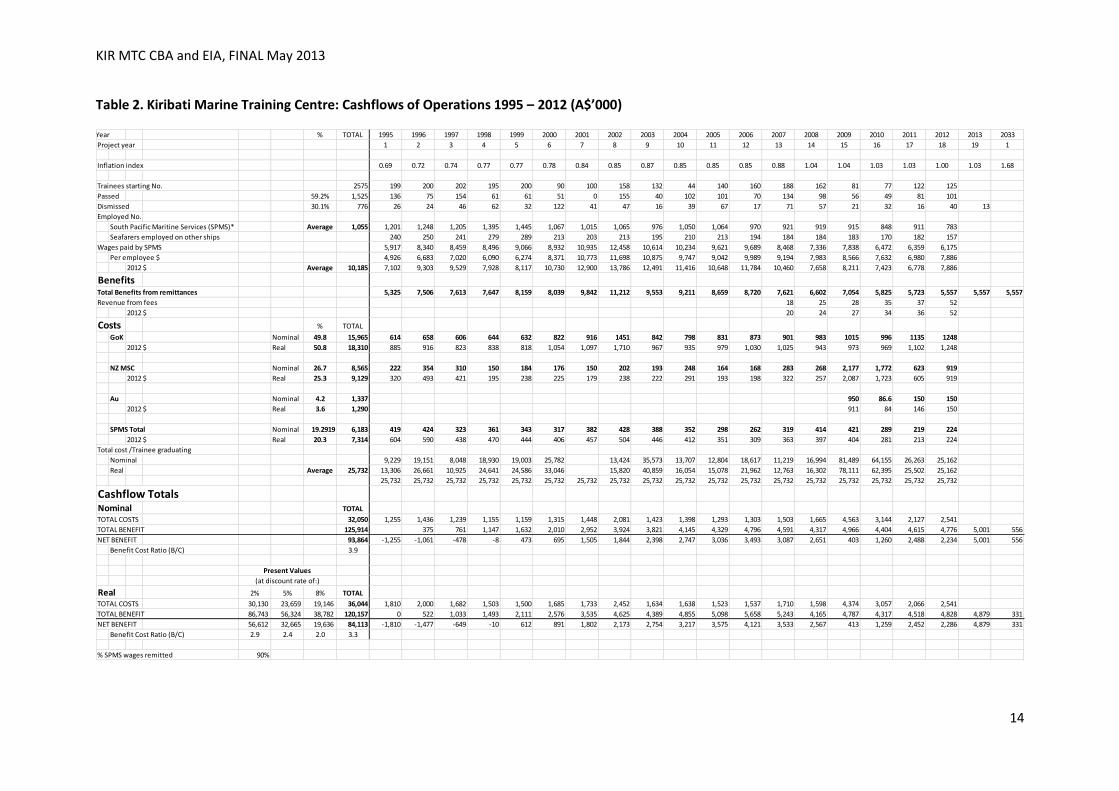
The cashflows and results are provided in Table 2.
2.6 Limitations of the analysis The key area of uncertainty in the analysis is around remittance levels due to a lack of consistent
data over the period of analysis. This is also a factor in the estimation of costs.
KIR MTC CBA and EIA, FINAL May 2013
14
Table 2. Kiribati Marine Training Centre: Cashflows of Operations 1995 – 2012 (A$’000)
Year % TOTAL 1995 1996 1997 1998 1999 2000 2001 2002 2003 2004 2005 2006 2007 2008 2009 2010 2011 2012 2013 2033
Project year 1 2 3 4 5 6 7 8 9 10 11 12 13 14 15 16 17 18 19 1
Inflation index 0.69 0.72 0.74 0.77 0.77 0.78 0.84 0.85 0.87 0.85 0.85 0.85 0.88 1.04 1.04 1.03 1.03 1.00 1.03 1.68
Trainees starting No. 2575 199 200 202 195 200 90 100 158 132 44 140 160 188 162 81 77 122 125
Passed 59.2% 1,525 136 75 154 61 61 51 0 155 40 102 101 70 134 98 56 49 81 101
Dismissed 30.1% 776 26 24 46 62 32 122 41 47 16 39 67 17 71 57 21 32 16 40 13
Employed No.
South Pacific Maritine Services (SPMS)* Average 1,055 1,201 1,248 1,205 1,395 1,445 1,067 1,015 1,065 976 1,050 1,064 970 921 919 915 848 911 783
Seafarers employed on other ships 240 250 241 279 289 213 203 213 195 210 213 194 184 184 183 170 182 157
Wages paid by SPMS 5,917 8,340 8,459 8,496 9,066 8,932 10,935 12,458 10,614 10,234 9,621 9,689 8,468 7,336 7,838 6,472 6,359 6,175
Per employee $ 4,926 6,683 7,020 6,090 6,274 8,371 10,773 11,698 10,875 9,747 9,042 9,989 9,194 7,983 8,566 7,632 6,980 7,886
2012 $ Average 10,185 7,102 9,303 9,529 7,928 8,117 10,730 12,900 13,786 12,491 11,416 10,648 11,784 10,460 7,658 8,211 7,423 6,778 7,886
BenefitsTotal Benefits from remittances 5,325 7,506 7,613 7,647 8,159 8,039 9,842 11,212 9,553 9,211 8,659 8,720 7,621 6,602 7,054 5,825 5,723 5,557 5,557 5,557
Revenue from fees 18 25 28 35 37 52
2012 $ 20 24 27 34 36 52
Costs % TOTAL
GoK Nominal 49.8 15,965 614 658 606 644 632 822 916 1451 842 798 831 873 901 983 1015 996 1135 1248
2012 $ Real 50.8 18,310 885 916 823 838 818 1,054 1,097 1,710 967 935 979 1,030 1,025 943 973 969 1,102 1,248
NZ MSC Nominal 26.7 8,565 222 354 310 150 184 176 150 202 193 248 164 168 283 268 2,177 1,772 623 919
2012 $ Real 25.3 9,129 320 493 421 195 238 225 179 238 222 291 193 198 322 257 2,087 1,723 605 919
Au Nominal 4.2 1,337 950 86.6 150 150
2012 $ Real 3.6 1,290 911 84 146 150
SPMS Total Nominal 19.2919 6,183 419 424 323 361 343 317 382 428 388 352 298 262 319 414 421 289 219 224
2012 $ Real 20.3 7,314 604 590 438 470 444 406 457 504 446 412 351 309 363 397 404 281 213 224
Total cost /Trainee graduating
Nominal 9,229 19,151 8,048 18,930 19,003 25,782 13,424 35,573 13,707 12,804 18,617 11,219 16,994 81,489 64,155 26,263 25,162
Real Average 25,732 13,306 26,661 10,925 24,641 24,586 33,046 15,820 40,859 16,054 15,078 21,962 12,763 16,302 78,111 62,395 25,502 25,162
25,732 25,732 25,732 25,732 25,732 25,732 25,732 25,732 25,732 25,732 25,732 25,732 25,732 25,732 25,732 25,732 25,732 25,732
Cashflow TotalsNominal TOTAL
TOTAL COSTS 32,050 1,255 1,436 1,239 1,155 1,159 1,315 1,448 2,081 1,423 1,398 1,293 1,303 1,503 1,665 4,563 3,144 2,127 2,541
TOTAL BENEFIT 125,914 375 761 1,147 1,632 2,010 2,952 3,924 3,821 4,145 4,329 4,796 4,591 4,317 4,966 4,404 4,615 4,776 5,001 556
NET BENEFIT 93,864 -1,255 -1,061 -478 -8 473 695 1,505 1,844 2,398 2,747 3,036 3,493 3,087 2,651 403 1,260 2,488 2,234 5,001 556
Benefit Cost Ratio (B/C) 3.9
Present Values
(at discount rate of:)
Real 2% 5% 8% TOTAL
TOTAL COSTS 30,130 23,659 19,146 36,044 1,810 2,000 1,682 1,503 1,500 1,685 1,733 2,452 1,634 1,638 1,523 1,537 1,710 1,598 4,374 3,057 2,066 2,541
TOTAL BENEFIT 86,743 56,324 38,782 120,157 0 522 1,033 1,493 2,111 2,576 3,535 4,625 4,389 4,855 5,098 5,658 5,243 4,165 4,787 4,317 4,518 4,828 4,879 331
NET BENEFIT 56,612 32,665 19,636 84,113 -1,810 -1,477 -649 -10 612 891 1,802 2,173 2,754 3,217 3,575 4,121 3,533 2,567 413 1,259 2,452 2,286 4,879 331
Benefit Cost Ratio (B/C) 2.9 2.4 2.0 3.3
% SPMS wages remitted 90%

KIR MTC CBA and EIA, FINAL May 2013
15
3. Economic Impact Analysis
3.1 Economic impact of the Marine Training Centre To measure the economic impact of the MTC on the Kiribati economy for the period between 1995
to 2012 Input-Output (IO) analysis was used. A Marine Training sector was constructed within the
model to measure the impact of expenditure by the MTC and the impact of seafarer remittances on
the economy. The combined value added of remittances and the operation of the MTC amounted to
3.4 per cent of the Kiribati’s GDP for 2010.6 It should be noted that in strict economic impact terms,
remittances, which embody the facilitated effects of the MTC through employment training, have a
significantly larger economic effect (6.75 times greater impact) than the operational impacts of the
MTC. As training generates income streams for the graduates throughout their working lives, the
benefits or effects of training in the period up to 2012 will continue into the future, for the duration
that the graduates have a seafaring career. These time lags were factored into the analysis. This
report presents a summary of the method used to calculate the economic impact of the MTC along
with the results of the study.
Due to data limitations employment impacts are not able to be estimated. Available employment
data only covers the formal (cash) economy and is therefore incompatible with the IO which covers
both the formal and informal (subsistence) sectors. Also, the employment breakdown is even more
aggregated than the IO sectors (8 vs 13); so, the aggregation bias would be very significant – leading
to substantial over-estimation of the employment impacts (probably 20-40%). So, overall, the data
is really not up to any analysis.
3.2 Methodology
3.2.1 Input-Output Analysis
This analysis of the economic impacts of the MTC is undertaken through a modelling framework that
is primarily based on Input-Output (IO) analysis (Miller and Blair, 2009). One of the core strengths of
IO analysis is that it captures the complex interactions and interdependencies occurring between
different sectors within an economy. An IO model has a set of data that measures the flows of
money or goods among various sectors or industrial groups within an economy, for a given year.
This means that it is possible to consider the vast number of the ‘indirect’ and ‘induced’ flow-on
effects that occur throughout an economy as a result of economic change. In this study, we use IO
analysis to measure how expenditure by the MTC impacts and flows onto other industries, either:
Directly – i.e. by creating employment and other value added within the MTC itself, and
by funding additional demands for goods and services through remittances;
Indirectly – i.e. by leading to economy-wide increases in the production of goods and
services in order to support the supply chains of those industries impacted directly;
6 Note, this figure is significantly less than the previously reported (ADB, 2000) remittances constituting 15 per cent of GDP. The Asian Development Bank figure represents the total nominal monetary value of remittances as a proportion of GDP, rather than the value added component of the remittances. Value added is calculated as output minus intermediate consumption (refer to National Statistics Office and Ministry of Finance, (2011) for details on the construction of the Kiribati National Accounts).
KIR MTC CBA and EIA, FINAL May 2013
16
By way of induced impacts – i.e. by leading to increased money (incomes) within the
economy, which is then re-spent on more goods and services produced by the economy.
It is important to note that only crude input-output tables could be constructed for Kiribati given the
available data and budgetary constraints. Market Economics are globally leading experts in the
application of Input-Output methods. This includes publication of several internationally recognised
peer reviewed journal publications and practical experience in undertaking more than 200 Economic
Impacts Assessment for major public and private clients. This includes completion of several of the
largest nationally significant EIAs undertaken within the New Zealand: the 1999, 2003 America’s Cup
official assessments, 2011 Rugby World Cup official assessment, and assessment of the Christchurch
earthquake series. Based on this experience Market Economics has endeavoured to develop input-
output 1995, 2000, 2005 and 2010 tables for the Kiribati economy based on representative technical
coefficients. These tables must, however, be treated as tentative estimates due to the severe
paucity of national account data available to construct the tables.
3.2.2 Multiplier Analysis
A major extension of EIA and input-output analysis is the derivation of multipliers. The concept of a
multiplier is that it is possible to effectively measure how a particular sector or industry is integrated
with the rest of the economy. Multipliers can be seen as a set of simple mathematical relationships
between one industry and the rest of the economy, and are used to measure the effects of a change
in one industry on the overall economy. For example, if the demand for training increases
significantly, the MTC (when unconstrained) will respond to this demand, by increasing training. This
will require an increase in the inputs to the industries that supply the MTC, perhaps more labour
input, hiring of equipment, and supply of building maintenance services. It may also require
increasing or diversifying the labour market where graduates find employment (e.g. labour supply to
different shipping companies). If the additional remittances provided by facilitated employment
allow for Kiribati residences to, say, purchase more goods from food retailers this generates
additional demand from agricultural suppliers, and so on. There are different types of impacts
making up the multiplier effects, and are also categorised into three different types – direct, indirect
and induced. Multipliers are based on coefficients derived from the input-output transactions
table.7 The set of multipliers for the Kiribati economy can thus show the effect on the economy if
there were changes to either the level of funding given to the MTC or to the wages that are
repatriated from graduates of the MTC, once they secure employment.
A type I multiplier measures the ratio of direct and indirect backward linkage impacts relative to the
direct impacts:
Type I Multiplier = Direct Effect + Indirect Effect Direct Effect
A Type II multiplier captures the direct, indirect and induced impacts taking into account consumer
expenditure in the economy, stimulated by increased incomes. Again these impacts are expressed
relative to the direct impact:
7 Input-output analysis is based on average impacts. It maintains a set of assumptions about constant and
uniform proportions of expenditure in the different sectors, and these are reflected in the multipliers.
KIR MTC CBA and EIA, FINAL May 2013
17
Type II Multiplier = Direct Effect + Indirect Effect + Induced effect Direct Effect
The greatest challenge for this report was obtaining data on the Kiribati economy to construct the IO
model from which the multipliers are derived. Technical details of how the Kiribati IO was
constructed are given in Appendix 1, but a number of salient points and assumptions underpinning
our analysis are detailed here.
3.3 Key Assumptions The basis of an IO model is the Transactions Table for the economy, showing what each industry
buys from the other industries. No official Transactions Table was available for Kiribati, so one was
constructed assuming that the Kiribati economy is structurally similar to that of Samoa (Appendix 1),
that is, the industries purchase goods from each other in a similar manner, although the size and
scale of the industries may be different. A quadratic program was used to balance the transactions
table, ensuring that inputs equated with outputs for the Kiribati economy. Official figures on GDP
from the Kiribati National Accounts are used in the analysis. Unfortunately reliable time-series data
on employment was not available, so this analysis reports on GDP or value added figures only.
As the number of sectors or industries by which the Kiribati economy is defined is relatively few, our
IO model is subject to aggregation bias.8 The typical result of aggregation bias is some
overestimation in the size of multipliers derived from an IO model. For this reason the results of the
economic impact will be overstated, and we believe this to be in the order of between 10 and 20 per
cent. An adjustment was made to eliminate this aggregation bias. To more accurately eliminate the
problem of aggregation bias would require significant work, beyond the scope of this project.
Within the system of national accounts for Kiribati, the National Statistics Office classifies the
economy into the formal or monetary sector and the informal or subsistence/non-formal sector. The
formal sector includes all entities whose output is sold in the market. However, a significant
proportion of output comes from the informal or subsistence sector (Kiribati National Statistics
Office, 2011). The model developed for this study includes both formal and informal sectors. We feel
this strengthens the model, given the importance of the informal sector. Data triangulation, using
Kiribati’s Household Expenditure Survey, enabled us to verify the expenditure within the informal
sector.
Historical expenditure by the MTC was used to create a Marine Training Sector within the IO model
for Kiribati. That expenditure was subtracted from the totals of the parent industry (e.g. education,
health and other Community, Social and Personal Services), where it would have appeared in the
original Kiribati IO model. In so doing, the impacts of that sector can be isolated, enabling an
economic impact assessment.
The impacts of the Marine Training Sector result from the operation of the MTC itself, which include
the effects of the operating costs in the economy, and the facilitated effects of MTC graduates
securing employment and wages. It is assumed that these would not be secured in the absence of
the MTC, and remittances would not be returned to Kiribati. The economic impact was measured for
the years 1995 to 2012, although the MTC has been in operation since 1967. The reason for choice
8 Refer to Miller and Blair (2009, p160) for further explanation.

KIR MTC CBA and EIA, FINAL May 2013
18
of years was pragmatic, due to availability of data for the construction of the accounts. It is noted
that the remittances currently being returned to Kiribati may result from graduates that completed
their training prior to 1995. Adjustments were made, based on the assumption that graduates have
a 20 year working life. Therefore, the 2012 graduates are assumed to return remittances to Kiribati
until 2032. As with the practice with cost benefit analysis, the value of future income or benefit
streams are discounted, to reflect the present value of money earned in the future. As the choice of
discount rate is somewhat arbitrary, a range of discount rates were calculated to assess the
variability or sensitivity of the analysis to the rate used.
It is assumed that the remittances from seafarers are spent by households, in accordance with the
patterns of expenditure that were reported in the Kiribati Household Expenditure Survey.
3.4 Results Table 3 presents a summary of the cumulative (i.e. summed across all study years) and average (i.e.
cumulative divided by number of study years) gross output and value added impacts of the MTC, for
the period 1995 to 2012. Note that these impacts are those created from operational and capital
expenditures of the MTC over the period 1995 to 2012, along with remittances produced from
persons graduating from the MTC during that period. It therefore includes, for example, remittances
for the next twenty years from 2012 graduates.
The gross output impact is the total value of goods and services, the demand for which is created by
the MTC. The cumulative gross output impact of the MTC (including all direct, indirect and induced
impacts) over the study period is estimated as AU$2012279mil. Note, however, that value added is
typically considered a more meaningful measure for evaluating economic impacts than gross output.
It includes the value of income-related impacts (e.g. additional wages and salaries, business profits)
but excludes the value of additional intermediate goods and services. The MTC’s cumulative value
added impact for Kiribati is estimated as 2012AU$93m. This equates to an average value added
impact of AU$20122.4mil per year. To place these results in context, the average value added impact
is estimated to be around 1.0 per cent of GDP in 2010. Importantly, of the total value added impact
estimated for the study period, 8 per cent is derived from the operational and capital expenditures
of the MTC itself, and the remaining 92 per cent from remittances that are facilitated by the MTC.
Note also that if we are to assume an aggregation bias effect of around 15 per cent, the average
value added impact drops from AU$20122.4mil to AU$20121.9mil

KIR MTC CBA and EIA, FINAL May 2013
19
Table 3. Cumulative and Average net Economic Impacts of the Marine Training Centre,
1995 to 2012 (without discounting)
It is standard practice in assessing economic benefits and costs to discount benefits and costs that
occur in the future, and inflate benefits and costs occurring in the past. This accounts for the lower
perceived value of benefits occurring in the future, compared with benefits occurring today, due to
factors such as risk. Additionally, benefits (incomes) can be invested to earn interest, and so the
earlier a benefit is obtained the better. Table 4 shows the discounted cumulative and average net
economic impacts of the Marine Training Industry, for the period 1995 to 2012. Three discount rates
are investigated, 2 percent, 5 per cent and 8 per cent. The preferred discount rate is 5 per cent.
Note that the discounted net impacts are greater than the net economic impacts (Table 1) because a
significant proportion of our study period occurs in the past, leading to inflated benefits. Applying
the 5 per cent discount rate, the average value added impact is estimated as AU$20123.0mil, or
AU$20122.4mil assuming an aggregation bias effect of 15 per cent.
Table 4 additionally shows the way in which gross output and value added impacts of MTC are
distributed through time. As already stated, the system boundary for our analysis includes
remittances generated out to the end of the working life of 2012 graduates, but only includes
operational and capital expenditures of the MTC from 1995 to 2012. Not surprisingly, the year with
the highest impact is 2012, as it this point there are a significant number of MTC graduates and we
are also capturing direct activities of the MTC itself.
Gross Output1 Value Added1 Gross Output1 Value Added1
$2012AU mil $2012AU mil $2012AU mil $2012AU mil
Direct 141 45 3.6 1.2
Indirect 126 44 3.2 1.1
Induced 13 4 0.3 0.1
TOTAL 279 93 7.2 2.4
Cumulative Net Average Net
1. This includes the economic impacts of both the operation of the MTC and the seafarer remittances for MTC
graduates . Note it i s assumed that remittances are received from seafarer's for the 20 years fol lowing
graduation. Thus , a seafarer graduating in 2012 is assumed to receive remittances for the period 2013 through
2033.

KIR MTC CBA and EIA, FINAL May 2013
20
Table 4. Discounted Cumulative and Average Net Economic Impacts of the Marine Training
Centre, 1995 to 2012
Table 5. Economic Impacts of the Marine Training Centre for Selected Years
Economic multipliers are used to measure how expenditure in one economic industry sets in motion
or stimulates activity in parts of the economy. The Type I Value Added multiplier for the MTC
calculated from Table 3 above is 1.98. That means, for every $1 of value added generated by
remittance expenditure and expenditure by the MTC, an additional $0.98 of value added is
generated in the Kiribati economy as a result of the upstream supply chains. The Type II Value Added
multiplier from Table 1 (which is a Type I plus the induced effects) is calculated as 2.07. These
multipliers are consistent with those calculated for other sectors of the Kiribati economy (mainly
ranging between 1 and 2).
Gross Output1 Value Added1 Gross Output1 Value Added1
$2012AU mil $2012AU mil $2012AU mil $2012AU mil
2% Discount rate
Direct 177 60 4.5 1.5
Indirect 135 49 3.5 1.3
Induced 15 5 0.4 0.1
TOTAL 327 114 8.4 2.9
5% Discount rate
Direct 180 61 4.6 1.6
Indirect 136 50 3.5 1.3
Induced 15 5 0.4 0.1
TOTAL 331 116 8.5 3.0
8% Discount rate
Direct 183 62 4.7 1.6
Indirect 138 51 3.5 1.3
Induced 15 5 0.4 0.1
TOTAL 336 118 8.6 3.0
Cumulative Net Average Net
1. This includes the economic impacts of both the operation of the MTC and the seafarer remittances for MTC
graduates . Note i t i s assumed that remittances are received from seafarer's for the 20 years fol lowing
graduation. Thus , a seafarer graduating in 2012 is assumed to receive remittances for the period 2013 through
2033.
1995 2000 2005 2010 2012 20151 20201 20251 20301
$2012AU mil $2012AU mil $2012AU mil $2012AU mil $2012 AU mil $2012AU mil $2012AU mil $2012AU mil $2012AU mil
Gross Output
Direct 0.9 3.7 6.1 5.7 6.0 5.1 3.4 2.0 0.9
Indirect 0.6 1.7 3.8 6.0 6.3 5.8 3.8 2.3 1.0
Induced 0.1 0.3 0.4 0.6 0.6 0.5 0.3 0.2 0.1
TOTAL 1.6 5.6 10.4 12.3 12.9 11.4 7.6 4.5 2.0
Value Added
Direct 0.4 1.4 2.0 1.8 1.9 1.5 1.0 0.6 0.3
Indirect 0.3 0.7 1.5 2.1 2.2 1.9 1.3 0.8 0.3
Induced 0.0 0.1 0.1 0.2 0.2 0.2 0.1 0.1 0.0
TOTAL 0.7 2.2 3.6 4.0 4.3 3.5 2.4 1.4 0.6
1. The years 2015, 2020, 2025 and 2030 represent only the impacts associated with seafarer's remittances received from seafarer's graduating in, or before,
2012.
KIR MTC CBA and EIA, FINAL May 2013
21
Another way to consider the economic impact of the MTC is to compare the value added impact of
the MTC with the costs of running the MTC. This is similar to the measures provided in the last
paragraph except that the direct measure is all operational and capital expenditures rather than just
value added. Furthermore, remittances are excluded from the direct impacts as these are facilitated
out of the operational and capital expenditure of the MTC. Over the entire study period, it is
estimated that for every AU$20121 invested in operating the MTC, on average AU$20124.9 (or
AU$20124.0 accounting for aggregation bias) is generated in value added through direct, indirect and
induced impacts, including the impacts from remittances.
References ADB, 2009. Kiribati’s political economy and capacity development. Mandaluyong, Asian
Development Bank.
Bedford, R. 2009. International migration in Kiribati and Tuvalu: A context for evaluating the impact
of global warming on population movement in atoll territories," Motu Public Policy Seminar,
Wellington, March 2009. Accessed on April 7th 2013 from
http://www.motu.org.nz/publications/detail/wellington_seminar_March09
Borovnik, M. 2006. Working overseas: Seafarers’ remittances and their distribution in Kiribati. Asia Pacific Viewpoint, Vol. 47. No 1. Jensen, R. and West, G. 1986. Input-output for practitioners: theory and applications. Issue 1 of Australian regional developments, Rodney Charles Jensen. Miller, R. and Blair, D. 2009. Input-Output Analysis: Foundations and Extensions. Cambridge: Cambridge University Press. 2nd Edition. National Statistics Office and Ministry of Finance, 2011. Kiribati National Accounts. The Production Account and GDP. NZAID, 2003. NZAID Support for the Kiribati Marine Training Centre. Feasibility Design Study. August 2003. Tekana Tiroa, 2006. Analytical report on the 2006 Kiribati HIES. National Statistics Office Kiribati

KIR MTC CBA and EIA, FINAL May 2013
22
Appendix 1. Technical Construction of Input Output Tables for
Kiribati In order to analyse the economic impact of the Marine Training Centre, the following data sources
were used:
Kiribati National Accounts: The Production Account and GDP, 2011.
Kiribati Household Income and Expenditure Survey 2006.
Asian Development Bank’s Balance of Payments for Kiribati
International Labour Organisation employment data (although lack of detailed time series
data limited the usefulness of this data)
Samoa Tables for 1995, 2000, 2005 and 2010
All figures in the analysis were converted to current 2012 Australian dollar terms.
To undertake the economic impact analysis, the following steps were undertaken:
Step 1. Derivation of representative coefficients for 1995, 2000, 2005 and 2010 by 25 economic
sectors in current $US 000s
a. These tables were created as part of a global research initiative to calculate trade,
environmental footprints and conduct multi-regional input-output studies. However, these
tables are only indicative of actual economic transactions. As a starting point for our work
the Samoa tables for 1995, 2000, 2005 and 2010 were used. As these tables were
unbalanced (i.e. inputs and outputs by industry were not in balance as required for input-
output analysis). A quadratic program was used to balance the transactions. This approach
was used as it makes the least possible change to the base table in producing the balanced
table. In technical terms, the quadratic program represents as an objective function of a
least squares optimization with total input and output by sector acting as constraints.
b. Aggregate to 13 sectors. Aggregation from 25 to 13 sectors was required to ensure
compatibility with data from the Kiribati National Statistical Office.
Step 2. Create Kiribati Input-Output Tables for 1995, 2000, 2005 and 2010 by 13 economic sectors in
current $US 000s
While the Samoa table was used as a starting point, significant adjustments were made to create a
unique Kiribati input-output table for the reference years.
a. Create Samoa technical coefficients from Step 1.
b. Create Kiribati technical coefficients using a GRIT approach (refer to Jensen and West, 1986).
Use Simple Location Quotients (SLQs) to adjust technical coefficients from Samoa to Kiribati
equivalents. SLQs were calculated for each of the 13 sectors, based on GDP series for both
countries. SLQs are calculated by measuring the proportion of Kiribati GDP in an industry
over total Kiribati GDP (all industries), divided by the proportion of Samoan GDP in an
industry over total Samoan GDP (all industries). Assumption, by industry, is if the SLQ < 1
then relative to Samoa, the Kiribati is unable to meet domestic requirements and therefore
the technical coefficients were adjusted downwards.

KIR MTC CBA and EIA, FINAL May 2013
23
c. Estimate Gross Output for Kiribati by assuming the GDP to Gross Output ratio by industry,
based on the Samoan tables.
d. Create 1st unbalanced transaction table.
e. Create 2nd unbalanced transactions table including insertion of superior Kiribati specific data
taken from Kiribati National Statistical Office and other reports, NZ government MFAT data.
In particular, official data was available for :
a. Kiribati imports and exports by total and commodity structure,
b. Kiribati household consumption by total and commodity purchase structure based
on 2006 HIES data,
c. Kiribati Government Expenditure and Income,
d. Kiribati GDP by 13 sectors,
e. Kiribati imputed rents from owner-occupied dwellings,
f. Kiribati government transfers to households and non-profit institutions.
NB: Scaling to relevant year was undertaken by accounting for population change, price
change based on CPI, and any conversion from $US to $AU using exchange rates.
f. Create balanced transactions table using a quadratic program. As above this ensured that
the transactions tables balanced using the least degree of change from the unbalanced
transactions, as necessary to ensure inputs equated with outputs.
Step 3. Economic Impact Assessment
a. Convert 13 sector Kiribati IO table created in Step 2 into $AU 000s.
b. Create a Marine Training Industry within the table, by coding MTC operation costs by
accounting category to IO13 sector and insert into 13 sector IO table.
c. Include MTC as a sector directly in derived IO table, by subtracting totals from parent
industry (Education, Health, and Other Community, Social and Personal Services).
The MTC had a total budget of Au$1.25m in 2012, a doubling from the Au$0.6m budget
in 1995. In 2012, this expenditure paid for Primary Inputs (35%), was spent on Wholesale
and Retail trade (29%), Electricity, Gas and Water (11%), Education Health and Other
Community Services (9%), Imports (7%), Transport and Storage (5%), Financial
Intermediation and Business Services (3%) and Communications (1%). There were no
links between the MTC and (or purchases from) the primary industries of Agriculture and
Fishing, nor any links to the secondary industries of Manufacturing and Construction.
d. Remittances from graduates of the MTC contributed significantly more to the Kiribati
economy than the operation of the MTC itself.
e. Derive input-output inverses and multipliers.
f. Derive net final demand vectors for the years 1995 to 2032. These include operation of
the MTC 1995 through to 2012, and the seafarer’s remittances for the period 1995 –
2033.
NB: As per Nimmo Bell it is assumed that seafarer’s provide remittances throughout
their working lives. A 20 year working life is assumed i.e. the 2012 graduates will
continue to provide remittances until 2033.
Using net final demand, calculate gross output and value added impacts (direct & indirect –