cost-benefit analysis of raising the age of juvenile ... · pdf filecost-benefit analysis of...
TRANSCRIPT

Cost-Benefit Analysis of Raising the Age of Juvenile Jurisdiction in North Carolina
Christian Henrichson Valerie Levshin Vera Institute of Justice January 10, 2011
Cost
-Ben
efit
Anal
ysis
Uni
t

Vera Institute of Justice ii
© 2011 Action for Children. All rights reserved.
Additional copies can be obtained from the communications department of the Vera Institute of Justice, 233 Broadway, 12th floor, New York, New York, 10279, (212) 334-1300. Requests for additional information about the research described in this report should be directed to Christian Henrichson at the above address or to [email protected].

Vera Institute of Justice iii
Executive Summary In fall 2009, the North Carolina General Assembly created the Youth Accountability Planning Task Force (YAPTF) to examine whether the state should raise the age of juvenile jurisdiction from 16 to 18. In July 2010, the System Costs Work Group of YAPTF asked the Vera Institute of Justice to conduct a cost-benefit analysis of this policy change. Specifically, Vera assessed the economic impact of implementing a plan to transfer 16- and 17-year-olds who commit misdemeanor and low-level, non-violent felony offenses to the juvenile system, while keeping 16- and 17-year-olds who commit serious violent felonies in the adult criminal justice system. Between July and December 2010, Vera staff worked closely with the System Costs Work Group, the North Carolina Sentencing and Policy Advisory Commission, and the state’s justice and public safety agencies to develop a methodology and gather the necessary information for the cost-benefit analysis. The study incorporates data and reflects processes that are specific to North Carolina, while also drawing upon national research and best practices in juvenile justice. This report presents the results of the cost-benefit analysis, highlights of which are summarized below:
• Raising the age of juvenile jurisdiction from 16 to 18 for alleged misdemeanants and low-level felons will generate $52.3 million in net benefits, per annual cohort of youth aged 16 and 17, from the combined perspectives of taxpayers, victims, and youth. The “annual cohort of youth aged 16 and 17” is the total number of 16- and 17-year-old youth who are arrested during a 12-month period.
• From the taxpayer or government perspective, the policy change will generate an annual net cost of $49.2 million. The net cost equals a cost of $70.9 million to North Carolina’s justice agencies minus $21.7 million in benefits to the criminal justice system.
• From the victim perspective, raising the age will generate $3.6 million in benefits, per annual cohort of youth aged 16 and 17. Youth whose cases will be handled in the juvenile system will reoffend at lower rates than if they were processed in the adult system, thus reducing victimizations and victimization costs.
• From the youth perspective, the policy change will generate $97.9 million in long-term benefits, per annual cohort of youth aged 16 and 17. These benefits accrue over a period of 35 years and result from increased lifetime earnings, based upon the fact that youth tried in the juvenile rather than the adult system will be free of the burden of a criminal record that suppresses earning potential.
These findings rest on several assumptions that are described fully in the report. A few key assumptions are highlighted below:
• Recidivism rates among 16- and 17-year-olds handled by the juvenile justice system will be 10 percent lower than the recidivism rates of 16- and 17-year-olds currently handled by the criminal justice system.

Vera Institute of Justice iv
• Capital costs are excluded from the cost-benefit analysis and examined separately. • This analysis monetizes benefits to youth by estimating the impact on lifetime earnings
from not having a criminal record. Many intangible benefits to youth, families, and communities from the policy change could not be included in the analysis because of the difficulty of accurately placing a dollar value on intangible benefits such as improved well-being from participating in programs available within the juvenile justice system and not having the stigma of a criminal record.
In sum, the cost-benefit analysis shows that this specific plan to raise the age of juvenile jurisdiction in North Carolina will cost taxpayers $70.9 million a year and that this annually reoccurring investment will generate $123.1 million in reoccurring benefits to youth, victims, and taxpayers over the long term. These results indicate that the benefits of the plan outweigh the costs and that, from a cost-benefit standpoint, the policy change merits consideration.

Vera Institute of Justice v
Acknowledgments The authors thank the members of the System Costs Work Group of the Youth Accountability and Planning Task Force for their deep involvement and careful deliberations throughout this analysis. We are especially grateful to Representative Alice Bordsen and Senator Stan Bingham, co-chairs of the System Costs Work Group, for their commitment to this work. We also thank Susan Katzenelson and Ginny Henever at the North Carolina Sentencing and Policy Advisory Commission for their time and assistance with the data analysis, and Michelle Hall for coordinating our work with the System Costs Work Group and North Carolina’s justice agencies.
We thank our Vera Institute of Justice colleagues, including director Michael Jacobson for reviewing the analysis; Jennifer Fratello for providing expertise on juvenile justice research and practice and conducting the analysis of the juvenile data; Tina Chiu for her insight and guidance throughout this project; and Alice Chasan for editing. Special thanks go to Philip J. Cook of Duke University; Howard N. Snyder of the Bureau of Justice Statistics; and Jeffrey A. Butts of the John Jay College of Criminal Justice, City University of New York, for their helpful comments.
Funding for this study was provided by the Eckerd Family Foundation.

Vera Institute of Justice vi
Table of Contents
Background ................................................................................................................................... 1
Cost-Benefit Methodology ................................................................................................................ 2
Diagram of the Cost-Benefit Model .............................................................................................. 2 Assumptions ............................................................................................................................. 4 Estimating Costs and Benefits ..................................................................................................... 6 Comparing Costs and Benefits .................................................................................................... 9 Limitations of the Analysis ..........................................................................................................10
Summary of the Cost-Benefit Analysis ...............................................................................................10
Costs .............................................................................................................................................11
Law Enforcement ......................................................................................................................12 Courts ......................................................................................................................................12 Juvenile Justice: Operating Costs ................................................................................................15 Juvenile Justice: Capital Costs.....................................................................................................16
Benefits .........................................................................................................................................17
Criminal Justice System ..............................................................................................................18 Victims .....................................................................................................................................19 Youth .......................................................................................................................................20
Conclusion .....................................................................................................................................21
Appendix A: Youth Accountability and Planning Task Force, System Costs Work Group ..........................22
Appendix B: System Costs Work Group Discussions of the Cost-Benefit Analysis ....................................23
Appendix C: Marginal Costs ..............................................................................................................24
Appendix D: Costs and Benefits to the Justice System, Supporting Tables ............................................32
Appendix E: Victim Benefits Calculations ...........................................................................................35
Appendix F: Youth Benefits Calculations ............................................................................................36
Appendix G: Sensitivity Analysis .......................................................................................................37
Appendix H: Taxpayer Cost and Benefits by Annual Cohort of Youth ....................................................41

Vera Institute of Justice 1
Background
Beginning in the 1970s, increasing crime rates among adolescents led many states to pass laws that brought youth under the age of 18 under the jurisdiction of the adult court. Since then, many states have reversed their decisions, raising the age of juvenile jurisdiction back to 17 or 18.
Today, North Carolina remains one of two states that process any offense committed by 16- and 17-year-olds in the adult system. In recent years, however, there has been a growing call for raising the state’s age of juvenile jurisdiction so that adult jurisdiction begins at age 18 rather than 16. As in other states, the impetus for these efforts arose from recent research that demonstrates cognitive and behavioral differences between adolescents and adults; an emerging national consensus regarding the necessity to handle youth cases in a manner that addresses these differences in their development; and a greater awareness of the adverse effects that a criminal conviction will have on youth for the duration of their lives.
Recent developments in neuroscience suggest that teenagers are neither competent to stand trial under the same circumstances as adults nor are they as culpable for their actions. For example, brain imaging studies show that teenagers, whose brains have not fully developed, take longer to judge something to be a bad idea.1 Other studies have confirmed significant differences in the cognitive processing of adolescents that affect their ability to make sound judgments.2
These findings have led to an emerging national consensus that youth under age 18 are less culpable because they do not fully comprehend the consequences of their actions and thus require a different response from the justice system. A 2005 Supreme Court decision outlawing the death penalty for anyone younger than age 18 encapsulates this consensus. In Roper v. Simmons, the court noted that “from a moral standpoint it would be misguided to equate the failings of a minor with those of an adult, for a greater possibility exists that a minor’s character deficiencies will be reformed . . . . For the reasons we have discussed . . . a line must be drawn. . . . The age of 18 is the point where society draws the line for many purposes between childhood and adulthood.”
3
Last, but not least, handling 16- and 17-year-olds in the adult criminal justice system imposes a cost on their future ability to succeed academically, professionally, and financially, since a criminal record will restrict their ability to obtain financial aid for college, find jobs, vote, and apply for public benefits. Research also suggests that youth who have been confined in adult facilities are more likely to reoffend than those who have spent time in juvenile institutions.
In fall 2009, the North Carolina General Assembly created the Youth Accountability Planning Task Force (YAPTF) to examine whether the state should raise the age of juvenile
1 A.A. Baird, J.A. Fugelsang, and C.M. Bennett, “What Were You Thinking?” Available at http://faculty.vassar.edu/abbaird/research/projects/goodidea2.php [last visited December 30, 2010]. 2 Laurence Steinberg and Elizabeth Scott, “Less Guilty By Reason of Adolescence: Developmental Immaturity, Diminished Responsibility, and the Juvenile Death Penalty,” American Psychologist 58 (2003). 3 543 U.S. 551, 569-70, & 574 (2005).

Vera Institute of Justice 2
jurisdiction.4 In July 2010, the System Costs Work Group of YAPTF asked the Cost-Benefit Analysis Unit at the Vera Institute of Justice to examine both the costs and the benefits of this policy change. Specifically, Vera assessed the economic impact of implementing a plan to transfer 16- and 17-year-olds who commit misdemeanor and low-level, non-violent (F-I) felony offenses to the juvenile system, while keeping 16- and 17-year-olds who commit serious violent (A-E) felonies in the adult criminal justice system.5
The report begins with a description of the methodology we used for the cost-benefit analysis and outlines the conceptual framework for the cost-benefit model as well as the policy assumptions that we made. It next provides a summary of the costs and benefits of the policy change and then describes the estimated costs and benefits to taxpayers, as well as victims and youth. Additional details, such as the calculation of unit costs, the sensitivity analysis, and supporting tables, are in the appendices.
This analysis benefited from the input and guidance of the System Costs Work Group, which provided us with feedback on data and our analytic approach and helped us to arrive at a consensus on the central assumptions of the cost-benefit analysis.6
Cost-Benefit Methodology In this section we discuss the conceptual framework for the cost-benefit analysis, the general assumptions used in the model, the methodology for estimating costs and benefits, and the comparison of costs and benefits. We also discuss the limitations of the analysis.
Cost-benefit analysis (CBA) is a tool used by decision makers to weigh the pros and cons of potential investments. This CBA assesses the costs and benefits of raising the age of juvenile jurisdiction from the perspectives of taxpayers, victims, and youth. The taxpayers’ perspective examines how much this policy change will cost government agencies and the extent to which this cost will be offset by taxpayer benefits and potential budgetary savings. The victims’ perspective addresses the effect of the policy change on reducing crime and the impact that will have on the associated victimization costs. The youth perspective captures the impact on a young person of being tried in the more treatment-oriented juvenile justice system rather than in the more punitive environment of the adult criminal justice system. Diagram of the Cost-Benefit Model Our analysis captures the cost of the policy change and the ensuing benefits of raising the age for an annual cohort of 16- and 17-year-old youth. Figure 1 outlines the conceptual model for this
4 Session Law 2009-451, Senate Bill 202. 5 Under the plan, violent (A-E) felony cases will originate in the juvenile court, but they will be subsequently transferred to the adult court 6 A list of work group members and the schedule of meetings and agendas are provided in appendices A and B.

Vera Institute of Justice 3
analysis. Arrests, shown at the top left, represent the starting point of justice system expenditures.
Figure 1: Diagram of the Cost-Benefit Model
We thus begin our analysis by estimating the impact of the policy change on law enforcement, followed by its impact on the courts. We then assess how much the policy change will cost the juvenile justice system, which oversees juvenile detention, juvenile residential care, and community programs for youth. Next, we consider how the policy change will affect the workload of the adult system, which will no longer be responsible for 16- and 17-year-olds. The difference in the additional costs to law enforcement, courts, and juvenile justice, and the benefits to the adult system represents the net taxpayer cost. An analysis limited to the impact on the government budget would end here, but the cost-benefit model continues by estimating the future benefits of raising the age. We calculate some of these future benefits based on an anticipated reduction in recidivism. We estimate the number of crimes that will be avoided and the resulting benefits to victims in avoided victimization costs and to taxpayers in reduced justice system expenditures associated with investigating and prosecuting crimes. We also examine the benefits that will accrue to youth affected by this policy
Arrests
Taxpayer Benefits
Total Benefit/
Cost
Adult Justice System Benefit
Law Enforcement and Courts
Cost
Juvenile Justice SystemCost
Youth BenefitsYouth
Benefits
Victimization Reduction Benefit
Victim Benefits
Net Taxpayer Costs
Reduction in Adult Criminal Justice Expenses Benefit
Cost of thePolicy Change
Future Benefits
Recidivism Reduction

Vera Institute of Justice 4
change, the most tangible benefit being an increased opportunity for future earnings by not having a criminal record. The cost of the investment reoccurs on an annual basis, as each year another cohort of 16- and 17-year-olds enters the juvenile justice system. The benefits of the policy change accrue for each cohort of 16- and 17-year-olds. The taxpayer and victim benefits, for each annual cohort, are realized two to four years after the investment, and the youth benefits occur over 35 years after the investment. Assumptions Performing a cost-benefit analysis of a large-scale policy change requires making several assumptions. In raising the age of juvenile jurisdiction, we worked with the System Costs Work Group to arrive at a consensus on the central assumptions of the cost-benefit analysis, including how 16- and 17-year-olds would be handled in the juvenile justice system, how the new policy would affect the future offending behavior of the affected youth, and which benefits to include in the analysis.7
These and related assumptions are detailed below.
• Number of 16- and 17-year-olds arrested. This analysis assumes that if the state of North Carolina raises the age of juvenile jurisdiction, the initial number of 16- and 17-year-olds who are arrested and treated as juveniles will be the same as the number of 16- and 17-year-olds who are currently arrested on misdemeanors and low-level, non-violent felony (F-I) offenses and treated as adults (about 30,500). In the years subsequent to the policy change, the number of 16- and 17-year-olds arrested will decline based on a reduction in youth recidivism, which is discussed below.8
• Impact of the policy change on the number of younger juveniles arrested. This analysis assumes that raising the age of juvenile jurisdiction will not affect the number of arrests of young people ages six to 15 who are currently defined as juveniles.
• Probability of juvenile justice resource use. This analysis assumes that the likelihood that arrests of 16- and 17-year-olds will result in court processing, detention, residential commitment, or community supervision will be the same as that of younger juveniles, as there is no evidence to support that the juvenile justice system will arrest, prosecute, and adjudicate older juveniles differently than younger juveniles. The only changes we assume in juvenile justice resource use for 16- and 17- year-olds are higher rates of referrals to diversion programs, as discussed below.
• Rate of referrals to Juvenile Crime Prevention Council (JCPC) programs. The model assumes that, after the policy change, 30 percent of juvenile arrests of 16- and 17-year-olds will be referred to JCPC programming. This is the proportion of juvenile arrests
7 A list of work group members and the schedule of meetings and agendas are provided in appendices A and B 8 Sixteen- and 17-year-olds arrested for A-E felonies will initially be processed in the juvenile system and then transferred to the adult criminal justice system. We assume that the number of young people arrested on these charges (about 1,000 currently) will remain the same after the policy change.

Vera Institute of Justice 5
that JCPC currently serves. The use of JCPC programming contributes to the low rate of juvenile commitment to Youth Development Centers (YDCs).9
• Rate of referrals to alternative-to-detention programs (ATD). The cost-benefit model assumes that, after the policy change, 30 percent of 16- and 17-year-olds who would be detained will instead be referred to an ATD program. This assumption is based on the work group’s guidance that the juvenile system should use the least restrictive option and should reserve pretrial detention for youth who have the highest risk of re-arrest prior to court disposition or of failure to appear in court. The authors selected the rate of 30 percent because it reflects an aggressive, yet attainable, diversion effort to minimize the use of detention. A sensitivity analysis in Appendix G presents alternative cost-benefit results that are based on different diversion rates.
• Rate of referrals to alternative-to-placement programs (ATP). The cost-benefit model assumes that, after the policy change, 30 percent of 16- and 17-year-olds who would be committed to a residential YDC will instead remain at home or in their communities, and be placed in an ATP program. This assumption is also based on the work group’s guidance that the juvenile system should use the least restrictive option and should reserve confinement for the most serious and chronic offenders. The authors selected the rate of 30 percent because it reflects an aggressive, yet attainable, diversion effort to minimize the use of commitment. A sensitivity analysis in Appendix G presents alternative cost-benefit results based on different diversion rates.
• Effect of the juvenile justice system on recidivism. This analysis assumes that the recidivism rates for rearrest, reconviction, and reincarceration among 16- and 17-year-olds handled by the juvenile justice system will be 10 percent lower than the recidivism rates of 16- and 17-year-olds currently handled by the criminal justice system. This conservative assumption is based on recent literature showing that recidivism rates are lower in the juvenile system than in the adult system. For example, a literature review conducted by the Centers for Disease Control and Prevention found “strong evidence” that juveniles tried in adult courts have higher recidivism rates than those tried in juvenile court, with a median difference of 34 percent.10
• Jurisdiction of subsequent offenses. The analysis assumes that, after the policy change, 16- and 17-year-olds who re-offend will be handled in the criminal justice system because of the proximity of their age to the age of adult jurisdiction. That is, 16- and 17-year-olds will likely turn 18 before they commit their next offense.
A sensitivity analysis in Appendix G presents alternative cost-benefit results based on different recidivism rates.
9 In addition to serving court-involved youth, JCPC programs also serve other youth who are referred by schools and other institutions. Because this cost-benefit study focuses on a policy change that affects youth who are charged with juvenile offenses, we only estimate the additional costs that JCPC will incur to handle more court-involved youth. 10 Centers for Disease Control and Prevention, Task Force on Community Preventive Services, “Effects on Violence of Laws and Policy Facilitating the Transfer of Juveniles from the Juvenile Justice System to the Adult Justice System,” American Journal of Preventive Medicine (April 2007): p.S14, available at http://www.cdc.gov/mmwr/pdf/rr/rr5609.pdf.
Vera Institute of Justice 6
• Monetizing youth benefits. The only youth benefit included in the model is the benefit of greater future earnings from not having a criminal record. We did not measure benefits to youth resulting from increased access to treatment and vocational programs within the juvenile system because of insufficient data on the impact of these programs on youth’s health or well-being. We also did not measure the intangible benefits of the proposed change, such as removing the stigma of criminal conviction and the deprivation of voting rights for people convicted of a felony.
• Family and community benefits. Other stakeholders, such as the families of youth and communities at large, will benefit from the policy change. Families will benefit, for instance, by avoiding the stigma of their child’s involvement in the criminal justice system. We recognize benefits to families and communities as important but have not included them in the analysis because they cannot be accurately monetized.
• Capital costs. A supply of “off-line,” i.e., unused, capacity in the Youth Development Centers (YDC) could be used to serve 16- and 17-year-old juvenile offenders. Because the required capital costs remain in question, we omitted these costs from the cost-benefit model and discuss them separately. If capital costs were included in the cost-benefit model, they would only have a modest impact on the total net benefit of the policy change. We discuss this particular scenario in a sensitivity analysis in Appendix G.
Additional assumptions are discussed in the sections on costs and benefits. Estimating Costs and Benefits As illustrated in the diagram of the cost-benefit model (Figure 1), we estimated costs and benefits from the perspective of taxpayers, victims, and youth based on the assumptions detailed in the previous section. In this section, we discuss specific details of how we estimated costs and benefits for each perspective. Taxpayers. How much will raising the age cost state agencies, and how much will the policy change generate in savings and other benefits? To answer this question, we examined how raising the age will affect each component of the state’s juvenile and criminal justice system. These components include law enforcement, courts, juvenile detention, juvenile correctional institutions, and community-based programs for youth, jails, prisons, and probation.
To project the additional cost that justice agencies will incur as a result of the policy change, we estimated the cost to each component of the juvenile justice system of handling one individual and applied this cost to the number of 16- and 17-year-olds who will reach each stage of the system. To estimate justice system costs, we used marginal, rather than average, costs of each part of the system.
Marginal costs describe how the cost of an operation changes when workload levels change. Average costs include both marginal and fixed costs, which typically do not change as workload
Vera Institute of Justice 7
changes. For example, if 100 fewer people are sent to prison, the corrections department would be able to save immediately on variable costs such as food, clothing, and some medical expenses. Fixed costs, however, like rent, utilities, and executive management salaries will not be affected.11
To estimate how many 16- and 17-year-olds will reach each system component, we analyzed how individuals currently flow through the state’s justice agencies. We then estimated the proportions of all arrests that result in court processing, referral to community-based programs, placement in detention centers, and sentencing to correctional facilities.
Using average costs in cost-benefit analysis is common, but this practice overstates costs because fixed expenses do not change when the inmate population declines. In contrast to average costs, marginal costs reflect only those costs that increase or decrease as workload changes, and thus provide a better measure of the cost-savings that crime reduction can generate. The marginal costs and benefits used in this analysis are provided in Appendix C.
To determine the impact of expanding juvenile jurisdiction for an annual cohort of youth, we multiplied marginal costs by the number of individuals that reach each stage of the system and, if applicable, by the average length of stay. For example, we multiplied arrest costs by the number of arrests; court costs by the number of court cases; and jail costs by the number of incarcerations and the average length of stay in jail.
Changing the age of jurisdiction will add to the workload of juvenile justice agencies; at the same time, it will reduce the workload of some criminal justice agencies. We assess the value of this workload reduction by estimating the marginal cost of each criminal justice system component and the number of 16- and 17-year-olds who will no longer need to be in that component. We also assess the reduction in future criminal justice expenditures due to the reduction in recidivism that the policy change is expected to produce. It is important to note that these benefits may not necessarily translate into budget savings, as agencies may use these funds to fill existing gaps or meet other needs. We count these benefits nonetheless because they represent a positive outcome that offsets the cost of the investment.
Victims. Research shows that placing 16- and 17-year-olds under the jurisdiction of the juvenile system and increasing the availability of high-quality programs will likely reduce recidivism rates among these youth. As recidivism decreases, so does victimization. This cost-benefit analysis estimates the avoided victimization costs that will result from raising the age of juvenile jurisdiction in North Carolina.
Crime often imposes substantial costs on victims. Some victims incur direct out-of-pocket expenses, such as medical costs and the value of stolen property. Others suffer physical injuries or endure psychological pain. As crime decreases, fewer people incur the costs associated with crime. Over the past few decades, researchers have developed methods to place a dollar value on the monetary and the non-monetary costs of crime. One recent study by McCollister et al. uses the most current data available to estimate the victimization costs of serious crimes such as 11 To the extent there is an appreciable reduction in the inmate population, fewer staff would be necessary to oversee the reduced population, and larger reductions might allow for the closure of a housing unit.

Vera Institute of Justice 8
murder, rape, robbery, aggravated assault, burglary, larceny, and motor vehicle theft.12 To estimate the monetary costs, it uses the cost-of-illness approach, which measures medical expenses, cash loss, property theft or damage, and lost earnings that result from injury and other victimization-related consequences. Another study, by Mark Cohen, provides victim costs for less serious crime categories, such as fraud, vandalism, and simple assault.13
This analysis draws on McCollister’s and Cohen’s studies to estimate the victim benefits of raising the age in North Carolina. However, these studies present victim costs by crime categories, not by offense levels, which we use in our analysis. Therefore, we examined the types of crimes that are typically considered misdemeanors and low-level felonies in North Carolina in order to assign victim costs to each. We assume that an average F-I felony has a victim cost of $4,000, based on the studies’ victim cost estimates for crimes such as aggravated assault ($8,700), simple assault ($4,500), motor vehicle theft ($6,114), and robbery ($3,299). We also assume that an average misdemeanor has a victim cost of $500, based on the victim cost estimates of vandalism ($370), larceny ($450), fraud ($1,100), and theft ($480).
We compute the victim benefits of expanding juvenile jurisdiction using the victim cost estimates described above and the impact of the reform on recidivism rates. The general approach is to multiply the victim costs associated with felony and misdemeanor offenses by the number of felonies and misdemeanors the reform will prevent. Because recidivism rates only indicate the number of arrests that offenders commit, and not every crime results in an arrest, we used the National Crime Victimization Survey to estimate how many crimes were prevented for each arrest. Youth. Raising the age of juvenile jurisdiction will benefit 16- and 17-year-olds because they will no longer have criminal records that limit their future employment opportunities. Employers are often hesitant to hire people with criminal records because of potential legal liability if the person with a criminal record harms a customer or coworker; financial liability if the person engages in theft; fear of violence; and the negative signals that a criminal conviction sends about a person’s general skills and trustworthiness. When young people have criminal records, therefore, their employment prospects are jeopardized for many years ahead.14
Research suggests that a person’s criminal justice involvement reduces his or her future earnings, with estimates of the impact ranging from 10 to 40 percent.
15
12 Kathryn E. McCollister, Michael T. French, and Hai Fang, “The Cost of Crime to Society: New Crime-Specific Estimates for Policy and Program Evaluation,” Drug and Alcohol Dependence 108, no. 1 (2010): pp. 98-109.
One particularly relevant study that investigates the impact of receiving a criminal conviction when young on future
13 Mark A. Cohen and Alex Piquero, “New Evidence on the Monetary Value of Saving a High Risk Youth,” Journal of Quantitative Criminology, 25 (2009): pp. 25-49. 14 Harry Holzer, “Collateral Costs: Effects of Incarceration on Employment and Earnings Among Young Workers,” In Do Prisons Make Us Safer? The Benefits and Costs of the Prison Boom, ed. Steven Raphael and Michael Stoll, 239–263 (New York: Russell Sage Foundation, 2009). 15 The Pew Charitable Trusts, Collateral Costs: Incarceration’s Effect on Economic Mobility (Washington, DC: The Pew Charitable Trusts, 2010); Joel Waldfogel, “The Effect of Criminal Conviction on Income and the Trust ‘Reposed in Workmen,’” The Journal of Human Resources 29 no. 1 (1994): pp. 62-81.

Vera Institute of Justice 9
earnings finds that earnings decrease by 13 percent after nine years.16
Placing 16- and 17-year-olds in the juvenile system will benefit youth in other ways as well:
The cost-benefit analysis applies this finding to estimate the additional earnings to youth who would avoid having a criminal record given this policy change.
• The absence of a felony criminal record means that a person may vote, obtain
financial aid for college, secure public housing, and avoid other collateral consequences of a criminal conviction.17
• Additional services within the juvenile system, such as mental health treatment and vocational programs, may further enable young people to develop skills and abilities to succeed in the future.
• Because the policy change will likely reduce recidivism rates among 16- and 17- year-olds, it will enable youth who might have otherwise re-offended to avoid future criminal justice involvement and thus lead more satisfying, productive lives.
Because of the dearth of information about the impact of the juvenile system on these
outcomes, they are not incorporated into our cost-benefit analysis. Nevertheless, it is important to recognize that raising the age would produce these valuable benefits.
Comparing Costs and Benefits We compare the costs and benefits of raising the age to estimate the net present value (NPV) of the fiscal impact of the policy change. “Net” means that the amount represents differences between costs and benefits.18
16 Sam Allgood, David B. Mustard, and Ronald S. Warren, Jr., The Impact of Youth Criminal Behavior on Adult Earnings (Athens, GA: University of Georgia, August 2003).
“Present value” is an accounting method for estimating the worth today of dollars that occur in the future. With an investment such as expanding juvenile jurisdiction, most costs are incurred early on, while many benefits (such as avoided criminal justice costs and benefits to youth) are realized in later years. Simply comparing the nominal dollar value of program costs and benefits would be problematic. The value of a dollar is greater in the present than in the future, because a dollar available today can be invested and produce income over time, making it worth more than a dollar available in the future. Thus, to make a fair comparison between costs and benefits, it is essential to focus on their value at a common point in time—in this case, in the present. This cost-benefit analysis discounts all future costs and benefits using a 3 percent discount rate, which is commonly accepted for the evaluation of social programs.
17 Michael Pinard, “An Integrated Perspective on the Collateral Consequences of Criminal Convictions and Reentry Issues Faced by Formerly Incarcerated Individuals,” Boston University Law Review 86 (2006): 623-636. 18 James Riccio, Daniel Friedlander, and Stephen Freedman, Gain: Benefits, Costs, and Three-Year Impacts of a Welfare-to-Work Program (New York: MDRC, 1994).

Vera Institute of Justice 10
The net present values of benefits and costs that we report are per an annual cohort of 16- and 17-year-old youth, meaning they will reoccur annually for each new cohort of youth.19
Limitations of the Analysis This analysis is based on a rigorous cost-benefit methodology, data specific to North Carolina’s justice system, and expertise of the state’s criminal justice practitioners. In this section, we review the limitations of the analysis. First, some of the data necessary for a more detailed analysis was not available. For example, we had little information about jail populations and law enforcement spending patterns across the state, as North Carolina does not have a centralized data-collection process or repository for this information. In these situations, we relied on site-specific information or national statistics. For instance, we relied on data from the Mecklenburg County Jail and consulted with task force members to ensure that it was reasonable to assume that other jails were similar to this jail. For data on law enforcement, we drew on national data from the Bureau of Justice Statistics.
Second, this analysis does not measure the intangible benefits of the proposed change, such as avoiding the stigma of criminal conviction and the deprivation of voting rights for those convicted of a felony. We also did not measure benefits to youth as a result of increased access to treatment and vocational programs within the juvenile system because of insufficient data on the impact of these programs on the health or well-being of youth. As a result, this analysis is a conservative estimate of the benefits of raising the age.
Third, cost-benefit analysis involves making predictions, which are inherently uncertain. We addressed this limitation by using the best available information to support all the assumptions in the analysis. If some of our assumptions—such as how 16- and 17-year-olds will be handled in the juvenile system, or the rates at which youth will re-offend—prove to be incorrect, the actual costs and benefits of the policy change may change. The sensitivity analyses in Appendix G investigate the effects of varying some of these assumptions, including the policy’s impact on recidivism and the state’s level of investment in diversion programs, on the cost-benefit results.
Summary of the Cost-Benefit Analysis This analysis found that expanding juvenile jurisdiction to include misdemeanor and nonviolent felony offenses for 16- and 17-year-olds would yield $52.3 million in net benefits per annual cohort of youth. As Figure 2 shows, an annually recurring investment of $70.9 million would yield $123.1 million in total benefits: $21.7 million in taxpayer benefits, $3.6 million in victim benefits, and $97.9 million in benefits to youth. This section presents a summary of the analysis, and subsequent sections discuss the details of the costs and benefits by perspective. Please note
19 Alternatively, we could have reported the net present value per offender (as is sometimes the case in cost-benefit studies of criminal justice investments); we determined, however, the resulting figure would have been too abstract to be useful to the reader.

Vera Institute of Justice 11
that in Figure 2 and all subsequent tables, the values in parentheses are costs and the values without parentheses are benefits.
Actual policy and implementation decisions will affect the accuracy of these findings. Vera staff will provide the cost-benefit model used in this analysis to the System Costs Work Group, and task force members will be able use the model to modify various scenarios.
Figure 2: Cost-Benefit Summary, by Perspective, per Annual Cohort of Youth Aged 16 and 17
Net Present Values in Millions
Note: the subtotals may not sum to totals due to rounding.
Costs We estimate that raising the age of juvenile jurisdiction would have a taxpayer cost of $70.9 million per annual cohort of 16- and 17-year-olds. This section will discuss the annual cost to law enforcement ($7.9 million), courts ($3.9 million), and the juvenile justice system ($59.1 million). We will discuss the benefits in the next section. Further details on all these costs and
Net Present Value
Taxpayer Costs Law Enforcement ($7.9)
Courts ($3.9)
Youth Detention ($6.1)
Youth Commitment ($14.7)
Youth Supervision ($18.2)
Youth Programs ($20.2)
Total Taxpayer Costs ($70.9) Benefits
Taxpayer Benefits $21.7 Law Enforcement $0.5
Courts $0.3
Adult Jail $13.9
Adult Prison $3.3
Adult Supervision $3.8
Victims Benefits $3.6 Youth Benefits $97.9
Total Benefits $123.1
Net Benefit $52.3 Net Taxpayer Cost ($49.2)

Vera Institute of Justice 12
calculations are in Appendices C and D. Appendix H provides a breakdown of taxpayer costs in the years following the policy change.
Law Enforcement Expanding the age of juvenile jurisdiction will increase the workload of law enforcement agencies because juvenile arrests are more labor-intensive to process than adult arrests. According to information provided by the North Carolina Sheriff’s Association to the System Costs Work Group, “the investigation of a criminal case involving a juvenile and the processing of that juvenile case through the criminal justice system is much more complex and labor intensive than required when processing as an adult.”20
This analysis assumes that the marginal cost of a juvenile complaint is 50 percent greater than that of an adult arrest. Based on this assumption, the expansion of juvenile jurisdiction will cost $7.9 million per annual cohort of youth (see Figure 3). We estimate this cost by multiplying the total arrests of 16- and 17-year-olds (31,590) by the additional cost ($249) that is associated with a juvenile arrest.
Different procedural treatment by law enforcement, such as working with the youth’s parents in juvenile cases, accounts for this difference in workload.
To provide some context to this figure, $7.9 million amounts to 0.5 percent of law enforcement spending in North Carolina, based on spending data from the Bureau of Justice Statistics.21
Figure 3: Cost to Law Enforcement, per Annual Cohort of Youth Aged 16 and 17 Net Present Values in Millions
Arrests Net Present Value
Misdemeanors 25,000 ($6.2)
Felonies F-I 5,535 ($1.4)
Felonies A-E 1,054 ($0.3)
Total 31,590 ($7.9)
Note: Totals may not sum because of rounding.
Courts Increasing the age of juvenile jurisdiction will affect North Carolina’s court system in several ways. First, district courts will spend more time on misdemeanor cases because, according AOC’s survey of court staff, juvenile matters are more time-consuming than adult criminal
20 Memo from Eddie Caldwell, executive vice president and general counsel, North Carolina Sheriffs’ Association, to the System Costs Work Group. Re: Local Costs Related to an Increase in the Juvenile Age from 16 to 18, July 16, 2010. 21 Bureau of Justice Assistance, Office of Justice Programs Justice Expenditure and Employment Extracts, 2006, December 1, 2008. NCJ 224394.

Vera Institute of Justice 13
proceedings. Second, the jurisdiction of F-I felonies will be moved from superior to district courts, thus increasing the district courts’ workload. Third, the district courts will handle additional transfers of a small proportion of F-I felony cases that belong in the superior court. Fourth, moving F-I felonies from superior to district courts will reduce the superior courts’ caseload backlog. Finally, as more district attorneys will be needed to handle 16- and 17-year-olds as juveniles, some attorneys will require training on juvenile law.22
Details about changes to the court system and their associated costs are discussed below. As Figure 4 indicates, the total cost to the court system will be $3.9 million.
Figure 4: Cost to Courts per Annual Cohort of Youth Aged 16 and 17 Net Present Values in Millions
Cases Net Present Value
Misdemeanors 14,097 ($3.0)
F-I Felonies 4,990 ($1.6)
Transfer Costs 849 ($0.1)
Superior Court 4,990 $1.1
DA Training n/a ($0.17)
Total n/a ($3.9)
Note: Totals may not sum because of rounding.
District Courts: Misdemeanors. According to recent interviews with court staff, it will take approximately twice as long for district courts to process misdemeanors as juvenile cases as compared to adult cases.23 This additional court time translates into increased workloads for judges, clerks, assistant district attorneys, and judicial assistants. We estimate the additional cost required to support this increased workload using current staff salaries, the additional amounts of time staff members will spend on a misdemeanor case, and the number of misdemeanor cases that would be affected by the policy change. The staff salaries were provided by the state’s Administrative Office of the Courts (AOC), and the amounts of time spent on cases in North Carolina are presented in a workload study by the National Center on State Courts.24
We estimate the additional cost per misdemeanor to be $213 per case and the total cost of processing 14,097 affected misdemeanor cases to be $3.0 million.
22 According to a civil defender educator at the University of North Carolina’s School of Government, who provides training to defense attorneys, the policy change will not require substantial training for defense attorneys. 23 Communication with AOC’s Research and Planning Division. 24 North Carolina Administrative Office of the Courts, Judicial Department Position Costs. 2011-2013 Long Session, 2010; Matthew Kleiman, and Cynthia G. Lee, North Carolina Assistant District Attorney / Victim Witness Legal Assistant Workload Study (Williamsburg, VA: National Center for State Courts, 2010); William E. Hewitt, Matthew Kleiman, Wanda L. Romberger, and Richard Y. Schauffler, Updating North Carolina’s Workload Assessment Methodology (Williamsburg, VA: National Center for State Courts, 2007).

Vera Institute of Justice 14
District Courts: F-I Felonies. F-I felonies will be transferred from the superior to district courts, which will consequently require more district court judges, clerks, and judicial assistants to process these cases. We estimate the additional cost of supporting this increased workload using staff salaries, the amounts of time each staff member will spend on a felony case, and the number of F-I felony cases that will be transferred to district courts. We estimate the additional cost per felony case to be $329 and the total cost of processing 4,990 additional felony cases to be $1.6 million.
District Courts: Transfers. Every year, a small proportion of juvenile cases are transferred to the superior court. Based on our conversation with the work group, we assume that approximately 1 percent of 16- and 17-year-olds charged with an F-I felony will be transferred. Transfer hearings generally require at least an hour of court time and expert witness testimony, which costs at least $1,000 a day. We estimate the cost of these additional transfer hearings using the salaries of judges, district attorneys, and clerks. The total cost of a transfer hearing, including the cost of an expert witness, is estimated at $1,230 and the total cost of 50 additional transfer hearings at about $61,399.
Additionally, all youth charged with an A-E felony will face a mandatory transfer to the superior court. Conversations with AOC staff indicate that these transfer hearings will be relatively brief, and we assume that they will take an average of 15 minutes to complete. We estimate that the cost of each additional hearing will be $58 and the total cost of processing 849 mandatory transfer hearings to be $48,822. The total cost of additional transfer hearings for both A-E and F-I felony charges will be $110,221. Superior Courts: Backlog Reduction. As F-I felony cases of 16- and 17-year-olds are transferred from superior to district courts, the workload of superior courts will decrease. Because of the backlog in the superior courts’ caseloads, AOC will not be able to reduce staffing and realize cost-savings. The backlog reduction will, however, make case processing more efficient, and we estimate the dollar value of this efficiency boost using court staff salaries and the amounts of time saved from reduced caseloads. The benefit of an avoided F-I felony case is estimated at $212 per case, and the total benefit of reducing the superior courts’ caseload by 4,990 cases is estimated to be $1.1 million. District Attorney Training. In order to process 16- and 17-year-olds’ cases in the juvenile system, some North Carolina district attorneys will need to be trained on juvenile law. The North Carolina Conference of District Attorneys (NCCDA) stated that it would need a resource attorney and semiannual training sessions to prepare attorneys to handle juvenile cases. According to NCCDA, the resource prosecutor would have the same salary as a district attorney, and each training session would cost $35,000. We estimate the overall cost associated with training district attorneys at $178,829.

Vera Institute of Justice 15
Juvenile Justice: Operating Costs Raising the age would cost the juvenile justice system $59.1 million per annual cohort of youth (see Figure 5), exclusive of capital costs, which we discuss in the next section. In addition to the cost of expanded residential services (both detention and commitment) for 16- and 17-year-olds, the agency will also be responsible for additional case intake, community supervision, and prevention programs for this population.
Figure 5: Cost to Juvenile Justice Detention, Commitment, and Supervision
per Annual Cohort of Youth Aged 16 and 17 Net Present Values in Millions
Placements Net Present Value
Detention 2,045 ($6.1)
Commitments 168 ($14.7)
Court Counselors 31,590 ($5.5)
Juvenile Supervision 6,234 ($18.2)
Juvenile Programs
JCPC 9,161 ($12.8)
Alternatives-to-Detention 631 ($.7)
Alternatives-to-Placement 72 ($1.1)
TOTAL n/a ($59.1)
Note: Totals may not sum because of rounding.
Detention. We estimate that 3 percent of misdemeanants and 15 percent of youth who are charged with a low-level (F-I) felony will be sent to detention for an average of 17 days. These youth will include those who are sent to a detention center pending a disposition; those who serve their sentence in a detention center; and those who violate their probation terms. About $4.6 million would be necessary to serve 1,473 youth in detention each year. This is based on the daily cost of $181.90, which is calculated assuming an average staffing ratio of 1.4 positions per youth (88 full-time positions per 64-bed facility). We also assume that 30 percent of those youth who would have been detained are instead referred to an alternative to detention (ATD) program.
Additionally, some youth who are charged with an A-E felony will spend several weeks in juvenile detention until the finding of probable cause, and will then be transferred to a jail. We estimated that 54 percent of the youth arrested on an A-E felony will spend about two weeks in juvenile detention. At a daily cost of $181.90, the stay for this group will amount to roughly $1.5 million. The total additional detention cost will be $6.1 million per year.
Vera Institute of Justice 16
Commitments. We estimate that 3 percent of youth charged with a low-level felony will be committed to a YDC for an average of 344 days. We estimate that $14.7 million annually will be necessary to serve 168 youth in 158 new YDC beds. The daily cost of $254.90 is calculated assuming an average staffing ratio of two positions per juvenile (198 full-time positions per 96-bed facility). The estimate also assumes that 30 percent of those youth who would have been committed to a YDC are instead referred to an alternative to placement (ATP) program.
Court Counselors. When law enforcement officers in North Carolina arrest youth, they send them to Department of Juvenile Justice and Delinquency Prevention (DJJDP) court counselors, who collect information about the person, decide whether to recommend him or her to court, prepare predisposition reports with a risk and needs assessment, and contact parents regarding possible future appointments. According to DJJDP, this intake process costs $175 per person. Based on this cost, we estimate that an additional $5.5 million will be required for counselors to handle more than 30,000 16- and 17-year-olds annually. Juvenile Supervision. We estimate that $18.2 million would be necessary to support more than 6,200 youth who would be sentenced to community supervision for an average of 361 days at a daily cost of $8.06. The supervision population also includes the youth referred to ATP programs. Juvenile Programs. If JCPC programs serve 16- and 17-year-olds with the same frequency as they now do for juveniles as defined under the existing statute, then $12.8 million each year would be necessary to support the expansion of the present portfolio of JCPC programs. This estimate is based on the current JCPC program cost of $1,400 per youth.25
Additionally, $0.7 million would provide for 631 ATD placements and $1.1 million for 72 ATP placements annually. These costs are based on the assumption that 30 percent of youth who would have been detained or committed to a YDC will be served by a community-based alternative program. We estimate that ATDs will cost $26 per day and ATPs will cost about $15,000 per person, based on the costs of programs implemented elsewhere. Also, according to DJJDP, there may be other costs involved in the start-up and overhead associated with new programs. We do not include these administrative costs in the analysis; however, a substantial investment in new programs might require additional resources for DJJDP.
Juvenile Justice: Capital Costs If the jurisdictional responsibility of DJJDP is increased, there would be a need for capital funding for residential facilities—both detention and commitment—for 16- and 17-year-olds. There is, however, an existing stock of “off-line,” or currently unused, YDC capacity that could
25 The cost includes both the state and county share of JCPC funding.

Vera Institute of Justice 17
be used to house 16- and 17-year-olds. This section describes the cost implications of both new construction and the renovation of existing capacity.
Youth Detention: Capital Costs. Information provided by Guilford County indicates that the marginal cost of a new detention bed is $109,000. Based on the proportion of juveniles under the current law who are detained, we estimate that 92 new beds would be necessary at a capital cost of $10.0 million. We do not assume that there are opportunities to renovate unused capacity at existing facilities, as we are not aware of any off-line capacity in youth detention. Youth Development Centers: Capital Costs. This analysis estimates that 158 new beds at YDCs would be required to meet the needs of the expanded population. DJJDP reports that new construction would cost $180,000 per bed, and the total capital cost would thus be $28.5 million. However, as discussed in the System Costs Work Group, renovating existing YDC facilities would be less expensive than constructing new ones. An analysis of the renovation needs at existing YDCs suggests an estimated cost of $45,606 per bed, for a total cost of $7.2 million for 158 new beds, compared to the $28.5 million needed for new construction of the same number of beds.
As of April 2010, there were 319 beds off-line in the state’s network of YDCs, which could be available for use if they were adequately renovated. Most of these beds are in three facilities: Stonewall Jackson, Dobbs, and Samarkand Manor. According to a DJJDP list of funding needs for renovations, it appears that some vacant cottages in those facilities could be readily converted into new capacity. Holshouser Dormitory at Stonewall Jackson YDC, for instance, requires $1.4 million in repairs for 49 off-line beds ($29,184 per bed), which includes the costs for other campuswide needs, such as school and cafeteria renovations. At Dobbs YDC, 100 off-line beds could be renovated at a cost of $32,976 per bed, which includes the full cost of the replacement of the sewer system; and at Samarkand Manor 49 off-line beds could be renovated at a cost of $87,806 per bed, which includes other campuswide renovations such as the upgrade of the electrical system. This totals $9.0 million for 198 beds at an average renovation cost of $45,606 per bed. Given that renovating existing facilities will cost less than constructing new ones, the state should consider this option. Benefits We estimate that raising the age of juvenile jurisdiction would yield net present value benefits of $123.1 million per annual cohort of 16- and 17-year-olds. This section discusses the annual benefits to taxpayers via the criminal justice system ($21.7 million), to victims ($3.6 million), and to youth ($97.9 million). Further details on all these benefits and calculations are in Appendix D. Additionally, Appendix H provides a breakdown of taxpayer costs and benefits in the years following the policy change.

Vera Institute of Justice 18
Criminal Justice System While raising the age will add to the workload of juvenile justice agencies, it will reduce the workload of some criminal justice agencies and reduce future criminal justice expenditures. It is important to note that these benefits may not necessarily fund new juvenile justice programs or otherwise translate into budget savings, as agencies may use these funds to fill existing gaps or meet other needs. We count these as taxpayer benefits nonetheless to illustrate the positive effects on law enforcement, courts, and corrections that offset the cost of the policy change (see Figure 6).
Figure 6: Benefits to the Justice System, per Annual Cohort of Youth Aged 16 and 17 Net Present Values in Millions
Number of Individuals Net Present Value
Law Enforcement 992 $0.5 Courts 576 $0.3 Adult Jail 8,349 $13.9 Adult Prison 136 $3.3 Adult Supervision 6,423 $3.8 Total n/a $21.7
Note: Totals may not sum because of rounding.
Law Enforcement. Lower recidivism rates mean that fewer people are likely to be arrested in the future. We estimate that law enforcement agencies will not have to spend about $465,948 per year because of 992 fewer future arrests, which includes 695 misdemeanors (totaling $326,410) and 297 felonies (totaling $139,537). Courts. Lower recidivism rates also mean that fewer people are likely to be referred to court. We estimate that the court system will not have to spend about $292,042 on processing cases. This estimate includes a reduction of $123,024 in spending from 306 fewer misdemeanor cases; $165,912 from 268 fewer felony cases; and $3,107 from three fewer transfer hearings. Adult Jail. If responsibility for the detention of 16- and 17-year-olds were shifted to the juvenile justice system, local jails would accrue an annual benefit of $13.9 million. Most of this benefit results from the transfer of responsibility for the 8,349 people who would have been detained in adult jail. These calculations are based on a daily cost of $37.39 and an average length of stay of 15 days for misdemeanors and 80 days for low-level felonies, based on data from Mecklenburg County.26
26 Although the average length of stay in jails across the state may differ from that in Mecklenburg County, the work group agreed that the county’s length of stay data was suitable for the cost-benefit analysis.

Vera Institute of Justice 19
Adult Prison. We estimate that $3.3 million in benefits would accrue to adult prisons: $1.1 million in benefits would result from lower workloads from the transfer of responsibility for 136 youth who would have been sent to prison, and $2.2 million would accrue in the future from lowered incarceration rates due to lower crime rates. This estimate is based on a length of stay of 115 days and a daily cost per inmate of $70.14.
Adult Prison: Capital Benefits. Raising the age of juvenile jurisdiction could generate benefits for the adult prison capital budget. Forty-three prison beds would become available both on account of a reduction in future crime and because responsibility for 16- and 17-year-olds would be transferred to the juvenile system. The average capital cost per prison bed is $47,202, resulting in a benefit of $2 million. To the extent the prison population is forecasted to increase, this vacated capacity could offset future capital budget needs.
Adult Supervision. Benefits totaling $3.8 million would be generated because of reduced adult supervision workloads. We assume that 6,423 individuals would have been referred to community supervision, and the benefit we estimate is based on a daily cost of $2.48 and an average supervision period of 228 days. Victims Transferring 16- and 17-year-olds to the juvenile system will likely reduce recidivism rates for that population, therefore reducing crimes and the associated victimization costs. As mentioned previously, we estimate avoided victimization costs (benefits to victims) using the latest research on the victimization costs for different crime categories. Figure 7 presents these benefits for misdemeanors and F-I felonies. As the table indicates, a 10 percent recidivism reduction among 16- and 17-year-olds transferred into the juvenile system means that there will be 1,724 fewer victimizations associated with misdemeanor arrests and 737 fewer victimizations related to F-I felony arrests. This will result in $3.6 million in benefits to victims, which are realized two to four years after the policy change. For additional information on how we calculated these costs, see Appendix E.
Figure 7: Benefits to Victims, per Annual Cohort of Youth Aged 16 and 17 Net Present Values in Millions
Avoided Victimizations
(Based on 10% Reduction in Recidivism)
Net Present Value
Misdemeanors 1,724 $ 0.8
Felonies (F – I) 737 $ 2.8
Total 2,461 $ 3.6
Note: Totals may not sum because of rounding.

Vera Institute of Justice 20
Youth Research shows that having a criminal record reduces a person’s employment opportunities. This means that 16- and 17-year-olds under juvenile justice jurisdiction will have better employment prospects because they will not have criminal records, as they would if they remained in the criminal justice system. In this analysis, we focus on the additional earnings youth will generate as a result of not having a criminal record.
To calculate additional earnings, we begin by estimating the number of youth who will no longer have criminal records. About 4,276 16- and 17-year-olds are convicted of an F-I felony each year. If tried in the juvenile justice system, they would not receive a permanent criminal record. Statistics show that about half of these youth (2,010) will be reconvicted for another offense in the next three years; most likely, this reconviction will be in the adult system because of the proximity of their age to the criminal justice jurisdiction, and they will receive a criminal record. We also estimate that of the remaining individuals, 30 percent (680) will be reconvicted in the adult system in the subsequent years. This leaves 1,586 youth who will not be reconvicted of another offense and who will never have a criminal record.
The Bureau of Labor Statistics estimates that an average full-time worker with a high school degree alone earns $626 a week, or $32,552 a year, and that about 72 percent of men with a high school degree alone are employed.27 A recent study finds that individuals who were convicted of an offense when young earn 13 percent less than those who were not convicted, which means that individuals with a high school degree alone earn $3,046 less a year ($32,552 x 0.13 x 0.72).28 Over a lifetime, this earnings differential totals $61,691 per person, assuming that an average individual with a high school degree alone works for 35 years, from age 20 to 65.29
As Figure 8 shows, for 1,586 youth, these additional earnings add up to $97.9 million. For additional information on how we calculated these costs, see Appendix F.
Figure 8: Benefits to Youth, per Annual Cohort of Youth Aged 16 and 17
Number of Youth Without a
Criminal Records, per Year
Additional Lifetime
Earnings Per Youth Net Present Value
1,586 $61,691 $97,857,916
Note: Totals may not sum because of rounding.
27 U.S. Department of Labor, Bureau of Labor Statistics Employment Projections: Education Pays… (Washington, DC: 2009), available at http://www.bls.gov/emp/ep_chart_001.htm [last Accessed January 2, 2011]. This figure is distinct from the official unemployment rate which excludes those who are not looking for work, either because they are unable to work or choose not to look for work. 28 Sam Allgood, David B. Mustard, and Ronald S. Warren, Jr., The Impact of Youth Criminal Behavior on Adult Earnings (Athens, GA: University of Georgia, August 2003). 29 In our calculations, we assume that although individuals earn an average of $32,552 a year, their starting salary is lower, at $22,785, and their salary at 65 is $44,673. We also discount future earnings to the present, using a 3 percent discount rate. These are gross earnings and may include earnings that are paid in taxes, depending on the individual’s filing status, family size, and future tax laws.

Vera Institute of Justice 21
Conclusion This analysis presents the costs and benefits of raising the age of juvenile jurisdiction in North Carolina to include 16- and 17-year-olds, based on a plan to process all misdemeanors and non-violent (F-I) felonies in the juvenile system, while keeping A-E felonies in the adult system. The analysis reflects a careful examination of North Carolina’s juvenile and criminal justice policies and costs, incorporates the feedback of the System Costs Work Group, and draws upon national research and best practices in juvenile justice. It is important to note that specific policy and implementation decisions will affect the actual net present value of this investment.30
We find that implementing this particular plan for raising the age of juvenile jurisdiction would yield $52.3 million in net benefits per annual cohort of youth aged 16 and 17. A net present value investment of $70.9 million each year would yield $123.1 million in total benefits, specifically, $21.7 million in taxpayer benefits, $3.6 million in victim benefits, and $97.9 million in benefits to youth. The taxpayer and victim benefits are realized two to four years after the investment, and the youth benefits occur over 35 years after the investment.
This analysis suggests that the costs of raising the age in North Carolina may be less expensive than previously estimated. This is in part because 16- and 17-year-olds who commit violent offenses (A-E felonies) will remain under the jurisdiction of the criminal justice system and also because the analysis models the effect of investing in community-based alternative programming that minimizes the use of detention and commitment. The analysis also suggests that the benefits of raising the age that are presented in this report may be underestimated, since many intangible benefits to youth, families, and communities have not been monetized. These results indicate that the benefits of the plan to raise the age of juvenile jurisdiction outweigh the costs and that, from a cost-benefit standpoint, the policy change merits consideration.
30 Task force members will be able use the model developed for this analysis to consider various scenarios—modifying assumptions, cost information, policy decisions, and other inputs—and to assess the costs and benefits of various policy options.

Vera Institute of Justice 22
Appendix A: Youth Accountability and Planning Task Force System Costs Work Group
Task Force Member Representing Rep. Alice Bordsen (co-chair) NC House of Representatives Sen. Stan Bingham (co-chair) NC Senate Sen. Peter Brunstetter NC Senate Hon. Charlie Brown NC Sentencing Commission Sec. Alvin Keller NC Department of Correction Sr. Dep. Director Gregg Stahl NC Administrative Office of the Courts Chief Tom Bergamine Police Chiefs Stan Clarkson NC Department of Juvenile Justice and
Delinquency Prevention /Chief Court Counselors
Additional Members Representing Dr. Mario Paparozzi (co-facilitator) UNC-Pembroke Rep. Larry Bell NC House of Representatives Dr. Robin Jenkins NC Department of Juvenile Justice and
Delinquency Prevention David Jones NC Department of Juvenile Justice and
Delinquency Prevention Susan Katzenelson NC Sentencing Commission Ginny Hevener NC Sentencing Commission Chloe Gossage NC Administrative Office of the Courts Brad Fowler NC Administrative Office of the Courts Doug Yearwood Governor’s Crime Commission Jonathan Williams Alcoholic Beverage Control Commission Anthony Allen County Commissioner’s Association Dr. Joel Rosch Duke Center for Child & Family Policy Lao Rubert Carolina Justice Policy Center Elizabeth Hudgins NC Child Fatality Task Force Dr. Ken Wilson East Carolina University

Vera Institute of Justice 23
Appendix B: System Costs Work Group Discussions of the Cost-Benefit Analysis
September 27, 2010
• Overview of the Analysis • Governmental Costs • Victim Costs
October 21, 2010
• Cost-Benefit Analysis Diagram • Juvenile Programs, Alternatives to Detention • Juvenile Programs, Alternatives to Placement • Offender Benefits
November 19, 2010
• Description of the Analysis • Resource use in the Adult and Juvenile Systems • Assumptions for the Cost-Benefit Analysis • Review of the Draft Analysis
December 17, 2010
• Cost-Benefit Analysis Findings

Vera Institute of Justice 24
Appendix C: Marginal Costs
Perspective Marginal
Cost Calculations Sources
Law Enforcement: One arrest
$498
Average cost of an arrest is $3,110 ($1.358 billion in law enforcement expenses per Bureau of Justice Statistics divided by 436,676 arrests per Uniform Crime Reports). Because data to calculate the marginal cost is not available for North Carolina, information from Washington State, where this calculation has been made, is used to estimate the marginal cost in North Carolina. In Washington State the marginal cost of an arrest ($670) is 16 percent of the average cost ($4,182). Therefore, the marginal cost of $498 is calculated by multiplying the North Carolina average cost ($3,110) by 16 percent.
• Bureau of Justice Statistics. Justice Expenditure and Employment Extracts, 2006. Table 4. December 1, 2008. NCJ 224394.
• Federal Bureau of Investigation. Uniform Crime Reports. Crime in the United States, 2006. Table 69.
• Aos, Steve and E. Drake. WSIPP’s Benefit-Cost Tool for States: Examining Policy Options in Sentencing and Corrections. Washington State Institute for Public Policy. August 2010.
Law Enforcement: Differential cost of juvenile arrest versus adult arrest
$249
Cases involving juveniles are more complex and labor intensive than cases involving adults. We therefore assume that juvenile cases require 50 percent more resources. The marginal cost of one arrest ($498) is multiplied by 50 percent.
• Bureau of Justice Statistics. Justice Expenditure and Employment Extracts, 2006. Table 4. December 1, 2008. NCJ 224394.
• Federal Bureau of Investigation. Uniform Crime Reports. Crime in the United States, 2006. Table 69.
• Aos, Steve and E. Drake. WSIPP’s Benefit-Cost Tool for States: Examining Policy Options in Sentencing and Corrections. Washington State Institute for Public Policy. August 2010.

Vera Institute of Justice 25
Perspective Marginal
Cost Calculations Sources
Courts: Differential cost of a juvenile misdemeanor
$213
According to the Administrative Office of Courts (AOC), it will take about twice as long to process juvenile misdemeanor cases as it does to process adult cases. The marginal cost is estimated using the additional number of minutes judges, judicial assistants, clerks, and assistant district attorneys spend on juvenile misdemeanor cases (per judicial workload studies); their salaries (per AOC); and the number of minutes they work each year (per judicial workload studies). For example, a judge works 77,120 minutes and makes $161,476 a year, which means that s/he earns $2.07 per minute. It takes an additional 22 minutes to process a juvenile misdemeanor case, so it will take $45 (22 x $2.07) in judge’s salary to process the case. The same process is repeated for judicial assistants, clerks, and assistant district attorneys.
• North Carolina Administrative Office of the Courts. (2010) Judicial Department Position Costs. 2011-2013 Long Session.
• Kleiman, Matthew; Lee, Cynthia G. (2010) North Carolina Assistant District Attorney / Victim Witness Legal Assistant Workload Study. Williamsburg, VA: National Center for State Courts.
• Hewitt, William E.; Kleiman, Matthew; Romberger, Wanda L.; Schauffler, Richard Y. (2007). Updating North Carolina’s Workload Assessment Methodology. Williamsburg, VA: National Center for State Courts.
Courts: Differential cost of processing a juvenile F-I Felony in district rather than superior court.
$329
Estimated using the additional number of minutes judges, judicial assistants, and clerks spend on felony cases in district courts versus superior courts (per 2007 workload study); their salaries (per AOC); and the number of minutes they work each year (per judicial workload studies). For example, a judge works 77,120 minutes and makes $161,476 a year, which means that s/he earns $2.07 per minute. It takes 45 minutes to process a felony case in district court, so it will take $93 (45 x $2.07) in judge’s salary to process the case. The same process is repeated for judicial assistants and clerks. Assistant district attorneys were not included in this calculation because we received information that it would take them about the same amount of time to prosecute felony cases in district courts as in superior courts.
• North Carolina Administrative Office of the Courts. (2010) Judicial Department Position Costs. 2011-2013 Long Session.
• Kleiman, Matthew; Lee, Cynthia G. (2010) North Carolina Assistant District Attorney / Victim Witness Legal Assistant Workload Study. Williamsburg, VA: National Center for State Courts.
• Hewitt, William; Kleiman, Matthew; Romberger, Wanda L.; Schauffler, Richard Y. (2007). Updating North Carolina’s Workload Assessment Methodology. Williamsburg, VA: National Center for State Courts.

Vera Institute of Justice 26
Perspective Marginal
Cost Calculations Sources
Courts: Transfer hearing for F-I felony
$1,230
It takes at least an hour of court time and an expert witness to implement a transfer hearing. The marginal cost is calculated using the salaries of a judge, a clerk, and an assistant district attorney, divided by the number of hours they work in a year, plus $1,000 paid to expert witnesses.
• North Carolina Administrative Office of the Courts. (2010) Judicial Department Position Costs. 2011-2013 Long Session.
• Kleiman, Matthew; Lee, Cynthia G. (2010) North Carolina Assistant District Attorney / Victim Witness Legal Assistant Workload Study. Williamsburg, VA: National Center for State Courts.
• Hewitt, William; et al.. (2007). Updating North Carolina’s Workload Assessment Methodology. Williamsburg, VA: National Center for State Courts.
• Legislative Fiscal Note for HB1414 (Second Edition). July 20, 2009.
Courts: Transfer hearing for A-E felony
$58
All A-E felonies will originate in the juvenile system but face a mandatory transfer to the adult system. According to AOC, these transfer hearings will be relatively short. We estimate them to last about 15 minutes. The marginal cost is calculated using the salaries of a judge, a clerk, and an assistant district attorney, divided by the number of hours they work in a year, divided by four.
• North Carolina Administrative Office of the Courts. (2010) Judicial Department Position Costs. 2011-2013 Long Session.
• Kleiman, Matthew; Lee, Cynthia G. (2010) North Carolina Assistant District Attorney / Victim Witness Legal Assistant Workload Study. Williamsburg, VA: National Center for State Courts.
• Hewitt, William; et al. (2007). Updating North Carolina’s Workload Assessment Methodology. Williamsburg, VA: National Center for State Courts.

Vera Institute of Justice 27
Perspective Marginal
Cost Calculations Source
Courts: Cost of one adult case, misdemeanor
$427
The marginal cost is estimated using the number of minutes judges, judicial assistants, clerks, and assistant district attorneys spend on juvenile misdemeanor cases (per judicial workload studies); their salaries (per AOC); and the number of minutes they work each year (per judicial workload studies). See the description of “Courts: Differential cost of processing a juvenile F-I Felony in district rather than superior court.” for an example of this calculation.
• North Carolina Administrative Office of the Courts. (2010) Judicial Department Position Costs. 2011-2013 Long Session.
• Kleiman, Matthew; Lee, Cynthia G. (2010) North Carolina Assistant District Attorney / Victim Witness Legal Assistant Workload Study. Williamsburg, VA: National Center for State Courts.
• Hewitt, William; et al.. (2007). Updating North Carolina’s Workload Assessment Methodology. Williamsburg, VA: National Center for State Courts.
Courts: Cost of one adult case, Felony F-I, processed in a superior court
$657
The marginal cost is estimated using the number of minutes that judges, judicial assistants, district attorneys, and clerks spend on felony cases in superior courts (per 2007 judicial workload study); their salaries (per AOC); and the number of minutes they work each year (per judicial workload studies). See the description of “Courts: Differential cost of processing a juvenile F-I Felony in district rather than superior court” for an example of this calculation. Assistant district attorneys were not included in this calculation because we received information that it would take them about the same amount of time to prosecute felony cases in district courts as in superior courts.
• North Carolina Administrative Office of the Courts. (2010) Judicial Department Position Costs. 2011-2013 Long Session.
• Kleiman, Matthew; Lee, Cynthia G. (2010) North Carolina Assistant District Attorney / Victim Witness Legal Assistant Workload Study. Williamsburg, VA: National Center for State Courts.
• Hewitt, William; et al.. (2007). Updating North Carolina’s Workload Assessment Methodology. Williamsburg, VA: National Center for State Courts.

Vera Institute of Justice 28
Perspective Marginal
Cost Calculations Sources
Courts: Benefit of Superior Court backlog reduction
$212
The marginal benefit is estimated using the additional number of minutes that judges, assistant district attorneys, judicial assistants, and clerks spend on felony cases in superior courts (per 2007 judicial workload study); their salaries (per AOC); and the number of minutes they work each year (per judicial workload studies). See the description of “Courts: Differential cost of processing a juvenile F-I Felony in district rather than superior court” for an example of this calculation.
• North Carolina Administrative Office of the Courts. (2010) Judicial Department Position Costs. 2011-2013 Long Session.
• Kleiman, Matthew; Lee, Cynthia G. (2010) North Carolina Assistant District Attorney / Victim Witness Legal Assistant Workload Study. Williamsburg, VA: National Center for State Courts.
• Hewitt, William; et al. (2007). Updating North Carolina’s Workload Assessment Methodology. Williamsburg, VA: National Center for State Courts.
Department of Juvenile Justice and Delinquency Prevention (DJJDP): Court Counselor (Intake)
$175
Marginal cost per intake. Data provided by DJJDP. • Jenkins, Robert. (May 2010). DJJDP: Department Overview and Costs Presented to the Cost Work Group. PowerPoint Presentation.
Juvenile Detention: per day
$181.90
Assumes 1.4 positions per detainee (88 full-time employees (FTEs) for 64-bed facility) at an average salary of $38,696. The marginal cost also includes $13,188 per year, per inmate for supplies and materials, according to data provided by Guilford County.
• Legislative Fiscal Note for HB1414 (Second Edition). July 20, 2009.
• Presentation by Doug Logan, Director, Court Alternative Department, Juvenile Detention Division. Guilford County. July 16, 2010.

Vera Institute of Justice 29
Perspective Marginal Cost
Calculations Sources
Juvenile Detention: Capital expense, per bed
$109,375
Information presented to the System Costs Work Group by Guilford County. It is estimated that each youth requires 375 square feet. Construction cost is $250 per square foot, and land acquisition is $41.67 per square foot.
• Doug Logan, Director, Court Alternative Department, Juvenile Detention Division. Guilford County. July 16, 2010. Presentation to System Costs Work Group.
Juvenile Commitment (YDC): per day
$254.90
Assumes 2.06 positions per juvenile (198 FTEs for 96-bed facility) at an average salary of $38,716. The marginal cost also includes $13,188 per year for supplies and materials, according to data provided by Guildford County.
• Legislative Fiscal Note for HB1414 (Second Edition). July 20, 2009.
• Presentation by Doug Logan, Director, Court Alternative Department, Juvenile Detention Division. Guilford County. July 16, 2010.
Juvenile Commitment (YDC): Capital expense, new construction
$180,000
Per bed cost for the new construction of a 64-bed facility. Data provided by DJJDP.
• Communication with Jean Sandaire (DJJDP), December 1, 2010.
Juvenile Commitment (YDC): Capital expense, renovation of existing capacity
$45,606
Per bed costs to renovate 198 off-line beds at Stonewall Jackson, Dobbs, and Samarkand Manor YDCs. Marginal costs are authors’ calculation based on renovation costs provided by DJJDP. These calculations include the both the costs of renovating the cottages as well as other campus-wide needs, such as sewer and electrical upgrades.
• Renovation Needs for Current Cottages, Support Buildings, and Bed Populations. DJJDP. May 4, 2010.
Juvenile Supervision: Per day
$8.06 Per DJJDP presentation to the System Costs Work Group, May 21, 2010.
• Jenkins, Robert. (May 2010). DJJDP: Department Overview and Costs Presented to the Cost Work Group. PowerPoint Presentation.

Vera Institute of Justice 30
Perspective Marginal Cost
Calculations Sources
Juvenile Program: Juvenile Crime Prevention Council (JCPC), per slot.
$1,400
Data provided by DJJDP. This includes both the county and state share of program expenses.
• Communication with Jean Sandaire (DJJDP), December 1, 2010.
Juvenile Program: Alternative-to-Placement (ATP)
$15,000
Cost of Multisystemic Treatment slot. • Communication with New York State’s MST service providers.
Juvenile Program: Alternative-to-Placement (ATD), per day
$26
The marginal cost estimates assume that half of those in an ATD program are supervised in the community by a youth advocate for $17 a day, and half report nightly to a community center for intensive supervision and programming at a cost of $35 a day.
• The Annie E. Casey Foundation. (2007). Detention Reform: A Cost-Saving Approach.
Adult Jail: per day
$37.39
Average annual cost per inmate is $18,372 ($337 million annually for jails divided by 18,339 inmates). Spending data per Bureau of Justice Statistics expenditures data, 2006, and inmates per the North Carolina Association of County Commissioners (NCAAC). The marginal cost is estimated to be 74 percent of this amount per analysis conducted by the Washington State Institute of Public Policy (WSIPP).
• Bureau of Justice Statistics. Justice Expenditure and Employment Extracts, 2006. Table 4. December 1, 2008. NCJ 224394.
• David Johnson. An Evaluative Study of Jail Inmate Populations and Growth in North Carolina. NCAAC.
• Aos, Steve and E. Drake. WSIPP’s Benefit-Cost Tool for States: Examining Policy Options in Sentencing and Corrections. Washington State Institute for Public Policy. August 2010.

Vera Institute of Justice 31
Perspective Marginal
Cost Calculations Sources
Adult Prison: per day
$70.14
Assumes a staffing ratio of 2.5 inmates per prisoner (the average of the last seven prisons constructed in North Carolina) and an average salary of $39,000; also includes $10,000 per year, per inmate for supplies and materials.
• Legislative Fiscal Note for HB1414 (Second Edition). July 20, 2009.
Adult Prison: Capital expense
$47,017 Calculated by averaging the cost to expand capacity at Bertie, Maury, Tabor, and Lanesboro Correctional Institutions.
• North Carolina Capital Improvement Program. Six-Year Summary FY 2007–2013. Office of State Budget and Management

Vera Institute of Justice 32
Appendix D: Costs and Benefits to the Justice System, Supporting Tables
Figure D1: Law Enforcement Costs and Benefits per Annual Cohort of Youth Aged 16 and 1731
Figure D2: Court Costs and Benefits
per Annual Cohort of Youth Aged 16 and 17
31 In this and subsequent tables, subtotals may not sum to totals because of rounding.
ArrestsMarginal
CostYear 1Cost
FutureBenefit
Net Present Value Cost
Law EnforcementMisdemeanors 25,000 (249)$ (6,228,983)$ 326,410$ (5,902,572)$ Felonies (F-I) 5,535 (249)$ (1,379,190)$ 139,537$ (1,239,652)$ Felonies (A-E) 1,054 (249)$ (262,618)$ -$ (262,618)$
Total 31,590 (249)$ (7,870,790)$ 465,948$ (7,404,842)$
CasesMarginal (Cost)/Benefit
Year 1Cost
FutureBenefit
Net Present Value Cost
Courts Misdemeanors 14,097 (213)$ (3,009,360)$ 123,024$ (2,886,336)$ Felonies (F-I) 4,990 (329)$ (1,639,540)$ 165,912$ (1,473,628)$ Transfer Costs (F-I) 50 (1,230)$ (61,399)$ 3,107$ (58,292)$ Transfer Costs (A-E 849 (58)$ (48,822)$ -$ (48,822)$ ADA training n/a n/a (178,829)$ -$ (178,829)$ Superior Court 4,990 212$ 1,057,923$ -$ 1,057,923$
Total n/a n/a (3,880,027)$ 292,042$ (3,587,985)$

Vera Institute of Justice 33
Figure D3: Juvenile Justice System Costs and Benefits per Annual Cohort of Youth Aged 16 and 17
% of Arrests Placements
Length of Stay (Days)
Marginal Cost
TotalCost
Youth DetentionMisdemeanors 3% 649 15 (181.90)$ (1,769,302)$ Felonies (F-I) 15% 824 19 (181.90)$ (2,862,051)$ Felonies (A-E) 54% 572 14 (181.90)$ (1,457,339)$
Subtotal n/a 2,045 n/a n/a (6,088,692)$ YDC Placement
Misdemeanors 0.03% 8 251 (254.90)$ (538,788)$ Felonies (F-I) 3% 159 349 (254.90)$ (14,171,044)$
Subtotal n/a 168 n/a n/a (14,709,832)$ Supervision (Probation)
Misdemeanors 18% 4,484 360 (8.06)$ (13,018,745)$ Felonies (F-I) 32% 1,750 364 (8.06)$ (5,137,492)$
Subtotal n/a 6,234 n/a n/a (18,156,237)$ Juvenile Programs Court Counselors 31,590 n/a (175)$ (5,528,250)$ JCPCs 30.0% 9,161 n/a (1,400)$ (12,825,105)$
ATDs (Misdm.) 1.1% 278 45 (26)$ (325,632)$ ATDs (F-I) 6.4% 353 45 (26)$ (413,037)$
ATD Total 7.5% 631 90 (26)$ (738,669)$ ATPs (Misdm) 0.0% 4 n/a (15,000)$ (54,136)$
ATPs (F-I) 1.2% 68 n/a (15,000)$ (1,024,781)$ ATP Total 1.2% 72 n/a (15,000)$ (1,078,917)$ Subtotal (20,170,941)$ Total (59,125,702)$

Vera Institute of Justice 34
Figure D4: Criminal Justice System Costs and Benefits per Annual Cohort of Youth Aged 16 and 17
% Arrests
Place-ments
Length of Stay (Days)
Marginal (Cost)/Benefit
Year 1Benefit
FutureBenefit
Net Present Value Benefit
Adult JailMisdem. 19% 4,806 15 37.39$ 2,695,670$ 70,629$ 2,766,299$ Felonies (F-I) 64% 3,543 80 37.39$ 10,597,639$ 536,100$ 11,133,738$
Subtotal n/a 8,349 n/a n/a 13,293,309$ 606,729$ 13,900,038$ Adult Prison
Misdem. 0.24% 61 58 70.14$ 248,145$ 568,305$ 816,449$ Felonies (F-I) 1% 75 161 70.14$ 849,161$ 1,614,194$ 2,463,355$
Subtotal n/a 136 n/a n/a 1,097,305$ 2,182,498$ 3,279,804$ Adult Supervision
Misdem. 17% 4,226 227 2.48$ 2,373,448$ 62,591$ 2,436,038$ Felonies (F-I) 40% 2,197 232 2.48$ 1,260,543$ 63,629$ 1,324,172$
Subtotal n/a 6,423 n/a n/a 3,633,990$ 126,220$ 3,760,210$ Total n/a n/a n/a n/a 18,024,604$ 2,915,448$ 20,940,052$

Vera Institute of Justice 35
Appendix E: Victim Benefits Calculations Figure E presents how we calculated the victim benefits of raising the age. Rows two, three, and four show the number of felony and misdemeanor rearrests that can be expected for 16- and 17-year-olds in the adult system, the number of rearrests that can be expected in the juvenile system, and the difference between the two. The next row shows the percentage of crimes that are reported to the police. The sixth row contains the number of avoided victimizations, which are calculated by dividing the number of avoided re-arrests by the percentage of crimes reported to the police. The seventh row shows the victim cost per misdemeanor/felony, and the seventh and eighth rows show the total avoided costs as a result of the policy change. As the next row indicates, raising the age will avoid $3,809,721 in victimization costs. These avoided costs are realized over a period of three years, so we discount the avoided costs from years two and three to the present using a 3 percent discount rate, resulting in a net present value of $3,592,073.
Figure E: Avoided Victimization Costs per Annual Cohort of Youth Aged 16 and 17
Misdemeanors Felonies (F-I) Source(s)
Projected number of re-arrests
Based on current recidivism rates 6,950 3,042
NC recidivism rates (Sentencing and Policy Commission); NC arrest rates (State Bureau of Investigation)
After policy change, assuming a 10 percent reduction in recidivism
6,255 2,745 n/a
Avoided re-arrests 695 297 n/a
Percent crimes reported to the police 40% 40% National Crime Victimization Survey32
Total victimizations averted
1,724 737 n/a
Victim cost per misdemeanor/felony $ 500 $ 4,000 McCollister et al (2010) and Cohen et al. (2009)33
Avoided victim costs for misdemeanor/felony
$ 861,942 $ 2,947,778 n/a
Total avoided victim costs $ 3,809,721 n/a
Total avoided victim costs (discounted at 3%) $3,592,073 n/a
32 United States Department of Justice. Bureau of Justice Assistance (2009). National Crime Victimization Survey.
33 McCollister, Kathryn E., French, Michael T.; Fang, Hai. (2010). The Cost of Crime to Society: New Crime-Specific Estimates for Policy and Program Evaluation. Drug and Alcohol Dependence. Volume 108, Issue 1, pp. 98-109. Cohen, Mark A. and Alex Piquero. (2009). New Evidence on the Monetary Value of Saving a High Risk Youth. Journal of Quantitative Criminology, Volume 25, pp. 25-49.
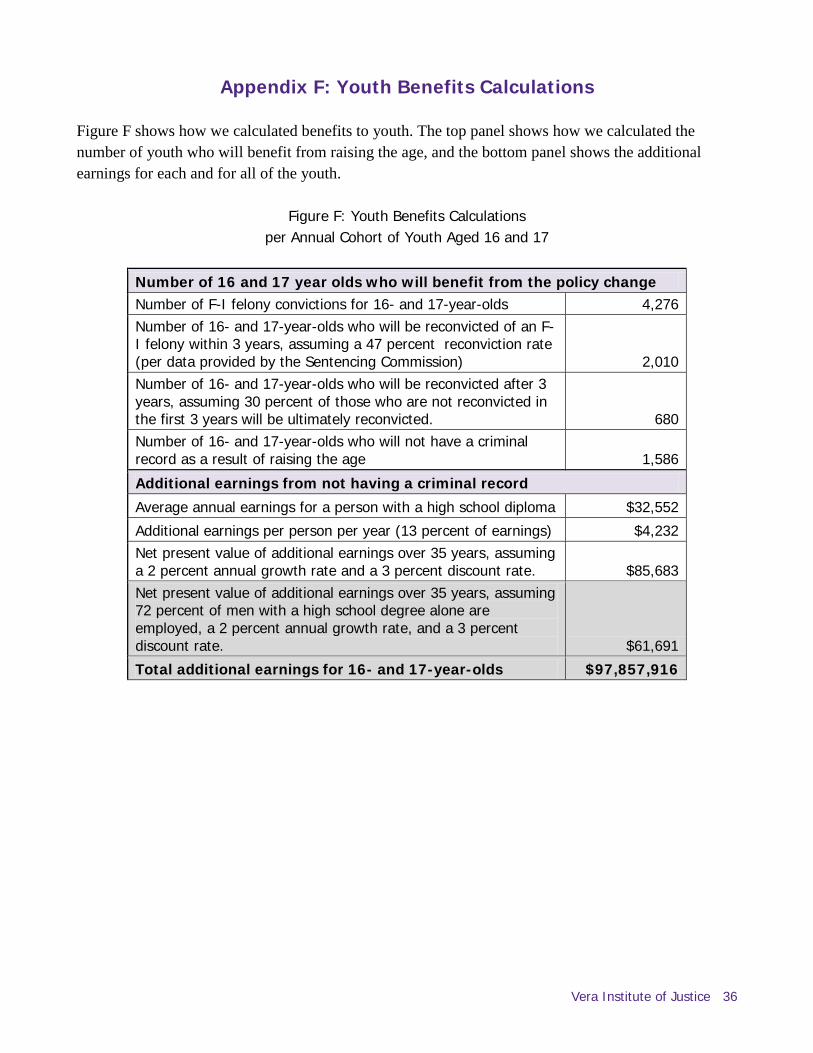
Vera Institute of Justice 36
Appendix F: Youth Benefits Calculations Figure F shows how we calculated benefits to youth. The top panel shows how we calculated the number of youth who will benefit from raising the age, and the bottom panel shows the additional earnings for each and for all of the youth.
Figure F: Youth Benefits Calculations per Annual Cohort of Youth Aged 16 and 17
Number of 16 and 17 year olds who will benefit from the policy change Number of F-I felony convictions for 16- and 17-year-olds 4,276 Number of 16- and 17-year-olds who will be reconvicted of an F-I felony within 3 years, assuming a 47 percent reconviction rate (per data provided by the Sentencing Commission) 2,010 Number of 16- and 17-year-olds who will be reconvicted after 3 years, assuming 30 percent of those who are not reconvicted in the first 3 years will be ultimately reconvicted. 680 Number of 16- and 17-year-olds who will not have a criminal record as a result of raising the age 1,586 Additional earnings from not having a criminal record Average annual earnings for a person with a high school diploma $32,552 Additional earnings per person per year (13 percent of earnings) $4,232 Net present value of additional earnings over 35 years, assuming a 2 percent annual growth rate and a 3 percent discount rate. $85,683 Net present value of additional earnings over 35 years, assuming 72 percent of men with a high school degree alone are employed, a 2 percent annual growth rate, and a 3 percent discount rate. $61,691 Total additional earnings for 16- and 17-year-olds $97,857,916

Vera Institute of Justice 37
Appendix G: Sensitivity Analysis Sensitivity analysis provides information about the degree to which our cost-benefit analysis results are sensitive to changes in the underlying assumptions. Conducting a sensitivity analysis involves varying important or uncertain assumptions and then examining the impact that these changes have on the results. We focus here on the variables that are the most difficult to predict, such as the level of investment in juvenile diversion programs and the impact of the juvenile justice system on recidivism rates. We also investigate the impact that capital costs have on the net benefit of the investment. Recidivism Rates In this analysis, one of the variables that involves the most uncertainty is the change in recidivism rates among 16- and 17-year-olds resulting from the policy change. We assume that the recidivism rate will be 10 percent lower in the juvenile than in the adult system. Since research findings on recidivism rates among youth tried in juvenile and adult systems are mixed, and because recidivism rates can be affected by many factors, we conducted sensitivity analyses using 0, 20, 30, and 40 percent recidivism rates.
As Figure G1 shows, the larger the reduction in recidivism, the greater taxpayer and victim benefits will be, while benefits to youth remain constant. If recidivism rates decline by 30 percent, the investment will generate $66.8 million in net benefits per annual cohort of youth, compared with $52.3 million if recidivism rates decline by only 10 percent. Most notably, the sensitivity analysis indicates that, even in a scenario where these is zero reduction in recidivism, the policy change generates a net benefit of $45 million resulting from the sizable youth benefits.
Figure G1: Sensitivity Analysis Various Reductions in Recidivism Among 16- and 17-Year-Olds
Net Present Value in Millions
Reduction in Recidivism
0% 10%* 20% 30% 40%
Taxpayer Costs ($70.9) ($70.9) ($70.9) ($70.9) ($70.9) Taxpayer Benefits $18.0 $21.7 $25.4 $29.0 $32.7 Victim Benefits $0 $3.6 $7.2 $10.8 $14.4 Youth Benefits $97.9 $97.9 $97.9 $97.9 $97.9 Net Benefit $45.0 $52.3 $59.5 $66.8 $74.1
* The cost-benefit analysis presented in the main body of the report assumes a recidivism reduction
of 10 percent.
Investment in Juvenile Programs One of the key assumptions in this cost-benefit analysis deals with the proportion of youth who will be diverted from detention and YDC placement. In the report, we assume that 30 percent of the 16- and

Vera Institute of Justice 38
17-year-olds who would be detained are instead referred to an alternative-to-detention (ATD) program and that 30 percent of those who would be committed to a YDC are instead referred to an alternative-to-placement (ATP) program. This assumption is based on the guidance from the System Costs Work Group that the use of confinement should be minimized and reserved for youth who are most likely to reoffend right away and/or fail to appear in court. Figure G2 shows how sensitive the cost-benefit results are to different rates of diversion to ATDs and ATPs.
The top portion of Figure G2 illustrates the costs and benefits of raising the age when 0, 10, 20, and 30 percent of youth are placed in ATDs and ATPs. If no youth are sent to diversion programs, the taxpayer cost of the policy change will be $77.1 million, and the net benefit will be $46.2 million. If 30 percent are diverted, the taxpayer cost decreases to $70.9 million and the net benefit increases to $52.3 million. The taxpayer cost and the net benefits change because diversion programs are less expensive than detention centers and YDCs.
The bottom portion of Figure G2 shows the impact of different diversion rates on detention beds, YDC beds, and associated capital costs. If no youth are sent to diversion programs, 122 detention beds and 226 YDC beds will be needed. These numbers decrease to 92 detention beds and 158 YDC beds in a scenario where 30 percent of youth are sent to diversion programs.
As discussed in the report, YDC capacity could be expanded either through new construction ($180,000 per bed) or by renovating existing off-line capacity ($45,606 per bed). The costs of both options are also presented in Figure G2.

Vera Institute of Justice 39
Figure G2: Sensitivity Analysis
Various Investments in Alternative Programs Net Present Value in Millions
Diversion Rate to ATDs and ATPs
0% 10% 20% 30%* 40%
Cost-Benefit Analysis Taxpayer Costs ($77.1) ($75.1) ($73.0) ($70.9) ($68.8) Law Enforcement ($7.9) ($7.9) ($7.9) ($7.9) ($7.9) Courts ($3.9) ($3.9) ($3.9) ($3.9) ($3.9) Youth Detention ($8.1) ($7.4) ($6.8) ($6.1) ($5.4) Youth Commitment ($21.0) ($18.9) ($16.8) ($14.7) ($12.2) Youth Supervision ($17.9) ($18.0) ($18.1) ($18.2) ($18.2) Youth Programs ($18.4) ($19.0) ($19.6) ($20.2) ($20.8) Taxpayer Benefits $21.77 $21.75 $21.72 $21.70 $21.67 Victim Benefits $3.67 $3.65 $3.62 $3.59 $3.57 Youth Benefits $97.9 $97.9 $97.9 $97.9 $97.9 Net Benefit $46.2 $48.2 $50.2 $52.3 $54.3
Capital Summary Beds
Youth Detention 122 112 102 92 82 YDC 226 203 181 158 136
Capital Costs Youth Detention $13.3 $12.2 $11.1 $10.0 $8.9 YDC New Construction $40.6 $36.6 $32.5 $28.5 $24.4 Renovation $10.3 $9.2 $8.2 $7.2 $6.2
* The cost-benefit analysis presented in the main body of the report assumes a diversion rate of 30
percent.

Vera Institute of Justice 40
Capital Costs We also conducted a sensitivity analysis to examine how incorporating the capital costs associated with the policy change affects the cost-benefit results. Figure G3 shows cost-benefit results for three scenarios: the first, which is the scenario presented in the report, excludes the capital costs from the analysis; the second includes the costs of constructing new detention centers and renovating YDC facilities; the third includes the costs of constructing both new detention centers and new YDC facilities. As the figure illustrates, including the renovation and construction costs does not substantially affect the bottom line of the analysis. Even large capital expenditures have a minimal impact in the cost-benefit analysis because the cost of a facility is allocated across its 20-year useful lifespan.
Figure G3: Sensitivity Analysis Cost-Benefit Analysis Inclusive of Capital/Renovation Costs
Net Present Value in Millions
Excluding Construction/Renovation
Costs*
Includes the Costs of New Construction for
Detention and Renovation for YDCs
Includes the Costs of New Construction for Both Detention and YDCs
Taxpayer Costs ($70.9) ($71.7) ($72.8) Taxpayer Benefits $21.7 $21.7 $21.7 Victim Benefits $3.6 $3.6 $3.6 Youth Benefits $97.9 $97.9 $97.9 Net Benefit $52.3 $51.4 $50.3 * The cost-benefit analysis presented in the main body of the report excludes construction/renovation costs.

Vera Institute of Justice 41
Appendix H: Taxpayer Costs and Benefits by Annual Cohort of Youth
This section discusses how taxpayer costs and benefits will occur over time and further explains the concept of the annual youth “cohort.” An outlay of $70.9 million would be necessary every year; and this cost would be partially offset by $18 million in benefits in the same year. In the subsequent three years (years two through four after the investment), justice system benefits would accrue due to lower victimization. Because the taxpayer benefits for each cohort end at year four, the costs and benefits from the taxpayer perspective are fully realized in year 4. Thus, the net taxpayer cost in year four ($49.2 million) will persist into perpetuity. While the per cohort taxpayer and victims benefits are modeled to end four years after the investment, the youth benefits for each cohort will persist for 35 years, the duration of the cohort’s working life.
Cost-benefit analysis can be used to assess taxpayer—and therefore budget—costs, but CBA is distinct from a fiscal note in two ways. First, we present estimated annual costs by cohort and do not account for the fact that actual costs will “phase-in” over several years. That is, it will take more than one budget year to serve each cohort that enters the juvenile justice system in any given year. The costs and benefits in year one will actually extend across two fiscal years, resulting in a smaller budget impact in year one. Second, we do not account for rising government costs such as scheduled wage increases or other escalation factors.
Figure H1: Taxpayer Costs and Benefits by Year Dollars in Millions
Year 1 Year 2 Year 3 Year 4Cohort 1Taxpayer Cost ($70.9)Taxpayer Benefit $18.0 $1.3 $1.2 $1.2Cohort 2Taxpayer Cost ($70.9)Taxpayer Benefit $18.0 $1.3 $1.2Cohort 3Taxpayer Cost ($70.9)Taxpayer Benefit $18.0 $1.3Cohort 4Taxpayer Cost ($70.9)Taxpayer Benefit $18.0All CohortsTaxpayer Cost ($70.9) ($70.9) ($70.9) ($70.9)Taxpayer Benefit $18.0 $19.3 $20.5 $21.7Net Taxpayer Cost ($52.9) ($51.6) ($50.4) ($49.2)