countermeasures that work - ems.gov · countermeasures that work: ... examine and report on...
TRANSCRIPT
Countermeasures That Work: A Highway Safety Countermeasure Guide
For State Highway Safety Offices
Prepared for the
National Highway Traffic Safety Administration U.S. Department of Transportation
By the Governors Highway Safety Association
Author: James H. Hedlund, Ph.D.
Highway Safety North
Executive Editor: Barbara Harsha
Governors Highway Safety Association
Editor: Katherine R. Hutt
Nautilus Communications, Inc.
2005
i
TTaabbllee ooff CCoonntteennttss
Introduction
Purpose of the Guide How to Use the Guide Abbreviations Used Throughout Acknowledgements User Suggestions and Future Editions
1. Alcohol-Impaired Driving 1-1 Overview 1-2 Strategies 1-4 Countermeasures That Work 1-6 Deterrence: Laws, Enforcement, Prosecution and Adjudication, DWI Offender Treatment, Monitoring, and Control 1-33 Prevention, Intervention, Communications and Outreach 1-40 Underage Drinking and Alcohol-related Driving 1-46 References 2. Safety Belts 2-1 Overview 2-2 Strategies 2-4 Countermeasures That Work 2-6 Laws 2-12 Enforcement 2-16 Communications and Outreach 2-19 Other Strategies 2-21 References 3. Aggressive Driving and Speeding 3-1 Overview 3-2 Strategies 3-3 Countermeasures That Work 3-5 Laws 3-8 Enforcement 3-13 Penalties and Adjudication 3-17 Communications and Outreach 3-18 References 4. Distracted and Fatigued Driving 4-1 Overview 4-2 Strategies 4-4 Countermeasures That Work 4-6 Laws and enforcement
ii
4-10 Communications and outreach 4-13 Other countermeasures 4-16 References 5. Motorcycle Safety 5-1 Overview 5-2 Strategies 5-4 Countermeasures That Work 5-6 Motorcycle Operator Licensing and Education 5-10 Motorcycle Helmets 5-14 Alcohol Impairment 5-18 Communications and Outreach 5-21 References 6. Young Drivers 6-1 Overview 6-2 Strategies 6-4 Countermeasures That Work 6-6 Graduated Driver Licensing 6-13 Driver Education 6-16 Parents 6-18 Traffic Law Enforcement 6-19 References 7. Older Drivers 7-1 Overview 7-3 Strategies 7-5 Countermeasures That Work 7-7 Communications and Outreach 7-10 Licensing 7-17 Traffic Law Enforcement 7-18 References
1
IInnttrroodduuccttiioonn Purpose of the Guide This guide is a basic reference to assist State Highway Safety Offices (SHSOs) in selecting effective, science-based traffic safety countermeasures for major highway safety problem areas. The guide:
o describes major strategies and countermeasures that are relevant to SHSOs; o summarizes their use, effectiveness, costs, and implementation time; and o provides references to the most important research summaries and individual studies.
The guide is not intended to be a comprehensive list of countermeasures available for State use or a list of expectations for SHSO implementation. For a description of an optimal State countermeasure program, SHSOs should refer to the Highway Safety Program Guidelines, which delineate the principal components of each of the major program areas. States should identify problem areas through systematic data collection and analysis and are encouraged to continue to apply innovation in developing appropriate countermeasures. The evaluations summarized in this guide allow SHSOs to benefit from the experience and knowledge gained by others and to select countermeasure strategies that have either proven to be effective or that have shown promise. States choosing to use innovative programs can contribute to the collective knowledge pool by carefully evaluating the effectiveness of their efforts and publishing the findings for the benefit of others. How to Use the Guide What’s included: The guide contains a chapter for each problem area. Each chapter begins with a brief overview of the problem area’s size and characteristics, the main countermeasure strategies, a glossary of key terms, and a few general references. Next, a table lists specific countermeasures and summarizes their use, effectiveness, costs, and implementation time. Each countermeasure is then discussed in approximately one page. The guide provides an overview and starting point for readers to become familiar with the behavioral strategies and countermeasures in each program area. It has attempted to include countermeasures that have the most evidence of effectiveness as well as those that are used most regularly by SHSOs. Only those countermeasures that could be supported by traditional highway safety grant programs have been considered. Some countermeasure areas are covered in more depth than others due to the availability of published research. For example, impaired driving has a long and rich research history while other topics, such as driver distraction and fatigue, have received less attention. This difference in the availability of published research findings is due to a number of factors, including the relative scale of the problem areas, the availability of reliable data on the frequency and characteristics of some safety problems, and the challenge of conducting scientifically valid studies in certain behavioral areas.
2
References are provided for each countermeasure. When possible, summaries of available research are cited, with Web links where available, so users can find most of the evaluation information in one place. If no summaries are available, one or two key studies are cited. There has been no attempt to list all research, current studies, or program information available on any countermeasure. Readers interested in any problem area or in specific countermeasures are urged to consult the references. What’s not included: Since the guide is intended as a tool for SHSO use, it does not include countermeasures for which SHSOs have little or no authority or responsibility, or that cannot be supported under typical highway safety grant programs. For example, the guide does not include vehicle- or roadway-based solutions. Also, it does not include countermeasures that are already in place in every State, such as .08 blood alcohol concentration (BAC) laws. Finally, the guide does not include administrative or management topics such as traffic safety data systems and analyses, program planning and assessments, State and community task forces, or comprehensive community traffic safety programs. What the effectiveness data means: The effectiveness of any countermeasure can vary immensely from State to State or community to community. What is done is often less important than how it is done. The best countermeasure may have little effect if it is not implemented vigorously, publicized extensively, and funded satisfactorily. Evaluation studies generally examine and report on high-quality implementation because there is little interest in evaluating poor implementation. Also, the fact that a countermeasure is being evaluated usually gets the attention of those implementing it, so that it is likely to be done well. The countermeasure effectiveness data presented in this guide probably show the maximum effect that can be realized with high-quality implementation. Many countermeasures have not been evaluated well, or at all, as noted in the effectiveness data.
NCHRP Guides: The National Cooperative Highway Research Program (NCHRP) is developing a series of guides for State DOTs to use in implementing the American Association of State Highway and Transportation Officials (AASHTO) Strategic Highway Safety Plan. As of summer 2005, 13 guides had been published and several more were being prepared. This guide draws heavily on the published NCHRP guides and on several draft guides. It differs from the NCHRP guides because it is written for SHSOs only, contains only behavioral countermeasures, and is considerably more concise. Readers are urged to consult the NCHRP guides relevant to their interests. They are available at safety.transportation.org/guides.aspx. Disclaimers: As with any attempt to summarize a large amount of sometimes-conflicting information, this guide is highly subjective. All statements, judgments, omissions, and errors are solely the responsibility of the author and do not necessarily represent the views of the Governors Highway Safety Association (GHSA) or NHTSA. Users who disagree with any statement or who wish to add information or key references are invited to send their comments and suggestions for future editions (see bottom of page 4 for details). New traffic safety programs and research appear almost weekly. Web sites change frequently. This means that this guide was out of date even before it was published. Readers interested in a
3
specific problem area or countermeasure are urged to contact NHTSA for up-to-date information. Abbreviations, acronyms, and initialisms used throughout:
• AAA: was the American Automobile Association but now the organization uses only the initials
• AAAFTS: AAA Foundation for Traffic Safety • AAMVA: American Association of Motor Vehicle Administrators • AARP: was the American Association of Retired Persons but now the organization uses
only the initials • AASHTO: American Association of State Highway and Transportation Officials • ADTSEA: American Driver and Traffic Safety Education Association • ALR: administrative license revocation • ALS: administrative license suspension • AMA: American Medical Association • ASA: American Society on Aging • BAC: blood alcohol concentration • CDC: Centers for Disease Control and Prevention • CTIA: Cellular Telecommunications and Internet Association • DOT: Department of Transportation (Federal or State) • DWI: driving while intoxicated • DWS: driving while driver’s license is suspended • FHWA: Federal Highway Administration • FMCSA: Federal Motor Carrier Safety Administration • GDL: graduated driver licensing • GHSA: Governors Highway Safety Association • HOS: hours of service • IIHS: Insurance Institute for Highway Safety • ITS: Intelligent Transportation Systems • MSF: Motorcycle Safety Foundation • NCHRP: National Cooperative Highway Research Program • NCSDR: National Center for Sleep Disorders Research • NCUTLO: National Committee on Uniform Traffic Laws and Ordinances • NHTSA: National Highway Traffic Safety Administration (U.S. DOT) • NIAAA: National Institute on Alcohol Abuse and Alcoholism (NIH) • NIH: National Institutes of Health • NMSL: National Maximum Speed Limit • NSC: National Safety Council • NSF: National Sleep Foundation • NTSB: National Transportation Safety Board • SFST: Standardized Field Sobriety Tests • SHSO: State Highway Safety Office • SMSA: National Association of State Motorcycle Safety Administrators
4
• STEP: selective traffic enforcement program • TIRF: Traffic Injury Research Foundation • TRB: Transportation Research Board • UVC: Uniform Vehicle Code
Acknowledgments: Many people provided invaluable help in the preparation of this guide.
• Eminent traffic safety researchers Daniel Mayhew, David Preusser, Ruth Shults, and Allan Williams recommended what countermeasures to include and what research studies were most useful.
• Governors Highway Safety Representatives or Coordinators Chuck Abbott of Nevada, Jim Champagne of Louisiana, Lorrie Laing of Ohio, Terry Pence of Texas, Priscilla Sinclair of Montana, and Kathy Swanson of Minnesota reviewed drafts, corrected errors, filled in gaps, and provided other valuable advice.
• Many people at NHTSA, too many to name individually, reviewed drafts and provided information on the most recent research and program activities. Special thanks go to Jo Ann Kelley for coordinating all NHTSA comments and advice.
User Suggestions and Future Editions NHTSA will update this guide annually and will expand it with additional problem areas and countermeasures as appropriate. Users are invited to provide their suggestions and recommendations for the guide:
• How can it be improved, in form and content? • Specific comments on information in the guide. • Additional problem areas to include. • Additional countermeasures to include for the current problem areas. • Additional key references to include.
Please send your suggestions and recommendations to:
Countermeasures That Work NHTSA Office of Research and Technology, NTI-130 400 Seventh Street SW., Room 5119 Washington, DC 20590 or by e-mail to [email protected] .
1 - 1
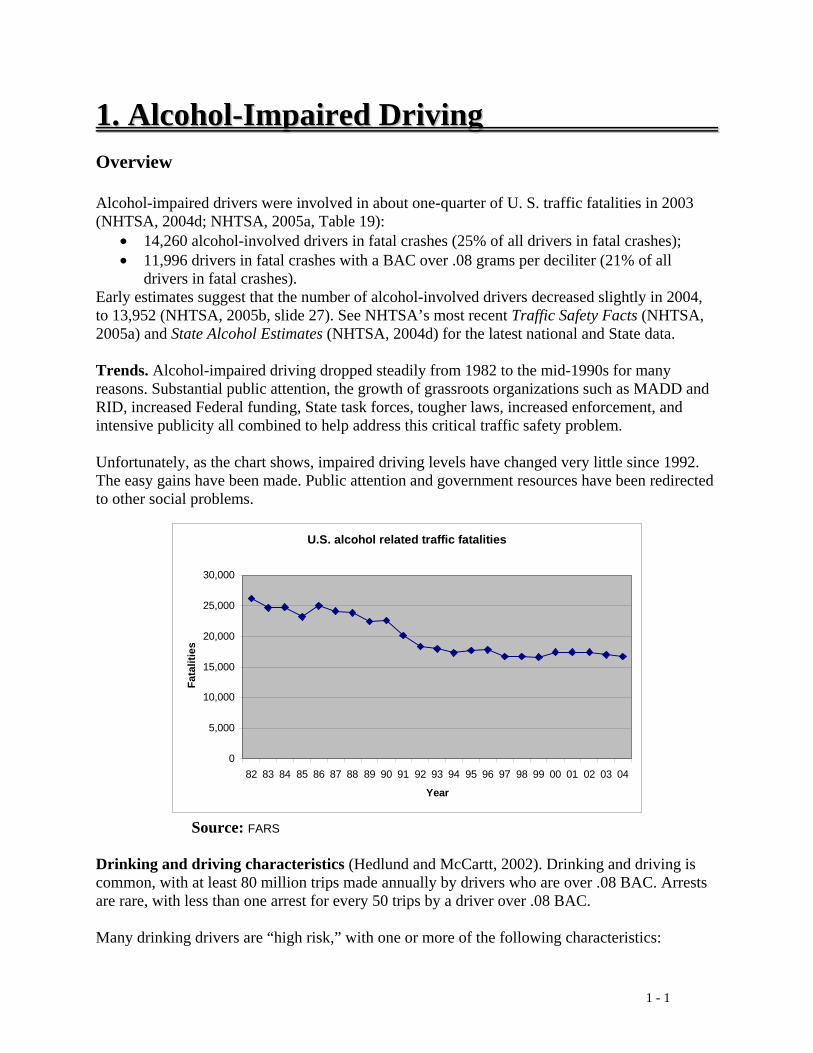
11.. AAllccoohhooll--IImmppaaiirreedd DDrriivviinngg Overview Alcohol-impaired drivers were involved in about one-quarter of U. S. traffic fatalities in 2003 (NHTSA, 2004d; NHTSA, 2005a, Table 19):
• 14,260 alcohol-involved drivers in fatal crashes (25% of all drivers in fatal crashes); • 11,996 drivers in fatal crashes with a BAC over .08 grams per deciliter (21% of all
drivers in fatal crashes). Early estimates suggest that the number of alcohol-involved drivers decreased slightly in 2004, to 13,952 (NHTSA, 2005b, slide 27). See NHTSA’s most recent Traffic Safety Facts (NHTSA, 2005a) and State Alcohol Estimates (NHTSA, 2004d) for the latest national and State data. Trends. Alcohol-impaired driving dropped steadily from 1982 to the mid-1990s for many reasons. Substantial public attention, the growth of grassroots organizations such as MADD and RID, increased Federal funding, State task forces, tougher laws, increased enforcement, and intensive publicity all combined to help address this critical traffic safety problem. Unfortunately, as the chart shows, impaired driving levels have changed very little since 1992. The easy gains have been made. Public attention and government resources have been redirected to other social problems.
Source: FARS Drinking and driving characteristics (Hedlund and McCartt, 2002). Drinking and driving is common, with at least 80 million trips made annually by drivers who are over .08 BAC. Arrests are rare, with less than one arrest for every 50 trips by a driver over .08 BAC. Many drinking drivers are “high risk,” with one or more of the following characteristics:
U.S. alcohol related traffic fatalities
0
5,000
10,000
15,000
20,000
25,000
30,000
82 83 84 85 86 87 88 89 90 91 92 93 94 95 96 97 98 99 00 01 02 03 04
Year
Fata
litie
s
1 - 2
• Half of drinking drivers in crashes or arrests have a BAC of .15 or higher. • One-third of drinking drivers in crashes or arrests have a prior DWI conviction. • One-quarter of drinking drivers in surveys have some indication of an alcohol problem.
Alcohol-impaired driving is affected by several external factors, including geography, urbanization, road structure and conditions, and economic activity, as well as by a State’s laws and programs. For all of these reasons, both the current level of alcohol-impaired driving and the progress in reducing alcohol-impaired driving vary greatly from State to State. For example, comparing all 50 States and the District of Columbia (NHTSA, 2004d):
• the proportion of drivers in fatal crashes with a BAC of .08 or more in 2003 ranged from 8 percent in the lowest State to 31 percent in the highest.
• The change in traffic fatalities involving any alcohol from 1982 to 2003 ranged from a decrease of 63 percent in the best State to an increase of 11 percent in the worst.
Strategies to Reduce Alcohol-Impaired Driving Five basic strategies are used to reduce alcohol-impaired driving crashes and consequences:
• Deterrence: enact, publicize, enforce, and adjudicate laws prohibiting alcohol-impaired driving;
• Prevention and intervention: reduce drinking, keep drinkers from driving; • Communications and outreach: inform the public of the dangers of impaired driving and
establish positive social norms that make driving while impaired unacceptable; • Alcohol treatment: reduce alcohol dependency or addiction among drivers; • Other traffic safety measures: implement strategies that affect alcohol-impaired drivers
and other drivers as well. This chapter includes countermeasures for the first four strategies. Deterrence countermeasures are divided into four sections: (1) laws, (2) enforcement, (3) prosecution and adjudication, and (4) offender treatment, monitoring, and control. Alcohol treatment is included in the offender section. Prevention, intervention, communications, and outreach countermeasures are combined in a single section. The Underage Drinking and Alcohol-Related Driving section includes deterrence, prevention, and communications measures specific to this age group. Many other traffic safety countermeasures help reduce alcohol-related crashes and casualties but are not discussed in this chapter. Behavioral countermeasures, such as those that increase safety belt use and reduce speeding, are discussed in other chapters. Vehicle and environmental countermeasures, such as improved vehicle structures and centerline rumble strips, are not included because SHSOs have little or no authority or responsibility for them. See the series of NCHRP Report 500 guides for the AASHTO Strategic Highway Safety Plan, especially the impaired driving guide (NCHRP, under review), for detailed discussions of environmental measures.
1 - 3
Key terms • BAC: Blood alcohol concentration in the body, expressed as grams of alcohol per
deciliter (g/dL) of blood, usually measured with a breath or blood test. • DWI: the offense of driving while impaired by alcohol. In different States the offense
may be called Driving While Intoxicated, Driving Under the Influence (DUI), or other similar terms.
• MADD: Mothers Against Drunk Driving. • PAS: Passive Alcohol Sensor, a device to detect alcohol presence in the air near a
driver’s face, used to estimate whether the driver has been drinking. • PBT: Preliminary Breath Test device, a small handheld alcohol sensor used to estimate
or measure a driver’s BAC. • RID: Remove Intoxicated Drivers • SFST: Standardized Field Sobriety Tests, a battery of three simple performance tasks
(One-Leg Stand, Walk-and-Turn, and Horizontal Gaze Nystagmus) used by law enforcement at the roadside to estimate whether a driver is impaired by alcohol.
• Illegal per se law: A law that makes it an offense in and of itself to operate a motor vehicle with a BAC at or above a specified level.

1 - 4
Countermeasures That Work Countermeasures to reduce alcohol-impaired driving are listed below and discussed individually in the remainder of this chapter. The table is intended to give a rough estimate of each countermeasure’s effectiveness, use, cost, and time required for implementation. The terms used are described below. Effectiveness, cost, and time to implement can vary substantially from State to State and community to community. Costs for many countermeasures are difficult to measure, so the summary terms are very approximate. See each countermeasure discussion for more information. 1. Deterrence: laws Countermeasure Effectiveness Use Cost Time 1.1 ALR/ALS Proven High High Medium 1.2 BAC test refusal penalties Proven-refusals Unknown Low Short 1.3 High-BAC sanctions Uncertain Medium Low Short 1.4 Open containers Uncertain High Low Short 1.5 DWI code review Likely Low Medium Medium 2. Deterrence: enforcement Countermeasure Effectiveness Use Cost Time 2.1 Sobriety checkpoints Proven Medium High Short 2.2 Saturation patrols Proven-arrests High Medium Short 2.3 Integrated enforcement Likely Unknown Low Short 2.4 Preliminary Breath Test Devices Proven- arrests High Medium Short 2.5 Passive sensors Proven-arrests Unknown Medium Short 3. Deterrence: prosecution and adjudication Countermeasure Effectiveness Use Cost Time 3.1 Sanctions Varies Varies Varies Varies 3.2 Diversion, plea agreement restrictions Proven-convictions Medium Low Short 3.3 DWI courts Likely Low High Medium 3.4 Court monitoring Proven-convictions Unknown Low Short 4. Deterrence: DWI offender treatment, monitoring, and control Countermeasure Effectiveness Use Cost Time 4.1 Alcohol problem assessment, treatment Proven High Varies Varies 4.2 DWI offender monitoring Proven-recidivism Unknown High Medium 4.3 Alcohol interlocks Proven Medium Medium Medium 4.4 Vehicle and license plate sanctions Varies Medium Varies Medium 4.5 Lower BAC limit for repeat offenders Uncertain Low Low Short

1 - 5
5. Prevention, intervention, communications and outreach Countermeasure Effectiveness Use Cost Time 5.1 Responsible beverage service Likely Medium Medium Medium 5.2 Alternative transportation Unknown Unknown Medium Short 5.3 Designated drivers Unknown Medium Low Short 5.4 Alcohol screening and brief interventions Proven Medium Medium Short 5.5 Mass-media campaigns Proven * High High Medium * High-quality campaigns supporting other program activities, such as enforcement 6. Underage drinking and alcohol-related driving Countermeasure Effectiveness Use Cost Time 6.1 Age 21 enforcement Varies Varies Varies Varies 6.2 Zero-tolerance enforcement Likely Unknown Medium Short 6.3 School education programs Uncertain Unknown Low Long 6.4 Youth programs Uncertain High Varies Medium Effectiveness: Proven: demonstrated by several high-quality evaluations with consistent results Likely: balance of evidence from high-quality evaluations or other sources Uncertain: limited and perhaps ambiguous evidence Unknown: no high-quality evaluation evidence Varies: different methods of implementing this countermeasure produce different results Effectiveness is measured by reductions in crashes or injuries unless noted otherwise. See individual countermeasure descriptions for information on effectiveness size and how effectiveness is measured. Use: High: more than two-thirds of the States, or a substantial majority of communities Medium: between one-third and two-thirds of States or communities Low: less than one-third of the States or communities Unknown: data not available Cost to implement: High: requires extensive new facilities, staff, equipment, or publicity, or makes heavy
demands on current resources Medium: requires some additional staff time, equipment, facilities, and/or publicity Low: can be implemented with current staff, perhaps with training; limited costs for equipment, facilities, and publicity Time to implement: Long: more than one year Medium: more than three months but less than one year Short: three months or less These estimates do not include the time required to enact legislation or establish policies.

1 - 6
Deterrence Deterrence means enacting laws that prohibit driving while impaired, publicizing and enforcing those laws, and punishing the offenders. Deterrence works by changing behavior through the fear of punishment. If drivers believe that impaired driving is likely to be detected and that impaired drivers are likely to be arrested, convicted, and punished, many will not drive while impaired by alcohol. This strategy is sometimes called general deterrence because it influences the general driving public through well publicized and highly visible enforcement activities and subsequent punishment. In contrast, specific deterrence refers to efforts to influence drivers who have been arrested for impaired driving so that they will not continue to drive while impaired by alcohol. Deterrence works when consequences are swift, sure, and severe (with swift and sure being more important in affecting behavior than severe). All States have the basic laws in place to define impaired driving, set illegal per se limits at .08 BAC, and provide standard penalties. Deterrence, however, is far from straightforward, and complexities can limit the success of deterrence measures. For instance:
• Detecting alcohol-impaired drivers is difficult. Alcohol-impaired driving is a common behavior, law enforcement agencies have limited resources, and (except at checkpoints) officers must observe some traffic violation or other aberrant behavior before they can stop a motorist.
• Conviction also may be difficult. DWI laws are extremely complicated (20 pages in some State codes); the evidence needed to define and demonstrate impairment is complex; judges and juries may not impose specified penalties for an action that they do not believe is a “real crime.”
• The DWI control system is complex. There are many opportunities for breakdowns in the system that allow impaired drivers to go unpunished.
DWI control system operations and management. The DWI control system consists of a set of laws together with the enforcement, prosecution, adjudication, and offender follow-up policies and programs to support the laws. In this complicated system, the operations of each component affect all the other components. Each new policy, law, or program affects operations throughout the system, often in ways that are not anticipated. This guide documents 16 specific impaired driving countermeasures in the deterrence section, in four groups: laws, enforcement, prosecution and adjudication, and offender treatment, monitoring, and control. But the overall DWI control system, including its management and leadership, is more important than any individual countermeasure. Recent studies have highlighted the key characteristics of an efficient and effective DWI control system (Hedlund and McCartt, 2002; Robertson and Simpson, 2003):
• Training and education for law enforcement, prosecutors, judges, and probation officers; • record systems that are accurate, up-to-date, easily accessible, and able to track each DWI
offender from arrest through the completion of all sentence requirements;
1 - 7
• adequate resources for staff, facilities, training, equipment, and new technology; and • coordination and cooperation within and across all components.
A few of the countermeasures discussed in this guide, such as BAC test refusal penalties (Chapter 1, Section 1.2), DWI code review (1.5), and DWI courts (3.2), are directed at improving DWI system operations. Most, though, are not. The most important action many SHSOs can take to reduce alcohol-impaired driving may be to review and improve DWI control system operations, perhaps using a State DWI task force and/or a State alcohol program assessment. Ulmer et al. (1999) investigated why some States reduced alcohol-related traffic fatalities more than others. They concluded that there is no “silver bullet,” no single critical law, enforcement practice, or communications strategy. Once a State has effective laws, high-visibility enforcement, and substantial communications and outreach to support them, the critical factors are strong leadership, commitment to reducing impaired driving, and adequate funding. SHSOs should keep this in mind as they consider the specific countermeasures in this chapter.
1 - 8
1.1 Administrative License Revocation or Suspension (ALR or ALS) Effectiveness: Proven Use: High Cost: High Time: Medium Administrative license revocation or administrative license suspension laws allow law enforcement and driver licensing authorities to revoke or suspend a driver's license if the driver fails or refuses to take a BAC test. The license revocation or suspension occurs very quickly: usually the arresting officer takes the license at the time that a BAC test is failed or refused. The driver typically receives a temporary license that allows the driver time to make other transportation arrangements and to request and receive an administrative hearing or review. In most jurisdictions, offenders may obtain an occupational or hardship license during part or all of the revocation or suspension period (NCHRP, 2003; NHTSA, 2002a; McCartt et al., 2002). ALR and ALS laws provide for swift and certain penalties for DWI, rather than the lengthy and uncertain outcomes of criminal courts. They also protect the driving public by removing some DWI offenders from the road (but see the discussion of driving with a suspended license, under other issues, below). Use: As of July 2005, 41 States and the District of Columbia had some form of ALR or ALS law. An additional two States had an alternative method for removing the license quickly, before criminal action in court (McCartt et al., 2002; NHTSA, 2004a; NHTSA, 2005c). Effectiveness: A summary of 12 evaluations through 1991 found that ALR and ALS laws reduced crashes of different types by an average of 13 percent (Wagenaar et al., 2000). Studies that evaluated ALR in combination with other laws found similar effects. More recently, Voas and Tippetts found that ALR laws in combination with other laws reduced alcohol-related fatal crashes by about 30 percent over the period 1982-1997 (Jones and Lacey, 2001, pp. 105-106). There is some evidence that ALR laws also are effective in reducing repeat offenses (Jones and Lacey, 2001, pp. 105-106). The Centers for Disease Control and Prevention concluded that ALR and ALS effectiveness is so well established that a synthesis of the evaluation evidence is not needed. Costs: ALR laws require funds to design, implement, and operate a system to record and process administrative license actions. In addition, a system of administrative hearing officers must be established and maintained. Some States have recovered ALR system costs through offender fees (Century Council, 2003, 57-61). Time to implement: 6 to 12 months are required to design and implement the system and to recruit and train administrative hearing officers. Other issues:
• Two-track system: Under ALR or ALS laws, drivers face both administrative and criminal actions for DWI. The two systems operate independently. Drivers whose licenses have been suspended or revoked administratively still may face criminal actions that also may include license suspension or revocation. This two-track system has been
1 - 9
challenged in some States. All State supreme courts have ruled against these challenges (NHTSA, 2004a).
• Driving with a suspended license: Many DWI offenders continue to drive with a suspended or revoked license, though there is some evidence that they drive less frequently and/or more carefully than before their license action. Both administrative and criminal laws that remove a driver’s license should be accompanied by strategies to reduce driving with a suspended or revoked license (see NCHRP, 2003, for a thorough discussion of ten potential strategies; see also Chapter 1, Sections 4.3 and 4.4).
• Hearings: An effective ALR system will restrict administrative hearings to the relevant facts: that the arresting officer had probable cause to stop the car and require a BAC test and that the driver refused or failed the test. Such a system will reduce the number of hearings requested, reduce the time required for each hearing, and minimize the number of licenses that are reinstatestated. When administrative hearings are not restricted in this way they can serve as an opportunity for defense attorneys to question the arresting officer about many aspects of the DWI case. This may reduce the chance of a criminal DWI conviction (Hedlund and McCartt, 2002, pp. 58-59). Officers often spend substantial time appearing in person at ALR hearings, and cases may be dismissed if an officer fails to appear. Some States use telephonic hearings to solve these problems (Wiliszowski et al, 2003).
1 - 10
1.2 BAC Test Refusal Penalties Effectiveness: Proven-refusals Use: Unknown Cost: Low Time: Short A driver’s BAC is a critical piece of evidence in any alcohol-impaired driving action. A positive BAC provides evidence of alcohol presence that supports the basic DWI charge. All States have enacted per se laws under which it is illegal to drive with a BAC of .08 or greater, with no other evidence required. Many States have established more severe penalties for drivers with BACs that exceed a specific higher BAC level, typically .15 or .16 (see Chapter 1, Section 1.3, High BAC Sanctions). Finally, administrative license revocation or suspension (ALR or ALS) laws are based entirely on the driver’s BAC level. However, many drivers refuse to provide a breath or blood sample for a BAC test. In 2001, in half the States with BAC testing data more than 18 percent of drivers refused a BAC test and in one-quarter of the States more than 32 percent refused (Zwicker et al, 2005, p. 6; data from 41 States). All States have established separate penalties for BAC test refusal, typically involving administrative license revocation or suspension. If the penalties for refusal are less severe than the penalties for failing the test, many drivers will refuse (see also Simpson and Robertson, 2001, pp. 39-46). The Model DWI code sets a more severe penalty for test refusal than for test failure (NCUTLO, 2000). Use: The relative penalties in each State for failing and refusing a BAC test cannot be categorized in a straightforward manner due to the complexity of State alcohol-impaired driving laws. Zwicker et al. (2005) summarized each State’s laws as of 2001 in Appendices A and B. NHTSA (2002a) gives more detail on each State’s laws. Effectiveness: Zwicker et al. (2005) found that test refusal rates are lower in States where the consequences of test refusal are greater than the consequences of test failure. These consequences are determined both by the statutory penalties for test refusal and failure and by operational considerations of the DWI system. Operational considerations include issues such as whether test refusal is admissible in court as part of the DWI proceedings and whether hardship licenses are routinely available for drivers whose licenses are suspended for test refusal. Reduced test refusal rates will help the overall DWI control system by providing better BAC evidence. This in turn should reduce pleas to non-alcohol offenses, increase DWI and high-BAC DWI convictions, increase the likelihood that prior DWI offenses will be properly identified, and provide the court with better evidence for offender alcohol assessment. Costs: There are no direct costs of increasing penalties for BAC test refusal. Time to implement: Increased BAC test refusal penalties can be implemented as soon as appropriate legislation is enacted. Other issues:
• Criminalizing test refusal: BAC test refusal is a criminal offense in at least some circumstances in nine States (Zwicker et al, 2005, Appendix A; see also Century Council, 2002, p. 31; NCHRP, under review, Strategy C2).
1 - 11
1.3 High-BAC Sanctions Effectiveness: Uncertain Use: Medium Cost: Low Time: Short Many States increase the penalties for the standard impaired driving (DWI) offense for two classes of drivers. Almost all States increase the penalties for repeat offenders. Recently, some States also have increased the penalties for drivers with a high BAC, typically .15 or .16 or higher. High-BAC sanctions are based on the observation that many high-BAC drivers are habitual impaired driving offenders, even though they may not have a record of previous arrests and convictions. Use: As of July 2005, 32 States and the District of Columbia had high-BAC laws (Century Council, 2003, p. 56; McCartt and Northrup, 2003, Appendix A; NHTSA, 2005c).
Effectiveness: In the only evaluation of high-BAC sanctions to date, McCartt and Northrup (2003, 2004) found that Minnesota’s law appears to have increased the severity of case dispositions for high-BAC offenders, although the severity apparently declined somewhat over time. They also found some evidence of an initial decrease in recidivism among high-BAC first offenders. The BAC test refusal rate declined for first offenders and was unchanged for repeat offenders after the high-BAC law was implemented. The authors point out that Minnesota’s law has a high threshold of .20 BAC, relatively strong administrative and criminal sanctions, and strong penalties for BAC test refusal.
Costs: High-BAC sanctions will produce increased costs if the high-BAC penalties are more costly per offender than the lower-BAC penalties. Over a longer period, if high-BAC sanctions reduce recidivism and deter alcohol-impaired driving, then costs will decrease. Time to implement: High-BAC sanctions can be implemented as soon as appropriate legislation is enacted. Other issues:
• Test refusal: High-BAC laws may encourage some drivers to refuse the BAC test unless the penalties for test refusal are at least as severe as the high-BAC penalties. See Chapter 1, Section 1.2.
1 - 12
1.4 Open Containers Effectiveness: Uncertain Use: High Cost: Low Time: Short Open-container laws prohibit the possession and consumption of alcoholic beverages by motor vehicle drivers or passengers. These laws typically exempt passengers in buses, taxis, and the living quarters of mobile homes. In 1998, Congress required States to enact open-container laws or have a portion of their Federal aid highway construction funds redirected to alcohol-impaired driving or hazard elimination activities (23 U.S.C. § 154; NHTSA, 2004b). Use: As of July 2005, 38 States and the District of Columbia had open-container laws that complied with the Federal requirements (NHTSA, 2004b, NHTSA, 2005c).
Effectiveness: The only study of open-container law effectiveness (Stuster et al., 2002) examined four States that enacted laws in 1999. It found that three of the four States appeared to decline in their proportions of alcohol-involved fatal crashes during the first six months after the laws were implemented, but the declines were not statistically significant. In 1999, the proportion of alcohol-involved fatal crashes was higher in States with no open-container law than in States with a law. Survey data show strong public support for open-container laws in both law- and no-law States.
Costs: Open-container law costs depend on the number of offenders detected and the penalties applied to them. Time to implement: Open-container laws can be implemented as soon as appropriate legislation is enacted.

1 - 13
1.5 Alcohol-impaired Driving Law Review Effectiveness: Likely Use: Low Cost: Medium Time: Medium Alcohol-impaired driving laws in many States are extremely complex. They are difficult to understand, enforce, prosecute, and adjudicate, with many inconsistencies and unintended consequences. In many States, a thorough review and revision would produce a system of laws that would be far simpler and more understandable, efficient, and effective. DWI laws have evolved over the past 30 years to incorporate new definitions of the offense of driving while impaired (illegal per se laws), new technology and methods for determining impairment (BAC tests, Standardized Field Sobriety Tests), and new sentencing and monitoring alternatives (electronic monitoring, alcohol ignition interlocks). Many States modified their laws to incorporate these new ideas without reviewing their effect on the overall DWI control system. The result is often an inconsistent patchwork. Robertson and Simpson (2003, p. 18) summarized the opinions of thousands of law enforcement officers, prosecutors, judges, and probation officials across the country: “Professionals unanimously support the simplification and streamlining of existing DWI statutes.” See also Hedlund and McCartt (2002, p. 53). The National Committee on Uniform Traffic Laws and Ordinances has prepared a model DWI law, which has been incorporated into the Uniform Vehicle Code (NCUTLO, 1999). It addresses BAC testing, BAC test refusals, higher penalties for high-BAC drivers, ALR hearing procedures, and many other issues of current interest. States can use the NCUTLO model as a reference point in reviewing their own laws. Use: Minnesota and Virginia recently reviewed and revised their DWI laws.
Effectiveness: The effect of a law review will depend on the extent of inconsistencies and inefficiencies in current State law. In many States a law review may be the most important single action a State can take to address its alcohol-impaired driving problem, because a thorough law review also will review the function of the entire DWI control system and will identify problem areas. The immediate effect of a law review will be a more efficient and effective DWI control system.
Costs: The review itself will require substantial staff time. Outside groups, such as the defense bar and citizen groups, should be asked to participate. Implementation costs of course will depend on the extent to which the laws are changed. Time to implement: The review will require four to six months. Its recommendations must then be enacted by the legislature and implemented.
1 - 14
2.1 Sobriety Checkpoints Effectiveness: Proven Use: Medium Cost: High Time: Short At a sobriety checkpoint, law enforcement officers stop vehicles at a predetermined location to check whether the driver is impaired. They either stop every vehicle or stop vehicles at some regular interval, such as every third or tenth vehicle. The purpose of checkpoints is to deter driving after drinking by increasing the perceived risk of arrest. To do this, checkpoints should be highly visible, publicized extensively, and conducted regularly. Fell et al. (2004) provide an overview of checkpoint operations, use, effectiveness, and issues. Use: Sobriety checkpoints are used occasionally in most of the 39 States in which they are permitted, but few States conduct them regularly. Fell et al. (2003) found that 37 States and the District of Columbia conducted checkpoints at least once in the year 2000 but only 11 States conducted them on a weekly basis. The main reasons given for not using checkpoints more frequently were lack of law enforcement personnel and lack of funding. Some States have increased checkpoint operations recently. For example, each of the six jurisdictions in NHTSA’s Mid-Atlantic Region (the District of Columbia, Delaware, Maryland, Pennsylvania, Virginia, and West Virginia) conducted weekly checkpoints for much of 2003. Effectiveness: CDC’s systematic review of 11 high-quality studies (Elder et al., 2002) found that checkpoints reduced alcohol-related fatal, injury, and property damage crashes each by about 20 percent. Costs: The main costs are for law enforcement time and for publicity. A typical checkpoint requires several hours from each law enforcement officer involved. Officers must either be diverted from other duties or paid overtime. Law enforcement costs can be reduced by operating checkpoints with 3 to 5 officers, perhaps supplemented by volunteers, instead of the 10 to 12 or more officers used in some jurisdictions (NHTSA, 2002b, p. 4; Stuster and Blowers, 1995). Recently, police agencies in two rural West Virginia counties were able to sustain a year-long program of weekly low-manpower checkpoints (Lacey et al., 2005). The proportion of nighttime drivers with BACs of .05 and higher was 70 percent lower in these counties, compared to drivers in comparison counties that did not operate additional checkpoints. Checkpoint publicity can be costly if paid media are used. Time to implement: Checkpoints can be implemented within three months if officers are trained in detecting impaired drivers, SFST, and checkpoint operational procedures. See NHTSA (2002b) for implementation information. Other issues:
• Legality: Checkpoints currently are permitted in 39 States and the District of Columbia (NHTSA, 2002b). Checkpoints are permitted under the U.S. Constitution but some State courts have held that checkpoints violate their State’s constitution. Other State legislatures have not authorized checkpoints. States where checkpoints are not permitted may use saturation patrols (see Chapter 1, Section 2.2).
1 - 15
• Publicity: Checkpoints must be highly visible and publicized extensively to be effective. Communication and enforcement plans should be coordinated. Messages should clearly and unambiguously support enforcement. Paid media may be necessary to complement news stories and other earned media, especially in a continuing checkpoint program (NCHRP, under review, Strategy B1).
• Arrests: The purpose of checkpoints is to deter impaired driving, not to increase arrests. Impaired drivers detected at checkpoints should be arrested and arrests should be publicized, but arrests at checkpoints should not be used as a measure of checkpoint effectiveness.
• Other offenses: Checkpoints may also be used to check for valid driver licenses, safety belt use, outstanding warrants, stolen vehicles, and other traffic and criminal infractions.
1 - 16
2.2 Saturation Patrols Effectiveness: Proven-arrests Use: High Cost: Medium Time: Short A saturation patrol (also called a blanket patrol, “wolf pack,” or dedicated DWI patrol) consists of a large number of law enforcement officers patrolling a specific area for a set time to detect and arrest impaired drivers. The purpose of saturation patrols is to arrest impaired drivers and also to deter driving after drinking by increasing the perceived risk of arrest. To do this, saturation patrols should be publicized extensively and conducted regularly. A less-intensive strategy is the “roving patrol” in which individual patrol officers concentrate on detecting and arresting impaired drivers in an area where impaired driving is common or where alcohol-involved crashes have occurred (Stuster, 2000). Use: The Century Council (2003, p. 20) survey reported that 44 States used saturation patrols. Effectiveness: Saturation patrols can be very effective in arresting impaired drivers. For example, in 2001 Minnesota’s 96 saturation patrols stopped 13,681 vehicles and arrested 566 impaired drivers (Century Council, 2003). The effects of saturation patrols on alcohol-related crashes or injuries have not been evaluated. Costs: The main costs are for law enforcement time and for publicity. Saturation patrol operations are quite flexible in both the number of officers required and the time that each officer participates in the patrol. As with sobriety checkpoints, publicity can be costly if paid media is used. Time to implement: Saturation patrols can be implemented within three months if officers are trained in detecting impaired drivers and in SFST. See NHTSA (2002b) for implementation information. Other issues:
• Legality: Saturation patrols are legal in all jurisdictions. • Publicity: Saturation patrols should be publicized extensively to be effective in deterring
impaired driving. Communication and enforcement plans should be coordinated. Messages should clearly and unambiguously support enforcement. Paid media may be necessary to complement news stories and other earned media, especially in a continuing saturation patrol program (NCHRP, under review, Strategy B2).
• Other offenses: Saturation patrols are effective in detecting other driving and criminal offenses.

1 - 17
2.3 Integrated Enforcement Effectiveness: Likely Use: Unknown Cost: Low Time: Short Impaired drivers are detected and arrested through regular traffic enforcement and crash investigations as well as through special impaired driving checkpoints and saturation patrols. A third opportunity is to integrate impaired driving enforcement into special enforcement activities directed primarily at other offenses such as speeding or safety belt use, especially since impaired drivers often speed or fail to wear safety belts. Use: There is no data on how frequently integrated enforcement methods are used. Effectiveness: Jones et al. (1995) evaluated a three-site evaluation of integrated impaired driving, speed, and safety belt use enforcement. They found that the sites that combined high publicity with increased enforcement reduced crashes likely to involve alcohol (such as single-vehicle nighttime crashes) by 10 percent to 35 percent. They concluded that the results were encouraging but not definitive. See also Jones and Lacey (2001, pp. 113-115), NCHRP (under review, Strategy B2), and Stuster (2000). The Massachusetts Saving Lives comprehensive programs in five communities used integrated enforcement methods. The programs reduced fatal crashes involving alcohol by 42 percent (Hingson et al., 1996). About half the speeding drivers detected through these enforcement activities had been drinking and about half the impaired drivers were speeding. Costs: As with other enforcement strategies, the primary costs are for law enforcement time and for publicity. Time to implement: Impaired driving can be integrated into other enforcement activities within three months if officers are trained in detecting impaired drivers and in SFST. Other issues:
• Publicity: Integrated enforcement activities should be publicized extensively to be effective in deterring impaired driving and other traffic offenses. Paid media may be necessary to complement news stories and other earned media, especially in a continuing saturation patrol program.
• Priorities: Integrated enforcement activities send a message to the public and to law enforcement officers alike that traffic safety is not a single-issue activity.
1 - 18
2.4 Preliminary Breath Test Devices (PBTs) Effectiveness: Proven-arrests Use: High Cost: Medium Time: Short A preliminary breath tester is a small handheld alcohol sensor used to estimate or measure a driver’s BAC. Law enforcement officers use PBTs in the field to help establish evidence for a DWI arrest. The driver blows into a mouthpiece and the PBT displays either a numerical BAC level, such as .12, or a BAC range, such as a red light for BACs above .08. Several PBT models are available commercially. They are quite accurate and generally reliable. NHTSA maintains a “Conforming Products List” of alcohol testing and screening instruments, including PBTs, that meet accuracy and reliability standards (NHTSA, 2004e). Use: PBTs are used in 39 States to provide evidence of alcohol use to support a DWI arrest (Century Council, 2003, p. 24). This evidence of alcohol use is admissible in court in approximately half the States, but in most States PBT evidence cannot be used to establish a driver’s BAC. California allows officers to use PBT evidence to enforce zero-tolerance laws: Officers at the roadside can issue a citation and seize the driver’s license (Ferguson et al., 2000).
Effectiveness: Law enforcement officers generally agree that PBTs are useful. Sixty-nine percent of the 2,731 law enforcement officers surveyed by Simpson and Robertson (2001, p. 51) supported greater PBT availability and use. PBTs are especially valuable for two classes of drivers who may appear to perform normally on many tasks: drivers with a high tolerance to alcohol (Simpson and Robertson, 2001, p. 47) and drivers under the age of 21 who may be in violation of zero-tolerance laws (Ferguson et al., 2000). PBTs also can be useful at crash scenes where a driver is injured and unable to perform a Standardized Field Sobriety Test . There is some direct evidence that PBT use increases DWI arrests and reduces alcohol-involved fatal crashes (Century Council, 2003, p. 24).
Costs: PBTs cost from $450 to $750 apiece. Many law enforcement departments have only a limited number of PBTs and many patrol officers do not have regular access to them. Officers surveyed by Simpson and Robertson (2001, p. 71) estimated that three-fourths of all DWI arrests occur on routine patrol, so that DWI detection would be substantially improved if every patrol officer had a PBT. Time to implement: PBTs can be used as soon as they are purchased and officers receive a short training course in their use and maintenance. PBT instruments must have regular calibration checks. Most law enforcement agencies have the facilities to conduct these checks. Other issues:
• The “one test” rule: Some State statutes allow only one chemical BAC test to be taken from a driver arrested for DWI. These States do not use PBTs because an evidential BAC test cannot be requested if an officer previously has taken a PBT test in the field.

1 - 19
2.5 Passive Alcohol Sensors Effectiveness: Proven-arrests Use: Unknown Cost: Medium Time: Short A passive alcohol sensor is a device to detect alcohol presence in the air. The sensor usually is integrated into a flashlight or clipboard. Officers hold the flashlight or clipboard near the driver’s mouth, where it measures alcohol presence in the air where the driver is breathing. The PAS can be used without the driver’s knowledge and without any probable cause because the PAS is considered “an extension of the officer’s nose” and records information that is “in plain view” (Preusser, 2000, p. E5). The PAS displays its results using lights of different colors to indicate different alcohol concentration levels. Several PAS models are available commercially. They generally are reliable and effective at detecting alcohol in the surrounding air. NHTSA does not maintain a list of PAS models. Use: PAS units typically are used at the car window after a traffic stop or at a checkpoint. A PAS report of alcohol presence gives the officer evidence to request further examination with SFSTs or a PBT device. No data is available on how many PAS units are in use.
Effectiveness: The PAS is especially effective at checkpoints, where officers must screen drivers quickly with little or no opportunity to observe the drivers on the road. Several evaluations show that officers using a PAS at checkpoints can detect twice as many drivers at BACs of .10 and above than officers not using a PAS (Fell et al., 2004; Century Council, 2003, p. 25). The PAS can help officers avoid detaining drivers with BACs of .04 or below. The PAS also assists officers on routine patrol in detecting alcohol-impaired drivers (Preusser, 2000, p. E5). The PAS can be used to help enforce zero tolerance laws for drivers under 21, where violators may have relatively low BAC levels.
Costs: PAS units cost from $500 to $750 apiece. Time to implement: PAS units can be used as soon as they are purchased and officers are trained in their use and maintenance. Other issues:
• Acceptance by law enforcement: Some officers dislike using a PAS because they believe it requires them to be closer to the driver than they wish to be, it requires some portion of the officer’s attention at a time when the officer has several other things to be concerned about (including personal safety), or it may keep the officer from having a hand free. Other officers believe they can detect the odor of alcohol accurately without assistance from a PAS (Preusser, 2000, p. E5).
1 - 20
3.1 Sanctions Effectiveness: Varies Use: Varies Cost: Varies Time: Varies The standard court sanctions for DWI offenses are driver’s license suspension or revocation, fines, jail, and community service. All States use some combination of these sanctions. Tables summarizing all State laws and details of each State’s laws may be found in NHTSA’s Digest of State Alcohol-Highway Safety Related Legislation (NHTSA, 2002a), which is updated regularly. Some States set mandatory minimum levels for some sanctions, which often increase for second and subsequent offenders. DWI offenders also may have their driver’s licenses revoked or suspended administratively and may have sanctions imposed on their vehicles or license plates. See Chapter 1, Section 1.1, Administrative License Revocation or Suspension, and Chapter 1, Section 4.4, Vehicle and License Plate Sanctions, for discussions of these sanctions. License suspension or revocation: All States allow post-conviction license actions. Twenty-eight States set a mandatory minimum length for first offenders. This suspension or revocation typically runs concurrently with any administrative license action. In most States, offenders may obtain an occupational or hardship license during part of all of the revocation or suspension period (McCartt et al., 2002; NHTSA, 2002a). Both court-imposed and administrative license actions are highly effective in reducing crashes. See Chapter 1, Section 1.1 for details. Court-imposed license actions have few direct costs. As with administrative license actions, they should be accompanied by strategies to reduce driving with a suspended or revoked license. Fines: Most States impose fines on DWI offenders. Twenty-eight States have mandatory minimum fines for first offenders, typically ranging from $250 to $500. In addition to fines, offenders often face substantial costs for license reinstatement, mandated alcohol education or treatment, insurance rate increases, and legal fees. The scanty information available suggests that fines at the levels currently imposed have little effect on reducing alcohol-impaired driving (Century Council, 2003, p. 65). Jail: All States allow some DWI offenders to be sentenced to jail. Eighteen States require some jail time for first offenders, though 11 of these States allow community service in lieu of jail. Forty-nine States require jail for third offenders, though even these offenders can substitute community service in 9 States. Jail is the most severe and most contentious of the DWI sanctions. Jail is expensive: $16,500 per offender per year in Maryland and $27,500 in New Mexico, for example (Century Council, 2003; pp. 72 and 100). Judges and prosecutors may be reluctant to use limited jail space for DWI offenders rather than “real” criminals. Offenses with mandatory jail terms may be pled down, or judges simply may ignore the mandatory jail requirement (Robertson and Simpson, 2002b, pp. 85-90).
1 - 21
Research on the effectiveness of jail is equivocal at best (Jones and Lacey, 2001, p. 119; NTSB, 2000, p. 29). Very short (48-hour) jail sentences for first offenders may be effective (NTSB, 2000, p. 29) but other jail policies appear to have little effect. Wagenaar et al. (2000, p. 12) reviewed 18 studies and concluded: “The balance of the evidence clearly suggests the ineffectiveness of mandatory jail sentence policies.” In fact, they find “numerous studies that indicate that [mandatory jail] might be a counterproductive policy” that increases alcohol-related crashes. Community service: Many States allow community service as part of a DWI offender’s sentence and 11 States allow community service in lieu of mandatory jail for first-time offenders. Community service can provide benefits to society if offenders perform useful work, but even if appropriate jobs can be found there are costs for program operation, offender supervision, and liability. The effects of community service programs on alcohol-impaired driving have not been evaluated (Century Council, 2003, p. 63).

1 - 22
3.2 Diversion and Plea Agreement Restrictions Effectiveness: Proven-convictions Use: Medium Cost: Low Time: Short Diversion programs defer sentencing while a DWI offender participates in some form of alcohol education or treatment. In many States, charges are dropped or the offender’s DWI record is erased if the education or treatment is completed satisfactorily. Negotiated plea agreements are a necessary part of efficient and effective DWI prosecution and adjudication. However, plea agreements in some States allow offenders to eliminate any record of a DWI offense and to have their penalties reduced or eliminated. Effective DWI control systems can use a variety of adjudication and sanction methods and requirements. The key feature is that an alcohol-related offense must be retained on the offender’s record (Hedlund and McCartt, 2002; NCHRP, under review; NTSB, 2000; Robertson and Simpson, 2002a). Use: A Century Council (1997) survey of the States reported that 16 States provide for diversion programs in State law or statewide practice, and local courts and judges in some additional States also offer diversion programs. NTSB (2000) reported that 16 States restrict plea agreements in at least some DWI cases. The Century Council (2003, pp. 49, 52) documented diversion programs and plea agreement restrictions in several States.
Effectiveness: There are no studies that demonstrate that diversion programs reduce recidivism (NTSB, 2000, p. 28) and there is substantial anecdotal evidence that diversion programs, by eliminating the offense from the offender’s record, allow repeat offenders to avoid being identified (Hedlund and McCartt, 2002, p. 38). Eliminating diversion programs should remove a major loophole in the DWI control system. Wagenaar et al. (2000) reviewed 52 studies of plea agreement restrictions applied in combination with other DWI control policies and found that they reduced various outcome measures by an average of 11 percent. However, the effects of plea agreement restrictions by themselves cannot be determined in these studies. The only direct study of plea agreement restrictions was completed over 15 years ago (NHTSA, 1989; see NTSB, 2000, p. 27). It found that plea agreement restrictions reduced recidivism in all three study communities.
Costs: Costs for eliminating diversion programs can be determined by comparing the per-offender costs of the diversion program and the non-diversion sanctions. Similarly, costs for restricting plea agreements will depend on the relative costs of sanctions with and without the plea agreement restrictions. In addition, if plea agreements are restricted, some charges may be dismissed or some offenders may request a full trial, resulting in significant costs. Time to implement: Eliminating diversion programs and restricting plea agreements statewide likely will require changes to a State’s DWI laws. Once legislation is enacted, policies and practices can be changed within three months. Individual prosecutor offices and courts also can change local policies and practices without statewide legislation.
1 - 23
3.3 DWI Courts Effectiveness: Likely Use: Low Cost: High Time: Medium A dedicated DWI court provides a systematic and coordinated approach to prosecuting, sentencing, monitoring, and treating DWI offenders. A DWI court’s underlying goal is to change offenders’ behavior by identifying and treating their alcohol problems and by holding offenders accountable for their actions. Prosecutors and judges in DWI courts specialize in DWI cases. Probation officers monitor offenders closely and report any probation infraction to the judge immediately for prompt action. Restrictions and monitoring are relaxed as offenders demonstrate responsible behavior. DWI courts follow the model established by the more than 1,200 drug courts around the Nation (Huddleston et al., 2004, pp. 6-7; NADCP, 2005; NCHRP, under review, Strategy D3). See Brunson and Knighten (2005), Practice #1, for an excellent overview of DWI courts and NDCI (2004) for a more complete description. DWI courts can reduce recidivism because judge, prosecutor, probation staff, and treatment staff work together as a team to assure that alcohol treatment and other sentencing requirements are satisfied. DWI courts can be more efficient and effective than regular courts because judges and prosecutors are familiar with the complex DWI laws, evidentiary issues, and sentencing options. NHTSA (2003, p. 18) describes the operation of a DWI court in Albuquerque, New Mexico. Over half the judges in Robertson and Simpson’s survey (2002b, p. 63) recommended DWI courts, as did participants in NHTSA’s Criminal Justice Summit (NHTSA, 2003, p. 18). Use: NHTSA reported 58 DWI courts in operation as of June 2003, with another 10 being planned (NHTSA, 2003, p. 18). NDCI (2004) and Huddleston et al. (2004, p. 9) reported 42 stand-alone DWI courts and “many more” hybrid DWI/drug courts as of about the same time. As of June 2005, NDCI reported 90 stand-alone DWI courts and 86 hybrid DWI/drug courts (Huddleston, 2005).
Effectiveness: As of summer 2005, evaluations of DWI court effects on offender recidivism and court efficiency are in progress. Some individual program evaluations show that they are quite successful, with low recidivism rates. Evaluations have shown that close monitoring and individualized sanctions for DWI offenders reduce recidivism (see Chapter 1, Section 4.2). When these are incorporated within a comprehensive DWI court program their effect is likely to be even greater.
Costs: DWI court costs are difficult to estimate and compare with regular courts. Court operations may become more efficient as judges and prosecutors specialize in DWI cases. Follow-up costs may be greater because probation officer caseloads may need to be reduced to provide close monitoring and because judges must allocate time to meet regularly with probationers and to deal with any probation violations. Offenders can bear some of the monitoring and treatment costs (see Chapter 1, Sections 4.1, 4.2, and 4.3). DWI courts may reduce long-term system costs substantially if they decrease DWI recidivism as expected.

1 - 24
Offenders in DWI court programs definitely cost far less than offenders in jail (Huddleston, 2005). Time to implement: DWI courts can be implemented in four- to six months after the participating organizations agree on the program structure if enough trained prosecutors, judges, probation officers, and treatment providers are available. Otherwise, planning and implementation may require one year or more.
1 - 25
3.4 Court Monitoring Effectiveness: Proven-convictions Use: Unknown Cost: Low Time: Short In court monitoring programs, citizens observe, track, and report on DWI court or administrative hearing activities. Court monitoring provides data on how many cases are dismissed or pled down to lesser offenses, how many result in convictions, what sanctions are imposed, and how these results compare across different judges and different courts. Court monitoring programs usually are operated and funded by citizen organizations such as MADD, though Mississippi funds a statewide court monitor (Century Council, 2003, p. 51). Use: No data is available on the number of court monitoring programs currently active. It is generally believed that court monitoring has decreased substantially since the mid-1980s, when Probst et al. (1987) identified over 300 programs in the United States.
Effectiveness: Shinar (1992) found that court-monitored cases in Maine produced higher conviction rates and stiffer sentences than unmonitored cases. Probst et al. (1987) found that judges, prosecutors, and other officials in 51 communities believed that court monitoring programs helped increase DWI arrests, decrease plea agreements, and increase guilty pleas. Both studies are summarized in Hedlund and McCartt (2003, p. 60).
Costs: The main requirement for a court monitoring program is a reliable supply of monitors. Monitors typically are unpaid volunteers from MADD, RID, or a similar organization. Modest funds are needed to establish and maintain court monitoring records and to publicize the results. Time to implement: Court monitoring programs can be implemented very quickly if volunteer monitors are available. A few weeks will be required to set up the program and train monitors.
1 - 26
4.1 Alcohol Problem Assessment and Treatment Effectiveness: Proven Use: High Cost: Varies Time: Varies It is widely recognized that many DWI first offenders and most repeat offenders are dependent on alcohol or have alcohol use problems. They likely will continue to drink and drive unless their alcohol problems are addressed. A DWI arrest provides an opportunity to identify offenders with alcohol problems and to refer them to treatment as appropriate. Alcohol problem assessment can take many forms, from a brief paper-and-pencil questionnaire to a detailed interview with a treatment professional. Alcohol treatment can be even more varied, ranging from classroom alcohol education programs to long-term inpatient facilities. For brief overviews of alcohol assessment and treatment programs and further references see Century Council (2003, pp. 89-104), Jones and Lacey (2001, pp. 116-118), and NCHRP (under review, Strategy C4). Use: A Century Council (2003, p. 92) survey reported that 41 States require alcohol assessment for some or all first offenders. Though data on the use of alcohol treatment is not available, some judges in all States probably assign some form of treatment to some DWI offenders.
Effectiveness: Even the best of the many assessment instruments currently in use is relatively inaccurate. Chang et al. (2002) found that none correctly identified more than 70 percent of offenders who were likely to recidivate. Wells-Parker et al. (1995) reviewed the studies evaluating treatment effectiveness. They found that, on average, treatment reduced DWI recidivism and alcohol-related crashes by 7 to 9 percent. Treatment appears to be most effective when combined with other sanctions and when offenders are monitored closely to assure that both treatment and sanction requirements are met (Century Council, 2003, p. 95)
Costs: Trained personnel are required to assess offenders. Treatment expenses vary widely depending on program type. Offenders can bear some of the costs of both assessment and treatment, though provisions must be made for indigent offenders. Both assessment and treatment require good record systems to track offenders and monitor progress. Time to implement: Implementation time also varies depending on program type. The simplest can be implemented in several months, while others may take years. Other issues:
• Treatment options: Alcohol assessment and treatment programs are long-term and expensive investments. States and communities should carefully weigh the costs and benefits of the many options available before implementing any. Implementation time will depend on the specific programs chosen.
1 - 27
4.2 DWI Offender Monitoring Effectiveness: Proven-recidivism Use: Unknown Cost: High Time: Medium The most successful methods for controlling convicted DWI offenders and reducing recidivism have the common feature that they monitor offenders closely. Close monitoring can be accomplished at various levels and in various ways, including a formal intensive supervision program, home confinement with electronic monitoring, dedicated detention facilities, and individual oversight by judges. DWI courts and alcohol ignition interlocks, which are discussed in Chapter 1, Sections 3.3 and 4.3, also assist in monitoring offenders closely. Use: There is no data showing how extensively these programs are used. Effectiveness: All four methods cited above have been evaluated in individual settings and show substantial reductions in DWI recidivism. For example, recidivism was reduced by one-half in an intensive supervision program, by one-third in an electronic monitoring program, by one-half in a dedicated detention facility, and by one-half by a judge’s individual oversight. The references cited below provide additional detail. Costs: All close monitoring programs are more expensive than the standard high-caseload and low-contact probation but less expensive than jail. Electronic monitoring fees typically range from $3 to $15 per day (NCHRP, 2005, Strategy 5.1 D3). New Mexico estimated that intensive supervision cost $2,500 per offender per year compared to $27,500 per offender per year for jail (Century Council, 2003, p. 72). Dedicated detention facility costs can approach jail costs: $13,500 annually in Maryland for dedicated detention compared to $16,500 for jail (Century Council, 2003, p. 100). Offenders can bear some program costs, especially for the less expensive alternatives (Century Council, 2003, pp. 72, 74). Time to implement: All close monitoring programs require many months to plan and implement. Dedicated facilities require years to plan and build. References providing summaries and containing further references to detailed studies: Intensive supervision
• The Century Council (2003), Hard Core Drunk Driving: A Sourcebook of Promising Strategies, Laws & Programs. Washington, DC: The Century Council. www.dwidata.org, pp. 69-72.
• Jones, R. K., and Lacey, J.H. (2001). Alcohol and Highway Safety 2001: A Review of the State of Knowledge. DOT HS 809 383. Washington, DC: National Highway Traffic Safety Administration. www.nhtsa.dot.gov/people/injury/research/AlcoholHighway/, p. 120.
• NCHRP Report 500, Vol. 16 (2005). A Guide for Reducing Alcohol-Related Collisions. Washington, DC: Transportation Research Board. trb.org/publications/nchrp/nchrp_rpt_500v15.pdf, strategy D3.
1 - 28
Home confinement with electronic monitoring • Brunson W., and Knighten, P., editors. (2005). Strategies for Addressing the DWI
Offender: 10 Promising Sentencing Practices. DOT HS 809 850. Washington, DC: National Highway Traffic Safety Administration. www.nhtsa.dot.gov/people/injury/enforce/PromisingSentence/images/10Promising.pdf, Practice #6.
• The Century Council (2003), Hardcore Drunk Driving: A Sourcebook of Promising Strategies, Laws & Programs. Washington, DC: The Century Council. www.dwidata.org, pp. 73-75.
• Jones R.K., and Lacey J.H. (2001). Alcohol and Highway Safety 2001: A Review of the State of Knowledge. DOT HS 809 383. Washington, DC: National Highway Traffic Safety Administration. www.nhtsa.dot.gov/people/injury/research/AlcoholHighway/, p. 120.
• NCHRP Report 500, Vol. 2 (2003). Guidance for Implementation of the AASHTO Strategic Highway Safety Plan, Volume 2: A Guide for Addressing Collisions Involving Unlicensed Drivers and Drivers with Suspended or Revoked Licenses. Washington, DC: Transportation Research Board. trb.org/publications/nchrp/nchrp_rpt_500v2.pdf, Strategy 2.1 D1.
• NCHRP Report 500, Vol. 16 (2005). A Guide for Reducing Alcohol-Related Collisions. Washington, DC: Transportation Research Board. trb.org/publications/nchrp/nchrp_rpt_500v16.pdf, strategy D3.
Dedicated detention facilities • The Century Council (2003), Hardcore Drunk Driving: A Sourcebook of Promising
Strategies, Laws & Programs. Washington, DC: The Century Council. www.dwidata.org, pp. 100-103.
• NTSB (2000). Actions to Reduce Fatalities, Injuries, and Crashes Involving the Hard Core Drinking Driver. NTSB/SR-00/01. Washington, DC: National Transportation Safety Board. www.ntsb.gov/publictn/2000/sr0001.pdf
Individual judicial oversight
• The Century Council (2003), Hardcore Drunk Driving: A Sourcebook of Promising Strategies, Laws & Programs. Washington, DC: The Century Council. www.dwidata.org, pp. 71-72.
• Jones, R.K., and Lacey, J.H. (2001). Alcohol and Highway Safety 2001: A Review of the State of Knowledge. DOT HS 809 383. Washington, DC: National Highway Traffic Safety Administration. www.nhtsa.dot.gov/people/injury/research/AlcoholHighway/, p. 120.

1 - 29
4.3 Alcohol Interlocks Effectiveness: Proven Use: Medium Cost: Medium Time: Medium An alcohol ignition interlock prevents a car from starting unless the driver provides a breath sample with a BAC lower than a pre-set level, usually .02 grams per deciliter. Interlocks typically are used as a condition of probation for DWI offenders, to prevent them from driving while impaired by alcohol after their driver’s licenses have been reinstated. Interlocks are highly effective in allowing a car to be started by sober drivers but not by alcohol-impaired drivers. A “running retest” requires the driver to remain sober while driving. A data recorder logs the driver’s BAC at each test and can be used by probation officers to monitor the offender’s drinking and driving behavior. Beirness and Marques (2004) provide an overview of interlock use, effectiveness, operational considerations, and program management issues. Beirness and Robertson (2005) summarize interlock programs in the United States and other countries and discuss typical problems and solutions. See also Brunson and Knighten (2005), Practice #5. Use: As of 2005, 44 States allowed interlocks to be required for some DWI offenders (NHTSA, 2005c). In 2004, about 70,000 interlocks were in use, on the cars of perhaps 10 percent of eligible offenders (Beirness and Marques, 2004).
Effectiveness: Beirness and Marques (2004) summarized 10 evaluations of interlock programs in the United States and Canada. Interlocks cut DWI recidivism at least in half, and sometimes more, compared to similar offenders without interlocks. After the interlock was removed, the effects largely disappeared, with interlock and comparison drivers having similar recidivism rates. A Cochrane review of 11 studies reached similar conclusions (Willis et al., 2004). Thus, interlocks are an effective method for preventing alcohol-impaired driving while they are installed.
Costs: Interlock programs are managed by private interlock equipment providers. Costs in 2003 averaged about $60 per month. The offenders usually pay these costs (Century Council, 2003, p. 86). Time to implement: Interlock programs may require enabling legislation. Once authorized, interlock programs require four to six months to implement a network of interlock providers. Other issues:
• Barriers to use: Interlocks have demonstrated their effectiveness in controlling impaired driving while they are installed. In light of this success, their limited use may be due to several factors, such as long license suspension periods during which offenders are not eligible for any driving, judges who lack confidence in the interlock technology or who fail to enforce “mandatory” interlock requirements, and interlock costs. See Beirness and Marques (2004), Beirness and Robertson (2005), and NCHRP (2003, strategy C2) for discussion.
1 - 30
4.4 Vehicle and License Plate Sanctions Effectiveness: Varies Use: Medium Cost: Varies Time: Short In recent years many States have implemented sanctions affecting a DWI offender’s license plate or vehicle. These sanctions both prevent the offender from driving the vehicle while the sanctions are in effect and also deter impaired driving by the general public. Vehicle and plate sanctions include:
• Special license plates for drivers whose licenses have been revoked or suspended. The plates allow family members and other people to drive the offender’s car but permit law enforcement to stop the car to verify that the driver is properly licensed.
• License plate impoundment. Officers seize and impound or destroy the license plate. • Vehicle immobilization: vehicles are immobilized on the offender’s property with a
“boot” or “club.” • Vehicle impoundment. Vehicles are stored in a public impound lot. • Vehicle forfeiture. Vehicles are confiscated and sold at auction.
Voas et al. (2004) give an overview of all vehicle and license plate sanctions currently in use and are the basic reference for the information provided below. See also Brunson and Knighten (2005), Practice #4. All vehicle and license plate sanctions require at least several months to implement. Use, effectiveness, and costs:
• Special license plates: Used in some jurisdictions in Iowa, Minnesota, and Ohio (NHTSA, 2004c). A 2004 law in Ohio requires special plates for all first-time offenders with a BAC of .17 and above and for all repeat offenders. Effectiveness and costs have not been evaluated in any State. In the 1990s Oregon and Washington adopted a version of this strategy by allowing arresting officers to place a “zebra stripe” sticker on the license plate at the time of arrest. Oregon’s program proved effective in reducing DWI recidivism but Washington’s did not. Use has been discontinued in both States (NCHRP, 2003, Strategy B1).
• License plate impoundment: Used in Minnesota, where it has been shown to reduce recidivism. Since plate impoundment does not involve the courts, it occurs quickly, consistently, and efficiently (NCHRP, 2003, Strategy B2; NTSB, 2000, p. 21).
• Vehicle immobilization: Laws in 13 States allow vehicle immobilization but it is currently used only in a few States. An evaluation in Ohio found that immobilization reduced recidivism. Costs are minimal compared to impoundment or forfeiture (NCHRP, 2003, Strategy C1; NHTSA, 2004c; NTSB, 2000, p. 21).
• Vehicle impoundment: 13 States use vehicle impoundment extensively. Vehicle impoundment reduces recidivism while the vehicle is in custody and to a lesser extent after the vehicle has been released. The strategy is costly, as storage fees can be $20 daily and owners may abandon low-value vehicles rather than pay substantial storage costs (NCHRP, 2003, Strategy C1; NHTSA, 2004c; NTSB, 2000, p. 22). In California, impoundment programs are administered largely by towing contractors and supported by fees paid when drivers reclaim their vehicles or by the sale of unclaimed vehicles.
• Vehicle forfeiture: Vehicle forfeiture has been applied to first-DWI offenders in New York City, to first Driving While Suspended (DWS) offenders in Portland, Oregon, and

1 - 31
to second-DWS offenders in California. Twenty-seven States have provisions allowing vehicle confiscation but there is little information on its use or effectiveness. Vehicle forfeiture programs must pay storage costs until the vehicles are sold or otherwise disposed (NCHRP, 2003, Strategy C1; NHTSA, 2004c; NTSB, 2000, p. 24).
Other issues:
• To whom are vehicle sanctions applied: Most vehicle sanctions have been applied to repeat offenders rather than first offenders. All vehicle and license plate sanctions must address the issue of what action to take when a DWI offender is driving a vehicle registered to someone else.
• Administrative issues: All license plate and vehicle sanctions require an administrative structure to process the license plates or vehicles.
1 - 32
4.5 Lower BAC Limits for Repeat Offenders Effectiveness: Uncertain Use: Low Cost: Low Time: Short All States now have an illegal per se BAC limit of .08. All States also have a BAC limit of .02 or lower for drivers under the age of 21. These laws reinforce the minimum drinking age 21 laws in all States that prohibit people under 21 from purchasing or possessing alcohol in public. Two States also lower the BAC limit for people convicted of DWI, to emphasize that they should not be driving after drinking even moderate amounts. Use: Maine and North Carolina have established lower BAC limits for people with a prior DWI offense (NTSB, 2000, p. 14). Effectiveness: In 1988, Maine established a .05 BAC limit for one year after a first DWI offense and for 10 years after a subsequent offense. Violators receive an administrative license suspension. In 1995 this BAC limit was lowered to .00. Hingson et al. (1998) evaluated the 1988 law and concluded that it reduced the proportion of repeat offender drivers in fatal crashes by 25 percent. Jones and Rodriguez-Iglesias (2004) evaluated the overall effects of both laws, using data from 1988-2001. They also concluded that the laws contributed to a reduction in the proportion of repeat offenders in fatal crashes, primarily due to a reduction in drivers at BACs of .10 and higher. Costs: Implementation and operation costs are minimal. Jones and Rodriguez-Iglesias (2004) found that Maine’s laws had little or no effect on the operations of the DWI control system. Time to implement: Lower-BAC-limit laws can be implemented as soon as legislation is enacted.
1 - 33
Prevention, Intervention, Communications and Outreach Prevention and intervention. Prevention and intervention strategies seek to reduce drinking, especially drinking associated with driving, or to prevent driving by people who have been drinking. Prevention and intervention work through laws, policies, and programs that:
• control alcohol sales hours, locations, and promotions; • implement responsible alcohol service practices; • control alcohol purchase and use through increased alcohol taxes and restrictions on
consumption in public locations such as parks and sports facilities; or • provide alternatives to driving for people who have been drinking.
Prevention and intervention measures are especially important for those under 21. These are discussed in the Youth section that follows. Many prevention and intervention measures fall under the authority of a State’s alcohol control board rather than the SHSO. However, the SHSO can be a critical partner in many prevention and intervention activities. Communications and outreach. Communications and outreach strategies seek to inform the public of the dangers of driving while impaired by alcohol and to promote positive social norms of not driving while impaired. As with prevention and intervention, education through various communications and outreach strategies is especially important for youth under 21. Education may occur through formal classroom settings, news media, paid advertisements and public service announcements, and a wide variety of other communication channels such as posters, billboards, Web banners, and the like. Communications and outreach strategies are a critical part of many deterrence and prevention strategies. This section discusses only stand-alone communications and outreach countermeasures.

1 - 34
5.1 Responsible Beverage Service Effectiveness: Likely Use: Medium Cost: Medium Time: Medium Responsible beverage service covers a range of alcohol sales policies and practices that prevent or discourage restaurant and bar patrons from drinking to excess or from driving while impaired by alcohol. Server training programs teach servers how to recognize the signs of intoxication and how to prevent intoxicated patrons from further drinking and from driving. Management policies and programs include limits on cheap drinks and other promotions, support for designated driver programs, strong commitment to server training, and strong support for servers who refuse alcohol to intoxicated patrons. NCHRP (under review, Strategy A2) provides an overview of responsible beverage service. Server training programs are the only segment of responsible beverage service for adults that has been documented and evaluated well. Activities directed at people under 21 are discussed separately in Chapter 1, Section 6.1. Use: As of 2005, 13 States had some form of mandatory server training programs (MADD, 2005). As of 2000, 10 additional States had non-mandatory programs that provided some liability protection to participating establishments (Alcohol Epidemiology Program, 2000, p. 14).
Effectiveness: In their systematic review, Shults et al. (2001) found five high-quality evaluations of server training programs. They concluded that “intensive, high-quality, face-to-face server training, when accompanied by strong and active management support, is effective in reducing the level of intoxication in patrons.” The one evaluation of a statewide server training program, in Oregon, showed that it reduced single-vehicle nighttime injury crashes by 23 percent. Jones and Lacey (2001, pp. 137-138) note that no other evaluations have attempted to measure the effects of server training programs on alcohol-related crashes.
Costs: A typical alcohol server course takes about 4 hours. Course costs can be borne by the servers themselves, their employers, or the State. Time to implement: Server training courses are offered by several private vendors and can be implemented in a few weeks. A statewide requirement for server training or more general responsible beverage service policies would require time to enact any necessary legislation, establish policies, and provide for program administration. Other issues:
• Program quality: The quality of responsible beverage service programs can vary enormously, from excellent to abysmal. Management support can vary from enthusiastic to nonexistent. Shults et al. (2001) clearly limit their conclusions to high-quality programs with strong management support. Alcohol Epidemiology Program (2000, p. 13) cites some server training program evaluation studies that found no effect and notes that these programs may have been poorly supported or implemented.

1 - 35
• Responsible beverage service is more than server training: Grube and Stewart (2004) emphasize that management policy and its implementation may be at least as important as server training in determining responsible beverage service program effectiveness.
1 - 36
5.2 Alternative Transportation Effectiveness: Unknown Use: Unknown Cost: Medium Time: Short Alternative transportation describes methods by which people can get to and from places where they drink without having to drive. Alternative transportation supplements normal public transportation provided by subways, buses, taxis, and other means. Ride service programs transport drinkers home from, and sometimes to and between, drinking establishments using taxis, private cars, buses, tow trucks, and even police cars. Some will drive the drinker’s car home along with the drinker. For an overview, see Jones and Lacey (2001, pp. 133-134). Most operate only for short periods of the year, such as the Christmas and New Year’s holidays. Many are free; some charge users a minimal fee; some are operated commercially on a for-profit basis. Use: There is no data on current ride service programs, but more than 300 were in operation at some time in the 1980s (Jones and Lacey, 2001, p. 133).
Effectiveness: Unless a ride service program operates for a long period of time or over a large area it is difficult to determine whether it has any effect on alcohol-related crashes. Two studies have evaluated ride service programs (Jones and Lacey, 2001, pp. 133-134). The first examined one year-round and one holiday program. Both functioned smoothly and delivered rides but neither demonstrated any effect on crashes. The second study examined a year-round program in Aspen, Colorado, and concluded that it reduced injury crashes in the surrounding county by 15 percent (see also NCHRP, 2003, Strategy E1).
Costs: The major ride service program costs are for the rides that are provided. Short-term ride service programs can be operated largely with donated rides. Year-round programs need enough steady funding to accommodate demand (NCHRP, 2003, Strategy 2.1 E1).
Time to implement: Short-term ride service programs can be established and operated informally in a few weeks. Longer-term programs need to establish long-term strategies for funding and managing the program.

1 - 37
5.3 Designated Drivers Effectiveness: Unknown Use: Medium Cost: Low Time: Short Designated drivers are individuals who agree not to drink so they can drive their friends who have been drinking. Formal designated driver programs in drinking establishments provide incentives such as free soft drinks for people who agree to be designated drivers. Usually, though, designated driver arrangements are completely informal. Use: The designated driver concept is widely understood and accepted. Surveys show that designated driver use is common: for example, about one-third of college students in a national survey in 1993 reported that they had served as a designated driver and one-third of students who drink had ridden with a designated driver (Hedlund et al., 2001, p. 47).
Effectiveness: The designated driver concept has been questioned on two grounds: that it may encourage passengers to drink to excess and that the designated driver may drink, though perhaps less than the passengers. In a national survey, over half of the college student drinkers who served as designated drivers did not drink and only 2 percent had five or more drinks. Because designated drivers are informally determined and somewhat imprecisely defined, it’s no surprise there appears to be no data on the impact of designated drivers on crashes. CDC’s systematic review found insufficient evidence to determine the effectiveness of designated driver programs (Ditter et al., 2005).
Costs: The only costs associated with informal designated driver programs are for publicity. Designated drivers can be promoted independently or can be included with other impaired driving publicity. Establishments that operate formal designated driver programs have minimal costs for the drinks provided and for publicity.
Time to implement: Designated driver promotion can be implemented in a few weeks and formal programs can be established equally quickly.
1 - 38
5.4 Alcohol Screening and Brief Interventions Effectiveness: Proven Use: Medium Cost: Medium Time: Short Brief interventions refer to short, one-time encounters with people who may be at risk of alcohol-related injuries or other health problems. Alcohol screening is a quick form of estimating whether a person has an alcohol problem (see Chapter 1, Section 4.1). The combination of alcohol screening and brief intervention is most commonly used with injured patients in emergency departments or trauma centers. Patients are screened for alcohol use problems and, if appropriate, counseled on how alcohol can affect injury risk and overall health and referred to a follow-up alcohol treatment program. Brief interventions take advantage of a “teachable moment” when a patient can be shown that alcohol use can have serious health consequences. Dill et al. (2004) provide an extensive summary and bibliography of alcohol screening and brief intervention studies. Use: Approximately one-third of trauma centers use some form of brief intervention and an additional one-sixth screen patients for alcohol problems (NCHRP, under review, Strategy A4; Schermer et al., 2003). Alcohol screening and brief interventions also are used in colleges and social service settings (NCHRP, 2004, Strategy A4; Jones and Lacey, 2001, p. 146). Effectiveness: Many studies show that alcohol screening and brief interventions in medical facilities can reduce drinking and self-reported driving after drinking (D’Onofrio and Degutis, 2002; Moyer et al., 2002; Whitlock et al., 2004; Wilk et al., 1997). Dill et al. (2004) reviewed nine studies that evaluated alcohol screening and brief intervention effects on injury. These studies generally found that alcohol screening and brief interventions reduced both drinking and alcohol-related traffic crashes and injuries. Costs: Alcohol screening and brief interventions in medical facilities require a trained person to administer the intervention. Time to implement: Procedures for alcohol screening and brief interventions are readily available and can be implemented as soon as staff is identified and trained.
1 - 39
5.5 Mass Media Campaigns Effectiveness: Proven* Use: High Cost: High Time: Medium * High-quality campaigns supporting other program activities, such as enforcement A mass media campaign consists of intensive communications and outreach activities regarding alcohol-impaired driving that use radio, television, print, and other mass media. Mass media campaigns are a standard part of every State’s efforts to reduce alcohol-impaired driving. Some campaigns publicize a deterrence or prevention measure such as a change in a State’s DWI laws or a checkpoint program. Others promote specific behaviors such as the use of designated drivers, illustrate how impaired driving can injure and kill, or simply urge the public not to drink and drive. Campaigns vary enormously in quality, size, duration, funding, and every other way imaginable. Effective campaigns identify a specific audience and communications goal and develop messages and delivery methods that are appropriate to and effective for the audience and goal. Use: Most States use some form of alcohol-impaired driving mass media campaign every year. Mass media campaigns are an essential part of many deterrence and prevention countermeasures that depend on public knowledge to be effective.
Effectiveness: Most mass media campaigns are not evaluated. Elder et al. (2004) studied the few available high-quality evaluations. The campaigns being evaluated were carefully planned, well funded, well executed, achieved high levels of audience exposure (usually by using paid advertising), had high-quality messages that were pretested for effectiveness, and were conducted in conjunction with other impaired-driving activities. These mass media campaigns reduced alcohol-related crashes by about 13 percent. Levy et al. (2004) document the costs and media strategy of a high-quality national media campaign and document its effects on driver knowledge and awareness.
Costs: High-quality and effective mass media campaigns are expensive. Funds are needed for market research, design, pretesting, and production. Paid advertising expenses depend on the media chosen and the media markets needed to reach the target audience. Time to implement: A high-quality mass media campaign will require at least six months to research, plan, produce, and distribute. Other issues:
• Campaign quality: These conclusions apply only to high-quality and well-funded mass media campaigns that complement other impaired driving activities. Poor-quality or stand-alone campaigns are likely to be ineffective. Public service announcements (PSAs) may be an easy way to spend money quickly and appear to be doing something about impaired driving but they are likely to be aired infrequently, reach small audiences, and have little or no effect.
• Comprehensive media strategy: Mass media campaigns should be planned as part of an overall communications and outreach strategy that supports specific impaired driving activities.
1 - 40
Underage Drinking and Alcohol-Related Driving In addition to the deterrence, prevention, intervention, communications, and outreach countermeasures that apply to all drivers, some countermeasures are directed specifically to those under 21. Since 1987, minimum-drinking-age laws in all States prohibit youth under 21 from purchasing alcohol or consuming it in public. These laws influence all youth impaired driving strategies. For people over 21, drinking is legal but driving while impaired by alcohol is not. With a BAC limit of .08, drivers know they should not drive after drinking “too much,” but are faced with mixed messages at low levels of alcohol, because a BAC of .05 is not per se illegal. The message for those under 21 is unambiguous: they should not be drinking at all, and certainly should not be driving after drinking. Zero-tolerance laws in all States reinforce this message by setting a maximum BAC limit of .02 or less for drivers under 21. This effectively prohibits driving after drinking any amount of alcohol. Many policies and programs reinforcing the no-drinking message are directed primarily at youth (beer keg registration) or take place in schools or youth organizations (SADD clubs, alcohol-free prom and graduation parties). Youth receive education and information about alcohol and alcohol-impaired driving in schools and colleges and through media directed to youth. The minimum-drinking-age laws and the no-drinking message for youth mean that youth impaired driving activities must work hand-in-hand with activities to control youth drinking. With the exception of the enforcement of zero-tolerance laws enforcement, all the countermeasures discussed below require cooperative activities between traditional highway safety organizations, such as law enforcement and motor vehicle departments, and community, health, and educational organizations with a broader social agenda than traffic safety.
1 - 41
6.1 Minimum-Drinking-Age-21 Law Enforcement Effectiveness: Varies Use: Varies Cost: Varies Time: Varies The minimum legal drinking age (MDA) has been 21 in all States since 1987. There is strong evidence that MDA-21 laws reduced drinking, driving after drinking, and alcohol-related crashes and injuries among youth (Hingson et al., 2004; Shults et al., 2001). In fact, MDA-21 laws reduced youth drinking and driving more than youth drinking alone (using the measurements of self-reporting and testing of drinking drivers in fatal crashes.). Drinking and driving has become less socially acceptable among youth, and more youth have separated their drinking from their driving (Hedlund et al., 2001, pp. 43-48). The specific laws implementing MDA-21 for alcohol vendors, adults, and youth differ substantially from State to State. See Alcohol Epidemiology Program (2000) and Century Council (2005) for State-by-State summaries of some of the key provisions. MDA-21 law enforcement is very limited in many communities (Hedlund et al., 2001, p. 52). Enforcement can take several forms, as summarized by Stewart (1999):
• Actions directed at alcohol vendors: compliance checks to verify that vendors will not sell to youth;
• actions directed at youth: “use-and-lose” laws that confiscate the driver’s license of an underage drinker, “Cops in Shops” directed at underage alcohol purchasers, law enforcement “party patrols,” and penalties for using false identification; and
• actions directed at adults: beer keg registration laws, enforcement of laws prohibiting purchasing alcohol for youth, and programs to limit parties where parents provide alcohol to youth.
While these enforcement strategies have been used frequently, few have been evaluated. Four strategies with some research evidence are discussed below, followed by a discussion of comprehensive, multi-strategy community programs. Alcohol vendor compliance checks: In a compliance check or “sting,” law enforcement officers watch as underage people attempt to purchase alcohol and cite the vendor for an MDA-21 violation if a sale is made. Several studies document that well-publicized and vigorous compliance checks reduce alcohol sales to youth (NCHRP, under review, Strategy A3; Stewart, 1999, p. 9). Compliance checks require strong community support, education for alcohol vendors on their responsibilities under MDA-21, and publicity to underage youth. They require staff time from traffic or alcohol beverage control staff. See NCHRP (under review, Strategy A3) for a full discussion. Use-and-lose laws: These laws allow confiscation of the driver’s license or postpone licensure for a period of time for youth who violate a State’s MDA-21 law. In the only study to date, Ulmer et al. (2001) investigated use-and-lose law implementation and effects in Missouri and Pennsylvania. Missouri suspended the driver’s licenses of most youth arrested for DWI but rarely suspended the licenses of youth who violated the MDA-21 law by drinking but not driving. Pennsylvania, in contrast, applied the use-and-lose law to violations of the MDA-21
1 - 42
both for youth arrested while driving and youth arrested while not driving. Pennsylvania’s use-and-lose license suspensions appeared to reduce subsequent traffic violations and crashes. Use-and-lose laws can be implemented quickly and inexpensively once enacted. To be effective, they should be publicized extensively. Keg registration laws: These laws link beer keg purchasers to an identification number on the keg, which provides a method of identifying adults who supply beer to parties attended by youth. Thirteen States have statewide keg registration laws, as do many communities in other States (Alcohol Epidemiology Program, 2000, p. 22). The only known study, of 97 communities, found that keg registration laws reduced traffic fatality rates (Grube and Stewart, 2004). However, Grube and Stewart conclude that the evidence for the effectiveness of keg registration “is best considered inconclusive.” Media campaigns directed at parents: Ohio has conducted a statewide media campaign, Parents Who Host Lose the Most, since 2000. The campaign informs parents and youth about Ohio’s underage drinking laws and attempts to discourage parents from providing alcohol to underage drinkers at parties. Telephone surveys in 2004, the campaign’s fifth year, showed that about two-thirds of parents and youth had heard messages about underage drinking (Seufert et al., 2004). About two-thirds of those who had heard a message said that it prompted a conversation between parents and their teenagers about drinking. The evaluation did not investigate any changes in behavior. Comprehensive community programs: Several comprehensive community initiatives have reduced youth drinking and alcohol-related problems (Hingson et al., 2004). These initiatives typically bring together several community government departments, such as schools, health, and law enforcement, with alcohol sellers, parents, youth, and citizen organizations. They may include school-based programs, law enforcement, media, and other intervention strategies. They require strong leadership and organization. They may take many months to plan and implement. Costs depend on the activities included.
1 - 43
6.2 Zero Tolerance Law Enforcement Effectiveness: Likely Use: Unknown Cost: Medium Time: Short Zero-tolerance laws set a maximum BAC of .02 or less for drivers under 21. Violators have their driver’s licenses suspended or revoked. There is strong evidence that zero-tolerance laws reduce alcohol-related crashes and injuries (Jones and Lacey, 2001, p. 109; NCHRP, under review, Strategy B3; Shults et al., 2001). However, zero-tolerance laws often are not actively enforced or publicized (Hedlund et al., 2001, p. 54; Jones and Lacey, 2001, p. 109). Studies have found that young drivers are not arrested in proportion to their involvement in alcohol-related crashes (Hingson et al., 2004). Use: Zero-tolerance laws have been in effect in all States since 1998.
Effectiveness: An early study in Maryland found that alcohol-involved crashes for drivers under 21 dropped by 21 percent in six counties after the zero-tolerance law was implemented. After the law was publicized extensively, these crashes dropped by an additional 30 percent (Jones and Lacey, 2001, p. 109). No other studies have examined the effect of increasing enforcement and publicity for an existing zero-tolerance law. Lacey et al. (2000) document how zero-tolerance laws are administered and enforced in four States. Highly publicized enforcement has proven effective in increasing compliance with many traffic safety laws and reducing crashes and injuries: see for example checkpoints (Chapter 1, Section 2.1) and safety belt use mobilizations (Chapter 2, Section 2.1).
Costs: Zero-tolerance laws can be enforced on regular patrol or on special patrols directed at times and areas when young drinking drivers may be present. Enforcement will require moderate costs for appropriate training, publicity, and perhaps equipment (see Other Issues). Time to implement: Enforcement programs can be implemented within three or four months, as soon as appropriate training, publicity, and equipment are in place. Other issues:
• Zero-tolerance-law provisions: Zero-tolerance laws are far easier to enforce if the offense is an administrative rather than criminal violation, and if law enforcement officers can use PBTs at the roadside to determine if the law has been violated and to seize the driver’s license if it has (Jones and Lacey, 2001, p. 110). Some State laws require probable cause for a standard DWI arrest, or even require a full DWI arrest, before a BAC test for a zero-tolerance-law violation can be administered. In these States, the zero-tolerance law is not enforced independently of the standard DWI law, and in fact young drivers may not be aware of the zero-tolerance law (Hingson et al., 2004).
• PBT and PAS: PBTs are critical to effective and efficient enforcement in States that allow PBT use for zero-tolerance laws. PAS units can help officers detect violators with BAC levels below .08. See Chapter 1, Sections 2.4 and 2.5.

1 - 44
6.3 School Education Programs Effectiveness: Uncertain Use: Unknown Cost: Low Time: Long Elementary and secondary schools often include education on alcohol, impaired driving, and traffic safety as regular topics in health and driver education courses. Use: Health education is a standard course for most students, but the coverage of impaired-driving issues is not known. Driver education is an elective course in some schools and is not offered in others. Commercial instructors offer driver education courses in many communities. In each, the coverage of impaired-driving issues is not known.
Effectiveness: Evaluations generally have found that prevention curricula have weak and inconsistent effects on alcohol use (Stewart, 1999, p. 13). CDC’s systematic review found that education programs are effective in reducing riding with a drinking driver. There was insufficient evidence to determine the programs’ effectiveness in reducing drinking and driving (Elder et al., 2005).
Costs: Many education programs or course units are available. They must compete with other pressing educational needs for space in a crowded school curriculum. Time to implement: School education programs require at least a year to plan, schedule, acquire material, and train teaching staff.

1 - 45
6.4 Youth Programs Effectiveness: Uncertain Use: High Cost: Varies Time: Medium States and communities have conducted extensive youth drinking-and-driving-prevention programs over the past 25 years. These programs seek to motivate youth not to drink, not to drink and drive, and not to ride with a driver who has been drinking. They use positive messages and methods: educating youth on the crash and injury risks of drinking and driving and on the effects of alcohol use and abuse, providing positive role models that discourage alcohol use, promoting positive norms that do not involve alcohol, and encouraging youth activities that do not involve or lead to alcohol use. The best-known youth program is SADD, founded in 1981 as Students Against Driving Drunk, then renamed Students Against Destructive Decisions. In 1994 an estimated 16,000 U.S. high schools had SADD chapters (Hedlund et al, 2001, p. 56). Some States conducted similar activities under different names, such as STAND in Colorado and SAFTYE in Washington. MADD’s Youth In Action is active in 44 States (www.youthinaction.org/index.cfm?cID=home). One specific activity, operated either by a youth program or independently, is Project Graduation, which provides alcohol-free prom and graduation parties for high school students. See Hedlund et al. (2001, pp. 56-60) for brief examples of State programs Use: Youth programs of some type are conducted in most, if not all, States.
Effectiveness: Two studies attempted to evaluate SADD’s activities and effects. One study, in two schools, found that neither school implemented the model SADD program well and found no evidence of SADD effects on any drinking and driving measure. The second study, in six schools, found that SADD affected drinking and driving attitudes as well as self-reported drinking and driving (Hedlund et al., 2001, p 60). No other youth programs have been evaluated. CDC’s systematic review found that there was insufficient evidence to determine the effectiveness of youth programs (Elder et al., 2005).
Costs: Youth program costs can vary substantially depending on the size and nature of the individual activities. States have spent substantial sums on youth drinking-and-driving programs overall: $10 million in Federal funds in 1993, $21 million in 1994, and $22 million in 1995. These figures include a special $8 million appropriation in both 1994 and 1995 (Hedlund et al., 2001, p. 60). In each year, States also spent substantial non-Federal funds on youth drinking-and-driving programs. These funds were used for a variety of youth education, enforcement, and program activities. Time to implement: With model programs available and organizations such as SADD and MADD available for assistance, youth programs can be started easily in six months.
1 - 46
Alcohol-Impaired Driving References Alcohol Epidemiology Program (2000). Alcohol Policies in the United States: Highlights from the 50 States. University of Minnesota, School of Public Health. www.epi.umn.edu/alcohol/pdf/Chrtbook.pdf. Beirness, D.J., and Marques, P.R. (2004). Alcohol ignition interlock programs. Traffic Injury Prevention, Vol. 5, pp. 299-308. Beirness, D.J., and Robertson, R.D. (2005). Alcohol Interlock Programs: Enhancing Acceptance, Participation and Compliance. Ottawa, ON: Traffic Injury Research Foundation. trafficinjuryresearch.com/publications/PDF_publications/Hilton_Head_Proceedings.pdf Brunson, W., and Knighten, P., editors. (2005). Strategies for Addressing the DWI Offender: 10 Promising Sentencing Practices. DOT HS 809 850. Washington, DC: National Highway Traffic Safety Administration. www.nhtsa.dot.gov/people/injury/enforce/PromisingSentence/images/10Promising.pdf The Century Council (1997). Combating Hardcore Drunk Driving: A Sourcebook of Promising Strategies, Laws & Programs. Washington, DC: The Century Council. The Century Council (2003). Hardcore Drunk Driving: A Sourcebook of Promising Strategies, Laws & Programs. Washington, DC: The Century Council. www.dwidata.org The Century Council (2005). Underage Drinking: A Resource Guide to State Laws. Washington, DC: The Century Council. www.centurycouncil.org/underage/aboutguide.html Chang, I., Gregory, C., and Lapham, S.C. (2002) Review of Screening Instruments and Procedures for Evaluating DWI (Driving While Intoxicated/Impaired) Offenders. Washington, DC: AAA Foundation for Traffic Safety. www.aaafoundation.org/resources/index.cfm?button=research Dill, P.L., Wells-Parker, E., and Soderstrom, C.A. (2004). The emergency care setting for screening and intervention for alcohol use problems among injured and high-risk drivers: a review. Traffic Injury Prevention 5, pp. 278-291. Ditter, S.M., Elder, R.W., and Shults, R.A., et al. (2005). Effectiveness of Designated Driver Programs for Reducing Drinking and Driving and Alcohol-Involved Crashes: A Systematic Review. Atlanta, GA: Centers for Disease Control and Prevention. www.thecommunityguide.org/mvoi/ D'Onofrio, G., and Degutis, L.C. (2002). Preventive care in the emergency department: screening and brief intervention for alcohol problems in the emergency department: a systematic review. Academic Emergency Medicine 5, pp. 627-638. www.ncbi.nlm.nih.gov/entrez/query.fcgi?cmd=Retrieve&db=pubmed&dopt=Abstract&list_uids=12045080
1 - 47
Elder, R.W. (2002). Effectiveness of Sobriety Checkpoints for Reducing Alcohol-Involved Crashes. Atlanta, GA: Centers for Disease Control and Prevention. www.thecommunityguide.org/mvoi/ Elder, R.W., Nichols, J.L., and Shults, R.A., et al. (2005). Effectiveness of School-Based Health Promotion Programs for Reducing Drinking and Driving and Alcohol-Involved Crashes: A Systematic Review. Atlanta, GA: Centers for Disease Control and Prevention. www.thecommunityguide.org/mvoi/ Elder, R.W., Shults, R.A., and Sleet, D.A., et al. (2002). Effectiveness of sobriety checkpoints for reducing alcohol-involved crashes. Traffic Injury Prevention 3, pp. 266-274. Elder, R.W., Shults, R.A., and Sleet, D.A., et al. (2004), Effectiveness of mass media campaigns for reducing drinking and driving and alcohol-involved crashes. American Journal of Preventive Medicine 27, pp. 57-65. www.thecommunityguide.org/mvoi/glance_massmediaAJPM.pdf. Fell, J.C., Ferguson, S.A., and Williams, A.F., et al. (2003). Why are sobriety checkpoints not widely adopted as an enforcement strategy in the United States? Accident Analysis and Prevention 35, pp. 897-902. Fell, J.C., Lacey, J.H., and Voas, R.B. (2004). Sobriety checkpoints: Evidence of effectiveness is strong, but use is limited. Traffic Injury Prevention 5, pp. 220-227. Ferguson, S.A., Fields, M., and Voas, R.B. (2000). Enforcement of zero-tolerance laws in the United States. In Proceedings of the 15th International Conference on Alcohol, Drugs and Traffic Safety. Stockholm, Sweden. www.icadts.org/proceedings/2000/icadts2000-108.pdf Grube, J.W., and Stewart, K. (2004). Preventing impaired driving using alcohol policy. Traffic Injury Prevention 5, pp. 199-207. Hedlund, J.H., and McCartt, A.T. (2002). Drunk Driving: Seeking Additional Solutions. Washington, DC: AAA Foundation for Traffic Safety. www.aaafoundation.org/resources/index.cfm?button=research Hedlund, J.H., Ulmer, R.G., and Preusser, DF (2001). Determine Why There Are Fewer Young Alcohol Impaired Drivers. DOT HS 809 348. Washington, DC: National Highway Traffic Safety Administration. www.nhtsa.dot.gov/people/injury/research/FewerYoungDrivers Hingson, R.W., Assailly, J-P., and Williams, A.F. (2004). Underage drinking: Frequency, consequences, and interventions. Traffic Injury Prevention 5, pp. 228-236. Hingson, R., Heeren, T., and Winter, M. (1998). Effects of Maine’s 0.05% legal blood alcohol level for drivers with DWI convictions. Public Health Reports, pp. 113, 440-6.

1 - 48
Hingson, R., McGovern, T., and Howland, J., et al. (1996). Reducing alcohol-impaired driving in Massachusetts: the Savings Lives Program. American Journal of Public Health, pp. 86, 791-797. Huddleston, C.W. III, Freeman-Wilson, K., and Boone, D.L. (2004). Painting the Current Picture: A National Report Card on Drug Courts and Other Problem-Solving Court Programs in the United States, Vol. I, No. 1. Alexandria, VA: National Drug Court Institute. www.ndci.org/publications/paintingcurrentpicture.pdf Huddleston, C.W. III (2005). Oral briefing to the GHSA Executive Board, June 2, 2005. Jones, R.K., Joksch, H.C., and Lacey, J.H., et al. (1995). Summary Report: Field Test of Combined Speed, Alcohol, and Safety Belt Strategies. DOT HS 808 242. Washington, DC: National Highway Traffic Safety Administration,. www.nhtsa.dot.gov/people/injury/traffic_tech/1995/TT096.htm Jones, R.K., and Lacey, J.H. (2001). Alcohol and Highway Safety 2001: A Review of the State of Knowledge. DOT HS 809 383. Washington, DC: National Highway Traffic Safety Administration. www.nhtsa.dot.gov/people/injury/research/AlcoholHighway/ Jones, and R.K., Rodriguez-Iglesias C. (2004). Evaluation of Lower BAC Limits for Convicted OUI Offenders in Maine. DOT HS 809 827. Washington, DC: National Highway Traffic Safety Administration. www.nhtsa.dot.gov/people/injury/alcohol/Maine-BAC-Limits/index.htm Lacey, J.H., Ferguson, S.A., Kelley-Baker, and T., Rider, R.P. (2005). Low-manpower checkpoints: can they provide effective DUI enforcement for small communities? Arlington, VA: Insurance Institute for Highway Safety. www.iihs.org/srpdfs/sr4004.pdf Lacey, J.H., Jones, R.K., and Wiliszowski, C.H. (2000). Zero-Tolerance Laws for Youth: Four States’ Experience. DOT HS 809 803. Washington, DC: National Highway Traffic Safety Administration. www.nhtsa.dot.gov/people/injury/alcohol/zero/zerolaws/zerotolerance_index.html Levy, M., Compton, R., and Dienstfrey, S. (2004). Public Perceptions of the July 2003 “You Drink & Drive. You Lose” Crackdown: Telephone Surveys Show the Media Campaign Reaches Target Audience. Traffic Safety Facts: Research Note. DOT HS 809 708. Washington, DC: National Highway Traffic Safety Administration. www.nhtsa.dot.gov/people/injury/research/RN-public04/RN%20PublicPercep/ Mothers Against Drunk Driving (2005). State-by-State Alcohol-Related Laws. Irving, TX: Mothers Against Drunk Driving. www3.madd.org/laws/ McCartt, A.T., Geary, L.L., and Nissen, W.J. (2002). Observational Study of the Extent of Driving While Suspended for Alcohol-Impaired Driving. Washington, DC: National Highway Traffic Safety Administration. www.nhtsa.dot.gov/people/injury/research/observation_study/

1 - 49
McCartt, A.T., and Northrup, V.S. (2003). Enhanced Sanctions for Higher BACs: Evaluation of Minnesota's High-BAC Law. DOT HS 809 677. Washington, DC: National Highway Traffic Safety Administration www.nhtsa.dot.gov/people/injury/alcohol/EnhancedSanctions/ McCartt, A.T., and Northrup, V.S. (2004). Effects of enhanced sanctions for high-BAC DWI drivers on case dispositions and rates of recidivism, Traffic Injury Prevention 5, pp. 270-277. Moyer, A., Finney, J.W., and Swearingen, C.E., et al. (2002). Brief interventions for alcohol problems: a meta-analytic review of controlled investigations in treatment-seeking and non-treatment-seeking populations. Addiction 97, pp. 279-292. NADCP (2005). Facts on Drug Courts. Alexandria, VA: National Association of Drug Court Professionals. www.nadcp.org/docs/FactsFinal.pdf NCHRP Report 500, Vol. 2 (2003). Guidance for Implementation of the AASHTO Strategic Highway Safety Plan, Volume 2: A Guide for Addressing Collisions Involving Unlicensed Drivers and Drivers with Suspended or Revoked Licenses. Washington, DC: Transportation Research Board. trb.org/publications/nchrp/nchrp_rpt_500v2.pdf, Strategy 2.1 D1. NCHRP Report 500, Vol. 16 (2005). A Guide for Reducing Alcohol-related Collisions. Washington, DC: Transportation Research Board. trb.org/publications/nchrp/nchrp_rpt_500v16.pdf NCUTLO (1999). Millennium DUI Prevention Act. Alexandria, VA: National Committee on Uniform Traffic Laws and Ordinances. www.ncutlo.org/1999dwi.htm NDCI (2004). DWI/Drug Court. Alexandria, VA: National Drug Court Institute. www.ndci.org/dwi_drug_court.htm NHTSA (1989). An Evaluation of the Elimination of Plea Bargaining for DWI Offenders. DOT HS 807 435. Washington, DC: National Highway Traffic Safety Administration. NHTSA (2002a). Digest of State Alcohol-Highway Safety Related Legislation, 20th Edition. DOT HS 809 435. Washington, DC: National Highway Traffic Safety Administration. NHTSA (2002b). Saturation Patrols and Sobriety Checkpoints: A How-to Guide for Planning and Publicizing Impaired Driving Enforcement Efforts. DOT HS 809 063. Washington, DC: National Highway Traffic Safety Administration. www.nhtsa.dot.gov/people/injury/alcohol/saturation_patrols/index.html NHTSA (2003). Criminal Justice Summit on Impaired Driving. DOT HS 809 605. Washington, DC: National Highway Traffic Safety Administration. www.nhtsa.dot.gov/people/injury/enforce/CrimJustSum-HTML/
1 - 50
NHTSA (2004a). Administrative License Revocation. Traffic Safety Facts: Laws. Washington, DC: National Highway Traffic Safety Administration. www.nhtsa.dot.gov/people/injury/New-fact-sheet03/fact-sheets04/Laws-ALR.pdf NHTSA (2004b). Open Container Laws. Traffic Safety Facts: Laws. Washington, DC: National Highway Traffic Safety Administration. www.nhtsa.dot.gov/people/injury/New-fact-sheet03/OpenContainer.pdf NHTSA (2004c). Vehicle and License Plate Sanctions. Traffic Safety Facts: Laws. Washington, DC: National Highway Traffic Safety Administration. www.nhtsa.dot.gov/people/injury/New-fact-sheet03/VehicleLicensePlate.pdf NHTSA (2004d). Traffic Safety Facts 2003: State Alcohol Estimates. DOT HS 809 772. Washington, DC: National Highway Traffic Safety Administration. www-nrd.nhtsa.dot.gov/pdf/nrd-30/NCSA/TSF2003/809772.pdf NHTSA (2004e). Conforming Products List. www.nhtsa.dot.gov/people/injury/alcohol/blood/htm NHTSA (2005a). Traffic Safety Facts 2003. DOT HS 809 775. Washington, DC: National Highway Traffic Safety Administration. www-nrd.nhtsa.dot.gov/pdf/nrd-30/NCSA/TSFAnn/TSF2003.pdf NHTSA (2005b). Motor Vehicle Traffic Crash Fatalities and Injuries: 2004 Projections. DOT HS 809 862. Washington, DC: National Highway Traffic Safety Administration. www-nrd.nhtsa.dot.gov/pdf/nrd-30/NCSA/PPT/2004EARelease.pdf NHTSA (2005c). Data from NHTSA Program Development and Delivery. NTSB (2000). Actions to Reduce Fatalities, Injuries, and Crashes Involving the Hard Core Drinking Driver. NTSB/SR-00/01. Washington, DC: National Transportation Safety Board. www.ntsb.gov/publictn/2000/sr0001.pdf Preusser, D.F. (2000). Identification of alcohol impairment on initial interview. In Issues and Methods in the Detection of Alcohol and Other Drugs, TRB Circular E-C020, pp. E1-E7. Washington, DC: Transportation Research Board. gulliver.trb.org/publications/circulars/ec020.pdf Probst, J., Lewis, J., and Asunka, K. et al. (1987). Assessment of Citizen Group Court Monitoring Programs. DOT HS 807 113. Washington, DC: National Highway Traffic Safety Administration. Robertson, R.D., and Simpson, H.M. (2002a). DWI System Improvements for Dealing with Hard Core Drinking Drivers: Prosecution. Ottawa, ON: Traffic Injury Research Foundation. www.trafficinjuryresearch.com/publications/PDF_publications/Prosecution_Report.pdf
1 - 51
Robertson, R.D., and Simpson, H.M. (2002b). DWI System Improvements for Dealing with Hard Core Drinking Drivers: Sanctioning. Ottawa, ON: Traffic Injury Research Foundation. www.trafficinjuryresearch.com/publications/PDF_publications/Sanctioning_Report.pdf Robertson, R.D., and Simpson, H.M. (2003). DWI System Improvement: Stopping the Revolving Door. Ottawa, ON: Traffic Injury Research Foundation. www.trafficinjuryresearch.com/publications/PDF_publications/DWI_Synthesis_Report.pdf Schermer, C.R., Gentilello, L.M., and Hoyt, D.B., et al. (2003). National survey of trauma surgeons’ use of alcohol screening and brief intervention. The Journal of Trauma: Injury, Infection, and Critical Care, 55, pp. 849-856. www.ncbi.nlm.nih.gov/entrez/query.fcgi?cmd=Retrieve&db=pubmed&dopt=Abstract&list_uids=14608155
Seufert, R.A., Clements-Carter, D., Walton, A.J., et al. (2004). Parents Who Host Lose the Most: Final Evaluation Report. Middletown, OH: Applied Research Center, Miami University Middletown. Shinar, D. (1992). Impact of court monitoring on the adjudication of driving while intoxicated (DWI). Accident Analysis and Prevention 24, pp. 167-179. Shults, R.A., Elder R.W., Sleet D.A., et al. (2001). Review of evidence regarding interventions to reduce alcohol-impaired driving, American Journal of Preventive Medicine 21(4S), pp. 66-84, www.thecommunityguide.org/mvoi/default.htm. Simpson, H.M., and Robertson, R.D. (2001). DWI System Improvements for Dealing with Hard Core Drinking Drivers: Enforcement. Ottawa, ON: Traffic Injury Research Foundation. www.trafficinjuryresearch.com/publications/PDF_publications/EnforcementReport.pdf Stewart, K. (1999). Strategies to Reduce Underage Alcohol Use: Typology and Brief Overview. Washington, DC: Office of Juvenile Justice and Delinquency Prevention, U.S. Department of Justice. www.udetc.org/documents/strategies.pdf Stuster, J.W. (2000). Increasing the opportunity to examine impaired drivers, in Issues and Methods in the Detection of Alcohol and Other Drugs, TRB Circular E-C020, pp. D10-D14. Washington, DC: Transportation Research Board. gulliver.trb.org/publications/circulars/ec020.pdf Stuster, J.W., and Blowers, P. (1995). Experimental Evaluation of Sobriety Checkpoint Programs. DOT HS 808 287. Washington, DC: National Highway Traffic Safety Administration. www.nhtsa.dot.gov/people/injury/traffic_tech/1995/TT103.htm Stuster, J., Burns, and M., Fiorentino, D. (2002). Open Container Laws and Alcohol Involved Crashes: Some Preliminary Data. DOT HS 809 426. Washington, DC: National Highway Traffic Safety Administration. www.nhtsa.dot.gov/people/injury/research/OpenContainer/index.htm
1 - 52
Toomey, T.L., and Wagenaar, A.C. (1999). Policy options for prevention: the case of alcohol, Journal of Public Health Policy 20, pp. 192-13. Ulmer, R.G., Hedlund, J.H., and Preusser, D.F. (1999). Determine why alcohol-related fatalities decreased in five states. Final report, contract DTHN22-97-D-05018. Washington, DC: National Highway Traffic Safety Administration. Ulmer, R.G., Shabanova, V.I., and Preusser, D.F. (2001). Evaluation of Use and Lose Laws. DOT HS 809 285. Washington, DC: National Highway Traffic Safety Administration. www.nhtsa.dot.gov/people/injury/research/pub/alcohol-laws/eval-of-law/ Voas, R.B., Fell, J.C., McKnight, A.S., et al. (2004). Controlling impaired driving through vehicle programs: an overview. Traffic Injury Prevention 5, pp. 292-298. Wagenaar, A.C., Zobek, T.S., Williams, G.D., et al. (2000). Effects of DWI Control Efforts: a Systematic Review of the Literature from 1960-1991. Minneapolis, MN: University of Minnesota, School of Public Health. Wells-Parker, E., Bangert-Drowns, R., McMillan, R., et al. (1995). Final results from a meta-analysis of remedial interventions with drink/drive offenders. Addiction 90, pp. 907-926. Wiliszowski, C.H., Jones, R.K., and Lacey, J.H. (2003). Examining the Effectiveness of Utah’s Law Allowing for Telephonic Testimony at ALR Hearings. Washington, DC: National Highway Traffic Safety Administration. www.nhtsa.dot.gov/people/injury/research/Utah_telephonic/Images/UTAH.PDF Wilk, A.L., Jensen, N.M., and Havighurst, T.C. (1997). Meta-analysis of randomized control trials addressing brief interventions in heavy alcohol drinkers. Journal of General Internal Medicine 12, pp. 274-83. Willis, C., Lybrand, S., and Bellany, N. (2004). Alcohol ignition interlock programs for reducing drink driving recidivism. The Cochrane Database of Systematic Reviews,3. www.cochrane.org/cochrane/revabstr/AB004168.htm Zwicker, T.J., Hedlund, J., and Northrup, V.S. (2005). Breath Test Refusals in DWI Enforcement: An Interim Report. DOT HS 809 876. Washington, DC: National Highway Traffic Safety Administration. www.nhtsa.dot.gov/staticfiles/DOT/NHTSA/Traffic%20Injury%20Control/Articles/Associated%20Files/Breath_TestRefusals.pdf
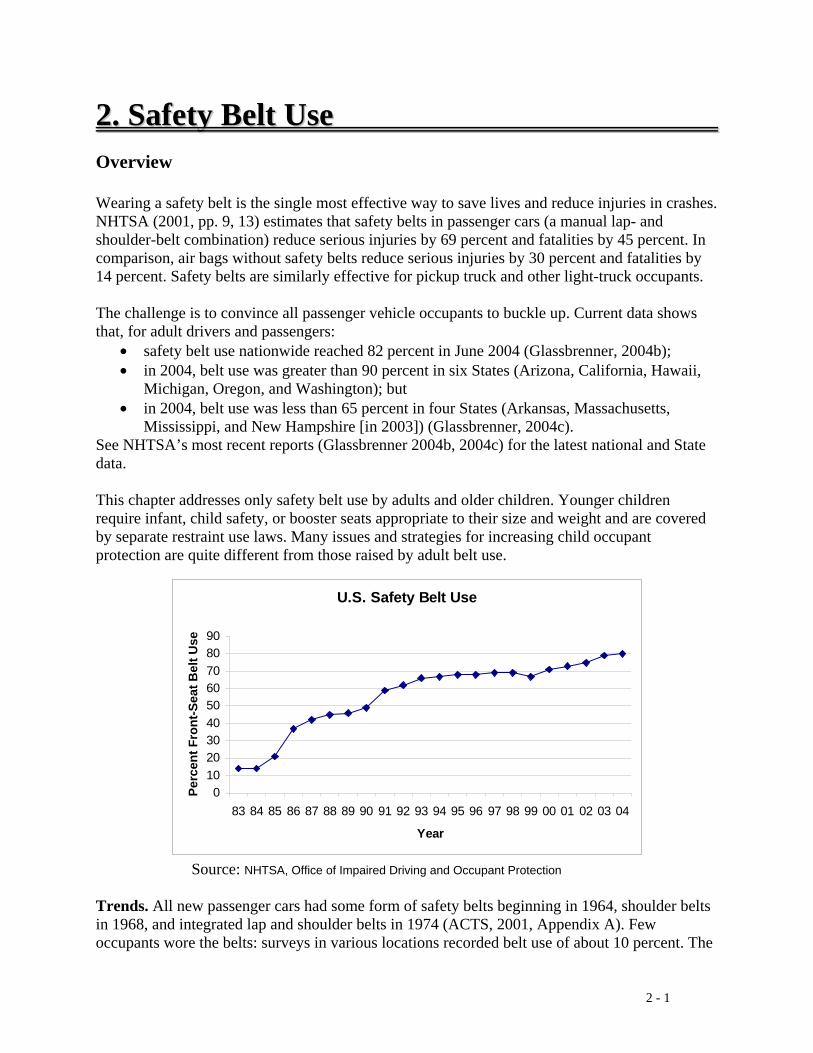
2 - 1
22.. SSaaffeettyy BBeelltt UUssee Overview Wearing a safety belt is the single most effective way to save lives and reduce injuries in crashes. NHTSA (2001, pp. 9, 13) estimates that safety belts in passenger cars (a manual lap- and shoulder-belt combination) reduce serious injuries by 69 percent and fatalities by 45 percent. In comparison, air bags without safety belts reduce serious injuries by 30 percent and fatalities by 14 percent. Safety belts are similarly effective for pickup truck and other light-truck occupants. The challenge is to convince all passenger vehicle occupants to buckle up. Current data shows that, for adult drivers and passengers:
• safety belt use nationwide reached 82 percent in June 2004 (Glassbrenner, 2004b); • in 2004, belt use was greater than 90 percent in six States (Arizona, California, Hawaii,
Michigan, Oregon, and Washington); but • in 2004, belt use was less than 65 percent in four States (Arkansas, Massachusetts,
Mississippi, and New Hampshire [in 2003]) (Glassbrenner, 2004c). See NHTSA’s most recent reports (Glassbrenner 2004b, 2004c) for the latest national and State data. This chapter addresses only safety belt use by adults and older children. Younger children require infant, child safety, or booster seats appropriate to their size and weight and are covered by separate restraint use laws. Many issues and strategies for increasing child occupant protection are quite different from those raised by adult belt use.
Source: NHTSA, Office of Impaired Driving and Occupant Protection Trends. All new passenger cars had some form of safety belts beginning in 1964, shoulder belts in 1968, and integrated lap and shoulder belts in 1974 (ACTS, 2001, Appendix A). Few occupants wore the belts: surveys in various locations recorded belt use of about 10 percent. The
U.S. Safety Belt Use
0102030405060708090
83 84 85 86 87 88 89 90 91 92 93 94 95 96 97 98 99 00 01 02 03 04
Year
Perc
ent F
ront
-Sea
t Bel
t Use
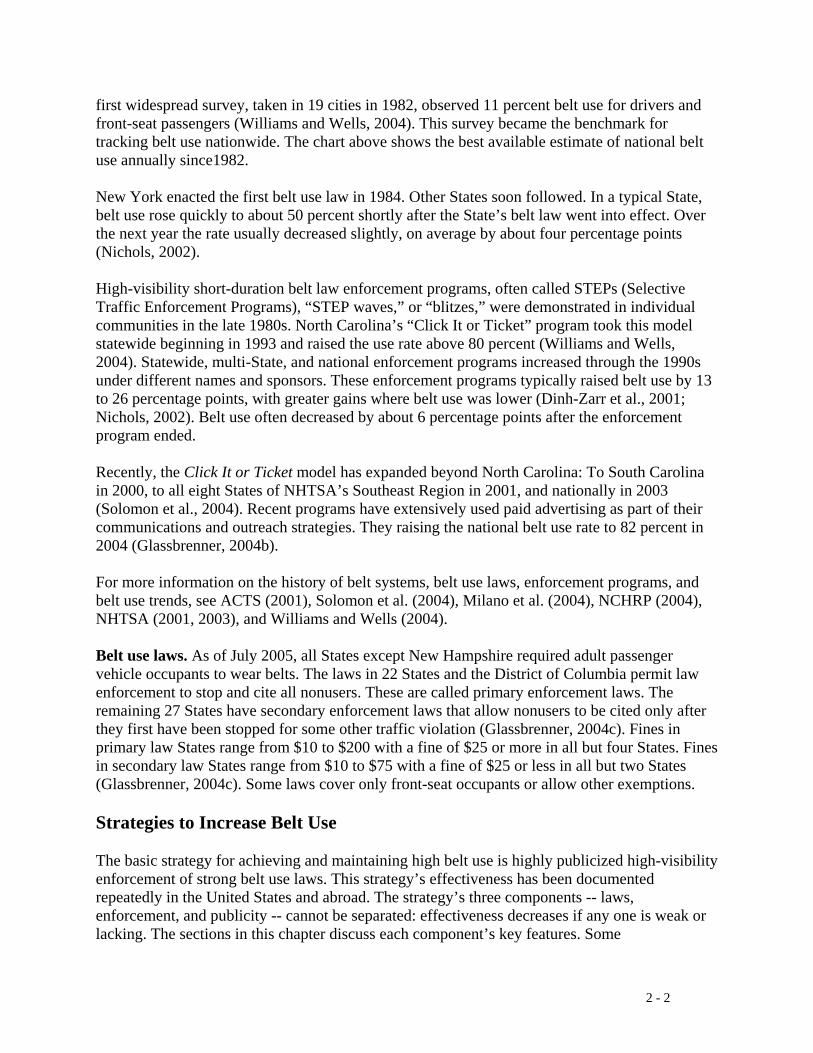
2 - 2
first widespread survey, taken in 19 cities in 1982, observed 11 percent belt use for drivers and front-seat passengers (Williams and Wells, 2004). This survey became the benchmark for tracking belt use nationwide. The chart above shows the best available estimate of national belt use annually since1982. New York enacted the first belt use law in 1984. Other States soon followed. In a typical State, belt use rose quickly to about 50 percent shortly after the State’s belt law went into effect. Over the next year the rate usually decreased slightly, on average by about four percentage points (Nichols, 2002). High-visibility short-duration belt law enforcement programs, often called STEPs (Selective Traffic Enforcement Programs), “STEP waves,” or “blitzes,” were demonstrated in individual communities in the late 1980s. North Carolina’s “Click It or Ticket” program took this model statewide beginning in 1993 and raised the use rate above 80 percent (Williams and Wells, 2004). Statewide, multi-State, and national enforcement programs increased through the 1990s under different names and sponsors. These enforcement programs typically raised belt use by 13 to 26 percentage points, with greater gains where belt use was lower (Dinh-Zarr et al., 2001; Nichols, 2002). Belt use often decreased by about 6 percentage points after the enforcement program ended. Recently, the Click It or Ticket model has expanded beyond North Carolina: To South Carolina in 2000, to all eight States of NHTSA’s Southeast Region in 2001, and nationally in 2003 (Solomon et al., 2004). Recent programs have extensively used paid advertising as part of their communications and outreach strategies. They raising the national belt use rate to 82 percent in 2004 (Glassbrenner, 2004b). For more information on the history of belt systems, belt use laws, enforcement programs, and belt use trends, see ACTS (2001), Solomon et al. (2004), Milano et al. (2004), NCHRP (2004), NHTSA (2001, 2003), and Williams and Wells (2004). Belt use laws. As of July 2005, all States except New Hampshire required adult passenger vehicle occupants to wear belts. The laws in 22 States and the District of Columbia permit law enforcement to stop and cite all nonusers. These are called primary enforcement laws. The remaining 27 States have secondary enforcement laws that allow nonusers to be cited only after they first have been stopped for some other traffic violation (Glassbrenner, 2004c). Fines in primary law States range from $10 to $200 with a fine of $25 or more in all but four States. Fines in secondary law States range from $10 to $75 with a fine of $25 or less in all but two States (Glassbrenner, 2004c). Some laws cover only front-seat occupants or allow other exemptions. Strategies to Increase Belt Use The basic strategy for achieving and maintaining high belt use is highly publicized high-visibility enforcement of strong belt use laws. This strategy’s effectiveness has been documented repeatedly in the United States and abroad. The strategy’s three components -- laws, enforcement, and publicity -- cannot be separated: effectiveness decreases if any one is weak or lacking. The sections in this chapter discuss each component’s key features. Some
2 - 3
communications and outreach and incentive programs directed to well-defined and limited audiences such as schools, businesses, and communities have been moderately successful and also are discussed in this Chapter. NCHRP (2004) discusses several of these strategies and provides links to additional information. Safety belt use also may be affected by vehicle design features such as the comfort and convenience of belt systems, and by lights or buzzers to remind occupants to buckle up (NHTSA, 2003). These vehicular countermeasures are not included in this guide because SHSOs have little or no authority or responsibility for them.
Key terms • Primary enforcement: laws that permit nonusers to be stopped and cited by a law
enforcement officer independently of any other traffic behavior. • Secondary enforcement: laws that permit nonusers to be cited only after they have been
stopped for some other traffic violation.

2 - 4
Countermeasures That Work Countermeasures to increase safety belt use are listed below and discussed individually in this chapter. The table is intended to give a rough estimate of each countermeasure’s effectiveness, use, cost, and time required for implementation. The terms used are described below. Effectiveness, cost, and time to implement can vary substantially from State to State and community to community. Costs for many countermeasures are difficult to measure, so the summary terms are very approximate. See each countermeasure discussion for more information on each item. 1. Safety belt use laws Countermeasure Effectiveness Use Cost Time 1.1 State primary enforcement belt use laws Proven Medium Low Short 1.2 Local primary enforcement belt use laws Likely Low Low Short 1.3 Increased belt use law penalties Likely Low Low Short 1.4 Coverage: seating position, vehicles, ages Unknown Medium Low Short 2. Safety belt law enforcement Countermeasure Effectiveness Use Cost Time 2.1 Short high-visibility belt law enforcement Proven Medium* High Medium 2.2 Sustained enforcement Uncertain Unknown Varies Varies 2.3 Combined enforcement, nighttime Likely Unknown High Medium * Used in many jurisdictions but often only once or twice each year 3. Communications and outreach Countermeasure Effectiveness Use Cost Time 3.1 Supporting enforcement Proven Medium Varies Medium 3.2 Strategies for low-belt-use groups Uncertain* Unknown Unknown Medium * For stand-alone programs not supporting enforcement 4. Other strategies Countermeasure Effectiveness Use Cost Time 4.1 Employer and school programs Proven* Unknown Varies Varies 4.2 Incentive programs Proven* Low Varies Medium * In low-belt-use settings with no belt use law Effectiveness: Proven: demonstrated by several high-quality evaluations with consistent results. Likely: balance of evidence from high-quality evaluations or other sources. Uncertain: limited and perhaps ambiguous evidence. Unknown: no high-quality evaluation evidence. Varies: different methods of implementing this countermeasure produce different results. Effectiveness is measured by increases in observed safety belt use. See individual countermeasure descriptions for information on effectiveness size and how effectiveness is measured.
2 - 5
Use: High: more than two-thirds of the States, or a substantial majority of communities. Medium: between one-third and two-thirds of States or communities. Low: fewer than one-third of the States or communities. Unknown: data not available. Cost to implement: High: requires extensive new facilities, staff, equipment, or publicity, or makes heavy
demands on current resources. Medium: requires some additional staff time, equipment, and/or facilities. Low: can be implemented with current staff, perhaps with training; limited costs for equipment or facilities. These estimates do not include the costs of enacting legislation or establishing policies. Time to implement: Long: more than one year. Medium: more than three months but less than one year. Short: three months or less. These estimates do not include the time required to enact legislation or establish policies.

2 - 6
1.1 State Primary Enforcement Belt Use Laws Effectiveness: Proven Use: Medium Cost: Low Time: Short Primary enforcement belt use laws permit non-users to be stopped and cited independently of any other traffic behavior. Secondary enforcement laws allow non-users to be cited only after they first have been stopped for some other traffic violation. Use: As of July 2005, 22 States and the District of Columbia had primary belt use laws, 27 States had secondary enforcement laws, and New Hampshire had no belt use law applicable to adults (Glassbrenner, 2004c, NHTSA, 2005b). Some of the secondary laws are primary for drivers under a specified age. Effectiveness: In 2004, belt use averaged 85 percent in the 21 primary law States and the District of Columbia and averaged 75 percent in the 28 secondary law States (Glassbrenner, 2004c). Studies of five States that changed their belt use laws from secondary to primary enforcement found that belt use increased from 12 to 18 percentage points where all passenger vehicles were covered by the law and 8 percentage points in one State where pickup trucks were excluded (Nichols, 2002). CDC’s systematic review of 13 high-quality studies (Shults et al., 2004) found that primary laws increase belt use by about 14 percentage points and reduce occupant fatalities by about 8 percent compared to secondary laws. Costs: Once legislation has been enacted to upgrade a secondary law to primary, the costs are to publicize the change and enforce the new law. Publicity costs to inform the public of the law change should be low because the media will cover the law change extensively. Law enforcement can adapt its secondary law enforcement strategies for use under the primary law or may be able to use new strategies permitted by the primary law. States wishing to increase enforcement and publicity to magnify the effect of the law change will incur additional costs: see Chapter 2, Section 2.1. Time to implement: A primary belt use law can be implemented as soon as the law is enacted. Other issues:
• Opposition to primary belt laws: In most States there is substantial opposition to changing a secondary to a primary belt use law. Opponents claim that primary laws impinge on individual rights and provide opportunities for law enforcement to harass minority groups. Studies in several States have found that minority groups were ticketed at similar or lower rates than others after a primary law was implemented (Shults et al., 2004). When Michigan changed from a secondary to a primary law, harassment complaints were very uncommon both before and after the law change. The proportion of safety belt use citations issued to minority groups decreased under the primary law. In a telephone survey, the vast majority of people who actually received safety belt citations did not feel that they were singled out on the basis of race, age, or gender. However, some minorities and young drivers reported perceptions of harassment (Eby et al., 2004).
• Effect on low-belt-use groups: Studies in States that changed their law from secondary to primary show that belt use increased across a broad range of drivers and passengers. In

2 - 7
some States, belt use increased more for low-belt-use groups, including Hispanics, African-Americans, and drinking drivers, than for all occupants (Shults et al., 2004).
2 - 8
1.2 Local Primary Enforcement Belt Use Laws and Ordinances Effectiveness: Likely Use: Low Cost: Low Time: Short In some States with secondary enforcement belt use laws, individual communities have enacted and enforced community-wide primary laws or ordinances. These laws differ from statewide laws only in that they are enacted, publicized, and enforced locally. Use: No data is available on how many communities have primary laws. NHTSA’s Great Lakes Region reports that 47 communities in Illinois, with a combined population of 1.3 million residents, had local primary laws in effect before the Illinois statewide law was enacted. Similarly, Memphis had a primary law before Tennessee’s statewide primary law (Lacey et al., 2005). Effectiveness: While there are no formal studies of local primary belt laws, the available evidence suggests that they increase belt use. See also NCHRP (2004, strategy A3).
• Illinois: The statewide primary belt use law was enacted in 2003. From 1997 to 2002, Illinois Department of Transportation data shows that average belt use was higher in communities with local primary belt use laws. In the annual statewide belt use surveys over these six years, average belt use in the 39 sites with local laws was 5.6 percentage points higher than the statewide belt use rate (M. Nassirpour, personal communications, January 2005. ).
• Tennessee: The University of Tennessee conducted regional belt use surveys before and after the 2003 combined safety belt and impaired-driving campaigns. At this time Tennessee did not have a statewide primary belt law. The western region of the State is dominated by Memphis, where a local primary belt law was in place. The other three regions had no local belt use laws. Belt use was substantially higher in the western region than in the other regions before the campaigns: 74 percent in the west compared to 55 percent, 66 percent, and 68 percent in the other regions. The media campaign in the west used only the You Drink & Drive. You Lose. impaired-driving message and no belt use message. Belt use in the west slipped slightly to 72 percent after the campaign. The media campaigns in the other three regions used the Click It or Ticket safety belt message either alone or together with the You Drink & Drive. You Lose message. Belt use in these regions increased slightly to 62 percent, 67 percent, and 70 percent, respectively, still lower that the west’s 72 percent (Lacey et al., 2005).
Costs: As with a statewide law, the costs are for publicity and enforcement. Both must be directed to the community itself. Time to implement: As with a statewide law, a local law can be implemented as soon as it is enacted. The law’s debate and passage likely will generate initial publicity. Other issues: See the discussion under Chapter 2, Section 1.1, Primary Enforcement Belt Use Laws.
2 - 9
1.3 Increased Belt Use Law Penalties: Fines and Driver’s License Points Effectiveness: Likely Use: Low Cost: Low Time: Short Penalties for most belt use law violations are low. As of October 2004, a violation resulted in a typical fine of $25 or less in all but 9 States (Glassbrenner, 2004c). Low fines may not convince nonusers to buckle up. They also may send a message that belt use laws are not taken seriously. Most States penalize serious traffic law violations by assessing demerit points against a driver’s license. Drivers lose their licenses if they accumulate more than a specified number of points within a specified period of time. In a national survey in 2000, drivers who were not regular belt users considered license points the most effective way to increase their belt use. License points were considered more effective than increased fines or increased enforcement, in both primary and secondary law States (ACTS, 2000, Appendix D). Use: As of October 2004, 7 primary law States and 2 secondary law States had a minimum fine of $30 or more. Three other States allowed a fine of $30 or more in some circumstances. Three jurisdictions assessed driver’s license points: New Mexico, New York, and the District of Columbia (Glassbrenner, 2004c). Effectiveness: No recent study has evaluated the effects of fine levels on belt use (Nichols, 2002). Evidence from 2004 suggests that higher fines may help achieve higher belt use. In primary law States, belt use averaged 4.5 percentage points higher in the 7 States with fines of $30 or more compared to the 15 States with fines of $25 or less (88.4% compared to 83.9%). In secondary law States, the difference was 1.2 percentage points: 76.2 percent in the 2 States at $30 or more and 75.0 percent in the 26 States at $25 or less (Glassbrenner, 2004c). The laws may be publicized and enforced more vigorously in States with higher fines, and the enforcement and publicity may account for some or all of the differences in usage rates. In a national survey in 2000, 42 percent of drivers who did not use belts regularly said they would definitely be more likely to wear belts if the fine were increased. Another 25 percent of these drivers said they would probably be more likely to wear their belts (ACTS, 2001, Appendix D). Surveys in North Carolina also found that some nonusers would buckle up if the fine were doubled to $50 (Williams and Wells, 2004). The effect of driver’s license points on belt use also has not been evaluated. As with fine levels, the evidence from 2004 suggests that points may be effective. All 3 jurisdictions with points had primary laws. Belt use averaged 87.3 percent in these jurisdictions and 85.0 percent in the remaining primary law States (Glassbrenner, 2004c). In the 2000 national survey, 49 percent of drivers who were not regular belt users said they would definitely be more likely to wear their belts if violators were assessed driver’s license points. Another 27 percent of these drivers said they would probably be more likely to wear their belts (ACTS, 2001, Appendix D). In a North Carolina survey, 62 percent of nonusers said they always would wear their belt if violations led to driver’s license points (Williams and Wells, 2004).
2 - 10
Costs: The direct costs associated with increasing fine levels or assessing driver’s license points are minimal. Time to implement: Both measures can be implemented as soon as they are publicized and appropriate changes are made to the motor vehicle records systems. Other issues:
• Balance: If penalties are excessively low, then they may have little effect. If they are excessively high, then law enforcement officers may be reluctant to issue citations and judges may be reluctant to impose them. States should choose penalty levels that strike an appropriate balance.
• Penalty levels are part of a system: Penalty levels are part of the complete system of well-publicized enforcement of strong belt use laws. Appropriate penalty levels help make strong laws. But without effective enforcement, judicial support, and good publicity, increased penalties may have little effect.
2 - 11
1.4 Belt Use Law Coverage: Seating Positions, Vehicles, Ages Effectiveness: Unknown Use: Medium Cost: Low Time: Short Belt use laws cover only front-seat passengers in more than half of the States (Glassbrenner, 2004c). Most States’ laws exempt some vehicles, such as those designed for more than 10 passengers, taxis, postal delivery vehicles, farm vehicles, or vehicles not required to have safety belts (Glassbrenner, 2004c). Most State belt use laws cover passengers over a specified age and are designed to work in combination with child passenger safety laws covering younger passengers, usually up to the minimum driving age. Some States exempt passengers for specified medical or physical reasons (Glassbrenner, 2004c). Many States make belt use mandatory under their Graduated Driver Licensing laws for beginning drivers (see Chapter 6, Section 1.1). A good belt use law should be comprehensive, covering all seating positions equipped with a safety belt in all passenger vehicles (ACTS, 2001, p. 3; NCUTLO, 2004; NHTSA, 2003, Table 3). Such a law sends a clear and consistent message to the public. Use: In more than half the States, belt use laws exempt passengers in some seating positions or in some passenger vehicles (Glassbrenner, 2004c). Effectiveness: The effects on belt use of excluding some vehicles or some seating positions have not been evaluated. In NHTSA’s 2003 national telephone survey, rear-seat passengers who thought they were covered by their State’s law reported higher belt use than those who did not: 62 percent “always use belts” compared to 45 percent (Boyle and Vanderwolf, 2003, p. 130). Costs: The costs of expanding a belt use law to include all seating positions in all passenger vehicles are minimal. Time to implement: Expanded belt use law coverage can be implemented as soon as the law is enacted and publicized.
2 - 12
2.1 Short-Term, High-Visibility Belt Law Enforcement Effectiveness: Proven Use: Medium* Cost: High Time: Medium * Used in many jurisdictions but often only once or twice each year The most common high-visibility belt law enforcement method consists of short-term (typically lasting for two weeks), intense, highly publicized periods of increased belt law enforcement, frequently using checkpoints (in States where checkpoints are permitted), saturation patrols, or enforcement zones. These periods sometimes are called STEP waves (Selective Traffic Enforcement Programs) or blitzes. The method was developed in Canada in the 1980s (Boase et al., 2004) and demonstrated in several United States communities (Williams and Wells, 2004). It was implemented statewide in North Carolina in 1993 using the Click It or Ticket slogan (Reinfurt, 2004), and subsequently adopted in other States under different names and sponsors (Solomon et al., 2004). NHTSA’s Click It or Ticket high-visibility enforcement model is described in detail in Solomon et al. (2003) and Solomon and Chafee (2005). Use: Most States currently conduct short-term, high-visibility belt law enforcement programs in May, as part of a national safety belt mobilization (Solomon et al., 2004). They may conduct others throughout the year. In recent years the Air Bag and Seat Belt Safety Campaign and NHTSA have supported these campaigns. Nearly 12,500 law enforcement agencies took part in the May 2005 campaign (NHTSA, 2005b). See Milano et al. (2004) for a detailed account of the history and evolution of the national campaigns. Effectiveness: CDC’s systematic review of 15 high-quality studies (Dinh-Zarr et al., 2001; Shults et al., 2004) found that short-term, high-visibility enforcement programs increased belt use by about 16 percentage points, with greater gains when pre-program belt use was lower. CDC noted that many of the studies were conducted when belt use rates were considerably lower than at present, so that new programs likely will not have as large an effect. Belt use often dropped by about 6 percentage points after the enforcement program ended. Short-term, high-visibility enforcement programs thus typically have a ratchet effect: belt use increases during and immediately after the program and then decreases somewhat, but remains at a level higher than the pre-program belt use. NHTSA evaluated the effects of the May 2002, 2003, and 2004 Click It or Ticket campaigns on belt use in the States. In 2002, belt use increased by 8.6 percentage points across 10 States that used paid advertising extensively in their campaigns. Belt use increased by 2.7 percentage points across 4 States that used limited paid advertising and increased by 0.5 percentage points across 4 States that used no paid advertising (Solomon et al., 2002). The 2003 campaign used extensive paid advertising: about $8 million nationally and $16 million in individual States (Solomon et al., 2003, Technical Summary). The advertising strongly supported the campaign with clear enforcement images and messages. Nationally, belt use following the 2003 campaign was 79 percent compared to 75 percent at the same time in 2002 (Glassbrenner, 2004b). Twenty-eight States conducted small belt use surveys immediately before the May 2003 campaign. Across these States, belt use was 75.2 percent in 2002, 72.8 percent before the 2003 campaign and 78.5 percent immediately after the campaign. These results show the typical ratchet effect, with belt use dropping gradually after the 2002 campaign and then
2 - 13
rising rapidly immediately after the 2003 campaign to a higher level than after the previous campaign (Solomon et al., 2003, Chapter IV). The 2004 campaign increased paid advertising to about $12 million nationally and $20 million in the States (Solomon and Chaffe, in review). As in 2003, the advertising strongly supported enforcement activities. Belt use nationally reached 82 percent following the campaign (Glassbrenner, 2004b). Across the 50 States and the District of Columbia, belt use increased in 42 jurisdictions compared to the same time in 2003. Averaged across all 51 jurisdictions, belt use increased by 2.4 percentage points (Solomon and Chafee, in review, Chapter IV). Costs: High-visibility enforcement campaigns are expensive. They require extensive time from State highway safety office and media staff and often from consultants to develop, produce, and distribute publicity and time from law enforcement officers to conduct the enforcement. Paid advertising increases a campaign’s effectiveness, as discussed above, but can be quite expensive. Averaged across all States, paid advertising costs were about $125,000 per State for the 2002 campaign and over $400,000 in 2004 (Solomon and Chaffe, in review, Chapter II). Time to implement: A high-visibility enforcement program requires four to six months to plan and implement. Other issues:
• Effects in primary and secondary belt law States: High-visibility enforcement campaigns are effective in both primary and secondary law States. NHTSA’s 2003 evaluation found that belt use increased by 4.6 percentage points across the primary law States and by 6.6 percentage points across the secondary law States (Solomon et al, 2003, Chapter IV; see also Nichols, 2002). The 2004 evaluation found that the campaign increased belt use in 25 secondary jurisdictions by an average of 3.7 percentage points. Belt use decreased in the remaining 5 jurisdictions by an average of 2.3 percentage points (Solomon and Chaffe, in review, Chapter IV).
• Effects on low-belt-use groups: CDC’s systematic review observed that short-term, high-visibility enforcement campaigns increased belt use more among lower-belt-use groups, including young drivers, rural drivers, males, African-Americans, and Hispanics, than among higher-belt-use drivers such as older drivers, suburban drivers, females, and Caucasians (Shults et al., 2004).
2 - 14
2.2 Sustained Enforcement Effectiveness: Uncertain Use: Unknown Cost: Varies Time: Varies Some jurisdictions, including California, Oregon, and Washington, enforce their belt use laws vigorously as part of standard traffic enforcement activities. Use: The extent of vigorous sustained belt law enforcement, with or without extensive publicity, is unknown. Effectiveness: There are no studies of the effectiveness of sustained enforcement (Hedlund et al, 2004). California, Oregon, and Washington, States reported to use sustained enforcement, have recorded statewide belt use well above national belt use rates since 2002 (California: 90%-91%; Oregon: 88%-93%; Washington: 93%-95%) (Glassbrenner, 2004c). Costs: Sustained enforcement may require funds for publicity. As with short-term, high-visibility enforcement programs, publicity costs will depend on the mix of earned and paid media. Paid media can be expensive. Time to implement: Sustained enforcement by law enforcement officers can be implemented immediately. Extensive publicity will take three or four months to plan and implement.
2 - 15
2.3 Combined Enforcement; Nighttime Enforcement Effectiveness: Likely Use: Unknown Cost: High Time: Medium Short-term, high-visibility belt law enforcement programs (Chapter 2, Section 2.1) require substantial funding and law enforcement resources, so they can be difficult to sustain over a period of several years (Nichols, 2002). These programs also have been conducted almost exclusively during the daylight hours, and the limited available data suggests that belt use is lower at night (Chaudhary et al., under review; Hedlund et al., 2004). Continual enforcement (Chapter 2, Section 2.2), in which belt law violations are enforced as standard part of regular traffic patrol, is one way to address these issues. A second way is to retain the short-term, high-intensity enforcement model but include other traffic safety issues such as impaired driving (DWI) and excessive speed, especially since the same drivers tend to drink, speed, and not buckle up. In particular, combined DWI and belt law checkpoints, saturation patrols, or enforcement zone operations could be conducted at night, when belt use is lower, DWI higher, and crash risk greater than during the day. Another way to increase belt use at night is to use new night-vision technology for nighttime enforcement. The first demonstration of this strategy took place in 2004 in Reading, Pennsylvania (Chaudhary et al., under review). Use: There is no available information on how frequently the multifocused high-visibility enforcement strategy is used. A single demonstration of a nighttime program was conducted in 2004 (Chaudhary et al., under review). Effectiveness: The one study of combined high-visibility enforcement, in three demonstration sites, produced “encouraging but inconclusive” overall results (Jones et al., 1995; Jones and Lacey, 2001, p. 113). Each site targeted belt use, speeding, and alcohol-impaired driving (DWI). One site maintained the planned high-intensity enforcement directed at all three behaviors and saw reduced DWI and speeding while maintaining a high belt use rate. A second site conducted only high-visibility DWI enforcement, which had an effect only on DWI. The third site failed to conduct high-visibility enforcement of any type and saw no effect. A 2004 nighttime high-visibility belt enforcement program in Reading, Pennsylvania, increased nighttime front-seat-occupant belt use by 6 percentage points, from 50 percent to 56 percent. Daytime belt use increased by 3 percentage points, from 56 percent to 59 percent (Chaudhary et al., under review). Costs: The costs of combined high-visibility enforcement programs are similar to and probably somewhat greater than the costs of programs directed exclusively at belt law violators (Chapter 2, Section 2.1). Publicity must be directed at different offenses in turn, and law enforcement officers must have the training and equipment to address different offenses. Nighttime and daytime programs should have similar costs. Time to implement: As with standard belt law short-term, high-visibility enforcement programs, combined or nighttime programs require four to six months to plan and implement.

2 - 16
2 - 17
3.1 Communications and Outreach Supporting Enforcement Effectiveness: Proven Use: Medium Cost: Varies Time: Medium Effective, high-visibility communications and outreach are an essential part of successful safety belt law high-visibility enforcement programs (Solomon et al., 2003, Chapter II). Paid advertising can be a critical part of the media strategy. Paid advertising brings with it the ability to control message content, timing, placement, and repetition (Milano et al., 2004). Use: All high-visibility enforcement programs include communications and outreach strategies that use some combination of earned media (news stories) and paid advertising. Effectiveness: As discussed in Section 2.1, the May 2002 Click It or Ticket campaign evaluation demonstrated the effect of different media strategies. Belt use increased by 8.6 percentage points across 10 States that used paid advertising extensively in their campaigns. Belt use increased by 2.7 percentage points across 4 States that used limited paid advertising and increased by only 0.5 percentage points across 4 States that used no paid advertising (Solomon et al., 2002). Milano et al. (2004) summarize an extensive amount of information from national telephone surveys conducted in conjunction with each national campaign from 1997 through 2003. Costs: As discussed in Chapter 2, Section 2.1, paid advertising can be quite expensive. In the average State, paid advertising costs were about $125,000 for the 2002 campaign and over $400,000 in 2004 (Solomon and Chaffe, in review, Chapter II). Time to implement: An effective media campaign requires four to six months to plan and implement.
2 - 18
3.2 Communications and Outreach Strategies for Low Belt Use Groups Effectiveness: Uncertain* Use: Unknown Cost: Varies Time: Medium * For stand-alone programs not supporting enforcement With belt use at 80 percent nationally and 70 percent or higher in 42 States, the large majority of drivers and passengers use their belts on every trip. The challenge is to reach the minority who still do not buckle up regularly. Observations and telephone surveys show who these nonusers are. NHTSA’s 2003 national observation survey found lower use for males (77%) than females (81%), lower use for drivers age 16 to 24 (75%) than those 25 to 69 (80%), lower use for rural drivers (74%) compared to urban (79%) and suburban (84%) drivers (all data from Glassbrenner, 2004a, Table 5), and lower use for passengers (77%) than for drivers (80%) (Glassbrenner, 2003, Table 1). Belt use is lower for pickup truck drivers (69%) than passenger car drivers (81%) (Glassbrenner, 2003, Table 1). NHTSA’s 2003 national telephone survey found the same patterns, with males, young drivers, rural drivers, pickup truck drivers, and passengers reporting lower belt use (Boyle and Vanderwolf, 2003, p. iv). In the telephone survey, no ethnic or racial group reported substantially lower than average belt use (Boyle and Vanderwolf, 2003, p. 16). Most nonusers do wear belts some of the time, or at least say they do. In NHTSA’s 2003 national telephone survey, only 2 percent of drivers and front-seat passengers said they never used their belts and another 2 percent said they rarely used them (Boyle and Vanderwolf, 2003, pp. 11, 39). Back-seat passengers are more frequently unbelted: 13 percent said they never use belts and another 8 percent said they rarely use them, while only 53 percent reported wearing belts all the time (Boyle and Vanderwolf, 2003, p. 41). The most frequent reasons given for not wearing a belt were forgetting to buckle up (55% of drivers and 44% of passengers), only driving a short distance (56% and 34%), in a hurry (40% and 31%), and uncomfortable belts (32% and 30%) (Boyle and Vanderwolf, 2003, p. 81). In the 1960s and 1970s, during the period of low belt use before belt use laws were enacted, communications and outreach campaigns did not increase belt use (ACTS, 2001, Appendix A). More recently, many communications efforts that do not carry an enforcement message have been used in attempts to raise the belt use of low-belt-use groups but few have been evaluated. High-visibility enforcement programs generally have been effective in increasing belt use among these lower-use groups (see Chapter 2, Section 2.1; Shults et al., 2004). Their publicity messages and placement can be directed at specific lower-belt-use groups. Two 2001 programs successfully targeted pickup trucks as part of high-visibility safety belt enforcement activities. The “Pick Up the Buckle, Each Time, Every Time” campaign in South Dakota increased belt use in pickup trucks from 33 percent to 49 percent and the “When you get in a truck, you’d better buckle up” campaign in Florida increased use from 47 percent to 68 percent (NHTSA, 2005a). North Dakota’s “Pick Up the Habit for Someone You Love” campaign in 2003 provides the best-documented example of a successful nonenforcement communications and outreach program. It was directed at male pickup drivers, whose pre-program belt use was 20 percentage points lower than the statewide 63 percent rate. A survey of these drivers identified effective message goals
2 - 19
(choose and remember to buckle up); message strategies (motivation through loved ones, sometimes using humor); and message placement (combining paid and earned radio and television, posters, and public relations events). The program increased observed belt use of male pickup drivers by 7 percentage points at a total cost of $295,000 (North Dakota DOT, 2004). The 5 States of NHTSA’s South Central Region conducted a two-week “Buckle Up in Your Truck” paid advertising campaign immediately before their May 2004 Click It or Ticket campaign. The truck campaign’s message complemented the Click It or Ticket message by focusing on the dangers of riding unrestrained in a truck and stressing the usefulness of belts in rollover crashes. The campaign spent nearly $600,000 for paid advertising in the 5 States. Surveys at the end of the campaign, before any enforcement-based Click It or Ticket publicity, showed that belt use increased in pickup trucks by about 2 percentage points. Belt use in pickup trucks increased by another 6 percentage points after the Click It or Ticket publicity (Solomon and Chaffe, in review, Chapter IV). The campaign will continue to be conducted and evaluated in 2005 and 2006. In a follow-up study, an intensive campaign using the same “Buckle Up in Your Truck” message was conducted in Amarillo, Texas, in November 2004. Belt use in pickup trucks increased by 12 percentage points in Amarillo, and belt use in cars increased by 8 percentage points. At the same time, belt use in a comparison community increased by 5 percentage points for pickup truck occupants and by 4 percentage points for car occupants. Another follow-up study is planned for 2005 (Solomon and Chafee, in review, Chapter IV). Use: Communications and outreach campaigns directed at low-belt-use groups probably are quite common, but no summary is available. Effectiveness: Uncertain. The North Dakota and Amarillo campaigns are the only well-documented and successful examples. They used all the characteristics of effective communications and outreach campaigns: good target audience research, effective and creative message development, and good message placement using both paid and earned media. The overall South Central Region campaign produced only modest gains. Costs: As with enforcement-related communications and outreach, costs vary depending on program quality and delivery. Paid advertising can be expensive. Time to implement: A good media campaign will require four to six months to plan and implement.
2 - 20
4.1 Employer and School Programs Effectiveness: Proven* Use: Unknown Cost: Varies Time: Varies * In low-belt-use settings with no belt use law Employers, schools, and similar institutions provide well-defined and somewhat controlled audiences for safety belt use programs. Education and other communications strategies can be tailored to a specific audience. Safety belt use policies can be implemented and enforced in certain settings. Incentive programs can be conducted (Chapter 2, Section 4.2). Little information is available on what employer and school programs have been conducted recently and how effective they have been. The few high-quality published studies were conducted more than 15 years ago, in a low-belt-use environment (Nichols, 2002). Use: There is no data on the number of employer and school programs operating currently. Effectiveness: Employer and school programs in a low-belt-use environment with no belt use law have increased belt use substantially: by an average of 24 percentage points in five corporate programs and by 6 to 28 percentage points in several school programs (Nichols, 2002). Costs: Program costs will depend on the size of the target audience and the components of the program. Time to implement: Employer and school policies can be implemented immediately. Complete programs will require at least four months to plan and implement. School programs may require a full year. Other issues:
• Employer and school programs in high-belt-use settings: As noted above, there is little information on employer and school programs in a setting with a belt use law and high-baseline belt use. No evaluations appear to have been conducted since 1994.
2 - 21
4.2 Incentive Programs Effectiveness: Proven* Use: Low Cost: Varies Time: Medium * In low-belt-use settings with no belt use law Incentive programs use rewards of some sort as an inducement to wear safety belts. Incentive programs have been implemented by employers, in schools, and across entire communities. Rewards have included cash, coupons for merchandise or food, T-shirts or other promotional items, and raffle tickets for valuable prizes. Rewards typically have been given to people observed to be wearing their belts but sometimes have been given for a pledge to buckle up. Incentive programs usually are accompanied by safety belt communications and outreach and may also be combined with safety belt use policies (Nichols, 2002). Hagenzieker et al. (1997) summarized 34 incentive program evaluations published between 1978 and 1992. Almost all (95%) programs were conducted in the United States. Almost all (83%) were conducted when no belt use law was in effect, so that pre-program belt use was low. No incentive program evaluations appear to have been conducted since 1992 (Hagenzieker et al., 1997; Nichols, 2002). Use: Incentive programs were popular before belt use laws were implemented but most appear to have been discontinued. There is no data on the number of incentive programs operating currently. Effectiveness: In the situations studied – low-baseline belt use and no belt use law in effect -- incentive programs raised belt use immediately by 12 percentage points on average. As with enforcement programs, belt use subsequently decreased somewhat, so that the average long-term belt use increase was 9 percentage points (Hagenzieker et al., 1997; Nichols, 2002). In general, the effects were greater when baseline belt use was lower and when the target population was more confined: elementary school programs had the greatest impact, followed by employers, colleges, and finally entire communities. Costs: Incentive program costs will depend on the size of the target audience, the nature of the incentives, and the nature and amount of publicity required. Sponsors can be sought to donate incentive rewards or otherwise offset program costs. Time to implement: An incentive program should take four to six months to plan and implement. Other issues:
• Incentive programs in high-belt-use settings: As noted above, there is little or no information on incentive programs in a setting with a belt use law and high-baseline belt use. No incentive program evaluations appear to have been conducted since 1992.

2 - 22
Safety Belt Use References ACTS (2001). 2001 Seat Belt Summit: Policy Options for Increasing Seat Belt Use in the United States. Arlington, VA: Automotive Coalition for Traffic Safety. www.actsinc.org/Acrobat/SeatbeltSummit2000.pdf Boase, P., Jonah, B.A., and Dawson, N. (2004). Occupant Restraint Use in Canada. Journal of Safety Research, 35, pp. 223-229. www.sciencedirect.com/ Boyle, J.M., and Vanderwolf, P. (2003). 2003 Motor Vehicle Occupant Safety Survey, Vol. 2, Safety Belt Report. DOT HS 809 789. Washington DC: National Highway Traffic Safety Administration. Chaudhary, N.K., Alonge, M., and Preusser, D.F. (under review). Evaluation of the Reading, Pennsylvania, Nighttime Safety Belt Enforcement Campaign. Washington, DC: National Highway Traffic Safety Administration. Dinh-Zarr, T.B., Sleet, D.A., Shults, R.A., et al. (2001). Reviews of Evidence Regarding Strategies to Increase the Use of Safety Belts. American Journal of Preventive Medicine, 21(4S), pp. 48-65. www.thecommunityguide.org/mvoi/mvoi-AJPM-evrev-seat-belts.pdf Eby, D.W., Kostyniuk, L.P., Molnar, L.J. et al. (2004). The effect of changing from secondary to primary safety belt enforcement on police harassment. Accident Analysis and Prevention 36, pp. 819-828. www.sciencedirect.com/ Glassbrenner, D. (2003). Safety Belt Use in 2003. DOT HS 809 646. Washington, DC: National Highway Traffic Safety Administration. www.nhtsa.dot.gov/people/injury/airbags/809646.pdf Glassbrenner, D. (2004a). Safety Belt Use in 2003: Demographic Characteristics. DOT HS 809 729. Washington, DC: National Highway Traffic Safety Administration. www.nhtsa.dot.gov/people/injury/airbags/809729.pdf Glassbrenner, D. (2004b). Safety Belt Use in 2004: Overall Results. Traffic Safety Facts: Research Note. DOT HS 809 783. Washington, DC: National Highway Traffic Safety Administration. www.nhtsa.dot.gov/people/injury/Traffic-Safety-Facts/Research-Notes/SeatBelt-Use-2004/image`s/RN%20Final.pdf Glassbrenner, D. (2004c). Safety Belt Use in 2004: Use Rates in the States and Territories. DOT HS 809 813. Washington DC: National Highway Traffic Safety Administration. www.nhtsa.dot.gov/people/injury/SafetyBelt/SafetyBeltUse_2004/ Hagenzieker, M.P., Bijleveld, F.D., and Davidse, R.J. (1997). Effects of Incentive Programs to Stimulate Safety Belt Use: A Meta-Analysis. Accident Analysis and Prevention 29, pp. 759-777. www.sciencedirect.com/
2 - 23
Hedlund, J.H., Preusser, D.F., and Shults, R.A. (2004). A Research Agenda for Increasing Safety Belt Use in the United States. Journal of Safety Research, 35, 231-235. www.sciencedirect.com/ Jones, R.K., Joksch, H.C., Lacey, J.H., et al. (1995). Summary Report: Field Test of Combined Speed, Alcohol, and Safety Belt Strategies. DOT HS 808 242. Washington, DC: National Highway Traffic Safety Administration. www.nhtsa.dot.gov/people/injury/traffic_tech/1995/TT096.htm Jones, R.K., Lacey, J.H. (2001). Alcohol and Highway Safety 2001: A Review of the State of Knowledge. DOT HS 809 383. Washington, DC: National Highway Traffic Safety Administration. www.nhtsa.dot.gov/people/injury/research/AlcoholHighway/ Lacey, J., Fell, J.C., Cosgrove, L., et al. (2005). Tennessee’s Combined Safety Belt and Impaired Driving Campaign in 2003 Yields Mixed Results. Research Note. Washington, DC: National Highway Traffic Safety Administration (under review). Milano, M., McInturff, B., and Nichols, J.L. (2004). The Effect of Earned and Paid Media Strategies in High-Visibility Enforcement Campaigns. Journal of Safety Research, 35, 203-214. www.sciencedirect.com/ NCHRP Report 500, Vol. 11 (2004). A Guide for Increasing Seatbelt Use. Washington, DC: Transportation Research Board. trb.org/publications/nchrp/nchrp_rpt_500v11.pdf NCUTLO (2004). Model Occupant Protection Law. Alexandria, VA: National Committee on Uniform Traffic Laws and Ordinances. www.ncutlo.org/occprotect02.html NHTSA (2001). Fifth/Sixth Report to Congress: Effectiveness of Occupant Protection Systems and Their Use. DOT HS 809 442. Washington, DC: National Highway Traffic Safety Administration. www-nrd.nhtsa.dot.gov/pdf/nrd-30/NCSA/Rpts/2002/809-442.pdf NHTSA (2003). Initiatives to Address Safety Belt Use. Washington, DC: National Highway Traffic Safety Administration. www.nhtsa.dot.gov/people/injury/SafetyBelt/OPIPT_FinalRpt_07-17-03.html NHTSA (2005a). Personal communication, Office of Impaired Driving and Occupant Protection. Washington, DC: National Highway Traffic Safety Administration. NHTSA (2005b). Data from NHTSA Program Development and Delivery. Washington, DC: National Highway Traffic Safety Administration. Nichols, J.L. (2002). A Review of Research-Based Findings and Recommendations for Programs to Increase Seat Belt Usage. Washington, DC: National Highway Traffic Safety Administration.
2 - 24
Nichols, J.L., and Jones, R.K. (2005). Increasing Safety Belt Usage in the United States: A Review of the State of Knowledge. Washington, DC: National Highway Traffic Safety Administration (in progress). North Dakota DOT (2004). “Pick Up the Habit for Someone You Love” Campaign. Final report, Contract PHSP4030301. Bismarck, ND: North Dakota Department of Transportation. Reinfurt, D.W. (2004). Click It or Ticket in North Carolina: A Decade of Progress. Journal of Safety Research, 35, pp. 181-188. www.sciencedirect.com/ Shults, R.A., Nichols, J.L., Dinh-Zarr, T.B., et al. (2004). Effectiveness of Primary Enforcement Safety Belt Laws and Enhanced Enforcement of Safety Belt Laws: A Summary of the Guide to Community Preventive Services Systematic Reviews. Journal of Safety Research, 35, pp. 189-196. www.sciencedirect.com/ Solomon, M.G. (in review). Buckle Up in Your Truck - Interim Evaluation Summary. Washington, DC: National Highway Traffic Safety Administration. Solomon, M.G., Chaffe, R.H.B. (in review). Evaluation of the May 2004 Mobilization: Programs to Increase Safety Belt Use. Washington, DC: National Highway Traffic Safety Administration. Solomon, M.G., Chaudhary, N.K., and Cosgrove, L.A. (2003). May 2003 Click It or Ticket Safety Belt Mobilization Evaluation Final Report. Washington, DC: National Highway Traffic Safety Administration. www.nhtsa.dot.gov/people/injury/airbags/clickit_ticke03/ciot-report04/CIOT%20May%202003/index.htm Solomon, M.G., Compton, R.P., and Preusser, D.F. (2004). Taking the “Click It or Ticket” model nationwide. Journal of Safety Research, 35, 197-201. www.sciencedirect.com/ Solomon, M.G., Ulmer, R.G., and Preusser, D.F. (2002). Evaluation of Click It or Ticket Model Programs. DOT HS 809 498. Washington, DC: National Highway Traffic Safety Administration. www.nhtsa.dot.gov/people/injury/airbags/clickitcomposite/clickit_composite.pdf Williams, A.F., and Wells, J.K. (2004). The role of enforcement programs in increasing seat belt use. Journal of Safety Research, 35, pp. 175-180. www.sciencedirect.com/

3 - 1
33.. AAggggrreessssiivvee DDrriivviinngg aanndd SSppeeeeddiinngg Overview Aggressive driving is generally understood to mean driving actions that markedly exceed the norms of safe driving behavior and that place the driver or other road users in unnecessary danger (NHTSA, 2000; NCHRP, 2003). Aggressive behaviors may be directed at other drivers or pedestrians through actions such as following too closely or erratic and unsafe lane changes. Or aggressive behaviors may violate the established traffic control system through speeding or running red lights. All aggressive driving violates some traffic laws, but not every moving violation is considered aggressive driving. Aggressive driving should not be confused with road rage: an intentional assault by a driver or passenger, with a motor vehicle or a weapon, on the roadway or precipitated by an incident on the roadway. The legal definition of speeding is exceeding the posted speed limit. In practice, law enforcement officers seldom write citations for speeds less than 5 or sometimes 10 mph over the posted limit (GHSA, 2005). Speeding becomes aggressive driving when a vehicle’s speed is too high for conditions or substantially exceeds the prevailing travel speeds of other vehicles. Problem size. Speeding is common, and on some roads almost universal. About two-thirds of all drivers in NHTSA’s 2002 national survey reported that they exceeded the posted speed limit on each type of road -- interstate, non-interstate multilane, two lane, and city streets -- within the past week, and about one-third reported this behavior on the day of the interview (Royal, 2004, p. 29). One-third of all drivers reported that they often or sometimes drive at least 10 mph faster than most other vehicles (Royal, 2004, p. 31). Yet two-thirds of drivers felt that other speeding drivers pose a major threat to their personal safety (Royal, 2004, p. 43; NHTSA, 2003a). NHTSA estimated that speeding, as determined by the investigating officer, was a contributing factor in 31 percent of fatal crashes in 2003 (NHTSA, 2004a) and 2004 (NHTSA, 2005b, slide 39). In-depth investigations found speeding to be a causal factor in 19 percent of a sample of serious crashes in 1996-1997 (Hendricks et al., 2001a; Hendricks et al., 2001b). Speeding can be dangerous on all roads. In 2003, half of the speed-related traffic fatalities occurred on roads posted at 50 mph or less and one-quarter occurred on roads posted at 35 mph or less (NHTSA, 2005a, Table 118). Aggressive driving actions other than speeding also are common, though they are more difficult to measure accurately. In NHTSA’s survey, 40 percent of drivers reported that they sometimes or often enter an intersection “just as the light turned from yellow to red,” which is a good working definition of red light running. In the same survey, 10 percent reported sometimes or often cutting in front of another driver (Royal, 2004, p. 47; NHTSA, 2003a). About one-third of drivers reported that they feel threatened by other drivers at least several times monthly (Royal, 2004, p. 59). NHTSA estimated that two-thirds of traffic fatalities involve behaviors commonly associated with aggressive driving such as speeding, red-light running, and improper lane changes (NHTSA, 2001a).
3 - 2
Strategies to Reduce Aggressive Driving and Speeding Aggressive driving, speeding, and red-light running all involve traffic law violations. Therefore, deterrence through traffic law enforcement is the basic behavioral strategy that has been used to control them. This strategy involves the same components used to deter alcohol-impaired driving or safety belt nonuse: highly publicized and highly visible enforcement of practical, sound, and broadly accepted laws. In particular, speed limits should be set carefully and rationally, taking into account the road segment’s design speed, traffic operations, and environmental conditions; if not, many drivers will exceed the speed limit. Enforcement can be conducted through regular traffic patrols; short, intense, highly publicized enforcement periods; or automated speed or red-light enforcement. The sections in this chapter discuss the relevant laws and sanctions, enforcement techniques, and publicity needs. General communications and outreach campaigns urging tolerant and nonaggressive driving behavior also have been used in an attempt to reduce aggressive driving and speeding. Environmental and vehicular measures also can be effective. As examples, traffic calming measures can reduce speeds, especially on local roads (TRB, 1998, p. 13). Well-coordinated traffic signals can improve traffic flow and reduce red-light running. Adequately designed turn bays and entrance and exit ramps can reduce improper merging and driving on the shoulder (NCHRP, 2003, Strategy B1). A variety of measures to reduce congestion can diminish driver frustration that leads to aggressive driving (Shinar and Compton, 2004). Company policies, backed up with speed monitors and logs or even speed regulators, can reduce commercial vehicle speeding. These environmental and vehicular strategies are not included in this guide because SHSOs have little or no direct authority or responsibility for them. However, managing traffic operations in general and speeds in particular requires cooperative efforts between State DOTs and SHSOs. SHSOs are encouraged to act cooperatively with State DOTs to identify their aggressive driving and speeding problems and to adopt comprehensive plans and programs to address them. See NCHRP (2003) for examples of cooperative strategies. The same cooperative methods can be useful in addressing local aggressive driving or speeding concerns, for example in a neighborhood or on a road segment or corridor. Working together, State and community traffic engineers, law enforcement, safety officials, community leaders, and concerned citizens can develop comprehensive plans and programs. The Department of Transportation’s 2005 Speed Management Strategic Initiative (U.S. DOT, 2005) contains a comprehensive set of engineering, enforcement, and education strategies to reduce speeding-related fatalities, injuries, and crashes. The Department, together with GHSA and several national organizations, sponsored a National Forum on Speeding in June 2005. The forum’s goals were to identify effective strategies to reduce speeding-related crashes; coordinate Federal, State, local, and private sector speeding-related policies and programs; and identify additional needed data and research. The forum report will be released in 2005.

3 - 3
Countermeasures That Work Countermeasures to reduce aggressive driving and speeding are listed below and discussed individually in this chapter. The table is intended to give a rough estimate of each countermeasure’s effectiveness, use, cost, and time required for implementation. The terms used are described below. Effectiveness, cost, and time to implement can vary substantially from State to State and community to community. Costs for many countermeasures are difficult to measure, so the summary terms are very approximate. See each countermeasure discussion for more information. 1. Laws Countermeasure Effectiveness Use Cost Time 1.1 Speed limits Proven* High Low Short 1.2 Aggressive driving laws Unknown Low Low Short * When enforced and obeyed 2. Enforcement Countermeasure Effectiveness Use Cost Time 2.1 High-visibility enforcement Uncertain Low High Medium 2.2 Automated enforcement Proven Medium High* Medium 2.3 Other enforcement methods Varies Unknown Varies Varies *Can be covered by income from citations 3. Penalties and Adjudication Countermeasure Effectiveness Use Cost Time 3.1 Penalty types and levels Proven High Varies Low 3.2 Diversion and plea agreements Unknown Unknown Varies Varies 4. Communications and Outreach Countermeasure Effectiveness Use Cost Time 4.1 Supporting enforcement Likely Medium Varies Medium Effectiveness: Proven: demonstrated by several high-quality evaluations with consistent results. Likely: balance of evidence from high-quality evaluations. Uncertain: limited and perhaps ambiguous evidence. Unknown: no high-quality evaluation evidence. Varies: different methods of implementing this countermeasure produce different results. Effectiveness is measured by reductions in crashes or injuries unless noted otherwise. See individual countermeasure descriptions for information on effectiveness size and how effectiveness is measured. Use:
3 - 4
High: more than two-thirds of the States, or a substantial majority of communities. Medium: between one-third and two-thirds of States or communities. Low: fewer than one-third of the States or communities. Unknown: data not available. Cost to implement: High: requires extensive new facilities, staff, or equipment, or makes heavy demands on current resources. Medium: requires some additional staff time, equipment, and/or facilities. Low: can be implemented with current staff, perhaps with training; limited costs for equipment or facilities. Time to implement: Long: more than one year. Medium: more than three months but less than one year. Short: three months or less. These estimates do not include the time required to enact legislation or establish policies.

3 - 5
1.1 Speed Limits Effectiveness: Proven* Use: High Cost: Low Time: Short *When enforced and obeyed Speed limits are only one part of the system that attempts to control driving speeds. Without broad public acceptance and active enforcement they have little effect. With public acceptance and enforcement, lower speed limits can reduce travel speeds and casualties. Speed limits are set both by legislation and by administrative action. General speed limits apply to all roads in a class, such as rural interstates or local streets. They are set by State, municipal, or even at times by Federal law based on tradeoffs between safety, travel efficiency, and community concerns, taking into account the design characteristics of each road class. GHSA (2005) and IIHS (2005a) summarize each State’s maximum speed limits and NHTSA (2003b) provides each State’s complete speed limit laws. Speed zones apply to road segments where the general speed limit is thought to be inappropriate. Speed limits in these zones usually are set by administrative action based on the road segment’s free-flowing travel speeds, crash experience, road and land use conditions, and other factors. Speed limits in many speed zones are set near the 85th percentile travel speed: the speed at or below which 85 percent of vehicles travel in good weather, with no congestion (TRB, 1998, p. 2). The effects of maximum speed limits on speeds, crashes, and casualties have been studied extensively over the past 30 years. In 1974 the 55 mph National Maximum Speed Limit (NMSL) was enacted to conserve fuel. Travel decreased, speeds decreased on roads where the speed limit was lowered to 55 mph, and total traffic fatalities decreased by 9,100 from 1973. The slower and more uniform speeds due to the 55 mph limit are judged to have saved between 3,000 and 5,000 lives in 1974 (TRB, 1984, p. 2). As fuel became plentiful again, travel increased and compliance with the 55 mph limit decreased markedly (TRB, 1984, p. 5). In 1987 Congress allowed States to raise speed limits to 65 mph on rural interstate highways. States that raised their limits generally saw increases of about 4 mph in average speeds and 85th percentile speeds and statistically significant increases in traffic fatalities on these roads (TRB, 1998, p. 5). In 1995, Congress repealed the NMSL and returned full authority to set speed limits back to the States. Again, increased speed limits produced modest increases in both average and 85th percentile speeds and increases in traffic fatalities (TRB, 1998, p. 6). Few studies have examined the effects of speed limit changes on lower-speed roads. Those that did found little effect on driving speeds or crash rates when speed limits were raised to near the 85th percentile travel speed or lowered to near the 35th percentile speed, either on rural roads or on urban and suburban arterials. These results illustrate that changing the speed limit by itself may not affect driving speeds (TRB, 1998, p. 6). Use: A speed limit is in effect on all road segments in all States. Effectiveness: Lower maximum speed limits definitely reduce crashes and casualties when the limits are obeyed. The same holds true on any road: if a lower speed limit is obeyed, then crashes and casualties will drop. But lower speed limits by themselves may not reduce travel speeds.

3 - 6
Costs: The immediate costs of changing speed limits are for new signage and for publicizing the new limit. Enforcing the new limit may involve substantial costs. Time to implement: Speed limit changes can be implemented quickly, as soon as signage is in place and the new limits are publicized. Other issues:
• Public acceptance, roadway characteristics, enforcement, and publicity: Speed limit changes cannot by themselves reduce speeding, whether defined either as average travel speed or as the proportion of drivers traveling substantially faster than the average speed. Speed limits can reduce speeding if most drivers believe that the limits are reasonable and if the threat of enforcement is great enough to affect the few drivers who would not comply voluntarily. It is generally very difficult to enforce and obtain general compliance with a lower speed limit on a roadway designed for higher speeds (TRB, 1998, p 12). Thus, speed limits must be considered as part of a system including broad public acceptance, roadway characteristics, active enforcement, and publicity (TRB, 1998, p. 133).
• Rational speed limits: Speed limits on many road segments are frequently not obeyed, and average travel speeds on these segments substantially exceed the speed limit. One strategy that has been proposed to increase overall safety is to increase the speed limit to a generally accepted level on selected road segments and at the same time aggressively publicize and enforce this speed limit. The strategy’s goal is to increase the public’s overall acceptance of speed limits while reducing the number of people driving at speeds considerably higher than the limit. NHTSA began a demonstration of this strategy in 2003. Preliminary data as of December 2004 suggest that the increased speed limits have had little effect on travel speeds. Final demonstration reports, which will include data on speeds, crashes, and casualties, will be available in 2005.

3 - 7
1.2 Aggressive Driving Laws Effectiveness: Unknown Use: Low Cost: Low Time: Short Aggressive driving actions are covered by specific traffic laws such as speeding, improper lane changes, and following too closely or by general laws such as reckless driving. These laws typically carry relatively minor penalties and may be difficult to prosecute (NHTSA, 2001a, Statutory Strategies). Aggressive drivers often can be identified as those who violate these traffic laws repeatedly or whose violations lead to crashes producing serious injury or death. The traffic law strategy to address aggressive driving is to assure that more severe penalties are available for repeat offenders and for violations causing death or serious injuries. NHTSA’s 1999 Symposium on Aggressive Driving and the Law (NHTSA, 2001a, Statutory Strategies) recommended that State laws implement this strategy by providing for:
• enhanced penalties for repeat offenders, including increased driver’s license points, license suspension or revocation, higher fines, and jail or probation; and
• felony charges for violations resulting in serious injury or death. The symposium developed a model aggressive driving statute that defines aggressive driving as three moving violations in a single driving incident. The NCHRP Aggressive Driving Guide also recommends increased sanctions for repeat offenders and serious offenses (NCHRP, 2003, Strategy A3). Use: In general, States provide for increased penalties for repeat offenders and for violations with serious consequences. Ten States have a formal aggressive driving law and two other States have laws relating to assault-type crimes involving motor vehicles (GHSA, 2005; NHTSA, 2003b). Effectiveness: There are no studies of the effects of aggressive driving laws in general or of increased penalties in particular on aggressive driving, traffic law violations, or crashes. See Chapter 3, Section 3.1 for a discussion of the effects of driver improvement actions in general. Costs: The only immediate costs of the recommended law changes are to publicize the new laws. Additional costs may result as drivers are sentenced to more costly sanctions. Time to implement: Law changes can be implemented quickly, as soon as they are publicized. Other issues:
• Public acceptance, enforcement, and publicity: Law changes by themselves cannot reduce aggressive driving. Traffic laws in general and aggressive driving laws in particular are essential to, but only a part of, a system that includes broad public acceptance, active enforcement, and publicity (NHTSA, 2001a, Executive Summary).
3 - 8
2.1 High-Visibility Enforcement Effectiveness: Uncertain Use: Low Cost: High Time: Medium High-visibility enforcement campaigns have been used to deter aggressive driving and speeding. They are based on the same principles as high-visibility safety belt and alcohol-impaired driving enforcement: to convince the public that speeding and aggressive driving actions are likely to be detected and that offenders will be arrested and punished (see Chapter 1, Alcohol-Impaired Driving, Sections 2.1 and 2.2, and Chapter 2, Safety Belt Use, Section 2.1). Speeding and aggressive driving are moving violations. Enforcement cannot use checkpoints but must observe driving behavior on the road. In the high-visibility enforcement model, law enforcement targets selected high-crash or high-violation geographical areas using either expanded regular patrols or designated aggressive driving patrols. Officers focus on drivers who commit common aggressive driving actions such as speeding, following too closely, and running red lights. Enforcement is publicized widely. The strategy is very similar to saturation patrols directed at alcohol-impaired drivers (Chapter 1, Section 2.2). Use: No data is available on the number of jurisdictions operating high-visibility aggressive driving enforcement campaigns, but it is likely that they are not common. NCHRP (2003, Strategy A1) provides a few examples of recent aggressive driving enforcement programs. Effectiveness: The best effectiveness evidence comes from NHTSA demonstrations in three communities. All three demonstrations lasted six months and included extensive publicity but differed in other respects. Milwaukee was the most successful. Red-light running decreased at targeted intersections. Crashes in the city dropped by 12 percent in targeted corridors and by 2 percent in comparison corridors (NHTSA, 2002; McCartt et al., 2001). The Indianapolis demonstration was not a success. Average speeds dropped slightly. Total crashes increased 32 percent over the previous year. Crashes increased more in the demonstration area than in other areas, and the proportion of crashes involving aggressive driving behaviors also increased in the demonstration areas (NHTSA, 2004b; Stuster, 2004). Tucson had mixed results. Average speeds dropped moderately. Total crashes increased 10 percent in the demonstration areas and decreased in comparison areas. However, the proportion of crashes involving aggressive driving behaviors decreased by 8 percent in the demonstration areas (NHTSA, 2004b; Stuster, 2004). Taken together, the demonstrations suggest that high-visibility aggressive driving enforcement campaigns may have promise but success is far from guaranteed. Costs: As with alcohol-impaired driving and safety belt use enforcement campaigns, the main costs are for law enforcement time and for publicity. The Milwaukee demonstration received a $650,000 grant and the other two demonstrations each received a $200,000 grant. Time to implement: High-visibility enforcement campaigns may require four to six months to plan, publicize, and implement.

3 - 9
2.2 Automated Enforcement Effectiveness: Proven Use: Medium Cost: High* Time: Medium *Can be covered by income from citations Automated enforcement is used in some jurisdictions to reduce red-light running and speeding. At intersections with traffic lights, automated cameras take photographs of vehicles entering the intersection on a red light. Citations are sent to the vehicle’s registered owner. FHWA’s Red-Light Running Cameras (FHWA, 2005b) and Red-Light Camera Systems Operational Guidelines (FHWA, 2005a) and the National Campaign to Stop Red-Light Running’s Guide to Red-Light Camera Programs (NCSRLR, 2002) provide information on red-light camera program costs, effectiveness, implementation, and other issues. Maccubbin et al. (2002) provide more detailed information on programs operating in 2001. Speed cameras operate similarly, recording a vehicle’s speed using radar or other instrumentation and taking a photograph of the vehicle. Use: Red-light cameras are used extensively in other industrialized countries and were first employed in the United Sates in 1993 (NCSRLR, 2002). As of July 2004, red-light cameras were used in more than 100 U.S. communities in 17 States and the District of Columbia (IIHS, 2005c). Speed cameras also are used extensively in other countries (WHO, 2004, p. 128) and are authorized and used in a few jurisdictions in the United States (IIHS, 2005b). Effectiveness: Red-light camera effectiveness has been studied fairly extensively. Summary reviews conclude that they increase rear-end crashes, reduce side-impact crashes, and reduce overall injury crashes perhaps by as much as 25 percent (Aeron-Thomas and Hess, 2005; FHWA, 2005b; IIHS, 2002; Maccubbin, 2001; Retting et al., 2003; WHO, 2004, p. 132). Speed cameras also reduce crashes substantially, though no studies have been conducted in the United States (IIHS, 2005e; WHO, 2004, p. 128). A recent review of the impact of both speed and red-light cameras in 24 British jurisdictions over three years found a 33 percent reduction in personal injury crashes at camera sites. At speed camera sites, vehicle speeds decreased by 7 percent and the number of vehicles exceeding the speed limit decreased by 32 percent (Gains et al., 2004). Costs: In 2001, red-light cameras cost about $50,000 to $60,000 to purchase and $25,000 to install. Monthly operating costs were about $5,000 (Maccubbin et al., 2001). Most jurisdictions contract with private vendors to install and maintain the cameras and use a substantial portion of the income from red-light citations to cover program costs. Speed camera costs probably are similar. Time to implement: Once any necessary legislation is enacted, automated enforcement programs probably require four to six months to plan, publicize, and implement. Other issues:
• Laws: Many jurisdictions using automated enforcement are in States with laws authorizing its use. Some States permit automated enforcement without a specific State law. A few States prohibit some forms of automated enforcement (IIHS, 2005b). See NCUTLO (2004) for a model automated enforcement law. The National Campaign to Stop Red-Light Running newsletter, Safety Focus, provides periodic summaries of State automated enforcement legislative activity (www.stopredlightrunning.com).

3 - 10
• Public acceptance: Public surveys typically show strong support for red-light and speed cameras (IIHS, 2005d; Royal, 2004, p. 66). Support appears highest in jurisdictions that have implemented red-light or speed cameras. However, efforts to institute automated enforcement often are opposed by people who believe that speed or red-light cameras intrude on individual privacy or are an inappropriate extension of law enforcement authority. They also may be opposed if they are viewed as revenue generators rather than methods for improving safety.
• Legality: State courts have consistently supported the constitutionality of automated enforcement.

3 - 11
2.3 Other Enforcement Methods Effectiveness: Varies Use: Unknown Cost: Varies Time: Varies All traffic enforcement helps to deter speeding and aggressive driving as well as other traffic offenses. In addition to high-visibility enforcement campaigns (Chapter 3, Section 2.1) and automated enforcement (Section 2.2), two strategies have been recommended to address speeding and aggressive driving: targeting repeat offenders and using new technology (NCHRP, 2003, Strategies A1 and A3; NHTSA, 2001a). Several law enforcement agencies around the country have conducted innovative and effective aggressive driving enforcement programs (NHTSA, 2000). Repeat offenders: Repeat speeding and aggressive driving offenders have not been deterred by their arrest and punishment for their previous offenses. Recommended methods to reach them include:
• Enhanced penalties, including increased driver’s license points, immediate license suspension or revocation, higher fines, and jail or probation. See Chapter 3, Sections 1.2 and 3.1, for more information.
• Improved traffic record systems, to better identify repeat offenders and to allow patrol officers to immediately access a driver’s complete driving record (NHTSA, 2001a). Many jurisdictions are working toward this goal. There are no studies of the effects of improved record systems on repeat offenders. Costs and implementation time will vary.
New technology: Improved technology may help in several ways.
• In-car video equipment in patrol cars allows law enforcement to record aggressive driving actions and can enhance the ability to prosecute and convict offenders (NHTSA, 2001a).
• Laser speed measuring equipment can provide more accurate and reliable evidence of speeding (NHTSA, 2001a).
• Unstaffed speed display devices, also known as speed trailers, can show drivers that they are speeding and may encourage some drivers to slow down. They also provide an automated method to collect location-specific travel speed data.
Many jurisdictions use some of these new technologies. Each has costs for new equipment and training. Each can be implemented quickly as soon as equipment is purchased and training completed. Innovative programs: NHTSA (2000) provided brief descriptions of 12 aggressive driving enforcement programs around the country. See NHTSA’s Aggressive Driving Programs (NHTSA, 2001b) for additional examples.
• The Albuquerque, New Mexico, Safe Streets program used saturation patrols in four high-crash and high-crime areas. On freeways they observed speeding and aggressive driving from a “cherry picker” platform and radioed to patrol officers.
• The Arizona Department of Public Safety’s Operation Chill used both marked and unmarked patrol vehicles backed up with an extensive publicity campaign.
3 - 12
• The Colorado State Patrol ADAPT (Aggressive Drivers Are Public Threats) campaign used unmarked patrol vehicles, motorcycles, airplanes, and motorist calls to *277 to detect aggressive drivers. The campaign was publicized extensively.
• The Maryland State Police used a special ADVANCE (Aggressive Driving Video and Non-Contact Enforcement) vehicle equipped with lasers to determine a vehicle’s range and speed and a computer system to record video images of the vehicle.
• The Massachusetts State Police 3D Program, (Dangerous Drunk and Drugged Driving) used unmarked patrol vehicles as well as unmarked or nontraditional vehicles, equipped with in-car video cameras and radar units, and emergency lights, working in cooperation with two or more marked patrol vehicles.
• The Milwaukee, Wisconsin, Police Department used an "angel patrol" (for those drivers who “drive faster than their guardian angel can fly”), a "flasher patrol" for those drivers who do not use their turn signals when turning or switching lanes, and a "basket patrol" for the drivers who like to weave in and out of traffic. See Chapter 3, Section 2.1 for evaluation data.
• The Ohio State Highway Patrol’s Operation TRIAD (Targeting Reckless, Intimidating, and Aggressive Drivers) used a large, fixed-wing aviation division and local highway patrol officers to target aggressive driving.
• The Oklahoma City Police Department’s RAAID (Reduction of Accidents and Aggressive and Inconsiderate Drivers) used dedicated law enforcement teams to target 10 high-crash areas.
• The Pennsylvania State Police used two programs. Operation Centipede stationed 8 to 10 officers one to two miles apart along a roadway, in both marked and unmarked vehicles. TAG-D (Ticket the AGgressive Driver) used saturation patrols with marked and unmarked law enforcement vehicles, a vehicle that appears disabled, radar, fixed-wing aircraft, and pursuit vehicles.
• The Richardson, Texas, Police Department used a downstream light system to reduce red-light running. A white light on the back of a traffic light was activated when the light turned red. Officers across the intersection or downstream from the traffic light could then tell when the light turned red and wait for the red-light runners to reach them.
• The St. Petersburg, Florida, Police Department’s “Where’s Jockers?” program featured Patrol Officer Mike Jockers, equipped with a radar gun and handheld radio, sitting in unexpected places to observe aggressive driving and call ahead to marked patrol vehicles. Locations included on lawn mowers and bus benches, and in road construction vehicles.
• The greater Washington, DC, area multi-agency Smooth Operator program used coordinated enforcement waves with marked and unmarked patrol vehicles as well as nontraditional vehicles.

3 - 13
3.1 Penalty Types and Levels Effectiveness: Proven Use: High Cost: Varies Time: Low Penalty types and levels for speeding and the various traffic offenses included under aggressive driving are part of each State’s overall driver control system. Penalties typically are low for first offenses that do not produce serious crashes and casualties and include small fines and perhaps a few demerit points assessed against the driver’s license. When violations cause a crash producing serious injury or death, the offense may carry criminal charges and sanctions may be more severe. As discussed in Chapter 3, Section 1.2, NHTSA’s Aggressive Driving Symposium and NCHRP’s Aggressive Driving Guide recommend enhanced penalties for repeat aggressive driving offenders and felony charges for offenses resulting in serious injury or death (NHTSA, 2001a, Statutory Strategies; NCHRP, 2004, Strategy A3). Between these two practices, States use the demerit point system in an attempt to prevent drivers from committing repeated traffic offenses. As drivers accumulate demerit points, States use various actions and penalties such as warning letters, educational brochures, group counseling meetings, individual counseling, administrative hearings, and driver’s license suspension or revocation (Masten and Peck, 2004). Penalty levels and types for speeding and aggressive driving offenses should be considered within the context of a State’s overall driver control and problem driver remediation system. Use: Each State has a system of penalties for traffic offenses. Each system includes more severe penalties for significant individual offenses, such as those producing serious injury or death, and for repeated offenses, often determined through accumulated driver’s license demerit points. Effectiveness: Masten and Peck (2004) reviewed the effectiveness evidence for different driver improvement and driver control actions, including penalty levels and types, from 35 high-quality studies of 106 individual actions and penalties. They found that, taken together, all actions and penalties reduced subsequent crashes by 6 percent and violations by 8 percent. Even simple warning letters have some effect on both violations and crashes. The effect increased as the “obtrusiveness” of the action increased, with license suspension or revocation the most effective by far. The authors noted that the threat of license suspension probably is responsible for the effectiveness of the weaker actions such as warning letters. Educational brochures by themselves had no effect. Finally, administrative penalties imposed by the driver licensing agency were more effective than penalties imposed by the courts. Costs: Costs vary by penalty type. For example, warning letters are very cheap once a record system has been established to identify drivers who should receive letters. Individual counseling and administrative hearings may require substantial staff time. Some costs may be recovered through offender fees. Time to implement: Most changes in penalty levels can be implemented quickly within a State’s overall driver improvement system.

3 - 14
Other issues: • Public acceptance, enforcement, and publicity: Changes in speeding and aggressive
driving penalty types and levels by themselves cannot reduce speeding and aggressive driving. Traffic laws, penalty types, and penalty levels are essential to, but only a part of, a system that includes broad public acceptance, active enforcement, and publicity (NHTSA, 2001a, Executive Summary).
3 - 15
3.2 Diversion and Plea Agreement Restrictions; Traffic Violator School Effectiveness: Unknown Use: Unknown Cost: Varies Time: Varies In many jurisdictions, drivers who accumulate enough demerit points on their driver’s licenses are allowed to attend a Traffic Violator School. In most instances, drivers who complete Traffic Violator School have their traffic offenses dismissed or removed from their driving record (Masten and Peck, 2004). Negotiated plea agreements are a necessary part of an effective and efficient court system. However, plea agreements may allow offenders to have their penalties reduced or eliminated, for example if a driver is allowed to avoid a driver’s license suspension by attending Traffic Violator School. Use: No data is available on the number of jurisdictions in which Traffic Violator School is available or the number of offenders who use Traffic Violator School to reduce their penalties. Similarly, no data is available on the availability and use of other plea agreements for speeding or aggressive driving violations. Effectiveness: Masten and Peck’s review (2004) included high-quality studies of over 30 group meeting programs, including Traffic Violator School. Taken together, these group meeting programs reduced subsequent crashes by 5 percent and violations by 8 percent. Masten and Peck point out that Traffic Violator School programs in California increased, rather than decreased, crashes because they allowed offenders to escape more severe penalties and start again with a clean driving record. Their review was not able to determine whether other Traffic Violator School programs that dismissed an offender’s violation had similar negative effects. Costs: Costs for establishing diversion or Traffic Violator School programs will depend on the nature of the program. Costs include developing and maintaining a tracking system, notifying offenders, and administering the Traffic Violator School. Costs for limiting or eliminating diversion programs, plea agreements, and Traffic Violator School can be determined by comparing the per-offender costs of these programs with the costs of the penalties that would otherwise be applied. Time to implement: Diversion or Traffic Violator School programs will require at least six months to establish and implement. They can be modified within a few months. Other issues:
• Diversion and Plea Agreement Issues in Alcohol-Impaired Driving: Diversion and plea agreements have been discussed and evaluated more extensively for alcohol-impaired driving offenses than for speeding and aggressive driving offenses. See Chapter 1, Section 3.2 for additional discussion.
• Public acceptance, enforcement, and publicity: Changes in the adjudication of speeding and aggressive driving infractions, such as limiting or eliminating diversion and plea agreements, by themselves cannot reduce speeding and aggressive driving. Traffic laws and adjudication are essential to, but only a part of, a system that includes broad

3 - 16
public acceptance, active enforcement, and publicity (NHTSA, 2001a, Executive Summary).
3 - 17
4.1 Communications and Outreach Supporting Enforcement Effectiveness: Likely Use: Medium Cost: Varies Time: Medium Effective, high-visibility communications and outreach are an essential part of successful speed and aggressive driving enforcement programs (NCHRP, 2003; NHTSA, 2000). All the examples discussed in Chapter 3, Sections 2.1, High-Visibility Enforcement, and 2.3, Other Enforcement Methods, used extensive communications campaigns to support their enforcement efforts. Most campaigns to date have not used paid advertising. The success of paid advertising in safety belt use campaigns (Chapter 2, Section 3.1) suggests that it is worth considering for speed and aggressive driving enforcement campaigns. Communications and outreach programs urging drivers to behave courteously or not to speed are unlikely to have any effect unless they are tied to vigorous enforcement (NCHRP, 2003, Strategy A2). Use: All aggressive driving and speed enforcement programs have a communications and outreach component. Effectiveness: No studies have evaluated how different communications and outreach strategies influence the effectiveness of speed and aggressive driving enforcement programs. The evidence from safety belt (Chapter 2, Sections 2.1, 2.2, and 3.1) and alcohol-impaired driving (Chapter 1, Sections 2.1 and 2.2) enforcement programs strongly suggests that good communications and outreach are essential to a successful enforcement program. See also NCHRP (2003, Strategy A2). Costs: Good media campaigns can be expensive. See Chapter 2, Section 3.1. Time to implement: An effective media campaign requires four to six months to plan and implement.
3 - 18
Speed and aggressive driving references Aeron-Thomas, A.S., and Hess, S. Red-light cameras for the prevention of road traffic crashes. The Cochrane Database of Systematic Reviews 2005, Issue 2. www.cochrane.org/cochrane/revabstr/AB003862.htm FHWA (2005a). Red-Light Camera Systems Operational Guidelines. Washington, DC: Federal Highway Administration. safety.fhwa.dot.gov/intersections/rlc_guide/index.htm FHWA (2005b). Red Light Running Cameras. Washington, DC: Federal Highway Administration. safety.fhwa.dot.gov/intersections/redl_cameras.htm Gains, A., Heydecker, B., Shrewsbury, J., and Robertson, S. (2004). The national safety camera programme: Three-year evaluation report. London, England: PA Consulting Group and University College London. www.dft.gov.uk/stellent/groups/dft_rdsafety/documents/downloadable/dft_rdsafety_029194.pdf GHSA (2005). Survey of the States: Speeding. Washington, DC: Governors Highway Safety Association. www.statehighwaysafety.org/html/publications/pdf/surveystates2005/surveystates_speeding.pdf Hendricks, D.L., Fell, J.C., and Freedman, M. (2001a). The Relative Frequency of Unsafe Driving Acts in Serious Traffic Crashes: Summary Technical Report. Washington, DC: National Highway Traffic Safety Administration. www.nhtsa.dot.gov/people/injury/research/UDAshortrpt/UDAsummtechrept.pdf Hendricks, D.L., Freedman, M., Zador, P.L., and Fell, J.C. (2001b). The Relative Frequency of Unsafe Driving Acts in Serious Traffic Crashes. Washington, DC: National Highway Traffic Safety Administration. www.nhtsa.dot.gov/people/injury/research/UDAshortrpt/UDAlongreport.pdf IIHS (2002). Automated Enforcement. IIHS Status Report 37(5). Arlington, VA: Insurance Institute for Highway Safety. www.hwysafety.org/sr/pdfs/sr3705.pdf IIHS (2005a). Maximum Posted Speed Limits for Passenger Vehicles. Arlington, VA: Insurance Institute for Highway Safety. www.hwysafety.org/laws/state_laws/speed_limit_laws.html IIHS (2005b). State Automated Enforcement Laws. Arlington, VA: Insurance Institute for Highway Safety. www.hwysafety.org/laws/state_laws/pdf/automated_enforcement.pdf IIHS (2005c). Red Light Cameras in Action: July 2004. Arlington, VA: Insurance Institute for Highway Safety. www.hwysafety.org/research/topics/rlc_cities.html IIHS (2005d). Q&A: Red Light Running. Arlington, VA: Insurance Institute for Highway Safety. www.hwysafety.org/research/qanda/speed_lawenf.html
3 - 19
IIHS (2005e). Q&A: Speed: Law Enforcement. Arlington, VA: Insurance Institute for Highway Safety. www.hwysafety.org/research/qanda/speed_lawenf.html Maccubbin, R., Staples, B., and Salwin, A. (2001). Automated Enforcement of Traffic Signals: A Literature Review. Washington, DC: Federal Highway Administration. www.itsdocs.fhwa.dot.gov//JPODOCS/REPTS_TE//13603.html Abstract available at: www.benefitcost.its.dot.gov/its/benecost.nsf/0/7BCBD2BEE5EEA1D985256C1A0070B736?OpenDocument&Flag=Country Masten, S.V., and Peck, R.C. (2004). Problem driver remediation: A meta-analysis of the driver improvement literature. Journal of Safety Research 35, 403-425. www.sciencedirect.com McCartt, A.T., Leaf, W.A., Witkowski, T.L., and Solomon, M.G. (2001). Evaluation of the Aggression Suppression Program, Milwaukee, Wisconsin. DOT HS 809 395. Washington DC: National Highway Traffic Safety Administration. www.nhtsa.dot.gov/people/injury/research/Aggressionwisc/contents.htm NCHRP Report 500, Vol. 1 (2003). A Guide for Addressing Aggressive-Driving Collisions. Washington, DC: Transportation Research Board. www.ch2m.com/nchrp/AggDrvr/assets/ADguide.pdf NCSRLR (2002). Stop on Red = Safe on Green: A Guide to Red Light Camera Programs. Washington, DC: National Campaign to Stop Red Light Running. www.stopredlightrunning.com/pdfs/StopOnRedSafeOnGreen.pdf NCUTLO (2004). Automated Traffic Law Enforcement Model Law. Alexandria VA: National Committee on Uniform Traffic Laws and Ordinances. www.ncutlo.org/autoenforce622.htm NHTSA (2000). Aggressive Driving Enforcement: Strategies for Implementing Best Practices. Washington DC: National Highway Traffic Safety Administration. www.nhtsa.dot.gov/people/injury/enforce/aggressdrivers/aggenforce/index.html NHTSA (2001a). National Aggressive Driving Action Guide: A Criminal Justice Approach. DOT HS 809 351. Washington DC: National Highway Traffic Safety Administration. www.nhtsa.dot.gov/people/injury/enforce/DOT%20Aggress%20Action/index.htm#Contents NHTSA (2001b). Aggressive Driving Programs. DOT HS 808 730. Washington DC: National Highway Traffic Safety Administration. www.nhtsa.dot.gov/people/injury/enforce/AggressiveDrivingHTML/Aggressive_index.htm NHTSA (2002). Aggression Suppression Program in Milwaukee Reduces Crashes and Changes Motorist Behavior. Traffic Safety Facts: Traffic Tech No. 268. Washington DC: National Highway Traffic Safety Administration. www.nhtsa.dot.gov/people/injury/traffic_tech/2002/TT268.htm

3 - 20
NHTSA (2003a). National Survey of Speeding and Unsafe Driving Attitudes and Behavior: 2002. Traffic Safety Facts: Traffic Tech No. 289. Washington DC: National Highway Traffic Safety Administration. www.nhtsa.dot.gov/people/injury/traffic_tech/2003/TrafficTech289.html NHTSA (2003b). Summary of State Speed Laws, Seventh Edition, Current as of January 1, 2003. Washington DC: National Highway Traffic Safety Administration; for Fifth edition see www.nhtsa.dot.gov/people/injury/enforce/speedlaws501/introduction.htm NHTSA (2004a). Traffic Safety Facts 2003: Speeding. DOT HS 809 771. Washington DC: National Highway Traffic Safety Administration. www-nrd.nhtsa.dot.gov/pdf/nrd-30/NCSA/TSF2003/809771.pdf NHTSA (2004b). Aggressive driving enforcement in two demonstration communities. Traffic Safety Facts: Traffic Tech No. 292. Washington DC: National Highway Traffic Safety Administration. www.nhtsa.dot.gov/people/injury/traffic_tech/2004/TrafficTech292/index.html NHTSA (2005a). Traffic Safety Facts 2003. DOT HS 809 775. Washington, DC: National Highway Traffic Safety Administration. www-nrd.nhtsa.dot.gov/pdf/nrd-30/NCSA/TSFAnn/TSF2003.pdf NHTSA (2005b). Motor Vehicle Traffic Crash Fatalities and Injuries: 2004 Projections. DOT HS 809 862. Washington, DC: National Highway Traffic Safety Administration. www-nrd.nhtsa.dot.gov/pdf/nrd-30/NCSA/PPT/2004EARelease.pdf Retting, R.A., Ferguson, S.A., and Hakkert, A.S. (2003). Effects of red light cameras on violations and crashes: a review of the international literature. Traffic Injury Prevention 4(1), pp. 17-23. Royal, D. (2004). National Survey of Speeding and Unsafe Driving Attitudes and Behavior: 2002; Vol. II: Findings. DOT HS 809 730. Washington DC: National Highway Traffic Safety Administration. www.nhtsa.dot.gov/people/injury/research/speed_volII_finding/SpeedVolumeIIFindingsFinal.pdf Shinar, D., and Compton, R. (2004). Aggressive driving: an observational study of driver, vehicle, and situational variables. Accident Analysis and Prevention 36, pp. 429-437. Stuster, J. (2004). Aggressive Driving Enforcement: Evaluation of Two Demonstration Programs. DOT HS 809 707. Washington DC: National Highway Traffic Safety Administration. www.nhtsa.dot.gov/people/injury/research/AggDrivingEnf/images/AggresDrvngEnforce-5.0.pdf TRB (1984). 55: A Decade of Experience. Transportation Research Board Special Report 254. Washington DC: National Academy Press. trb.org/news/blurb_detail.asp?id=2721 TRB (1998). Managing Speed: Review of Current Practice for Setting and Enforcing Speed Limits. Transportation Research Board Special Report 254. Washington DC: National Academy Press. gulliver.trb.org/publications/sr/sr254.pdf
3 - 21
U.S.DOT (2005). Speed Management Strategic Initiative. Washington, DC: U.S. Department of Transportation Speed Management Team (Federal Highway Administration, Federal Motor Carrier Safety Administration, and National Highway Traffic Safety Administration). www.nhtsa.dot.gov/people/injury/enforce/DOTSpeedManagementStrategicInitiative.pdf WHO (2004). World Report on Road Traffic Injury Prevention. Geneva, Switzerland: World Health Organization. www.who.int/world-health-day/2004/infomaterials/world_report/en/
4 - 1
44.. DDiissttrraacctteedd aanndd FFaattiigguueedd DDrriivviinngg Overview Distracted and fatigued driving are common, though both are difficult to define, observe, and measure. Both distracted and fatigued driving result in large part from lifestyle patterns and choices: they are societal issues rather than just driving and transportation system issues. For these reasons, few behavioral highway safety countermeasures have been shown to reduce distracted or fatigued driving. Rumble strips and other environmental measures have proven quite successful in reducing crashes by distracted or fatigued drivers. A variety of vehicular measures may either increase or reduce distractions and fatigue. Recent distracted driving attention and research has concentrated on cell phones, but other distractions are more common and appear to contribute more to crashes. Attention and research on fatigue has concentrated on commercial truck drivers, but the problem is far more widespread. Problem size and characteristics: distracted driving. Distractions take a driver’s attention away from driving. A distraction can be produced by something a driver sees or hears, some physical task not directly involved in driving (such as eating or operating the car radio), or mental activities (such as conversations with passengers or on a cell phone) (NHCRP, 2005, Section III). NHTSA surveyed 4,010 drivers in spring 2002 and asked about a variety of potentially distracting behaviors (Royal, 2003, p. 1). The vast majority reported these behaviors on some trips, often on many or most trips. The most common were:
• 81 percent talked to other passengers on some trips; • 66 percent changed radio stations or looked for CDs or tapes; • 49 percent ate or drank; • 26 percent took incoming calls on a cell phone and 25 percent made outgoing calls; • 24 percent dealt with children in the back seat; • 12 percent read a map or directions.
About one-quarter of the drivers reported that they had been involved in a crash in the previous five years in which some vehicle was damaged. About 14 percent attributed their crash to distracted driving (Royal, 2003, p. 28). Similarly, about 10 percent of the drivers in a sample of crashes involving at least one towed vehicle in 1995-1999 were classified by NHTSA investigators as having been distracted (Stutts et al., 2001, p. 3). The true role of distraction in crashes probably is higher because pre-crash distractions often leave no evidence for law enforcement officers or crash investigators to observe. A recent study that monitored 100 drivers for a year, using specialized instrumentation, reported that nearly 80 percent of the 72 recorded crashes and 65 percent of the 761 near-crashes involved driver inattention just prior to the incident (VTTI, 2005). In crashes where distractions were reported, the most common distractions were similar in NHTSA’s driver survey and crash investigations.
4 - 2
• 37 percent in survey, 29 percent in crashes: something outside the car - street sign, another driver;
• 19 percent in survey, 11 percent in crashes: other passengers, including children; • 16 percent in survey, 21 percent in crashes: object or controls inside the car; • 2 percent in survey, 2 percent in crashes: dialing or using a cell phone.
None of the leading distractions is easily addressed. Cell phone use falls well down this list. Problem size and characteristics: fatigued or drowsy driving. Three recent national telephone surveys, two in the United States and one in Canada, provide consistent estimates of the prevalence and key characteristics of drowsy driving. Of the 1,456 adult drivers surveyed by the National Sleep Foundation (NSF) in fall 2004, 60 percent reported that they had driven while feeling drowsy at least once within the past year. Further, 37 percent said they had “nodded off or fallen asleep” while driving a vehicle at least once in their life (NSF, 2005b, p. 42). Canadian responses from 1,209 drivers were similar: 57 percent had driven while tired and 20 percent had dozed off (Beirness et al, 2005). In NHTSA’s survey, 11 percent reported that they had nodded off while driving during the past year (Royal, 2003, p. 42). Of those who nodded off, 66 percent said they had six or fewer hours of sleep the previous night (Royal, 2004, p. 46). The NHTSA and Canadian surveys found that drivers under age 30 and male drivers were more likely than older drivers and female drivers to have dozed off at the wheel, as did a previous NSF survey (Beirness et al., 2005, p. iii; NSF, 2002a, p. 25; Royal, 2003, p. 42) (the 2005 NSF survey did not examine driver age and gender). The NHTSA and Canadian surveys provide additional useful information about drowsy driving. Drivers nodded off throughout the day and night. In each survey, over one-quarter of the most recent incidents occurred in the afternoon (noon to 6 p.m.) and over one-quarter between midnight and 6 a.m. In both surveys, nearly half of the drivers who nodded off had been driving for an hour or less (Royal, 2003, p. 44; Beirness et al, 2005, p. 12). About 0.7 percent of all drivers reported that they had been in a crash in the past five years that they attributed to their drowsy driving. That’s about one-fifth as many as reported a crash that they attributed to distracted driving (Royal, 2003, p. 50). Strategies to Reduce Distracted and Fatigued Driving The obvious way to reduce distracted or drowsy driving crashes is to convince or require drivers to get enough sleep and to pay attention to their driving. These are very difficult goals. Drowsy driving may result from lifestyles that include insufficient or irregular sleep (shift workers, for instance) or from medical problems – issues beyond a driver’s immediate control. Many drivers consider some distractions, such as eating or drinking, listening to the radio, or talking on a cell phone, to be important and common activities and are unlikely to give them up. Behavioral strategies to reduce distracted or drowsy driving attempt to remove some of the underlying causes and to promote awareness of the risks. The standard behavioral countermeasures of laws, enforcement, and sanctions, which are used successfully for alcohol impairment, safety belt use, aggressive driving, and speeding, are unlikely to be effective for distracted or drowsy drivers. One exception is for young drivers: some graduated driver licensing
4 - 3
provisions help reduce distractions by limiting the number of passengers or restricting cell phone use. Distracted or fatigued driving that is related to a driver’s job may be reduced through employer policies and programs. Drowsy driving caused by medical conditions such as sleep apnea or by drugs or medications may be addressed through policies, communications, and outreach. Similarly, communications and outreach may be useful in raising awareness of specific distraction or fatigue issues among certain high-risk populations. However, none of these strategies has been evaluated. This chapter discusses these behavioral strategies. It does not include the environmental, vehicular, and regulatory countermeasures mentioned below because SHSOs do not have authority or responsibility in these areas. Environmental strategies can address both distracted and drowsy driving. Rumble strips, both on the shoulder and the centerline, have demonstrated their effectiveness in preventing crashes caused by inattention or fatigue. Other roadway improvements, such as wide and visible edge lines, more easily visible road signs, and better lighting at night, can help drivers who are not fully alert. See NCHRP (under review) for a thorough discussion and for references to other NCHRP guides. In the future, ITS (Intelligent Transportation System) technology also may help drivers remain alert or warn them of risky situations (ITS, 2003). Vehicular strategies also affect driver distraction and fatigue. In-car television, vehicle location and route-finding systems, and other new technologies in vehicles may create more potential distractions. On the other hand, in-vehicle technology in the future may be able to detect driver distraction or fatigue, by monitoring driver performance, and then alert drivers. In-vehicle technology also may be able to warn drivers of risky situations. Automobile manufacturers and NHTSA are vigorously investigating many possibilities (NHTSA, 2000; ITS, 2003). Driver fatigue is a critical issue for commercial drivers. The Federal Motor Carrier Safety Administrtion attempts to control commercial driver fatigue through Hours of Service regulations, driver logs and inspections (see for example FMCSA, 2005a). FMCSA has an extensive driver fatigue research program focused on commercial drivers (FMCSA, 2005b). As with the environmental and vehiclular countermeasures mentioned above, commercial driver countermeasures are not discussed in this guide because they do not fall under SHSO jurisdiction.
Key terms • GDL: Graduated Driver Licensing, a three-phase system for beginning drivers consisting
of a learner’s permit, a provisional license, and a full license. A learner’s permit allows driving only while supervised by a fully licensed driver. A provisional license allows unsupervised driving under certain restrictions.
• NCSDR: National Center for Sleep Disorders Research • NSF: National Sleep Foundation.
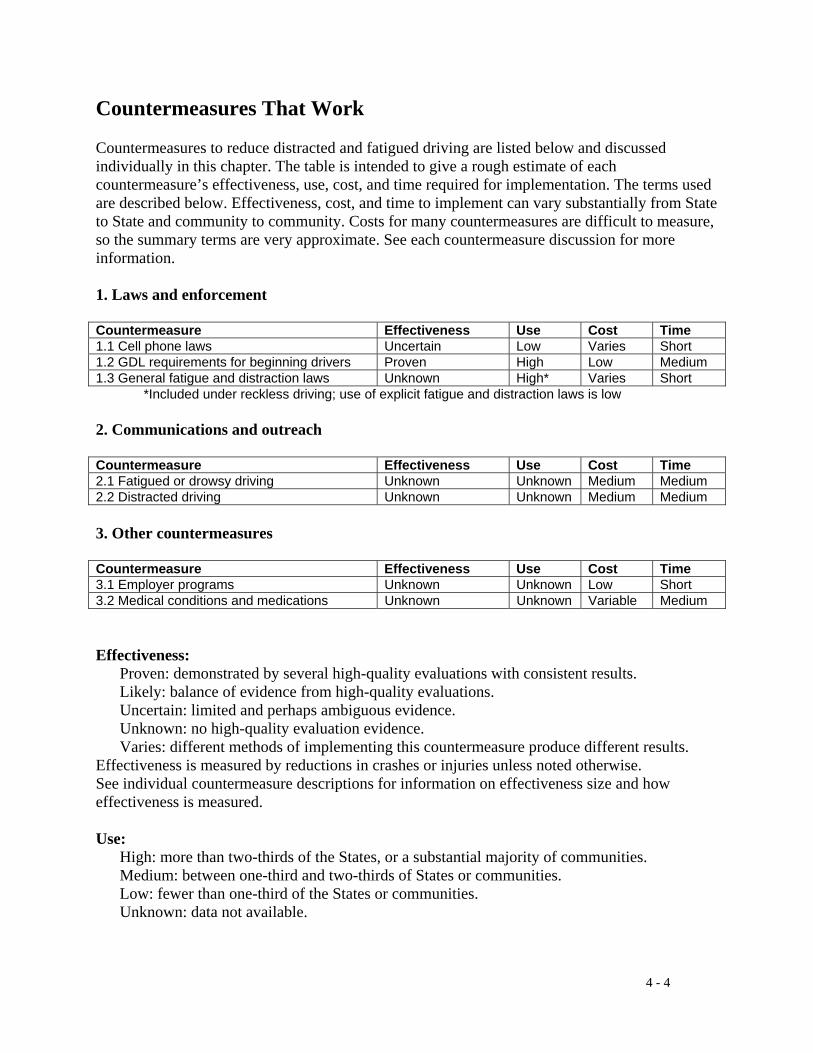
4 - 4
Countermeasures That Work Countermeasures to reduce distracted and fatigued driving are listed below and discussed individually in this chapter. The table is intended to give a rough estimate of each countermeasure’s effectiveness, use, cost, and time required for implementation. The terms used are described below. Effectiveness, cost, and time to implement can vary substantially from State to State and community to community. Costs for many countermeasures are difficult to measure, so the summary terms are very approximate. See each countermeasure discussion for more information. 1. Laws and enforcement Countermeasure Effectiveness Use Cost Time 1.1 Cell phone laws Uncertain Low Varies Short 1.2 GDL requirements for beginning drivers Proven High Low Medium 1.3 General fatigue and distraction laws Unknown High* Varies Short
*Included under reckless driving; use of explicit fatigue and distraction laws is low 2. Communications and outreach Countermeasure Effectiveness Use Cost Time 2.1 Fatigued or drowsy driving Unknown Unknown Medium Medium 2.2 Distracted driving Unknown Unknown Medium Medium 3. Other countermeasures Countermeasure Effectiveness Use Cost Time 3.1 Employer programs Unknown Unknown Low Short 3.2 Medical conditions and medications Unknown Unknown Variable Medium Effectiveness: Proven: demonstrated by several high-quality evaluations with consistent results. Likely: balance of evidence from high-quality evaluations. Uncertain: limited and perhaps ambiguous evidence. Unknown: no high-quality evaluation evidence. Varies: different methods of implementing this countermeasure produce different results. Effectiveness is measured by reductions in crashes or injuries unless noted otherwise. See individual countermeasure descriptions for information on effectiveness size and how effectiveness is measured. Use: High: more than two-thirds of the States, or a substantial majority of communities. Medium: between one-third and two-thirds of States or communities. Low: fewer than one-third of the States or communities. Unknown: data not available.

4 - 5
Cost to implement: High: requires extensive new facilities, staff, equipment, or publicity, or makes heavy
demands on current resources. Medium: requires some additional staff time, equipment, facilities, and/or publicity . Low: can be implemented with current staff, perhaps with training; limited costs for equipment or facilities. Time to implement: Long: more than one year. Medium: more than three months but less than one year. Short: three months or less. These estimates do not include the time required to enact legislation or establish policies.

4 - 6
1.1 Cell phone laws Effectiveness: Uncertain Use: Low Cost: Varies Time: Short Cell phones have become an essential feature of modern life. In June 2004, about 170 million Americans had a cell phone, an increase of more than 20 million from 2003 (CITA, 2004). About two out of every three drivers now have a cell phone, and before long almost all of them will. In NHTSA’s 2002 national telephone survey, 60 percent of drivers reported that they had a cell phone and about one-third of all drivers used a cell phone at some time while driving (Royal, 2003, p. 20). NHTSA’s 2002 national observation survey found that 4 percent of drivers on the road at any time were using handheld cell phones (Glassbrenner, 2003). Several statewide surveys found similar use rates (McCartt and Hellinga, 2005). While more than 100 research studies have investigated various aspects of cell phone use, they do not provide clear answers to critical questions (McCartt and Hellinga, 2005). Experiments on simulators or test tracks document that cell phone use has some effect on driving performance but these experiments cannot measure the impact on crash risk. Most studies find similar effects for handheld and hands-free phones. Most crash studies rely on driver’s own reports or on law enforcement investigations to estimate whether cell phone use contributed to the crash. A recent review of these studies concluded that cell phones are involved in 1 to 4 percent of crashes (an amount consistent with the 2 percent found in NHTSA’s telephone survey and crash investigations discussed in the Overview) and that cell phone use increases crash risk by a modest amount (McCartt and Hellinga, 2005). While cell phone use occurs less frequently than other driver distractions (see Overview), it has been singled out for special attention, probably for several reasons. Cell phone use is a multi-sensory distraction, requiring a driver’s eyes to locate a ringing phone, hands to hold or dial the phone, hearing to listen to the call, and attention to carry on a conversation. Handheld cell phone use is easy to observe and may send the message that drivers using cell phones are more interested in their conversations than they are in driving safely. Several highly publicized crashes have been attributed to cell phones. In response to these concerns, the District of Columbia, New Jersey, New York, and several communities prohibit handheld cell phone use while driving (GHSA, 2005; NCHRP, under review, Strategy C2; Sundeen, 2003). Several States prohibit all cell phone use by drivers under the age of 18 or 21, drivers with a GDL, and school bus drivers. Other States do not allow communities to restrict cell phone use. Legislatures in over two-thirds of the States have considered bills related to cell phone use in each recent year: 37 in 2005 (Copeland, 2005) and 42 in 2003 (Sundeen, 2003). No United States jurisdiction restricts hands-free phone use for all drivers. Many European countries and all Australian States prohibit handheld phone use (McCartt and Hellinga, 2005). Use: The District of Columbia, New Jersey, New York, and about two dozen communities prohibit handheld cell phone use while driving (GHSA, 2005; Sundeen, 2003). Effectiveness: The only evaluation data in the United States comes from two studies of New York’s 2001 law. Observation studies found that handheld phone use by drivers on the road dropped from 2.3 percent pre-law to 1.1 percent a few months after the law and then returned to
4 - 7
pre-law levels during the subsequent year. The authors note that publicity regarding the law diminished substantially after the law was implemented and no targeted enforcement was conducted (McCartt and Geary, 2004). A telephone survey found that the proportion of drivers who reported using a cell phone at least once increased from 38 percent immediately before the law to 45 percent about 18 months after the law. Hands-free use increased only slightly (McCartt and Hellinga, 2005). Costs: As with any law, costs are required to publicize and enforce it. New York’s experience suggests that a strong communications campaign and vigorous enforcement may be necessary to reduce cell phone use over the long term. A handheld cell phone law can be enforced during regular traffic patrol because cell phone use can be observed easily, so that enforcement costs should be minimal. Publicity can be expensive. Paid advertising supporting highly visible law enforcement may be necessary to achieve substantial effects. Paid advertising can be expensive: for example, costs for some belt use enforcement campaigns in 2003 averaged $500,000 per State (Chapter 2, Section 2.1; Solomon et al., 2003). Time to implement: A cell phone law can be implemented quickly, as soon as it is publicized. Other issues:
• Handheld or hands-free: All current cell phone laws applying to all drivers prohibit handheld phones but not hands-free phones. However, current research finds little difference in the distracting effects of handheld and hands-free phones (McCartt and Hellinga, 2005).

4 - 8
1.2 Graduated driver licensing requirements for beginning drivers Effectiveness: Proven Use: High Cost: Low Time: Medium Graduated driver licensing (GDL) is a three-phase system for beginning drivers consisting of a learner’s permit, then a provisional license, and finally a full license. A learner’s permit allows driving only while supervised by a fully licensed driver. A provisional license allows unsupervised driving under certain restrictions. IIHS and TIRF (2004) describe the key provisions of State GDL laws as of August 2004. See Chapter 6, Sections 1.1 to 1.6, for a complete discussion of GDL for beginning young drivers. GDL helps beginning drivers acquire their initial driving experience in lower-risk situations. During the provisional phase, this is accomplished by restricting driving under certain high-risk circumstances. Some of these restrictions are directly linked to fatigue and distractions. Driving at night is more dangerous overall than during the day and also may pose greater risks of drowsy driving. Passengers, especially teenage passengers, are a major source of distraction. Cell phones can distract drivers, as discussed in Chapter 4, Section 1.l. Use: As of August 2004, 47 States and the District of Columbia had some GDL components in place. The laws in 37 States and the District of Columbia do not allow driving during certain nighttime hours. Laws in 26 States limit the number of passengers allowed with a driver with a provisional license. In addition to the three States with cell phone laws applying to all drivers, five States prohibit cell phone use by drivers with a learner’s permit or provisional license or by drivers under 18 (GHSA, 2005). Effectiveness: Several studies document that nighttime and passenger GDL restrictions reduce teenage driver crashes and injuries (Hedlund and Compton, 2005; IIHS, 2004; Lin and Fearn, 2003). There are no evaluations of GDL cell phone prohibitions. Costs: Publicity for GDL restriction changes can be delivered directly by the Department of Motor Vehicles to young drivers as they apply for their learner’s permits and provisional licenses, so costs will be minimal. GDL enforcement to date has been low, so costs also are low. Time to implement: GDL nighttime, passenger, or cell phone restriction changes require several months to implement for drivers receiving a provisional license. They then will take one or two years before all provisionally licensed drivers are subject to the new restrictions.
4 - 9
1.3 General driver fatigue and distraction laws Effectiveness: Unknown Use: High* Cost: Varies Time: Short *included under reckless driving; use of explicit fatigue and distraction laws is low States implicitly prohibit driving while seriously distracted or fatigued through their reckless driving laws (NCHRP, under review, Strategy C2). New Jersey recently enacted a law under which drivers can be prosecuted for vehicular homicide if they have not slept in 24 hours and they cause a crash in which someone is killed (NCHRP, under review, Strategy C2). Massachusetts is considering a bill that would make it illegal to fall asleep while driving (NSF, 2005a). No studies have evaluated whether general reckless driving laws or specific drowsy or distracted driving laws have any effect (except for New York’s cell phone law: see Chapter 4, Section 1.1). Based on extensive experience in other traffic safety areas, it is likely that these laws will have little or no effect unless they are vigorously publicized and enforced. See Chapter 1, Sections 2.1 and 5.5 on alcohol-impaired driving, Chapter 2, Sections 2.1, 3.1, and 3.2, on safety belt use laws, and Chapter 3, Sections 2.1 and 4.1, on aggressive driving and speeding laws. Enforcement of fatigued or distracted driving laws is likely to be especially difficult because fatigue and distraction often are difficult to observe, measure, and document. Nevertheless, these laws may increase the impact of communications and outreach efforts to reduce fatigued and distracted driving discussed in Chapter 4, Sections 2.1 and 2.2 (see also NCHRP, under review, Strategy C2). Use: New Jersey is the only State with a law explicitly addressing fatigued driving or distractions other than cell phones (Chapter 4, Section 1.1). Other States include these conditions under their laws regarding reckless driving or similar offenses. Effectiveness: The effects of any laws on reducing drowsy or distracted driving are unknown. Costs: Costs are required for publicity and enforcement. Enforcement costs likely will be minimal, as most enforcement likely will be included under regular traffic patrols or combined with enforcement activities directed primarily at other offenses such as alcohol-impaired or aggressive driving. Time to implement: A new fatigued or distracted driving law can be implemented quickly, as soon as it is publicized and law enforcement patrol officers are trained.
4 - 10
2.1 Communications and outreach on fatigued driving Effectiveness: Unknown Use: Unknown Cost: Medium Time: Medium Fatigued or drowsy driving occurs because drivers don’t get enough sleep. This apparently obvious statement is well documented. In NHTSA’s telephone survey, 66 percent of the drivers who reported they had nodded off while driving had six or fewer hours of sleep the previous night (Royal, 2004, p. 46). Stutts et al. (1999) interviewed 467 crash-involved drowsy drivers (reported as “fatigued” or “asleep” by the investigating officer) and 529 other crash-involved drivers who were not drowsy. Half of the drowsy drivers had six or fewer hours of sleep the previous night compared to fewer than 10 percent of the other drivers. States and national organizations such as the National Sleep Foundation have conducted drowsy driving communications and outreach campaigns directed to the general public (NCHRP, under review, Strategy C1; NSF, 2004a). Campaign goals usually include:
• raising awareness of the dangers of drowsy driving; • motivating drivers to take action to reduce drowsy driving; and • providing information on what drivers can do, either before they start out on a trip or if
they become drowsy while driving. NHTSA and NCSDR (NHTSA, 1997, p. viii) identified three groups that are over-involved in drowsy driving crashes: drivers in their teens and 20s, shift workers, and people suffering from sleep apnea or narcolepsy. The joint NHTSA-NCSDR Report to Congress on drowsy driving recommended that communications and outreach on drowsy driving be directed to these groups, especially to young drivers (NHTSA, 1999). This information can be delivered in several ways. Driver education programs can include information on both drowsy and distracted driving, and the new model curriculum developed by NHTSA and the American Driver and Traffic Safety Education Association (ADTSEA) includes both. See Chapter 4, Sections 3.1 and 3.2, for additional discussion of shift workers and medical conditions, respectively. Communications and outreach campaigns can be delivered in high schools, colleges, military training programs and bases, and other locations where there are many young drivers. NCHRP (under review, Strategy D2) provides examples. Many young drivers have part-time jobs, which place them at even higher risk for drowsy driving. See Chapter 4, Section 3.1, for discussion. Finally, information can be delivered through Web sites and other media with a youthful target audience. The ultimate goal of drowsy driving communications and outreach is to change driver behavior, but they face substantial obstacles. As discussed in other chapters, communications and outreach by themselves rarely change driving behavior (Chapter 1, Section 5.5; Chapter 2, Section 3.2; Chapter 3, Section 4.1; see also NCHRP, under review, Strategy C1). To have any chance of success, stand-alone campaigns must have careful planning, good target audience identification and research, good message development and placement, and substantial funding. An additional barrier is that drowsy driving is a byproduct of busy lifestyles that do not include enough sleep. The only truly effective method to prevent drowsy driving crashes is to get enough sleep (Nguen et al., 1998; NHTSA, 1997). Traffic safety messages urging enough sleep may be

4 - 11
overwhelmed by the other demands on a driver’s time that are responsible for insufficient sleep. Focus group discussions with young men and shift workers, two groups at high risk of drowsy driving, confirmed this conclusion (Nelson et al., 2001). Most shift workers and many young men understood well the risks caused by lack of sleep. Many had crashed or almost crashed after falling asleep at the wheel or had friends who had crashed. But neither their knowledge nor their crash experience changed their sleep habits. They sacrificed sleep for the demands of their work, families, and social lives. Campaigns directed to young drivers also must overcome the higher risk-taking behavior and overall immaturity of young drivers discussed in Chapter 6. No drowsy driving communications and outreach program has been evaluated (NCHRP, under review, Strategies C1 and D2). Use: Utah is the only State known to have conducted a drowsy driving campaign for the general public (see NCHRP, under review, Strategy C1). NCHRP (under review, Strategy D2) gives examples of college programs. Effectiveness: There are no studies of any campaign’s effects on driver knowledge, attitudes, or behavior (NCHRP, under review, Strategies C1 and D2). Costs: A high-quality campaign will be expensive to develop, test, and implement. Time to implement: A high-quality campaign will require at least six months to plan, produce, and distribute.
4 - 12
2.2 Communications and outreach on distracted driving Effectiveness: Unknown Use: Unknown Cost: Medium Time: Medium Distracted driving communications and outreach campaigns for the general public face different, but equally difficult, obstacles than drowsy driving campaigns. All drivers “know” at some level that they should be alert. However, as discussed in the Overview, distractions come in many forms. Distractions outside the car are not under the driver’s control. Many distractions inside the car also cannot be controlled easily (conversations, children), or are intentional (listening to the radio or CD player, eating). They may in fact be useful, to keep drivers alert on a long trip. States (including California and New York) and national organizations (AAA Foundation for Traffic Safety) have conducted or provided material for distracted driving communications and outreach campaigns directed to the general public (AAAFTS, 2004; NCHRP, under review, Strategy C1). Some carry a general “pay attention” message while others are directed at specific behaviors such as cell phone use. Drivers in their teens and early 20s are often distracted while driving (Ferguson, 2003; NCHRP, under review, Strategy D2). GDL passenger and cell phone restrictions directly address two sources of distractions, as discussed in Chapter 4, Section 1.2. Broader communications and outreach efforts for young drivers regarding distracted driving also have been proposed. They can be combined with or complementary to information on drowsy driving and can be delivered in the same ways. See Chapter 4, Section 2.1, and NCHRP (under review, Strategy D2) for discussion. The ultimate goal of these campaigns is to change driver behavior, but they face substantial obstacles. As discussed in other chapters, communications and outreach by themselves rarely change driving behavior (Chapter 1, Section 5.5; Chapter 2, Section 3.2; Chapter 3, Section 4.1; see also NCHRP, under review, Strategy C1). To have any chance, stand-alone campaigns must have careful planning, good target audience identification and research, good message development and placement, and substantial funding. A broad “stay alert” message may be too general to have any impact. Specific distractions are not linked as clearly to crashes as is falling asleep at the wheel because they are not recorded consistently in State crash data files. Use: California and New York are known to have conducted driver alertness campaigns for the general public (see NCHRP, under review, Strategy C1). NCHRP (under review, Strategy D2) cites a Cingular Wireless educational program aimed at young drivers on the problem of distractions. Effectiveness: There are no studies of any campaign’s effects on driver knowledge, attitudes, or behavior (NCHRP, under review, Strategies C1 and D2). Costs: A high-quality campaign will be expensive to develop, test and implement. Time to implement: A high-quality campaign will require at least six months to plan, produce and distribute.

4 - 13
3.1 Employer programs Effectiveness: Unknown Use: Unknown Cost: Low Time: Short Driver fatigue and distractions are critical issues for commercial drivers. As discussed in the Overview, commercial driver countermeasures, including employer policies and programs to reduce commercial driver fatigue, are not discussed in this guide because they do not fall under SHSO jurisdiction. Shift workers are another employment group at high risk for drowsy driving crashes. Young male drivers with part-time jobs are at especially high risk, as they satisfy two of the three high-risk conditions identified by NHTSA and NCSDR (NHTSA, 1999, p. iii): shift workers; young drivers, especially males; and drivers with the medical conditions of sleep apnea or narcolepsy. “Shift workers” include people who work long or irregular hours or who work at night, including many law enforcement officers (NCHRP, under review, Strategy D6). A recent study documents the dangers for medical interns, who frequently work extended shifts of 24 hours or more. Barger et al. (2005) collected monthly reports from 2,737 interns. Interns were 2.3 times more likely to report a crash and 5.9 times more likely to report a near miss after an extended shift than a shorter shift. Each extended shift in a month increased the monthly risk of a crash during the commute from work by 16 percent. NHTSA and NCSDR have produced a comprehensive workplace education program for shift workers. It includes information on sleep habits in general and drowsy driving in particular. Program material includes a video, posters, brochures for workers and their families, tip cards, a PowerPoint training session, and an administrator’s guide (NHTSA and NCSDR, undated). Focus-group discussions with shift workers highlight the difficulties faced by employer programs (Nelson et al., 2001). Most shift workers understood well the risks caused by lack of sleep. Many had crashed or almost crashed after falling asleep at the wheel or had friends who had crashed. But neither their knowledge nor their crash experience changed their sleep habits. They sacrificed sleep for the demands of their work, families and social lives. Use: The number of employers who use the NHTSA/NCSDR program, or any drowsy driving prevention material or program, is not known. Effectiveness: The NHTSA/NCSDR program was tested by more than 20 U.S. companies and was well received by workers and management. It has not been evaluated further (NCHRP, under review, Strategy D3). No other employer drowsy driving program has been evaluated. Costs: Since a comprehensive program is available at no cost, program costs will consist only of material production and employer time for training. Time to implement: An employer program can be implemented within three months.
4 - 14
3.2 Medical conditions and medications Effectiveness: Unknown Use: Unknown Cost: Variable Time: Medium Two medical conditions can cause drivers to fall asleep at the wheel (NCHRP, under review, Strategy D6; NHTSA, 1997).
• Sleep apnea is a breathing disorder characterized by brief interruptions of breathing during sleep, perhaps as many as 20 to 60 per hour (NSF, 2002b). By fragmenting nighttime sleep, sleep apnea produces daytime sleepiness. NSF estimates that about 4 percent of men and 2 percent of women are affected by sleep apnea. It can be treated by physical or mechanical therapy or by surgery.
• Narcolepsy is a disorder of the central nervous system’s sleep-wake mechanism that can cause narcoleptics to fall asleep suddenly at any time (NSF, 2004b). It is quite rare, affecting about one person in 2,000. It can be treated with medications.
The number of crashes resulting from sleep apnea or narcolepsy is not known. Most cases of sleep apnea or narcolepsy are undiagnosed and untreated (NCHRP, under review, Strategy D6; NHTSA, 1997). Indeed, falling asleep at the wheel may be one of the main ways to raise the possibility of a sleep disorder and motivate a driver to seek medical attention (NHTSA, 1997). Even without treatment, drivers who are aware that they have one of these disorders can take precautions to avoid falling asleep at the wheel. Many common prescription and over-the-counter medications can cause drowsiness. Warning labels on the medications note this and caution users against driving or other activities that could be affected by drowsiness. As with sleep apnea and narcolepsy, the number of crashes resulting from or affected by drowsiness produced by medications is unknown. The principal countermeasures to address sleep apnea, narcolepsy, and medication effects are (NCHRP, under review, Strategy D6):
1. Communications and outreach on sleep disorders to increase overall awareness of their symptoms, consequences, and treatment.
2. Efforts with driver licensing medical advisory boards to increase their awareness of these conditions as they review driver fitness for licensing.
3. Efforts with physicians to increase their awareness of these conditions and their potential effects on driving, to treat these conditions as appropriate, and to counsel their patients to take steps to reduce the risk of drowsy driving.
Use and Effectiveness: There is no information available on how frequently these countermeasures are used or on how effective they have been in raising awareness, increasing knowledge, or affecting behavior (NCHRP, under review, Strategy D6). Costs: Targeted communications and outreach to drivers (through driver licensing handbooks or flyers in license renewal material) or to physicians (through medical associations) would be relatively inexpensive. A communications and outreach campaign directed at all drivers will be expensive to develop, test and implement. See Chapter 1, Section 5.5 and Chapter 2, Sections 2.1 and 3.1, for additional discussion.

4 - 15
Time to implement: Either targeted or general communications and outreach activities will require at least six months to plan, produce, and distribute. Efforts with driver licensing medical advisory boards could be implemented quickly.
4 - 16
Distracted and Fatigued Driving References AAAFTS (2004). Pay Attention! Washington, DC: AAA Foundation for Traffic Safety. www.aaafoundation.org/products/index.cfm?button=item-detail&ID=962&storeid=1 Barger, L.K., Cade, B.E., Ayas, N.T., Cronin, J.W., Rosner, B., Speizer, F.E., and Czeisler, C.A. (2005). Extended work shifts and the risk of motor vehicle crashes among interns. New England Journal of Medicine 352, pp. 125-134. www.nejm.org Beirness, D.J., Simpson, H.M., and Desmond, K. (2005). The Road Safety Monitor 2004: Drowsy Driving. Ottawa, ON: Traffic Injury Research Foundation. trafficinjuryresearch.com/whatNew/newsItemPDFs/RSM_Drowsy_Driving_2004.pdf CITA (2004). CITA’s semi-annual wireless industry survey results, June 1985-December 2004. Washington, DC: Cellular Telecommunications and Internet Association. www.wow-com.com/research_statistics/index.cfm/AID/10030 Copeland, L. (2005). States to Drivers: Hang Up, Look Out. USA Today, June 2, 2005, p. A1. www.usatoday.com/news/nation/2005-06-01-distracted-drivers-lede_x.htm Ferguson, S.A. (2003). Other high-risk factors for young drivers - how graduated licensing does, doesn’t, or could address them. Journal of Safety Research 34(1), pp. 71-77. www.nsc.org/gdlsym/index.htm FMCSA (2005a). FMCSA Proposes Rulemaking to Address Trucker’s Hours-of-Service Regulations; Invites Public Comment. Press release FMCSA 01-05. Washington, DC: National Highway Traffic Safety Administration. www.fmcsa.dot.gov/contactus/press/2005/011905.htm FMCSA (2005b). FMCSA Research Publications. Washington, DC: Federal Motor Carrier Safety Administration. www.fmcsa.dot.gov/safetyprogs/research/researchpubs.htm GHSA (2005). Cell Phone Restrictions - State and Local Jurisdictions. Washington, DC: Governors Highway Safety Association. www.statehighwaysafety.org/html/stateinfo/laws/cellphone_laws.html Glassbrenner, D. (2003). Cell phone use on the roads in 2002. DOT HS 809 580. Washington, DC: National Highway Traffic Safety Administration. Hedlund, J.. and Compton, R. (2005). Graduated driver licensing research in 2004 and 2005. Journal of Safety Research 36 (in press). IIHS and TIRF (2004). Graduated Licensing: A Blueprint for North America. Arlington, VA: Insurance Institute for Highway Safety. www.hwysafety.org/research/topics/pdf/blueprint.pdf

4 - 17
ITS (2003). 2003 Intelligent Transportation Systems (ITS) Projects Book, Section Seven: Intelligent Vehicle Initiative. Washington, DC: Federal Highway Administration. www.itsdocs.fhwa.dot.gov//JPODOCS/REPTS_TE/13631/Section7_Introduction.htm Lin, M-L., and Fearn, K.T. (2003). The provisional license: nighttime and passenger restrictions - a literature review. Journal of Safety Research 34, pp. 51-61. www.nsc.org/gdlsym/index.htm Llaneras, R.E. (2000). NHTSA Driver Distraction Internet Forum: Summary and Proceedings. Washington, DC: National Highway Traffic Safety Administration. www-nrd.nhtsa.dot.gov/pdf/nrd-13/FinalInternetForumReport.pdf McCartt, A.T., and Geary, L.L. (2004). Longer term effects of New York State’s law on drivers’ handheld cell phone use. Injury Prevention 10(1), pp. 11-15. McCartt, A.T., and Hellinga, L. (2005). Review of Research on the Effects of Drivers’ Use of Wireless Phones. Arlington, VA: Insurance Institute for Highway Safety. NCHRP Report 500 (under review). A Guide for Addressing Collisions Involving Distracted or Fatigued Drivers. Washington, DC: Transportation Research Board. www.ch2m.com/nchrp/over/default.htm Nelson, T.F., Isaac, N.E., and Graham, J.D. (2001). Development and Testing of Countermeasures for Fatigue Related Highway Crashes. Washington, DC: National Highway Traffic Safety Administration. www.nhtsa.dot.gov/people/injury/drowsy_driving1/listening/title.htm#title NETS (2005). Distracted Driver Tool Kit. www.trafficsafety.org/products.asp Nguen, L.T., Jauregui, B., and Dinges, D.F. (1998). Changing Behaviors to Prevent Drowsy Driving and Promote Traffic Safety: Review of Proven, Promising, and Unproven Techniques. Washington, DC: AAA Foundation for Traffic Safety. www.aaafoundation.org/pdf/drowsydriving.pdf NHTSA (1997). Drowsy Driving and Automobile Crashes. Washington, DC: National Highway Traffic Safety Administration. www.sleepfoundation.org/ddsummit/CrashesNHTSAReport.PDF NHTSA (1999). The NHTSA and NCSDR Program to Combat Drowsy Driving. Washington, DC: National Highway Traffic Safety Administration. www.nhtsa.dot.gov/people/injury/drowsy_driving1/drowsy2/drws-cov.htm NHTSA (2000). NHTSA’s Drowsy Driver Technology Program. Washington, DC: National Highway Traffic Safety Administration. www-nrd.nhtsa.dot.gov/departments/nrd-01/summaries/ITS_11.html
4 - 18
NHTSA and NCSDR (undated). Wake Up and Get Some Sleep Program. Washington, DC: National Highway Traffic Safety Administration. www.nhtsa.dot.gov/people/injury/drowsy_driving1/human/drows_driving/index.html NSF (2002a). 2002 “Sleep in America” Poll. Washington, DC: National Sleep Foundation. www.sleepfoundation.org/_content/hottopics/2002SleepInAmericaPoll.pdf NSF (2002b). Sleep Apnea. Washington, DC: National Sleep Foundation. www.sleepfoundation.org/publications/sleepap.cfm NSF (2004a). Drive Alert - Arrive Alive National Campaign. Washington, DC: National Sleep Foundation. www.sleepfoundation.org/activities/daaamain.cfm NSF (2004b). Living with Narcolepsy. Washington, DC: National Sleep Foundation. www.sleepfoundation.org/publications/livingnarcolepsy.cfm NSF (2005a). NSF Alert, Jan. 25, 2005. Washington, DC: National Sleep Foundation. www.sleepfoundation.org/Alert/050125.cfm NSF (2005b). 2005 “Sleep in America” Poll. Washington, DC: National Sleep Foundation. www.sleepfoundation.org/_content/hottopics/2005_summary_of_findings.pdf Royal, D. (2003). National Survey of Distracted and Drowsy Driving Attitudes and Behavior: 2002 Volume I: Findings. DOT HS 809 566. Washington, DC: National Highway Traffic Safety Administration. www.nhtsa.dot.gov/people/injury/drowsy_driving1/survey-distractive03/index.htm Solomon, M.G., Chaudhary, N.K., and Cosgrove, L.A. (2003). May 2003 Click It or Ticket Safety Belt Mobilization Evaluation Final Report. Washington, DC: National Highway Traffic Safety Administration. www.nhtsa.dot.gov/people/injury/airbags/clickit_ticke03/ciot-report04/CIOT%20May%202003/index.htm Stutts, J.C., Reinfurt, D.W., Staplin, L., and Rodgman, E.A. (2001). The Role of Driver Distraction in Traffic Crashes. Washington, DC: AAA Foundation for Traffic Safety. www.aaafoundation.org/pdf/distraction.pdf Stutts, J.C., Wilkins, J.W., and Vaughn, B.V. (1999). “Why Do People Have Drowsy Driving Crashes? Input from Drivers Who Just Did. Washington, DC: AAA Foundation for Traffic Safety. www.aaafoundation.org/pdf/Sleep.pdf Sundeen, M. (2003). Cell Phones and Highway Safety. 2003 Legislative Update. Denver, CO: National Conference of State Legislatures. www.ncsl.org/programs/transportation/cellphoneupdate1203.htm

4 - 19
VTTI (2005). 100-Car Naturalistic Driving Study Tracks Drivers for a Year. Press release. Blacksburg, VA: Virginia Tech Transportation Institute. www.vtti.vt.edu/documents/100-Car%20Naturalistic%20Driving%20Study%20Press%20Release.pdf
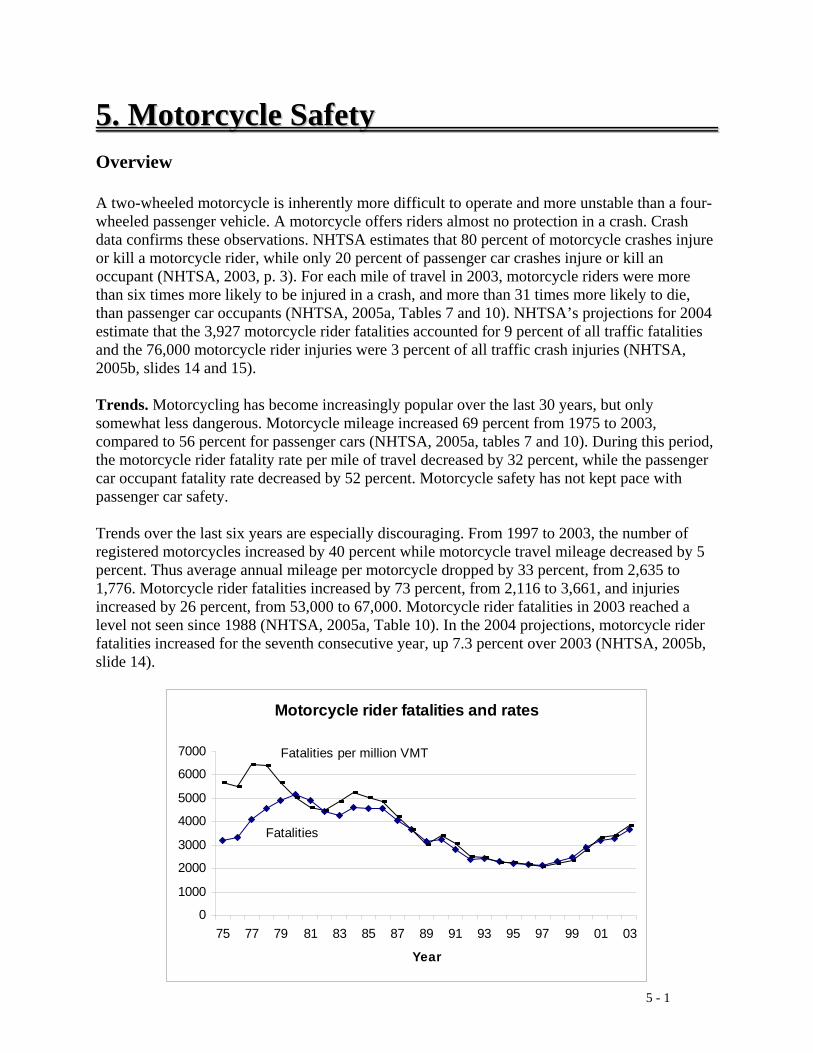
5 - 1
55.. MMoottoorrccyyccllee SSaaffeettyy Overview A two-wheeled motorcycle is inherently more difficult to operate and more unstable than a four-wheeled passenger vehicle. A motorcycle offers riders almost no protection in a crash. Crash data confirms these observations. NHTSA estimates that 80 percent of motorcycle crashes injure or kill a motorcycle rider, while only 20 percent of passenger car crashes injure or kill an occupant (NHTSA, 2003, p. 3). For each mile of travel in 2003, motorcycle riders were more than six times more likely to be injured in a crash, and more than 31 times more likely to die, than passenger car occupants (NHTSA, 2005a, Tables 7 and 10). NHTSA’s projections for 2004 estimate that the 3,927 motorcycle rider fatalities accounted for 9 percent of all traffic fatalities and the 76,000 motorcycle rider injuries were 3 percent of all traffic crash injuries (NHTSA, 2005b, slides 14 and 15). Trends. Motorcycling has become increasingly popular over the last 30 years, but only somewhat less dangerous. Motorcycle mileage increased 69 percent from 1975 to 2003, compared to 56 percent for passenger cars (NHTSA, 2005a, tables 7 and 10). During this period, the motorcycle rider fatality rate per mile of travel decreased by 32 percent, while the passenger car occupant fatality rate decreased by 52 percent. Motorcycle safety has not kept pace with passenger car safety. Trends over the last six years are especially discouraging. From 1997 to 2003, the number of registered motorcycles increased by 40 percent while motorcycle travel mileage decreased by 5 percent. Thus average annual mileage per motorcycle dropped by 33 percent, from 2,635 to 1,776. Motorcycle rider fatalities increased by 73 percent, from 2,116 to 3,661, and injuries increased by 26 percent, from 53,000 to 67,000. Motorcycle rider fatalities in 2003 reached a level not seen since 1988 (NHTSA, 2005a, Table 10). In the 2004 projections, motorcycle rider fatalities increased for the seventh consecutive year, up 7.3 percent over 2003 (NHTSA, 2005b, slide 14).
Motorcycle rider fatalities and rates
0
1000
2000
3000
4000
5000
6000
7000
75 77 79 81 83 85 87 89 91 93 95 97 99 01 03
Year
Fatalities
Fatalities per million VMT
5 - 2
Source: NHTSA Motorcycling today is not just a young person’s activity. In 2003, 58 percent of the motorcycle operators involved in a fatal crash were 35 or older, and 33 percent were 45 or older (NHTSA, 2005a, Table 91). The change in only six years is striking: in 1997, only 46 percent were 35 or older and 22 percent were 45 or older (NHTSA 1998, Table 91). In the preliminary 2004 data, 47 percent of motorcyclist fatalities were aged 40 or older and 22 percent were 50 or older (NHTS, 2005b, slide 30). Strategies to Increase Motorcycle Safety Motorcycle operators should be properly trained and licensed. They should be alert and aware of the risks they face while riding; in particular, they should not be impaired by alcohol. All motorcycle riders should wear a motorcycle helmet that meets FMVSS 218 and clothing that provides both protection and visibility. These and other strategies are discussed in the National Agenda for Motorcycle Safety (NHTSA, 2000a). Unfortunately, many motorcyclists do not take these straightforward precautionary measures. In 2003, one-quarter of the motorcycle operators involved in a fatal crash did not have a valid motorcycle operator’s license (NHTSA, 2005a, Table 91). More than one-third of the motorcycle operators killed in a crash had been drinking (NHTSA, 2005a, Table 80). Almost half of the motorcycle rider fatalities were not wearing a helmet (NHTSA, 2005a, Table 90). The most important objectives for improving motorcycle safety are to increase helmet use, reduce alcohol impairment, and increase proper licensing and training. These all are difficult to accomplish. State helmet use laws are extremely effective in assuring virtually universal helmet use, but they also are politically difficult to enact and retain. Strategies using only communications and outreach to promote helmet use, reduce impaired motorcycling, and increase licensing and training appear to have been no more successful with motorcyclists than with other drivers. A fourth objective is to increase other drivers’ awareness of motorcyclists by increasing the visibility of motorcyclists and by educating other drivers on the importance of sharing the road with motorcycles. Many environmental measures can affect motorcycle safety. Slippery roadway surfaces and markings, surface irregularities, unpaved shoulders, and unforgiving roadway barriers all can be dangerous. These issues are not included in this guide because SHSOs have little or no authority or responsibility for them. See NCHRP (under review) for a thorough discussion. Daytime running lights for motorcycles, in the form of headlights that are always lighted, improve motorcycle conspicuity. Most motorcycles on the road have headlights that turn on automatically when the engines are started (NCHRP, under review, Strategy E2). In addition, 24 States require daytime headlight use for all motorcycles manufactured since 1980 (MSF, 2004). Modulating headlights, which cause the headlight to move from high- to low beam rapidly, also increase visibility but are not legal in many States.
5 - 3
Key terms • Motorcycle operator, motorcyclist: a person operating or driving a motorcycle. • Passenger: a person riding on but not operating a motorcycle. • Motorcycle rider: any person on a motorcycle, both operators and passengers. • National Agenda: the National Agenda for Motorcycle Safety (NHTSA, 2000a). • FMVSS 218: the Federal Motor Vehicle Safety Standard that sets performance
requirements for motorcycle helmets. • AMA: American Motorcyclist Association. • BAC: Blood alcohol concentration in the body, expressed as grams of alcohol per deciliter
of blood, and usually measured with a breath or blood test. • MSF: Motorcycle Safety Foundation. • SMSA: National Association of State Motorcycle Safety Administrators.
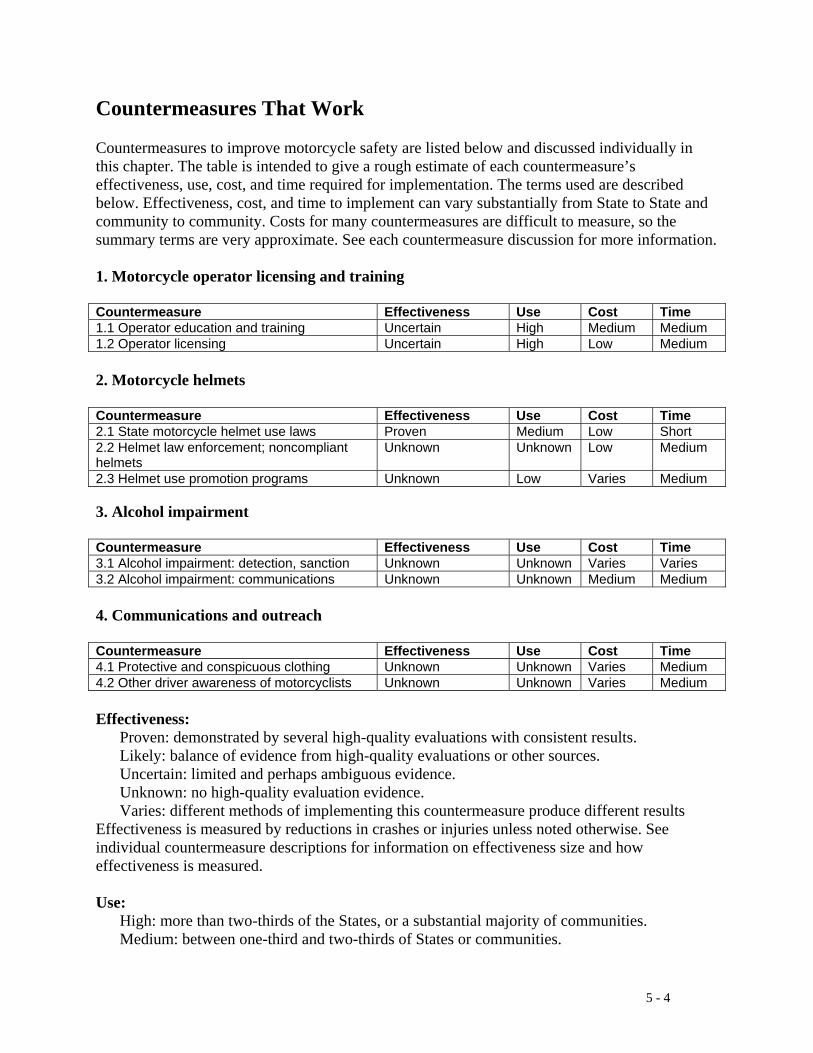
5 - 4
Countermeasures That Work Countermeasures to improve motorcycle safety are listed below and discussed individually in this chapter. The table is intended to give a rough estimate of each countermeasure’s effectiveness, use, cost, and time required for implementation. The terms used are described below. Effectiveness, cost, and time to implement can vary substantially from State to State and community to community. Costs for many countermeasures are difficult to measure, so the summary terms are very approximate. See each countermeasure discussion for more information. 1. Motorcycle operator licensing and training Countermeasure Effectiveness Use Cost Time 1.1 Operator education and training Uncertain High Medium Medium 1.2 Operator licensing Uncertain High Low Medium 2. Motorcycle helmets Countermeasure Effectiveness Use Cost Time 2.1 State motorcycle helmet use laws Proven Medium Low Short 2.2 Helmet law enforcement; noncompliant helmets
Unknown Unknown Low Medium
2.3 Helmet use promotion programs Unknown Low Varies Medium 3. Alcohol impairment Countermeasure Effectiveness Use Cost Time 3.1 Alcohol impairment: detection, sanction Unknown Unknown Varies Varies 3.2 Alcohol impairment: communications Unknown Unknown Medium Medium 4. Communications and outreach Countermeasure Effectiveness Use Cost Time 4.1 Protective and conspicuous clothing Unknown Unknown Varies Medium 4.2 Other driver awareness of motorcyclists Unknown Unknown Varies Medium Effectiveness: Proven: demonstrated by several high-quality evaluations with consistent results. Likely: balance of evidence from high-quality evaluations or other sources. Uncertain: limited and perhaps ambiguous evidence. Unknown: no high-quality evaluation evidence. Varies: different methods of implementing this countermeasure produce different results Effectiveness is measured by reductions in crashes or injuries unless noted otherwise. See individual countermeasure descriptions for information on effectiveness size and how effectiveness is measured. Use: High: more than two-thirds of the States, or a substantial majority of communities. Medium: between one-third and two-thirds of States or communities.
5 - 5
Low: fewer than one-third of the States or communities. Unknown: data not available. Cost to implement: High: requires extensive new facilities, staff, equipment, or publicity, or makes heavy
demands on current resources. Medium: requires some additional staff time, equipment, facilities, and/or publicity. Low: can be implemented with current staff, perhaps with training; limited costs for equipment or facilities. These estimates do not include the costs of enacting legislation or establishing policies. Time to implement: Long: more than one year. Medium: more than three months but less than one year. Short: three months or less. These estimates do not include the time required to enact legislation or establish policies.
5 - 6
1.1 Operator Education and Training Effectiveness: Uncertain Use: High Cost: Medium Time: Medium Motorcycle operator education and training has been thoroughly integrated into all aspects of motorcycle safety. The National Agenda for Motorcycle Safety calls it “the centerpiece of a comprehensive motorcycle safety program” (NHTSA, 2000a, Rider Education and Training). NHTSA’s motorcycle safety program guideline states that “safe motorcycle operation requires specialized training by qualified instructors” and recommends that States conduct education and training (NHTSA, undated). As of 2003, 47 States had State-operated and legislated education and training programs and the other three had privately operated programs (NHTSA, 2003, p. 14). Many States encourage training either by requiring it for all motorcycle operators under a specified age or by waiving some licensing or testing requirements for motorcycle operators who complete an approved training course (Baer et al., 2005, p. 22). Education and training enjoys broad support from the motorcycle industry, motorcycle user organizations, and motorcyclists (NCHRP, under review, Strategy D1). Indeed, the need for good operator education and training may be the only subject on which virtually all organizations involved with motorcycling agree. However, it is not at all clear what constitutes good operator education and training, nor whether current training reduces crashes. As to content, the National Agenda concluded that “it is assumed, yet unknown, that the current [operator education and training] programs are teaching necessary skills to survive in traffic” (NHTSA, 2000a, Rider Education and Training). It recommended that a “uniform, educationally sound” curriculum be adopted. NHTSA (2003, p. 13) reported wide differences in training program content and administration from State to State. Baer et al. (2005, p. 17) summarized the curricula offered in each State. Training effectiveness is equally uncertain. Mayhew and Simpson (2003, pp. 29-36) reviewed all available high-quality studies of motorcycle operator education and training programs. Of six studies in the United States, only one showed any positive results: “[I]t appears that training has an impact on riders, particularly inexperienced riders, for at least six months following training... Beyond this time, riding experience levels the playing field and accident rates of the trained and untrained groups become indistinguishable” (Billheimer, 1996, quoted in Mayhew and Simpson, 2003, p. 32). Mayhew and Simpson point out several methodological issues and questions regarding Billheimer’s results. They also summarized New York’s high-quality evaluation in the early 1980s. It randomly assigned operators to one of four groups: 1) New York’s existing and fairly simple licensing road test; 2) a more thorough test, called MOST II, developed by MSF and AAMVA; 3) MOST II plus 3 hours of training; and 4) MOST II plus 20 hours of training. Training did not affect crash rates. Mayhew and Simpson concluded that the studies to date “have failed to provide definitive conclusions about the effectiveness of rider education and training in reducing crashes.” They also summarized four studies from Canada and one from the United Kingdom that add further support to this conclusion. Training also may not be easily available to many beginning motorcycle operators. The National Agenda (NHTSA, 2000a, Rider Education and Training) estimated that no more than half of those who want training receive it. Both NHTSA (2003, p. 13) and NCHRP (under review, Strategy D1) report that waiting times of 3 to 12 months are not unusual.
5 - 7
NHTSA has reviewed and summarized each State’s motorcycle education and licensing programs and practices (Baer et al., 2005). A second report, Promising Practices in Motorcycle Rider Education and Licensing, was published in September 2005. It describes effective training and licensing programs and actions to promote training and licensing. NHTSA and motorcycle organizations must take the lead in resolving these issues. In the meantime, States should do their best to offer their current motorcycle training on a timely basis to all who wish to take it and to revise their training if another curriculum is demonstrated to be more effective. States also may wish to examine their own motorcycle crash data to see if their training should stress certain situations or skills, as Oregon has done (NCHRP, under review, Strategy D2). Use: 47 States have State-operated motorcycle operator education and training programs and the other three have privately-operated programs. Effectiveness: As discussed above, the effectiveness of current operator training programs in reducing crashes is unknown. Costs: Operator training programs are funded in part by the States and in part by fees paid by the students who take them. State costs per student in 2001 ranged from less than $35 to more than $200 and averaged $106.98 (Baer et al., 2005, p. 14). Student fees ranged from zero to more than $200 and averaged $106.16 (Baer et al., 2005, pp. 14-15). Many States offset some or all of their costs through motorcycle license or registration fees. Time to implement: Operator training currently is conducted in all States. Opening new training sites to increase capacity could take three to six months or more depending upon State regulations. Other issues:
• Training for experienced motorcyclists: MSF and the States offer training courses for experienced motorcyclists (www.msf-usa.org/sitemap.cfm). There are no evaluations of their effectiveness.
• Training for other motorcycle configurations (three-wheeled motorcycles and motorcycles pulling trailers): Courses addressing these special motorcycle configurations are offered by several motorcycle organizations. There are no evaluations of their effectiveness.
5 - 8
1.2 Operator Licensing Effectiveness: Uncertain Use: High Cost: Low Time: Medium All 50 States and the District of Columbia require motorcyclists to obtain a motorcycle operator license or endorsement before they ride on public highways. The goal of licensing is to assure that motorcyclists have the minimum skills needed to operate a motorcycle safely (NHTSA, 2000a, Licensing). Operator licensing faces three issues.
• Many motorcyclists are not properly licensed. In 2003, 25 percent of motorcyclists involved in fatal crashes did not have a valid motorcycle license, compared to 12 percent of drivers of other vehicles who were not properly licensed (NHTSA, 2005a, Tables 65 and 91). Many of these motorcyclists did have a driver’s license but not a separate motorcycle license or endorsement (NHTSA, 2005a, Table 91). Barriers to obtaining a motorcycle license include limited and inconvenient licensing examination hours, which sometimes require appointments weeks or months in advance, and licensing systems in some States that provide no incentive to become fully licensed because learner’s permits may be renewed indefinitely (NCHRP, under review, Strategy D3).
• State motorcycle licensing practices vary substantially. Most States have a learner’s permit requiring only vision and knowledge tests. Motorcyclists with a learner’s permit can ride only in restricted circumstances, typically some combination of no passengers, only during daylight hours, and only with the supervision of a fully licensed motorcyclist. A skills test is required for full licensure. Two-thirds of the States use one of three tests developed by the MSF and AAMVA, while one-third use their own tests. Most States will waive the skills test, and sometimes the knowledge test, for motorcyclists who have completed an approved training course. See Baer et al. (2005) for a summary of each State’s licensing requirements and procedures and NCHRP (under review, Strategy D1) for brief summaries of the major skills tests currently in use.
• The goal of motorcycle operator licensing is to assure that motorcyclists have basic riding skills, but its effectiveness is not known. This is perhaps not surprising given the variability of licensing tests and procedures. The National Agenda recommends research to “ensure that licensing tests measure skills and behaviors required for crash avoidance” (NHTSA, 2000a, Licensing). NCHRP (under review, Strategy D3) notes that there are no evaluations of whether increasing the proportion of motorcyclists who are validly licensed would reduce motorcycle crashes or injuries.
NHTSA has reviewed and summarized each State’s motorcycle education and licensing programs and practices (Baer et al., 2005). A second report, Promising Practices in Motorcycle Rider Education and Licensing, was published in September 2005. It describes effective training and licensing programs and actions to promote training and licensing. Also, in 2005 NHTSA and MSF are scheduled to begin a study of the effectiveness of motorcycle operator education and training in developing crash avoidance skills. As with motorcyclist education and training, NHTSA and motorcycle organizations must take the lead in establishing model motorcycle operator licensing and testing requirements, demonstrating that these requirements measure the essential knowledge and skills needed for
5 - 9
safe riding, and evaluating their effects on motorcycle crashes and injuries. In the meantime, States should do their best to encourage all motorcyclists to be validly licensed. The National Agenda (NHTSA, 2000a, Licensing) and NCHRP (under review, Strategy D3) recommend that States:
• provide enough convenient testing times and locations to accommodate the demand, for example by offering testing during evening hours;
• waive skills and knowledge tests for graduates of approved education and training courses;
• actively enforce motorcycle operator licensing requirements; and • promote motorcyclist licensing.
NCHRP (under review, Strategy D3) describes how Maryland and Minnesota used some of these strategies to increase proper licensing for motorcyclists. Maryland used the additional strategy of comparing their vehicle registration and driver licensing files. A letter was sent to each owner of a registered motorcycle who did not have a motorcycle operator’s license. This quick and inexpensive strategy caused 1,700 owners to become licensed within four months. Use: All States require motorcyclists to obtain a motorcycle license or endorsement to ride on public highways. Effectiveness: The effectiveness of current licensing and testing has not been evaluated. Costs: Most States charge a small fee for the motorcycle licensing tests (MSF, 2002). The costs of changing the licensing tests and procedures depend on the extent of changes and the amount of retraining needed for licensing examiners. Time to implement: New licensing tests and procedures likely would require 6 to 12 months to implement. Other issues:
• Graduated licensing: Most States employ graduated driver licensing for beginning automobile drivers. Under GDL, new drivers must pass through learner’s permit and provisional license stages before becoming fully licensed. A learner’s permit allows driving only while supervised by a fully licensed driver and a provisional license allows unsupervised driving under certain conditions, such as limiting the number of passengers and prohibiting driving at night. Many States place restrictions similar to these on motorcyclists with a learner’s permit or younger than a specified age (MSF, 2002). Mayhew and Simpson (2001) describe motorcyclist GDL programs in California, Maryland, and South Dakota. Baer et al. (2005, p. 24) report that seven States had a some form of graduated licensing in 2001 and five restricted motorcyclists in some age groups to motorcycles of certain sizes. GDL programs for automobile drivers are proven to be effective in reducing crashes (Hedlund, Shults, and Compton, 2003; Hedlund and Compton, 2004, 2005). Evaluations in New Zealand and evidence from Quebec suggest that they may do the same for motorcyclists (Mayhew and Simpson, 2001).
5 - 10
2.1 State Motorcycle Helmet Use Laws Effectiveness: Proven Use: Medium Cost: Low Time: Short Motorcycle helmets are highly effective in protecting motorcycle riders’ heads in a crash. The latest research, using data from 1993-2002, showed that helmets reduce motorcycle rider fatalities by 37 percent (Deuterman, 2004; NCHRP, under review, Strategy F1) and brain injuries by 65 percent (NHTSA, 2003, p. 18; NCHRP, under review, Strategy F1). The Cochrane review, summarizing five well-conducted studies, estimated that helmets reduce head injuries by 72 percent (Liu et al., 2003). Helmets do not increase neck injuries (NCHRP, under review, Strategy F1; NHTSA, 2000a; Ulmer and Preusser, 2003, p. 8). State helmet use laws are highly effective in assuring that almost all motorcycle riders wear helmets. Helmet use is well above 90 percent in States with a universal helmet law that covers all riders and about 34 percent to 54 percent in States with no law or a law covering only young riders (NHTSA, 2003, p. 18). Studies in States that enacted universal helmet laws observed use rates of 90 percent or higher after the law, compared to 50 percent or lower before the law (Ulmer and Preusser, 2003, Section II). States that repealed universal helmet laws saw the opposite effect, as use rates dropped from well above 90 percent to about 50 percent (Preusser et al., 2000, Section V; Ulmer and Preusser, 2003, Sections IV and V). The first universal helmet law was enacted in 1966. Universal laws were in force in 47 States and the District of Columbia by 1975. After Federal penalties were eliminated in 1975 for States failing to have a universal law, about half the States repealed their laws. A few States have enacted or repealed helmet laws since then. Ulmer and Preusser (2003, Section II and Appendix) summarized the helmet law history in each State through 2001. Use: As of July 2005, 20 States and the District of Columbia had a helmet law covering all riders. Most other States had a law covering only riders under a specified age, typically 18 or 21 (IIHS, 2004; NHTSA, 2005c). Effectiveness: The General Accounting Office (GAO, now called the General Accountability Office) reviewed 46 methodologically sound studies of State helmet laws published before 1990. GAO concluded that motorcycle rider fatality rates were 20 to 40 percent lower with universal helmet laws (GAO, 1991, p. 4; Ulmer and Preusser, 2003, Section II). Studies since 1990 confirm these results (Ulmer and Preusser, 2003, Section II). GAO also noted that helmet use was low among young riders in States with laws covering only young riders. Laws covering only young riders are difficult to enforce because it is hard for law enforcement officers to estimate a motorcycle rider’s age. Costs: Once legislation requiring helmet use has been enacted, implementation costs are minimal. The inevitable controversy surrounding the legislation will publicize the new law extensively. Motorcycle helmet laws can be enforced during regular traffic patrol operations because helmet use is easily observed. Time to implement: A universal helmet use law can be implemented as soon as the law is enacted.
5 - 11
Other issues: • Opposition to motorcycle helmet laws: Any effort to enact a universal helmet law can
expect immediate, well-coordinated, and highly political opposition (NHCRP, 2005, Strategy F1; NHTSA 2003, p. 18). Helmet law opponents claim that helmet laws impinge on individual rights. They also claim that helmets interfere with motorcycle riders’ vision or hearing, though research shows that these effects are minimal (NHTSA, 1996).
• Noncompliant helmets: Some riders in States with universal helmet laws wear non-compliant helmets that do not comply with FMVSS 218 in order to avoid a helmet law citation. See the discussion in Chapter 5, Section 2.2.
5 - 12
2.2 Motorcycle Helmet Law Enforcement; Noncompliant Helmets Effectiveness: Unknown Use: Unknown Cost: Low Time: Medium Law enforcement officers in universal helmet law States can easily observe and cite motorcycle riders who are not wearing a helmet. This likely explains why helmet use rates are well above 90 percent in universal helmet law States (Chapter 5, Section 2.1). However, some helmets are non-compliant in that they do not meet the FMVSS 218 performance requirements. State helmet laws require motorcycle riders to wear helmets that comply with FMVSS 218. In the latest national survey, 14 percent of motorcycle riders in 2002 were wearing noncompliant helmets (Glassbrenner, 2002, Table 6). Since 58 percent of riders were wearing compliant helmets, this means that almost one-fifth of the helmets observed on the road in 2002 were noncompliant. Motorcycle riders wearing these helmets are no safer than if they wore no helmets at all (NCHRP, under review, Strategy F1). The challenge of motorcycle helmet law enforcement is to actively identify and cite motorcycle riders wearing noncompliant helmets. In addition to flimsy construction, noncompliant helmets often cover only a portion of the rider’s head and have inadequate chin straps (NCHRP, under review, Strategy F1). These features are fairly easy for an observer to identify. Some noncompliant helmets also have spikes or other protrusions that mark them as noncompliant (Glassbrenner, 2002, p. 19). A recent NHTSA brochure (NHTSA, 2004) discusses how to identify noncompliant helmets. Identifying a noncompliant helmet is easier than proving that it is noncompliant. Compliant helmets are formally identified by a DOT sticker on the back of the helmet. However, counterfeit DOT stickers are easily available and are found on many noncompliant helmets. As a result, it is difficult to obtain a conviction for a noncompliant helmet citation in some courts (NHCRP, under review, Strategy F1). NHTSA is considering ways to strengthen the labeling requirement to make it easier to prove that a helmet is noncompliant (NHTSA, 2003, p. 20). Use: The extent of helmet law enforcement activities to identify and cite noncompliant-helmet wearers is not known. Effectiveness: The effectiveness of an active helmet law enforcement program on noncompliant helmet use has not been evaluated. Costs: Since helmet laws can be enforced during regular traffic patrols, the only costs will be for training law enforcement officers, prosecutors, and judges. Time to implement: An active helmet-law enforcement program requires training for law enforcement to identify noncompliant helmets and training for prosecutors and judges to assure that citations will be prosecuted and adjudicated. This training probably will require four to six months to implement.
5 - 13
2.3 Motorcycle Helmet Use Promotion Programs Effectiveness: Unknown Use: Low Cost: Varies Time: Medium A few States with no motorcycle helmet use law have attempted to promote helmet use through communications and outreach campaigns. NCHRP (under review, Strategy F1) provides brief information about campaigns in Washington and Wisconsin. The AMA, the MSF, and NHTSA all encourage helmet use. Use: Few States without universal helmet laws conduct helmet use promotion campaigns (NHTSA, 2005c). Effectiveness: There appear to be no formal evaluations of the effect of helmet use promotion programs in States without universal helmet laws (NCHRP, under review, Strategy F1). However, there also are no examples of helmet use rates much over 50 percent in States without a universal helmet law. Recent helmet use data is not encouraging. In NHTSA’s national survey, use of legal helmets (complying with FMVSS 218) dropped from 71 percent in 2000 to 58 percent in 2002 (Glassbrenner, 2002, Table 6). In each year, 14 percent of motorcyclists wore noncompliant helmets. The survey does not separate use rates for States with and without universal helmet laws. However, no States enacted or repealed universal helmet laws between the 2000 and 2002 surveys: Florida’s repeal was effective on July 1, 2000, before the 2000 survey was conducted in the fall, and Pennsylvania’s repeal was effective on September 4, 2003 (Glassbrenner, 2002, p. 8). Since helmet use in helmet law States typically is well above 90 percent, it’s likely that helmet use in non-law States dropped from 2000 to 2002. Costs: Good communications and outreach campaigns can be expensive to develop and implement: see Chapter 2, Section 3.1. Helmet use promotion material is available from various sources including MSF, NHTSA (2003), and States that have conducted these campaigns. Time to implement: A good campaign, including market research, materials development, and message placement, will require at least six months to plan and implement.
5 - 14
3.1 Alcohol-Impaired Motorcyclists: Detection and Sanction Effectiveness: Unknown Use: Unknown Cost: Varies Time: Varies Alcohol impairment is a substantial problem for motorcycle operators, more so than for drivers of other motor vehicles. In 2003, 36 percent of motorcycle operators involved in fatal crashes had been drinking, compared to 26 percent for passenger car drivers, 25 percent for light truck drivers, and 2 percent for heavy-truck drivers (NHTSA, 2005a, Table 80). Motorcyclists in fatal crashes had a BAC of .08 or higher more frequently than other drivers (NHTSA, 2003, p. 11). Motorcyclists in injury or property-damage crashes had higher alcohol-involvement rates than other vehicle drivers (NHTSA, 2005a, Table 80). One recent study found that alcohol-impaired motorcycle operators were 16.9 times more likely to be at fault in a crash than sober operators (NCHRP, under review, Strategy C1). Fatally injured motorcycle operators wore helmets less frequently than sober operators (NHTSA, 2003, p. 12). Motorcyclists are included in and affected by the comprehensive strategies to reduce alcohol-impaired driving discussed in detail in Chapter 1. However, some law enforcement, sanction, and communication strategies may be especially useful for motorcyclists, while others may be relatively ineffective. This section discusses law enforcement and sanctions. Section 3.2 discusses communications. Law enforcement officers on traffic patrol use characteristic driving behaviors, or cues, to identify drivers who may be impaired by alcohol. Some of the cues for motorcyclists, such as trouble maintaining balance at a stop, are different from those for cars and trucks. Stuster (1993) identified and validated 14 cues useful for identifying alcohol-impaired motorcyclists. NHTSA prepared a brochure discussing the cues, a law enforcement training video for roll-call use, and a pocket detection guide (NHTSA, 2000b). The cues are part of the SFST training given to all law enforcement officers. Vehicle impoundment or forfeiture can be an effective deterrent to drinking and driving for all drivers (see Chapter 1, Section 4.4). It may be even more effective for motorcyclists. Recent research (Becker et al., 2003) confirmed earlier findings that many motorcyclists do not find traditional impaired driving sanctions such as fines and license suspension to be effective deterrents. However, they are strongly concerned for the safety and security of their motorcycles. These findings suggest a potentially effective strategy to reduce alcohol-impaired motorcycling: highly publicized enforcement, using officers trained in identifying impaired motorcyclists as well as other vehicle drivers, with offender sanctions including vehicle impoundment or forfeiture. This will treat motorcyclists on an equal footing with other vehicle drivers in impaired-driving enforcement and publicity. Use: The extent to which law enforcement agencies train officers to detect alcohol-impaired motorcyclists, or include alcohol-impaired motorcycling in any way in their traffic patrol activities, is not known. Effectiveness: Some agencies have reported some success in using the cues for identifying alcohol-impaired motorcyclists, but no evaluation data is available (NCHRP, under review, Strategy C3).
5 - 15
Costs: Law enforcement training costs are low and training material is available. Enforcement itself can be carried out during regular traffic patrol. A major campaign including alcohol-impaired motorcyclists will require additional costs for publicity. Time to implement: Law enforcement training can be conducted quickly. A major campaign will require four to six months to plan and implement. Other issues:
• Motorcyclist groups: Motorcyclist groups likely will object strenuously to any enforcement activities that are perceived to target motorcyclists unfairly. The best strategy is to assure that motorcyclists, rider organizations, and motorcycle dealers are included in planning and publicizing impaired driving enforcement.
• Drugs other than alcohol: Drugs other than alcohol can impair motorcycle operators. Potentially impairing drugs include over-the-counter and prescription medications as well as illegal drugs. Beyond this, little more can be said with any confidence. Studies of vehicle drivers, typically in individual hospitals, find drug presence considerably lower than alcohol presence. Motorcycle operators usually are not separated out in these studies. The extent to which various drugs impair driving performance or contribute to crashes is not well understood, either for four-wheeled vehicles or for motorcycles. See Jones et al. (2003) for a thorough summary of current knowledge. Law enforcement should consider drugs as potential impairing agents for motorcycle operators just as for other vehicle operators.

5 - 16
3.2 Alcohol-Impaired Motorcyclists: Communications and Outreach Effectiveness: Unknown Use: Unknown Cost: Medium Time: Medium Alcohol impairment is a substantial problem for motorcyclists, more so than for drivers of other motor vehicles. Chapter 5, Section 3.1 discusses the problem and suggests law enforcement and sanction strategies that may help alleviate it. This section discusses communications strategies. Several States have conducted communications and outreach campaigns directed at drinking and motorcycling. See NCHRP (under review, Strategy C1) for examples and links. Organizations including AMA, MSF, and SMSA have produced campaigns and material on drinking and motorcycling. Again, see NCHRP (under review, Strategy C1) for examples and links. There are no evaluations of the effectiveness of any of these campaigns at any level, from awareness to knowledge and attitude change to any effect on motorcyclists’ drinking and motorcycling behavior. The experience of drinking and driving campaigns directed at all drivers suggests that they are unlikely to have any effect unless they are carefully researched and planned, well funded, well executed, achieve high levels of target audience exposure (perhaps using paid advertising), use high-quality messages that are pretested for effectiveness, and are conducted in conjunction with other activities directed at impaired motorcyclists. See Chapter 1, Section 5.5, for further discussion. A recent focus group study (Becker et al., 2002) examined motorcyclists’ attitudes, beliefs, and behaviors regarding drinking and motorcycling. It concluded that many motorcyclists have strong feelings of freedom, independence, and individual responsibility and believe that drinking motorcyclists endanger only themselves. Consequently, they believe that government efforts to discourage drinking and motorcycling are inappropriate. These beliefs also limit some motorcyclists’ willingness to take actions to prevent others from riding while impaired. These findings suggest that only very high-quality drinking and motorcycling campaigns have any chance of being effective. In particular, any campaign should be researched, designed, and pretested thoroughly and must appeal to common motorcyclist attitudes and beliefs. Use: Several States have conducted drinking and motorcycling campaigns (NCHRP, under review, Strategy C1), but the total number of States that have done so is not known. It also is not known whether States have included messages directed to motorcyclists in their overall alcohol-impaired driving campaigns. Effectiveness: There are no evaluations of the effectiveness of any drinking and motorcycling campaigns. Costs: A good campaign will require substantial funds to conduct market research, design and test messages, and place campaign material where it will reach motorcyclists frequently. Time to implement: A good campaign will require at least six months to research, design, test, and implement. Other issues:
5 - 17
• Drugs other than alcohol: Drugs other than alcohol can impair motorcycle operators. Potentially impairing drugs include over-the-counter and prescription medications and illegal drugs. See Chapter 5, Section 3.1, for additional discussion and Jones et al. (2003) for a thorough summary of current knowledge. Drinking and motorcycling campaigns may wish to include other drugs as well as alcohol in their messages.
5 - 18
4.1 Communications and Outreach: Protective and Conspicuous Clothing Effectiveness: Unknown Use: Unknown Cost: Varies Time: Medium Motorcycle riders should wear clothing that provides both protection and visibility. FMVSS 218 helmets (Chapter 5, Sections 2.1-2.3) with face shields protect the eyes from wind and foreign objects in addition to protecting the head in a crash. Well-constructed jackets, pants, boots, and gloves can prevent abrasions and bruises. If made of impact-resistant material, they even may prevent arm and leg fractures or serious torso and spinal cord injuries (NHTSA, 2000a, Personal Protective Equipment). A common cause of motorcycle crashes involving other vehicles is that other vehicle drivers do not see the motorcycle. This observation is reported anecdotally and confirmed in motorcycle crash causation studies (NCHRP, under review, Strategy E2; NHTSA, 2000a, Conspicuity). One easy way to increase motorcycle conspicuity is through lighted headlights. Most motorcycles on the road have their headlights always on, because most motorcycles manufactured since 1979 have this feature (NCHRP, under review, Strategy E2) and because 24 States require daytime headlight use for all motorcycles manufactured since 1980 (MSF, 2004). A second way to increase conspicuity is to wear brightly colored clothing (for increased visibility during daylight) incorporating some retro-reflective material (for increased visibility at night). Recent studies confirm that motorcyclists wearing conspicuous clothing or helmets are less likely to be involved in a crash (NCHRP, under review, Strategy E1). There is no data on how many motorcycle riders wear various types of protective clothing other than helmets. Only a minority wears brightly colored clothing (NHTSA, 2000a, Conspicuity); in fact, the predominant color of motorcycle clothing is black (NCHRP, under review, Strategy E1). Helmet manufacturers and distributors report that more than half the helmets sold for street use are black (NCHRP, under review, Strategy E1). Communications and outreach campaigns promoting protective and conspicuous clothing have been conducted by States and by motorcyclist organizations. NCHRP (under review, Strategy E1) provides examples of material from Oregon and the MSF and references to additional material from the SMSA, the Gold Wing Road Riders Association, and the Motorcycle Council of New South Wales, Australia. Use: The number of States that conduct campaigns to promote protective and conspicuous clothing for motorcycle riders is not known. Effectiveness: There are no evaluations of the effectiveness of campaigns to increase the use of protective and conspicuous clothing (NCHRP, under review, Strategy E1). Costs: Good communications and outreach campaigns can be expensive to develop and implement: see Chapter 2, Section 3.1. Material promoting protective and conspicuous clothing are available from various sources including MSF, other motorcyclist organizations, and States that have conducted these campaigns (NCHRP, under review, Strategy E1).

5 - 19
Time to implement: A good campaign, including market research, message development and testing, and implementation, will require at least six months to plan and implement.
5 - 20
4.2 Communications and Outreach: Awareness of Motorcyclists Effectiveness: Unknown Use: Unknown Cost: Varies Time: Medium When motorcycles crash with other vehicles, the other vehicle driver usually violates the motorcyclist’s right-of-way (NCHRP, under review, Strategy G3; NHTSA, 2000a, Motorist Awareness). Motorcycles and motorcyclists obviously are a smaller visual target than cars or trucks. Motorcyclists may not be conspicuous (see Chapter 5, Section 4.1). Also, drivers may not expect to see motorcycles on the road and may not anticipate how motorcycles are likely to be driven (NCHRP, under review, Strategy G3; NHTSA, 2000a, Motorist Awareness). Several States have conducted communications and outreach campaigns to increase other drivers’ awareness of motorcyclists. Typical themes are “Share the Road” or “Watch for Motorcyclists.” Some States build a campaign around a “Motorcycle Awareness Month,” often in May, early in the summer riding season. Many motorcyclist organizations, including MSF, SMSA, the Gold Wing Road Riders Association, and State motorcycle rights organizations, have driver awareness material available. See NCHRP (under review, Strategy G3) for links and references. These organizations also make presentations on drivers’ awareness of motorcyclists to driver education classes. Use: The number of States that conduct campaigns to increase drivers’ awareness of motorcycles and motorcyclists is not known. NCHRP (under review, Strategy G3) provides examples or links to campaigns from 11 States. Effectiveness: There are no evaluations of the effectiveness of campaigns to increase driver awareness of motorcyclists (NCHRP, under review, Strategy E1). NHTSA conducted a demonstration of driver awareness programs in New York and Washington but the results have not yet been released (NHTSA, 2003, p. 18). Costs: Good communications and outreach campaigns can be expensive to develop and implement: see Chapter 2, Section 3.1. Motorcyclist awareness material is available from various sources including the MSF, other motorcyclist organizations, and States that have conducted these campaigns (NCHRP, under review, Strategy E1). Time to implement: A good campaign, including market research, message development and testing, and implementation, will require at least six months to plan and implement. A good campaign, including market research, material development, and message placement, will require at least six months to plan and implement.
5 - 21
Motorcycle Safety References Baer, J.D., Cook, A.L., and Baldi, S. (2005). Motorcycle Rider Education and Licensing: A Review of Programs and Practices. DOT HS 809 852. Washington, DC: National Highway Traffic Safety Administration. www.nhtsa.dot.gov/people/injury/pedbimot/motorcycle/McycleRiderWeb/pages/index.htm Becker, L.R., McKnight, A.S., and Nelkin, V.S., et al. (2003). Drinking, Riding, and Prevention: A Focus Group Study. DOT HS 809 490. Washington, DC: National Highway Traffic Safety Administration. www.nhtsa.dot.gov/people/injury/pedbimot/motorcycle/DrinkRidePrevent/index.htm#TABLE%20OF%20CONTENTS Billheimer, J.W. (1996). California Motorcyclist Safety Program: Program Effectiveness. Sacramento, CA: California Highway Patrol. Deuterman, W. (2004). Motorcycle Helmet Effectiveness Revisited. DOT HS 809 715. Washington, DC: National Highway Traffic Safety Administration. www-nrd.nhtsa.dot.gov/pdf/nrd-30/NCSA/Rpts/2004/809-715/pages/TRDpage.html GAO (1991). Highway Safety: Motorcycle Helmet Laws Save Lives and Reduce Costs to Society. Washington, DC: U.S. General Accounting Office (now the General Accountability Office). Glassbrenner, D. (2002). Safety Belt and Helmet Use in 2002 - Overall Results. DOT HS 809 500. Washington, DC: National Highway Traffic Safety Administration. www-nrd.nhtsa.dot.gov/pdf/nrd-30/NCSA/Rpts/2002/809-500.pdf Hedlund, J., Shults, R.A., and Compton, R. (2003). What we know, what we don’t know, and what we need to know about graduated driver licensing. Journal of Safety Research 34, pp. 107-115. www.nsc.org/gdlsym/index.htm Hedlund, J., and Compton, R. (2004). Graduated driver licensing research in 2003 and beyond. Journal of Safety Research 35, pp. 5-11. Hedlund, J., and Compton, R. (2005). Graduated driver licensing research in 2004 and 2005. Journal of Safety Research 36 (in press). IIHS (2004). Current U.S. Motorcycle and Bicycle Helmet Laws, December 2004. Arlington, VA: Insurance Institute for Highway Safety. www.hwysafety.org/safety%5Ffacts/State%5Flaws/helmet%5Fcurrent.htm Jones, R.K., Shinar, D., and Walsh, J.M. (2003). State of Knowledge of Drug-Impaired Driving. DOT HS 809 642. Washington, DC: National Highway Traffic Safety Administration. www.nhtsa.dot.gov/people/injury/research/StateofKnwlegeDrugs/StateofKnwlegeDrugs/index.html

5 - 22
Liu, B., Ivers, R., Norton, R., et al. (2003). Helmets for preventing injury in motorcycle riders. The Cochrane Database of Systematic Reviews. www.cochrane.org/cochrane/revabstr/AB004333.htm Mayhew, D.R., and Simpson, H.M. (1996). Effectiveness and Role of Driver Education and Training in a Graduated Licensing System. Ottawa, ON: Traffic Injury Research Foundation. www.trafficinjuryresearch.com/publications/pub_details.cfm?intPubID=65 Mayhew, D.R., and Simpson, H.M. (2001). Graduated Licensing for Motorcyclists. Ottawa, ON: Traffic Injury Research Foundation. www.trafficinjuryresearch.com/publications/PDF_publications/GDL_for_Motorcyclists_Report.pdf MSF (2002). State Motorcycle Operator Licensing - 2002. Irvine, CA: Motorcycle Safety Foundation. www.msf-usa.org/Downloads/2002%20CSI%20Licensing.pdf MSF (2004). State On-Highway Motorcycle Equipment Requirements. Irvine, CA: Motorcycle Safety Foundation. www.msf-usa.org/downloads/Equipment_Chart_2004_MSFlogo.pdf NCHRP Report 500 (under review). A Guide for Addressing Collisions Involving Motorcycles. Washington, DC: Transportation Research Board. www.ch2m.com/nchrp/over/default.htm NHTSA (1996). Do Motorcycle Helmets Interfere with the Vision and Hearing of Riders? Traffic Tech No. 127. Washington, DC: National Highway Traffic Safety Administration. www.nhtsa.dot.gov/people/outreach/traftech/pub/tt127.pdf NHTSA (1998). Traffic Safety Facts 1997. DOT HS 808 806. Washington, DC: National Highway Traffic Safety Administration. www-nrd.nhtsa.dot.gov/pdf/nrd-30/NCSA/TSFAnn/TSF97.pdf NHTSA (2000a). National Agenda for Motorcycle Safety. Washington, DC: National Highway Traffic Safety Administration. www.nhtsa.dot.gov/people/injury/pedbimot/motorcycle/00-NHT-212-motorcycle/index.html NHTSA (2000b). The Detection of DWI Motorcyclists. Washington, DC: National Highway Traffic Safety Administration. www.nhtsa.dot.gov/people/injury/alcohol/SobrietyCheck/order_form.html NHTSA (2003). The National Highway Traffic Safety Administration Motorcycle Safety Program. DOT HS 809 539. Washington, DC: National Highway Traffic Safety Administration. www.nhtsa.gov/people/injury/pedbimot/motorcycle/motorcycle03/index.htm NHTSA (2004). How to Identify Unsafe Motorcycle Helmets. DOT HS 807 880 (revised). Washington, DC: National Highway Traffic Safety Administration. www.nhtsa.dot.gov/people/injury/pedbimot/motorcycle/UnsafeHelmetID/images/UnsafeHelmets.pdf
5 - 23
NHTSA (2005a). Traffic Safety Facts 2003. DOT HS 809 775. Washington, DC: National Highway Traffic Safety Administration. www-nrd.nhtsa.dot.gov/pdf/nrd-30/NCSA/TSFAnn/TSF2003.pdf NHTSA (2005b). Motor Vehicle Traffic Crash Fatalities and Injuries: 2004 Projections. DOT HS 809 862. Washington, DC: National Highway Traffic Safety Administration. www-nrd.nhtsa.dot.gov/pdf/nrd-30/NCSA/PPT/2004EARelease.pdf NHTSA (2005c). Data from NHTSA’s office of Program Development and Delivery. NHTSA (undated). Highway Safety Program Guideline No 3: Motorcycle Safety. Washington, DC: National Highway Traffic Safety Administration. www.nhtsa.dot.gov/nhtsa/whatsup/tea21/tea21programs/402Guide.html#g3 Preusser, D.F., Hedlund, J.H., and Ulmer, R.G. (2000). Evaluation of Motorcycle Helmet Law Repeal in Arkansas and Texas. DOT HS 809 131. Washington, DC: National Highway Traffic Safety Administration. www.nhtsa.dot.gov/people/injury/pedbimot/motorcycle/EvalofMotor.pdf Stuster, J. (1993). The Detection of DWI Motorcyclists. DOT HS 807 839. Washington, DC: National Highway Traffic Safety Administration. Ulmer, R.G., and Preusser, D.F. (2003). Evaluation of the Repeal of Motorcycle Helmet Laws in Kentucky and Louisiana. DOT HS 809 530. Washington, DC: National Highway Traffic Safety Administration. www.nhtsa.dot.gov/people/injury/research/kenturky-la03/TecDoc.htm

6 - 1
66.. YYoouunngg DDrriivveerrss Overview Young drivers under 21 are substantially over-involved in crashes. In 2003, drivers under 21 were 6.4 percent of all licensed drivers in the United States, 13.8 percent of drivers in fatal crashes, and 17.6 percent of drivers in all crashes (NHTSA, 2005, Table 63).
Fatal: crashes per 30,000 drivers (FARS) All: crashes per 100 drivers (GES)
Per mile driven, young drivers are even more over-involved. From April 2001 through March 2002, young drivers were involved in 7.4 fatal crashes per 100 million miles of travel, compared to 4.3 for drivers 21 to 24 and 1.6 for drivers 30 to 69 years old (IIHS, 2005). Trends. The number of young drivers in fatal crashes dropped 22 percent over the past 20 years, from 10,080 in 1982 to 7,884 in 2003. However, the decrease occurred during the first 10 years, from 1982 to 1992, and the number of young drivers in fatal crashes increased 6 percent from 1992 to 2003. The decrease was due entirely to a reduction in alcohol-involved drivers from 1982 to 1993. Sober driver involvements increased 7 percent from 1982 to 2003, and the number of alcohol-involved drivers has been essentially constant since 1993. Young-driver characteristics. Young drivers have high crash risks for two main reasons, as documented by extensive research (summarized in Hedlund et al., 2003). First, they are inexperienced, just learning to drive. The mechanics of driving require much of their attention, so safety considerations frequently are secondary. They do not have experience in recognizing potentially risky situations or in reacting appropriately and controlling their vehicles in these situations. Second, they are immature, sometimes seeking risks for their own sake, often not able or willing to think ahead to the potentially harmful consequences of risky actions.
Crash rate per licensed driver - 2003
0
4
8
12
16
20
16-20 21-24 25-34 35-44 45-54 55-64 65-74 >74
Driver age
All crashes
Fatal crashes
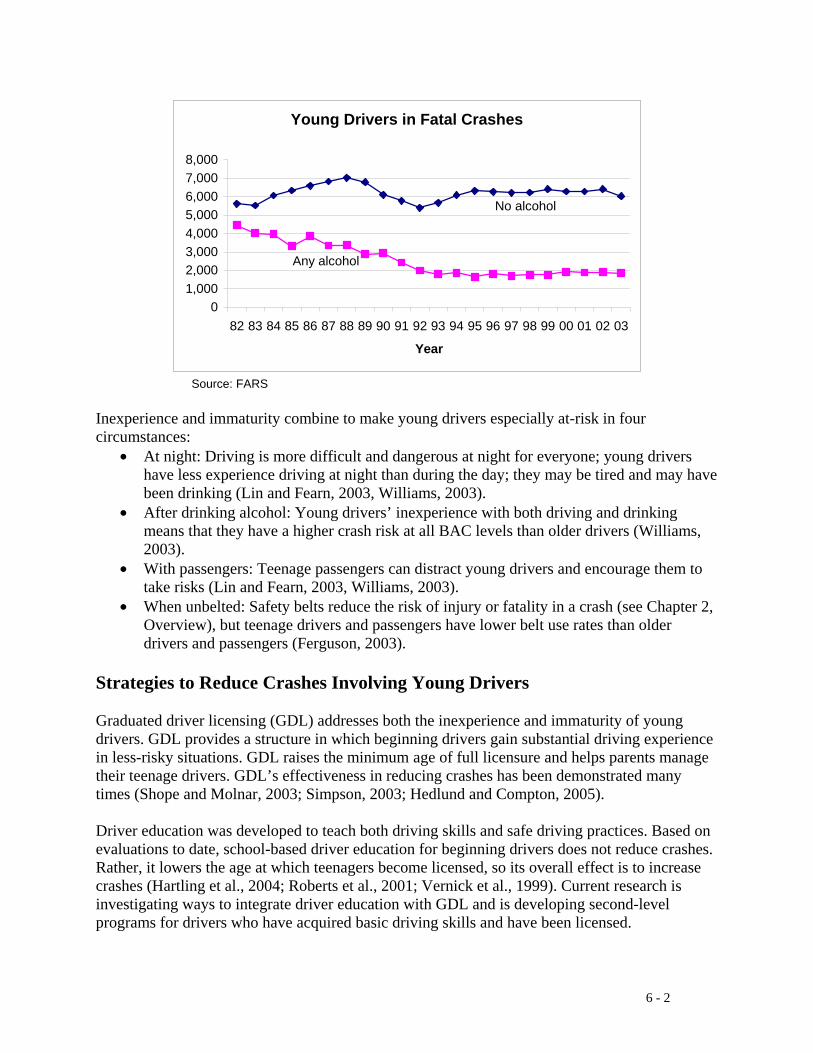
6 - 2
Source: FARS Inexperience and immaturity combine to make young drivers especially at-risk in four circumstances:
• At night: Driving is more difficult and dangerous at night for everyone; young drivers have less experience driving at night than during the day; they may be tired and may have been drinking (Lin and Fearn, 2003, Williams, 2003).
• After drinking alcohol: Young drivers’ inexperience with both driving and drinking means that they have a higher crash risk at all BAC levels than older drivers (Williams, 2003).
• With passengers: Teenage passengers can distract young drivers and encourage them to take risks (Lin and Fearn, 2003, Williams, 2003).
• When unbelted: Safety belts reduce the risk of injury or fatality in a crash (see Chapter 2, Overview), but teenage drivers and passengers have lower belt use rates than older drivers and passengers (Ferguson, 2003).
Strategies to Reduce Crashes Involving Young Drivers Graduated driver licensing (GDL) addresses both the inexperience and immaturity of young drivers. GDL provides a structure in which beginning drivers gain substantial driving experience in less-risky situations. GDL raises the minimum age of full licensure and helps parents manage their teenage drivers. GDL’s effectiveness in reducing crashes has been demonstrated many times (Shope and Molnar, 2003; Simpson, 2003; Hedlund and Compton, 2005). Driver education was developed to teach both driving skills and safe driving practices. Based on evaluations to date, school-based driver education for beginning drivers does not reduce crashes. Rather, it lowers the age at which teenagers become licensed, so its overall effect is to increase crashes (Hartling et al., 2004; Roberts et al., 2001; Vernick et al., 1999). Current research is investigating ways to integrate driver education with GDL and is developing second-level programs for drivers who have acquired basic driving skills and have been licensed.
Young Drivers in Fatal Crashes
01,0002,0003,0004,0005,0006,0007,0008,000
82 83 84 85 86 87 88 89 90 91 92 93 94 95 96 97 98 99 00 01 02 03
Year
No alcohol
Any alcohol
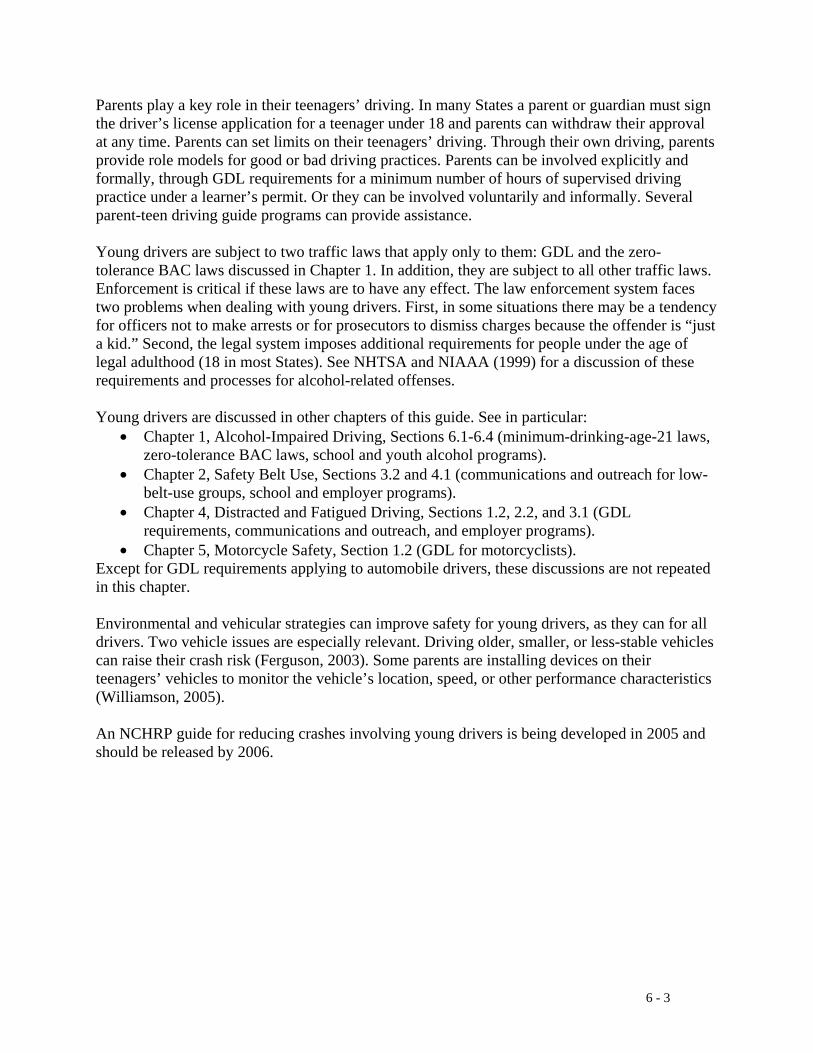
6 - 3
Parents play a key role in their teenagers’ driving. In many States a parent or guardian must sign the driver’s license application for a teenager under 18 and parents can withdraw their approval at any time. Parents can set limits on their teenagers’ driving. Through their own driving, parents provide role models for good or bad driving practices. Parents can be involved explicitly and formally, through GDL requirements for a minimum number of hours of supervised driving practice under a learner’s permit. Or they can be involved voluntarily and informally. Several parent-teen driving guide programs can provide assistance. Young drivers are subject to two traffic laws that apply only to them: GDL and the zero-tolerance BAC laws discussed in Chapter 1. In addition, they are subject to all other traffic laws. Enforcement is critical if these laws are to have any effect. The law enforcement system faces two problems when dealing with young drivers. First, in some situations there may be a tendency for officers not to make arrests or for prosecutors to dismiss charges because the offender is “just a kid.” Second, the legal system imposes additional requirements for people under the age of legal adulthood (18 in most States). See NHTSA and NIAAA (1999) for a discussion of these requirements and processes for alcohol-related offenses. Young drivers are discussed in other chapters of this guide. See in particular:
• Chapter 1, Alcohol-Impaired Driving, Sections 6.1-6.4 (minimum-drinking-age-21 laws, zero-tolerance BAC laws, school and youth alcohol programs).
• Chapter 2, Safety Belt Use, Sections 3.2 and 4.1 (communications and outreach for low-belt-use groups, school and employer programs).
• Chapter 4, Distracted and Fatigued Driving, Sections 1.2, 2.2, and 3.1 (GDL requirements, communications and outreach, and employer programs).
• Chapter 5, Motorcycle Safety, Section 1.2 (GDL for motorcyclists). Except for GDL requirements applying to automobile drivers, these discussions are not repeated in this chapter. Environmental and vehicular strategies can improve safety for young drivers, as they can for all drivers. Two vehicle issues are especially relevant. Driving older, smaller, or less-stable vehicles can raise their crash risk (Ferguson, 2003). Some parents are installing devices on their teenagers’ vehicles to monitor the vehicle’s location, speed, or other performance characteristics (Williamson, 2005). An NCHRP guide for reducing crashes involving young drivers is being developed in 2005 and should be released by 2006.
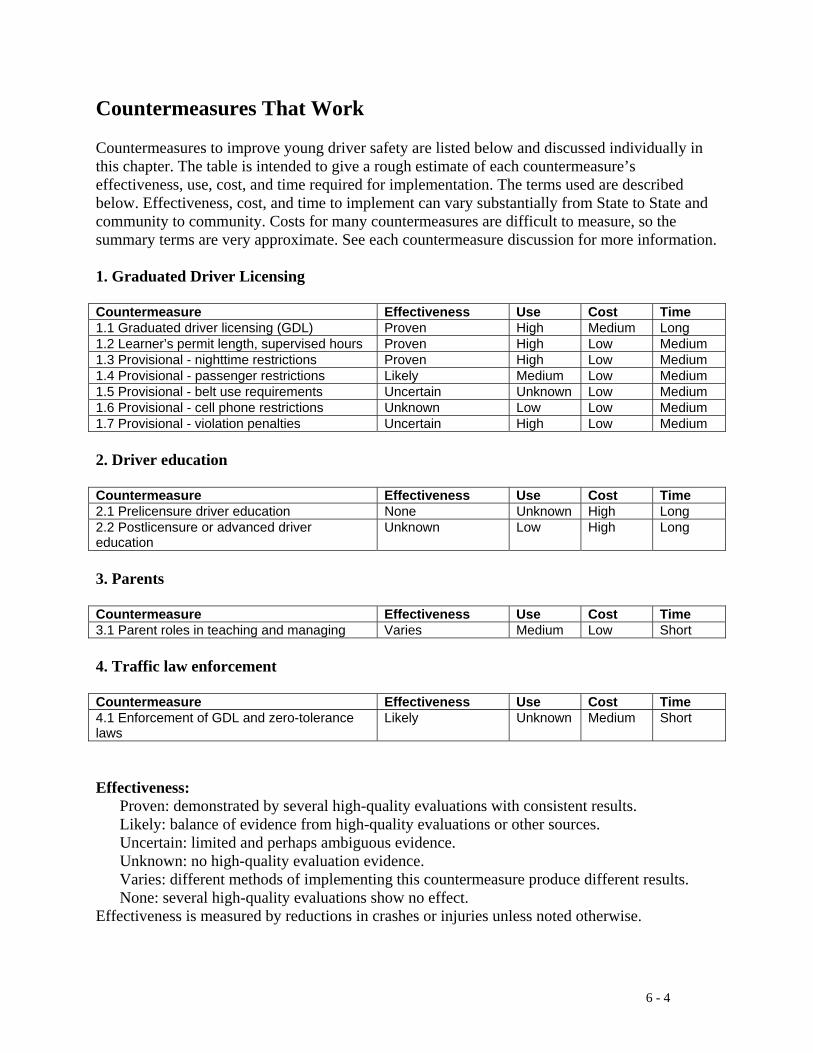
6 - 4
Countermeasures That Work Countermeasures to improve young driver safety are listed below and discussed individually in this chapter. The table is intended to give a rough estimate of each countermeasure’s effectiveness, use, cost, and time required for implementation. The terms used are described below. Effectiveness, cost, and time to implement can vary substantially from State to State and community to community. Costs for many countermeasures are difficult to measure, so the summary terms are very approximate. See each countermeasure discussion for more information. 1. Graduated Driver Licensing Countermeasure Effectiveness Use Cost Time 1.1 Graduated driver licensing (GDL) Proven High Medium Long 1.2 Learner’s permit length, supervised hours Proven High Low Medium 1.3 Provisional - nighttime restrictions Proven High Low Medium 1.4 Provisional - passenger restrictions Likely Medium Low Medium 1.5 Provisional - belt use requirements Uncertain Unknown Low Medium 1.6 Provisional - cell phone restrictions Unknown Low Low Medium 1.7 Provisional - violation penalties Uncertain High Low Medium
2. Driver education Countermeasure Effectiveness Use Cost Time 2.1 Prelicensure driver education None Unknown High Long 2.2 Postlicensure or advanced driver education
Unknown Low High Long
3. Parents Countermeasure Effectiveness Use Cost Time 3.1 Parent roles in teaching and managing Varies Medium Low Short 4. Traffic law enforcement Countermeasure Effectiveness Use Cost Time 4.1 Enforcement of GDL and zero-tolerance laws
Likely Unknown Medium Short
Effectiveness: Proven: demonstrated by several high-quality evaluations with consistent results. Likely: balance of evidence from high-quality evaluations or other sources. Uncertain: limited and perhaps ambiguous evidence. Unknown: no high-quality evaluation evidence. Varies: different methods of implementing this countermeasure produce different results. None: several high-quality evaluations show no effect. Effectiveness is measured by reductions in crashes or injuries unless noted otherwise.
6 - 5
See individual countermeasure descriptions for information on effectiveness size and how effectiveness is measured. Use: High: more than two-thirds of the States, or a substantial majority of communities. Medium: between one-third and two-thirds of States or communities. Low: fewer than one-third of the States or communities. Unknown: data not available. Cost to implement: High: requires extensive new facilities, staff, equipment, or publicity, or makes heavy
demands on current resources. Medium: requires some additional staff time, equipment, facilities, and/or publicity. Low: can be implemented with current staff, perhaps with training; limited costs for equipment or facilities. Time to implement: Long: more than one year. Medium: more than three months but less than one year. Short: three months or less. These estimates do not include the time required to enact legislation or establish policies.
6 - 6
1.1 Graduated Driver Licensing Effectiveness: Proven Use: High Cost: Medium Time: Long GDL is a three-phase system for beginning drivers, consisting of a learner’s permit, a provisional (or intermediate) license, and a full license. A learner’s permit allows driving only while supervised by a fully licensed driver. A provisional license allows unsupervised driving under certain restrictions. These usually include limits on driving at night or with teenage passengers. The learner’s permit and the provisional license each must be held for a specified minimum period of time. GDL serves two functions: reducing risk and reducing exposure. GDL allows beginning drivers to acquire driving experience in less-risky situations, under direct supervision during the learner’s permit phase. It helps young drivers avoid dangerous conditions such as late-night driving or driving with teenage passengers in the vehicle during the provisional phase. GDL delays full licensure by requiring a minimum time in both the learner’s permit and provisional phases. Compared to earlier requirements in many jurisdictions, where beginning drivers could receive a full license at age 16 (and sometimes earlier) by passing a minimal driving test, GDL reduces the amount of driving by 16-year-old drivers. GDL also assures that young drivers are more mature when they receive their first unrestricted license. Most States now have some form of GDL in place. NCUTLO (2000) provides a model GDL law. IIHS and TIRF (2004) summarize and discuss GDL provisions and document GDL laws in each State as of August 2004. The papers in the Journal of Safety Research special issue of January 2003 document GDL’s history, components, effectiveness, parental roles, potential enhancements, and research needs. See Hedlund et al. (2003) for a summary and links to other papers, and Hedlund and Compton (2004, 2005) for updates. Use: 40 States and the District of Columbia had a three-phase GDL system as of August 2004 (IIHS and TIRF, 2005). Effectiveness: GDL’s effectiveness in reducing crashes has been documented repeatedly (Hartling et al., 2004; Hedlund and Compton, 2005; Shope and Molnar, 2003; Simpson, 2003). Costs: GDL’s primary costs result from the provisional license, which adds to licensing agency workload by requiring each beginning driver to receive three licenses in succession rather than two. Time to implement: Licensing changes typically require more than a year to plan, publicize, and implement. Other issues:
• GDL provisions: The specific provisions in current GDL systems vary substantially from State to State. IIHS and TIRF (2004) document the main provisions of each State’s law. Sections 1.2-1.7 of this Chapter discuss the main provisions in more detail.

6 - 7
1.2 GDL Learner’s Permit Length, Supervised Hours Effectiveness: Proven Use: High Cost: Low Time: Medium With a learner’s permit, a beginning driver can drive when supervised by a fully licensed driver at least 21 years old. The learner’s permit allows and encourages beginning drivers to acquire substantial driving experience. To aid this, most States require the learner’s permit to be held for a minimum period of time and most require a minimum number of supervised driving hours. NCUTLO’s model GDL law suggests minimum requirements of six months holding period and 30 hours supervised driving (NCUTLO, 2000). Most States meet or exceed these recommendations. Use: As of August 2004, 37 States required learner’s permits to be held for at least six months and another 9 had minimum holding periods of 10 days to five months. Some minimum number of supervised driving hours were required in 36 States: 15 required at least 50 hours, 8 required 40 hours, 6 required 30 to 36 hours, and 7 required 12 to 15 hours (IIHS and TIRF, 2004). Effectiveness: Several studies, summarized in Mayhew (2003), show that learner’s permit drivers in various jurisdictions regularly drive under adult supervision and often exceed the minimum requirement for supervised driving hours. Thus the combination of a minimum learner’s permit holding period and a supervised driving hour requirement is successful in achieving substantial supervised driving practice. In surveys, both parents and teenagers strongly support GDL overall. In particular, they support the learner’s permit holding period and supervised driving requirements (Mayhew, 2003). Since learner’s permit drivers are being supervised, it’s not surprising that crash rates during the learner’s permit period are very low. For young drivers holding their first unsupervised license, the limited available evidence suggests that crash rates decreased after jurisdictions with no learner’s permit holding requirement implemented a six-month requirement (Mayhew, 2003). No studies have compared the effects of different learner’s permit holding times and no studies have evaluated the effects of a minimum-supervised-driving-hour requirement. NCUTLO’s model requirements of at least six months’ holding time and at least 30 hours of supervised practice seem to be generally accepted as minimum standards (IIHS and TIRF, 2004). Costs: Once GDL is in place, a requirement for a minimum learner’s permit holding period length or a minimum number of supervised driving hours can be implemented at very little cost. Time to implement: GDL requirement changes typically require at least six months to notify the public and implement the changes.
6 - 8
1.3 GDL Provisional License Nighttime Restrictions Effectiveness: Proven Use: High Cost: Low Time: Medium Driving at night increases the fatal crash risk per mile of travel for all drivers, and especially for teenage drivers (Hedlund et al., 2003; Williams, 2003). At night, driving is more difficult, driver fatigue is more common, and alcohol is more likely to be used. Many provisionally licensed drivers have limited experience driving at night. For all of these reasons, a night driving restriction or prohibition is the most common provisional license restriction. The restricted hours vary widely, from “sunset to sunrise” or 6 p.m. to 6 a.m. in the most restrictive States, to 1 a.m. to 5 a.m., in the least restrictive (IIHS and TIRF, 2004). The most common hours are midnight to 5 a.m. The NCUTLO model law recommends a 10 p.m. starting time (NCUTLO, 2000) and the IIHS-TIRF Blueprint recommends a 9 p.m. or 10 p.m. starting time, but only 7 States start their restrictions as early as 10 p.m. A starting time earlier than midnight will prevent more crashes, especially since teenage driver crashes occur more frequently before midnight than after (Foss and Goodwin, 2003; Williams, 2003). Use: As of August 2004, 38 States restricted provisionally licensed drivers from driving during specified nighttime hours. Many States allowed driving during the restricted hours for work or school-related activities (IIHS and TIRF, 2004). Effectiveness: The effectiveness of nighttime driving restrictions in reducing both nighttime driving and nighttime crashes has been demonstrated conclusively (Hedlund et al., 2003; Hedlund and Compton, 2004; Hedlund and Compton, 2005; Lin and Fearn, 2003). Costs: Once GDL is in place, a nighttime driving restriction can be implemented or modified at very little cost. Time to implement: GDL requirement changes typically require at least six months to notify the public and implement the changes.
6 - 9
1.4 GDL Provisional License Passenger Restrictions Effectiveness: Likely Use: Medium Cost: Low Time: Medium Passengers increase the crash risk for teenage drivers, especially the youngest drivers. Each additional passenger produces an additional increase in crash risk. In contrast, passengers decrease crash risk for drivers 30 to 59 years old (Williams, 2003). To reduce the risk to teen drivers, half the States include a passenger restriction in their GDL requirements for provisional licensees. NCUTLO’s model law prohibits passengers younger than 20 (NCUTLO, 2000). Use: As of August 2004, 27 States restricted in some way the number of passengers who can be carried by a provisionally licensed driver (IIHS and TIRF, 2004). Some restrictions apply to all passengers and some only to passengers younger than a specified age. Some restrictions apply only during the initial months of the provisional license. Effectiveness: Passenger restrictions are generally effective in reducing the number of passengers, though the restrictions sometimes are violated (Hedlund et al., 2003). A recent study in California found that 16-year-old drivers who were at fault in crashes were more frequently carrying teenage passengers than 16-year-old drivers involved in crashes who were not at fault (Hedlund and Compton, 2005). Two studies in progress in 2005 are evaluating the effects of passenger restrictions in four States (Hedlund and Compton, 2005). Costs: Once GDL is in place, a passenger restriction can be implemented at very little cost. Time to implement: GDL requirement changes typically require at least six months to notify the public and implement the changes.
6 - 10
1.5 GDL Provisional License Belt Use Requirements Effectiveness: Uncertain Use: Unknown Cost: Low Time: Medium Teenage drivers and passengers have lower safety belt use rates than older drivers and passengers (Ferguson, 2003). All States except New Hampshire have belt use laws covering passengers of all ages, though the laws in over half the States exempt passengers in some seating positions or in some passenger vehicles (Glassbrenner, 2004). New Hampshire requires belt use by all passengers under 18. Six States have primary enforcement belt use laws for passengers under the age of 18 or 19 but secondary enforcement for older passengers (Glassbrenner, 2004; see also Chapter 2, Sections 2.1 and 2.4). Some States explicitly require belt use under their GDL laws. NCUTLO’s model law requires provisionally licensed drivers and all their passengers to be belted (NCUTLO, 2000). An explicit belt use requirement in a State’s GDL law may have more influence on beginning drivers than the State’s overall belt use law, especially in those States with primary enforcement for young drivers. Use: GDL laws in 15 States explicitly require belt use (AAA, 2005). Effectiveness: There are no evaluations of the effects of explicit belt use requirements in GDL laws. A current NHTSA-funded study is examining whether increased publicity for safety belt GDL requirements leads to increased belt use (Hedlund and Compton, 2005). Costs: Once GDL is in place, a belt use requirement can be implemented at very little cost. Time to implement: GDL requirement changes typically require at least six months to notify the public and implement the changes.
6 - 11
1.6 GDL Provisional License Cell Phone Restrictions Effectiveness: Unknown Use: Low Cost: Low Time: Medium Cell phones may distract drivers, as discussed in Chapter 4, Section 1.1. Their distractions may pose greater risks for beginning drivers than for experienced drivers, for the reasons outlined in the Overview (see also Ferguson, 2003). To reduce this risk, a few States include cell phone restrictions in their GDL laws. NCUTLO’s model law does not include a cell phone restriction for either learner’s permit or provisionally licensed drivers (NCUTLO, 2000). See Chapter 4, Section 1.1 for a discussion of cell phone laws applying to all drivers. Use: Five States (Colorado, Delaware, Maine, New Jersey, and Tennessee) and the District of Columbia prohibit cell phone use by drivers with a GDL or all drivers under the age of 18 (GHSA, 2005). Maryland prohibits drivers under 18 from using any wireless communication device. New York prohibits handheld cell phone use by all drivers (see Chapter 4, Section 1.1). Effectiveness: There are no evaluations of the effects of cell phone prohibitions in GDL laws. Costs: Once GDL is in place, a cell phone restriction can be implemented at very little cost. Time to implement: GDL requirement changes typically require at least six months to notify the public and implement the changes.
6 - 12
1.7 GDL Provisional License Violation Penalties Effectiveness: Uncertain Use: High Cost: Low Time: Medium Probationary licensing preceded graduated licensing. Probationary licensing had no provisional phase, so that beginning drivers received a full and unrestricted license after their learner’s permit. However, the initial full licensure period was probationary in that the license could be revoked or suspended, or some driver improvement actions could be required, at a lower threshold than for drivers with a standard non-probationary license (Simpson, 2003). The probationary feature has been included in the provisional phase of graduated licensing, typically by delaying full licensure until the provisional licensee has demonstrated a good driving record. For example, the NCUTLO model law recommends a six-month period free of all traffic violation convictions before full licensure (NCUTLO, 2000). Use: Almost all States penalize some GDL or traffic law violations by delaying full licensure (IIHS and TIRF, 2004). Effectiveness: The few evaluations of early stand-alone probationary license systems generally found no substantial benefits (McKnight and Peck, 2003; Simpson, 2003). No recent evaluations have attempted to separate out the effect of penalties for GDL or other traffic law violations from the overall effects of GDL (see Chapter 6, Section 1.1). Two studies evaluated the effects on young drivers of lower-threshold driver improvement actions, with mixed results (NCHRP, under review, Strategy A4). Costs: Once GDL is in place, penalties for violating its provisions can be changed at very little cost. Time to implement: GDL requirement changes typically require at least six months to notify the public and implement the changes.
6 - 13
2.1 Pre-licensure Driver Education Effectiveness: None Use: Unknown Cost: High Time: Long Driver education has long been advocated and used to teach both driving skills and safe driving practices. Driver education in high schools grew in popularity in the 1950s, using a standard curriculum of at least 30 hours classroom instruction and 6 hours on-the-road driving practice. By about 1970, approximately 14,000 high schools taught driver education to about 70 percent of all eligible teenagers. Many States and insurance companies encouraged driver education: States licensed graduates at an earlier age and insurance companies reduced auto insurance premiums for graduates. During the 1980s driver education offerings decreased as State and Federal funding for driver education decreased. By the early 1990s fewer than half of all high schools offered driver education and the majority of beginning drivers did not take driver education. See Smith (1994) for a concise review of the history of driver education in the United States. The evaluations to date find that driver education does not improve safety. Roberts et al. (2001) concluded from three well-designed evaluations in Australia, New Zealand, and the United States that driver education lowers the age at which teenagers become licensed but does not affect their crash rates once they do become licensed. The net effect of driver education is to increase crashes because it puts more young drivers on the road. Vernick et al. (1999) reached the same conclusion from a review of nine studies, eight from the United States and one from Australia. The study most familiar in the United States is the extensive NHTSA-sponsored study in DeKalb County, Georgia, in the late 1970s. Over 16,000 students were randomly assigned to three groups: standard driver education; an 80-hour long course including classroom, simulation, driving range, and on-the-road components; and a control group of no formal driver education. The initial analysis found no significant difference in crashes or traffic violations among the three groups (Smith, 1994). A second analysis, which tracked the students’ driving records for a longer period of time, found a slight crash reduction for standard course graduates during their first months of driving only, and no difference between the long course and no course graduates (Smith, 1994). See Vernick (1999) for brief summaries of all DeKalb study analyses. Based primarily on these results, NHTSA dropped driver education from its list of priority highway safety program areas for States (Smith, 1994). NHTSA concluded that driver education should be integrated into a GDL program. It also concluded that driver education should be “distributed over time.” NHTSA proposed a two-stage driver education system, both prelicensure and postlicensure. See Chapter 6, Section 2.2, for further discussion. As of August 2004, over half the States encouraged driver education by lowering the minimum provisional or unrestricted licensing age for driver education graduates, and a few States reduce the required number of supervised driving hours (IIHS and TIRF, 2004). Based on the evaluation data discussed above, these driver education “discounts” likely increase rather than reduce crashes. A recent study in British Columbia supports this conclusion. Crash rates were 27 percent higher for driver education graduates, who reduced their learner’s permit holding period by three months, than for non-graduates (Wiggins, 2004). Two other studies scheduled for release in 2005 are examining the same issue (Hedlund and Compton, 2005).
6 - 14
Use: There is no current data on the number of high schools that offer driver education or the number of teenagers who complete a driver education course. NHTSA and the American Driver and Traffic Safety Education Association (ADTSEA) plan to acquire this data shortly (Hedlund and Compton, 2005). There also is no data on commercial driver education courses or students. Effectiveness: Driver education leads to earlier licensure but does not reduce crash rates (Roberts et al, 2001; Vernick et al., 1999). Costs: Even a minimal driver education course of 30 hours in the classroom and 6 hours on the road requires extensive funds. Driver education also requires students to find time for it in their schedules of high school classes, extracurricular and summer activities, and jobs. Time to implement: A driver education course requires at least a year to plan and implement.

6 - 15
2.2 Post-licensure or Advanced Driver Education Effectiveness: Unknown Use: Low Cost: High Time: Long As discussed in Chapter 6, Section 2.1, standard prelicensure driver education leads to earlier licensure but does not reduce crash rates. Based on this conclusion, recent driver education research has sought to develop postlicensure driver education curricula and to integrate driver education with GDL (Smith, 1994). Previous postlicensure driver education courses were remedial, directed at drivers who had accumulated enough violations or crashes to warrant some attention. For this audience, driver education had no effect (Ker et al., 2004). Christie and colleagues have developed a model “best practice” curriculum for provisional drivers with at least six months of driving experience (Christie et al., 2004) in Australia. The 8-hour curriculum consists of eight modular sessions with a mentor or coach, including one-on-one driving and discussion, group observation and discussion of driving behavior, and telephone follow-up. A trial involving 14,000 provisional drivers, funded by a consortium of government bodies, insurers, industry groups, and automobile clubs, will be conducted in New South Wales and Victoria beginning in 2005. NHTSA is conducting a feasibility study in anticipation of a major evaluation of the benefits of an integrated driver education and GDL program (Hedlund and Compton, 2005). Use: Postlicensure driver education is still under development and is not in regular use in any State. Effectiveness: Postlicensure driver education has not yet been evaluated. Costs: If a postlicensure driver education program proves to be effective, it likely will require substantial funds to implement. Time to implement: Any course requires at least a year to plan and implement.
6 - 16
3.1 Parental Role in Teaching and Managing Young Drivers Effectiveness: Varies Use: Medium Cost: Low Time: Short Most parents are heavily involved in teaching driving skills to their beginning teenage drivers and supervising their driving while they have a learner’s permit. Parents are in the best position to enforce GDL restrictions for provisional drivers, and many parents impose additional driving restrictions on their teenagers. Parents strongly support GDL. But many parents do not understand the dangers of high-risk situations, such as driving with teenage passengers. Parents could use guidance and assistance in teaching and managing their teenage drivers (Hedlund et al., 2003; NCHRP, under review, Strategies C1-C4). Several programs to assist parents and beginning drivers have been developed recently. Four examples follow. The first, Checkpoints, is the only one with any evaluation data. There is no data yet on whether any of these programs reduces crashes. The central feature of the Checkpoints program, developed by Simons-Morton and colleagues at the National Institute of Child Health and Human Development, is a written agreement that parents and teens sign. The agreement limits teens' driving under various higher-risk situations, such as driving at night, with other teens in the car, or in bad weather. A supporting video and periodic newsletter explain the risks that new drivers face and reinforce the need for parents to limit their newly licensed teens' driving under these risky conditions (Simons-Morton and Hartos, 2003). Driving Skills for Life, developed by Ford and GHSA, emphasizes four skills: hazard recognition, vehicle handling, space management, and speed management (Ford and GHSA, 2003). The program’s educational kit includes a video, guide, and brochure, and the Web site contains on-line learning material and parental tips and coaching guide. It has been sent to every public high school in the United States and the materials have reached an estimated 4 million teenagers and their parents. Road Ready Teens, developed by DaimlerChrysler together with AAA, MADD, and the National Safety Council, provides a parent’s guide, a parent-teen contract, and a video game and Road Ready Reality Check quiz for teens (DaimlerChrysler, 2003). The National Safety Council released its 68-page book, Teen Driver: A Family Guide to Teen Driver Safety, in 2004 (NSC, 2004). The book provides information and advice to parents and teens on crash risks, how to develop a family plan and written agreement for beginning drivers, and GDL components and restrictions. Use: Checkpoints is still being tested and has not been released to the general public. Teen Driver has been distributed to individual families upon request. Driving Skills for Life and Road Ready Teens are available on the Web. Effectiveness: Results from testing in several States show that the Checkpoints program increased parents’ restrictions on teen driving (Simons-Morton and Hartos, 2003; Simons-Morton et al., 2005). None of the other programs have been evaluated.
6 - 17
Two other parental assistance programs have been evaluated and were not successful. Each sent information on driving instruction and driving management to parents of teens who had just received their learner’s permits. Parents said that the information was helpful, but used the information in only a general way. The information had no effect on the amount or type of supervised driving during the learner’s stage nor on parental restrictions on driving after licensure (Hedlund and Compton, 2005). Costs: Driving Skills for Life and Road Ready Teens are available on the Web at no cost. Teen Driver is available to parents and teenagers at minimal cost. Time to implement: The Checkpoints program has not been released for use by the general public. The other three programs are available immediately.
6 - 18
4.1 Enforcement of GDL and Zero-Tolerance Laws Effectiveness: Likely Use: Unknown Cost: Medium Time: Short Two traffic laws apply only to young drivers: GDL laws and zero-tolerance laws that set a maximum BAC of .02 or less for drivers under the age of 21. As discussed in Chapter 1, Section 6.2, zero-tolerance laws are not actively publicized or enforced. It’s likely that increased publicity and enforcement would reduce teenage drinking and driving. GDL laws, discussed in Chapter 6, Sections 1.1-1.7, also appear not to be enforced vigorously. Some GDL provisions such as nighttime driving restrictions are inherently difficult to enforce because violations are difficult to detect (Hedlund et al, 2003). A recent study in one State found that provisionally licensed drivers and their parents were quite aware of their GDL law’s nighttime and passenger restrictions. Both restrictions were violated, though not frequently. Teenagers expressed little concern regarding GDL enforcement. Law enforcement officers were not familiar with GDL details and considered GDL enforcement a low priority (Hedlund and Compton, 2005). Parents are in the best position to enforce GDL requirements (Chapter 6, Section 3.1). However, some law enforcement support for GDL nighttime driving and teenage passenger restrictions may be useful to emphasize that the requirements are serious. GDL law violations are penalized by driver license actions, such as suspension or revocation of the learner’s permit or provisional license or an extension of the time before full licensure. This means that they can be applied administratively and do not involve criminal court proceedings. As noted in Chapter 1, Section 6.2, administrative penalties for zero-tolerance laws are far easier to enforce than criminal penalties. Use: The amount of enforcement of zero-tolerance and GDL laws is unknown but probably is low. Effectiveness: Zero-tolerance-law publicity and enforcement likely will reduce teenage drinking and driving, as discussed in Chapter 1, Section 6.2. A 2005 study is investigating whether well-publicized enforcement, including checkpoints near high schools, can increase compliance with GDL provisions (Hedlund and Compton, 2005). Costs: See Chapter 1, Section 6.2, for zero-tolerance law enforcement strategies and costs. GDL law enforcement costs will depend on how the enforcement is conducted. Enforcement through regular patrols will require moderate costs for training. Special patrols or checkpoints will require additional staff time. All enforcement will require good publicity to both teens and parents. Publicity to teens can be delivered through high schools, colleges, recreational venues attended by youth, and media directed to youth. Time to implement: Enforcement programs can be implemented within three or four months, as soon as appropriate training, publicity, and equipment are in place.
6 - 19
Young Driver References AAA (2005). GDL Laws. Heathrow, FL: AAA Public Affairs. Christie, R., Harrison, W., and Johnston, D. (2004). Development of a Novice Driver Education Curriculum for the ATSB. Report CR 222. Canberra, Australia: Australian Transport Safety Bureau. www.atsb.gov.au/road/res-exec/cr222ex.cfm DaimlerChrysler (2003). Road Ready Teens. Auburn Hills, MI: DaimlerChrysler. www.roadreadyteens.org/index.html Ferguson, S.A. (2003). Other high-risk factors for young drivers - how graduated licensing does, doesn’t, or could address them. Journal of Safety Research 34(1), pp. 71-77. www.nsc.org/gdlsym/index.htm Ford and GHSA (2003). Driving Skills for Life. Dearborn, MI: Ford Motor Company. www.drivingskillsforlife.com/ Foss, R., and Goodwin, A. (2003). Enhancing the effectiveness of graduated driver licensing legislation. Journal of Safety Research 34(1), pp. 79-84. www.nsc.org/gdlsym/index.htm GHSA (2005). Cell Phone Restrictions - State and Local Jurisdictions. Washington, DC: Governors Highway Safety Association. www.Statehighwaysafety.org/html/Stateinfo/laws/cellphone_laws.html Glassbrenner, D. (2004). Safety Belt Use in 2004: Use Rates in the States and Territories. DOT HS 809 813. Washington DC: National Highway Traffic Safety Administration. www.nhtsa.dot.gov/people/injury/SafetyBelt/SafetyBeltUse_2004/ Hartling, L., Wiebe, N., Russell, K., Petruk, J., Spinola, C., and Klassen, T.P. (2004). Graduated driver licensing for reducing motor vehicle crashes among young drivers. The Cochrane Database of Systematic Reviews 2004, Issue 2. www.cochrane.org/cochrane/revabstr/AB003300.htm Hedlund, J., and Compton, R. (2004). Graduated driver licensing research in 2003 and beyond. Journal of Safety Research 35(1), pp. 5-11. Hedlund, J., and Compton, R. (2005). Graduated driver licensing research in 2004 and 2005. Journal of Safety Research 36 (1), pp. 4-14. Hedlund, J., Shults, R.A., and Compton, R. (2003). What we know, what we don’t know, and what we need to know about graduated driver licensing. Journal of Safety Research 34(1), pp. 107-115. www.nsc.org/gdlsym/index.htm

6 - 20
IIHS (2005). Fatality Facts 2003: Teenagers. Arlington, VA: Insurance Institute for Highway Safety. 12.4.65.102/safety_facts/fatality_facts/teenagers.htm IIHS and TIRF (2004). Graduated Licensing: A Blueprint for North America. Arlington, VA: Insurance Institute for Highway Safety. http://www.hwysafety.org/research/topics/pdf/blueprint.pdf Ker, K., Roberts, I., Collier, T., Beyer, F., Bunn, F., and Frost, C. (2005). Post-license driver education for the prevention of road traffic crashes: a systematic review of randomised controlled trials. Accident Analysis and Prevention 37(2), pp. 305-313, Nutrition and Public Health Intervention Research Unit, London School of Hygiene and Tropical Medicine, Keppel Street, London, U.K.. Lin, M-L., and Fearn, K.T. (2003). The provisional license: nighttime and passenger restrictions -- a literature review. Journal of Safety Research 34(1), pp. 51-61. www.nsc.org/gdlsym/index.htm Mayhew, D. (2003). The learner’s permit. Journal of Safety Research 34(1), pp. 35-43. www.nsc.org/gdlsym/index.htm McKnight, A.J., and Peck, R.C. (2003). Graduated driver licensing and safer driving. Journal of Safety Research 34(1), pp. 85-89. www.nsc.org/gdlsym/index.htm NCHRP Report 500 (under review). A Guide for Addressing Collisions Involving Young Drivers. Washington, DC: Transportation Research Board. www.ch2m.com/nchrp/over/default.htm NCUTLO (2000). Graduated Driver Licensing Model Law. Alexandria, VA: National Committee on Uniform Traffic Laws and Ordinances. www.ncutlo.org/gradlaw2.html NHTSA (2004). Traffic Safety Facts 2003: Young Drivers. DOT HS 809 774. Washington, DC: National Highway Traffic Safety Administration. www-nrd.nhtsa.dot.gov/pdf/nrd-30/NCSA/TSF2003/809774.pdf NHTSA (2005). Traffic Safety Facts 2003. DOT HS 809 775. Washington, DC: National Highway Traffic Safety Administration. www-nrd.nhtsa.dot.gov/pdf/nrd-30/NCSA/TSFAnn/TSF2003.pdf NHTSA and NIAAA (1999). Sentencing and Dispositions of Youth DUI and Other Alcohol Offenses: A Guide for Judges and Prosecutors. DOT HS 808 891. Washington, DC: National Highway Traffic Safety Administration. NSC (2004). Teen Driver: A Family Guide to Teen Driver Safety. Itasca, IL: National Safety Council. www.nsc.org/issues/teendriving/guide.htm

6 - 21
Roberts, I., Kwan, I., and the Cochrane Injuries Group Driver Education Reviewers (2001). School based driver education for the prevention of traffic crashes. The Cochrane Database of Systematic Reviews. www.cochrane.org/cochrane/revabstr/AB003201.htm Shope, J.T., and Molnar, L.J. (2003). Graduated driver licensing in the United States: evaluation results from the early programs. Journal of Safety Research 34(1), pp. 63-69. www.nsc.org/gdlsym/index.htm Simons-Morton, B.G., and Hartos, J.L. (2003). How well do parents manage young driver crash risks? Journal of Safety Research 34(1), pp. 91-97. www.nsc.org/gdlsym/index.htm Simons-Morton, B.G., Hartos, J.L., Leaf, W.A., and Preusser, D. (2005). The persistence of effects of the Checkpoints Program on parental restrictions of teen driving privileges. American Journal of Public Health 95(3), pp. 447-452. Simpson, H.M. (2003). The evolution and effectiveness of graduated licensing. Journal of Safety Research 34(1), pp. 25-34. www.nsc.org/gdlsym/index.htm Smith, M.F. (1994). Research Agenda for an Improved Novice Driver Education Program. Report to Congress, May 31, 1994. DOT HS 808 161. Washington, DC: National Highway Traffic Safety Administration. www.nhtsa.dot.gov/people/injury/research/pub/drive-ed.pdf Vernick, J.S., Li, G., Ogaitis, S., MacKenzie, E.J., Baker, S.P., and Gielen, A.C. (1999). Effects of high school driver education on motor vehicle crashes, violations, and licensure. American Journal of Preventive Medicine 16(1S), pp. 40-46. www.oshweb.com/s/AFRT-542JXK-01 Wiggins, S. (2004). Graduated Licensing Program: Interim Evaluation Report - Year 3. Victoria, BC: Insurance Corporation of British Columbia. www.icbc.com Williams, A.F. (2003). Teenage drivers: patterns of risk. Journal of Safety Research 34(1), pp. 5-15. www.nsc.org/gdlsym/index.htm Williamson, E. (2005). Parents Hand Out Keys, and a Monitoring Device. Washington Post, March 2, 2005, p. A1. www.washingtonpost.com/wp-dyn/articles/A64176-2005Mar1.html
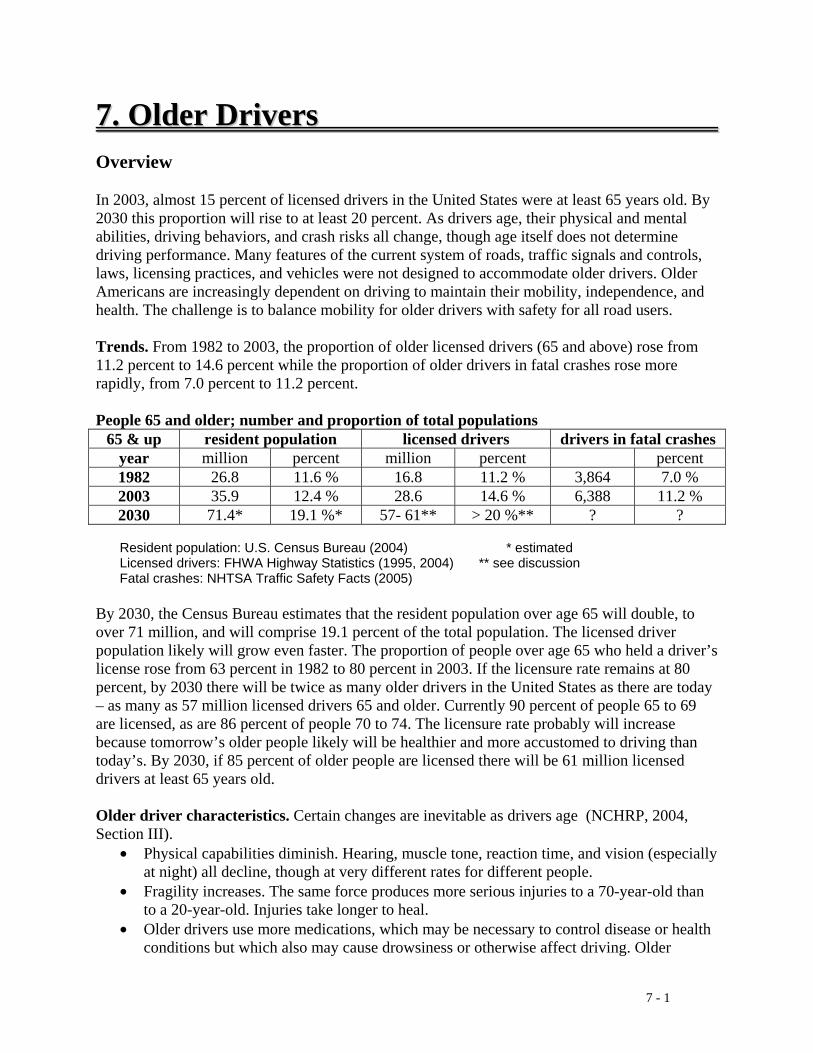
7 - 1
77.. OOllddeerr DDrriivveerrss Overview In 2003, almost 15 percent of licensed drivers in the United States were at least 65 years old. By 2030 this proportion will rise to at least 20 percent. As drivers age, their physical and mental abilities, driving behaviors, and crash risks all change, though age itself does not determine driving performance. Many features of the current system of roads, traffic signals and controls, laws, licensing practices, and vehicles were not designed to accommodate older drivers. Older Americans are increasingly dependent on driving to maintain their mobility, independence, and health. The challenge is to balance mobility for older drivers with safety for all road users. Trends. From 1982 to 2003, the proportion of older licensed drivers (65 and above) rose from 11.2 percent to 14.6 percent while the proportion of older drivers in fatal crashes rose more rapidly, from 7.0 percent to 11.2 percent. People 65 and older; number and proportion of total populations
65 & up resident population licensed drivers drivers in fatal crashes year million percent million percent percent 1982 26.8 11.6 % 16.8 11.2 % 3,864 7.0 % 2003 35.9 12.4 % 28.6 14.6 % 6,388 11.2 % 2030 71.4* 19.1 %* 57- 61** > 20 %** ? ?
Resident population: U.S. Census Bureau (2004) * estimated
Licensed drivers: FHWA Highway Statistics (1995, 2004) ** see discussion Fatal crashes: NHTSA Traffic Safety Facts (2005) By 2030, the Census Bureau estimates that the resident population over age 65 will double, to over 71 million, and will comprise 19.1 percent of the total population. The licensed driver population likely will grow even faster. The proportion of people over age 65 who held a driver’s license rose from 63 percent in 1982 to 80 percent in 2003. If the licensure rate remains at 80 percent, by 2030 there will be twice as many older drivers in the United States as there are today – as many as 57 million licensed drivers 65 and older. Currently 90 percent of people 65 to 69 are licensed, as are 86 percent of people 70 to 74. The licensure rate probably will increase because tomorrow’s older people likely will be healthier and more accustomed to driving than today’s. By 2030, if 85 percent of older people are licensed there will be 61 million licensed drivers at least 65 years old. Older driver characteristics. Certain changes are inevitable as drivers age (NCHRP, 2004, Section III).
• Physical capabilities diminish. Hearing, muscle tone, reaction time, and vision (especially at night) all decline, though at very different rates for different people.
• Fragility increases. The same force produces more serious injuries to a 70-year-old than to a 20-year-old. Injuries take longer to heal.
• Older drivers use more medications, which may be necessary to control disease or health conditions but which also may cause drowsiness or otherwise affect driving. Older
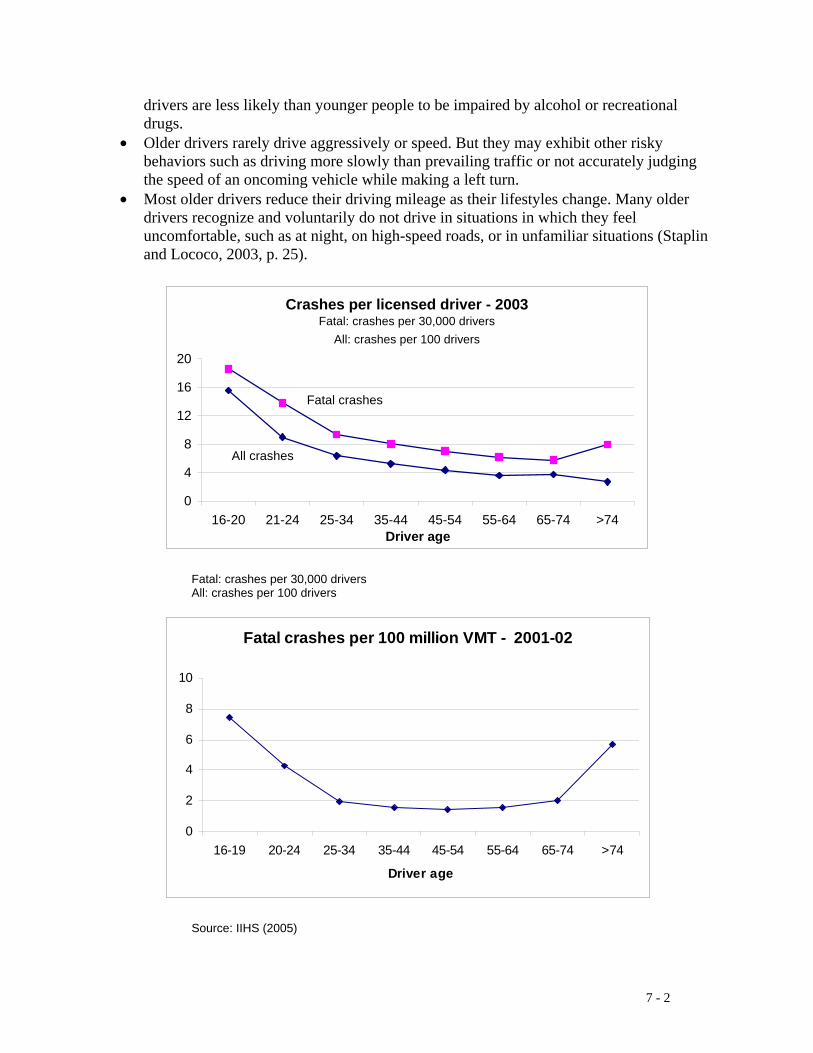
7 - 2
drivers are less likely than younger people to be impaired by alcohol or recreational drugs.
• Older drivers rarely drive aggressively or speed. But they may exhibit other risky behaviors such as driving more slowly than prevailing traffic or not accurately judging the speed of an oncoming vehicle while making a left turn.
• Most older drivers reduce their driving mileage as their lifestyles change. Many older drivers recognize and voluntarily do not drive in situations in which they feel uncomfortable, such as at night, on high-speed roads, or in unfamiliar situations (Staplin and Lococo, 2003, p. 25).
Fatal: crashes per 30,000 drivers All: crashes per 100 drivers
Source: IIHS (2005)
Crashes per licensed driver - 2003Fatal: crashes per 30,000 drivers
All: crashes per 100 drivers
0
4
8
12
16
20
16-20 21-24 25-34 35-44 45-54 55-64 65-74 >74Driver age
All crashes
Fatal crashes
Fatal crashes per 100 million VMT - 2001-02
0
2
4
6
8
10
16-19 20-24 25-34 35-44 45-54 55-64 65-74 >74
Driver age
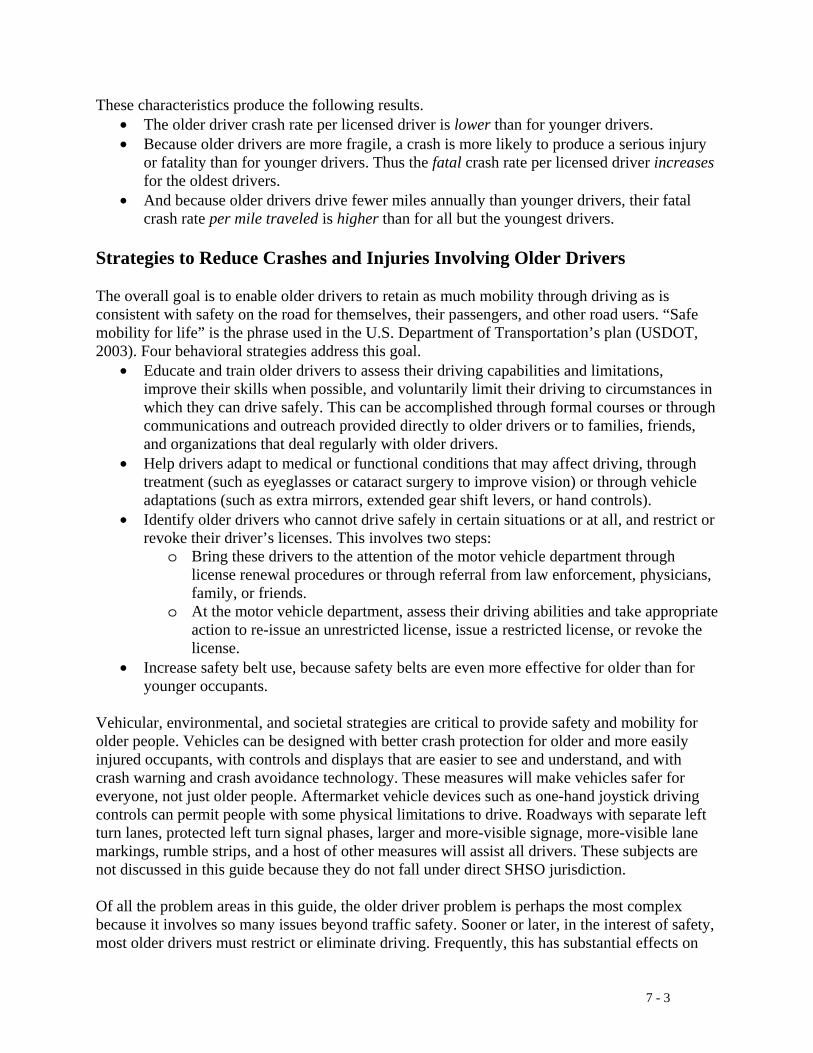
7 - 3
These characteristics produce the following results. • The older driver crash rate per licensed driver is lower than for younger drivers. • Because older drivers are more fragile, a crash is more likely to produce a serious injury
or fatality than for younger drivers. Thus the fatal crash rate per licensed driver increases for the oldest drivers.
• And because older drivers drive fewer miles annually than younger drivers, their fatal crash rate per mile traveled is higher than for all but the youngest drivers.
Strategies to Reduce Crashes and Injuries Involving Older Drivers The overall goal is to enable older drivers to retain as much mobility through driving as is consistent with safety on the road for themselves, their passengers, and other road users. “Safe mobility for life” is the phrase used in the U.S. Department of Transportation’s plan (USDOT, 2003). Four behavioral strategies address this goal.
• Educate and train older drivers to assess their driving capabilities and limitations, improve their skills when possible, and voluntarily limit their driving to circumstances in which they can drive safely. This can be accomplished through formal courses or through communications and outreach provided directly to older drivers or to families, friends, and organizations that deal regularly with older drivers.
• Help drivers adapt to medical or functional conditions that may affect driving, through treatment (such as eyeglasses or cataract surgery to improve vision) or through vehicle adaptations (such as extra mirrors, extended gear shift levers, or hand controls).
• Identify older drivers who cannot drive safely in certain situations or at all, and restrict or revoke their driver’s licenses. This involves two steps:
o Bring these drivers to the attention of the motor vehicle department through license renewal procedures or through referral from law enforcement, physicians, family, or friends.
o At the motor vehicle department, assess their driving abilities and take appropriate action to re-issue an unrestricted license, issue a restricted license, or revoke the license.
• Increase safety belt use, because safety belts are even more effective for older than for younger occupants.
Vehicular, environmental, and societal strategies are critical to provide safety and mobility for older people. Vehicles can be designed with better crash protection for older and more easily injured occupants, with controls and displays that are easier to see and understand, and with crash warning and crash avoidance technology. These measures will make vehicles safer for everyone, not just older people. Aftermarket vehicle devices such as one-hand joystick driving controls can permit people with some physical limitations to drive. Roadways with separate left turn lanes, protected left turn signal phases, larger and more-visible signage, more-visible lane markings, rumble strips, and a host of other measures will assist all drivers. These subjects are not discussed in this guide because they do not fall under direct SHSO jurisdiction. Of all the problem areas in this guide, the older driver problem is perhaps the most complex because it involves so many issues beyond traffic safety. Sooner or later, in the interest of safety, most older drivers must restrict or eliminate driving. Frequently, this has substantial effects on
7 - 4
the older driver’s mobility and on physical and mental health. SHSOs and licensing agencies cannot act alone but must plan and implement their older driver policies and programs as part of integrated community activities to improve older people’ safety, mobility, and health. As just one example, some communities have established referral centers where people can go for “one-stop” access to resources for addressing the full range of transportation safety and mobility issues, including driving skills assessment, educational courses, licensing regulations and practices, and public transportation. See Stutts (2005, Chapter 8) for summaries of comprehensive programs for older drivers in five States. Several recent studies and policy papers discuss the issues involved. See in particular the Department of Transportation’s Safe Mobility for a Maturing Society: Challenges and Opportunities (USDOT, 2003) and NCHRP’s Guide for Addressing Collisions Involving Older Drivers (NCHRP, 2004) for excellent summaries and references to further information. OECD’s Ageing and Transport: Mobility Needs and Safety Issues (OECD, 2001) presents a discussion from a European perspective. The recent NCHRP synthesis, Improving the Safety of Older Road Users (Stutts, 2005), summarizes State activities as of 2005.
Key terms • AAA: formerly the American Automobile Association; the organization now uses only
the initials • AAMVA: American Association of Motor Vehicle Administrators • AARP: formerly the American Association of Retired Persons; the organization now uses
only the initials • AMA: American Medical Association • ASA: American Society on Aging • Older driver: a driver at least 65 years old.
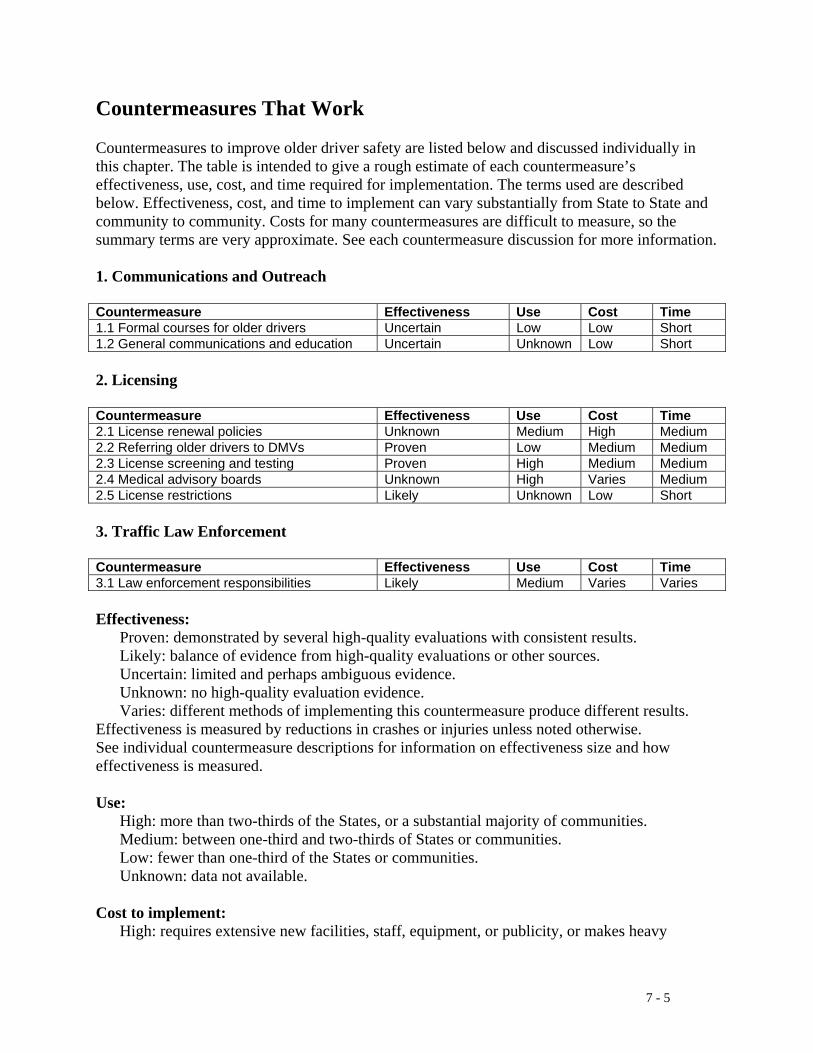
7 - 5
Countermeasures That Work Countermeasures to improve older driver safety are listed below and discussed individually in this chapter. The table is intended to give a rough estimate of each countermeasure’s effectiveness, use, cost, and time required for implementation. The terms used are described below. Effectiveness, cost, and time to implement can vary substantially from State to State and community to community. Costs for many countermeasures are difficult to measure, so the summary terms are very approximate. See each countermeasure discussion for more information. 1. Communications and Outreach Countermeasure Effectiveness Use Cost Time 1.1 Formal courses for older drivers Uncertain Low Low Short 1.2 General communications and education Uncertain Unknown Low Short
2. Licensing Countermeasure Effectiveness Use Cost Time 2.1 License renewal policies Unknown Medium High Medium 2.2 Referring older drivers to DMVs Proven Low Medium Medium 2.3 License screening and testing Proven High Medium Medium 2.4 Medical advisory boards Unknown High Varies Medium 2.5 License restrictions Likely Unknown Low Short 3. Traffic Law Enforcement Countermeasure Effectiveness Use Cost Time 3.1 Law enforcement responsibilities Likely Medium Varies Varies Effectiveness: Proven: demonstrated by several high-quality evaluations with consistent results. Likely: balance of evidence from high-quality evaluations or other sources. Uncertain: limited and perhaps ambiguous evidence. Unknown: no high-quality evaluation evidence. Varies: different methods of implementing this countermeasure produce different results. Effectiveness is measured by reductions in crashes or injuries unless noted otherwise. See individual countermeasure descriptions for information on effectiveness size and how effectiveness is measured. Use: High: more than two-thirds of the States, or a substantial majority of communities. Medium: between one-third and two-thirds of States or communities. Low: fewer than one-third of the States or communities. Unknown: data not available. Cost to implement: High: requires extensive new facilities, staff, equipment, or publicity, or makes heavy

7 - 6
demands on current resources. Medium: requires some additional staff time, equipment, facilities, and/or publicity. Low: can be implemented with current staff, perhaps with training; limited costs for equipment or facilities. Time to implement: Long: more than one year. Medium: more than three months but less than one year. Short: three months or less. These estimates do not include the time required to enact legislation or establish policies.
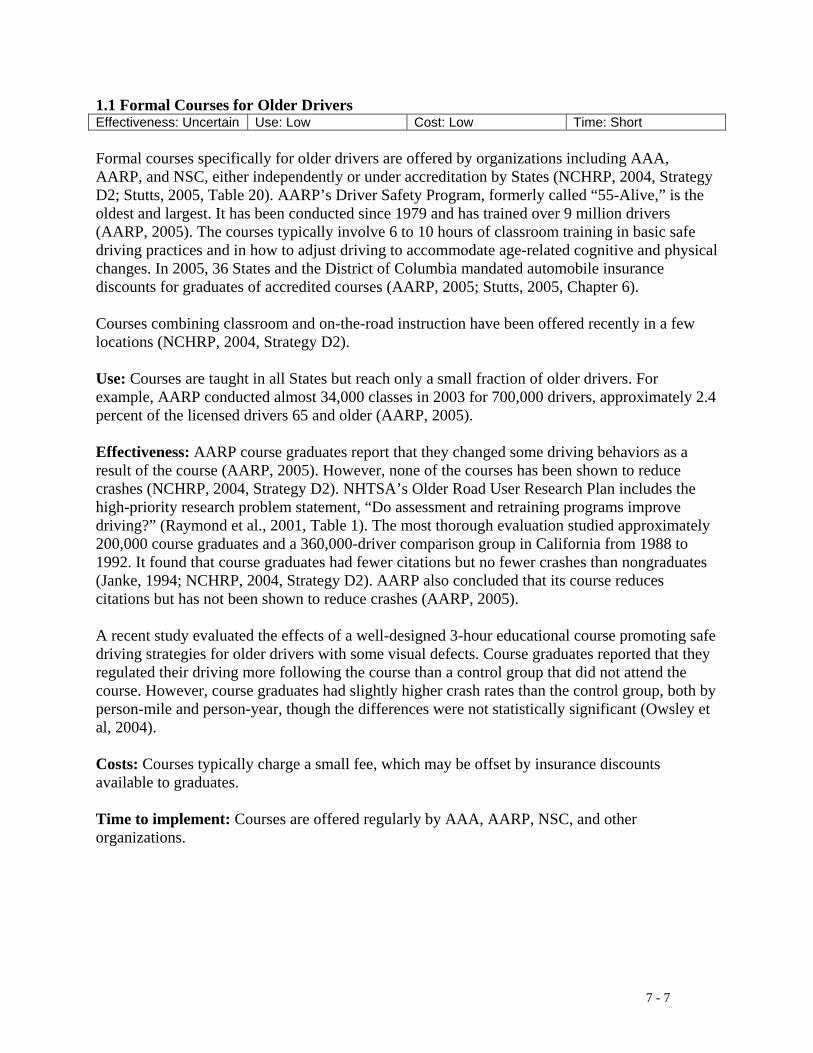
7 - 7
1.1 Formal Courses for Older Drivers Effectiveness: Uncertain Use: Low Cost: Low Time: Short Formal courses specifically for older drivers are offered by organizations including AAA, AARP, and NSC, either independently or under accreditation by States (NCHRP, 2004, Strategy D2; Stutts, 2005, Table 20). AARP’s Driver Safety Program, formerly called “55-Alive,” is the oldest and largest. It has been conducted since 1979 and has trained over 9 million drivers (AARP, 2005). The courses typically involve 6 to 10 hours of classroom training in basic safe driving practices and in how to adjust driving to accommodate age-related cognitive and physical changes. In 2005, 36 States and the District of Columbia mandated automobile insurance discounts for graduates of accredited courses (AARP, 2005; Stutts, 2005, Chapter 6). Courses combining classroom and on-the-road instruction have been offered recently in a few locations (NCHRP, 2004, Strategy D2). Use: Courses are taught in all States but reach only a small fraction of older drivers. For example, AARP conducted almost 34,000 classes in 2003 for 700,000 drivers, approximately 2.4 percent of the licensed drivers 65 and older (AARP, 2005). Effectiveness: AARP course graduates report that they changed some driving behaviors as a result of the course (AARP, 2005). However, none of the courses has been shown to reduce crashes (NCHRP, 2004, Strategy D2). NHTSA’s Older Road User Research Plan includes the high-priority research problem statement, “Do assessment and retraining programs improve driving?” (Raymond et al., 2001, Table 1). The most thorough evaluation studied approximately 200,000 course graduates and a 360,000-driver comparison group in California from 1988 to 1992. It found that course graduates had fewer citations but no fewer crashes than nongraduates (Janke, 1994; NCHRP, 2004, Strategy D2). AARP also concluded that its course reduces citations but has not been shown to reduce crashes (AARP, 2005). A recent study evaluated the effects of a well-designed 3-hour educational course promoting safe driving strategies for older drivers with some visual defects. Course graduates reported that they regulated their driving more following the course than a control group that did not attend the course. However, course graduates had slightly higher crash rates than the control group, both by person-mile and person-year, though the differences were not statistically significant (Owsley et al, 2004). Costs: Courses typically charge a small fee, which may be offset by insurance discounts available to graduates. Time to implement: Courses are offered regularly by AAA, AARP, NSC, and other organizations.
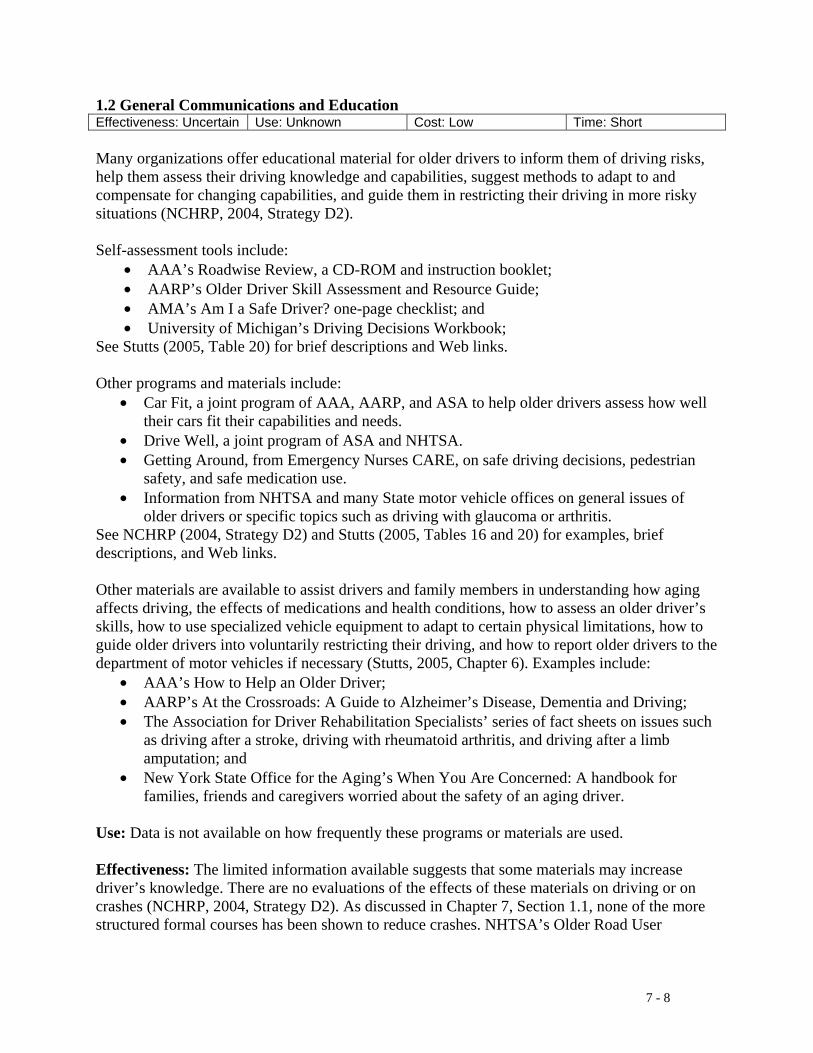
7 - 8
1.2 General Communications and Education Effectiveness: Uncertain Use: Unknown Cost: Low Time: Short Many organizations offer educational material for older drivers to inform them of driving risks, help them assess their driving knowledge and capabilities, suggest methods to adapt to and compensate for changing capabilities, and guide them in restricting their driving in more risky situations (NCHRP, 2004, Strategy D2). Self-assessment tools include:
• AAA’s Roadwise Review, a CD-ROM and instruction booklet; • AARP’s Older Driver Skill Assessment and Resource Guide; • AMA’s Am I a Safe Driver? one-page checklist; and • University of Michigan’s Driving Decisions Workbook;
See Stutts (2005, Table 20) for brief descriptions and Web links. Other programs and materials include:
• Car Fit, a joint program of AAA, AARP, and ASA to help older drivers assess how well their cars fit their capabilities and needs.
• Drive Well, a joint program of ASA and NHTSA. • Getting Around, from Emergency Nurses CARE, on safe driving decisions, pedestrian
safety, and safe medication use. • Information from NHTSA and many State motor vehicle offices on general issues of
older drivers or specific topics such as driving with glaucoma or arthritis. See NCHRP (2004, Strategy D2) and Stutts (2005, Tables 16 and 20) for examples, brief descriptions, and Web links. Other materials are available to assist drivers and family members in understanding how aging affects driving, the effects of medications and health conditions, how to assess an older driver’s skills, how to use specialized vehicle equipment to adapt to certain physical limitations, how to guide older drivers into voluntarily restricting their driving, and how to report older drivers to the department of motor vehicles if necessary (Stutts, 2005, Chapter 6). Examples include:
• AAA’s How to Help an Older Driver; • AARP’s At the Crossroads: A Guide to Alzheimer’s Disease, Dementia and Driving; • The Association for Driver Rehabilitation Specialists’ series of fact sheets on issues such
as driving after a stroke, driving with rheumatoid arthritis, and driving after a limb amputation; and
• New York State Office for the Aging’s When You Are Concerned: A handbook for families, friends and caregivers worried about the safety of an aging driver.
Use: Data is not available on how frequently these programs or materials are used. Effectiveness: The limited information available suggests that some materials may increase driver’s knowledge. There are no evaluations of the effects of these materials on driving or on crashes (NCHRP, 2004, Strategy D2). As discussed in Chapter 7, Section 1.1, none of the more structured formal courses has been shown to reduce crashes. NHTSA’s Older Road User
7 - 9
Research Plan includes the high-priority research problem statement, “Do assessment and retraining programs improve driving?” (Raymond et al., 2001, Table 1). Costs: Funds are required for producing and distributing materials. Time to implement: Materials and programs are available and ready for use. Other issues:
• Safety belt use: Safety belts are even more effective in preventing injuries and fatalities to older than to younger occupants (NCHRP, 2004, Strategy E1). While belt use among older occupants is high compared to other occupants - 81 percent for occupants 70 and older in 2003, compared to 80 percent for occupants 25 to 69 (Glassbrenner, 2004, Table 5) - one-fifth of older occupants are unbelted. Communications and outreach on the safety benefits of belt use may be more effective with older occupants than with younger because they may be more attentive to health and safety issues. However, no State or local safety belt use efforts directed at older occupants have been identified (NCHRP, 2004, Strategy E1).
7 - 10
2.1 License Renewal Policies: In-person Renewal, Vision Test Effectiveness: Unknown Use: Medium Cost: High Time: Medium Driver’s licenses in most States are valid for 4 to 6 years, longer in a few States. To renew an expiring license, drivers in many States must appear in person, pay the license fee, and have new pictures taken for their licenses. Some States require a vision test for license renewal. Some States allow some drivers to renew by mail or electronically. About half the States change license renewal requirements for drivers older than a specified age, typically 65 or 70. These changes may include a shorter interval between renewals, in-person renewal (no renewal by mail or electronically), or a vision test at every renewal. A very few States require written or road tests for some older renewal applicants. AAA (2005), IIHS (2004), and Stutts (2005, Chapter 5) summarize these requirements. AMA (2004, Chapter 8) and Staplin and Lococo (2003, Appendix B) provide more detail on the requirements in effect in 2001. License examiners report that the driver’s appearance at the motor vehicle office is the single most important criterion for identifying a person of any age whose driving skills may be impaired (NCHRP, 2004, Strategy C2). Frequent in-person renewals and vision tests may be more useful for older drivers than for younger drivers because their abilities may change more quickly. AAMVA recommends that all drivers renew licenses in person and pass a vision test at least every four years (Staplin and Lococo, 2003, p. 54; Stutts, 2005, Chapter 5). Very few States meet these recommendations for all drivers. About one-third of the States meet them for drivers over some specified age (AAA, 2005; IIHS, 2004). In-person renewals would be even more useful, for drivers of all ages, if they included functional ability tests as recommended in the NHTSA-AAMVA Model Driver Screening and Evaluation Program Guidelines for Motor Vehicle Administrators (Staplin and Lococo, 2003) (see Chapter 7, Section 2.3). Use: At least 22 States have different license renewal requirements for older than for younger drivers (AAA, 2005; IIHS, 2004; Stutts, 2005, Chapter 5). These include 14 States with a shorter interval between renewals, 6 States that require in-person renewals, and 10 that require vision tests at each renewal. About 15 States meet the AAMVA recommendations of in-person renewal, with a vision test, at least every 4 years for all drivers over some specified age (AAA, 2005; IIHS, 2004). Effectiveness: License examiners report that in-person renewals and vision tests are effective in identifying people whose driving skills may be impaired (NCHRP, 2004, Strategy C2). No data is available on the number of potentially impaired drivers identified through these practices or on the effects of more frequent renewals and vision tests on crashes. Costs: More-frequent license renewals or additional testing at renewal impose direct costs on driver licensing agencies. For example, a State that reduces the renewal time from 6 years to 3 years for drivers 65 and older would approximately double the licensing agency workload associated with these drivers. If 15 percent of licensed drivers in the State are 65 and older, then the agency’s overall workload would increase by about 15 percent to process the renewals. If more frequent renewals and vision tests identify more drivers who require additional screening and assessment, then additional costs are imposed. See Chapter 7, Section 2.3, for additional discussion.
7 - 11
Time to implement: A vision test requirement for renewal or a change in the renewal interval can be implemented within months. The new requirements will not apply to all drivers for several years, until all currently valid licenses have expired and drivers appear at the driver licensing agency for licensing renewal. Other issues:
• Age discrimination: A few States explicitly provide that age alone is not a justification for reexamining a driver’s qualifications (AAA, 2005). These States have the same license renewal interval for all drivers.
• Road tests and medical reports: Several Australian States require a medical report, a road test, or both for drivers over a specified age to renew their licenses. Langford et al. (2004) compared States with and without these requirements. They found that States with these requirements had higher older driver crash rates than States without them. They conclude that there are “no demonstrable road safety benefits” to requiring medical reports or road tests for older drivers.

7 - 12
2.2 Referring Older Drivers to Licensing Agencies Effectiveness: Proven Use: Low Cost: Medium Time: Medium Older drivers come to the attention of licensing agencies at regular license renewals, as discussed in Chapter 7, Section 2.1, or when they are referred to the licensing agency for re-evaluation of their driving skills. Licensing agencies in all States accept reevaluation referrals for drivers of any age. A survey of all State licensing agencies found that 85 percent of referrals came from three sources: 37 percent from law enforcement, 35 percent from physicians and other medical professionals, and 13 percent from family and friends (Stutts, 2005, Table 19). The remaining 15 percent came from crash and violation record checks, courts, self-reports, and other sources. Law enforcement officers have the opportunity to observe drivers directly at traffic stops or crashes. With appropriate training they can identify many drivers who should be referred to the licensing agency for assessment. NHTSA has developed and field-tested a set of cues that officers can use to identify potentially impaired drivers (NHTSA, 1998; Stutts, 2005, Chapter 7). A training video is available (NCHRP, 2004, Strategy C3). Physicians are in an excellent position to assess if changes in their patients’ physical or cognitive abilities may increase their crash risk. In addition to assessment, physicians should provide counseling and assistance on driving as needed and refer patients to the licensing agency if appropriate. In six States, physicians are required to report patients who have specific medical conditions such as epilepsy or dementia (NCHRP, 2004, Strategy C3). Other States require physicians to report “unsafe” drivers, with varying guidelines for defining “unsafe.” Physicians must balance their legal and ethical responsibilities to protect their patient’s physical and mental health and their patient confidentiality obligations with their duty to protect the general public from unsafe drivers. Physicians have been held liable for damages from crashes involving patients whom they failed to advise of medical conditions that may affect their driving or failed to report to the licensing agency (AMA, 2004, Chapter 7). NHTSA’s Physician’s Guide to Assessing and Counseling Older Drivers (NHTSA, 2003b), prepared in cooperation with the AMA, provides detailed information for physicians and medical professionals. Chapter 8 has an extensive summary of State licensing and reporting laws. Chapter 9 contains a list of medical conditions and medications that may impair driving and consensus recommendations on what action to take for each. Other chapters include information on treatment and rehabilitation options that may allow patients to continue to drive and on how to counsel patients about retiring from driving. See also Lococo (2003, Appendix C) for State-level information and NCHRP (2004, Strategy C3) for overall discussion. Many States have established procedures for family members and friends to report drivers of any age whose abilities may be impaired. NCHRP (2004, Strategy C3) provides examples and Web links for programs in Florida, Missouri, Minnesota, and Oregon. States can increase driver referrals by establishing and publicizing procedures for referring drivers, establishing referral policies and providing appropriate training and materials to law enforcement officers, and informing physicians and health professionals of their responsibilities.

7 - 13
Use: A survey of all State licensing agencies found that fewer than 100,000 drivers 65 and older are referred each year from all sources, or fewer than 0.4 percent of the 28.6 million older licensed drivers (Stutts, 2005, Appendix B.2). The number of referrals varies substantially across the States, from a few hundred to 50,000. Effectiveness: States that establish and publicize effective referral procedures will increase referrals substantially. NCHRP (2004, Strategy C3) provides examples and Web links. As one example, Pennsylvania increased physician referrals substantially by sending letters to all physicians (NCHRP, 2004, Strategy C3). Costs: Costs for establishing and publicizing effective referral procedures vary depending on the procedures adopted, but should not be extensive. Educational and training materials are available for use with law enforcement and medical professionals. Funds will be required to distribute these materials and for general communications and outreach. If referrals increase substantially, then licensing agency administrative costs will increase. Time to implement: States seeking to improve referrals will require at least six months to develop, implement, and publicize new policies and procedures.
7 - 14
2.3 License Screening and Testing Effectiveness: Proven Use: High Cost: Medium Time: Medium State licensing agencies vary considerably in their procedures for screening and evaluating a driver’s abilities and skills (NCHRP, 2004, Strategy C2). Many State guidelines are outdated, incomplete, or not based on actual functional impairment. Most do not include all the recommendations on medical conditions from the recent Physician’s Guide (NHTSA, 2003b). NHTSA and AAMVA recently published their Model Driver Screening and Evaluation Program Guidelines for Motor Vehicle Administrators (Staplin and Lococo, 2003). This was the final stage in a research program that investigated the relationships between functional impairment and driving skills; methods to screen for functional impairment; and the cost, time, legal, ethical, and policy implications of the guidelines (Staplin et al., 2003a). The Model Driver Guidelines’ goal is to keep drivers on the road as long as they are safe, through early identification and assessment together with counseling, remediation, and license restriction when needed (Staplin and Lococo, 2003, p. v). The guidelines outline a complete process of driver referral, screening, assessment, counseling, and licensing action (Staplin and Lococo, 2003, pp. 38-39). They include nine simple visual inspection tests that licensing agency personnel can administer to screen for functional ability (Staplin and Lococo, 2003, Table 2). A survey of State motor vehicle departments outlines some of the legal, policy, cost, and other criteria that must be met before the guidelines could be implemented in some States (Staplin and Lococo, 2003, Appendix C). The guidelines were tested in Maryland (Staplin et al., 2003b). Use: All States screen and test drivers referred to them, though their procedures and criteria vary considerably (NCHRP, 2004, Strategy C2). No State appears to have implemented the model guidelines. USDOT recommends that further testing and evaluation of the guidelines are needed (USDOT, 2003, p. 15). Effectiveness: There is substantial evidence that State screening and assessment programs identify some drivers who should not be driving at all or whose driving should be limited. The Maryland pilot test of the model guidelines concluded that “the analysis results ... have provided perhaps the best evidence to date that functional capacity screening, conducted quickly and efficiently, in diverse settings, can yield scientifically valid predictions about the risk of driving impairment experienced by older individuals” (Staplin et al., 2003b, Chapter 5). Costs: The model guideline functional screening tests can be administered for less than $5 per driver, including administrative and support service costs (Staplin et al., 2003a, p. 32). Time to implement: States should be able to modify their driver license screening and assessment procedures in four to six months.
7 - 15
2.4 Medical Advisory Boards Effectiveness: Unknown Use: High Cost: Varies Time: Medium Thirty-five States and the District of Columbia have medical advisory boards (MABs) to assist the licensing agencies in evaluating people with medical conditions or functional limitations that may affect their ability to drive (NCHRP, 2004, Strategy C1). MABs generally make policy recommendations on what licensing actions are appropriate for people with specific medical conditions or functional limitations. Most State MABs review individual cases, though this activity varies widely: 7 States reported that their MABs review 1,000 cases or more annually while another 7 review 10 or fewer cases (Lococo, 2003, Table D-6). In 2003, NHTSA and AAMVA surveyed MAB practices in all States. Lococo (2003) contains the results: detailed documentation of how each State’s medical review is organized; how drivers are identified, referred, screened, and assessed; and what licensing actions can be taken. MABs should play a key role in each State as the link between health care professionals, licensing agencies, law enforcement, and the public. They should take the lead in defining how various medical conditions and functional impairments affect driving; defining medical assessment and oversight standards; improving awareness and training for healthcare providers, law enforcement, and the public; advising health care professionals how drivers can compensate for certain medical conditions or functional impairments; and reviewing individual cases. AAA has developed its list of best practices and recommendations for MABs based on the NHTSA-AAMVA study findings (AAA, 2004). NTSB has made similar recommendations (NTSB, 2004). In June 2005, NHTSA released a summary of best practices for MABs and national medical guidelines for driving, prepared in collaboration with AAMVA (Lococo and Staplin, 2005). Use: 35 States and the District of Columbia have MABs, though some are inactive (NCHRP, 2004, Strategy C1). Effectiveness: There are no studies evaluating the effects of MABs. Maryland’s MAB reviewed over 500 individual cases in 2004 and recommended license suspension for about two-thirds of the cases (C. Soderstrom, personal communication, April 2005). Costs: MABs are comprised of physicians and other health care professionals together with appropriate administrative staff. Costs will be minimal for an MAB whose activities are limited to policy recommendations. Costs for an MAB that evaluates individual cases will depend on the caseload. Time to implement: States probably will need at least a year to establish and staff an MAB, depending on what duties the MAB undertakes. States likely can expand the functions of an existing MAB in six months.
7 - 16
2.5 License Restrictions Effectiveness: Likely Use: Unknown Cost: Low Time: Short If a State licensing agency determines through screening, assessment, medical referrals, road tests, or other means that a driver poses excessive risks only in certain situations, the driver can be issued a restricted license. This process of “graduated de-licensing” preserves the driver’s mobility while protecting the driver, passengers, and others on the road. Drivers whose vision is adequate during daylight hours but not at night present an obvious example. Their licenses can be restricted to daylight driving only. Other common restrictions limit driving to a specific geographical area, such as the town or county where the driver lives, or limit driving only to low-speed roads. Iowa issues restricted licenses as part of its overall older driver program (N. Chaudhary, personal communication, 2005). As an example, drivers referred to the licensing agency for retesting who feel uncomfortable taking a driving test in strange surroundings can arrange to be tested in their home towns. If they pass the test, they will be issued a license restricted to that town. About 2 percent of older drivers’ licenses in Iowa are restricted to daytime driving and another 2 percent to a limited geographic area. Use: Iowa and Utah are known to issue restricted licenses (N. Chaudhary, personal communication, 2005; Stutts, 2005, Chapter 5; Vernon et al., 2001). A survey of State licensing agencies found that two-thirds of the States said that restricted licenses would be feasible under current State policies, though two-thirds of these would require legislative changes before restricted licenses could be issued (Staplin and Lococo, 2003, Appendix C). The number of States that currently issue restricted licenses to older drivers is not known. Effectiveness: Several studies show that driver license restrictions lower the crash risk for these drivers, though their crash risk is still higher than for similar-age drivers with unrestricted licenses (NCHRP, 2004, Strategy C2; Vernon et al., 2001). Costs: Once drivers have been screened and assessed, the costs of issuing a restricted license are minimal. Time to implement: Restricted licenses can be implemented as soon as any needed policy or legislation changes are enacted.
7 - 17
3.1 Law Enforcement Responsibilities Effectiveness: Likely Use: Medium Cost: Varies Time: Varies Law enforcement plays three overall roles in improving the safety of older drivers: • Enforce traffic laws. In particular, active publicized enforcement of safety belt use laws can
help increase belt use for older drivers and occupants. See Chapter 7, Section 1.2, for discussion.
• Identify drivers with potential driving impairments and refer them to licensing agencies.
Traffic stops and crash investigations provide officers excellent opportunities to observe and evaluate driving behavior. See Chapter 7, Section 2.2, for discussion.
• Provide information and education. Law enforcement officers have formed many partnerships
with public and private organizations to give talks, teach safe driving courses, work with media on news stories and PSAs, and other communications and outreach initiatives. Stutts (2005, Chapter 7) summarizes several examples. NHTSA (2003a) lists law enforcement programs that were active in 2003. They include training for officers, training for older drivers, and community relations programs that promote safety.
Use: NHTSA (2003a) describes older driver programs in 28 States. Effectiveness: Enforcement activities, such as high-visibility safety belt law enforcement, probably affect older drivers even more than other drivers. Law enforcement provides more than one-third of all referrals to licensing agencies for driver screening and assessment (Chapter 7, Section 2.2). Costs: Costs vary depending on the nature and scope of activities. Time to implement: Implementation time varies depending on the nature and scope of activities.
7 - 18
Older driver references AAA (2004). AAA Basic Best Practices for Medical Advisory/Review Boards. Heathrow, FL: American Automobile Association. www.aaanewsroom.net/Files/seniorbestpractices.doc AAA (2005). Senior Licensing Laws. Heathrow, FL: American Automobile Association. www.aaapublicaffairs.com/Main.asp?CategoryID=3&SubCategoryID=38& AARP (2005). Driver Safety. Washington, DC: AARP. www.aarp.org/life/drive/ FHWA (1995). Licensed Drivers by Sex and Age Group, 1963-1995. Washington, DC: Federal Highway Administration. www.fhwa.dot.gov/ohim/summary95/dl220.pdf FHWA (2004). Distribution of Licensed Drivers 2003; Table DL-20. Highway Statistics 2003. Washington, DC: Federal Highway Administration. www.fhwa.dot.gov/policy/ohim/hs03/htm/dl20.htm Glassbrenner, D. (2004). Safety Belt Use in 2003 - Demographic Characteristics. DOT HS 809 729. Washington, DC: National Highway Traffic Safety Administration. www.nhtsa.dot.gov/people/injury/airbags/809729.pdf IIHS (2004). U.S. Driver Licensing Renewal Procedures for Older Drivers. Arlington, VA: Insurance Institute for Highway Safety. www.hwysafety.org/safety_facts/State_laws/older_drivers.htm IIHS (2005). Fatality Facts 2003: Older People. Arlington, VA: Insurance Institute for Highway Safety. www.hwysafety.org/safety%5Ffacts/fatality%5Ffacts/pdfs/olderpeople.pdf Janke, M.K. (1994). The Mature Driver Improvement Program in California. Sacramento, CA: California Department of Motor Vehicles. Langford, J., Fitzharris, M., Koppell, S., and Newstead, S. (2004). Effectiveness of mandatory license testing for older drivers in reducing crash risk among urban older Australian drivers. Traffic Injury Prevention 5(4), pp. 326-335. Lococo, K.H. (2003). Summary of Medical Advisory Board Practices in the United States. Washington, DC: U.S. Department of Transportation. www.aamva.org/drivers/drvProblemDriversMedicalAdvisoryBoardPractices.asp Lococo, K.H., and Staplin, L. (2005). Strategies for Medical Advisory Boards and Licensing Review. DOT HS 809 874. Washington, DC: National Highway Traffic Safety Administration. www.nhtsa.dot.gov/people/injury/research/MedicalAdvisory/pages/Job%201602%20-%20final%20new.pdf
7 - 19
NCHRP Report 500, Vol. 9 (2004). A Guide for Reducing Collisions Involving Older Drivers. Washington, DC: Transportation Research Board. trb.org/publications/nchrp/nchrp_rpt_500v9.pdf NHTSA (1998). Older Drivers: Cues for Law Enforcement. DOT HS 808 778. Washington, DC: National Highway Traffic Safety Administration. www.nhtsa.dot.gov/people/injury/olddrive/cuesindex.html NHTSA (2003a). A Compendium of Law Enforcement Older Driver Programs. Washington, DC: www.nhtsa.dot.gov/people/injury/olddrive/LawEnforcementOlderDriver03/index.htm NHTSA (2003b). Physician’s Guide to Assessing and Counseling Older Drivers. DOT HS 809 647. Washington, DC: National Highway Traffic Safety Administration. www.nhtsa.gov/people/injury/olddrive/OlderDriversBook/index.html NTSB (2004). Highway Special Investigation Report: Medical Oversight of Noncommercial Drivers. Washington, DC: National Transportation Safety Board. NTSB/SIR-04/01 PB2004-917002 www.ntsb.gov/publictn/2004/SIR0401.pdf OECD (2001). Ageing and Transport: Mobility Needs and Safety Issues. Paris, France: Organization for Economic Cooperation and Development. www.oecd.org/dataoecd/40/63/2675189.pdf Owsley, C., McGwin, Jr. G., Phillips, J.M., McNeal, S.F., and Stalvey, B.T. (2004). Impact of an education program on the safety of high-risk, visually impaired, older drivers. American Journal of Preventive Medicine 26(3), pp. 222-229. Raymond, P., Knoblauch, R., and Nitzburg, M. (2001). Older Road User Research Plan. DOT HS 809 322. Washington, DC: National Highway Traffic Safety Administration. www.nhtsa.dot.gov/people/injury/olddrive/OlderRoad/index.htm Staplin, L., and Lococo, K.H. (2003). Model Driver Screening and Evaluation Program. Vol. 3: Guidelines for Motor Vehicle Administrators. DOT HS 809 581. Washington, DC: National Highway Traffic Safety Administration. www.nhtsa.dot.gov/people/injury/olddrive/modeldriver/ Staplin, L., Lococo, K.H., Gish, K.W., and Decina, L.E. (2003a). Model Driver Screening and Evaluation Program. Vol. 1: Project Summary and Model Program Recommendations. DOT HS 809 582. Washington, DC: National Highway Traffic Safety Administration. www.nhtsa.dot.gov/people/injury/olddrive/modeldriver/ Staplin, L., Lococo, K.H., Gish, K.W., and Decina, L.E. (2003b). Model Driver Screening and Evaluation Program. Vol. 2: Maryland Pilot Older Driver Study. DOT HS 809 583. Washington, DC: National Highway Traffic Safety Administration. www.nhtsa.dot.gov/people/injury/olddrive/modeldriver/
7 - 20
Stutts, J.C. (2005). Improving the Safety of Older Road Users. Final report, NCHRP Synthesis Project 20-5, Synthesis Topic 35-10. Washington, DC: Transportation Research Board. U.S. Census Bureau (2004). U.S. Interim Projections by Age, Sex, Race, and Hispanic Origin. Washington, DC: www.census.gov/ipc/www/usinterimproj/natprojtab02a.pdf USDOT (2003). Safe Mobility for a Maturing Society: Challenges and Opportunities. Washington, DC: U.S. Department of Transportation. ostpxweb.dot.gov/policy/Data/SafeMobility.pdf Vernon, D.D., Diller, E., Cook, L., Reading, J., and Dean, J.M. (2001). Further Analysis of Drivers Licensed with Medical Conditions in Utah. DOT HS 809 211. Washington, DC: National Highway Traffic Safety Administration. www.nhtsa.dot.gov/people/injury/olddrive/utah/utah_index.htm