county government of mombasa county treasury …
TRANSCRIPT

REPUBLIC OF KENYA
COUNTY GOVERNMENT OF MOMBASA
COUNTY TREASURY
ANNUAL DEVELOPMENT PLAN 2020/21
©September 2019

1
COUNTY VISION, MISSION AND CORE VALUES
VISION
To see Mombasa county as a vibrant modern regional commercial hub with a high standard of living for its residents
MISSION
To provide high quality services through transformational leadership by ensuring prudent utilization of resources to foster socio-economic development to the
residents of Mombasa
CORE VALUES
Patriotism
Professionalism
Integrity
Human Dignity
Good Governance
Diversity

2
TABLE OF CONTENTS
COUNTY VISION, MISSION AND CORE VALUES ....................................................................................... 1 TABLE OF CONTENTS ................................................................................................................................... 2 ABBREVIATIONS AND ACRONYMS ............................................................................................................. 4 CHAPTER ONE: INTRODUCTION ................................................................................................................ 9
1.1 OVERVIEW OF THE COUNTY ..................................................................................................... 9
1.2 ANNUAL DEVELOPMENT PLAN LINKAGE WITH CIDP ........................................................... 11
1.3 PREPARATION PROCESS OF THE ANNUAL DEVELOPMENT PLAN ......................................... 12
1.4 THE COUNTY ANNUAL DEVELOPMENT PLAN PREPARATION PROCESS ............................... 13
CHAPTER TWO: REVIEW OF THE IMPLEMENTATION OF THE PREVIOUS ADP ...................................... 14 2.1 Introduction .............................................................................................................................. 14
2.2. Sector/ Sub-sector Achievements in the Previous Financial Year ................................................. 17
1. Public Administration & International (Or Inter-Government) Relations ................................... 17
a. County Executive ....................................................................................................................... 17
b. Public Service Board .................................................................................................................. 20
2. General Economic and Commercial Affairs Sector ....................................................................... 23
➢ Finance and Economic Planning ............................................................................................... 23
➢ Trade Tourism and Investment ................................................................................................. 26
3. Education Sector ............................................................................................................................ 33
4. Health Sector .................................................................................................................................. 39
5. Environmental Protection, Water and Natural Resources Sector ................................................. 48
a. Water, sanitation and natural resources .................................................................................. 48
b. Environment, Energy & Solid Waste Management ................................................................... 50
6. Social Protection, Culture and Recreation Sector.......................................................................... 53
a. Youth, Gender, Sports and Cultural Affairs. ............................................................................. 53
7. Agriculture, Rural and Urban Development Sector ...................................................................... 55
a. Agriculture, Livestock, Fisheries and Cooperatives Development............................................ 55
b. Land, Housing and Physical Planning ............................................................................................ 55
8. Energy, Infrastructure and ICT Sector .......................................................................................... 63
2.3: Grants, Benefits and Subsidies .................................................................................................. 67
2.4 Challenges Experienced During Implementation of the previous ADP .................................. 68
2.5 LESSONS LEARNT ...................................................................................................................... 69
CHAPTER THREE: COUNTY STRATEGIC PRIORITIES, PROGRAMMES AND PROJECTS ........................... 73 3.1 Introduction ............................................................................................................................. 73
3.2 Planned Targets for the Sector/ Sub-sector programmes ........................................................ 73
3.2.1 General Economic and Commercial Affairs Sector .................................................................. 73

3
3.2.2: Public Administration & International (Or Inter-Government) Relations .............................. 81
3.2.3: Health ....................................................................................................................................... 97
3.2.4: Social Protection, Culture & Recreation Sector ..................................................................... 105
3.2.5: Agriculture, Rural and Urban Development Sector .............................................................. 113
3.2.6: Environmental Protection, Water & Natural Resources ........................................................ 129
3.2.7: Education Sector ..................................................................................................................... 135
3.2.8: Energy, Infrastructure and ICT .............................................................................................. 139
3.3 Payments of Grants, Benefits and Subsidies ........................................................................... 145
CHAPTER FOUR: DEPARTMENTAL RESOURCE ALLOCATION ................................................................ 146 4.3 Financial and Economic Environment .................................................................................... 147
4.3.1 County Economic and Fiscal Overview .............................................................................. 147
4.3.2 Fiscal Performance and Emerging Challenges ................................................................... 148
4.3.3 Risks, Assumptions and Mitigation measures .................................................................... 149
CHAPTER FIVE: MONITORING AND EVALUATION ................................................................................ 151

4
ABBREVIATIONS AND ACRONYMS
ADP Annual Development Plan
CADP County Annual Development Plan
CBEF County Budget and Economic Forum
CG County Government
CIDP County Integrated Development Plan
CIMES County Integrated Monitoring and Evaluation System
FY Financial Year
KSH Kenya Shilling
MTEF Medium Term Expenditure Framework
PBB Programme Based Budget
PFMA Public Finance Management Act

5
FOREWORD In line with the Constitution, the Public Finance Management (PFM) Act, 2012, sets out the fiscal
responsibility principles to ensure prudency and transparency in the management of public resources.
The PFM act (section 15) states that over the medium term, a minimum of 30% of the budget shall be
allocated to development expenditure. Departments obtain their ceilings from the County Budget Review
and Outlook Paper (CBROP) and the Fiscal Strategy Paper (FSP) to guide them in preparation of the
Annual Development Plan.
This ADP sets out the strategic priorities for the medium term that reflects the County Government’s
priorities and plans for the 2020/21 financial year. It contains the Programmes/Projects to be delivered
with their objectives, expected outputs, performance indicators, time frame and the amount allocated for
each project as in line with the budget estimates for the Fiscal year 2020/21.
The plan in totality presents the county strategies towards realizing the objectives of the County Integrated
Development Plan (CIDP) 2018-2022, the third Medium Term Plan, Vision 2030, Medium Term
Expenditure Framework (MTEF) and Sectoral Plans, and is also geared towards mainstreaming the
National and International commitments like Agenda 2063 of the African Union and the Sustainable
Development Goals (SDGs) among others.
The Annual Development Plan (ADP) will implement the CIDP in five annual plans and this is the second
plan to be developed and it will also be linked with the Sector/Departmental Annual Work Plans: The
Departments in the County prioritizes their programs in an annual work plan and this is essential in
consolidating the ADP.
Planning remains a key principle in the County as more resources and responsibilities are devolved to
the county government. These resources and responsibilities will be cascaded to the sub-county and ward
levels to ensure a bottom up public service delivery system.
MS. MARIAM MBARUK
COUNTY EXECUTIVE COMMITTEE MEMBER
FINANCE AND ECONOMIC PLANNING

6
ACKNOWLEDGEMENTS
The Mombasa County Annual Development Plan, 2020/21 is a result of contribution and concerted
efforts of many Stakeholders. The policy document is prepared in line with the provisions of Article
220(2) of the Constitution of Kenya, 2010 and Article 126(1) of the Public Financial Management Act,
2012.
The Plan is the second in a series of five Annual Development Plans that will implement the County
Integrated Development Plan (2018-2022).
The preparation of this Annual Development Plan continues to be a collaborative effort from an array of
expertise of professionals and key stakeholders in the County. The information in this policy document
has been obtained from the Mombasa County Government Departments. We are grateful for their inputs.
A core team in the Budget and Economic Planning unit spent a significant amount of time consolidating
this policy document. We are particularly grateful to Ms. Jane Githui (Director Budget & Economic
Planning) and Mr. Affan Mohamed (Director Revenue) for working tirelessly in the development of this
document.
MS. ASHA ABDI
CHIEF OFFICER
FINANCE AND ECONOMIC PLANNING

7
EXECUTIVE SUMMARY
This is a brief summary of the chapters / sections of the Annual Development Plan outlining the
content of each chapter.
1. The Mombasa County Annual Development Plan, 2020/2021 is prepared in line with the
provisions of Article 220(2) of the Constitution of Kenya, 2010 and Article 126(1) of the
Public Financial Management Act, 2012. The Plan is the second in a series of five Annual
Development Plans that will implement the County Integrated Development Plan (2018-
2022). It spells out the county government’s strategic priorities and programmes that will be
implemented over the medium term in response to the views expressed by members of the
public during stakeholder consultation forums held throughout the County.
2. Mombasa County has continued to lay a solid foundation upon which to start the journey of
building a prosperous County for all its residents. This is progressively attained through the
adoption of a growth strategy based in programmes that generate employment most rapidly,
and provide more income-generating opportunities for the poor. To achieve the required
economic growth, create impact in the county and realize the County vision of transforming
Mombasa county into a vibrant regional commercial hub with a high standard of living for
its residents, a set of five County strategic priorities have been identified; namely:
a) Investing in quality and accessible Health Care
b) Improved Land Services
c) Investment in Water & Transport Infrastructure
d) Provision of Quality Education
e) Youth, Sports & Gender empowerment

8
LEGAL BASIS FOR THE PREPARATION OF THE ADP AND THE LINK WITH CIDP AND THE
BUDGET
LEGAL BASIS
The Mombasa County Annual Development Plan is prepared in accordance with Article 220 (2)
of the Constitution and Section 126 (1) of the Public Finance Management Act, 2012. It states
that the plan should include;
(a) Strategic priorities for the medium term that reflect the county government’s priorities and
plans;
(b) A description of how the county government is responding to changes in the financial and
economic environment;
(c) Programmes to be delivered with details for each programme of—
(i) The strategic priorities to which the programme will contribute;
(ii) The services or goods to be provided;
(iii) Measurable indicators of performance where feasible; and
(iv) The budget allocated to the programme;
(d) Payments to be made on behalf of the county government, including details of any grants,
benefits and subsidies that are to be paid;
(e) A description of significant capital developments;
(f) A detailed description of proposals with respect to the development of physical, intellectual,
human and other resources of the county, including measurable indicators where those are
feasible;
(g) A summary budget in the format required by regulations; and
(h) Such other matters as may be required by the Constitution or this Act.

9
CHAPTER ONE: INTRODUCTION
1.1 OVERVIEW OF THE COUNTY This section provides a short description of the county in terms of the location; size; demographic profiles;
administrative and political units. It also highlights a summary of the socio-economic and infrastructural
information that has a bearing on the development of the county.
Position and Size
The County is located in the South Eastern part of the Coastal region of Kenya. It covers an area of 229.9
Km2 excluding 65 Km2 of water mass which is 200 nautical miles inside the Indian Ocean. It borders
Kilifi County to the North, Kwale County to the South West and the Indian Ocean to the East. The County
lies between latitudes 30 56’ and 40 10’ South of the Equator and between longitudes 390 34’and 390
46’east of Greenwich Meridian. The County also enjoys proximity to an expansive water mass as it
borders the Exclusive Economic Zone of the Indian Ocean to the East.
Demographic Features
Population Size and Composition
Population distribution and settlement patterns in the County are influenced by proximity to vital social
and physical infrastructure networks such as roads, housing, water and electricity. Other factors that
influence settlement patterns include accessibility to employment opportunities and security. Table 3
shows the county population projection by sex and Age groups. The total population of the county in
2009 was 939,370 persons of which 486,924 and 452,446 were male and female respectively. It was
projected to be 1,266,358 in 2018 and will rise to 1,433,689 persons by 2022. The population currently
stands at 1,208,333 consisting of 610,257 Male and 598,046 Female as per the 2019 population census.
Administrative and Political units (Sub-counties and wards)
Administratively, the County is divided into six sub-counties namely; Mvita, Nyali, Changamwe, Jomvu,
Kisauni, and Likoni and thirty county assembly wards. These are further sub-divided into thirty locations
and fifty-seven sub-locations as shown in Table 1 and Table 2 below:
Table 1: Number of Administrative Units by Sub-County, 2019
Sub-County Divisions Locations Sub-Locations Villages
Changamwe 1 4 10 58
Jomvu 1 3 7 65
Kisauni 3 6 9 200
Nyali 2 4 8 55
Likoni 2 6 9 145
Mvita 1 7 14 134
Total 10 30 57 657
Source: County Commissioner’s Office, Mombasa County, 2019

10
Table 2: County’s Electoral Wards by Sub-county Sub Counties Wards
Changamwe 5
Jomvu 3
Kisauni 7
Likoni 5
Mvita 5
Nyali 5
Total 30
Source: County Commissioner’s Office, Mombasa County, 2019
Table 3: Population Projection by Sex and Age Cohort
Age Group
2009 (Census) 2018 (Projections) 2020 (Projections) 2022 (Projections)
Male Female Total Male Female Total Male Female Total Male Female Total
0-4 64,317 63,002 127,319 81,103 79,343 160,481 84,256 82,572 166,828 86,337 84,615 170,952
5-9 49,836 50,081 99,917 64,567 65,014 129,611 68,543 69,020 137,563 71,179 71,656 142,836
10-14 40,660 42,221 82,881 53,935 55,919 109,880 57,308 59,739 117,047 61,136 63,594 124,730
15-19 40,095 46,640 86,735 54,220 61,206 115,458 57,966 65,541 123,507 61,882 70,315 132,197
20-24 57,005 69,257 126,262 77,941 77,649 155,618 82,450 81,300 163,750 88,600 87,306 175,906
25-29 63,689 60,776 124,465 81,659 78,500 160,123 86,571 80,150 166,721 91,722 83,664 175,383
30-34 52,178 39,131 91,309 68,750 62,552 131,323 73,501 67,492 140,993 78,218 68,575 146,774
35-39 39,968 26,889 66,857 55,511 46,085 101,460 58,903 51,514 110,417 63,479 56,197 119,675
40-44 25,837 16,200 42,037 42,248 28,765 71,005 45,524 31,619 77,143 48,586 36,880 85,425
45-49 19,270 12,089 31,359 29,616 18,791 48,407 32,888 21,005 53,893 35,915 23,659 59,570
50-54 12,816 8,389 21,205 18,597 10,817 29,413 20,198 11,794 31,992 23,309 13,743 37,052
55-59 8,052 5,300 13,352 11,717 8,092 19,809 12,637 8,604 21,241 13,978 9,545 23,524
60-64 5,102 4,124 9,226 7,518 5,812 13,331 8,138 6,271 14,409 8,901 6,696 15,596
65-69 2,801 2,561 5,362 4,363 4,116 8,481 4,788 4,506 9,294 5,274 4,921 10,194
70-74 2,099 2,078 4,177 2,669 2,800 5,471 2,868 3,027 5,895 3,237 3,392 6,629
75-79 1,220 1,211 2,431 1,576 1,690 3,266 1,676 1,818 3,494 1,829 1,999 3,827
80+ 1,979 2,497 4,476 1,299 1,920 3,220 1,302 1,951 3,253 1,359 2,060 3,419
Total 486,924 452,446 939,370 657,288 609,069 1,266,358 699,517 647,923 1,347,440 744,941 688,817 1,433,689

11
1.2 ANNUAL DEVELOPMENT PLAN LINKAGE WITH CIDP The County Governments are required to prepare the County Integrated Development Plans to
enable prioritization of socio-economic development issues at the local level. This is mandatory
before the funding of county projects and programmes. County Integrated development
planning is a process through which efforts of county devolved levels of government are
coordinated at the local level, through which economic, social, environmental, legal and spatial
aspects of development are brought together to produce a plan that meets the needs and sets the
targets for the benefit of local communities.
The County Government Act 2012, in fulfillment of the constitutional requirement to legislate preparation of county plans, details the goals and procedures of “County Planning” (Part XI of the Act). County planners are required to prepare 5-year integrated county development plans and the annual county budgets to implement them as per section 108 (1) of the Act. The Annual Development Plan therefore picks the priorities and strategies from the CIDP in yearly phases.

12
1.3 PREPARATION PROCESS OF THE ANNUAL DEVELOPMENT PLAN The Annual Development Plan preparation involved the following exercises:
➢ County Integrated Development Plan: The CIDP contains key information on the priorities
and strategies of the County during a five-year period. The Annual Development Plan
(ADP) will implement the CIDP in five annual plans.
➢ Sector/Departmental Annual Work Plans: The Departments in the County prioritizes their
programs in an annual work plan and this is essential in consolidating the ADP.
Annual Development Plan Sources of Data
The County Annual Development Plan captures;
✓ Submission of inputs from county departments
✓ Stake holder meetings, inputs from the County Budget and Economic Forum (CBEF),
existing government policies, plans and strategies etc.); and
✓ Public participation: The public is consulted on the planning process of the county. This
takes place during the preparation of the County Integrated Development Plan (CIDP). A
good CIDP must encourage public participation and inclusion of all stakeholders not only
before and during preparation but also during implementation of projects, programmes
and policies thereafter. Public participation is the process by which interested and affected
individuals, organizations, agencies and government entities are consulted and included in
the decision-making process.
✓ Emphasis is also made to ensure participatory development and capacities are developed at
the county and community level. Five laws which provide the framework for devolution
have been enacted, namely: Urban Areas and Cities Act, 2011; The County Governments
Act, 2012; The Transition to Devolved Government Act, 2012; The Intergovernmental
Relations Act, 2012 and The Public Finance Management Act, 2012. The PFM Act 2012
provides for effective and efficient management of public resources. Article 125 of the Act
requires the budget process for county governments in any financial year to consist of
integrated development planning process which include long term and medium-term
planning as well as financial and economic priorities for the county over the medium term.
Articles 126 of the Act further obligates each county government to prepare an integrated
development plan that includes strategic priorities for the medium term that reflect the
county government's priorities and plans, a description of how the county government is
responding to changes in the financial and economic environment; and, programmes to be
delivered.
✓ Stake holder meetings: The key stakeholders in the County are consulted on the planning
process of the county. This took place during the preparation of the County Integrated
Development Plan (CIDP), 2018-2022 as this Annual Development Plan will be the second
one to implement the CIDP.

13
1.4 THE COUNTY ANNUAL DEVELOPMENT PLAN PREPARATION PROCESS
Phase One: Data Collection and Analysis
In this Phase, information was collected on the existing conditions within the County and on the
implementation of previous plans. It focused on the types of challenges faced by people in the County
and their leading causes. The identified challenges were assessed and prioritized in terms of their
urgency. Information on availability of resources was also collected during this phase.
The Phase provides most of the content of Chapters 1 and 2 of the CADP. The County Annual Development
Plan contributes to the identification of key development challenges and county priorities for the year.
Phase Two: Strategies Development
The County worked on finding solutions to the problems assessed in phase one. The County heads
agreed on the following:
i. Annual development objectives and outcome targets;
ii. Annual criteria for prioritization and resource allocation amongst sectors and spatial
distribution of development resources;
iii. Formulation of annual development strategies which may require a multi-sectoral approach; and
iv. Listing of major programmes and sub-programmes for the year. The County developed the overall annual strategies for Cross-cutting issues dealing with climate change;
Environmental degradation; HIV/AIDs; Gender, Youth and Persons with Disability (PWD); Disaster Risk
Management (DRM), Ending Drought Emergencies (EDE) among others.
Phase Three: Integration of Programs/ Projects
Once all programmes/projects were formulated, they were verified that they are consistent with the
County Performance Management Framework (e.g. contribute to long term objectives, have clear
outcomes, indicators, performance management, M&E, within available resources, etc.). Programmes
were also reviewed based on cross-Sectoral considerations, both in terms of potential negative impact
and of harnessing synergies across County Government sectors, across levels of government and with
non-governmental stakeholders.
Phase Four: Annual Development Plan Approval
The Finance and Economic planning unit through the County Executive Committee Member presented the draft to the Executive for consideration and adoption. The Executive then tabled the draft CADP to
the County Assembly.
In collaboration with the Executive, the County Assembly is expected to review the draft CADP in
accordance with existing laws and regulations before approving the 2019/2020 County Annual
Development Plan with or without amendments.

14
CHAPTER TWO: REVIEW OF THE IMPLEMENTATION OF THE PREVIOUS ADP
2.1 Introduction
This chapter provides a review of sector/ sub-sector achievements, challenges and lesson learnt from the
previous year.
DEPARTMENTAL RECURRENT AND DEVELOPMENT EXPENDITURE AS AT 30TH JUNE 2019 FOR THE FY
2018-19
2018/2019 DEPARTMENTAL RECURRENT EXPENDITURE
S/NO DEPARTMENTS Original Budget
FY 2018/2019
Final Budget FY
2018/2019
TOTAL %age
3011 The Executive 382,877,200 392,849,560 359,522,059 91.8%
3012 County Assembly 610,986,278 707,114,950 682,989,659 96.6%
3013 Public Service Board 131,749,530 97,279,232 77,902,220 80.1%
3014 Finance and Economic Planning 1,107,521,980 2,203,652,095 2,165,655,494 98.3%
3015 Energy, Environment and Waste Management 510,208,594 571,430,649 528,341,544 92.5%
3016 Education, Information Technology and Mv 2035 578,507,296 477,019,476 397,535,735 86.1%
3017 Health 2,683,387,579 2,469,804,767 3,101,738,503 127.2%
3018 Water, Environment and Natural Resources 137,635,994 69,278,191 52,726,209 76.6%
3019 Youth, Gender, Sports and Cultural Affairs 230,297,579 203,328,519 187,973,874 92.4%
3020 Trade, Tourism and Investments 405,456,909 483,853,642 386,526,788 79.9%
3021 County Planning, Land and Housing 226,404,844 150,702,589 127,393,238 84.5%
3022 Transport, Infrastructure and Public Works 468,593,286 452,155,443 428,257,872 94.7%
3023 Agriculture, Fisheries, Livestock and Co-Operatives 232,703,389 208,839,379 192,386,271 92.1%
3026 Devolution and Public Service Administration 919,794,396 1,625,206,337 1,565,043,995 98.0%
REC TOTAL 8,626,124,854 10,112,514,829 10,253,993,461 102.2%

15
2018/2019 DEPARTMENTAL DEVELOPMENT EXPENDITURE
S/NO DEPARTMENTS Original Budget FY 2018/2019
Final Budget FY 2018/2019
TOTAL %age
3011 County Executive 84,424,673
8,913,030
7,306,594
82.0%
3012 County Assembly 45,773,748
-
-
-
3013 Public Service Board 21,637,280
4,514,200
4,280,707
94.8%
3014 Finance & Economic Planning 302,447,782
572,184,023
559,378,197
97.8%
3015 Energy, Environment & Waste Management 410,372,081
257,525,112
209,644,412
81.4%
3016 Education, Information Technology & MV 2035 244,499,756
97,242,233
54,126,040
55.7%
3017 Health Services 240,255,554
116,559,248
100,776,236
86.5%
3018 Water, Sanitation & Natural Resources 767,050,100
600,000,000
15,562,353
2.6%
3019 Youth, Gender, Sports and Cultural Affairs 1,269,841,602
147,479,603
92,455,232
62.7%
3020 Trade, Tourism & Investment 95,631,669
146,516,150
99,941,671
68.2%
3021 Lands, Housing and Physical Planning 221,201,888
244,153,682
184,373,277
75.5%
3022 Transport & Infrastructure 837,855,896
1,915,739,350
1,589,465,194
83.0%
3023 Agriculture, Fisheries, Livestock and Co-operatives 266,591,948
172,552,337
132,803,363
77.0%
3024 Devolution & Public Service Administration 158,063,060
60,601,778
56,381,853
93.0%
TOTAL
4,965,647,037
4,343,980,746
3,106,495,130
71.5%
2018/2019 TOTAL DEPARTMENTAL EXPENDITURE
DEPARTMENTS Approved Budget FY
2018/2019 Supplementary Budget FY 2018/2019
Total Expenditure %age
3011 County Executive 467,301,873 401,762,590
366,828,652
92%
3012 County Assembly 656,760,026 707,114,950
682,989,659
97%
3013 Public Service Board 153,386,810 101,793,432
82,182,927
81%
3014 Finance & Economic Planning 1,409,969,762 2,775,836,119
2,725,033,692
98%
3015 Energy, Environment & Waste Management 920,580,675 828,955,761
737,985,956
89%
3016 Education, Information Technology & MV 2035 823,007,052 574,261,709
451,661,776
79%
3017 Health Services 2,923,643,133 2,586,364,015
3,202,514,740
125%
3018 Water, Sanitation & Natural Resources 904,686,094 669,278,191
68,288,562
10%
3019 Youth, Gender, Sports and Cultural Affairs 1,500,139,181 350,808,122
280,429,106
80%
3020 Trade, Tourism & Investment 501,088,578 630,369,792
486,468,460
77%
3021 Lands, Housing and Physical Planning 447,606,732 394,856,271
311,766,515
79%
3022 Transport & Infrastructure 1,306,449,182 2,367,894,793
2,017,723,065
85%
3023 Agriculture, Fisheries, Livestock and Co-operatives 499,295,337 381,391,716
325,189,634
85%
3026 Devolution and Public Service Administration 1,077,857,456 1,685,808,115
1,621,225,848
96%
TOTAL 13,591,771,891 14,456,495,576
13,360,488,591
93%

16
Table 4: GROWTH OF EXECUTIVE EXPENDITURE FROM 2014/15-2018/19
GROWTH OF EXPENDITURE FROM 2014/2015-2018/2019
S NO. DEPARTMENTS 2014/2015 2015/2016 2016/2017 2017/2018 2018/2019
3011 County Executive
929,699,966
775,487,598
289,680,017
305,472,424
366,828,652
3013 Public Service Board
55,377,190
42,201,643
47,783,171
69,337,345
682,989,659
3014 Finance & Economic Planning
1,819,878,254 1,777,993,324
2,276,991,615
2,270,755,715
82,182,927
3015 Environment, Waste Management and Energy
63,501,521
111,733,374
70,677,866
504,702,480
2,725,033,692
3016 Education, Information Technology & MV 2035
307,844,255
457,102,717
1,033,070,417
469,161,316
737,985,956
3017 Health Services
1,396,970,317 2,285,276,810
2,532,325,353
2,500,178,693
451,661,776
3018 Water, Sanitation & Natural Resources
612,064,144
492,269,532
73,447,595
95,072,297
3,202,514,740
3019 Youth, Gender, Sports & Cultural Affairs
138,261,355
189,016,828
369,715,814
323,768,818
68,288,562
3020 Trade, Tourism & Investment
330,004,554
289,892,019
186,241,760
212,092,539
280,429,106
3021 Lands, Housing & Physical Planning
144,036,335
323,902,738
185,971,683
276,249,787
486,468,460
3022 Transport & Infrastructure & Public Works
701,982,041 1,175,521,171
1,731,846,854
1,871,526,082
311,766,515
3023 Agriculture, Fisheries, Livestock & Cooperatives
158,579,193
110,007,203
116,645,971
194,126,312
2,017,723,065
3026 Devolution & Public Service Administration
712,108,321
325,189,634
Total
6,658,199,125 8,030,404,957
8,914,398,116
9,804,552,129 12,677,498,932

17
2.2. Sector/ Sub-sector Achievements in the Previous Financial Year
1. Public Administration & International (Or Inter-Government) Relations
The sector is composed of the following sub-sectors: a. County Executive b. County Assembly c. Public Service Board d. Devolution & Public Service Administration
Sector/ Sub-sector name
a. County Executive
• The strategic priorities of the sector: To provide leadership for efficient and effective service delivery Key Achievement: Renovation of the County Court Mvita sub county Purchase of the Dg Vehicle and County Courtesy Van
Summary of Sector/ Sub-sector Programmes P1 Governor’s Affairs
Recurrent Expenditure
Objective Improved service delivery
Outcome Good governance and enhanced professionalism in service delivery
Delivery Units Key Outputs Key Performance Indicators
Target Person responsible
F/Y 2018/19
F/Y 2019/20
F/Y 2020/21
General Administration and advisory services
Improved service delivery by various sub units.
quality and timeliness of service
100% 100% 100% Chief Officer
Communication, Protocol and Public Relations
Informing the public on activities in the county. Branding the county positively and managing delegates
No. of adverts and stories run in the media. No of delegates and activities carried
2 per month
Director Communication
Sister Cities Programme International relations enhanced
No. of partnering projects initiated and implemented
2
Counter Violence Extremism
Sensitizing the public. Partnering with local and international communities
No. of sensitization workshop conducted and no. of projects initiated
6 Director CVE
P2 Deputy Governor's Affairs and Intergovernmental Relations
Recurrent
Objective Enhanced service delivery

18
Outcome Improved quality service delivery
Delivery Units Key Outputs Key Performance Indicators
Target Person responsible
F/Y 2018/19
F/Y 2019/20
F/Y 2020/21
General Administration Effective administration of DG office.
Service delivered as per the service chatter
80% 100% 100%
Intergovernmental Relation (COG, JKP)
Shared development project and services adopted
No. of shared development and services implemented
2 3 3 Chief officer
P3 Cabinet Affairs, Policy Research and Legal Services
Recurrent Expenditure
Objective Improved regulatory and supervisory system
Outcome Efficiency and timely service delivery
Delivery Units Key Outputs Key Performance Indicators
Target Person responsible
F/Y 2018/
19
F/Y 2019/
20
F/Y 2020/21
General Administration Effective administration of County Attorney’s office, County Courts and County Secretary’s office
Improved service delivery to the citizen as per the service chatter
80% 100% 100%
Cabinet Affairs Coordinated development projects and development agenda
No. of programs and projects successfully coordinated and directed
10 15 20
Policy, Legislation and contract
7 10 12
Human rights and litigation
Enhanced human rights adherence in all decision making. Effective litigation
No. of cases won for the County
100% 100% 100%
Civic Education Enlightened citizenry on matters legislation in devolution.
No. of Civic education done.
6 12 18
No. of increased participation of citizens in decision making.
P4 MV 2035 & E-Government
Recurrent expenditure
Objective Implementation of the MV 2035 programs and projects
Outcome Enhanced service delivery

19
Delivery Units Key Outputs Key Performance Indicators
Target Person responsible
F/Y 2018/19
F/Y 2019/20
F/Y 2020/21
General Administration Effective administration of MV2035 Secretariat
Enhanced service delivery as per the service chatter
80% 100% 100%
Coordination and planning
MV2035 Projects Coordinated
No. of MV2035 Projects coordinated and Guided
5 Deputy Governor
P5 Strategic Delivery Unit
Recurrent Expenditure
Objective Improved completion of projects to the required standard, quality, cost and within the stipulated time
Outcome Improved quality assurance in projects
Delivery Units Key Outputs Key Performance Indicators
Target Person responsible
F/Y 2018/19
F/Y 2019/20
F/Y 2020/21
RMO Final Evaluation of Flagship Projects
Project timing, quality and cost completion as per the target.
100% 100% 100% Chief of staff
ANNUAL DEVELOPMENT PLAN FY 2020/21
Programme Project Sub- county / ward
Description of project
Estimated cost
Remarks
P1 Governor’s Office and advisory services
P1.1 Administration
Construction of the Governor’s Residence
Kisauni provision of official residence for the Governor
40,000,000
actual construction
P1.2 - Communication & Public relations
None P1.3 Sister Cities None
P1.4 CVE
None P1.5 Advisory Services
None
P2 Deputy Governor's Affairs and Intergovernmental Relations
P2.1 -General Administration
Construction of the Deputy Governor’s Residence
Mvita /HQ provision of official residence for the Governor
33,000,000
actual construction
P2.1 - Intergovernmental Relation (COG, JKP)
None

20
P2.2 - MV 2035
None P3. County Secretary office
P3.1 Cabinet Affairs, Policy & Research
None
P3.2 -SDU
None P4. County Attorney Office
P4.1 Legal services
Construction of County Courts
Changamwe provision of legal services closer to the people
25,000,000
actual construction
P5. MV 2035 & E-Government
P5.1 Monitoring & Evaluation
None
b. Public Service Board Table 1: Summary of Sector/ Sub-sector Programmes
Programme Name (As per the Programme Based Budget): General Administration, Planning and Support Services
Objective: 1. To Establish and abolish offices in the County Public Service 2. Appoint persons to hold or act in Public offices 3. Exercise disciplinary control 4. Promotion of values and principles of Public Service 5.Facilitate the development of coherent, integrated human resource planning
Outcome: Competent, Motivated and disciplined workforce
Sub
Programme
Key outputs Key
performance
indicators
Planned
Targets
Achieved Targets Remarks
*
General
Administra
tion,
Planning
and
Support
Services
a) Competent, efficient and motivated workforce. b) County
public service
that upholds
values and
principles of
public service.
i) Motivated staff ii) Disciplined workforce iii) Reduction in industrial action iv) Citizen
satisfaction
in Service
Delivery
80% well
trained
staff.
i) Development of the Board Charter, ii) Board Communication Strategy and Board Newsletter, iii) Appointments in various positions for the county government of Mombasa as per departmental recruitment plans and establishments iv) Staff Promotions, v) Re-designations according to qualifications, vi) Capacity building of Human Resource Advisory Committee on Delegated Authority, vii) Human Resource and Performance Management Plans.

21
Project Name/ Location
Objective/ Purpose
Output Performance
Indicators
Status
(based on
the
indicators)
Planned
Cost
(Ksh.)
Actual
Cost (Ksh.)
Source of
funds
1. Acquisition
of Bulk Filers
- Safe storage of and controlled access to Records -Improve efficiency -Institutional
memory
Up to date,
reliable and
efficient safety
of records
- Safe guard integrity of Board process - Improved turnaround time between request and feedback.
1M 720,000 County
Government
of Mombasa
2. Acquisition
of two 20ft
storage
Containers for
Record Storage
- Safe storage of and controlled access to Records -To cater for an
increased workforce
- Conducive
environment
-Improved
efficiency
4M 3,003,200 County
Government
of Mombasa
3. Repartition
of PSB Offices
and acquisition
of Furniture
and Fittings
-To improve working environment - Transparency and Accountability of public workforce
-Safe working
environment
-Improved staff morale and motivation - Reduction on
staff turnover
-Repartition PSB already done - Furniture
- Ongoing
6.5M 1,511,000 County
Government
of Mombasa
4. Installation
of structured
cabling and ICT
Networking
- Digitization of Human Resource - To improve
service delivery
-Up to date reliable staff data
-Ease of verification of Existing staff data - Monitoring and evaluation staff performance - Monitoring and evaluation of wage bill - Integrated
human
resource
planning
-Done 2.5M 1.9M County
Government
of Mombasa
5. Research
-To assess level of Compliance with laws and policies and develop recommendations
- To Promote Innovation
- To encourage
public participation
in Government
businesses.
Recommendati
ons for
implementation
Indicating
timelines and
persons
responsible.
-Compliance with National and County laws and policies
-Address
challenges
6M 6M County
Government
of Mombasa

22
Analysis of Capital projects of the Previous ADP Project
Name/Locati
on
Objective/
Purpose
Output Performance
Indicators
Status
(based on
the
indicators
Planne
d Cost
(Ksh.)
Actual Cost
(Ksh.)
Source of
funds
1. Acquisition
of Bulk Filers
- Safe storage of and
controlled access to
Records
-Improve efficiency
-Institutional memory
Up to date,
reliable and
efficient safety
of records
- Safe guard integrity
of Board process -
Improved
turnaround time
between request and
feedback.
1M 720,000 County
Governme
nt of
Mombasa
2. Acquisition
of two 20ft
storage
Containers
for Record
Storage
- Safe storage of and
controlled access to
Records
-To cater for an
increased workforce
- Conducive
environment
-Improved efficiency 4M 3,003,200 County
Governme
nt of
Mombasa
3. Repartition
of PSB Offices
and
acquisition of
Furniture and
Fittings
-To improve working
environment
- Transparency and
Accountability of public
workforce
-Safe working
environment
-Improved staff
morale and
motivation
- Reduction on staff
turnover
Repartition
PSB already
done
-Furniture
- Ongoing
6.5M 1,511,000 County
Governme
nt of
Mombasa
4. Installation
of structured
cabling and
ICT
Networking
- Digitization of Human
Resource
- To improve service
delivery
-Up to date
reliable staff
data
-Ease of verification
of Existing staff data
- Monitoring and
evaluation staff
performance
- Monitoring and
evaluation of wage
bill
- Integrated human
resource planning
-Done 2.5M 1.9M County
Governme
nt of
Mombasa
5. Research
-To assess level of
Compliance with laws
and policies and develop
recommendations
- To Promote Innovation
- To encourage public
participation in
Government businesses.
Recommendati
ons for
implementatio
n Indicating
timelines and
persons
responsible.
-Compliance with
National and County
laws and policies
-Address challenges
6M 6M County
Governme
nt of
Mombasa

23
2.5 Challenges Experienced during Implementation of the previous ADP
1. Delayed payments and implementation of important board programs due to lack of funds despite provisions in the budget resulting to suppliers and staff apathy.
2. Delay in funds remittance to the county government by the national government.
2.6 Lessons learnt and Recommendations
1. Recommendation for Independent Board account to manage its operations efficiently and effectively.
2. Facilitate Board Pending Bill Vote to cater for it’s pending bills settlements
3. Early planning
4. Engage public private partnership.
2. General Economic and Commercial Affairs Sector The sector is composed of the following sub-sectors;
a. Finance and Economic Planning; b. Trade, Tourism and Investment
✓ Trade, Investment and industry ✓ Tourism
➢ Finance and Economic Planning The Finance and Economic Planning sub sector was able to adhere to the 19/20 FY timelines of the budget
cycle. The major achievements during the period under review were; the preparation, submission and
implementation of County Policy Documents such as the County Integrated Development Plan 2018-
2022, the County Fiscal Strategy Paper, the Annual Development Plan, Budget Implementation Reports:
the County Budget Review and Outlook Paper (CBROP), quarterly financial reports and the Budget
Estimates as well as coordinate the Kenya Devolution Support programme in which Counties Country
wide were assessed and awarded with a grant depending on their performance. As a County we manged
to acquire a grant of 259 million from the assessment done. The internal audit section was able to carry
out post-audit examination on all payments within the county executive departments. During the period
under review, the supply chain management unit was able to coordinate procurement services for the
county department’s use and projects. To ensure efficiency and effective management of public financial
resources, county treasury has embraced IFMIS; the only recognized management system by the National
Treasury and also Internet banking. The Revenue Section in 2018/19 coordinated the preparation and
submission of the Finance Act, 2018, implementation of the automated construction and Electronic Single
Business Permits; Mpesa collection for markets and barriers revenue streams with the ultimate goal of
fully automating collection systems.

24
Summary of Programme Outcome and Performance Indicators for 2020/2021- 2022/2023 Name Program Outcome Expected Outputs Medium Term Performance Indicators
and Targets
General Administration,
Planning and support services
Efficiency in service delivery to
constituent.
Departments and affiliated bodies and
organizations.
Departments facilitated and capacity
build of financial and economic
planning matters
All departments following financial
rules and regulations
Financial Management
Services
Prudent mobilization, absorption and
utilization of resources
Resources mobilized, a framework
with clear policy linking planning and
budgeting in place
Revenue and expenditure reports
developed
Economic Planning and Policy
Coordination
Increased effectiveness and efficiency
of policy service delivery by all
departments
Policy documents, Departments
capacity build, Monitoring and
Evaluation reports
No of policy documents developed, No
of departments capacity build,
Monitoring and Evaluation reports
produced
Summary of the Programme Outputs and Performance Indicators Code Key Outputs Key Performance Indicators Targets
P1: Administration, Planning and Support Services
Sp1: Administration, Planning and Support Services
Outcome: Efficiency in service delivery to constituent departments and affiliated bodies
and organizations.
Delivery Units County Treasury
Customer satisfaction survey. Staff skills and competences developed. Safety measures relating to accounting documents and information, equipment and assets maintained. Sections performance contract forms
Customer satisfaction survey report. Number of staff trained. Training reports or manuals. Number of sections performance reports
One Customer satisfaction survey reports developed in the Financial year To train at least 30 members of staff by the end of 2020/2021 FY All section heads submitting 4 (quarterly) performance reports by the end of 2020/2021 FY Sp2: County Emergency Fund Services
Outcome: Sustainable disaster management
Delivery Units County treasury, CEC Finance and County Executive and County
Assembly
An operationalized Fund aimed at
making payments for urgent and
unforeseen events or emergencies
Number of people and
institutions assisted after their
livelihoods and operations are
disrupted by disasters.
Prioritize, Operationalize and
utilize the Fund by 30th June 2021
P2: Financial Management Services
Sp2: Supply Chain Management Services
Delivery Units County treasury, Procurement unit

25
Code Key Outputs Key Performance Indicators Targets
Outcome: Improved public financial management
Oversight services on public procurement process Improved capacity of staff in the procurement department An implemented e-procurement platform
Percentage of cases of impropriety in public procurement Number of staff trained
Percentage of implementation
No cases of impropriety At least 10 members of staff by the end of the 2020/2021 FY 100 percent implementation of e-procurement platform in all departments
Sp1: Accounting services
Delivery Units: County Treasury, Accounting Unit
Outcome: Enhanced efficiency of public fund management
Capacities built for key finance
and accounting staff
Pensions, death gratuities and
other benefits processed and paid
to retirees
Number of officers trained and
number of workshops held.
Number of days of time taken to
process pension payments
Final accounts prepared and
submitted as per National
Treasury guidelines.
Sp3: Audit Services
Delivery Units: CEC Finance and Economic Planning, Audit Section and Audit Committee
Outcome: Value for money audits conducted
Risk based audit techniques
applied to audit financial
transactions
Value for money audits conducted
Number of risk-based audit
techniques applied to audit
financial transactions
• Number of value for money
audits conducted
Percentage of incidences of
financial impropriety
4 quarterly value for money
audits conducted by 30th June
2021
Sp4: Revenue Mobilization Services
Delivery Units County treasury and CEC Finance.
Outcome: Enhanced revenue collection
Automation of revenue streams Increased efficiency in revenue collection
Number of revenue streams automated Amount of revenue realized
Automate at least 90 percent of revenue streams by the end of 2020/2021 FY Realize 90 percent of local revenue projected
P3: Economic Planning and Policy Coordination
Outcome: Proper Policy formulation and execution as per set guidelines in the PFM Act, 2012 and the Constitution of Kenya
2010.
Delivery Units County Treasury
Annual plans prepared. Annual plans prepared and submitted to the County Assembly.
By 30th August 2020

26
Code Key Outputs Key Performance Indicators Targets
Fiscal deficit maintained at less than 10% of total budget.
Ratio of fiscal deficit to total budget
Less than 10% deficit of the total budget
Budgets and expenditure review reports prepared and submitted on time
Budgets and expenditure review reports prepared and submitted on time
By the end of every quarter
Finance Bill, C-BROP Finance bill and C-BROP By 30th September 2020
Fiscal Strategy Paper Fiscal Strategy Paper By 28 February 2021 Draft budget estimates Draft budget estimates By 30th April 2021
Appropriations accounts prepared prepared and submitted to the County Assembly
By 30th June 2021
➢ Trade Tourism and Investment Programme Name: Public Administration
Objective: Improvement of departmental service delivery levels
Outcome: Competent staff and professionalism in service delivery
Key outputs Key performance
indicators
Planned Targets Achieved Targets Remarks*
Training No. of staff trained Train 20 No. middle level
staff
10 No. staff trained in
house
Enhanced mobility for effective
supervision
Purchase of double
cabin pickup
Purchase of 1 No. double
cabin pickup
Not achieved
Programme Name: Trade Development
Objective: To enhance socio economic development through trade.
Outcome: Improved standards of living of the citizenry.
Key outputs Key performance
indicators
Planned Targets Achieved Targets Remarks*
Improved Kongowea market
sanitation and hygienic
standards
Purchase of cleansing
machinery /
equipment
Purchase 1 No. shovel /
bobcat
Not achieved
Rehabilitation of
ground surface &
drainage system
Filling of ground surface pot
holes and covering of open
drains & chambers
Not achieved
Enhanced Kongowea market
security
Rehabilitation of
perimeter wall fence
To raise the existing
perimeter wall by 3 courses
of blocks
Not achieved

27
Installation of security
camera’s at Kongowea
market.
Installation and
commissioning of 20 No.
CCTV cameras
Not achieved
Improvement of work
environment
Rehabilitation of
Kongowea market
offices.
General painting of the
Kongowea market offices
Not achieved
Programme Name: Development of Tourism
Objective: To enhance socio economic development through tourism. Outcome: Improved standards of living of the citizenry. Sub Programme
Key outputs Key performance indicators Planned Targets Achieved Targets
Remarks*
Enhanced tourist activities
Revitalize tourist city tours 4 No. city tours 1 No. city tour conducted
Organized shopping festival and food bonanza
2 No. such events organized
1 No. such
event held
There was a food bazaar and shopping fest that was held in April- Easter Holiday
Improved community tourism
1. Capacity building sessions for taxi operators
2. Public awareness campaigns on importance of community tourism
4No. capacity building sessions 4No. awareness campaigns
Not Achieved
Insufficient funds to execute the trainings and public participations
Improved Sports Tourism
1. Local and international beach sporting events organized
4No. of beach sporting events held in the county
Not Achieved
Development of a beach management strategy
Clean and safe beaches
Monthly beach clean ups
12 No. of beach clean up
1 No. conducted
Beach cleanup conducted on 12th May Public participations exercises and legal consultancy
Beach safety clinics /sessions 4 No. of such clinics Not Achieved
Programme Name: Investment Promotion & Products
Objective: To create a conducive environment for investors Outcome: Mombasa as an investment hub Sub Programme Key outputs Key performance indicators Planned
Targets Achieved Targets
Remarks*
Investment Promotion
Database of investment opportunities and land available for investment.
Databank of investment opportunities and land available for investment.
1
1
Target achieved

28
County investment
portal
Updated County investment
portal
1 1 Target achieved
Enhanced Investment awareness
Number of investment exhibitions/ forums organized and held
1 1 Target achieved
Growth of investment opportunities
Percentage increase in the number of investors in Mombasa
10 % 10 % Target achieved
2.2.2 Administration & Planning: Achievements in the Previous Financial Year
Table 2: Administration & Planning Programmes Programme Name: Public Administration
Objective: Improvement of departmental service delivery levels
Outcome: Competent staff and professionalism in service delivery
Key outputs Key performance indicators Planned Targets Achieved Targets Remarks*
Training No. of staff trained Train 20 No. middle
level staff
10 No. staff trained in
house
Enhanced mobility for effective
supervision
Purchase of double cabin
pickup
Purchase of 1 No.
double cabin pickup
Not achieved
2.2.3 Trade Development: Achievements in the Previous Financial Year
Table 2: Summary of Trade Development Programmes Programme Name (As per the Programme Based Budget): Trade Development
Objective: To provide an enabling environment for growth of trade Outcome: Sub Programme Key outputs Key performance
indicators Planned Targets
Achieved Targets
Remarks*
Refurbishment of Retail Markets –
- Electricity
installed.
• 3 Retail market
rehabilitated
• Mwembe Tayari market
Programme Name: Ease of Doing Business
Objective: To create a conducive environment to promote business growth
Outcome: Automation of Business Services
Sub Programme Key outputs Key performance indicators Planned Targets Achieved
Targets
Electronic Business
Services
Integration of SBP,
Liquor License & Fire
certificate in one system
Revenue Collection Kes 600M 500M
No. of businesses registered 100,000 32,000

29
(Mwembe Tayari, Sega and Makupa)
- Toilet facilities
installed.
- Renovations of the
entire building.
- Water facilities
installed.
• Sega market
• Makupa market
Not undertaken
Rehabilitation of
Drainages & Market
Ground Surfaces at
Kongowea
An all weather surface
for the market • All weather
ground surface
• Graveling
• Concrete slabs
The ground
surface
improved by
gravelling &
works done.
Tomato, Potato, cabbage & damp site sections completed
Construction of Kongowea of Perimeter wall
Perimeter wall raised
by 2 courses.
▪ Perimeter wall
upgraded
▪ Inspection
reports
• Completion
Certificate
• To raise perimeter wall by 2courses
Not undertaken
Construction of standard market stalls at Kongowea
Improved market
facilities
▪ Market stalls
constructed • No of
stalls constructed
459 stalls constructed
The work is in progress
Completion & operationalization of retail markets: ✓ Shika Adabu
market
Improved market
environment
Markets
completed &
operationalized
• Shika Adabu market
work not undertaken
Installation of security lights at Kongowea market
Security lights installed No of security lights
installed • 27
security lights
• 27 security lights installed
Completed
Establishment of a Biashara Park at Makadara Grounds
Improved business
environment
Biashara park
established
1 Biashara park at Makadara Grounds
• work not done
Entrepreneurship skill development for SMEs
Business management
skills imparted on
SMEs,
• Number of
traders’ courses
organized
• the attendants
in report.
• 500 persons to be trained
517 persons trained in collaboration with Agriculture Dept, KCB & Equity Bank
Purchase of standards & testing equipment
Standards and testing
equipment purchased
• Purchase of
working
standards
• Purchase of
secondary
reference
standards
• Purchase of
testing
equipment
• 5 sets (1mg – 20kg)
• 2 sets (1mg – 20kg)
• 4 sets of beam balances ( 100mg, 200mg, 1kg, 5kg, 20kg),
Nil

30
• Purchase of
mass test
weights
Verification of weighing & measuring equipments
No of equipment verified
12,000 9,500 • Inadequate standards & testing equipments
• Lack of transport
• Inadequate funding
Inspections of traders’ premises to ensure compliance with W & M Act and TDA
Inspections carried out to ensure compliance
Number of inspection visits to traders’ premises
500 356 • Inadequate standards & testing equipments
• Lack of transport
• Inadequate funding
Table 3: Ease of Doing Business Programmes
Programme Name: Ease of Doing Business
Objective: To create a conducive environment to promote business growth
Outcome: Automation of Business Services
Sub Programme Key outputs Key performance
indicators
Planned Targets Achieved
Targets
Remarks*
Electronic Business
Services
Integration of SBP,
Liquor License & Fire
certificate in one system
Revenue Collection Kes 600M 500M
No. of businesses
registered
100,000 32,000
2.3 Analysis of Capital projects of the Previous ADP
Table 4: Analysis of Capital projects of the Previous ADP
Project Name/ Location
Objective/ Purpose
Output Performance Indicators Status (based on the indicators)
Planned Cost (Ksh.)
Source of funds
Refurbishment of Retail Markets -
Employment opportunities and improve business environment in the market
Markets rehabilitated 2 markets rehabilitated Work has not commenced
45m CGM
Rehabilitation of
Market Ground
Surface / Drainages
at Kongowea market
To provide an all weather surface for the market.
All weather ground
surface
Drainages rehabilitated
• Graveling
• Concrete slabs
• Drainages
About 60% completed
12m CGM

31
Upgrage of Perimeter wall at Kongowea market by 2 courses
To enhance
security at the
market.
Perimeter wall
upgraded
▪ To raise perimeter wall by 2 courses
▪ Inspection reports
▪ Completion
Certificate
Project not commenced
5m CGM
Construction of standard stalls at Kongowea market
To provide trading
spaces
Market stalls
constructed
▪ No of stalls constructed
451 stall constructed
5m CGM
Purchase of standards & testing equipment
Provide Accurate measurements for trade
• Purchase of
working
standards
• Purchase of
testing
equipment
• Purchase of mass test weights
• 5 sets (1mg – 20kg)
• 2 sets (1mg – 20kg) 4 sets of beam balances ( 100mg, 200mg, 1kg, 5kg, 20kg),
25m CGM
Project Name/
Location
Objective/
Purpose
Output Performance
Indicators
Status (based
on the
indicators)
Planned
Cost (Ksh.)
Actual
Cost
(Ksh.)
Source
of funds
Improvement of
Kongowea market
ground surface /
drainages
To improve Kongowea
market sanitation and
hygienic standards
A Clean and
hygienic market
Rehabilitation of
ground surface &
drainage system
40% 30M 7M CGM
Rehabilitation of market
offices, Kongowea
market
To improve on the
working environment
Improved
service delivery
Painting of market
offices
20% 2.5M CGM
Rehabilitation of
Mackinnon retail market
To improve on trading
environment and
opportunities
Improved
trading
opportunities
Modernized market 100% National
Government
Drilling of water
borehole & installation of
standing mast & water
tank at Kongowea market
To have uninterrupted
flow of water for market
use and fire hydrants
Sufficient water Functional boreholes 100% National
Government
2.5 CHALLENGES EXPERIENCED DURING IMPLEMENTATION OF THE PREVIOUS ADP
• Delays in the preparation of bill of quantities for the intended works. This is as a result
of shortage of man power as the County has one quantity surveyor to undertake such
overwhelming tasks
• Inadequate funds to implement the intended projects.
• Lack of technical capacity amongst staff members.
2.6 LESSONS LEARNT AND RECOMMENDATIONS
• There is need to adopt a proactive approach in preparation of bill of quantities.
• The County should build the technical capacity of its staff in order to realize smooth
implementation of projects.

32
• The County should endeavor to employ adequate number of quantity surveyors which
are key to prepare of bill of quantities for the projects.
• There is need to increase funding for projects.
STRATEGIC PRIORITIES OF THE DEPARTMENT
1. To undertake infrastructure development that promote trade, investment and tourism viz
construction and maintenance of public markets, business parks and recreational parks.
2. To develop and enact County policies and bills that promote trade, investment and tourism.
3. To undertake entrepreneurship development through capacity building and financing of SMEs.
4. To promote private partnership in development of trade, investment and tourism
5. To promote the growth of the informal sector.
6. To promote industrialization by establishing industrial parks with necessary infrastructure, e.g
water, power and roads.
7. To undertake County trade licensing.
8. To promote consumer protection and enhance fair trading practices.
9. To enhance and diversify County revenue base.
10. To boost the level of investors’ confidence in investing in Mombasa.
11. To revitalize Mombasa as a local tourism destination.
12. To create a positive image for Mombasa as an investment hub and holiday destination.
Programme Name : Investment Promotion & Products
Objective: To create a conducive environment for investors Outcome: Mombasa as an investment hub Sub Programme Key outputs Key performance indicators Planned
Targets
Investment Promotion E-Business integrated Integration of E-Business 1 Updated investment portal
Updated investment portal
1
Investment exhibitions/forums done
Number of investment exhibitions/forums 1
Investment certificates issued to potential investors
Percentage increase in the number of investment certificates issued to potential investors
10%
Investment Policy dissemination Investment Policy dissemination to the Stakeholder, County Assembly, Public at the Sub- County level and Stakeholders.
1
New investments Percentage increase in the number of investors 10% Capacity Building Skills development. Projects that have economic gains 50%
Blue Economy opportunity mapping
Coordinating All the County Blue Economy Activities
Identification of the various opportunities within the sector. Package the Investment opportunities and close deals with potential investors.
50%
County Branding and Marketing
To extensively brand and market all county products.
Conducive environment for investments through awareness creation.
30%
Establishment of the Mombasa County Special Economic Zone
Squatter’s resettlement and construction of the SEZ.
SEZ operators and developers on the ground. 30%

33
3. Education Sector
Introduction
The Sector is a stand-alone and has no sub sector. This section provides a summary of what was
planned and what was achieved by the Education sector, challenges and lesson learnt in 2017-
2.2. Sector Achievements in the Previous Financial Year
2.2.1 Education Sector
Table 3: Summary of Education Sector Programmes in the Previous Financial Year Programme Name: Education
Objective: Improve quality of teaching, learning and care
Outcome: Improved enrollment, retention, quality of early childhood education and transition rate
Sub Programme Key outputs Key performance indicators
Planned Targets Achieved Targets Remarks*
Establishment of resource centres
Functional resource centres
No. of resource centers.
6 6 Used available space and resources
Equip ECDE centres with Branded exercise books
Improved quality education
No. of ECDE centres equipped with exercise books.
97 97 Successfully done
Supply of teaching & learning materials
Well-equipped ECDE centres
No. of ECDE centers supplied with teaching& learning materials.
97 97 Successfully done
Establishment of libraries
Increased access to information
No. of libraries operational
6 2 Pended to await resources
Programme: Child Care
Objective: To improve child care services
Outcome: Improved multi-sector approach to dignified care and safety for children
Sub Programme Key outputs Key performance indicators
Planned Targets
Achieved Targets
Remarks*
Establishment of Child protection/rescue center
Improved child safety and protection
No. of child recue/protection centers established
0 0 Not planned for in the year 1 of CIDP
School Milk programme High school retention and completion rate
No. of children benefiting from the feeding program
31,529 31,650 Successfully done.

34
Establish 24-hour hotline services to ensure children safety in and out of schools
Improved child safety and protection
No. of hotline service stations established
1 NIL Pended to await supplementary budget
Program Name (As per the Program Based Budget): Operations and Administration
Objective: Provide Administrative support in the Department Outcome: Efficient and effective implementation of Departmental programs Sub Programme Key outputs Key performance
indicators Planned Targets
Achieved Targets
Remarks*
Random visits to ECD schools and City Polytechnics
Records of visited school
Improvement in target areas as per findings
3 Areas 3 Areas Polytechnic visits pushed to next FY due facilitation constraints
Job description analysis Job description for targeted designations
Clarity and disambiguation in functionalities
17 designations
17 designations
Successfully done
Asset register compilation
Asset register Asset register available in both hard and soft copies
2 2 Successfully done on time
Purchase of office stationery
Delivered stationary
Stationary in use to alleviate acute shortages
8 categories 0 No deliveries due to sluggish procurement process
Identification of Idle and Obsolete Assets
Compiled list of assets
Identified assets pooled together
All areas 100% Deposal yet to be done
Staff recruitment Employed staff
Improved service delivery in areas previously with shortages
123 121 Two declined offer
Preparation and placement of retiring staff
Prepared retiring staff
Staff eagerly awaiting to retire
10 10 Planned awarding ceremony yet to take place
Programme Name: ICT
Objective: Start ICT projects that will empower the community by creating employment
Outcome: Better living standards
Sub Programme Key outputs Key performance
indicators
Planned Targets Achieved Targets Remarks*
No of ICT Hubs established
Human
capital
development,
skills and job
creation
Number of ICT Hubs
established
0 0 No plan for
year 1 of
CIDP
Programme: Elimu Fund& EDC

35
Objective: Improve access to education for the children and youth
Outcome: Improved transition and retention rate
Sub Programme Key outputs Key performance indicators
Planned Targets
Achieved Targets
Remarks*
Granting of Bursaries to needy but bright students across the County
Improved transition and retention rates
No. of beneficiaries in the categories of Special Needs, Secondary, College & University
40,0000 0 Only 20 Million was disbursed out of an approved 300 million. It was used for pending University Bursary awards
2.3 Analysis of Capital projects of the Previous ADP
This provides a brief summary of what was achieved during the previous ADP.
Project Name/ Location
Objective/ Purpose
Output Performance Indicators
Status (based on the indicators)
Planned Cost (Ksh.)
Actual Cost (Ksh.)
Source of funds
Establishment of resource centres
Improve pedagogical skills through making Teaching &Learning materials
Effective service delivery
No. of complete resource centres
Nil 20m Nil Budgetary allocation was pended
Equip ECDE
centres with
play equipment
Increase items for art & play for improved learning outcomes
Equipped ECDE centres
No. of ECDE
centres equipped
with arts and play
equipment
Nil Nil Nil Budgetary allocation was pended
Supply of
teaching &
learning
materials
Improve learning outcomes
Equipped classrooms
No. of ECDE centers supplied with teaching& learning materials.
97 40m Nil Annual PBB
Establishment of
libraries
Develop a reading culture
Effective Service delivery
No. of libraries operational
Nil Nil - Low budgetary allocation
Project Name/ Location
Objective/ Purpose
Output Performance Indicators
Status (based on the indicators)
Planned Cost (Ksh.)
Actual Cost (Ksh.)
Source of funds
Establishment of
Child
protection/resc
ue center
To improve safety among children
Improved child safety and protection
-registers of rescue children - reports
NIL 3M NIL Annual PBB
School Feeding
programme
To improve nutrition and increase enrolment in
Improved nutrition and retention of
-Milk reports Milk -- -monitoring tools
31,650 100M 96.9M Annual PBB

36
public ECDE schools
children in ECDE
-Daily milk drinking registers -Attendance registers -Milk stock records
Establish 24-hour hotline services to ensure children safety in and out of schools
To improve safety among children
Improved child safety
-hotline records -records of cases reported - records of children saved
NIL 2.5M NIL Annual PBB
Project Name/ Location
Objective/ Purpose
Output Performance Indicators
Status (based on the indicators)
Planned Cost (Ksh.)
Actual Cost (Ksh.)
Source of funds
No of ICT Hubs established
To offer young people modern workspace
Human capital development, skills and job creation
Number of ICT Hubs established
Nil 10M Nil Annual PBB
Project Name/ Location
Objective/ Purpose
Output Performance Indicators
Status (based on the indicators)
Planned Cost (Ksh.)
Actual Cost (Ksh.)
Source of funds
School
Construction:
Likoni ECD
center
To improve
access to
quality Pre-
primary
Education in
Mombasa
County
Fully
constructed
ECDE Center
ECDE Center 100%
Complete
27,012,455
Annual PBB
School
Construction:
Longo ECDE
center
To improve
access to
quality Pre-
primary
Education in
Mombasa
County
Fully
constructed
ECDE Center
ECDE Center 90% 27,671,971
Annual PBB
School
Construction:
Kadzandani
ECDE center
To improve
access to
quality Pre-
primary
Education in
Mombasa
County
Fully
constructed
ECDE Center
ECDE Center 100% 29,106,650
Annual PBB
School
Construction:
Utange ECDE
center
To improve
access to
quality Pre-
primary
Education in
Fully
constructed
ECDE Center
ECDE Center 100% 28,836,930
Annual PBB

37
Mombasa
County
School
Construction:
Buxton ECDE
center
To improve
access to
quality Pre-
primary
Education in
Mombasa
County
Fully
constructed
ECDE Center
ECDE Center 92% 19,250,843
Annual PBB
School
Construction:
Kwa Jomvu
ECDE center
To improve
access to
quality Pre-
primary
Education in
Mombasa
County
Fully
constructed
ECDE Center
ECDE Center 92% 28,067,230
Annual PBB
School
Construction:
Digirikani
ECDE center
To improve
access to
quality Pre-
primary
Education in
Mombasa
County
Fully
constructed
ECDE Center
ECDE Center 55% 26,264,610
Annual PBB
School
Construction:
Chaani ECDE
center
To improve
access to
quality Pre-
primary
Education in
Mombasa
County
Fully
constructed
ECDE Center
ECDE Center 66%
27,909,180
Annual PBB
of ECDE Centers To make
facilities
usable
Refurbished
ECDE Center
9 2 Annual PBB
Purchase of 2 Motor Vehicles for Department
To ease mobility for staff
Delivered
Motor
vehicles
2 Vehicles in use
by the
department
0 6,000,0
00
Annual PBB
2.5 Challenges Experienced during Implementation of the previous ADP
i. Weak M&E Systems ii. Inadequate policy documents and regulatory framework to guide the Departmental
functions; iii. Lack of a projects implementation framework;

38
iv. Weak link between the CIDP, ADP and budgets; v. Poor prioritization;
vi. Failure to attain optimality in staffing levels in key technical areas; vii. Inadequate resources
viii. Delays in funds disbursement ix. Inadequate tools and equipment leading to low productivity x. Inadequate of reliable means of transport for staff and tools to/from work sites leading
to low productivity and inadequate supervision xi. Limited capacity within the community to actively participate in development activities
xii. Dilapidated old infrastructure service provision xiii. Lack of an implementation framework for certain programs 2.6 Lessons learnt and Recommendations
i. Need to put in place policy documents to guide most of the Department functions; ii. Need for strengthened link between the CIDP, ADPs and budgets;
iii. Proper prioritization is key; iv. Optimality in staffing levels in key technical departments is key ingredient; v. Sensitization of staff and sector heads on the significance of the ADP will enhance its
delivery capability; vi. Managing stakeholders as a project objective will enhance ADP delivery capability,
ownership and sustainability; vii. Delivery of the ADP is positively supported by a risk mapping and change
management plan; viii. Putting in place a functional monitoring and evaluation plan will enhance ADP
delivery; ix. Managing resource mobilization as a core objective will enhance delivery capability
of the ADP; x. Separation of roles (between owners, implementers and regulators) in the project
cycle management is key to the realization of the ADP; xi. Timelines: All the programmes /projects should have a defined life span. The
implementation period should have a start and an expected end date. Any variation calls for project/ programme review and approval from the relevant authorities; and

39
4. Health Sector The department aims to improve health infrastructure as a key pillar in the health transformative agenda.
Some critical services are being provided sub-optimally. The department has endeavored to bring critical
services closer to the citizen by expanding the scope of services being offered at the sub-County level.
This has been achieved through upgrading and construction of several health facilities to a sub-County
hospital level. These facilities are Mrima (50 Bed), Likoni Sub-county Hospital, Tudor Sub-County
Hospital, Marimani and Chaani are at 95% completion rate. While Mtongwe and Vikwatani are still
ongoing.
Sector/ Sub-sector Achievements in the Previous Financial Year
• The strategic priorities of the sector/sub-sector
The key strategic objectives and outcomes have been aligned to the Kenya health policy 2014-
2030 objectives and policy orientations which provide the policy framework to progress towards
attainment of vision 2030 goal for the health sector and universal health coverage. The ADP is
anchored on the six policy objectives seeking to eliminate communicable diseases, halt and
reverse burden of non-communicable diseases, reduce the burden of violence and injuries,
provide essential health care, minimize the exposure to health risk factors and strengthen
collaboration with other sector actors
• Analysis of planned versus allocated budget
The Department of Health was allocated a total budget of KES 2,923,643,133 for the FY 2019/2020 of
which Recurrent Vote accounts for KES 2,683,387,579 whereas Development Vote is 240,255,554.
I. Absorption rate in the previous year – Ksh 2,349,734,332 (after supplementary budget) against expenditure of Ksh.2,689,421,123 (114% )
II. Utilization of funds will be linked to compliance with set budget levels and shall be according to voted provisions in the printed and supplementary books.
• Key achievements
The Mombasa County HIV/AIDs prevalence 4.1 % form 7.5 %( NASCOP , 2018)
In 2017/18 the county hospital deliveries increase from 30584 to 31659 (78% coverage) with
reduced maternal mortality rate from 177/100000 live births to 168/100,000 live births),
under five hospital mortality rate at 41/1,000, neonatal mortality rate of 18per 1000 live births
and the infant mortality rate of 28/1,000, MMR, Malaria incidence rate is at 7.3.
The under one year of age fully immunized reduced from 85% to 80 % coverage due to health
care workers industrial action. During the review period 3 facilities were upgrade- Likoni SC
Hospital (Theatre), Tudor SC Hospital (Maternity Theatre) and Mrima Maternity Hospital (50
bed capacity). The County referral hospital Increased specialized services such as Oncology and
cardiac surgeries. Also notable is catastrophic spending which is below 4.5%

40
Summary of Sector/ Sub-sector Programmes
General Administration, Planning and Support Service
Objective: To increase access to quality effective health care services
Outcome: Provision of high-quality service delivery in an informed, supportive and conducive environment
Sub Programme Key outputs Key performance indicators Planned Targets
2018
Achieved targets remarks
Health policy, planning and financing
Improved policy implementation
No. of health policies/ guidelines implemented & legislated
2 2 Health bill passed by County assemble
HIV differentiated care implementation ongoing
Strengthened planning, and implementation of sector plans
Review and develop health sector investment and strategic plan
1 1 Stakeholders views in cooperated in the plan- implementation ongoing
Increased financing for county health services
% increase in resource allocation
27 21.5 The County’s Budget was revised downwards because of non-attainment of revenue targets
% increase in revenue collection
461Million 391Million Achievement below target due industrial action- ongoing
Increased absorption of allocated funds budget
83 83 Refer non-attainment of revenue target
Quality assurance & standards
Institutionalized quality assurance and practice
No. of health facilities accredited
1 0 Ongoing for lab
No of health workers trained on quality Assurance
20 95 Primary Health Care facilities, Sub county, level 4 & 5, County QITs trained –support by Palladium
No. of functional Quality Improvement teams
5 16 Program to roll out reactivation of Quality Improvement Teams planned.
Health Information Monitoring and Evaluation
Strengthened monitoring and evaluation of county health programs
Number of Performance review and reports prepared and disseminated
1 1 APR process started-ongoing
Sector working group development Report
1 1 Done -document available
No of data quality audits conducted/support supervision
15 20 HIV DQA(EMR) and Malaria done supported by Partners

41
Revitalized and functional Health integrated M& E TWG
1 1 Team in place and TOR developed
Number of HRIO providing service
15 4 taken on casual basis
2 HRIOs resigned
1 retired
1 died(critical shortage)
No of facilities with revised HMIS tools
240 240 Purchased and Distribution of tools done quarterly-ongoing
No of facilities with integrated County and sub county integrated LMIS(software/hardware)
42 20 Not functional – plans under way to replace it with commodity tracking tool
No of facilities with integrated EMR
1 0 Inadequate hardware
- Process ongoing
Computerization of EMMS Management system in pharmacy(level 4&5)
- 1 Commodity tracking system in place and functional at level 4&5
Health products and technologies
Improved commodity management
Annual Forecasting and quantification reports prepared
1 1 Done and in use for planning of commodities
Quarterly commodity order placement
4 3
Commodity order fill rate 100 72% 100% not achieved due to shortages at KEMSA
% reduction in the proportion of expired drugs
5 7 Expiries occurred due to short dated supplies of program commodities
No. of health workers trained on commodity management and appropriate drug use
60 0 Trainings have not been done
Strengthened evidence use in decision making
Functional data base for health research established
1 0 To be done in the near future
Leadership and governance
Improved oversight and Accountability
Hospital Management Boards for level 4. established
2 0
No of health facilities committees trained
5 6

42
No of health workers trained on senior management
20 15
No. of stakeholders meeting held
20 10
Health Infrastructure
Improved access to KEPH Services
Number of level 2/3 facilities renovated/constructed with maternity unit
1 1 Mrima H/C upgraded with theater and 50 bed maternity capacity- operationalized
No of facilities refurbished 10 10 ongoing
No. of new level 4 facilities completed
2 2 3 others ongoing at 90% completion rate
No. of container clinics operationalized in the informal settlements
2 0 Allocation to the counties delayed due to EACC/ parliamentary health committee audit
No. of health workers recruited
722 40
No. of staff promoted 326 85
No. of staff and documents uploaded into iHRIS
2291 250
No. of Dashboards developed
4 1
Proportion of departments on PC
100% 100% PC develop and implementation Process ongoing
Human resource management and Development
Improved number of staff and skills
Proportion of staff on PAS 100% 100% Implementation Process ongoing
Integrated HRIS 100% 100% Implementation of regulatory HRIS (rHRIS) for interoperability to be implemented in the current year

43
Programme Name : PREVENTIVE AND PROMOTIVE HEALTH
Objective: To increase access to quality effective Promotive and preventive health services
Outcome: Reduced incidence of Preventable Diseases and ill Health and
Improved maternal and child health
Sub Programme Key outputs Key performance
indicators
Planned
Targets
Achieved
Targets
Remarks*
Administration, School
health and health
promotion
Deworming of
school going
children
No. of school children
dewormed
219,450 286,032
School deworming program
supported by Evidence action
Administration, School
health and health
promotion
Hygiene
promotion
(wash)
No. of schools reached
with wash messages
60 5 No support for the activity
Administration, School
health and health
promotion
Adolescent
reproductive
health
promotion
No. of school children
reached with reproductive
health messages
1,000 1406 Supported by Marie stopes
Administration, School
health and health
promotion
Strengthen
leadership and
governance in
primary health
care
No. of facility management
teams trained
14 0 No Funding
Communicable Diseases
Control
Zero HIV
transmission
% HIV + pregnant mothers
receiving preventive ARV’s
80% 97% Spark – university of South
Africa. County Gov
supported graduation.
COMBO from Global Fund
% of HIV + Pediatrics on
ARVs
80% 86%
Communicable disease
control
Reduced
Malaria
prevalence
LLITN distribution to:
- Pregnant mothers
- Children under
one
60%
55%
81.5%
40.2%
Under reporting for the
under ones data by health
workers
Documentation issue at
service delivery point
Communicable disease
control
Reduced TB
morbidity and
mortality
No. of TB patients
completing treatment
90% 89% Support from KAPTLD on
CHV defaulter tracing
Case finding for pediatric
TB
12% 10% Support from Centre for
Health Solution

44
Maternal and Child
health
Reproductive
health services
Increase uptake of family
planning
49% 33% UHC Funds and Tupange
Pamoja support – activities
ongoing
Maternal and Child
health
Up scaling of
immunization
of Under 1yr
children
% of fully immunized
children
95% 80% The industrial action
RRI and routine
Immunization ongoing
Maternal and Child
health
Increased
women
attending ANC
visits
% of women attending 4th
ANC visits
68% 54% ongoing
Maternal and Child
health
Early cancer
detection
No. of females screened for
cervical
cancer/Breast/Prostrate
50% 1.6%
(3776/365
217)
ongoing
Non Communicable and
Nutrition
Early detection
of dietary –
related
conditions
% of clients with BMI
more than 25
54516
6.9 %
( 27719)
ongoing
Non Communicable and
Nutrition
Health children % of under five children
supplemented with
vitamin A
50% 87.4% ECD campaign supported by
County
Non Communicable and
Nutrition
Quality and
safe food for
human
consumption
No. of premises inspected
and licensed
food handlers medically
examined
5000
26000
3099
25,000
ongoing
Public health Reduce
incidence of
vector-borne
diseases
% of household spread
with IRS
70% 5% ongoing
Public health Strengthen
surveillance
and response
% of health facilities
submitting weekly IDSR
report
85% 65% ongoing
Alcohol and Drug
Abuse
Improved
access to DSA
treatment &
rehabilitation
% of addicts managed and
rehabilitated
60% 10% Inadequate funding to
facilitate ADA activities.
Alcohol and Drug
Abuse
Informed
community on
DSA
% of people reached with a
drug abuse prevention
information
54% 15%

45
Programme: Curative and Rehabilitative Health Services
Objective: to improve quality of health care sevices
Outcome: Reduced Morbidity and Mortality
Sub Programme Key outputs Key performance indicators Planned
Targets
Achieved
Targets
Remarks*
County referral services (CPGH)
Improved access to specialized care services
Number of dialysis machine and beds acquired and supplied
14 14 Increased number of patients accessing specialized services
Number of pediatric ICU cots with monitor and ventilator
1 0
Number of consultant Oncologists recruited
1 1
Number of Cath lab for cardiac surgery
1 0
Number of rehab centres operationalized/Functional
1 1
Mental Health Improved access to psychiatric and rehabilitative care
Rehab Centre refurbished 1 0
Number of sub-county hospitals providing comprehensive emergency obstetric care
1 1
Number of sub-county hospitals with fully functional maternity, postnatal and new born unit
1 1 Mrima at Likoni sub county launched
Secondary services Strengthened intermediate referral services
Number of sub-county hospitals providing comprehensive rehabilitative services(physiotherapy and occupational therapy)
1 1
% increase in deliveries assisted by skilled personnel
70 78 Delivery coverage increased by 8% after industrial action
Number of children under 5 years treated for diarrhea
32277 34411
Increased number of diarrhea cases(Against target -6%) due to poor sanitation and inadequate fresh water
Reduced Average Length Of Stay (ALOS) in hospital
ALOS (Days) 6 4.7 This is an efficiency indicator – if all other things (resources) being equal, a shorter stay will reduce the cost per discharge and shift care from inpatient to less expensive post-acute cases
Reduced diarrhea cases % of facilities with oxygen delivery facilities
50 30% Inadequate funds
Number of sub-county hospitals that have undergone full laboratory accreditation
1 1
Number of sub-county hospitals with basic lab equipment (chemical analyzer and hematology machine)
1 3
Strengthened laboratory and
Number of QC lab established 1 1

46
Laboratory and Diagnostic Services
radiological diagnostic services.
Number of lab technologists providing service
12 38
Number of sub-county hospitals with Basic radiology equipment (X-ray and Ultrasound)
1 2 Improved diagnostic cases
Number of Radiographers providing services
5 14
Primary Services Improved access to primary health care services
Number of health care facilities conducting deliveries
2 13 Increased number of pregnant mothers’ delivery in hospital
Number of primary care facilities providing lab service
3 27 Improved diagnosis and management of patients
Analysis of achieved Capital projects of the Previous ADP Project Name/
Location
Objective/
Purpose
Output Performance
Indicators
Status (based
on the
indicators)
Planned Cost
(Ksh)
Actual
Cost
(Ksh)
Source of
funds
Shika Adabu 30
bed Hospital –
LikoniSub County
Increase access
to medical care
Number of
people
seeking
Health care
services
Completion
certificate
55% 55,823,355 CGM
Marimani 30-bed
Hospital Kisauni
SubCounty
Improve access
to health care
Number of
people
seeking
Health care
services
Completion
certificate
100% 55,609,245 CGM
Vikwatani 30-
bed Hospital
Kisauni
Improve access
to health care
Number of
people
seeking
Health care
services
Completion
certificate
85% stalled 54,031,377 CGM
Chaani 30- bed
Hospital
Changamwe Sub
County
Improve access
to health care
Number of
people
seeking
Health care
services
Completion
certificate
100% 59m CGM
Shika Adabu
Maternity –
Likoni S. C.
Expand
maternity
services
Number of
persons
seeking
maternity
services
Completion
certificate
90% stalled 11m CGM
Tudor S. C.
Hospital theatre
Decongest
Coast G. Hosp.
of mothers who
require
operation
Number of
CS cases
Completion
certificate
100% with
defects
11m 11m Danish
Govt. Red
cross

47
Cabro at Dept. of
Health
Headquarter.
Improve the
working
environment at
the Dept. HQ
Clean and
conducive
for staff
Completion
certificate
100% 3.9m 3.9 CGM
Parking shade
and sentry at the
Dept. of health
HQ.
Provide sentry
for the security
manning the
gate and shade
for the vehicles
Completion
certificate
100% 3.9m 39m CGM
Construction of
Mrima Maternity
Hospital
Increase access
of maternity
services at
Mrima and the
Environs
Number of
deliveries
Completion
certificate
100% 75m 75m MSF
Belgium
Construction of
Delivery Room at
Mikindani H/C
Increase access
of maternity
services at
Mikindani
Number of
deliveries
Completion
certificate
100% 400,000 400,000 MSF
Belgium
Construction of
Post Natal Ward
at Bokole H/C.
Changamwe/
Air Port
Improve
maternity
services at
the facility
Quality
Improvement
20% July 2019-
October 2018
2M KRA
Procure 5
fogging machines
Control of
mosquito
vector
Reduced
morbidity
Delivery note 100% 15M 15M COG
Construction of
maternity at
Likoni S.C.
hospital
Increase access
of maternity
services at
Likoni to
decongest CGH
Number of
Deliveries
Completion
certificate
100% 18m 18m Base
Titanium
Theatre at Tudor
- When inspecting the works with the contractor there were a number of defects detected.
The Contractor promised to make good the defects but did not.
- The roof was leaking during the rainy season despite the assurance from the contractor
that the drainage of the roof was taken care of.
Lessons learnt and Recommendations 1. For any project to start the client should look at the drawing make criticism, add or subtract
what is necessary before construction commences.
2. The contractors should provide the work progress program which should include flow for
funding to be provided to county treasury for appropriate funding and payments.
3. The consultant together with the project manager should prepare a site visit programme to
enable all players participate in supervision and monitoring of works

48
5. Environmental Protection, Water and Natural Resources Sector This sector is represented by the Departments of:
a. Water, sanitation and natural resources
Analysis of Capital projects of the Previous ADP (2019/2020) Project Name/ Location
Objective/ Purpose
Output Performance Indicators Status (based on the indicators)
Planned Cost (Ksh.)
Actual Cost (Ksh.)
Source of funds
COUNTY FUNDED PROJECTS
Increase water supply
To increase supply of water by 1,500m3 per day
Reduced distance to water. Improved Access to water.
Procured 2 No investors for the Desalination project.
▪ 1No for Likoni site. and 1No for Shimo La Tewa site facilitated by the Transactional Advisor.
2 No Investors Procured.
25.0m 25.0m CGM
Launched the Desalination Project
Not Yet CGM
Completion of the 22 No. B/Hs Project.
7 No Almost Completed.
45.0m 10.40m CGM
10 No. Wells Completed Tender Documents stage for 6 wells
25.0m 0.0m CGM
Increase water supply coverage
To increase water supply coverage by 12km of pipeline network
▪ Increased access to water.
▪ Increased Revenue
▪ Reduced distance to water
10.5 km of pipe line laid from Kashani to Vikwatani
Tender Documents done.
102.0m 0.0m CGM
10.5km of pipeline laid from Mwakirunge to Maunguja
Advertised and the process to procure the contractor on-going.
0.0m CGM
2.6km of pipeline laid from Frere Town to Kisimani
Advertised and the process to procure the contractor on-going.
0.0m CGM
1.0km of pipeline laid for Jomvu mission.
Advertised and the process to procure the contractor on-going.
0.0m CGM
Improvement of Sanitation and Hygiene
To improve Sanitation /Hygiene Levels for 1,000 people
Motivated users Improved Hygiene Improved Revenue
10 No Public Toilets rehabilitated
Tender Documents stage
40.0m 0.0m CGM
7No. Public primary Schools benefited from WASH project.
Tender Documents done.
70.0m 0.0m CGM
Improvement of Working Environment
To improve working Environment for 17 staff
Improved service delivery
1 No Office block Renovated Completed
10.0m 11.05m CGM
1 No New Office block constructed

49
Resettlement Action Plan
(RAP)
To resettle 300 project affected people (PAP
PAP resettled or sorted out
1000 No PAPs resettled RAP report at final stage
30.0m 0.0m CGM
Survey & Design
To Enhance cost Effective project planning & costing.
Design Report
4 No Design Report 4 Survey & Design Reports in place.
10.0m 0.0m CGM
DONOR FUNDED PROJECTS
WSDP
(World Bank)
To improve water supply and Sanitation
coverage
Improved water supply and Sanitation
coverage
Works Contract signed for Rehabilitation and Extension of Mombasa water supply distribution –Lot 2B
Advertised and the process to procure a contractor is on-going.
1.65b 0.0m CGM
Works Contract signed for improvement of storm water outlets and combined sewer overflows in Mombasa Island.
Advertised and the process to procure a contractor is on-going.
601.35m 0.0m CGM
4 No Water Bowsers purchased.
Awaiting No objection from the WB to finalize the contract.
62.0m 54.0m CGM
2 No Vacuum Exhausters Purchased
Awaiting No objection from the WB to finalize the contract.
24.0m 22.0m CGM
2 No Vehicles (Double Cabin) Purchased
Awaiting No objection from the WB to finalize the contract.
12.0m 12.0m CGM
Works Contract signed for rehabilitation of Kipevu WWTP and the existing sewer system.
Advertised and the process to procure a contractor is on-going.
374.94m 0.0m CGM
KWS&RP
To improve water supply coverage
Improved water supply a
coverage
40km of new Pipeline completed in Likoni-Phase 1
50km pipeline Completed
210.0m 400.0m WB
PAP Verification report for Jomvu DMA
At final stage 100.0m 0.0m WB
Procured contractor for Jomvu DMA project.
Contractor procured and is on the ground.
100.0m X WB
Final design for Nyali DMA Design Finalized 100.0m X WB
ADB funded projects
To improve Sanitation coverage
Improved Sanitation coverage
Procured Contractor for Changamwe Repooling sewerage project.
Contractor procured and is on the ground.
100.0m X ADB

50
b. Environment, Energy & Solid Waste Management Table 4: Summary of Sector/ Sub-sector Programmes
Programme Name (Environment):
Objective: To ensure compliance with set environmental laws and regulations Outcome: Compliance Sub Programme Key outputs Key performance
indicators Planned Targets Achieved Targets Remarks*
Decommissioning of Kibarani Dumpsite
Ecological rehabilitation of dumpsite
- Cessation of
dumping at site
- Reclamation
practices
Total rehabilitation of the dumpsite
15% achieved at rehabilitation
Parks & Cemeteries
Improved aesthetics of county roads, traffic islands, parks, burial sites and other open spaces
- No of roads and open spaces landscaped
- No of rehabilitated county cemeteries
Beautification of Mombasa Roads
60% Roads have been beautified
Programme Name (Waste Management):
Objective: To develop an efficient waste collection and disposal system Outcome: efficient waste collection and disposal system Sub Programme Key outputs Key performance
indicators Planned Targets Achieved Targets Remarks*
Anti-littering and Waste management
Inculcate a culture of responsible waste handling
- No of schools
trained
- No of public
barazas trained
- Binning programs
- No of community
Clean ups
Responsible waste handling
50% achieved through clean ups
Acquisition of Machinery, Equipment and Tools for Waste Collection and transfer
Coordinated and organized dumping
- Clear access
- Zoned dumping
Equipped with enough Machinery for Collection and Transfer of Garbage
30%
Acquisition/ leasing of appropriate waste collection transfer stations.
Controlled waste disposal
- Existence of
developed waste
collection transfer
stations.
Acquired Waste Transfer Station
30%

51
Programme Name (Energy):
Objective: To promote the development and use of efficient and alternative energy sources Outcome: efficient and alternative energy sources Sub Programme
Key outputs Key performance indicators
Planned Targets Achieved Targets Remarks*
Mapping of County energy resources
Baseline feasibility data
- No of Energy
resources in the
County
- Data on the
Energy
resources in the
County
Increase renewable energy sources in the County
20% achieved through clean ups
2.3 Analysis of Capital projects of the Previous ADP
Project Name/ Location
Objective/ Purpose
Output Performance Indicators
Status (based on the indicators)
Planned Cost (Ksh.)
Actual Cost (Ksh.)
Source of funds
Purchase of Twelve (12) Garbage Collection Trucks
To facilitate efficiency in garbage collection from transfer points to the dumpsites
Twelve Faw Trucks
No. of trips to the dumpsite (Av 40Trips in a day) No. of Transfer Points cleared on a Monthly basis
Closure of several transfer points
130M 103M CGM
Refurbishment of Environment yard and Cabro carpeting
To enhance the working conditions at the yard/parking space
Well carpeted yard, and organized parking space
Cabro Carpet on entire yard No. of Trucks parked in the yard
Complete Cabro Carpet on the yard Well and organized truck parking in the yard
50M 45M CGM
Tree Planting and Beautification
To improve the aesthetics of the city/climate change adaptation measures
Improved flower gardens alon Mombasa streets Mangroove trees planted
No. of streets Beautified No. of Mangroove trees planted
All Mombasa streets improved by planting flowers beds
80M 65M CGM
Container Office/toilet Construction at Mwakirunge
To provide office space to the staffs at the dumpsite
Offices and Latrine Toilets
No. of Offices No. of Latrine Toilets
50% Complete Construction of Container Offices and latrines
5M 4.3M CGM
Research, survey and Feasibility Studies
To find out the causes of gaps in departmental activities
Research reports
No. of Submitted reports
Submitted reports of findings on Mtopanga, Kaa chonjo and Maduba Areas
10M 8M CGM

52
Lessons learnt and Recommendations Lessons Learnt:
1. Integrated approach which include the beneficiaries easen project planning and implementation
Recommendation:
1. Development funds to be deposited in the departmental Bank Accounts that is designated for
development activities to fast track effective implementation of projects.
2. There should be little gap between the budget presented to the public and that of supplementary

53
6. Social Protection, Culture and Recreation Sector This sector is represented by the Department of:
a. Youth, Gender, Sports and Cultural Affairs.
Sector/ Sub-sector name Summary of Sector/ Sub-sector Programmes
Programmes (P) / Sub
Programmes (SP)
Key Outputs Key Performance Indicators Targets
P1: Administration, Planning and Support Services Training of Staff
Sp1: Administration Services
Outcome: Efficient delivery of services and customer satisfaction
Delivery Units Service Delivery
Sp2: Personnel services Development of service charters
Outcome: Improved service delivery
Delivery Units Policy and Administration
P2: Youth Affairs
Sp1: Youth Economic Empowerment
Delivery Units Directorate of Youth Affairs and revolving fund
board
Empowerment of 10,000 youth
through training, skills
development and financial
support
Outcome: Empowered youth.
P3: Gender Affairs and Disability Mainstreaming Empowerment of 5,000 women
and PWDs. Sp1: Economic empowerment of women and PWDs
Delivery Units Directorate of Gender
Outcome: Empowered women and persons living with disability.
P4. Sports Development Improvement of 9 sports ground
and provision of sporting
equipment
Delivery Units Directorate of Sports
Outcome: Improved livelihoods for sportsmen and women
P5: Cultural Affairs 5 cultural sites and monuments
preserved. Sp1. Promotion, development and preservation of Cultural heritage
Delivery Unit Directorate of Culture
Outcome: Preserved positive cultural practices, sites and monuments
P5: Public Recreation and Entertainment -construct I Community cultural
center
- rehabilitate I public park
Sp1. Promotion and development of recreation and public entertainment facilities
Outcome:
Delivery Unit Directorate of Cultural Affairs

54
Analysis of Capital projects of the Previous ADP 2019-2020 Project Name/ Location
Objective/ Purpose
Output Performance Indicators
Status (based on the indicators)
Planned Cost (Ksh.)
Actual Cost (Ksh.)
Source of funds
Renovation of County Stadium
To improve the stadium to international standards. To nurture sports talent
Increased sporting activities at the stadium
Renovated stadium
Project stalled
61,290,854.90 39,000,000 County Government
Renovation of Mikindani social hall
• To provide social amenity to the community
Easy access to social amenities
Number of bookings by the community
Number of indoor games played at the facility
Project completed
5,393,580 5,393,580 County Government
Renovation of Majengo social hall
• To provide social amenity to the community
Easy access to social amenities
Number of bookings by the community
Project completed
3,719,200 3,719,200 County Government
Construction of uwanja wa mbuzi
• To provide a modern mini stadium for the community
To nurture youth sports talent
Number sports events held at the facility
Project completed
66,270,664 66,270,664 County Government
Renovation of Tudor social hall
• To provide social amenity to the community
Easy access to social amenities
Number of bookings by the community Number of indoor games played at the facility
Project completed
6,200,000 6,200,000 County Government
Renovation of Tononoka social hall
• To provide social amenity to the community
Easy access to social amenities
Number of bookings by the community Number of indoor games played at the facility
Complete 12,033,050 9,300,000 County Government
Construction of Bomu stadium
To provide a mini stadium to the community
To nurture youth sports talent
Number of sports activities held at the facility
Complete 85,075,195 85,075,195 County Government

55
7. Agriculture, Rural and Urban Development Sector The sector comprises of the following sub sectors/Departments;
a. Agriculture, Livestock, Fisheries and Cooperatives Development
b. Land, Housing and Physical Planning
Agriculture Sub Sector The strategic priorities of the sub-sector and sub-programs:
- Increase crop production and productivity through employment of better farming practices and protection of farming area.
- Promote Land management and development
- Increase market access for livestock products through marketing initiatives and establishment of processing and value addition facility.
- Increase livestock production through establishment of modern farming practices, provision of better inputs and favorable environment for the livestock
- Capacity build the sub sector staff to improve service delivery
- Improve Cooperative governance and establish county cooperative legislation and policy framework for cooperative growth
- Developing Akamba Handcraft to access foreign markets
- Increase the co-operative membership to 63,000 members
- Setting up a training fund to promote savings mobilization and promotion of enterprise
development
- Strengthening cooperative supervisory advisory and auditing
- Develop one major cooperative for fish farmers to deal with value additions
- Promote Matatu saccos to organize the transport sector
Departmental Achievements in the Previous Financial Year
Main achievements in the department include: Main achievements in crops sub department include:
• Purchase of certified crop seed: 8000 kg Hybrid maize seed which was given to 3000 farmers and 4000kg hybrid cowpeas seed which was given to 2000 farmers in all the 30wards, 306kg assorted vegetable seeds given to 600 vegetable farmers.
• Capacity building of 75 staff & 24,636 stakeholders
• Rehabilitation of 5 water pans (3 in Kisauni, 1 in Jomvu, 1 in Likoni), equipped with solar water pumps and storage tanks.
• 685 acres of land ploughed by county tractors for crop production Main achievements in the livestock sub department include:
• Through our livestock extension we had targeted to improve the percentage of households accessing food to 70% and achieved the target.
• Increased quantities of animal produce and products to 12%, and was achieved
• We targeted to issue 300 farmers with subsidized inputs and achieved 3000

56
• Increase the number of livestock breeds to 180,000 and achieved 181,930
• Through our livestock extension we had targeted to improve the percentage of households accessing food to 70% and achieved the target.
• Increased quantities of animal produce and products to 12%, and was achieved
• We targeted to issue 3000 farmers with subsidized inputs and achieved 300
• Increase the number of livestock breeds to 180,000 and achieved 181,930
• Vaccination of 12,207 Livestock against trade sensitive diseases,1242 Dogs and Cats against Rabies disease,7,189 Livestock dewormed,
• 392,099 livestock were slaughtered, carcasses inspected and passed as fit for human consumption.
Summary of Sub-sector Programmes Programme Name : CROP MANAGEMENT
Objective: Improve livelihoods by promotion of competitive farming, appropriate policy and development environment, effective support services, sustainable natural resources and Land management Outcome: Efficient service delivery, Improved livelihoods & household food security and nutrition Sub Programme Key
outputs Key performance indicators
Planned Targets
Achieved Targets
Remarks*
1.Administration, Planning and Support Services
Staff trained
-Number of staff capacity build
- Number of stakeholders capacity built
- Number of technical staff recruited
48 5000 45
75 24,636 0
Staff capacity building 1.Intergrity training at KSG 2. Integrity training at CDA board room 3.Preformance appraisal system sensitization for staff by Devolution department 4. Performance management training by Devolution department 5.Senior Management course at KSOG Stakeholders capacity building: Done during -57 barazas held -230 on farm demos done -5 farmer field days held -312 farmer group visits -1417 individual farm visits -1 Agricultural show held -8 4k clubs trained -160 farmer trainings achieved Staff recruitment: Nil due to no funds allocated
2.Crop Production and Productivity
Improved food security and incomes at the household level.
- Increase in number of households accessing food -Number of farmers benefiting from input subsidy programme -Acres put under vegetable production under micro irrigation - Acres put under production through mechanization
11,000 5000 7 acres 400acres
12,318 5600 11acres 685 acres
-8000 kg Hybrid maize seed & 4000kg hybrid cowpea seeds which was given to 5000 farmers in all the 30wards -306 kg Assorted vegetable seeds given to 600 farmers -5 water pans were rehabilitated for vegetable production under irrigation (3 in Kisauni, 1 in Likoni, 1 in Jomvu) -685 acres of land was ploughed by the 3 county tractors & ksh 822,000 was realized as revenue
3. Marketing and value addition
- Percentage increase in quantity of local produce accessing the retail market
5%
5.1%
-42 women, youth and PLWA groups were trained on value addition and agro processing

57
Number of groups women and youth engaged in value additions for employment creation - Number of value added products accessing the market - Percentage Increase in the farm household income
40 5 12%
42 7 14%
Programme Name (LIVESTOCK PRODUCTION)
Objective: To improve productivity of Livestock and livestock produce through effective extension services Outcome: Improved household food security, nutrition and income Sub Programme Key outputs Key performance
indicators Planned Targets Achieved Targets Remarks*
Administration, planning and support services
Staff capacity build Stakeholders capacity build
Number of staff capacity build
Number of livestock stakeholder’s capacity build
Number of technical staff recruited
13 3000 7
5 1500 0
Staffs were capacity build in management of incubator technologies in poultry rearing.
Livestock Production and Productivity
Improved Farmers issued with subsides Number of livestock increased Increase in productivity
Percentage of households accessing food Number of farmers issued with subsidized inputs Increase in the number of livestock breeds Percentage increase in Quantities of animal produce and products
70% 3000 180,000 12%
60% 300 181,930 10%
22 groups were issued with 1800 breeding birds
Marketing and value addition
Percentage increase in quantity of local produce accessing the retail market Number of groups engaged in value addition for employment creation Percentage Increase in the number of value added products accessing the market Percentage Increase in the household income
70% 12 20%
65% 5 8%
Four more groups are marketing eggs and chicks within themselves. Also selling poultry for meat. Value addition has not picked

58
20%
10%
Programme Name: Veterinary services
Objective: To prevent and control animal pests and diseases and improve animal welfare Outcome: Healthy and productive animals Sub Programme Key outputs Key performance
indicators Planned Targets Achieved Targets Remarks*
Disease, pest control and management
Animals vaccinated.
% increase in animals vaccinated against trade and public health sensitive diseases
16,000 vaccinated animals
12,207 vaccinated animals 1242 Dogs and Cats against Rabies
Timely and adequate facilitation
Livestock slaughtered and inspected.
% livestock slaughtered and inspected in licensed slaughter house
400,000 livestock slaughtered and inspected.
392,099 livestock slaughtered and inspected.
Livestock farmers benefitted with subsidized vaccines and veterinary supplies
No. of farmers issued with subsidized veterinary inputs
1000 farmers issued with subsidized Vaccines and Veterinary supplies
1220Households Benefitted with vaccines and veterinary supplies
Rehabilitation of Makupa Poultry Slaughter hse
No of slabs rehabilitated
One targeted Nil rehabilitated
Administration, Planning and Support Services
staff capacity build
Number of staff capacity build
25 staff capacity build
18 Capacity build
Technical staff recruited
Number of technical staff recruited
22 technical staff recruited
None
Animal health and animal welfare stakeholder’s capacity build
Number of Animal health and animal welfare stakeholder’s capacity build
1000 Animal health and animal welfare stakeholder’s capacity build
941 stakeholder’s capacity build
Programme Name: Fisheries
Objective: Increase fish production and productivity, Quality assurance, Value addition and marketing Outcome: Increased food security, nutrition and improved livelihoods Sub Programme Key outputs Key performance
indicators Planned Targets Achieved Targets Remarks*
Acquisition of modern fishing boats and gears
Increased deep sea capture fish production
Boats procured 28 28
Capacity building of Beach Management Units
Enhance management of fisheries resources
Number of BMUs trained
14 14
Conduct land and sea patrols
Ensure compliance to fisheries laws and regulations
Number of patrols 4 4

59
Improve fish quality assurance, handling and value addition
Fish handling standards observed
Procurement of assorted fish handling equipment including cooler boxes, fish racks and weighing scales
30 cooler boxes 30 fish racks 20 weighing scales
30 cooler boxes 30 fish racks 20 weighing scales
Programme Name : Cooperatives
Objective: Enhance market access and value addition for Co-operatives Outcome: Sub Programme Key outputs Key performance
indicators Planned Targets
Achieved Targets Remarks*
Developing Akamba
Handcraft to access
foreign markets
Developing
Akamba
Handcraft to
access foreign
markets
Increased incomes Creation of employment
Incomes from international markets Number of new jobs created Increased returns to members
Carry out a baseline survey Q1 International exhibitions Q2 Certification of products Q3 Liaison office Q4
An online platform (Shop) has been developed, Linkage with a number of online marketing companies
Need to build capacity of the staff to manage the online platform
Set up a training fund to promote savings mobilization and promotion of enterprise development
A fully fledged fund supporting co-operative development in the county
Number of co-operatives benefiting from the fund Number of dormant societies revived Amount allocated to the fund Number of programs conducted from the fund
Set up the fund 15 new cooperatives registered Train 3,000 cooperative leaders Revive 10 dormant societies
The department had just moved from the department of trade and there was no budget provision on the same
There need to complete the cooperative policy to facilitate implementation of this program.
Digitize the department and Develop the cooperative business information centre
Connect the dept with the other departments and stakeholders. Develop an information center
Department of cooperative to go digital Online reports Improved supervision
Q1 develop a prototype Q2 Go life Q3 Integrate with Co-operatives Q4 Online publications
Nil Lack of facilitations and other inbound logistics
Strengthen cooperative supervisory advisory and auditing
Effective extension services Conduct of timely interim and final audits
Enhanced
information to the
cooperative
movement
Cooperative policy Cooperative Act
The policy is in the progress of development held back by the need to await the completion of a National policy on cooperatives
The National government continues to exhibit proportionate interest in the management of cooperatives
To hold industrial exhibitions, ASK Show and trade exhibitions in the county per year.
Increase the
number of
cooperatives
participating in
the ASK show
Better visibility for
co-operatives
Increased
membership in
cooperatives
To participate in the annual ASK programs
Fully achieved The sub program well integrated in the system.

60
Renovate the cooperative stand
Increased confidence
with cooperatives
Develop one major cooperative for fish farmers, to deal with value additions
Registration of
the cooperative
for these
enterprises
Value addition on
these value
chains
Increased
incomes to the
members
- Organized fish
formers, bee-
keepers, poultry
farmers
- Increased access to
the market
- Value added
products
Certifications by
KEBs
Q1 organize the farmers and register Q2 value addition Q3 certification of products
Poultry farmers registered
The program is continuing into the new CIDP
Promote Matatu saccos to organize the transport sector
Matatu Saccos
code of conduct
Matatu Sacco
discipline
enforcement
mechanism
Matatu saccos
liason office
Bi-annual reports for
the matatu sacco
association
- Saving reports by
the matatu saccos
Develop the code of conduct Sensitization
forums
50% achieved Need more resources than provided
*Remarks:
• The sub department had planned to construct a value addition centre but this was not
achieved due to budgetary constraints.
Analysis of Capital projects of the Previous ADP Brief summary of what was achieved during the previous ADP is outlined in the table below.
Project Name/Location
Objective/purpose Output/ Outcome
Performance Indicators
Status based on Indicators
Planned Cost (Kshs
Actual Cost (Kshs)
Source of funds
Farm Inputs subsidy programme
Kisauni, Likoni, Jomvu, Changamwe, Mvita & Nyali sub counties
Improve infrastructure, productivity and outputs
Improved food & nutrition security
5600 farmers issued with subsidized inputs
6,411,120 6,411,120 County government of Mombasa
Promote cottage industries and strengthen value chain development
Mvita, Nyali, Changamwe, Kisauni, Likoni, Jomvu sub counties
To promote value addition of agricultural produce
Improved livelihoods of the household in the county
42 women & youth groups engeged in agro processing and value addition
10,691,140 10,691,140 County government of Mombasa

61
Project Name/Location
Objective/purpose Output/ Outcome
Performance Indicators
Status based on Indicators
Planned Cost (Kshs
Actual Cost (Kshs)
Source of funds
Acquisition of modern machinery and equipment for sustainable land development and crop management
All Sub counties To promote mechanization of agricultural practices
Improved crop production and productivity
685 acres of farm land ploughed using the 3 county tractors
2,000,000 2,000,000 County government of Mombasa
Promotion of micro irrigation and rehabilitation of water pans
Kisauni, Jomvu, Likoni
Improve productivity
Improved food & nutrition security
-5 water pans rehabilitated and equipped with drip irrigation equipment and water tanks -11 acres of land opened up for vegetables under micro irrigation
19,800,550 6,411,120 County government of Mombasa
Project Name/ Location
Objective/ Purpose
Output Performance Indicators
Status (based on the indicators)
Planned Cost (Ksh.)
Actual Cost (Ksh.)
Source of funds
Improved indigenous poultry production
To
improve
food
security
1800 birds issued to farmers and 300bags of feeds
Percentage of households accessing food Number of farmers issued with subsidized inputs Increase in the number of livestock breeds
60% 300 181,930
1,000,000
1,150,000
County Government of Mombasa
Rabbit production To improve food security
300 rabbits issued to farmers
1,000,000 00
Dairy goats To improve food security
100 dairy goats
2,500,000 0
Project Name/ Location
Objective/ Purpose
Output Performance Indicators
Status (based on the indicators)
Planned Cost (Ksh.)
Actual Cost (Ksh.)
Source of funds
Purchase vaccines, acaricides, Veterinary supplies and vaccination campaign
Herd immunity improved and reduced incidences of disease outbreak
Number of Animals against trade and public health sensitive diseases
% increase in animal vaccinated against trade and public health
12,207 animals vaccinated 1242 Dogs and Cats
18,409,115 1149,950 County government

62
sensitive diseases
Rehabilitation of Makupa Poultry Slab
Ensure safety and wholesomeness of Meat consumed
One Slab rehabilitated
Number of slab rehabilitated
Not done 9,000,000 Nil County
government
Purchase of Motorcycles
Improve efficiency in service delivery
Service delivery improved
Number of motorcycles procured
Non procured and supplied
3,200,000 Nil County
Government
Purchase of a vehicle
Improve efficiency in service delivery
Service delivery improved
Number of vehicles procured
Non procured and supplied
6,000,000 Nil County
Government
Purchase of backup generators
To improve Herd immunity and reduce incidences of disease outbreak
Cold chain for vaccines sustained
Number of backup generators purchased
Non purchased
800,000 Nil County
Government
Project Name/ Location
Objective/ Purpose
Output Performance Indicators
Status (based on the indicators)
Planned Cost (Ksh.)
Actual Cost (Ksh.)
Source of funds
Procurement of fishing boats and gears
To Increase fish production form capture fisheries
Increased fish production
Monthly fish catch statistics/report
Ongoing 200 Million 198 Million
County Government
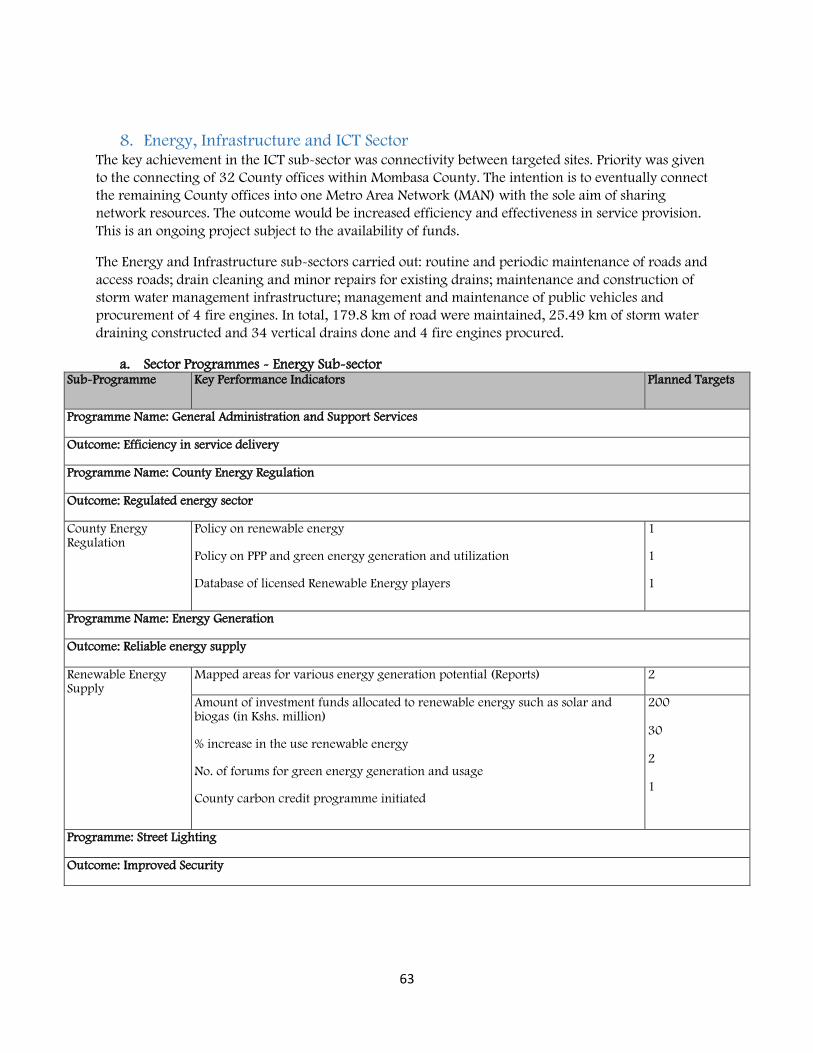
63
8. Energy, Infrastructure and ICT Sector The key achievement in the ICT sub-sector was connectivity between targeted sites. Priority was given
to the connecting of 32 County offices within Mombasa County. The intention is to eventually connect
the remaining County offices into one Metro Area Network (MAN) with the sole aim of sharing
network resources. The outcome would be increased efficiency and effectiveness in service provision.
This is an ongoing project subject to the availability of funds.
The Energy and Infrastructure sub-sectors carried out: routine and periodic maintenance of roads and
access roads; drain cleaning and minor repairs for existing drains; maintenance and construction of
storm water management infrastructure; management and maintenance of public vehicles and
procurement of 4 fire engines. In total, 179.8 km of road were maintained, 25.49 km of storm water
draining constructed and 34 vertical drains done and 4 fire engines procured.
a. Sector Programmes - Energy Sub-sector Sub-Programme Key Performance Indicators Planned Targets
Programme Name: General Administration and Support Services
Outcome: Efficiency in service delivery
Programme Name: County Energy Regulation
Outcome: Regulated energy sector
County Energy Regulation
Policy on renewable energy
Policy on PPP and green energy generation and utilization
Database of licensed Renewable Energy players
1
1
1
Programme Name: Energy Generation
Outcome: Reliable energy supply
Renewable Energy Supply
Mapped areas for various energy generation potential (Reports) 2
Amount of investment funds allocated to renewable energy such as solar and biogas (in Kshs. million)
% increase in the use renewable energy
No. of forums for green energy generation and usage
County carbon credit programme initiated
200 30 2 1
Programme: Street Lighting
Outcome: Improved Security

64
Sub-Programme Key Performance Indicators Planned Targets
Public and Street Lighting
Policy on street lighting formulated
Number of constructions (Installed lighting points Mass lighting poles)
% reduction in crime rate Number of street lights installed and maintained
Number of street lights maintained
1
4000
5
20 12,000
b. Sector Programme - Roads Sub-sector Sub-Programme Key performance Indicators Planned Targets
Programme Name: General Administration and Support Services Outcome: Efficiency in service delivery Programme Name: Roads Infrastructure Outcome: Increased efficient mobility, draining of affected areas, lit streets and well managed advertisement points. Roads Development Planning (Efficient network connectivity; Improved accessibility and Sustainable management of road reserves)
Road development and management policy Code and standards of road developed and implemented No. of km of paved road done No. of km of road maintained
1 1 45 65
Drainage and storm water management
Drainage and storm water policy developed No. of km of drainage and storm water constructed Drainage and storm water maintained
1 8 60
Advertisement and Compliance
Number of illuminated signs/Welcome signboard constructed Number illuminated signs/Welcome signboard maintained
86 36
c. Sector Programme – Transportation Sub-sector Sub-Programme Key Performance Indicators Planned Targets
Programme Name: General Administration and Support Services
Outcome: Efficiency in service delivery
Programme Name: Transportation
Outcome: Safe and efficient movement of people and goods.
Non-Motorized Transport (NMT)
NMT development and management policy Km of walkways and rest facilities done Number of footbridges constructed Km of NMT maintained
1 17 3 20

65
Sub-Programme Key Performance Indicators Planned Targets
Transport and public Safety
Safety policy developed
Number of Speed control facilities/Road Signs constructed
Passenger picking points constructed
1 100 20
Traffic Management
Transport management policy developed
Number of traffic Lights and pedestrian Railings put up
Number Traffic Lights Pedestrian Railings maintained
1
110
120
Parking
Parking policy
Number of intra-city Bus terminals/Parking silo constructed Number of on road parking maintained
1
1
220
Water Transport
Water transport policy
Number of Jetties/ Access roads constructed
Number of Jetties/ Access roads maintained
1
4
2
Fleet management Number of timely and accurate fleet reports produced
Tracking system installed
14
1
Transport mechanical services
Number of timely and accurate maintenance reports produced
New Fleet, rubber boat insurance cover, Spare parts
14
25

66
d. Sector Programmes - Public Works Infrastructure sub-sector Sub-Programme Key Performance Indicators
Planned Targets
Programme Name: General Administration and Support Services Outcome: Efficiency in service delivery Programme Name: Public Works Outcome: Well designed, constructed and managed structures. Professional services for public buildings and other public works (Architectural, Structural & Civil, Quantity Surveying and contract management services, Electrical (Building services), Mechanical (Building services), Building Maintenance)
Professional services for public buildings and other public works done Number of timely and accurate maintenance reports produced Number of offices constructed Number of offices maintained
7 7 2 14
Electrical
Number of timely and accurate maintenance reports produced
14
Building services including Building Mechanical services
Number of timely and accurate maintenance reports produced Number of buildings maintained
14 14
e. Sector Programmes - Fire fighting and Rescue Services Sub-sector Sub-Programme Key Performance Indicators Planned
Targets
Programme Name: Fire Fighting and Rescue Services
Outcome: Improved public and property safety
Fire Fighting Number of minutes taken to respond to fire emergency
Number of fire stations constructed
5
1
Rescue services Planning
Number of minutes taken to respond to emergency 40
Coast Guard rescue services
Number of minutes taken to respond to emergency 40
Programme Name: Administration and Support Services
Outcome: Efficiency in service delivery to departments, affiliated bodies and organizations
Administration, Planning and Support Services Records
Number of staff recruited
No. of staff trained
No. of policies developed
40
30

67
2.3: Grants, Benefits and Subsidies
The county government has been receiving grants through exchequer issues to finance programs
in the various Sectors as per the outlined guidelines
Table 7: 2019/2020 FINANCIAL YEAR GRANTS
DEPARTMENT GRANTS AMOUNT
FINANCE AND ECONOMIC PLANNING
Kenya Devolution Support Program Level 2 Grant - 18/19
259,416,946
Kenya Devolution Support Program- 18/19 53,333,725
Kenya Devolution Support Program- 19/20 30,000,000
TOTAL 342,750,671
AGRICULTURE Agriculture Sector Development Support Program II 16,374,963
TOTAL 16,374,963 TRANSPORT AND INFRASTRUCTURE CA-Fuel levy fund
200,344,594
TOTAL 200,344,594
EDUCATION Conditional Allocation for development of Youth Polytechnics
25,473,298
TOTAL 25,473,298
COUNTY HEALTH CA-User Fees Forgone 23,385,934
COUNTY HEALTH Level 5 H 388,439,306
COUNTY HEALTH DANIDA
24,562,500
COUNTY HEALTH Transforming Health Systems for Universal Care Project (World Bank-IDA)
37,921,806
COUNTY HEALTH Leasing of Medical Equipment
131,914,894
TOTAL 606,224,440
WATER, SANITATION & NATURAL RESOURCES World Bank Development Project 1,550,000,000
TOTAL 1,550,000,000
TOTAL GRANTS Total Grants 2,741,167,966

68
2.4 Challenges Experienced During Implementation of the previous ADP
The challenges experienced by the county during the implementation of the previous plan
• Human Resource Inadequacies
• Inadequate information management systems
• Insufficient collaboration and coordination amongst difference agencies and lack of
organized stakeholder fora in the county
• Weak and uncoordinated networks on technology development and dissemination (extension services poor)
• Inadequate basic infrastructure (Office space, transport facilities and ICT equipment).
• Lack of materials for demonstration and lack of facilitation for extension staff to d Inadequate funding
• Delayed funding
• Weak Legal and Regulatory Framework
• lack of sub-department policies and regulations
• Inadequate capacity to adapt and mitigate climate change effects
• High input prices and adulteration
• Vulnerability of UPA to adverse impacts of climate change
• Scarce land for agricultural development in urban and peri-urban areas
• Insufficient water supply for use in UPA activities
• Vulnerability of UPA to adverse impacts of climate change
• Vulnerability of UPA to negative impacts of environmental degradation
• High incidence of emerging crop pests and diseases
• High rate of change of land use. (Competing land, water, and power uses)
• Increasing environmental pollution
• Limited value addition,
• Lack of county agro-processing infrastructure (post-harvest management facilities etc.)
• Inadequate financial system arrangements in favor of establishment of cottage processing
industry
• Lack of succession planning in the department

69
2.5 LESSONS LEARNT
The key lessons learnt from the implementation of the previous plan and proposed
recommendations for improvement are outlined in the table below
Challenges Lessons learnt Recommendations
Capacity:
• Human Resource Inadequacies (few skilled and competent staff, lack of staff trainings on UPA technologies, lack of promotions, ageing technical staff and poor succession management)
• Inadequate information management systems
• Insufficient collaboration and coordination amongst
difference agencies and lack of organized stakeholder fora
in the county
• Weak and uncoordinated networks on technology development and dissemination (extension services poor)
• Inadequate basic infrastructure (Office space, transport
facilities and ICT equipment).
• Lack of materials for demonstration and lack of facilitation
for extension staff to disseminate the information
Continuous Staff development is important
• Capacity building of staff
• Develop a succession plan
• Recruit staff to replace those exiting through retirement and natural attrition.
• Proper deployment of staff is their areas of specialty
• Fast track promotion of staff
• Strengthen Extension farmer
research for a
• Equip offices with IT equipment
to enhance work performance
Funding:
• Inadequate funding
• delayed funding
Make requisitions at
beginning of financial year • Lobby for decentralization of
some treasury functions
• Put in place a mechanism for
resource mobilization to reduce
pressure on the equitable share
from the national government
Legal & policy:
• Weak Legal and Regulatory Framework
• lack of sub-department policies and regulations
Work in liaison with the
county attorney to develop
agricultural policies
• formulate agricultural policies
an
• Formulate agricultural
regulations to anchor
agriculture at the county level
Lack of breeding programme Takes long to improve the
local breeds and also a lot of
inbreeding leads to poor
productivity
Introduce Artificial Insemination and
come up with a breeding program for the
county
Lack of marketing infrastructure Animals being sold along
road reserves.
Revenue collection not done
Sale yards construction should be fast
tracked
No animal burial site and pound animal carcasses being
disposed in undesignated
areas poses health risk
In collaboration with relevant department
develop an animal burial site.

70
Challenges Lessons learnt Recommendations
Lack of county livestock infrastructure (abattoirs, hides and skins processing units, animal pound)
Leads to livestock illegal
slaughter posing health risk
and loss of revenue
Constructing an abattoir, sale yard and
hides and skins processing and value
addition facility and animal pound.
Lack of basic infrastructure for animal restraints during vaccinations For safety of staff carrying
out vaccinations and other
procedure.
Promote use of vaccination crush and Goats and sheep pens for hand spraying and pour on application and vaccinations
Lack of reliable basic veterinary diagnostic facility For quick disease
interventions and early
response there is need for a
lab in the county
Establish a Veterinary Laboratory in Kisauni Sub County
Risk preparedness
• Inadequate capacity to adapt and mitigate climate change effects
• High input prices and adulteration
• Vulnerability of UPA to adverse impacts of climate change
• Scarce land for agricultural development in urban and peri-urban areas
• Insufficient water supply for use in UPA activities
• Vulnerability of UPA to adverse impacts of climate change
• Vulnerability of UPA to negative impacts of environmental degradation
• High incidence of emerging crop pests and diseases
• High rate of change of land use. (Competing land, water, and power uses)
• Increasing environmental pollution
• Limited value addition,
• Lack of county agro-processing infrastructure (post-harvest management facilities etc.)
• Inadequate financial system arrangements in favor of establishment of cottage processing industry.
• Inefficient marketing environment and unsafe UPA produce and products
• Poor quality assurance systems (products that don’t meet market standards)
•
• Land for crop
production is
reducing due to
urbanization
• Climate change is
real
• Deforest ration
needs to be
controlled
• High
temperatures
contribute to high
incidence of pests
& diseases
- Promote water harvesting at house-hold level e.g. Roof catchment.
- Initiate and promote climate smart agriculture to arrest dangers of pollution.
- Promote appropriate technology that reduces water loss through evapo-transpiration, e.g. shade structures.
- Promote intensive production of high-value crops which can still fetch high returns from small land areas.
- Develop an input subsidy program to cushion farmers against high cost of inputs.
- Have a strategic reserve of pesticides & insecticides
-
- Promote irrigated production by equipping existing water pans with irrigation equipment and explore the possibility of using the natural water resources present to promote irrigation.
- Excavate water pans and rehabilitate existing ones through a work for asset program.
- Promote adoption of modern urban and periurban technologies such as shed structures, kitchen gardens hanging gardens, rooftop and balcony gardens.
- Develop an input subsidy program to enhance affordability and access by the farming community.
- Enact land use policy to control conversion of agricultural land into real estate.(spatial planning).
- Train staff on handling of emerging pests and subsequently train farmers on IPM to help deal with emerging pests.
- Mainstream climate change initiatives in agricultural activities to promote resilience (adaptation) and mitigation.

71
Challenges Lessons learnt Recommendations
- Promote organic farming thus reduce pollution
- Develop a value addition incubation center where upcoming agro-processors can hone their skills.
- Develop an agriculture credit guarantee scheme to increase credit access by agro-processors.
- Train groups in small scale value addition.
- Improve and develop postharvest facilities
- Give the department the agricultural produce inspection mandate through the training of inspectors to check of food quality and minimum residue levels in food before it consumed
High diseases and pests challenges and re-emerging diseases Causes loss of livestock
productivity and loss of
livelihoods
Develop a strategy to manage re-emerging
and emerging pests and diseases
Mandate Challenges Interventions
Co-operative policy
formulation and
implementation at the
county level
The National government was to have finalized on the
National cooperative policy; this has experienced
inordinate delay with poorly managed stakeholders’
engagement
A team has formed to consider a draft policy
at the sub-unit level to be finalized within
this financial year.
County Co-operative
Legislation
The Act did not go through in the last county assembly,
luckily the national cooperative Act is enforceable at the
county level
The department should ensure enactment of
this Act is concluded
Co-operative savings,
credit and Banking
services
This requires setting up a fully-fledged section within
the department, staff it properly and develop full
capacity for the section. This has been hampered by
lack of resources for the department, no specific
allocation to the department to build capacity. This
entailed space for filling, safe custody and staff
There is need to address this gap going
forward to avoid overdependence with the
national government which may not be
sustainable
Co-operative
Governance
258 cooperatives to be supervised by 7 officers is a tall
order, but it is made more complex by the fact that the
department has only one vehicle that is now
experiencing mechanical problems.
The movement demand for services continues to
increase and extends on Saturdays and Sundays putting
an extra strain on already stretched work force.
This is the area for intervention and in a big
way,
Finish the office renovations,
Provide officers with laptops,

72
Avail at least three printers for sharing or
provide the big printing machine that has
photocopying ability of heavy duty
Constant supply of stationeries
Provide facilitation for officers working on
weekends and special assignment like
inspections and inquiries
Co-operative
Marketing, including
value addition and
processing
Promotion of Co-
operative Ventures
There should be a fully-fledged section dealing with
marketing which should be well facilitated. This would
enable the department to carry out market research,
conduct marketing activities for cooperatives within
certain value chains, and promote special purpose
vehicles for different frontiers for the market like the
youth, women, agricultural marketing, fishing,
handicraft and others. With these limitations the unit
achievements are constrained
Create a fund for the cooperative
department to support all these initiatives
Cooperative audit
This is a very engaging function and a specialization,
auditing in its very nature requires a lot of time,
resources for publishing accounts as per the law and
space for storing audited accounts for a reasonable
time. The function has only four technical officers
including the head of audit, has no support staff of its
own a limitation that hampers service delivery, has no
sufficient office equipment like stationeries,
photocopiers, internet, printers, biding machines,
enough space for a registry and financial allocation to
facilitate the function.
It is the major source of fund for the department in
terms of A-I-A with approximately ksh 850,000 raised
last financial year.
There is need to capacity building the
function as we capacity build the entire
department, specific needs include:
More staff
Sufficient office equipment
Fully fledged registry

73
CHAPTER THREE: COUNTY STRATEGIC PRIORITIES, PROGRAMMES AND
PROJECTS
3.1 Introduction
This chapter presents the sector/sub-sector strategic priorities, programmes and projects for the
year. The programmes and projects envisage a green economy by mainstreaming cross-cutting
issues such as climate change; environmental degradation; Disaster Risk Reduction (DRR)
HIV/AIDs; Gender, Youth and Persons with Disability (PWD); among others.
3.2 Planned Targets for the Sector/ Sub-sector programmes
3.2.1 General Economic and Commercial Affairs Sector
➢ Finance and Economic Planning
Programme Name: General Administration, Planning and Support Services
1. Objective: To improve turnaround time on the Department’s processes
Outcome: Improved service delivery Sub Programme Key performance indicators Planned
Targets
Service Delivery Number of staff trained on performance appraisal Proportion of staff on PAS Proportion of sections on PC No of staff capacity build
140 100 100 25
County Emergency Fund Services Increase the amount in the annual budget allocated to disaster management fund 200
Programme Name: Financial Management Services
Outcome: Improved public financial management
Accounting services Number of timely and accurate financial reports produced in conformity with the PFMA Integrated real time accounting system in place Percentage increase in cash flow management Proportion of accounting and financial records managed electronically Level of budget implementation Reduction in budget deficit
12
1
100
80
100
80
Supply Chain Management Services
Level of compliance with public procurement laws and regulations An integrated automated assets management system in place Proportion of county assets safeguarded and managed Proportion of county supplies safeguarded and managed
100
1
100
100

74
Risk Management Services Risk management framework developed Percentage decrease in financial management irregularities (queries)
1
10
Resource Mobilization Services A fully integrated automated revenue collection system implemented Resource mobilization framework developed Percentage increase in local revenue collection % increase in external funding as a percentage of county revenue
1
1
20
15
Programme Name: Economic Planning, budgeting and Policy Coordination
Outcome: Improved policy formulation, planning, budgeting and implementation in the County
Economic Planning, budgeting and Policy Coordination
Number of policies prepared/reviewed Number of development plans prepared/reviewed Sector plans prepared Number of reports prepared on SDGs
30 4 8 1
Budget preparation coordination No. of financial reports/reviews done % absorption of allocated funds Levels of compliance with the budgetary preparation timelines Percentage increase in the participation of the state and non-state actors in the budget cycle
4 100 100 100
County Statistics and research County statistical office operationalized to increase in accessibility of reliable county data County Statistical Abstract developed Number of research studies/ surveys undertaken
1 1 1
Monitoring and Evaluation An automated monitoring and evaluation system Monitoring and evaluation framework Handbook of reporting indicators CMES established and operationalized CIDP, MV2035 and KJP implementation coordination mechanism County performance review reports
1 1 1 1 1 4
2020-21 Budget Projects
PROJECTS Sub County/Ward COST (SHS)
Refurbishment of Non-Residential Buildings- Offices and decentralized
banking halls
All Wards
50,000,000
Other Infrastructure and Civil Works – Revenue Cess Barriers All Wards
100,000,000
Upgrading of the County Revenue systems All Wards
50,000,000
Rehabilitation of access roads to the barriers All Wards
30,000,000
Research, Feasibility Studies, Project Preparation and Design, Project
Amalgamating of the various revenue streams
All Wards
120,000,000
Total 350,000,000

75
➢ Trade Tourism and Investment
INVESTMENT
Project Name Location/
Ward
Objective Output/ Outcome Performance Indicators
Time Frame (Start- End)
Implementing
Agencies
Cost (Kshs)
Set up of the Mombasa County Industrial Park - SEZ
Miritini To set up an Industrial Park Industrialization SEZ Operators and developers.
Q2-Q4 CGM
PPP
200M
Investment Forum/ Exhibition
County To bring together investors, financiers and Government.
Close potential investment deals
MOUs and Investment deals signed
Q3 CGM
Donors
30M
Investment Marketing
To increase in the traffic of the IP
County Branding Website traffic and interaction
Q1 CGM 10M
Blue Economy opportunity mapping
County Coordinating All the County Blue Economy Activities
Identification of the various opportunities within the sector. Package the Investment opportunities and close deals with potential investors.
Sector products packaged for investors.
Q1 CGM 5M
Establishment of Mombasa County Value addition centre
Likoni To provide investment opportunities
I value addition centre Q4 CGM 45m
Investment Promotion
E-Business integrated Integration of E-Business
A functional system Q1 CGM 2M
Updated investment portal Updated investment portal
An interactive system with an online presence and traffic
Q1 CGM 2M
Investment exhibitions/forums done
Number of investment exhibitions/forums
Closed deals Q3 CGM
Registration of persons
30M
Investment certificates issued to potential investors
An investment certificate issued to potential investors
1 investor awarded. Q2 Ken Invest
CGM
1M
Investment Policy dissemination
Investment Policy dissemination to the Stakeholder, County Assembly, Public at the Sub- County level and Stakeholders.
Knowledgeable staff and business community
Q2 CGM 5M
New investments Percentage increase in the number of investors
Job creation Q4 CGM
NITA
1M
Capacity Building Skills development. Projects that have economic gains
Skilled workforce on PPP and Investment appraisal techniques
Q3 CGM 3M

76
TOURISM
Project Name Location/ Ward
Objective Output/ Outcome Performance Indicators
Time Frame (Start- End)
Implementing Agencies
Cost (Kshs)
Destination management system
County wide Create an online marketing platform for tourist information
1.Increase Visibility and visitation in Mombasa County 2. Access to accurate data on bed occupancy
1. Higher ranking in search engines
2.Increase in the number of online bookings
Sept-march
County Government
20 Million
Blue flag Accreditation of Jomo Kenyatta Public Beach
Shanzu Development of clean,
secure and
environment
friendly
beaches
1. Improve recreational experiences on the beaches
2.Sustainably
manage public
beaches
Blue flag accreditation
certificate
Ongoing-march 2020
County Government
10 million
Training of Tour guides
County wide Vet and Train 300 tour guides to professional level
Enhance tourist experiences in the county
Number of tour guides trained
Sept-Dec 2019
County government
10 million
Branding and Signage of tourist attractions
County wide To create visibility of attraction sites in the County
Improve visitation to the attraction sites
Number of signage developed
July-Dec 2019
County Government
10million
Destination promotion through events
County wide To promote the County through events and festivals
Increase visitation and visitor experiences in the destination
Number of events and festivals
July-June County Government
40 million
Construction of an open air tourist market
Bamburi Link community to the tourism value chain
Improved earnings from tourism
1 tourist market developed
July-June County Government
10 million
Semi Annual Tourism Magazine
County wide To increase visibility of the County’s tourism offers
Increased number of tourists
2 promotion magazines developed
Q1 and Q3
County government
6 million

77
TRADE
3.2.1 Administration & Planning
Table 5: Administration & Planning Programmes Programme Name (As per the Programme Based Budget): Administration & Planning
Objective: To provide a conducive working environment for staff Outcome: Conducive work environment & motivated staff Sub Programme Key outputs Key
performance indicators
Planned Targets
Modernization & Digitization of Departmental Records
Effective management operations
3 computers 2 scanners
Office renovations & refurbishment
Effective & efficient service delivery
Renovated offices
Purchase of office furniture Effective & efficient service delivery
Office furniture purchased
3.2.2 Trade Development
Table 6: Trade Development programmes
Programme Name (As per the Programme Based Budget): Trade Development
Objective: To provide an enabling environment for growth of trade Outcome: Conducive environment for business Sub Programme Key outputs Key performance indicators Planned Targets
Reconstruction & Rehabilitation of Retail markets & Wholesale markets
• Employment opportunities for youth created
• Reduction in no of youths involved in crimes
• Improve business environment in markets
• Additional trading space created
• Retail markets rehabilitated ( Mwembe Tayari)
• Retail market reconstructed (Majengo)
2 retail markets
Civil Works at Kongowea Market
• Enhance trading environment
• Drainage works done
• All weather ground surface constructed
• Face lift through painting done
• Plumbing works done &
• Electrical works done
• Drainage works
• Improvement of ground surface
• General painting
• Plumbing &
• Electrical works
All drainage works
Modernization & digitization of 3 cess collection points
• Enhanced revenue collection
• Weighbridges installed at cess points
• 3 weighbridges installed
• 12 cameras installed
50% increase in revenue collection

78
• CCTV cameras installed
Establishment of business & industrial parks
• Improved business opportunities
• Plant for Processing of primary products i.e. industrial, fisheries, Livestock & Agricultural products
• Biashara centres
• Auto show rooms
• Biashara centres established
• Value addition center established
• Auto mobile park established
• I value addition centre established
• I automobile park established
• 2 Biashara Centres established
Capacity building of SMEs on basic management skills
SMEs trained No of SMEs successfully 100 persons trained
Development of trade licencing bill
Trade licensing bill enacted • Draft bill
• Stake holder meetings
• Bill enacted
• Bill signed into law
The bill enacted & operationalized by June 2020
Purchase of standards & testing equipment
Standards and testing equipment
purchased
• Purchase of working standards
• Purchase of secondary
reference standards
• Purchase of testing equipment
• Purchase of mass test weights
• 5 sets (1mg – 20kg)
• 2 sets (1mg – 20kg)
• 4 sets of beam balances ( 100mg, 200mg, 1kg, 5kg, 20kg)
• 2x5kg, 10x10kg, 40x20kg, 30x100kg, 40x200kg, 50x500kg, 40x1000kg
Verification of weighing & measuring equipments
Accurate weighing & measuring equipment for trade
• No of equipment verified 12,000
Bi-annual calibration of standards & testing equipment
Accurate standards & testing equipments
• No of standards & testing equipment calibrated
75 mass stds, 11 measures of capacity & 6 length stds, 13 testing equipment & 33 T/Ws calibrated
Inspections of traders’ premises to ensure compliance with W & M Act and TDA
Inspections carried out to ensure compliance
• Number of inspection visits to traders premises
500

79
3.2.3 Ease of Doing Business
Table 3: Ease of Doing Business Programmes
Programme Name: Ease of Doing Business
Objective:To create a conducive environment to promote business growth
Outcome: Automation of Business Services
Sub Programme Key outputs Key performance
indicators
Planned Targets
Electronic
Business Services
Integration of SBP, Liquor
License & Fire certificate in
one system
Revenue Collection Kes 600M
No. of businesses
registered
100,000
3.3 Capital Projects
Table 7: Summary of capital Projects to be implemented during 2020/2021
Project Name Location/ Ward
Objective Output/ Outcome Performance Indicators
Time Frame (Start- End)
Implementing Agencies
Budget (Kshs)
1. Rehabilitation of Retail markets
Mwembe Tayari
Provide additional trading space in markets
• Employment opportunities for youth
• Reduction in no of youths involved in crimes
• Improve business environment in markets
1 Retail markets rehabilitated (Sega & Mwembe Tayari)
Oct-March
CEM/CO-TRADE
30M
2. Modernization of Makupa market into a 2 storey building with a basement parking
Makupa Provide additional trading space in markets
• Employment opportunities
• Improve business environment in markets
1 retail market reconstructed
Oct-March
CEM/CO-TRADE
120M
3. Civil Works at Kongowea Market
Kongowea • Enhance trading environment
• Improve business environment in markets
• Drainage works
• Improvement of ground surface
• General painting
• plumbing &
• electrical works
Nov - June
CEM/CO-TRADE
30M

80
Project Name Location/ Ward
Objective Output/ Outcome Performance Indicators
Time Frame (Start- End)
Implementing Agencies
Budget (Kshs)
3.Establishment of Biashara Centres
Changamwe & Nyali
To provide investment opportunities
• Improved business opportunities
2 Biashara Centrs established
Oct - Dec
CEM/CO-TRADE
80M
4.Establishment of Mombasa County Value Addition Centre
Likoni To provide investment opportunities
• Processing of primary products i.e. industrial, fisheries, Livestock &
• Agricultural products.
I value addition centre established.
Sept-April
CEM/CO-TRADE
45M
5.Establishment of Aautomobile Park
Changamwe To provide investment opportunities
• Show rooms & motor vehicle assembly plants established.
I automobile park established
Aug - June
CEM/CO-TRADE
100M
6.Modernization & digitization of three cess collection points
Miritini, shanzu & Likoni
Enhance revenue collection
• Installation of weighbridges &
• CCTV cameras
% Increase in cess revenue collected
Sept – Dec
CEM/CO-TRADE
30M
7. Purchase of Standards & Testing Equipment
Whole county Ensure consumer protection & fair trade practices
• Purchase of working standards
• Purchase of secondary reference standards
• Purchase of beam scales
• Purchase of inspection equipment
• Purchase of test weights
• 5 sets (1mg – 20kg)
• 2 sets (1mg – 20kg)
• 4 sets of beam balances ( 100mg, 200mg, 1kg, 5kg, 20kg)
• Roller weights
Oct - March
CEM/CO-TRADE
25M
8.Modernization & Digitization of Departmental Records
Bima Towers (9th Floor)
Safe custody of records & easy retrieval of information
• Effective management operations
• 3 computers
• 2 scanners
Sept –
Dec CEM/CO-TRADE
1.5M
9.Office renovations & refurbishment
Bima Towers 9th floor
• Enhance better working environment
• Effective & efficient service delivery
• Renovated offices
Sept –
Dec CEM/CO-TRADE
7M
10. Purchase of office furniture
Bima Towers 9th floor
• To provide a conducive work environment
• Effective & efficient service delivery
• Office furniture purchased
Sept –
Dec CEM/CO-TRADE
7M

81
3.2.2: Public Administration & International (Or Inter-Government) Relations Executive Services
Capital Projects to be implemented during the plan period 2020/21
Project Name Location/ Ward Objective Output/ Outcome
Performance Indicators
Time Frame (Start- End)
Implementing Agencies
Cost (Kshs)
Construction of Governor’s residence.
Kisauni / Mwakirunge ward
To establish an official Governor’s residence for efficiency in service delivered
Governor’s residence constructed
Completion of the Construction of the House and furnishing in the next financial year
1 year July 2020-June 2021
County Government of Mombasa.
50,000,000
Construction of the Deputy Governor’s residence
Mvita/ Tudor ward
To establish an official Deputy Governor’s residence for efficiency in service delivered
Deputy Governors house constructed
Completion of the Construction of the House and furnishing in the next financial year
1 year July 2020-June 2021
County Government of Mombasa.
33,000,000
Construction of Sub County Court
Likoni/ Mjambere ward
To ensure legal service is easily accessible at the grassroots.
County Court constructed
Completion of the Construction of the County Court and furnishing in the next financial year
1 July 2020 –June 2021
County Government of Mombasa
30,000,000
• Mitigating adverse Cross-sector impacts: State mitigation measures that may be adopted 1. Weekly director meetings with staff. 2. Monthly Chief Officers and directors’ meetings. 3. Establishing quarterly Chief Officers and directors’ sectorial meetings.
➢ County Public Service Board
Sector/ Sub-sector programs 3.2.1 Finance, Administration and Corporate affairs
Programme Name (As per the Programme Based Budget): Finance, Administration and Corporate affairs
Objective: 1. To Establish and abolish offices in the County Public Service 2. Appoint persons to hold or act in Public offices 3. Exercise disciplinary control 4. Promotion of values and principles of Public Service 5.Facilitate the development of coherent, integrated human resource planning Outcome: Competent, Motivated and disciplined workforce Sub Programme
Key outputs Key performance indicators
Planned Targets Achieved Targets
Remarks*

82
Customer satisfaction survey
1. To determine the level of Customer Satisfaction to the following service attributes:
• Speed of service
• Quality of service
• Affordability
• Courteousness
• Information on services
2. To identify critical gaps in the service delivery system and recommend interventions.
3. Satisfaction with adherence to the commitments set out in the service charter.
4. To determine the level of satisfaction with respect to Board’s Complaints Management System.
5. To determine the adequacy, relevance and access to information provided by the Board through its media platforms
6. To determine an overall external customer satisfaction index.
1. Satisfied customers 2. Data for informed
decision making 3. Good customer
relations
1. Score on customer satisfaction index
2. Customer retention rate
3. Decline in customer complaints
4. Service charter awareness
1st March 2020 – 31st March 2020
Request management system
1. Streamlining of request 2. Submission of request
online 3. Track status of request,
take any necessary follow-up actions and give feedback
4. Track the progress of the request and see who is currently working on it
5. To improve service deliver
1. Satisfied customer 2. No. of Request
fulfilment 3. High level & quality
service to both our internal and external client’s
1. Accountability and transparency in service delivery
2. Adherence to the service charter
3. Timely and Quality service delivery
4. Spearheading the Boards corporate image
5. Risk management 6. Reduction in
unnecessary workload
1st March 2020 – 31st March 2020

83
3.2.1.1 Additional Sub-Sector program
Programme Name (As per the Programme Based Budget): Finance, Administration and Corporate affairs
Objective: 1. To Establish and abolish offices in the County Public Service 2. Appoint persons to hold or act in Public offices 3. Exercise disciplinary control 4. Promotion of values and principles of Public Service 5.Facilitate the development of coherent, integrated human resource planning Outcome: Competent, Motivated and disciplined workforce Sub Programme Key outputs Key performance
indicators Planned Targets Achieved
Targets Remarks*
E-Board Management System
1. to run Board/committee meeting effectively, without paperwork.
2. to create an online board portal to easily share board packs, communicate with board members, keep and access board documents from a central place
3. Projecting of minutes and packs during board meetings
1. Quick information sharing
2. Less time spent on updates and more time on the action items
1. Digital storage of the documents used by the board
2. paperless meetings 3. Conduct Board &
committee evaluations in real-time
4. Track compliance levels across the organization
5. saves time
1st March 2020 – 31st March 2020
Record information system
1. Improved record tracking during circulation.
2. Improved security of our records by providing various access rights to staff.
3. Fast records retrieval and circulation to action officer for timely decision making.
4. Overall automation of all records management procedures.
5. Customized disposal plan.
6. Offshore records storage-cloud based storage.
7. Improved storage space for our records.
A functional and user-friendly Electronic Records Management System.
1.Decline in delays for Action items
2. Ease retrieval of Information
3. Safety and Confidentiality of Information
July 2020-31st December 2020
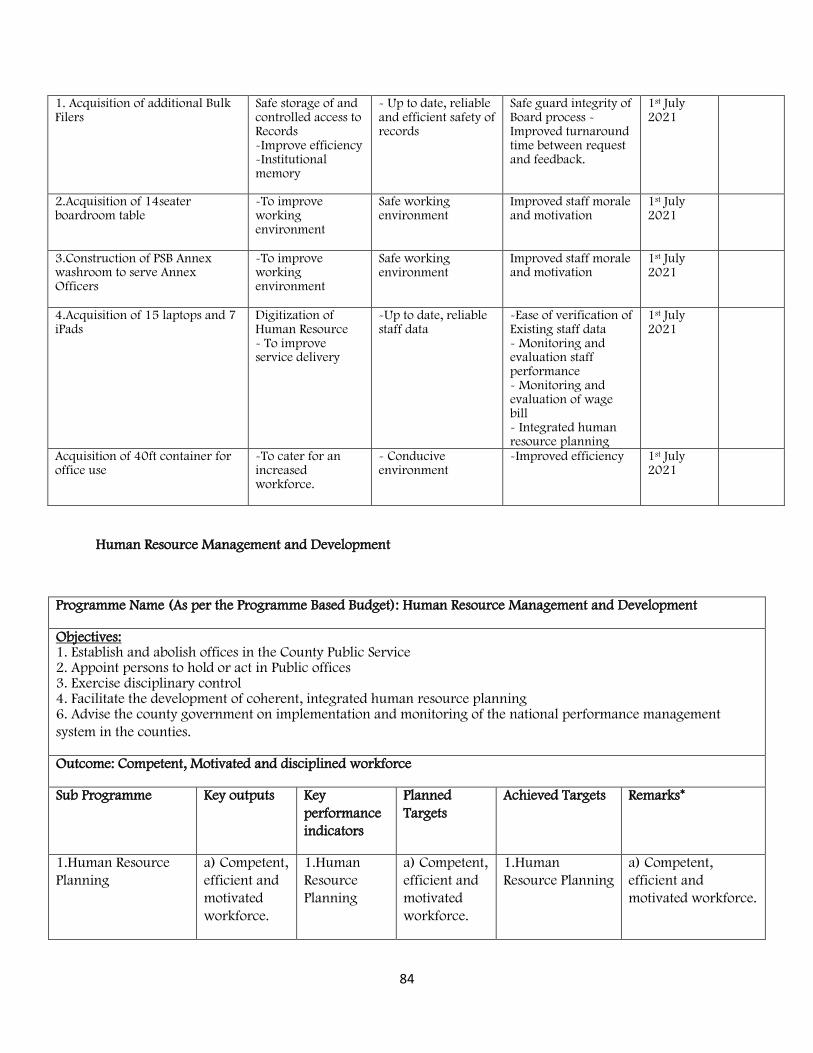
84
1. Acquisition of additional Bulk Filers
Safe storage of and controlled access to Records -Improve efficiency -Institutional memory
- Up to date, reliable and efficient safety of records
Safe guard integrity of Board process - Improved turnaround time between request and feedback.
1st July 2021
2.Acquisition of 14seater boardroom table
-To improve working environment
Safe working environment
Improved staff morale and motivation
1st July 2021
3.Construction of PSB Annex washroom to serve Annex Officers
-To improve working environment
Safe working environment
Improved staff morale and motivation
1st July 2021
4.Acquisition of 15 laptops and 7 iPads
Digitization of Human Resource - To improve service delivery
-Up to date, reliable staff data
-Ease of verification of Existing staff data - Monitoring and evaluation staff performance - Monitoring and evaluation of wage bill - Integrated human resource planning
1st July 2021
Acquisition of 40ft container for office use
-To cater for an increased workforce.
- Conducive environment
-Improved efficiency 1st July 2021
Human Resource Management and Development
Programme Name (As per the Programme Based Budget): Human Resource Management and Development
Objectives: 1. Establish and abolish offices in the County Public Service 2. Appoint persons to hold or act in Public offices 3. Exercise disciplinary control 4. Facilitate the development of coherent, integrated human resource planning 6. Advise the county government on implementation and monitoring of the national performance management
system in the counties.
Outcome: Competent, Motivated and disciplined workforce
Sub Programme Key outputs Key
performance
indicators
Planned
Targets
Achieved Targets Remarks*
1.Human Resource
Planning
a) Competent,
efficient and
motivated
workforce.
1.Human
Resource
Planning
a) Competent,
efficient and
motivated
workforce.
1.Human
Resource Planning
a) Competent,
efficient and
motivated workforce.

85
2.Human Resource
training and
Development
-Number of officers trained
-number of
training
program
developed
-TNA Report
-Training Projections
-Number of intervention programs
-Training impact assessment report
-level of
capacity
increased in
the CPSB
Conduct TNA
-Develop Training projection
-Implement other interventions programs.
- Conduct training impact assessment survey
-Conduct In-
house
Training
Conducted a two
days inhouse
training on work
live balance,
stress
management and
ADA.
3.Human Resource
welfare
-Number of surveys conducted
-
implemented
by 100%
Survey reports
-Human
Resource
Welfare
strategies
Conduct HR welfare survey -Develop a HR welfare strategy.
-Conduct
work
environment
and employee
satisfaction
survey
Implement welfare strategies by 70% Implement work
environment and
employee
satisfaction survey
recommendations.
3.2.2 Compliance and Quality Assurance Programme Name (As per the Programme Based Budget): Compliance and Quality Assurance
Objective:
1. Promotion of values and principles in the County Public Service
2. Evaluate and report to the County Assembly on the extent to which values and principles are complied with in the county Public Service.
3. Advice county Government on the implementation and monitoring of the National performance management system in counties
Outcome: Quality service provision and a compliant public service
Sub Programme Key outputs Key performance indicators
Planned Targets
Achieved Targets Remarks*

86
Monitoring and Evaluation
-M & E tools in use -Indicators developed -Field visits for evidence-based decision Making - Evaluation Reports
-Tools developed -data collection ongoing -PSB Indicator handbook -Field visit reports - Evaluation Reports
Monthly,Quart erly and Annual data collection tools in use -One indicator handbook for PSB programs -Four departmental visits
-Monthly and Quarterly achieved
-Nil Nil Nil
Civic awareness and Education
Production of Information and Educational materials
IEC materials
-Six Subcounty awareness for a held
Nil
Sensitization forums held
Attendance lists Photos
Research and Documentation
Surveys conducted -Service delivery survey
One Service delivery survey to be conducted to assess stakeholder perception of our services
Nil
One survey targeted
Nil
Drafting of advisories
-Evaluation of values and principles report
-Anti-corruption policy
- M&E policy
Advisories drafted
-One policy targeted
-One policy
3 Advisories targeted
Nil
Nil
Nil
Nil

87
3.3 Capital Projects
Provide a summary of the capital projects to be implemented during the plan period
3.3.1 Finance, Administration and Corporate Affairs
Project Name
Location/ Ward
Objective Output/ Outcome
Performance Indicators
Time Frame (Start- End)
Implementing Agencies
Cost (Kshs)
1. Research
CPSB Office
1. To determine the level of Customer Satisfaction to the following service attributes:
• Speed of service
• Quality of service
• Affordability
• Courteousness
• Information on services
2. To identify critical gaps in the service delivery system and recommend interventions. 3. Satisfaction with adherence to the commitments set out in the service charter. 4. To determine the level of satisfaction with respect to Board’s Complaints Management System. 5. To determine the adequacy, relevance and access to information
1. Satisfied customers
2. Data for informed decision making 3. Good customer relations
1. Score on customer satisfaction index
2. Customer retention rate
3. Decline in customer complaints
4. Service charter awareness
1st March 2020 – 31st March 2020
CPSB 3M
and shared to relevant stakeholders

88
Project Name
Location/ Ward
Objective Output/ Outcome
Performance Indicators
Time Frame (Start- End)
Implementing Agencies
Cost (Kshs)
provided by the Board through its media platforms 6. To determine an overall external customer satisfaction index.
2.Request management system
CPSB Office
1. To improve service deliver
2. Streamlining of request
3. Track status of request, take any necessary follow-up actions and give feedback
4. Track the progress of the request and see who is currently working on it
1. Accountability and transparency in service delivery
2. Adherence to the service charter
3. Timely and Quality service delivery
4. Spearheading the Boards corporate image
5. Risk management
6. Reduction in unnecessary workload
1. Satisfied customer
2. No. of Request fulfilment
3. High level & quality service to both our internal and external client’s
1st July 2021
CPSB 2M

89
Project Name
Location/ Ward
Objective Output/ Outcome
Performance Indicators
Time Frame (Start- End)
Implementing Agencies
Cost (Kshs)
3.E-Board Management System
CPSB Office
1. to run Board/committee meeting effectively, without paperwork.
2. to create an online board portal to easily share board packs, communicate with board members, keep and access board documents from a central place
3. Projecting of minutes and packs during board meetings
1. Digital storage of the documents used by the board
2. paperless meetings
3. Conduct Board & committee evaluations in real-time
4. Track compliance levels across the organization
1. Quick information sharing
2. Less time spent on updates and more time on the action items
CPSB 2M
4.Record Information Management
1.Improved record tracking during circulation.
2.Improved security of our records by providing various access rights to staff.
3.Fast records retrieval and circulation to action officer for timely decision making.
4.Overall automation of all records management procedures.
5.Customized disposal plan.
6.Offshore records storage-cloud based storage.
7.Improved storage space for our records.
A functional and user-friendly Electronic Records Management System.
CPSB 2.5M

90
3.3.1.1 Additional Capital Projects
Project Name Location/ Ward
Objective Output/ Outcome
Performance Indicators
Time Frame (Start- End)
Implementing Agencies
Cost (Kshs)
1. Acquisition of additional Bulk Filers
CPSB Office
Safe storage of and controlled access to Records -Improve efficiency -Institutional memory
- Up to date, reliable and efficient safety of records
Safe guard integrity of Board process - Improved turnaround time between request and feedback.
1st July 2021
CPSB Ksh.850
2.Acquisition of 14seater boardroom table
CPSB Office
-To improve working environment
Safe working environment
Improved staff morale and motivation
1st July 2021
CPSB 1M
3.Construction of PSB Annex washroom to serve Annex Officers
CPSB Office
-To improve working environment
Safe working environment
Improved staff morale and motivation
1st July 2021
CPSB 1M
4.Acquisition of 15 laptops and 7 iPads
CPSB Office
Digitization of Human Resource - To improve service delivery
-Up to date, reliable staff data
-Ease of verification of Existing staff data - Monitoring and evaluation staff performance - Monitoring and evaluation of wage bill - Integrated human resource planning
1st July 2021
CPSB 1.9M
Acquisition of 40ft container for office use
CPSB Office
-To cater for an increased workforce.
- Conducive environment
-Improved efficiency
1st July 2021
CPSB 2.5M

91
3.3.2 Human Resource Management and Development
Project Name
Location/ Ward
Objective Output/ Outcome
Performance Indicators
Time Frame (Start- End)
Implementing Agencies
Cost (Kshs)
1. Acquisition of HRMIS
CPSB Office - Digitization of Human Resource - To improve service delivery
-Up to date reliable staff data
-Ease of verification of Existing staff data - Monitoring and evaluation staff performance - Monitoring and evaluation of wage bill - Integrated human resource planning
1st July 2021
CPSB 4.5M
2. Research a. Work design Phase 1
CPSB Office County departments
- To structure the individual jobs in a way that will improve organization efficiency/performance - To increase employee Job satisfaction - To enhance Staff motivation - Staff will have a deeper understanding of their key result areas - To enhance job-skill and capacity match
Clear task structures Increased work efficiency
-Reports on baseline and post implementation surveys -Meeting set performance standards
July 2020- 31st December 2021
CPSB 2M

92
3.3.3 Compliance and Quality Assurance Project Name Location/
Ward Objective Output/
Outcome Performance Indicators
Time Frame (Start- End)
Implementing Agencies
Cost (Kshs)
1. Research
CPSB Office All wards
To assess level of Compliance with laws and policies and develop recommendations
- To Promote Innovation
- To encourage public participation in Government businesses.
Recommendations for implementation Indicating timelines and persons responsible.
-Compliance with National and County laws and policies
-Address challenges es
1st September 2021
CPSB 6m
Cross-sectoral Implementation Considerations
This section should provide measures to harness cross sector synergies and mitigate adverse cross-sectoral impacts of projects where necessary.
Harnessing Cross-sector synergies: Indicate what considerations that will be made in respect to harnessing cross-sector synergies arising from possible project impacts.
• Mitigating adverse Cross-sector impacts: State mitigation measures that may be adopted to avoid or manage potential adverse cross-sector impacts.
➢ Devolution and Public Service Administration
The Department of Devolution and Public Service Administration is expected to strengthen devolution
and decentralization of public service delivery in the County in ensuring that the objects of devolution
are achieved in the county. Development expenditure will go a long way in realizing devolution services
in the county. It will also ensure that the citizen participate in the decision-making process of the
development agenda of the county. An efficient feedback mechanism from the grass root will make this
more attainable.
The department of Devolution and Public Service Administration will continue to streamline the Human
Resource Function of the County towards a lean and efficient workforce.
The department is also planning to devolve services to the grassroots focusing on citizen participation
and engagement, enforcement of county laws, providing security to county Assets.

93
These will be measured by the increase of productivity of its Human Resource, satisfaction levels of the
clients and stakeholders, reduced incidences of theft and damage of county Assets, improved adherence
to county Laws.
Sector/ Sub-sector name: Public Administration and International (or Inter-Governmental) Relations
Description of significant capital development
The department will undertake the construction of Service centres and ward offices for improved service delivery to mwanachi.
The department will also construct a training school at the inspectorate for regular trainings of our Enforcement staff as well as train other counties and outside clients as an income generation activity.
This facility will also enable the county save on its expenditure of hiring facilities for training the enforcement employees.
The department will install a Human Resource System that will enable it digitalize staff files and records for ease of retrieval and security of documents.
The department will renovate office spaces to improve the working environment of staff for increased productivity.
• Sector/sub-sector key stakeholders and the responsibilities
The departmental stake holders include:
1. Banks and Saccos
2. Lap Fund/ Lap trust
3. Civil societies
4. Professional Bodies- IHRM
5. National Government Agencies and Commissions egThe Police Service, SRC
6. Workers Unions
7. The General public
8. Internal clients –the employees
9. Development Partners, Ahadi, GIZ ,Konrad Adenauer Stiftung
10. Media

94
Sub Sector/ Sub-sector programmes
Programme Name (As per the Programme Based Budget):
General Administration, Planning and Support Services
To provide strategic leadership in the provision of services to the citizen
Good governance and enhanced professionalism in service delivery
Sub Programme Key outputs Key performance indicators Planned Targets
Infrastructure Development Refurbishment of work
stations/offices/spaces
No of Offices and Spaces refurbished 6
Programme Name (As per the Programme Based Budget):
County administration and decentralized services
Objective: To ensure the services delivery is decentralized up-to grassroots levels
Outcome: Enhanced accessibility to services offered by county departments at grass root levels
Sub Programme Key outputs Key performance indicators Planned Targets
Decentralization of county
public service
Ward Offices
established
Number of ward offices established 4
Service Centers
established
Number of Service centres established 2
Programme Name (As per the Programme Based Budget):
Compliance and enforcement
Objective: To Cultivate the culture of compliance of county laws
Outcome: Improved service delivery
Sub Programme Key outputs Key performance indicators Planned Targets
General Administration, Planning
and support services
Training facility constructed
Training facility constructed
1
Public safety and order Specialized communication,
Surveillance and IT equipment
No. of equipment purchased 50
Disaster Management Emergency operation Centres
established
Constructed /Refurbished
operation center
1

95
Programme Name (As per the Programme Based Budget):
Programme :Public service management
Objective: To ensure effective and efficient public service which is citizen focused
Sub Programme Key outputs Key performance indicators Planned Targets
Integrated Information
management systems
Digitized personnel
records
No of personnel records/files Digitized 1000 files
Summary of the capital projects to be implemented during the plan period
Project Name Location/ Ward Objective Output/
Outcome
Performance
Indicators
Time Frame
(Start- End)
Implementing
Agencies
Cost
(Kshs)
Construction of
Service Centre
Likoni To ensure that
services delivery is
decentralized up-
to grassroots levels
Improved
service delivery
No. of offices
established at sub
county levels and
equipped
July 2020-
June 2021
DPSA 30m
Construction, of
Service Centres
Kisauni To ensure that
services delivery is
decentralized up-
to grassroots levels
Improved
service delivery
offices established
ad equipped
July 2020-
June 2021
DPSA 30m
Construction of
Ward Offices
Mwakirunge* To ensure that
services delivery is
decentralized up-
to grassroots levels
Improved
service delivery
offices established
ad equipped
July 2020-
June 2021
DPSA 8m
Construction of
Ward Offices
Jomvu* To ensure that
services delivery is
decentralized up-
to grassroots levels
Improved
service delivery
offices established
ad equipped
July 2020-
June 2021
DPSA 8m
Construction of
Ward Offices
Kadzandani* To ensure that
services delivery is
decentralized up-
to grassroots levels
Improved
service delivery
offices established
and equipped
July 2020-
June 2021
DPSA 8m
Construction of
Ward Offices
Bamburi* To ensure that
services delivery is
Improved
service delivery
offices established
ad equipped
July 2020-
June 2021
DPSA 8m

96
Project Name Location/ Ward Objective Output/
Outcome
Performance
Indicators
Time Frame
(Start- End)
Implementing
Agencies
Cost
(Kshs)
decentralized up-
to grassroots levels
Construction and
Rehabilitation of
Inspectorate
Training Facility
Tudor Improve learning
facilities and
conditions
Improved
service delivery
Constructed,
renovated and
Equipped training
school
July 2020-
June 2021
DPSA 35m
Establishment of
Emergency
Operation Centre
*Disaster prone
Area
To establish
Emergency
Operation/rescue
centre
Emergency
Operation/resc
ue centre
established
Refurbished and
equiped
Operation/rescue
center
July 2020-
June 2021
DPSA 30m
Rehabilitation/
refurbishment of
office spaces
Mvita/HQ To Improve
working
conditions
Rehabilitated/R
efurbished
office spaces
No. of offices
rehabilitated
July 2020-
June 2021
DPSA 15
Installation of
Information
management
systems
Mvita/HQ To Digitize
personnel records
Information
management
systems
installed
No of personnel
records Digitized
July 2020-
June 2021
DPSA 5
Cross-sectoral Implementation Considerations:
To harness cross sector synergies and mitigate adverse cross-sectoral impacts of projects where necessary.
The department will cultivate a good working relationship with other sectors to enable achievement of
the desired goals/ Targets
Harnessing Cross-sector synergies: Indicate what considerations that will be made in respect to
harnessing cross-sector synergies arising from possible project impacts.
The department will use expertise of various departments’ e.g functions of public works,
Sanitation, lands and physical planning, to ensure standards are adhered to for overall success.

97
3.2.3: Health Sector/ Sub-sector programmes
Programme Name: General Administration, Planning and Support Services including monitoring and Evaluation (As per the
Programme Based Budget):
Objective: Improve service delivery Improve service delivery by planning to derive achievable targets and provide support services
appropriately
Outcome:
Sub Programme Key outputs Key performance indicators Planned Targets
Leadership and
Governance
Put in place strategic
leadership and
oversight policies
- 4 management Board meetings at Coast
General Hosp.
- 12 CHMT meetings
- 4 integrated support supervision
- 1 training for facility management
committees
- 1 county stakeholders forum
- Quarterly management Board
meetings at Coast General Hospital
- Monthly CHMT meetings
- Quarterly integrated support
supervision
- Training of facility management
committees
- Hold 1 county stakeholders forum
Health Financing Enhance revenue
generation and
strength
transparency and
accountability
- Increase revenue generation
- Strict adherence to procurement act of
2005 and regulation of 2006
- Account for all expenditures incurred
- Increase revenue from 392M, to
500M
- Reduce incidences of Audit queries
Health policy and
planning
Provide a roadmap
and guidelines to
operationalize
activities
- Enact of policies and law-
- Development of annual work plan
- Implementation of the annual work
plan
- Development of Annual Work plan
by end of May of every financial
year
- Mobilize resources to implement
the annual work plan
Health
Infrastructure
Improve Health
infrastructure to
enhance access to
quality Health care
Provide efficient
support services to
improve service
delivery
- Improved infrastructure of various
facilities
- Purchase equipment to enhance
efficiency in the level 5 &4 facilities
- Completion and equipment of 2
level 4 facilities
- Improve sewerage system at
Maweni and Mvita H/C
- Rehabilitate the drainage for storm
water at Magongo, Jomvu ,
Shikadabu Ziwa la Ngombe H/C
- Purchase plant and Equipment for
level 5 and 4 Hospitals purchase 1
van for the CHMT
- Purchase of 3 double cabs for the
sub county MOH
ICT - Improved diagnostic service - Establish telemedicine services
- Establish tele-radiology services to
link CGH with Portreitz, Likoni and
Mlaleo

98
A summary of the capital projects to be implemented during the plan period 2020- 2021
Project Name Location/ Ward Objective Output/ Outcome Performance Indicators
Time Frame (Start- End)
Implementing Agencies
Cost (Kshs)
Construction of 50 bed private wing and Doctors plaza at Coast General Teaching & Referral Hospital (CGTRH)
Mvita/Tononoka Create inpatients for clients from the cooperate and Senior Civil Servants
Number of corporate clients and civil servants
Completion certificate
July 2018 – December 2018
PPP 200M
Rehabilitation of MAT Centre at Female Rehabilitation Center (CGTRH)
Mvita/Tononoka To improve specialized services
improved infrastructure
Number of MAT cases
July 2020 – June 2021
National 30M
Construction of perimeter wall at Mvita Health Center and Kaderbouy Health Center
Mvita/Majengo/Old Town
Improve security at the facility
Reduce incidences of theft and trespass
No cases July 2020 – June 2021
CGM/PPP 1.5M
Rehabilitation of sewerage and Drainage for storm water at Mvita Health Center
Mvita/Majengo Eradicate stench emanating from the sewage system and the drainage for storm water
Fresh air, No stagnant surface water
Clean environment July 2020 – June 2021
CGM/PPP 1.5 M
Drainage for storm water at Jomvu Model HC
Changamwe/Jomvu Open up channels to drain storm water during storm water during the rainy season
Drainage channels
No stagnant water & floods in the facility
July 2020 – June 2021
Dept of infrastructure and public works/PPP
3 M
Roofing at Jomvu Model HC
Changamwe/Jomvu improve infrastructure
infrastructure improved
new roofing done July 2020 – June 2022
CGM/PPP 5 m
Construction of integrated maternity and NBU at Port Reitz Hosp.
Changamwe/Jomvu Increase access to maternity services
Increase the number of people seeking maternity services
Number of Deliveries and CS / section
July 2020 – June 2021
MS - PPP (50%)
50M

99
Project Name Location/ Ward Objective Output/ Outcome Performance Indicators
Time Frame (Start- End)
Implementing Agencies
Cost (Kshs)
Construction of Perimeter wall and Painting at Port Reitz SCH
Changamwe/Jomvu improve security and work environment
Reduce incidences of theft and trespass
No cases July 2020 – June 2021
CGM/PPP 5 M
Removal of asbestos and re-roofing at Port Reitz SCH
Changamwe/Jomvu improve work environment
reduced exposure risks to asbestoses
new roofing done July 2020 – June 2021
CGM 30 M
Construction of Accident and Emergency Unit at Port Reitz SCH
Changamwe/Jomvu Improve access to emergency services
improved infrastructure
new accident and emergency unit
July 2020 – June 2021
CGM 5 M
Cabro works at Port Reitz SCH
Changamwe/Jomvu improve work environment
improved environment
cabro in place July 2020 – June 2021
CGM 5 M
Construction of Theatre at Chaani SCH
Changamwe/Jomvu Increase access to quality of health care services
reduced referrals to CGTRH
number of C/s July 2020 – June 2021
CGM Conditional grant
Expansion of maternity and consultation rooms at Miritini CDF HC
Changamwe/Jomvu Increase access to quality of health care services
reduced referrals to PRSCH
number of deliveries
July 2020 – June 2021
CGM 5 M
Construction of perimeter wall at Mikindani MCM Disp
Changamwe/Jomvu improve security and work environment
Reduce incidences of theft and trespass
No cases July 2020 – June 2021
CGM/PPP 3 M
Roofing for out-patient and maternity unit at Mikindani Disp
Changamwe/Jomvu Improve infrastructure
improved infrastructure
new roofing done July 2020 – June 2021
CGM 4.0m
Borehole drilling at Mikindani Disp
Changamwe/Jomvu To ensure continuous availability of utility water
Borehole drilled Drilled borehole July 2020 – June 2022
CGM 3.2m

100
Project Name Location/ Ward Objective Output/ Outcome Performance Indicators
Time Frame (Start- End)
Implementing Agencies
Cost (Kshs)
Rehabilitation of drainage system, plumbing works and incinerator at Mikindani Disp
Changamwe/Jomvu To ensure functional drainage system and safe disposal of waste
Constructed drainage system and incinerator
Functional drainage system and constructed incinerator
July 2020 – June 2023
CGM 5.0m
Painting works at Mikindani Disp
Changamwe/Jomvu To protect the wall from weather destruction
Prolonged building lifespan
Painted building July 2020 – June 2021
CGM 2.2m
Demolish and Construction of model dispensary at Miritini MCM Disp with perimeter wall
Changamwe/Jomvu To establish a comprehensive service delivery facility in the community
Increased service delivery uptake
Constructed Model facility
July 2020 – June 2023
CGM 6.0m
Replace asbestos roofing at Miritini MCM Disp
Changamwe/Jomvu To reduce exposure to poisonous affluent from asbestos roof
Improved health status due to correct diagnosis
Replaced roofing material
July 2020 – June 2023
CGM 3.6m
Construction of perimeter wall at Miritini MCM Disp
Changamwe/Jomvu To ensure safety of staff and provide privacy for clients
Reduced cases of burglary and increased service uptake
Constructed perimeter wall
July 2020 – June 2023
CGM 4.6m
Construction of perimeter wall at Jomvu Kuu Disp
Changamwe/Jomvu To ensure safety of staff and provide privacy for clients
Reduced cases of burglary and increased service uptake
Constructed perimeter wall
July 2020 – June 2022
CGM/PPP 6.5m
Borehole drilling at Jomvu Kuu Disp
Changamwe/Jomvu To ensure continuous availability of utility water
Borehole drilled Drilled borehole July 2020 – June 2021
CGM 3.4m
Construction of incinerator at Jomvu Kuu Disp
Changamwe/Jomvu To ensure safe waste disposal of medical waste material
Incinerator constructed
Constructed incinerator
July 2020 – June 2021
CGM 0.9m

101
Project Name Location/ Ward Objective Output/ Outcome Performance Indicators
Time Frame (Start- End)
Implementing Agencies
Cost (Kshs)
Completion of Shika Adabu S. C. Hospital
Likoni/Shika Adabu Increase access of health care services to people of Likoni
Improve status of health of the people
Complete of the project
July 2020 – June 2021
Consultant - Dept. of infrastructure and Public Works
17m
Perimeter wall at Mtongwe S. C. Hospital
Likoni/Mtongwe Improve security at the facility
Secured facility July 2020 – June 2021
Dept. of infrastructure and Public Works
Construction of Perimeter wall and Painting at Likoni SCH
Likoni improve security and work environment
Reduce incidences of theft and trespass
No cases July 2020 – June 2021
CGM/PPP 5 M
Roofing at Likoni SCH Likoni Increase access of health care services
improve infrastructure
new roofing done July 2020 – June 2022
CGM/PPP 5 M
Construction of Accident and Emergency Unit at Likoni SCH
Likoni Improve access to emergency services
improved infrastructure
new accident and emergency unit
July 2020 – June 2021
CGM 5 M
Cabro works at Likoni SCH
Likoni improve work environment
improved environment
cabro in place July 2020 – June 2021
CGM/PPP 3 M
Demolish and Construction of model dispensary at Miritini MCM Disp with perimeter wall
Changamwe/Jomvu To establish a comprehensive service delivery facility in the community
Increased service delivery uptake
Constructed Model facility
July 2020 – June 2023
CGM 6.0m
Replace asbestos roofing at Miritini MCM Disp
Changamwe/Jomvu To reduce exposure to poisonous affluent from asbestos roof
Improved health status due to correct diagnosis
Replaced roofing material
July 2020 – June 2023
CGM 3.6m

102
Project Name Location/ Ward Objective Output/ Outcome Performance Indicators
Time Frame (Start- End)
Implementing Agencies
Cost (Kshs)
Construction of perimeter wall at Miritini MCM Disp
Changamwe/Jomvu To ensure safety of staff and provide privacy for clients
Reduced cases of burglary and increased service uptake
Constructed perimeter wall
July 2020 – June 2023
CGM 4.6m
Construction of perimeter wall at Jomvu Kuu Disp
Changamwe/Jomvu
To ensure safety of staff and provide privacy for clients
Reduced cases of bugglery and increased service uptake
Constructed perimeter wall
July 2020 – June 2022
CGM/PPP 6.5m
Borehole drilling at Jomvu Kuu Disp
Changamwe/Jomvu To ensure continuos availability of utility water Borehole drilled Drilled borehole
July 2020 – June 2021
CGM 3.4m
Construction of incinerator at Jomvu Kuu Disp
Changamwe/Jomvu To ensure safe waste disposal of medical waste material
Incinerator constructed
Constructed incinerator
July 2020 – June 2021
CGM 0.9m
Completion of Shika Adabu S. C. Hospital
Likoni/Shika Adabu
Increase access of health care services to people of Likoni
Improve status of health of the people
Complete of the project
July 2020 – June 2021
Consultant - Dept. of infrastructure and Public Works
17m
Perimeter wall at Mtongwe S. C. Hospital
Likoni/Mtongwe
Improve security at the facility
Secured facility July 2020 – June 2021
Dept. of infrastructure and Public Works
Construction of Perimeter wall and Painting at Likoni SCH
Likoni improve security and work environment
Reduce incidences of theft and trespass
No cases
July 2020 – June 2021
CGM/PPP
5 M
Roofing at Likoni SCH Likoni
Increase access of health care services
improve infrastructure new foofing done
July 2020 – June 2022
CGM/PPP 5 M
Construction of Accident and Emergency Unit at Likoni SCH
Likoni Improve access to emergency services
improved infrastructure
new accident and emergency unit
July 2020 – June 2021
CGM 5 M

103
Project Name Location/ Ward Objective Output/ Outcome Performance Indicators
Time Frame (Start- End)
Implementing Agencies
Cost (Kshs)
Cabro works at Likoni SCH
Likoni improve work environment
imroved environment
cabro in place
July 2020 – June 2021
CGM/PPP 3 M
Construction of Perimeter wall and Painting at Mbuta Health Center
Likoni improve security and work environment
Reduce incidences of theft and trespass
No cases
July 2020 – June 2021
CGM/PPP 7 M
Water connection/Borehole drilling at Mbuta Health Center
Likoni
increase facility safe water
increased access safe water borehole in place
July 2020 – June 2021
CGM/PPP 1.5 M
Furnish and placement of MAT dispensing at LIKONI(2)
LIKONI Increase MAT Dispensing stations to Decongest Kisauni Mat Clinic
Decongest Kisauni MAT clinic
Number of MAT cases
July 2019 – June 2020
MCG 2.5M
Human resource recruitment and promotions
county to improve quality service delivery
imroved quality of service delivery
number of health care workers recruited/promoted
July 2019 – June 2021
MCG 30 M
Cabro works at Mrima SCH
Likoni to improve facility environment
environment improved
cabro in place July 2020 – June 2022
CGM/PPP 10 M
Increase size of perimeter wall at Mrima SCH
Likoni to improve facility security
security improved
perimeter wall done
July 2020 – June 2022
CGM/PPP 7 M
Construction of HDU and NBU at Mrima SCH
Likoni to improve maternaal neonatal health
reduced maternal /perinatal deaths
HDU/NBU unit July 2020 – June 2022
CGM/PPP 15M
Renovation of health information resource centre
PHD -MVITA IMPROVE ACCES TO INFORMATION
TIMELY INFORMATION SHARED
NUMBER OF HCP ACCESSING UPDATES
July 2020 – June 2022
CGM 10 M

104
Project Name Location/ Ward Objective Output/ Outcome Performance Indicators
Time Frame (Start- End)
Implementing Agencies
Cost (Kshs)
Construction and installation of cathlab at CGTRH
Mvita/Tononoka IMPROVE SPECIALIZED SERVICES
REDUCED MORT MOU signed CGM 100M
Procure Utility vehicles (Port Reitz SCH, Likoni SCH, Mrima SCH & Tudor SCH) and one 14-seater for CHMT
All Improved transportation
reduced transport turn arround time
number of hospital utility vehcles
July 2020 – June 2022
CGM 15 M
Radiotherapy Bunker at CPGH
Mvita/Tononoka improve quality of specialised services
specialized services improved
june 2Radiotherapy banker in place
July 2019 – June 2020
CGM/National GK
200M
Infectious Disease center at current railway Dispensary
Mvita/Tononoka improve quality infectious services
infectious specialized services improved
infectious centre in place
July 2020 – June 2022
CGM 10 M
Establishment of Emergency Ambulance VHF System (using inspectorate system)
MVITA improve referral services
referral servises improved
EEA VHF system in place
July 2020 – June 2021
CGM 10M

105
3.2.4: Social Protection, Culture & Recreation Sector The department is composed of the following Sections:
✓ Youth Affairs ✓ Gender Affairs and Disability Mainstreaming ✓ Sports Development ✓ Cultural Affairs ✓ Public Entertainment
Strategic Objectives
• To empower the youth with livelihood skills;
• To harness the full potential of the county cultural heritage;
• To promote sports development in the county; and
• To support women and Persons with Disability (PWDs) with start-up kits; and
• Provide and maintain public entertainment and recreational facilities.
Description of significant capital development
The department constructed a new state of the art stadium in Changamwe Sub-County.
Table: Sector/ Sub-sector programmes Code Key Outputs Key Performance Indicators Targets
P1: Administration, Planning and Support Services Training of Staff
Sp1: Administration Services
Outcome: Efficient delivery of services and customer satisfaction
Delivery Units Service Deliver
Sp2: Personnel services Development of service charters
Outcome: Improved service delivery
Delivery Units Policy and Administration
P2: Youth Affairs
Sp1: Youth Economic Empowerment
Delivery Units Directorate of Youth Affairs and revolving
fund board
Empowerment of 10,000 youth
through training, skills
development and financial
support
Outcome: Empowered youth.
P3: Gender Affairs and Disability Mainstreaming Empowerment of 5,000 women
and PWDs. Sp1: Economic empowerment of women and PWDs
Delivery Units Directorate of Gender
Outcome: Empowered women and persons living with disability.
P4.Sports Development

106
Delivery Units Directorate of Sports Improvement of 9 sports ground
and provision of sporting
equipment Outcome: Improved livelihoods for sportsmen and women
P5: Cultural Affairs 5 cultural sites and monuments
preserved. Sp1. Promotion , development and preservation of Cultural heritage
Delivery Unit Directorate of Culture
Outcome: Preserved positive cultural practices, sites and monuments
P5 :Public Recreation and Entertainment -construct Community cultural
center
- rehabilitate I public park
Sp1. Promotion and development of recreation and public entertainment facilities
Outcome:
Delivery Unit Directorate of Cultural Affairs
A summary of the capital projects to be implemented during the plan period
➢ Youth and Gender
Project Name Location/ Ward Objective Output/ Outcome
Performance Indicators
Time Frame (Start- End)
Implementing Agencies
Cost (Kshs)
Establishment of
Youth Empowerment
Centre
Tononoka/
Mvita
• To provide information to the youth
• Youth Engagement
• Talent Identification
Empowered
youth
No. of youth
utilizing the
centre annually
2020-
2021
CO – Y & G 20,000,000
Rescue Centre (Phase
II)
Likoni To provide temporal
shelter for
vulnerable victims
Improved
welfare for
persons affected
No. of persons
referred to the
centre
2020-
2021
CO - Y&G 20,000,000
Construction of 2 no.
Social Halls
Mtopanga/ Junda To provide social
amenity in
marginalized wards
Easy access to
social amenity
No. of activities
held at the
social centres
2020-
2021
CO – Y&G 70,000,000
Economic
Empowerment
& Revolving Fund
All Sub – counties To provide capital to
youth, women and
PWDs to start up
business ventures
Empowered
Youth, Women
and PWDs
No. of youth,
women &
PWDs who
access the
funds
2020-
2021 • CO –
Y&G
• Fund Manager
10,000,000
Capacity building for
CBO’s leaders
All Sub - counties Leadership
Empowerment
Empowered
Leaders
No. of CBOs
Leaders trained
2020-
2021
CO – Y&G 1,000,000

107
Project Name Location/ Ward Objective Output/ Outcome
Performance Indicators
Time Frame (Start- End)
Implementing Agencies
Cost (Kshs)
County Conference
for youth & Women
Leaders
County Share experience
strengths and
enhance
networking
Empowered
Leaders
No. of youth
and women
Leaders
empowered
2020-
2021
CO – Y&G 5,000,000
Celebration of
international Youth
Day, Women Day,
HIV/AIDS Day,
PWDs Day, Drug
Free Day
County Sensitization on the
various issues
affecting youth,
women and PWDs
Sensitized youth
women & PWDs
No. of
sensitized
youth, women
& PWDs
2020-
2021
CO – Y&G 10,000,000
Renovation of Alms
House
Tudor/
Mvita
• To provide decent housing for the elderly
Well cared for
elderly
Improved Alms
House
2020-
2021
CO – Y & G 15,000,000
Youth dialogue County • To enhance inclusivity and sensitization on economic empowerment
Empowered and
sensitized youth
No. of youth
engaged and
sensitized
2020-
2021
CO -Y & G 5,000,000
Provision of food to
the Alms House
Tudor/
Mvita
• To provide meals to the elderly
Increased life
span for the
elderly
Healthy elderly 2020 –
2021
CO -Y & G 1,000,000
Donation of Sanitary
Towels
County • To provide sanitary towels to vulnerable girl child
Good School
Performance
Reduced
absenteeism
among girls in
schools
2020-
2021
CO -Y & G 2,000,000
Women, Youth,
PWDs
entrepreneurship
training
County • To provide entrepreneurship skills
Improved
livelihood
among Women,
Youth and
PWDs
No. of women,
youth and
PWDs trained
2020-
2021
CO-Y & G 5,000,000
PWDs Assistive
devices
County • To provide assistive devices to PWDs
Improved
welfare of
PWDS in the
County
No. of PWDs
assisted
2020-
2021
CO-Y & G 4,000,000
Monitoring and
Evaluation
County • To assess the impact of the year’s department activities
More
partnership
between the
department and
the Mombasa
County Youth
NO. of
Proposals from
the youth
implemented
by the
department
2020-
2021
CO – Y&G 4,000,000

108
Project Name Location/ Ward Objective Output/ Outcome
Performance Indicators
Time Frame (Start- End)
Implementing Agencies
Cost (Kshs)
Mombasa Women
Market Day
County • To promote economic empowerment of women and inculcate entrepreneurship
Alleviation of
poverty
No. of the
economically
empowered
women
2020-
2021
CO – Y&G 2,000,000
Gender
Mainstreaming
Policy
County • To institutionalize the principle of gender mainstreaming to ensure equal opportunities and benefits are equally accessible to both men and women in the County of Mombasa
Contribute
towards a
gender sensitive
society where
solidarity,
opportunities
and
responsibilities
are shared by
men and
women
Gender
sensitive
society
2020-
2021
CO – Y&G 2,000,000
Gender Technical
Working Group
County • To eliminate gender stereotypes resulting in discrimination at decision making level and labor market.
Promotion of
gender equality
and freedom
from
discrimination
Gender
stereotype free
society
2020-
2021
CO – Y&G 1,000,000
Sensitization
programs
a. Early Pregnancies
b. Depression c. Mental
Health
County • To anchor and sustain dignified livelihood
Curb the
prevalence of
early
pregnancies,
depression and
enhanced
mental health
awareness
Rate of
Reduced early
pregnancies,
depression and
catalysed
mental health
awareness
2020-
2021
CO – Y&G 2,000,000
Trainings and
benchmarking
County • To equip and share the best practices in delivery of public service
Develop a
standardized set
of processes and
enable a
mindset and
culture of
continuous
improvement
Localization of
adopted
standard
procedures
2020-
2021
CO – Y&G 2,000,000

109
➢ Sports Section
Project Name Location/ Ward Objective Output/ Outcome
Performance Indicators
Time Frame (Start- End)
Implementing Agencies
Cost (Kshs)
Improvement of
community sports
grounds
Kisauni
Likoni
Jomvu
Changamwe
• Levelling, planting of grass, construction of ablution and changing rooms blocks, drilling of boreholes and provision of goal posts and nets
Promotion of
sports activities
at the local level
Levelled
ground
2020-2021 CO –
Sports
150,000,000
Establishment of
standard stadium
Bububu Likoni Construction of a
2000-seater
stadium with a
running truck
Improved
playgrounds
Stadium facility 2020-2021 CO –
Sports
200,000,000
Establishment of a
volleyball, hockey
and basketball court
Changamwe Construction of
outdoor
multipurpose court
for local community
and competition use
More sporting
activities
Volleyball and
basketball
court
2020-2021 CO –
Sports
50,000,000
Establishment of a
basketball court
Tudor To provide facility
for nurturing
basketball sports
More sporting
activities
Basketball
court
2020/2021 CO-
Sports
15,000,000
Construction of a
modern state of art
county stadium
Mvita/ Tononoka To provide a n
international sports
facility
Promotion of
local and
internal sports
activities
State of art
stadium
2020-2021 CO –
Sports
1,000,000,0
00
Procurement and
provision of sports
equipment
All Sub - counties To equip the youth
to use equipment
hence improve the
standard of the
game
Equipped youth No. of youth
using
equipment
2020-2021 CO –
Sports
20,000,000
Organizing sports
competition
All Sub – counties To engage the youth
on competitive
sports
Experienced
youth
No. of youth
participating in
competition
2020-2021 CO –
Sports
10,450,000
Training referees,
coaches and sports
administrators
All sub counties To train sports
technical persons
Empowered
technical
persons
Number of
coaches,
referees and
administrators
trained
2020-2021 CO-
Sports
5,000,000
Setting up of Youth
sports centre
All sub counties To train under 14
youth in Sport
Empowered
under 14 youth
Number of
trained under
14 youth
2020-2021 CO-
Sports
15,000,000

110
Project Name Location/ Ward Objective Output/ Outcome
Performance Indicators
Time Frame (Start- End)
Implementing Agencies
Cost (Kshs)
Establishment of
Beach sports facility
Kisauni sub
county
To promote sports
tourism
Improved beach
facility
Beach stadium 2020/2021 CO -
Sports
100,000,000
Hire of transport for
sports teams
All sub counties To facilitate local
teams with
transport
Empowered
teams
Number of
teams
facilitated
2020/2021 CO-
Sports
5,000,000
➢ Cultural Affairs
Project Name Location/ Ward
Objective Output/ Outcome
Performance Indicators
Time Frame (Start- End)
Implementing Agencies
Cost (Kshs)
Improvement of
public parks and
recreational facilities
Nyali, Likoni,
Changamwe.
Improvement of Uhuru
Gardens, Kengeleni,Shell
beach, Pirate beach.
Increased use of
public parks
Improve
ambience
Increased no of
visitors to the
parks
2020-
2021
CGM 20,000,000
Preservation and
protection of heritage
sites
Mvita
Likoni
Protection program for
Old Town and Kayas
Protection of
Old Town and
Kayas(shrines)
Reduction of
encroachment
and destruction
of the Kaya
2020-
2021
CGM 8,000,000
Development and
Beautification of
other Cultural sites
Changamwe
Nyali
Beautification of Akamba
Handcraft and
Bombolulu workshop
Center
Improve and
promote images
of our cultural
sites
Increased in
tourist
attraction,
2020 -
2021
CGM 10,000,000
Jomvu Kuu
Traditional Pottery
Regeneration
Jomvu Construction of a
traditional restaurant
Showcase traditional
pottery making skills.
Attract more visitors.
Improve income
of the Jomvu
people.
Increased in
the number of
visitors.
2020-
2021
CGM 4,000,000
Beautification of
Kibarani Park
Changamwe Construction of canopies,
seats, Fontain water etc.
Improved image
of the park.
Increased
number of
visitors.
2020 -
2021
CGM 10,000,000
Mombasa County
Music and Film
Production Studio
County Wide To support performing
artists in music and film
production
Improved youth
talents in art
Film & Music
studio
2020-
2021
CGM 20,000,000

111
Cross-sectoral Implementation Considerations
To harness cross sector synergies and mitigate adverse cross-sectoral impacts of projects where
necessary.
The department will cultivate a good working relationship with other sectors to enable
achievement of the desired goals/ Targets
Harnessing Cross-sector synergies: Indicate what considerations that will be made in respect to
harnessing cross-sector synergies arising from possible project impacts.
The department will use expertise of various departments’ e.g functions of public works,
Sanitation, lands and physical planning, to ensure standards are adhered to for overall success.
Harnessing Cross-sector synergies:
Programe Name Sector Cross Sector Impact Measures to Harness or Mitigate the Impact
Synergies Adverse Impact
Youth Economic Empowerment
Youth Affairs Tapping of youth talents; Involvement of youth in the creative industry; Involvement of youth in agribusiness; Skills development
High expectations from the Youth
Establish youth talent centers; Establishment of Community Cultural Centers; Funding and training in Agribusiness; Training in vocational and Technical institutions
Youth Talent development
Youth Affairs Capacity building in culture and creative industries; Training in different sports disciplines; Develop curriculum
Inadequate funding
Training in vocational and Technical institutions
Youth Social Development
Youth Affairs Prevention and creation awareness on alcohol and substance abuse; Rehabilitative and curative services for Alcohol and substance.
Inadequate funding
Provision of funds; Facilities and staff
Gender Social Economic Empowerment
Gender Affairs Involvement of Women in the creative industry; -Involvement of Women in agribusiness; Skills development
Inadequate funding
Establishment of Community Cultural Centers; Funding and training in Agribusiness; Training in vocational and Technical institutions
Gender and Social Protection
Gender Affairs Support for needy girls
Support for the aged
Support for the aged
Lack of adequate infrastructure
Coordination in identification and distribution of sanitary pads to the needy girls; Rehabilitation of the home for the aged (Alms House);

112
Programe Name Sector Cross Sector Impact Measures to Harness or Mitigate the Impact
Synergies Adverse Impact
Rescue of the vulnerable persons
Medical camps and resident nurse; development of a rescue house
Promotion and Development of Sports
Sports Development
Provision of funds Inadequate funding
Availability of funds for procurement of sports kits, equipment, league organization and training
Sports Facilities Sports Development
Designing and construction
Inadequate funding
Preparation of BQs, tender documents and supervision of works
Promotion, Development and Preservation of Cultural Heritage
Cultural Heritage
Provision of market for cultural goods and services
Trade; open air markets; Participation of Youth; Participation of women
Competition from low quality Chinese products
Marketing of Mombasa as a tourist destination of choice; Organizing more open air market days
Encourage more youth and women to venture in preservation of cultural heritage
Historical and Cultural Sites
Cultural Heritage
Promote tourism; Facilitate youth and women employment
Reduced freedom for use of privately-owned monuments
Increasing branding and marketing of monuments; Increased community involvement; Increase collaboration with private monument owners; Heritage sites owners should not pay land rates-framework for compensation
Promotion and Development of Culture and Creative Arts
Public Recreation and Entertainment
Provision of market for cultural goods and services; open air markets; Participation of Youth; Participation of women
Inadequate funding
Marketing of Mombasa as a tourist destination of choice; Organizing more open air market days
Encourage more youth and women to venture in Culture and creative arts
Promotion and Development of recreation and entertainment facilities
Public Recreation and Entertainment
Designing and construction
Unavailability of land
Preparation of BQs, tender documents and supervision of works
Empowered PWDs PWDs Trade licenses Lack of policy Waivers on licenses for PWDs
Affirmative Action PWDs Equity in employment; Building
Ignorance Ensure employment of PWDs; To ensure County Buildings are PWDs compliant

113
3.2.5: Agriculture, Rural and Urban Development Sector
➢ Agriculture
The Crops sub department: has planned to undertake the following:
Administration, Planning and Support Services: The crops sub-department has planned the following
• The sub department plans to Capacity build 48 staff on promotional courses, short courses on agricultural technologies that will aid them in improved service delivery to farmers.
• Plan to capacity build 5000 stakeholders on value addition, agribusiness, urban & peri urban
agricultural technologies, climate smart agricultural technologies, cross cutting issues, crop
husbandry through Barraza’s, on farm demonstrations, trainings, group visits, individual farm
visits, farmers field days, seminars and workshops.
• Plan to recruit 45 technical staff so as to reduce the high workload for the existing staff and wider
coverage of extension units that lack staff and for improved service delivery and efficiency.
Crop Production and Productivity: The crops sub department has planned the following in order to
improve food security
• Increase the number of households accessing food within the county to 11,000. This will be achieved by training the households in various agricultural technologies using different extension methods.
• Help vulnerable farmers benefiting from input subsidy programme. The sub department targeted to issue 5000 farmers with certified maize seeds, assorted vegetable seeds & fertilizer for planting during the long rains season. The main objective is to improve food security and household incomes.
• Facilitate farmers to put 7 acres under vegetable production using micro irrigation for farmer groups in Likoni, Jomvu, Changamwe, Mvita, Nyali & Kisauni sub counties
• Plan to plough 400 acres of land for farmers using tractor. The county purchased 2 more tractors
and accessories in the last financial year and this will be used in the current financial year to
expand the acreages for crop production and ensure that land preparation is timely before the
onset of the rains.
• Plan to rehabilitate 5 water pans in Mwakirunge, Mirironi & Dongo kundu for use in vegetable
production under irrigation for farmer groups living around these waterpans.
• Plan to purchase 100,000 tree seedlings for planting within the county so as to mitigate
environmental degradation.
• Plan to implement 3 climate smart agricultural technologies
Marketing and value addition: The crops sub department plans to undertake the following in order to
increase income and create employment among the youth, women, people living with HIV/AIDs & people
living with disabilities
• Plan to increase the percentage quantity of local produce accessing the retail market by 5%. This will be achieved through capacity building of farmers.
• Plan to enable groups’ 40 women, people living with disabilities and youth to engage in value addition of agricultural for employment creation, in value addition of coconut, assorted fruits, amaranthus, groundnuts, root crops, wheat crops.
• Plan to ensure that the number of value added products accessing the market is 5.The sub department will train the groups on how to improve the quality of their value added products and get KEBS mark and hence access the super markets.
• Plan to increase the percentage in the farm household income 12%. With many groups
undertaking value addition and accessing the market with their products this results in increase
in farm household income.

114
• Plan to purchase 3 value addition equipment for groups
• Construction of an agribusiness, value addition center in Mwakirunge
The sub department of Livestock intends to;
• To capacity build 19 members of staff and 2000 stakeholders and recruit 4 officers.
Through our livestock extension we targeted to increase the percentage of households accessing food to 70%, household income by 20%, the quantities of animal produce and products by 12% and the produce accessing market to 70%. We also targeted to increase the number of value addition groups to 12 as well as the number of value added products by 20%. We targeted to issue 1000 farmers with subsidized inputs and increase the number of livestock breeds to 180,000.
• To construct one sale yard in Mwakirunge
The sub department of veterinary services intends to ;
• Carry out animal disease, pest control and management by carrying three vaccination campaigns
targeting to increase the animals vaccinated against trade and public health sensitive diseases
and control of livestock pests to 80% (16000 animals) additionally, will increase the number of
livestock slaughtered and inspected in licensed slaughter houses to 81.5% (400,000).
• One large stock Slaughter house will be in Likoni Sub-county and one poultry slaughter house
rehabilitated in Mvita Sub County this will improve the quality of meat being consumed in the
county and also will generate more revenue.
• The sub-department also envisages recruiting technical staff, capacity build staff and also
capacity build animal health and animal welfare stakeholders
Key statistics:
• Area: 212.48 km2
• Agricultural land 129.1 km2
• Land under crop production 23.22 km2 which is 18 % of the total agricultural land
• Urban area is 140.6 km2
• Population: 924,143 persons-2009 population census (1,300,000 persons 2015 projection)
• Total Population of Livestock in Mombasa County is 169,198(cattle, shoats camels, crocodiles and poultry)
• Irrigation potential: 13 km2
• Irrigated: 2 km2 (15% of the total irrigation potential)
• Farm families: 24,200
• Staff: 75 technical staff & 36 Administration staff
• Staff: farmer ratio: 1:781
• There are 15 Beach Management Units with a membership of approximately 4, 500 people
• Fishermen use 1,500 motorised and non-motorised artisanal fishing vessels
• Fish catches ranges from 800,000 – 1,000,000 Kgs/yr
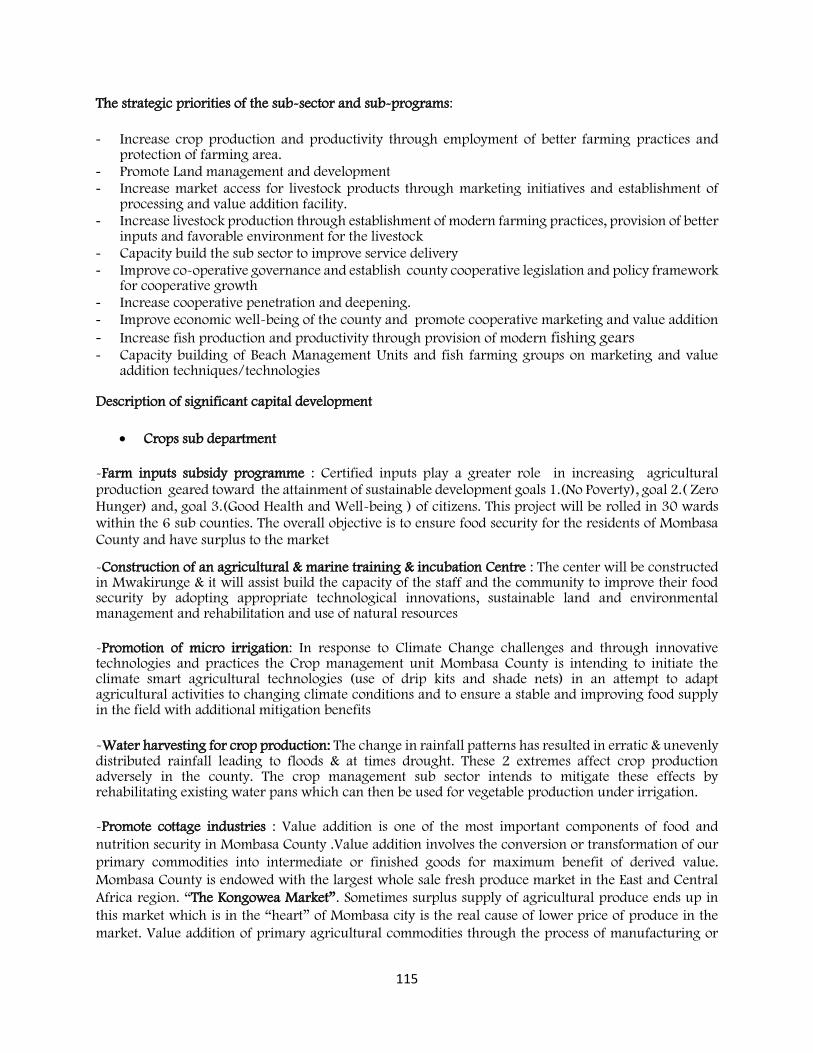
115
The strategic priorities of the sub-sector and sub-programs:
- Increase crop production and productivity through employment of better farming practices and protection of farming area.
- Promote Land management and development
- Increase market access for livestock products through marketing initiatives and establishment of processing and value addition facility.
- Increase livestock production through establishment of modern farming practices, provision of better inputs and favorable environment for the livestock
- Capacity build the sub sector to improve service delivery
- Improve co-operative governance and establish county cooperative legislation and policy framework for cooperative growth
- Increase cooperative penetration and deepening.
- Improve economic well-being of the county and promote cooperative marketing and value addition
- Increase fish production and productivity through provision of modern fishing gears - Capacity building of Beach Management Units and fish farming groups on marketing and value
addition techniques/technologies
Description of significant capital development
• Crops sub department
-Farm inputs subsidy programme : Certified inputs play a greater role in increasing agricultural production geared toward the attainment of sustainable development goals 1.(No Poverty), goal 2.( Zero Hunger) and, goal 3.(Good Health and Well-being ) of citizens. This project will be rolled in 30 wards within the 6 sub counties. The overall objective is to ensure food security for the residents of Mombasa County and have surplus to the market
-Construction of an agricultural & marine training & incubation Centre : The center will be constructed in Mwakirunge & it will assist build the capacity of the staff and the community to improve their food security by adopting appropriate technological innovations, sustainable land and environmental management and rehabilitation and use of natural resources
-Promotion of micro irrigation: In response to Climate Change challenges and through innovative technologies and practices the Crop management unit Mombasa County is intending to initiate the climate smart agricultural technologies (use of drip kits and shade nets) in an attempt to adapt agricultural activities to changing climate conditions and to ensure a stable and improving food supply in the field with additional mitigation benefits
-Water harvesting for crop production: The change in rainfall patterns has resulted in erratic & unevenly distributed rainfall leading to floods & at times drought. These 2 extremes affect crop production adversely in the county. The crop management sub sector intends to mitigate these effects by rehabilitating existing water pans which can then be used for vegetable production under irrigation.
-Promote cottage industries : Value addition is one of the most important components of food and
nutrition security in Mombasa County .Value addition involves the conversion or transformation of our
primary commodities into intermediate or finished goods for maximum benefit of derived value.
Mombasa County is endowed with the largest whole sale fresh produce market in the East and Central
Africa region. “The Kongowea Market”. Sometimes surplus supply of agricultural produce ends up in
this market which is in the “heart” of Mombasa city is the real cause of lower price of produce in the
market. Value addition of primary agricultural commodities through the process of manufacturing or

116
agro processing will increase the value of agricultural commodities thus also increasing their economic
value & increase household incomes for youth, women & disabled groups. This project will be rolled in 6
sub counties
-Agricultural machinery: These are value addition equipment. Value addition increases the shelf life of a product and at the same time increases the value or the income from the same product and creates employment
-Purchase of furniture: To make working environment more comfortable
-Purchase of motor vehicle and motor cycle
• Sub department Livestock
-Sale yards: The sale yard will enhance marketing of livestock and livestock products help farmers access the market and at the same time generate revenue for the county. Develop a marketing infrastructure. There is no sale yard in the County. Hence animals are sold by the road reserves. Purchase of breeding stocks to improve the breeds as the county does not offer Artificial Insemination. This will improve productivity and production hence increase income for the households.
-Promotion of Dairy goats: Mombasa County being an urban county, with farmers having small land sizes which cannot sustain cattle. Farmers are being given breeding stock to improve the production and productivity. There is no Artificial Insemination done by the County. Dairy goat production will improve the food security to the households and farmers will be able to get income from milk. Cottages industries can be established later for value addition and hence create employment.
-Promotion of indigenous Poultry and Rabbit production: Poultry and rabbits are small animals and can be reared in Urban as well as in the Peri urban areas. Mombasa has a problem of agricultural land, the department is promoting the Urban and peri urban Agriculture and these livestock are best suited. Promotion of these enterprises will lead to improving the food security and income for the households. Also value addition can be done in both poultry and rabbits and cottages industries can be established hence creating employment.
-Purchase of motor bikes: To improve efficiency in dissemination of Livestock extension services.
• Sub department veterinary
The Sub-Department will construct one slaughter slab for large stock in Likoni Sub County and rehabilitation of Majengo poultry slaughter slab. This will improve the quality of meat being consumed in the County and also will generate more revenue
• Sub department cooperatives -Develop a business information Centre
• Sub department of Fisheries
- Procurement of modern fishing boats and fishing gears: This will increase fish production leading to improved food security and nutrition. This will also improve incomes to the fisher folk leading to improved livelihoods.
- Promotion of fish farming: The sub department is planning to promote aquaculture and mariculture in the county inorder to reduce over-reliance of capture fisheries for source of food and income.

117
- Renovation of fisheries office block, installation of air conditioners and ICT equipment as a way to make the office a suitable environment for work. This will in turn improve work efficiency and quality as staff will be motivated.
- Purchase of motor cycle will also improve extension service hence service delivery to our customers will be easy and fast.
- Fish farming promotion (aquaculture, cage farming);
- Common user cold storage;
- Establishment of fish landing sites;
- Establishment of fish ports;
- Establishment of fish auction market Sector/sub-sector key stakeholders and the responsibilities
Stakeholder Name Responsibility
Research Institutions Crop, livestock and Fisheries research
Institutions of higher learning Staff training and induction
Farmers/CBOs Community development and empowerment
Non-Governmental Organizations (NGOs) Policy Advocacy
Development partners Support development projects
Pest Control Products Board Regulation and advisory
Kenya Plant Health Inspectorate Service (KePHIS) Regulatory
National Environmental Management Authority (NEMA Safeguard environment
Ministry of Agriculture Livestock, Fisheries and irrigation. Development of national policy and capacity building
Department of Health Collaboration in prevention and control of zoonotic diseases
KALRO Naivasha Researches in livestock
Mombasa Kuku Kienyeji development Cooperative Cooperative helps in marketing poultry and poultry
products
(Value Chain Actors ) Meat, Milk, Hides and Skins ,Livestock
traders
Production and marketing of various animal and animal
products
Department of lands Issue title deeds and develop policies on lands issues and
planning
Department of finance Provides the finances to implement projects
Department of trade Develop markets for livestock produce and products
Action AID Capacity build value chain actors and also advocacy.
KENAFF Voice of the farmer.
Catholic Church Buys subsidies for farmers
Financial institutions Loaning facilities

118
Regional Veterinary Investigation Laboratory Disease surveillance and investigation
Kenya Veterinary Vaccines Production Institute Suppliers of animal vaccines
Kenya Veterinary Board Regulation of Veterinary Profession
Kenya Dairy Board Regulation of the Dairy industry
Kenya Veterinary Association/Kenya Veterinary Paraprofessionals Association (KVPA)/ Kenya Association of Livestock Technicians (KALT)
Advocates for welfare of the veterinary professionals
Kenya Society for Protection & Care of Animals (KSPCA) Advocates for animal welfare
Veterinary Pharmaceutical Companies distributes veterinary drugs
Hatcheries And Day old chick suppliers Hatches and distributes day old chicks
Animal feed manufacturers Supplies animal feeds
Agrovets Sells animal inputs
World vision Capacity builds farmers on human rights and advocacy issues
Haller foundation Capacity building of farmers
Mombasa county cooperative committee Organize cooperative
Sector/ Sub-sector programmes
Programme Name : CROP MANAGEMENT
Objective: Improve livelihoods by promotion of competitive farming, appropriate policy and development environment, effective support services, sustainable natural resources and Land management Outcome: Efficient service delivery, Improved livelihoods & household food security and nutrition Sub Programme Key outputs Key performance indicators Planned Targets
Administration, Planning and Support Services
Staff trained -Number of staff capacity build
- Number of stakeholders capacity build on climate change, environmental conservation, HIV/AIDs, agricultural technologies
- Number of technical staff recruited
48 5000 45
Crop Production and Productivity Improved food security and nutrition security at household level.
- Percentage increase in number of households accessing food -Number of farmers benefiting from input subsidy programme -Acres put under vegetable production under micro irrigation & shade net - Acres put under crop production through mechanization -Number of water pans rehabilitated for vegetable production
11,000 5000 7acres 400 acres 5 water pans

119
-Number of tree seedlings acquired & planted -Number of climate smart agriculture technologies implemented
100,000 seedlings 3
Marketing and value addition Improved incomes at the household level.
- Percentage increase in quantity of local produce accessing the retail market - Number of women, disabled and youth groups engaged in value additions for employment creation - Number of value added products accessing the market -Number of value addition equipment acquired for youth, disabled & women groups -Construction of agricultural & marine training & incubation centre - Construction of a county value addition center
5% 40 5 3 Phase 1
Programme Name: VETERINARY SERVICES
Objective: To prevent and control animal pests and diseases and improve animal welfare Outcome: Healthy and productive animals Sub Programme Key outputs Key performance indicators Planned Targets
Disease ,pest control and management
animals vaccinated % increase in animals vaccinated against trade and public health sensitive diseases
80% Vaccinated (16000) animals against trade and public health sensitive diseases
Animals slaughter in licensed facility.
% livestock slaughtered and inspected in licensed slaughter house
81.5% (400,000) livestock Slaughter and inspect 400,000
Farmers issued with vaccines and veterinary inputs.
No. of farmers issued with subsidized inputs
1000 farmers benefit with subsidized veterinary inputs and services
Staff capacities build. Number of staff capacity build 27 staff capacity build.
Technical staff recruited.
Number of technical staff recruited 4 technical staff recruited
Animal health and animal welfare stakeholders capacity build
Number of Animal health and animal welfare stakeholders capacity build
1000 Animal health and animal welfare stakeholders capacity build
Programme Name: Cooperative Development (Administration, Planning and Support Services)
Objective: Improved access to co-operative information , extension and advisory service Outcome: Optimal use of available resources and efficient service delivery in cooperative development Sub Programme Key outputs Key performance indicators Planned Targets
Build staff capacity Enhanced efficiency
and effectiveness in service delivery
Number of staff capacity build 18
Build stakeholders and institutions capacity
Enhanced awareness by stakeholders on cooperative issues
Number of stakeholders and institutions capacity build
3000
Recruit technical staff Enhanced HR capacity in the directorate
Number of technical staff recruited 5
Programme Name: Cooperative Development (Cooperative Marketing and value addition)

120
Objective: Outcome: Improved livelihood for the households through income generation activities Sub Programme Key outputs Key performance indicators Planned Targets
Marketing of Jua Kali products through a cooperative society
New jobs created and increase in number of women and youth engaged in income generating activities
Increased income for women and youth
Introduce weekly market concept
Increased income for the players
Improved livelihood
Training & capacity building on products improvement
Increase in value of the products and access to retail market
Increase in products trading in the market
Encourage cottage industries and strengthen value chain development
Improved livelihoods Increased incomes
Training programs for SME entrepreneurs to promote business and savings
Increase the number of entrepreneurs with a high business acumen
Number of new business started
Organizing annual fair to showcase the Jua Kali products at county and national level
Enhance the profile of Jua kali products
Increase in revenues generated from Jua kali products
Programme Name: LIVESTOCK PRODUCTION
Objective: To improve productivity of Livestock and livestock produce through effective extension services
Outcome: Improved household food security, nutrition and income Sub Programme Key outputs Key performance indicators Planned Targets
Administration, Planning and Support Services
Staff trained Number of staff capacity build, Number of livestock stakeholders capacity build, Number of technical staff recruited,
19
1000
14
Livestock Production and Management
Increased number of improved Livestock breeds and productivity
Percentage of households accessing food Number of farmers issued with subsidized inputs Increase in the number of livestock breeds
70%
1000
180,000
Livestock Products Value addition and Marketing
improved livestock Productivity
Percentage increase in quantity of local produce accessing the retail market Number of groups engaged in value addition for employment creation Percentage Increase in the number of value added products accessing the market
70%
12
20%
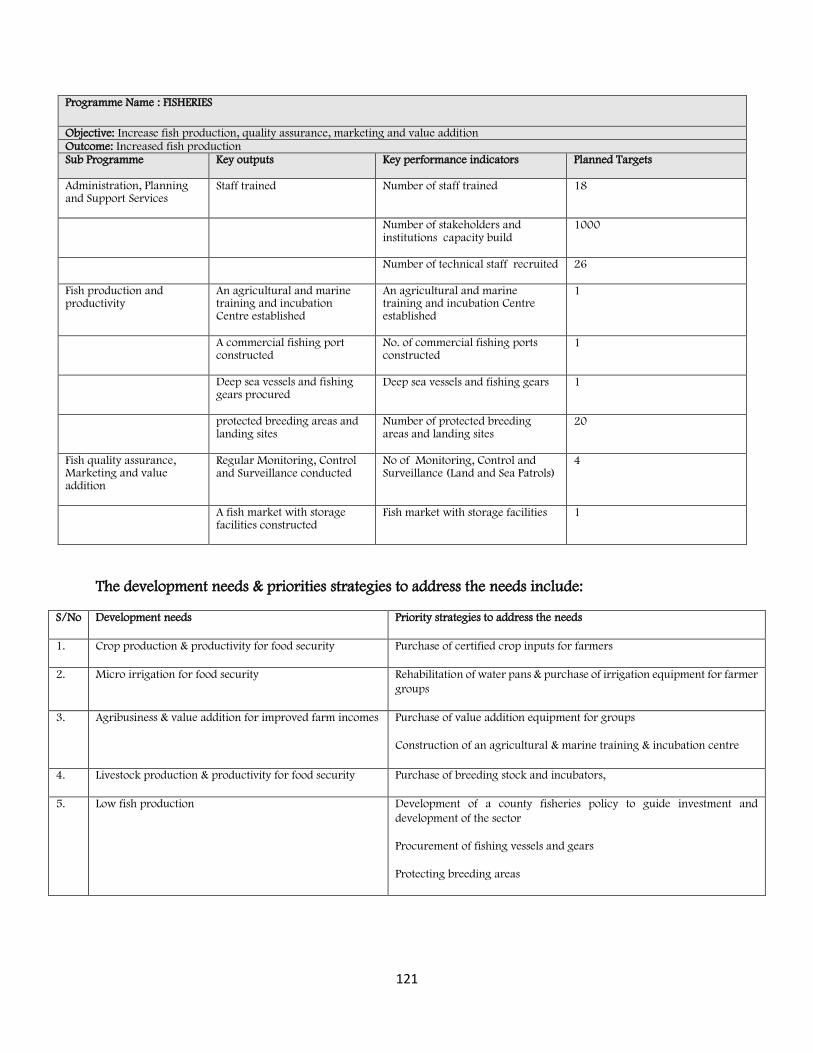
121
Programme Name : FISHERIES
Objective: Increase fish production, quality assurance, marketing and value addition Outcome: Increased fish production Sub Programme Key outputs Key performance indicators Planned Targets
Administration, Planning and Support Services
Staff trained Number of staff trained 18
Number of stakeholders and institutions capacity build
1000
Number of technical staff recruited 26
Fish production and productivity
An agricultural and marine training and incubation Centre established
An agricultural and marine training and incubation Centre established
1
A commercial fishing port constructed
No. of commercial fishing ports constructed
1
Deep sea vessels and fishing gears procured
Deep sea vessels and fishing gears 1
protected breeding areas and landing sites
Number of protected breeding areas and landing sites
20
Fish quality assurance, Marketing and value addition
Regular Monitoring, Control and Surveillance conducted
No of Monitoring, Control and Surveillance (Land and Sea Patrols)
4
A fish market with storage facilities constructed
Fish market with storage facilities 1
The development needs & priorities strategies to address the needs include:
S/No Development needs Priority strategies to address the needs
1. Crop production & productivity for food security Purchase of certified crop inputs for farmers
2. Micro irrigation for food security Rehabilitation of water pans & purchase of irrigation equipment for farmer
groups
3. Agribusiness & value addition for improved farm incomes Purchase of value addition equipment for groups
Construction of an agricultural & marine training & incubation centre
4. Livestock production & productivity for food security Purchase of breeding stock and incubators,
5. Low fish production Development of a county fisheries policy to guide investment and
development of the sector
Procurement of fishing vessels and gears
Protecting breeding areas

122
A summary of the capital projects to be implemented during the plan period
Project Name Location/ Ward Objective Output/ Outcome Performance Indicators Time Frame (Start- End)
Implementing Agencies Cost (Kshs)
Farm Inputs subsidy programme
Kisauni, Likoni, Jomvu, Changamwe, Mvita & Nyali sub counties
Improve infrastructure, productivity and outputs
3000 farmers benefit from input subsidy programme
Number of farmers issued with subsidized inputs
2020-2021
County Government 4.8M
Promotion of micro irrigation
Kisauni, Likoni, Mvita and Jomvu Sub counties
Improve productivity
7 acres put under
production
through micro
irrigation.
Acres of land opened up for vegetable crop farming
2020-21
County Government 1.5M
Water harvesting for crop production
Mwakirunge, Marimani, Dongo kundu, Jomvu kuu
To open up more land under irrigation to improve crop production and productivity
More agricultural produce from the county in the market
-Number of water pans rehabilitated
-Number of farms under irrigation
-Acres of land under irrigation around water pans
2020-21
County Government 24,077,476
Farm Inputs subsidy programme
Kisauni, Likoni, Jomvu, Changamwe, Mvita & Nyali sub counties
Improve infrastructure, productivity and outputs
3000 farmers benefit from input subsidy programme
Number of farmers issued with subsidized inputs
2020-21
County Government 5M
Promote cottage industries and strengthen value chain development
Mvita, Nyali, Changamwe, Kisauni, Likoni, Jomvu sub counties
To promote value addition of agricultural produce
Improved livelihoods of the household in the county
-Number of groups women and youth engaged in value additions for employment creation -Number of value added products accessing the market -Number of value addition equipment bought for groups
2020-21
County Government of Mombasa Department of Agriculture
2.4M
Promote cottage industries and strengthen value chain development
Mvita, Nyali, Changamwe, Kisauni, Likoni, Jomvu subcounties
To promote value addition of agricultural produce
Improved livelihoods of the household in the county
-Number of groups women and youth engaged in value additions for employment creation -Number of value added products accessing the market -Number of value addition equipment bought for groups
2020-
21 County Government of Mombasa Department of Agriculture
1.5M
Sale yard Mwakirunge To enhance marketing of livestock and livestock products To generate revenue for
Improved household income for the livestock farmers
One sale yard constructed
2020-
21 County Government of Mombasa
Department of Agriculture, Livestock,
20M

123
Project Name Location/ Ward Objective Output/ Outcome Performance Indicators Time Frame (Start- End)
Implementing Agencies Cost (Kshs)
the county and to help farmers access the market
Number of livestock sold
Fisheries & Cooperative and partners
Dairy goats project
All wards in likoni, changamwe, jomvu, Kisauni and Nyali subcounties
To improve livestock productivity in the county
Improved livelihood for the households through income generating activities
Percentage Increase in the household income
Increase in number of dairy goats
2020-
21 County Government of Mombasa
Department of Agriculture,Livestock, Fisheries & Cooperative and partners
2.5M
Poultry project All wards in the County
To improve livestock productivity in the county
Improved livelihood for the households through income generating activities
Percentage Increase in the household income
Increase in number of poultry
2020-
21 County Government of Mombasa
Department of Agriculture,Livestock, Fisheries & Cooperative and partners
1M
Rabbit project All wards in the County
To improve livestock productivity in the county
Improved livelihood for the households through income generating activities
Percentage Increase in the household income
Increase in number of rabbits
2020-
21 County Government of Mombasa
Department of Agriculture,Livestock, Fisheries & Cooperative and partners
1M
Agricultural
machinery
All wards in the County
To improve livestock productivity and value added products in the county
Increase in value added products
Number of equipment in place
2020-
21 County Government of Mombasa
Department of Agriculture,Livestock, Fisheries & Cooperative and partners 1M
Disease and Pest control and management
All wards To control diseases and pest and improve animal production and welfare
healthy,high productive Animals and safe animal products
No of animals vaccinated
2020-
21 DALFC 7,000,000
Construct County abattoirs/ slaughter houses
Kisauni To ensure quality and safe meat, co-product and by product
High quality livestock products for consumption and industry
Number of abattoirs/ slaughterhouses developed
2020-
21 DALFC 20,,000,000
Rehabilitate Majengo Poultry Slaughter Slab
Mvita To ensure quality and safe meat, co-product and by product
High quality livestock products for consumption and industry
Number of abattoirs/ slaughterhouses developed
2020-
21 DALFC 9,000,000

124
Project Name Location/ Ward Objective Output/ Outcome Performance Indicators Time Frame (Start- End)
Implementing Agencies Cost (Kshs)
Purchase of backup generator for vaccine preservation
Uhuru na kazi and Kisauni
To improve service delivery efficiency
Healthy,productive and safe animal products
No. of generator procured
2020-
21 DALFC 600,000
Establish a Veterinary Laboratory
Nyali To effectively and economically manage diseases
Quick diagnosis and management of diseases
No of Laboratory established and operationalized
2020-
21 DALFC 10M
Leather cottage industries established
Kisauni and Mvita
To enhance leather value addition
Increased income for leather value hain actors
No of cottages established
2020-
21 DALFC 10M
Develop Business Information Centre
County Facilitate flow of information for better market decisions
Better decisions and improved market linkage
Number of people receiving services from the center
2020-
21 50M
Purchase of fishing boats
County wide Increase capture fish production
Increased catches and incomes
Number of boats purchased
2020-
21 County Government 120 M
Construction of a 100 tonnes Multi-user Cold Store
Mvita Reduce post-harvest losses through better handling and improved roads and storage facilities
Increased Revenue collection
Percentage increase in revenue collected
2020-
21 County Government of Mombasa and Jumuiya ya Kaunti za Pwani
80 M
Construction of a modern fish bandas including a meeting hall at Landing sites
All sub counties Improve Mombasa county landing beaches’ quality standards
Improved quality of landed fish leading to good fish prices hence increased incomes
Percent decrease in fish brokers and percent increase in fish prices at landing sites
2020-
21 County Government of Mombasa and partners
12 M
Identification and facilitation in pond construction for fish farming (mariculture
Kisauni, Likoni and Jomvu
Promotion of Aquaculture for increased fish production
Sustainable fisheries supply for sustainable income to fishermen and creation of employment opportunities for women and youth
Percentage increase in the volume of fish from inland sources, no of youth and women actively engaged in IGA
2020-
21 County Government of Mombasa and partners
6 M
Construction of a modern fish market equipped with adequate cold chain facilities.
Mvita Centralized fish market for better prices
Increase in income generated from fish
Improved market for fish and fishery products
2020-
21 County Government of Mombasa and partners
20 M
Acquisition, rehabilitation and improvement of the landing sites
44 landing sites Establishment of designated landing sites for development
Designated and improved landing sites with title deeds
Number of designated, improved and titled landing sites
2020-
21 County Government of Mombasa Kenya Ports Authority and development partners
10 M

125
Cross-Sectoral Implementation Considerations in Crops sub department
Program Name
SECTOR Cross- sector Impact Measures to harness or Mitigate the impact
Synergies Adverse impact
Crop Development
ARUD Health
• Improved health and nutrition
• Negative health effects of pesticide use
• Activities can create breeding sites for vectors
• Increase production to promote food security and nutrition
• Training on safe use of pesticides and increase surveillance
• Encourage vector control
ARUD Environmental Protection, Water And Natural Resources
• Promotion of green city
• Negative environmental impact from pesticide use and production of agricultural waste
• Competing use of portable water
• Promote urban and peri urban agriculture and 10% farm forest policy
• Training on GAP (good agricultural practices)
• Promote water harvesting and conservation technologies
ARUD
Social Protection, Culture And Recreation
• Alleviation of poverty and social protection
• Creation of dependency syndrome
• Participatory approach to program planning and implementation
• Implementation of agricultural based social protection programs
ARUD General Economic, And Commercial Affairs;
• Income generation and creation of employment
• Increased Rural urban migration
• Increase in budgetary allocation required by the department
• Promote value addition and cottage industries
• Diversification of enterprises
• Promotion of agro tourism
• Resource mobilization from partners and PPP
ARUD Education
• Improvement of child health increasing retention of pupils
• Child labor in farms • Increase production to promote food security and nutrition
• Discourage use of child labour in agriculture through sensitization
ARUD Energy, Infrastructure And Ict
• Improvement and maintenance of farm roads
• Fragmentation of agricultural land
• Mobilize farmers to provide for access roads in the farms
• Policy on agricultural land management
ARUD Public Administration & International (Or Inter-Government) Relations;
• Enhanced Staff development
• Creation of a conducive working environment
• Overlapping departmental and/or intergovernmental functions
• Inefficient service delivery
• Staff development plans
• Development of policies and bills
•
Veterinary Services
ARUD Health
• Improved health and nutrition to households in Mombasa county
• Negative health effects from misuse of animal drugs
• Activities can create breeding sites for vectors
• Negative health from animal diseases(zoonotic diseases)
• Negative health due to low production of foods of animal origin
• Training on safe use of animal drugs and chemicals
• Encourage vector control and animal welfare
• Increase production to promote food security and nutrition
ARUD Environmental Protection, Water And Natural Resources
• Contribution to waste management
• Environmental degradation due to overstocking
• Negative environmental impact from pesticides and greenhouse gases emission.
• Competing portable water
• Use of modern technologies of fodder production
• Promote sorting of Livestock waste and making use in animal feed
• Promote production of organic manure from waste

126
• Planting of fodder trees which protects water and natural resources
• Training on modern integrated livestock production practices
• Promote Water harvesting and conservation technologies
ARUD Social Protection, Culture And Recreation
• Alleviation of poverty and social protection
• Perceived as a poor man’s job
• Slow returns to investment
• Participatory approach to program planning and implementation
• Implementation of livestock based social protection programs
ARUD
General Economic, And Commercial Affairs;
• Income generation and creation of employment
• Revenue generation
• Increased Peri urban to urban migration
• Promote Livestock based value addition and cottage industries in the peri urban parts of the County
• Diversification of Livestock enterprises
ARUD Education
• Improvement of child health increasing retention of pupils in schools
• Use of schools to promote livestock production
• Child labor in farms • Increase production to promote food security and nutrition
• Discourage use of child labor in livestock through sensitization and surveillance
ARUD Energy, Infrastructure and ICT
• Improvement and maintenance of farm roads
• Contribution on alternative sources of energy (Biogas)
• Increase in cost of infrastructure development due to fragmentation of agricultural land
• Policy on agricultural land management
• Promote use livestock waste for as an alternative source of energy
ARUD Public Administration & International (Or Inter-Government) Relations;
• Livestock subsector capacity development
• Creation of a conducive working environment
• Overlapping intergovernmental functions
• Inefficient service delivery
• Staff development plans
• Development of policies and bills
•
Cooperative Development
ARUD Energy, Infrastructure and ICT
• Improve the value of property through value addition and land development ( Housing Cooperatives)
• Potential to raise infrastructure bonds through cooperative engagement
• Strain existing infrastructure due to increased population
• Potential source of conflict from sharing of resources
• Need for adequate legislation and policy,
• Need for collaboration and stakeholders engagement in development
ARUD General Economic, and Commercial Affairs
• Alleviation of poverty through creation of new employment,
• Access to markets,
• Increase value of products through value additions
Increased taxation and licensing by the county government
Concessions from the county government on infant cooperatives and industries
ARUD Environmental Protection, Water and Natural Resources
Involve cooperatives in the implementation of the 17 SDGs

127
Cooperatives participate in sustainable development goal No. 13 on climate action.
ARUD Health
• Improve household livelihoods
• Access to medical services and insurance facilities
• Improved housing conditions and Hygiene
ARUD Public Administration & International (or inter-government) Relations
• Enhanced Staff development
• Creation of a conducive working environment
Poor involvement of cooperative staff in the county affairs
Poor definition of roles
Constant energumen and review of progress
ARUD Social Protection, Culture and Recreation
• Contributing to youth and women empowerment through creation of income generating activities for women and youth
• Involvement of women and youth in decision making
Can contribute to family dispute by shifting power base from male domination to fair distribution
Need for civic and family training
ARUD Education
• Provide resources for education through school fees loans, improved living standards
• Increase sensitizations on the need for education
Need for more partnership with the county on the education-biased program to increase their impact. Cooperatives can manage an education revolving fund jointly established by the cooperatives and the county government
Fisheries development
ARUD General Economic, And Commercial Affairs;
• Increase in trade and industry
• Income generation and creation of employment
• Revenue generation
• Income generation and creation of employment
• Port congestion
• Increased Rural urban migration Increased Rural urban migration
• Increase in budgetary allocation required by the department
• Construction of a fish port and market
• Promote value addition and cottage industries
• Diversification of enterprises Promote value addition and cottage industries
• Diversification of enterprises
• Promote sport fishing and ornamental fish production
• Resource mobilization from partners and PPP
ARUD
Health
• Improved health and nutrition
• Negative health effects from poor fish handling
• Increase production to promote food security and nutrition
• Training on post-harvest handling and preservation and increase surveillance
• Construct post-harvest handling and quality assurance facilities
ARUD Environmental Protection, Water And Natural Resources
• Protection of the marine ecosystem
• Negative environmental impact from depletion of rare and endangered fish species
• Environmental destruction from fishing activities
• Promote marine conservation
• Training on marine ecosystem management
• Promote water harvesting and conservation technologies

128
• Competing water usage
ARUD
Social Protection, Culture And Recreation
• Alleviation of poverty and social protection
• Creation of dependency syndrome
• Participatory approach to programme planning and implementation
• Implementation of fisheries based social protection programmes
ARUD Energy, Infrastructure And ICT
• Improvement and maintenance of fisheries infrastructure
• Destruction of the marine ecosystem
• Mobilize fisher folk to provide for access roads and land for fisheries infrastructure
• Policy on fisheries management ARUD Public Administration & International
(Or Inter-Government) Relations;
• Enhanced Staff development
• Creation of a conducive working environment
• Overlapping departmental and/or intergovernmental functions
• Inefficient service delivery
• Staff development plans
• Development of policies and bills
•

129
3.2.6: Environmental Protection, Water & Natural Resources
Programme 1: General Administration, Planning & Support Services
Objective: To improve workplace Environment, HR-Capacities and service delivery
Outcome: Effective service delivery Sub Programme Key outputs Key performance indicators Planned Targets Work Environment Place improvement.
Improved work place environment
No. of office block refurbished. 1 No. office block.
No. of office block Constructed 1 No. office block.
Capacity Building Improved service delivery. No. of staff trained. 10 staff
Managerial and operational systems improvement
Improved service delivery. No. of Office Equipment’s purchased
Assorted
Programme 2: Sanitation and Sewerage Services.
Objective: To improve sanitation/sewerage systems, coverage, Access, Hygiene and Service delivery
Outcome: Improved coverage/status of Sewer Network and Public Sanitation facilities. Sub Programme Key outputs Key performance indicators Planned Targets Sewer systems improvement ▪ Sewer lines
rehabilitated. ▪ 100 manholes
chambers with regular overflows rehabilitated.
▪ Km of pipeline rehabilitated ▪ No. of Chambers
Rehabilitated.
▪ 5km
▪ 100 No
Sewerage coverage Improvement
Decentralized waste water facilities constructed.
No.of DWWF constructed 2 No.
Improvement of existing public sanitation facilities
Public ablution blocks rehabilitated.
No. of Ablution blocks rehabilitated.
5No
Public sanitation facilities coverage improvement
New public ablution blocks constructed.
No. of Ablution blocks constructed
2No
Programme 3: Water Supply and Management
Objective: To improve water supply systems,Access,coverage, production and Service delivery
Outcome: Improved Water supply Coverage, Efficiency and Production. Sub Programme Key outputs Key performance indicators Planned Targets NRW reduction Reduced Non-Revenue
Water % of reduction. 2%
Survey & Design Water Systems surveyed and designed
No. of Water Systems Surveyed. 10 No.
Water Supply Coverage improvement.
Decentralized water systems developed which will include B/Hs, Pipeline network, Storage facilities, Treatment facilities and prepaid meters.
No. of Decentralised Water systems developed.
10 No.
Water Supply Production improvement.
Water abstracted from deep water aquifer at selected public points with
No.of public points water from deep aquifer was abstracted.
10 No.

130
at least 3,200m3 production per day
Water Metering Water Meters Supplied and Installed.
No.of meters installed 2,000 No.
Programme 4: Sustainable Natural resources Management.
Objective: To improve Environment and Socio-Economic growth.
Outcome: Improved Eco- systems, Community capacities and Marketing Sub Programme Key outputs Key performance indicators Planned Targets Improvement of degraded land Kaya Shonda rehabilitated
by planting trees. No. of trees seedlings planted. 5,000 No.
Abandoned quarry rehabilitated at Nguu Tatu into a park with many trees planted.
No. of Abandoned quarries rehabilitated.
1No
Community Empowerment Youth / Women groups empowered / trained in charcoal briquette production
No. of Youth / Women groups empowered/trained.
2 No.
Policy development County Natural resource Bill validated by the Public and enacted by the County Assembly
No. of Bills validated by the public and enacted by the County assembly.
1 No.
Mineral processing and Marketing.
Established a mineral processing, value addition plant and dealership market.
No. of Plant / Market established. 1No.
A summary of the capital projects to be implemented during the plan period
Project Name Location/ Ward
Objective Output/ Outcome Performance Indicators
Time Frame (Start- End)
Implementing Agencies
Cost (Kshs)
ADMINISTRATION,PLANNING AND SUPPORT SERVICES
Refurbishment of office block
Mkomani Ward
To improve workplace Environment.
Refurbished office block
No. of office block refurbished.
Oct -Dec 20 WSNR 3.0m
Construction of new office block.
Mkomani Ward
New office block constructed.
No. of office block constructed
Oct 20-Mar 21
WSNR 9.0m
Staff training KSG To improve service delivery
10 No. Skilled staff
No.of staff trained Dec 20-Jun 21
KSG 4.0m
Improvement of mgt. and operation systems
H/Q To improve service delivery.
Operational sytems
No.of Equipments/Facilities supplied.
Oct-Dec 20 WSNR 10.5m
SANITATION SERVICES IMPROVEMENT

131
Project Name Location/ Ward
Objective Output/ Outcome Performance Indicators
Time Frame (Start- End)
Implementing Agencies
Cost (Kshs)
Rehabilitation of public toilets
Mvita nd Nyali Sub-County
To improve status of sanitation facilities.
5 No. Rehabilitated Public toilets
No. of public toilets rehabilitated.
Jan- Mar 21 WSNR 10.0m
Construction of new public toilets
Likoni and Kisauni Sub-County.
To improve access and Sanitation Coverage.
2No. new public toilets constructed.
No.of new public toilets constructed
Jan-Apr 21 WSNR 10.0m
Construction of decentralized waste water Facilities
Kisauni and Nyali Sub-County
To improve sewerage Coverage
2No. DWWF Constructed
No.of DWWF constructed
Feb – June 21 WSNR 20.0m
Rehabilitation of sewer lines and Manhole Chambers which experience regular overflows.
Changamwe and Mvita Sub-County.
To improve efficiency of sewer lines.
▪ 5km sewer line rehabilitated
▪ 100 No. M/H Chambers rehabilitated..
▪ Km of sewrlines rehabilitated
▪ No.of M/H chambers rehabilitated.
Jan-Jun21 Mowasco 37.0m
WATER SUPPLY SERVICES IMPROVEMENT
Construction of Decentralised water systems which include B/Hs,Pipeline network,elevated storage tanks,treatment facilities and prepaid water meters
All Sub-Counties.
To improve coverage and production.
10 No. DWS constructed
No.of DWS Constructed
Jan-Jun 21 WSNR 150.23m
Survey & Design of water systems
All Sub-Counties
To establish technically sound and efficient systems.
10 No. water systems surveyed and designed.
No. of water systems surveyed and designed.
Oct 20-Jan 21 Mowasco 3.0m
Abtraction of water from deep aquifer at selected public points
All Sub-Counties
To improve production to supplement existing water sources
10 No. public points water was abstracted fro deep aquifer.
No. of public points water was abstracted from deep aquifer.
Sept-Dec 20 WSNR 40.0m
SUSTAINABLE NATURAL RESOURCES MANAGEMENT
Rehabilitation of Kaya Shonda by planting trees.
Shikaadabu Ward
To improve degraded land
5000 trees planted at Kaya Shonda.
No.of trees planted at Kaya Shonda
Oct –Dec 20 WSNR 2.0m
Training of youth/women groups on producing briquette Charcoal.
Likoni and Mvita Sub-County.
To empower youth/Women groups on IGA.
2 No. Youth/Women groups trained.
No. of youth/womwn groups trained
Sept -Dec 20 WSNR 2.2M
Rehabilitation of abandoned quarry at Nguu Tatu
Mwakirunge Ward
To improve Eco-Sytsem
1No. abadone quarry rehabilitated.
No of abandoned quarries rehabilitated
Jan-Mar 21 WSNR 10.0m

132
Establishment of mineral processing plant and the Market
Jomvu or Likoni Sub-County
To improve value addition of the local minerals.
1No. plant and a number of Markets established
No. of Plant and Markets established.
Jan-jun21 WSNR 10.0m
Validation of County Natural resources mgt. Bill through public participation.
All Wards To dissiminate and develop ownership of the Bill by the public..
1No. Bill Validated by the public.
No. of Bills validated by the public.
April 21 WSNR 5.0m
DONOR FUNDED PROJECT(WORLD BANK) UNDER WSDP
Project Name Location/ Ward
Objective Output/ Outcome Performance Indicators
Time Frame (Start- End)
Implementing Agencies
Cost (Kshs)
Rehabilitation & Extension of Mombasa Water Supply Distribution-Lot 2B
All Sub-Counties
To improve and extend the existing network.
50km of pipeline laid
No. of Km of pipeline laid.
July20-Dec 22
Mowasco 749,200,538.34
Rehabilitation of Kipevu Waste Water Treatment Plant (WWTP, Sewers and Pumping Station)
Kipevu ward To improve operational efficiency of the Plant and pumping stations.
1 No. Plant and 4 No. pumping stations
No. of Plants and Pumping stations rehabilitated.
Jul20-Dec22 Mowasco 240,623,354.00
Improvement of Storm Water outlets & Combined Sewer Overflows in Mombasa Island
Mvita Sub-County
To improve and provide preliminary treatment of the stuff at the sea outlets
10 No. sea –outlets with pleminary treatment
No. of sea-outlets with preliminary treatment
Jul 20-Jun 21 Mowasco 459,091,414.80
Purchase and delivery of 2No 4x4WD D/Cabin pick-ups
H/Q To improve service delivery
2 No. Pick-up vehicles purchased
No.of vehicles purchased
Jul-Dec20 Mowasco 11,800,000.00
Purchase and delivery of 4No 6 x 4 Water Boozers
H/Q To improve service delivery
4No. Water Bowsers purchased.
No.of Water bowsers purchased.
Jul-Dec 20 Mowasco 54,000,000.00
Purchase and delivery of 2No 4 x 2 Vacuum Exhauster
H/Q
To improve service delivery
2No. Vacuum Exhausters
No.of vacuum exhausters purchased
July –Dec20 Mowasco 22,000,000.00
TOTAL 1,536,715,307.14

133
Environment
Table: Sector/ Sub-sector programmes Programme Name (Environment):
Objective: To ensure compliance with set environmental laws and regulations Outcome: Pollution control Sub Programme Key outputs Key performance indicators Planned Targets Achieved Targets Remarks* Decommissioning of Kibarani Dumpsite
Ecological restoration of dumpsite
- Cessation of
dumping at site
- Metadata status
- Remediation process
- Park development
Total rehabilitation of the dumpsite
15% achieved at rehabilitation
Parks & Cemeteries Improved aesthetics of county roads, traffic islands, parks, burial sites and other open spaces
- No of roads and open spaces landscaped
- No of rehabilitated county cemeteries
Beautification of Mombasa Roads
40% CBD Roads have been landscaped
Programme Name (Waste Management):
Objective: To develop an efficient waste collection and disposal system Outcome: efficient waste collection and disposal system Sub Programme Key outputs Key performance indicators Planned
Targets Achieved Targets Remarks*
Acquisition of Machinery, Equipment and Tools for Waste Collection and transfer
Coordinated and organized dumping
- Clear access
- Zoned dumping
Equipped with enough Machinery for Collection and Transfer of Garbage
30%
Acquisition/ leasing of appropriate waste collection transfer stations.
Controlled waste disposal
- Developed waste collection
transfer stations.
Development of a waste segregation center
25% In process
Anti-littering and Waste management
Inculcate a culture of responsible waste handling
- No of schools trained
- No of public barazas trained
- Binning programs
- No of community Clean ups
Responsible waste handling
50% achieved through clean ups
Attitude change programs required
Programme Name (Energy):
Objective: To promote the development and use of efficient and alternative energy sources Outcome: efficient and alternative energy sources Sub Programme Key outputs Key performance
indicators Planned Targets Achieved Targets Remarks*

134
County energy survey
Baseline feasibility data
- No of Energy
sources in the
County
- Energy needs of
the County
County energy planning
Ongoing
Programme Name (Climate Change):
Objective: To facilitate a multi sectorial approach to climate change adaptation and mitigation Outcome: climate change adaptation and mitigation Sub Programme Key outputs Key performance
indicators Planned Targets Achieved Targets Remarks*
Climate Change mitigation
- Greening
- Create awareness
- enforcement
- Reduction in open burning
- Increased
Carbon sinks
-100,000 trees -
3.3 Capital Projects
Provide a summary of the capital projects to be implemented during the plan period
Project Name Location/ Ward Objective Output/ Outcome Performance Indicators
Time Frame (Start- End)
Implementing Agencies
Cost (Kshs)
Purchase of plant equipment Waste Management
All Efficient waste management from transfer point to the dumpsite
Efficient transfer of garbage to Mwakirunge Dumpsite
No. of Machinery, Equipment Purchased
No. of Garbage collection Trips made daily
2020-21 DoEWE 220,000,000
Decommissioning of Kibarani Dumpsite
Changamwe Ecological restoration and development of Kibarani
Reclamation practices Establishment of a park
-No of Tree planted at the dumpsite
2020-21 DoEWE 100,000,000
(Phase two)
Fencing of Mwakirunge dumpsite
Mwakirunge contain waste and control dumping and burning
Controlled waste No. of Fencing posts required
No of fencing wire rolls required
2020-21 DoEWE 100,000,000
(Phase two)
Development of an engineered landfill
Mwakirunge Sanitary disposal of waste
Proper waste disposal
-No of landfills generated
-Amount unit of waste disposed in the landfill
2020-21 DoEWE 200,000,000
(Phase two)

135
3.2.7: Education Sector
Introduction
The Education sector endeavors to promote social development by establishing safer cities for the
children of Mombasa County, transforming the human capital and educating the present and future
workforce in an effort to compete in an ever-evolving knowledge economy.
Vision A premier educational service provider known for quality teaching, learning, care and research Mission To develop and promote county children’s and youth’s fullest potential to become competent, responsible and productive citizens in all spheres of life by offering quality educational related services for sustainable socio-economic development process.
Strategic Objectives The strategic objectives for the sector are:
i. To improve the transition rate from home to ECDE, from ECDE to Basic Education, from Basic Education to Tertiary and from Tertiary into the global economy over the next 5 years;
ii. To restore the role of the parents as the primary stakeholders in education and child care in partnership with children, teachers and care givers;
iii. To improve the quality of care for every child by raising the standard of education qualification, skill, attitudes and values in teaching and learning across all levels and sectors of education over the next 5 years;
iv. To increase financial, technical and human resource by 55% annually; v. A multi-sector approach to dignified care and safety for children over the next 5 years; and
vi. To improve exposure and access to information in order to inspire transformation, create international thinking and establish global networking opportunities over the next 5 years for every child.
Sector Development Needs, Priorities and Strategies: Economic growth in a knowledge and technical economy is dependent on raising education standards, increasing the number of college graduates, and improving workforce skills. The Sector has prioritized quality learning and teaching that facilitates lifelong learning and an education curriculum tied to workforce and the economy’s needs.
To reduce drop-out rate, address underperforming schools, improve achievement rate, the Sector intended to use technology to offer more flexible learning environments within the county.
Education Sector development needs and the priorities strategies Development Issue
Causes Development Objectives
Immediate Objective Strategies
Early Childhood Development Low enrolment at Early Childhood Development (ECD) level
Lack of feeding program (proper nutrition); Poor accessibility to schools due to poor road networks; Inadequate and dilapidated ECD
Increase enrolment and retention at ECD level
Enhance enrolment and retention of ECD learners; Build capacity of the ECD management staff; Improve Access to ECD centres; Improve learning environment
Formulation and implementation of school health feeding program in all ECDCs Capacity building of Senior Management Committees (SMCs); Separate and independent management of ECDEs and primary schools.
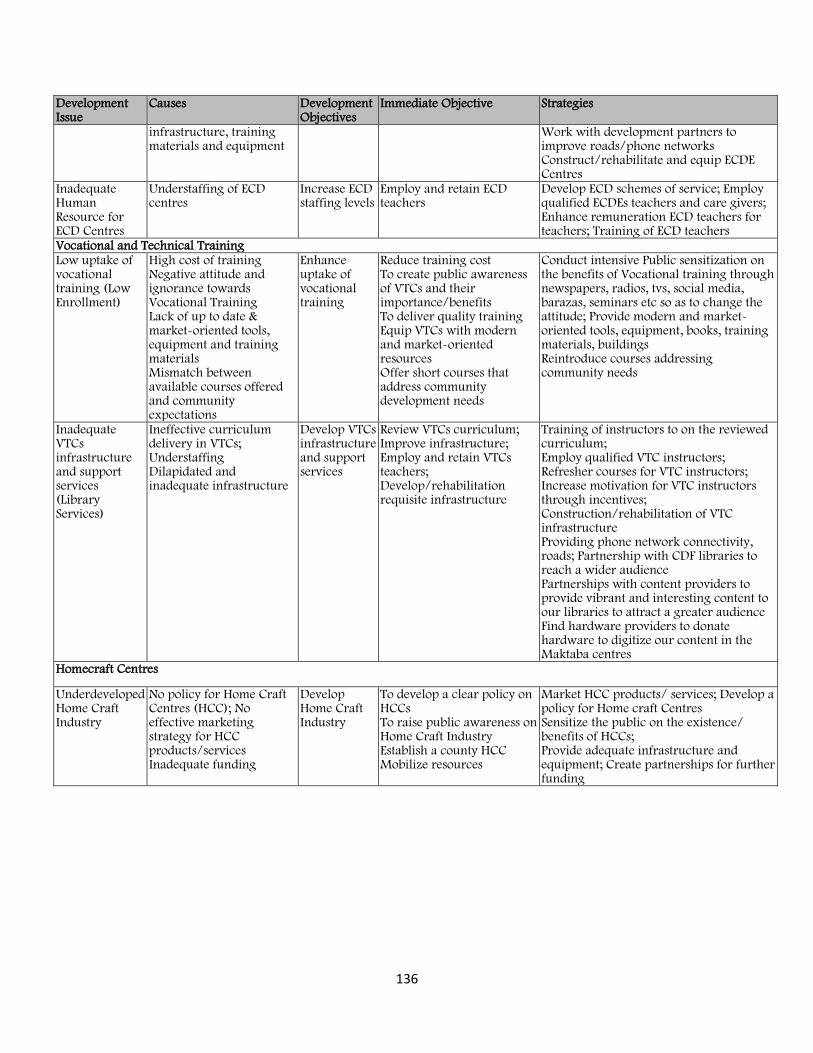
136
Development Issue
Causes Development Objectives
Immediate Objective Strategies
infrastructure, training materials and equipment
Work with development partners to improve roads/phone networks Construct/rehabilitate and equip ECDE Centres
Inadequate Human Resource for ECD Centres
Understaffing of ECD centres
Increase ECD staffing levels
Employ and retain ECD teachers
Develop ECD schemes of service; Employ qualified ECDEs teachers and care givers; Enhance remuneration ECD teachers for teachers; Training of ECD teachers
Vocational and Technical Training Low uptake of vocational training (Low Enrollment)
High cost of training Negative attitude and ignorance towards Vocational Training Lack of up to date & market-oriented tools, equipment and training materials Mismatch between available courses offered and community expectations
Enhance uptake of vocational training
Reduce training cost To create public awareness of VTCs and their importance/benefits To deliver quality training Equip VTCs with modern and market-oriented resources Offer short courses that address community development needs
Conduct intensive Public sensitization on the benefits of Vocational training through newspapers, radios, tvs, social media, barazas, seminars etc so as to change the attitude; Provide modern and market-oriented tools, equipment, books, training materials, buildings Reintroduce courses addressing community needs
Inadequate VTCs infrastructure and support services (Library Services)
Ineffective curriculum delivery in VTCs; Understaffing Dilapidated and inadequate infrastructure
Develop VTCs infrastructure and support services
Review VTCs curriculum; Improve infrastructure; Employ and retain VTCs teachers; Develop/rehabilitation requisite infrastructure
Training of instructors to on the reviewed curriculum; Employ qualified VTC instructors; Refresher courses for VTC instructors; Increase motivation for VTC instructors through incentives; Construction/rehabilitation of VTC infrastructure Providing phone network connectivity, roads; Partnership with CDF libraries to reach a wider audience Partnerships with content providers to provide vibrant and interesting content to our libraries to attract a greater audience Find hardware providers to donate hardware to digitize our content in the Maktaba centres
Homecraft Centres
Underdeveloped Home Craft Industry
No policy for Home Craft Centres (HCC); No effective marketing strategy for HCC products/services Inadequate funding
Develop Home Craft Industry
To develop a clear policy on HCCs To raise public awareness on Home Craft Industry Establish a county HCC Mobilize resources
Market HCC products/ services; Develop a policy for Home craft Centres Sensitize the public on the existence/ benefits of HCCs; Provide adequate infrastructure and equipment; Create partnerships for further funding

137
Education Sector Programmes
Outcome Outcome/Key output indicators Planned
Targets
Outcome 1: Enhanced access to ECDE NER
Total:
Boys
Girls
5
Teacher: Pupil ratio 1:35
Output 1.1: ECDE Centres Constructed No. of ECDE Centres Constructed 1
Output 1.2: renovated/refurbished ECDE Centres No. of ECDE Centres renovated/refurbished 12
Output 1.3: Furnished ECDE centres No of ECDE centres furnished 18
Output 1.4: ECDEs on feeding program Percentage of public ECDEs benefiting from feeding
program
100
Output 1.5: ECDE with teaching& learning materials Percentage of public ECDE centres supplied with teaching
& learning materials
100
Output 1.6: ECDE scheme of service developed ECDE scheme of service developed 1
Outcome 2: Enhanced access to vocational training NER
Total:
Male
Female
5
Teacher: Student ratio 1:35
Output 2.1: Vocational training centres (VTCs) established No. of vocational training centres constructed/established 3
Output 2.2: VTCs renovated No. of vocational training centres renovated 3
Output 2.2: VTCs furnished No. of vocational training centres furnished 2
Output 2.3: VTCs supplied with instructional materials and
equipment
No. of VTCs supplied with instructional materials and
equipment
2
Outcome 3: Improved literacy and reading culture through
library facilities
No. of libraries/resource centers operational 18
Output 3.1: Maktaba centres content digitized No. of Maktaba centres content digitized -
Output 3.2: mobile book facilities established No. of mobile book facilities -
Outcome 4: Improved retention, transition and completion
rate through bursaries and scholarship
No. of students benefiting from bursaries and scholarship
under the ‘Elimu Fund’
60,000
Output 4.1: Polytechnic students under sponsorship No. of polytechnic students under sponsorship (‘Tukuza
Vipawa’ programme)
5000

138
Outcome Outcome/Key output indicators Planned
Targets
Outcome 5: Improved multi-sector approach to dignified
care and safety for children
Child rescue Centres/ homes established 2
Output 5.1: Child care facilities licensed Proportion of child care facilities licensed 100
Output 5.2: child care facilities assessed No. of assessments in child care facilities 4
Output 5.3: Care givers trained No. of trainings done 2
Output 5.4: School buses for children with special needs No. of school buses for children with special needs
acquired
2
Output 5.5: Sensitized community No. of community sensitization meetings held 2
Outcome 6: Enhanced service delivery to Education
services
Management Information Systems in place 3
Policies in place 10
No. of Motor Vehicles purchased 1
Education Cross-sectoral Implementation Considerations Programme Name
Sector Cross-sector Impact Measures to Harness or Mitigate the Impact Synergies Adverse Impact
Education
Public Administration and International Relations Energy, Infrastructure and ICT; General Economic and Commercial Affairs
Legislation and policy development; Infrastructure development; technical advice Prioritization and Resource allocation
Delayed operations; Red-tape conflict; Inadequate funding; lack of prioritization
Timely implementation of legislation and policies Mapping out ICT infrastructure requirement; Prioritization and implementation of education programmes
Child Care
Public Administration and International Relations; Social protection, culture and recreation; Health; Environmental Protection, Water and Natural Resources; Agriculture, Rural and Urban Development; Energy, Infrastructure and ICT
Legislation and policy development; Multi-sector approach to programmes/projects implementation
Delayed operations Red-tape conflict
Timely implementation of legislation and policies; Multi-sectoral planning of programmes/projects; Improved collaboration and information sharing
General Administration
General Economic and Commercial Affairs Public Administration and International Relations Energy, Infrastructure and ICT
Efficient operations in planning and budgeting Recruitment of staff and capacity building Integration of ICT in teaching and learning Technical advice
Red-tape conflict Lack of prioritization of programmes/projects Delayed operations Inadequate data and information systems
Timely implementation of programmes/projects Timely implementation of departmental staff establishment Timely implementation of departmental requests Provision of ICT infrastructure and training

139
3.2.8: Energy, Infrastructure and ICT
The Energy, Infrastructure and ICT sector have the following subsectors:
i. Energy; ii. Infrastructure: Roads Infrastructure, Transportation, Public works, Firefighting and
rescue services, and Administration planning and suppor services; and iii. ICT: ICT Infrastructure, Network Administration & End-User Support; ICT
Consultancy Services; and Information Systems. Vision
A World class provider of cost effective physical and ICT infrastructure facilities and services
Mission
To provide efficient, affordable and reliable infrastructure for sustainable economic growth and development through construction, modernization, rehabilitation and effective management of all infrastructure facilities.
Strategic Objectives
i. To promote green energy power generation plants; ii. To provide effective, efficient and safe transport system for people, goods and services;
iii. To install, rehabilitate and maintain traffic signs and lighting; iv. To provide professional services (Architectural, Structural, Civil, Mechanical and
Quantity Surveying) for public buildings and facilities v. To provide fire fighting and rescue services, advertisement and compliance.
Sector Programmes - Energy Sub-sector
Sub-Programme Key Performance Indicators Planned Targets
Programme Name: General Administration and Support Services
Outcome: Efficiency in service delivery
Programme Name: County Energy Regulation
Outcome: Regulated energy sector
County Energy Regulation
Policy on renewable energy
Policy on PPP and green energy generation and utilization
Database of licensed Renewable Energy players
1
1
1
Programme Name: Energy Generation
Outcome: Reliable energy supply
Mapped areas for various energy generation potential (Reports) 2

140
Sub-Programme Key Performance Indicators Planned Targets
Renewable Energy Supply
Amount of investment funds allocated to renewable energy such as solar and biogas (in Kshs. million)
% increase in the use renewable energy
No. of forums for green energy generation and usage
County carbon credit programme initiated
200 30 2 1
Programme: Street Lighting
Outcome: Improved Security
Public and Street Lighting
Policy on street lighting formulated
Number of constructions (Installed lighting points Mass lighting poles)
% reduction in crime rate Number of street lights installed and maintained
Number of street lights maintained
1
4000
5
20 12,000
f. Sector Programme - Roads Sub-sector Sub-Programme Key performance Indicators Planned Targets
Programme Name: General Administration and Support Services Outcome: Efficiency in service delivery Programme Name: Roads Infrastructure Outcome: Increased efficient mobility, draining of affected areas, lit streets and well managed advertisement points. Roads Development Planning (Efficient network connectivity; Improved accessibility and Sustainable management of road reserves)
Road development and management policy Code and standards of road developed and implemented No. of km of paved road done No. of km of road maintained
1 1 45 65
Drainage and storm water management
Drainage and storm water policy developed No. of km of drainage and storm water constructed Drainage and storm water maintained
1 8 60
Advertisement and Compliance
Number of illuminated signs/Welcome signboard constructed Number illuminated signs/Welcome signboard maintained
86 36

141
g. Sector Programme – Transportation Sub-sector Sub-Programme Key Performance Indicators Planned Targets
Programme Name: General Administration and Support Services
Outcome: Efficiency in service delivery
Programme Name: Transportation
Outcome: Safe and efficient movement of people and goods.
Non-Motorized Transport (NMT)
NMT development and management policy Km of walkways and rest facilities done Number of footbridges constructed Km of NMT maintained
1 17 3 20
Transport and public Safety
Safety policy developed
Number of Speed control facilities/Road Signs constructed
Passenger picking points constructed
1 100 20
Traffic Management
Transport management policy developed
Number of traffic Lights and pedestrian Railings put up
Number Traffic Lights Pedestrian Railings maintained
1
110
120
Parking
Parking policy
Number of intra-city Bus terminals/Parking silo constructed
Number of on road parking maintained
1
1
220
Water Transport
Water transport policy
Number of Jetties/ Access roads constructed
Number of Jetties/ Access roads maintained
1
4
2
Fleet management Number of timely and accurate fleet reports produced
Tracking system installed
14
1
Transport mechanical services
Number of timely and accurate maintenance reports produced
New Fleet, rubber boat insurance cover, Spare parts
14
25

142
h. Sector Programmes - Public Works Infrastructure sub-sector Sub-Programme Key Performance Indicators Planned
Targets
Programme Name: General Administration and Support Services
Outcome: Efficiency in service delivery
Programme Name: Public Works
Outcome: Well designed, constructed and managed structures.
Professional services for public buildings and other public works (Architectural, Structural & Civil, Quantity Surveying and contract management services, Electrical (Building services), Mechanical (Building services), Building Maintenance)
Professional services for public buildings and other public works done
Number of timely and accurate maintenance reports produced
Number of offices constructed
Number of offices maintained
7
7
2
14
Electrical Number of timely and accurate maintenance reports produced
14
Building services including Building Mechanical services
Number of timely and accurate maintenance reports produced
Number of buildings maintained
14
14
i. Sector Programmes - Fire fighting and Rescue Services Sub-sector Sub-Programme Key Performance Indicators Planned
Targets
Programme Name: Fire Fighting and Rescue Services
Outcome: Improved public and property safety
Fire Fighting Number of minutes taken to respond to fire emergency
Number of fire stations constructed
5
1
Rescue services Planning Number of minutes taken to respond to emergency 40
Coast Guard rescue services Number of minutes taken to respond to emergency 40
Programme Name: Administration and Support Services
Outcome: Efficiency in service delivery to departments, affiliated bodies and organizations
Administration, Planning and Support Services Records
Number of staff recruited
No. of staff trained
No. of policies developed
40
30
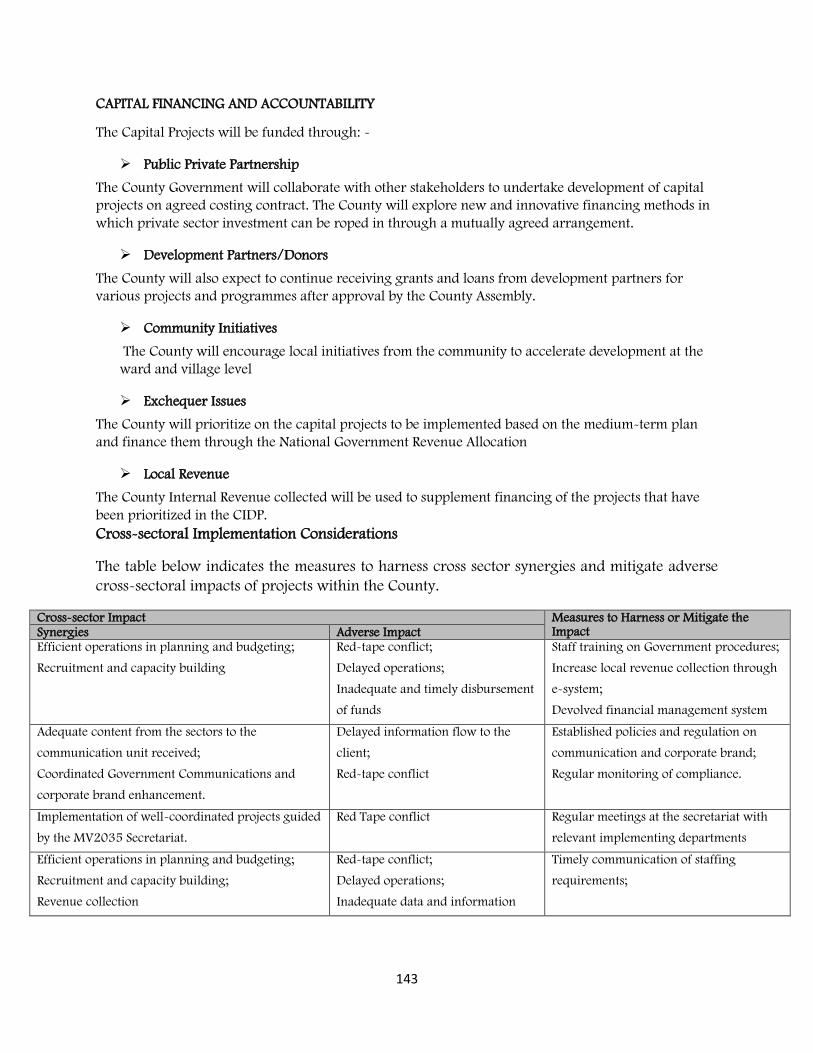
143
CAPITAL FINANCING AND ACCOUNTABILITY
The Capital Projects will be funded through: -
➢ Public Private Partnership
The County Government will collaborate with other stakeholders to undertake development of capital
projects on agreed costing contract. The County will explore new and innovative financing methods in
which private sector investment can be roped in through a mutually agreed arrangement.
➢ Development Partners/Donors
The County will also expect to continue receiving grants and loans from development partners for
various projects and programmes after approval by the County Assembly.
➢ Community Initiatives
The County will encourage local initiatives from the community to accelerate development at the
ward and village level
➢ Exchequer Issues
The County will prioritize on the capital projects to be implemented based on the medium-term plan
and finance them through the National Government Revenue Allocation
➢ Local Revenue
The County Internal Revenue collected will be used to supplement financing of the projects that have
been prioritized in the CIDP.
Cross-sectoral Implementation Considerations
The table below indicates the measures to harness cross sector synergies and mitigate adverse
cross-sectoral impacts of projects within the County.
Cross-sector Impact Measures to Harness or Mitigate the Impact Synergies Adverse Impact
Efficient operations in planning and budgeting;
Recruitment and capacity building
Red-tape conflict;
Delayed operations;
Inadequate and timely disbursement
of funds
Staff training on Government procedures;
Increase local revenue collection through
e-system;
Devolved financial management system
Adequate content from the sectors to the
communication unit received;
Coordinated Government Communications and
corporate brand enhancement.
Delayed information flow to the
client;
Red-tape conflict
Established policies and regulation on
communication and corporate brand;
Regular monitoring of compliance.
Implementation of well-coordinated projects guided
by the MV2035 Secretariat.
Red Tape conflict Regular meetings at the secretariat with
relevant implementing departments
Efficient operations in planning and budgeting;
Recruitment and capacity building;
Revenue collection
Red-tape conflict;
Delayed operations;
Inadequate data and information
Timely communication of staffing
requirements;

144
Urgent activities to receive priority during
payment process; An efficient e-system for
revenue collection;
Devolved financial management system
Adequate staffing;
Well trained staff; Best practices in management
Bloated Wage bill;
Delayed operations;
Red-tape conflict
Established policies and regulation;
Improved collaboration and information
sharing;
Succession planning in place; Talent
management
Resource mobilization
Adherence to statutory requirements
Effective organization and management
Policy formulation
Conflict of interest
Red tape conflict
Delayed operations
Inadequate data
Capacity building sectors on the statutory
requirements
Resource mobilization;
Revenue collection;
Adherence to statutory requirements;
Effective organization and management
Conflict of interest;
Red tape conflict;
Delayed operations
Capacity building sectors on the statutory
requirements and financial processes;
Devolving the financial system;
Automation of revenue collection system
Policy formulation;
Budget preparation and implementation;
Data collection, sharing and dissemination;
Sectoral reports generation
Duplication of interventions;
Delayed reporting;
Inadequate data;
Non-adherence to set timelines;
Red tape conflict
Establishment of central data collection
system;
Capacity building sectors on the
budgetary timelines and requirements

145
3.3 Payments of Grants, Benefits and Subsidies
This section should provide information on proposed payment of Grants, Benefits and Subsidies
to be done by the county government during the plan period. The following are the grants that
are expected to be received by the County Government in the 2019/20 FY but may be rolled
over to 2020/21 FY with or without increment.
Payments of Grants, Benefits and Subsidies
DEPARTMENT GRANTS AMOUNT
FINANCE AND ECONOMIC PLANNING
Kenya Devolution Support Program Level 2 Grant - 18/19 259,416,946
Kenya Devolution Support Program- 18/19 53,333,725
Kenya Devolution Support Program- 19/20 30,000,000 TOTAL 342,750,671
AGRICULTURE Agriculture Sector Development Support Program II 16,374,963
TOTAL 16,374,963
TRANSPORT AND INFRASTRUCTURE CA-Fuel levy fund 200,344,594 TOTAL 200,344,594
EDUCATION Conditional Allocation for development of Youth Polytechnics
25,473,298
TOTAL 25,473,298
COUNTY HEALTH CA-User Fees Forgone 23,385,934
COUNTY HEALTH Level 5 H 388,439,306
COUNTY HEALTH DANIDA
24,562,500
COUNTY HEALTH Transforming Health Systems for Universal Care Project (World Bank-IDA)
37,921,806
COUNTY HEALTH Leasing of Medical Equipment
131,914,894
TOTAL 606,224,440
WATER, SANITATION & NATURAL RESOURCES World Bank Development Project 1,550,000,000 TOTAL 1,550,000,000
TOTAL GRANTS Total Grants 2,741,167,966

146
CHAPTER FOUR: DEPARTMENTAL RESOURCE ALLOCATION
DEPARTMENTS CONSOLIDATED REVENUE
PERSONNEL OPERATIONS AND MAINTENANCE
RECURRENT DEVELOPMENT TOTAL EXPENDITURE
PERCENTAGE
County Executive 0 353,392,288 353,392,288 34,424,673 387,816,961 2.7
County Assembly 368,322,979 289,731,030 658,054,009 25,773,748 683,827,757 4.7
Public Service Board 63,967,274 57,410,615 121,377,889 11,637,280 133,015,169 0.9
Finance & Economic Planning 14,634,579,687 659,888,095 519,942,764 1,179,830,859 640,537,693 1,820,368,552 12.4
Environment, Solid Waste Management and Energy 341,856,186 270,650,963 612,507,149 568,372,081 1,180,879,230 8.1
Education, Information Technology & MV 2035 268,344,299 392,814,046 661,158,345 350,329,356 1,011,487,701 6.9
Health Services 2,383,380,832 777,010,272 3,160,391,104 351,641,776 3,512,032,880 24.0
Water, Sanitation & Natural Resources 31,369,213 97,492,220 128,861,433 309,225,704 438,087,137 3.0
Youth, Gender, Sports and Cultural Affairs 103,827,415 326,551,627 430,379,042 685,595,266 1,115,974,308 7.6
Trade, Tourism & Investment 285,811,605 173,063,580 458,875,185 251,056,936 709,932,121 4.9
Lands, Housing and Physical Planning 119,934,480 226,841,952 346,776,432 301,329,963 728,106,395 5.0
Transport, Infrastructure & Public Works 364,773,459 193,775,279 558,548,738 773,855,896 1,252,404,634 8.6
Agriculture, Fisheries, Livestock and Co-operatives 129,426,841 153,503,382 282,930,223 271,015,626 553,945,849 3.8
Devolution & Public Service Administration 555,791,432 300,363,979 856,155,411 250,545,582 1,106,700,993 7.6
TOTAL 5,676,694,110 4,132,543,997 9,809,238,107 4,825,341,580 14,634,579,687 100.0
SURPLUS / (DEFICIT) 0
REVENUE SOURCES
Local Revenue 5,221,477,087
Exchequer Issues 9,413,102,600
TOTAL REVENUE 14,634,579,687

147
4.3 Financial and Economic Environment
4.3.1 County Economic and Fiscal Overview
This County Annual Development Plan 2020/21 is prepared at a time when Inflation rate was highly
volatile in the period 2008-2012 and averaged 10.6 percent compared to the period 2003-2007 when
it averaged 8.5 percent. The sharp increase in inflation rate in the year 2008 to 2010 was occasioned by
internal shocks (post-elections disruptions and unfavorable weather conditions) and external shocks
(high crude oil prices and global financial crisis).The tightening of monetary policy, together with an
easing in global food and fuel prices, saw the levels of inflation come under control in 2012.
Amongst the 47 counties Mombasa contributes 4.7% to the Country’s GDP which ranks it fourth and has
a Growth County Product (GCP) of 7% above the country’s average of 5.6%.
Mombasa County faces a unique distributional challenge in real GCP per capita due to dynamics in real
economic activities as well as evolution of population size including internal migration and floating
population which ultimately has an implication on public service delivery, including a rise in expenditure
to deliver essential services.
The county continues to heavily invest in infrastructure through expansion of roads, rehabilitation of
non-motorized transport (NMTs, opening up of access roads so as to ease the movement of goods and
people within the county. Efforts are also in place to put up and rehabilitate trading centers and markets
with the ultimate collective objective of creating a 24-hour economy.
Blue economy being an avenue that has been recognized internationally as a sector that can not only
alleviate hunger but improve the standards of living of the citizens, in this regard the County Government
is in the forefront to harness and exploit its resources through purchasing of deep sea fishing vessels so
as to significantly expand fishing.
In addition to the above measures, the Government will continue to complement the development of
industrial infrastructure such as Export Processing Zones (EPZs), Special Economic Zones (SEZs) and
industrial parks within the county. More specifically the establishment of the Dongo Kundu SEZs and
infrastructures.

148
4.3.2 Fiscal Performance and Emerging Challenges
In the 2018/19 FY; The County was able to realize Kshs. 13,360,488,591 which translates to 93 percent
of the supplementary budget of Kshs 14,456,495,575, out of which 100 percent was recurrent
expenditure of Kshs. 10,253,993,461 and 72 percent being development expenditure of Kshs
3,106,495,130. In view of the above the County had a 7 percent budget deficit of Kshs. 1,096,006,984.
The County realized Kshs 3,704,597,554 being 78 percent of the budgeted local revenue of Kshs.
4,741,939,084. The total revenue collected was Kshs 13,360,488,591 being 93 percent of the total
budgeted revenue of Kshs. 14,456,495,575 of which Kshs 9,714,556,492 was exchequer issues and Kshs
988,988,577 transfers from other National Government entities including budgeted grants and donor
funding. Equitable National share amounted to Kshs 8,226,800,000 which was 100 percent of the
County allocation.
The County has hit the highest in budget implementation at 93 percent which is a 2 percent increase
from the previous financial year’s budget implementation.
The County received Donor Funding from DANIDA of Kshs. 27,337,500, Health Conditional Grants of
Kshs. 388,439,309, Road Maintenance Levy Grant of Kshs. 255,997,699, World Bank-KDSP Level II,
Kshs. 259,416,946, World Bank-THUSCP, Kshs. 27,473,711 and a Grant of Kshs. 6,937,481 for
Agriculture Sector Support Program II.
Total expenditure amounted to Ksh 13,360,488,591 against a target of Ksh 14,456,495,575
representing an under spending of Ksh 1,096,006,984. (or 7 percent deviation from the revised
budget). The shortfall was attributed to lower absorption in both recurrent and development
expenditures due to unrealized revenues.
Recurrent expenditure was 100% amounting 10.2 billion which comprised of personnel emoluments
and operations and maintenance.
Development expenditure was Ksh 3.1 Billion compared to a target of Ksh 4.3 Billion. This represented
an under-spending of approximately Ksh 1.2 Billion (or 28 percent deviation from the approved
development expenditure). The underperformance in development expenditure was majorly
contributed by lack of disbursement of the World Bank’s Water and Sanitation Grant of Ksh. 600
Million, unrealized local revenue and bureaucracy in procurement.

149
The County Government continues to put up stringent measures that ensures that the budget deficit is
reduced and adjustments will be made to fiscal aggregates to reflect revisions in the macroeconomic
projections as well as revenue performance in the FY 2019/20 going forward.
4.3.3 Risks, Assumptions and Mitigation measures
The “Statement of Specific Fiscal Risks” outlines the county’s and by extension the Kenya’s
exposure to fiscal risks that are associated with macroeconomic assumptions used for fiscal
projections, public debt dynamics, operations of state corporations, contingent liabilities,
vulnerabilities of the financial sector, as well as risks posed by nature.
The main challenges that continue to be experienced relate to low levels of local revenue
collection, bloated wage bill and huge pending bills some of which are statutory deductions that
accrue huge interests.
Unrealized local revenue which results to an over ambitious budget which in turn results to an
increase in pending bills continues to be a risk.
The risk to the outlook for Mombasa County Annual Development Plan and medium-term
emanate from both external and domestic sources. The economy remains vulnerable to both
domestic and external shocks. For prudent management of risks, the PFM Act, 2012 requires the
preparation of a “Statement of Fiscal Risks”.
The County Government remains committed to fiscal consolidation in order to assure on the
long-term sustainability of public finances. Nevertheless, the Government will monitor the risks
and take appropriate measures to safeguard macroeconomic stability.
Looking ahead, due to revenue shortfalls, the ever-increasing pending bills and a high wage bill,
continues to pose a threat of a budget deficit. Systems are being put in place to improve local
revenue performance following revenue collection reforms and moderation in recurrent
expenditure, so as to increase the revenue bases and the fiscal position in the medium term.
The challenges will be tackled by effectively operationalizing the MTEF, through deepening the
existing institutional framework, increased partnership between the public, private, civil and

150
community organizations in prioritizing of needs and allocation of resources, coming up with
realistic revenue projections, strengthening planning and budgeting capacities at the county
levels through provision of adequate resources, improving on the systems of accountability and
transparency and ensuring that all budgeting processes are grounded on a firm legal framework.
In the light of current revenue realities and some unanticipated expenditure items, the
Government is seeking to rationalize recurrent spending and to identify and resolve Revenue
leakages.
In addition the county has fully adopted IFMIS, G-Pay systems and automated the main revenue
streams such as electronic business permit, e-construction, and parking and has introduced a
cashless platform for ease of payment aimed at improving service delivery, enhancing financial
accountability and reporting.

151
CHAPTER FIVE: MONITORING AND EVALUATION
Introduction
The chapter presents the monitoring and evaluation framework that will be used at the National
and County level to track progress on implementation of projects and programmes. Monitoring
the performance of County programs and projects helps increase their effectiveness, provides
increased accountability and transparency in how public monies are used, and informs the
budgetary process and the allocation of public resources, thus improving their effectiveness to
improve welfare and, consequently, reduce poverty and increase the equality of opportunities.
M&E improves the effectiveness of projects by allowing for mid-course corrections if there are
aspects that do not have the desired impact; demonstrates impact and success of a project; and
identifies lessons learned, enabling institutional learning and informing decisions about future
programs. Evaluations assesses the relevance, effectiveness, efficiency, impact and sustainability
of a project.
Performance indicators adopted from CIMES
Performance indicators adopted from the County Integrated Monitoring and Evaluation System
are measures of project impacts, outcomes, outputs, and inputs that are monitored during project
implementation to assess progress toward project objectives. They are also used later to evaluate
a project's success. These Indicators organize information in a way that clarifies the relationships
between a project's impacts, outcomes, outputs, and inputs and help to identify problems along
the way that can impede the achievement of project objectives. They are therefore vital for
strategic planning, informing resource allocation, forecasting, measuring results, benchmarking
and quality management.
Institutional framework that will be adopted to monitor the programmes
At the National level, Monitoring and Evaluation is conducted through National Integrated
Monitoring and Evaluation System (NIMES), whose main aim is to improve the effectiveness
and quality of tracking of implementation of various development policies, strategies and
programmes. The County and lower level monitoring and evaluation of projects and
programmes are part of this system. The County will put in place a County Monitoring and
Evaluation system to serve the needs of the County Government, while complimenting the
National M & E system. The system will take cognizance of the projects and programmes
included in the County Integrated Development Plan as well as indicators facilitating the MTEF process,
and development aspects of the county.
Data collection, Analysis and reporting mechanisms
The County Monitoring and Evaluation process is as follows:

152
Planning: Identifying information to guide the project strategy, ensure effective operations and
meet external reporting requirements. This has been relying heavily on the draft indicators
handbook
Implementation: Gathering and managing information through informal as well as more
structured approaches. Information comes from tracking which outputs, outcomes and impacts
are being achieved and checking project operations. This is done through adhoc M&E
committees.
Participation: Involving project stakeholders in reflecting critically. Once information has been
collected its analysed and discussed by project stakeholders through town hall meetings
conducted through ward and sub county administrators.
Communication: The results of M & E is communicated to the relevant stakeholders who need to
use it. Ultimately the results from M&E – both the communication processes and information –
improve the project strategy and operations.
Sector: Public Administration and International Relations
Sub-sector: County Executive Sub-Sector
Key performance indicators Beginning of the ADP year situation
Planned Targets
Percentage increase in the level of satisfaction with quality of service by customers Service charter developed and cascaded Percentage increase in timely service delivery of services (Schedule Performance Index - SPI) Percentage increase in cost effectiveness of service delivery (Cost Performance Index - CPI)
35 - 40 (SPI 1) 20 (>1)
65 75 (SPI 1) 60 (>1)
Number of Cabinet decisions Number of policies and legislation developed/reviewed and adopted
13 4
49 20
Percentage increase in the number of coordinated projects Percentage increase in number of MOUs of funded projects Percentage increase in number of partnership established
30 10 20
75 25 35
Percentage reduction in complaints from the public o the county government services Communication strategy developed
10 -
70
Corporate brand policy Percentage increase in the level of implementation of the corporate brand policy
- 20
70
% increase in number of partnerships established on implementation of MV 2035 Mapping report of V2035 programmes Resource Mobilization strategy Increase in funds mobilized for MV 2035 (Kshs.) Proportion of Corporate Branded MV 2035 Projects
- - - - -
45 350 100

153
Public Service Board
Key performance indicators Beginning of the ADP year situation
Planned Targets
Proportion of staff with adequate working tools TNA report and annual training projections No. of staff recruited for the board Adequate office space
60 1and 28 Trained 28 1
80 30 trained 5
Staff rationalization report No. of HR succession plan Recruitment affirmative action policy in place Reviewed establishment and organogram Number of staff recruited for all departments Number of programs to enhance ethical and compliant Workforce & (Civic Education) No. of reports submitted to county assembly Customer, employee and work environment oversight survey reports % increase in levels of satisfaction (employee and work environment) No. of policies developed (Disciplinary, Reward management scheme, and PWD)
1 - - 1 4,300 4 2 - - -
1 1 340 4 2 3 15 3
HRIS (Human resource Information System) in place No. of HR audit reports Proportion of staff on Performance Appraisal System Proportion of departments on Performance contract
- - 100 100
1 100 100
Sector/Sub-sector
Key performance indicator Beginning of the ADP
year situation
Proposed End of the ADP
target
General Administration,
Planning and Support
Services
i) Motivated staff
ii) Disciplined workforce
iii) Reduction in industrial action
iv) Citizen satisfaction in Service
Delivery
Continuous process 70% well trained staff.

154
Devolution and Public Service Administration
Sector/Sub-sector
Key performance indicator Beginning of the ADP year
situation
Proposed End of the
ADP target
Public
Administration and
International (or
Inter-Governmental)
Relations
No. of service centres established
at sub county levels and
equipped
0 2
No. of offices at Ward Level 2 6
Constructed, renovated and
Equipped training school
0 1
Refurbished and equipped
Operation/rescue center
0 1
No of personnel records
Digitized
0 1000
No. of specialized equipment
purchased
10 50
Decentralized Units
Key performance indicators Beginning of the ADP year situation
Planned Targets
Number of staff trained Number of vehicles procured to support field operations Number of physical offices set up for ease in service delivery Number of service centres at the Sub-county level
- - 4 -
15 9 10 2
Key performance indicators Beginning of the ADP year
situation Planned Targets
Number of Civic Education programs held on county services Number of Town Hall meetings held on civic education forums No. of Ward Barazas conducted
3 - 60
20 24 420
Complaints handling mechanism in place Alternative dispute resolution mechanism in place
- -

155
Number of decentralized departments No. of periodic review meetings on project planning and review at county, Sub -county and ward levels Number of development committees established at the (6) sub-county and (30) ward levels Number of reports received from Ward/ Sub-county Administrators
3 1 30 480
2 6 36 480
County Assembly
Key performance indicators Beginning of the ADP year situation
Planned Targets
Number of MCAs and staff trained Number of staff recruited Proportion of staff on PAS
50 146 -
94 5 100
% level of completion of assembly buildings including the information resource centre % level of completion of Speaker’s official residential house % level of completion of IT, media systems, information networks and plenary sessions live streaming % level of completion of modernized Assembly chambers % level of completion of installation of improved security systems Number of ward offices built(30) % level of completion of installation of solar power back-up % level of completion of establishment of cafeteria and fitness centre
- - - - - - -
30 100 45 100 100 10 70
Purchase of new vehicles for Speaker and Assembly Officials; 1)Two saloon cars 2)Two minivans 3)Two minibuses 4)One motorcycle 5)Four SUVs
4
4 (2 minibuses; 2 minivans; 1 motorcycle)
Programme Name: Legislation and Oversight
Outcome: Improved policy formulation
Proportion of policies with citizen participation Proportion of bills enacted Proportion of financial performance reports reviewed
- - -
100 100 100

156
Sector: General Administration and Commercial Affairs
Sub-sector programme: Finance and Economic Planning
Key performance indicators Beginning of the ADP year situation
Planned Targets
Number of staff Trained Proportion of staff on PAS Proportion of sections on PC
- 100 -
48 100 100
Increase in amount in the annual budget allocated to disaster management fund
50 200
Number of timely and accurate financial reports produced in conformity with the PFMA Integrated real time accounting system in place Percentage increase in cash flow management Proportion of accounting and financial records managed electronically Level of budget implementation Level of debt management
4 - 60 55 60 60
12 1 25 85 100 100
Level of compliance with public procurement laws and regulations An integrated automated assets management system in place Proportion of county assets safeguarded and managed Proportion of county supplies safeguarded and managed
30 - 20
20
80 1 80 80
Risk management framework developed Percentage decrease in financial management irregularities (queries)
-
30
15
A fully integrated automated revenue collection system implemented Resource mobilization framework Percentage increase in local revenue collection % increase in external funding as a percentage of county revenue
-
-
10
-
1
25
15
Number of policies prepared/reviewed Number of development plans prepared/reviewed Sector plans prepared Number of reports prepared on SDGs
12 5 - 1
30 4 8 1
No. of financial reports/reviews done % absorption of allocated funds Levels of compliance with the budgetary preparation timelines Percentage increase in the participation of the state and non-state actors in the budget cycle
2 - 90 90
4 100 100 100
County statistical office operationalized to increase in accessibility of reliable county data County Statistical Abstract
- -
1

157
Key performance indicators Beginning of the ADP year situation
Planned Targets
Number of research studies/ surveys undertaken - 1
An automated monitoring and evaluation system Monitoring and evaluation framework Handbook of reporting indicators CMES established and operationalized CIDP, MV2035 and JKP implementation coordination mechanism County performance review reports
- - - - - -
1 1 4
Sub Sector Programmes- Trade, Industrialization and Investment Key performance indicators Beginning of the ADP year situation Planned
Targets
Number of staff recruited Number of staff trained Number of retail markets rehabilitated Number of retail markets expanded Number of modern wholesale markets constructed Number of modern kiosks constructed Number of modern Stalls in Kongowea Market Number of jua kali sheds constructed Number of business parks established Number of Special Economic Zones established Number of industrial parks established Number of cess barriers modernized
- - 2 - - 300 - 300 - - - -
6 5 1 1 600 100 600 1 1 1
% increase in the number of businesses registered % increase in the number of business permits issued Trade policy developed Ease of doing business survey report Number of Biashara Centres established Number of trade fairs conducted Proportion of business inspections conducted Number of business call centres established Number of revenue streams automated
35,000 (No.) 35,000 (No.) - - - - 50 - 1
79 79 1 4 3 100 1 3
% increase in the number of SMEs capacity built Amount of funds disbursed to SMEs (Kshs. Millions) Number of SMEs conferences held % increase in the Number of traders sensitized on value addition Business Information Centre (BIC) established
1000 (No.) 10 - 500 (No) -
89 25 3 88 1
Proportion of weights and measures equipments standardized/verified Percentage reduction in consumer complaints
70 30
100 15

158
Integration of e-business services Database of investment opportunities and land availability developed and updated Investment portal Number of investment exhibitions/forums County Job Index Report % increase in the number of investment certificates issued to potential investors Investment policy developed Percentage increase in the number of investors
- - - - - - - - - -
1 1 3 1 25 1 40
Sub-sector Programmes - Tourism Key Performance Indicators Beginning of the
ADP year situation
Planned Targets
Number of staff trained Number of staff recruited Mombasa Tourism Board established Tourism policy developed
10 4 - -
80 16
% increase in the number of new tourism products rolled out Number of Sports Tourism events held within the county Number of Eco-Tourism facilities established % increase in number of tourists visiting the county Number of home stays facilities established
4 6 - - -
16 15 3 30 15
Number of full operational International Convention Centres (PPP) Number of MICE (Meetings, Incentive Travel Conferences and Exhibitions) conducted within the county No. of products and brands developed Number of International Hotel Brands in Mombasa (Facilitation and incentives) Number of developed and implemented local tourist facilities’ classification criteria/scheme Proportion of facilities classified using local criteria
- 20 2 - - - -
1 45 12 2 2 70
No. of Beaches with Blue flag accreditation Number of beach clean ups conducted Number of beach operators trained Number of life guards deployed
6 500 -
2 6 500 10
Number of operationalised tourist information centres (an online version to be supported by the DMS) Mombasa Tourism websites and portal developed and updated Number of Modules Supported by an Operational Destination Management System
- - - -
3 2 6
Number of local suppliers trained on tourism products/commodities standards Number of tourism facilities that support use of local suppliers % increase in local tourist numbers
- - - -
200 80 30

159
Sub-sector Programmes - Trade
Sector/Sub-sector
Key performance indicator Beginning of the ADP year situation
Proposed End of the ADP target
Rehabilitation of Retail markets 1 Retail markets rehabilitated (Sega & Mwembe Tayari)
Not yet commenced 70% completed
Modernization of Makupa market into a 2 storey building with a basement parking
1 retail market reconstructed Not yet commenced 60%
Civil Works at Kongowea Market • Drainage works
• Improvement of ground surface
• General painting
• plumbing &
• electrical works
50% done 100% complete
Establishment of Biashara Centres 2 Biashara Centrs established
Not yet commenced 2 Biashara centres completed
Establishment of Mombasa County Value Addition Centre
I value addition centre established. Not yet commenced 60% complete
Establishment of Automobile Park I automobile park established
Not yet commenced 50% complete
6.Modernization & digitization of three cess collection points
% Increase in cess revenue collected Not yet commenced 100% complete
7. Purchase of Standards & Testing Equipment
• 5 sets (1mg – 20kg)
• 2 sets (1mg – 20kg)
• 4 sets of beam balances ( 100mg, 200mg, 1kg, 5kg, 20kg)
Roller weights
Not yet commenced 50% complete
Sector Programmes - Energy Sub-sector Key Performance Indicators Beginning of the ADP year
situation Planned Targets
Policy on renewable energy
Policy on PPP and green energy generation and utilization
Database of licensed Renewable Energy players
-
-
-
1
1
1
Mapped areas for various energy generation potential (Reports) - 2

160
Key Performance Indicators Beginning of the ADP year situation
Planned Targets
Amount of investment funds allocated to renewable energy such as solar and biogas (in Kshs. million)
% increase in the use renewable energy
No. of forums for green energy generation and usage
County carbon credit programme initiated
-
-
-
200 30 2 1
Policy on street lighting formulated
Number of constructions (Installed lighting points Mass lighting poles)
% reduction in crime rate Number of street lights installed and maintained
Number of street lights maintained
-
200,000
-
-
1
4000
5
20 12,000
Sector Programme - Roads Sub-sector Key performance Indicators Beginning of the ADP year
situation Planned Targets
Road development and management policy Code and standards of road developed and implemented No. of km of paved road done No. of km of road maintained
- 100 100
1 1 45 65
Drainage and storm water policy developed No. of km of drainage and storm water constructed Drainage and storm water Maintained
- 70 70
1 8 60
Number of illuminated signs/Welcome signboard constructed Number illuminated signs/Welcome signboard maintained
1 1
86 36

161
Sector Programme – Transportation Sub-sector
Key Performance Indicators Beginning of the ADP year situation
Planned Targets
NMT development and management policy Km of walkways and rest facilities done Number of footbridges constructed Km of NMT maintained
1 20 3 -
1 17 3 20
Safety policy developed
Number of Speed control facilities/Road Signs constructed
Passenger picking points constructed
- 200 -
1 100 20
Transport management policy developed
Number of traffic Lights and pedestrian Railings put up
Number Traffic Lights Pedestrian Railings maintained
-
200
100
1
110
120
Parking policy
Number of intra-city Bus terminals/Parking silo constructed Number of on road parking maintained
-
-
-
1
1
220
Water transport policy
Number of Jetties/ Access roads constructed
Number of Jetties/ Access roads maintained
-
-
-
1
4
2
Number of timely and accurate fleet reports produced
Tracking system installed
-
-
14
1
Number of timely and accurate maintenance reports produced
New Fleet, rubber boat insurance cover, Spare parts
-
-
14
25

162
Sector Programmes - Public Works Infrastructure sub-sector Key Performance Indicators
Beginning of the ADP year situation
Planned Targets
Professional services for public buildings and other public works done
Number of timely and accurate maintenance reports produced
Number of offices constructed
Number of offices maintained
-
-
-
14
7
7
2
14
Number of timely and accurate maintenance reports produced - 14
Number of timely and accurate maintenance reports produced
Number of buildings maintained
12
14
14
Sector Programmes - Firefighting and Rescue Services Sub-sector
Key Performance Indicators Beginning of the ADP year situation
Planned Targets
Number of minutes taken to respond to fire emergency
Number of fire stations constructed
- 5
1
Number of minutes taken to respond to emergency 3 40
Number of minutes taken to respond to emergency 75 40
Number of staff recruited
No. of staff trained
No. of policies developed
299
-
-
40
30

163
Sector Programme - ICT Sub-Sector Key Performance Indicators Beginning of the ADP
year situation Planned Targets
An ICT Governance Structure
Number of Policies
-
-
1
5
Risk Management Policy
Risk Management Framework
Risk Management systemand Business Continuity
Ducts/ Conduits for Internet Service Providers to lease i.e areas like Bamburi, etc
Undersea fibre cable between CBD and South Coast (Likoni) and lease to various service providers
% implementation of County Analytical CCTV surveillance for most critical areas in Mombasa and to monitor County facilities e.g. stadiums. Public beaches
- - - - - -
1 1 2 20 1 10
No of ICT Hubs established
No. of ICT Entrepreneurship Startups
No of ICT Sector jobs created
No of Apps developed
Percentage of network mobile coverage
No of Internet hotspots established
No of Established E-Waste management plants
-
-
-
-
60
2
-
2
10
400
3
80
5
1

164
Key Performance Indicators Beginning of the ADP year situation
Planned Targets
No of points Connected to each other through MPLS
Total amount of internet bandwidth (MBPS)
No of Offices with a Structured LAN No of IP Telephone extensions Network Management /monitoring system for WAN/LAN
Video Conferencing system for internal and external video communication
E- Board Management system
Office 365 Premium cloud for all users
Microsoft Express Route for Officer 365 products
Acquire Microsoft License for computers
Acquire Computers, phones, iPads etc. for Executive and directors
Consultancy for maintenance of Computers/LAN/WAN
Acquiring Display Information Boards/System to display and capture performance and progress of various projects, achievements etc
- - 3 - - - - - - - 30 -
30 200 30 800 1 1 1 500 1 300 45 1 15
Security Awareness and Training Policy and Procedures
Risk assessment report
Data Protection Act
Information security system
-
-
-
1
2
1
1
No of department web portals developed
No of corporate email user accounts
Acquire Live/Mobile streaming system for outdoor meetings etc
1
330
10
410
1
ICT training needs assessment report
No of ICT staff successfully trained
No/type of ICT tool-kits
No of operational vehicles
Training ICT support staff and users
Management training courses
-
-
-
-
-
-
1
25
20
1
20
5

165
Sector Programmes – Education Key Performance Indicator Beginning of the ADP Year
Situation Planned Targets
No. of ECDE Centres constructed
No. of ECDE Centres renovated/refurbished
No of ECDE centres furnished
Proportion of ECDEs benefiting from feeding program
No. of ECDE Centres equipped with arts and play equipment
No. of ECDE centres supplied with teaching& learning materials
No. of ECDE teachers and caregivers in schools
No.of co-curriculum activities organized annually
No. of ECDE assessments done
ECDE scheme of service developed
No. of sensitization meetings for parents and children
No. of ECDE teachers short and long training programs
No. of stakeholders’ engagement meetings
Proportion of children under 5 years of age attending school
8 2 9 29,002 (No.) - 97 133 1 2 - - 4 13 -
1 12 18 100 20 99 418 3 4 1 3 6 2 14.4
No. of vocational training centres constructed No. of vocational training centres renovated No. of vocational training centres furnished No. vocational instructors recruited No. of assessments done in vocational training centres No. of co-curriculum activities organized
No. of training programs for instructors No. of vocational training centres supplied with instructional materials and equipment No. of sensitization meetings for parents and youth
No. of stakeholders’ engagement meetings
Increase in the number benefiting from sponsorship of 70% annual fees to students recruited to join Mombasa City Polytechnics through ‘Tukuze Vipawa’ programme
% increase in transition rate from secondary
- 2 - 9 1 - - - - 2 2,059 -
1 3 2 25 4 3 3 2 3
2
5000
5 No. of librarians recruited No. of libraries operational No. of resource centres operational No. of reading materials No. of library training programs No. of reading and promotional activities held including use of sports
Maktaba centres content digitized
No. of mobile book facilities
- 6 - 23,000 - 1 - -
6 18 3 50,000 2 2 1 6

166
No. of stakeholders meetings 2 2 No. of child rescue centres established
Child care facilities licensed
No. of parents and children sensitization meetings
No. of assessments in child care facilities
% increase in the number of children with special needs benefiting from school transport
No. of meetings with stakeholders interested with child care
No. of trainings for care givers
No. of Children Homes established
-
-
2
1,432 (No.)
-
-
-
3
100 12 4 5 2 2 1
% Availability of office stationery, supplies and equipment No. of staff recruited No. of operational vehicles No. of refurbished offices No. of legislation and policies in place No. of MoUs signed with partners % of trained personnel Proportion of institutions with BOMs No. of Established Management Information Systems No. schools with ICT infrastructure, internet and e-learning tools
40 215 1 - 3 5 45 100 1 -
60 371 5 4 10 8 65 100 3 10
Education Table 5: Education Sector Monitoring and Evaluation Performance Indicators Matrix
Sector Outcomes Key Performance indicator Beginning of the ADP year situation
Proposed End of the ADP target
Outcome 1: Enhanced
access to ECDE
NER Total:
Boys
Girls
5 5
Teacher: Pupil ratio 1:57 1:35
Output 1.1: ECDE Centres
Constructed
No. of ECDE Centres Constructed 1 1
Output 1.2:
renovated/refurbished
ECDE Centres
No. of ECDE Centres
renovated/refurbished
12 12
Output 1.3: Furnished
ECDE centres
No of ECDE centres furnished 12 18
Output 1.4: ECDEs on
feeding program
Percentage of public ECDEs
benefiting from feeding program
100 100

167
Sector Outcomes Key Performance indicator Beginning of the ADP year situation
Proposed End of the ADP target
Output 1.5: ECDE with
teaching& learning
materials
Percentage of public ECDE centres
supplied with teaching & learning
materials
100 100
Output 1.6: ECDE scheme
of service developed
ECDE scheme of service developed 1 1
Outcome 2: Enhanced
access to vocational
training
NER
Total:
Male
Female
5 5
Teacher: Student ratio - 1:35
Output 2.1: Vocational
training centres (VTCs)
established
No. of vocational training centres
constructed/established
- 3
Output 2.2: VTCs
renovated
No. of vocational
training centres
renovated
2 3
Output 2.2: VTCs
furnished
No. of vocational
training centres
furnished
1 2
Output 2.3: VTCs
supplied with
instructional materials
and equipment
No. of VTCs supplied with
instructional materials and
equipment
2 2
Outcome 3: Improved
literacy and reading
culture through library
facilities
No. of libraries/resource centers
operational
12 18
Output 3.1: Maktaba
centres content digitized
No. of Maktaba centres content
digitized
- -
Output 3.2: mobile book
facilities established
No. of mobile book facilities 6 -
Outcome 4: Improved
retention, transition and
completion rate through
bursaries and scholarship
No. of students benefiting from
bursaries and scholarship under the
‘Elimu Fund’
50,000 60,000
Output 4.1: Polytechnic
students under
sponsorship
No. of polytechnic students under
sponsorship (‘Tukuza Vipawa’
programme)
4000 5000
Outcome 5: Improved
multi-sector approach to
dignified care and safety
for children
Child rescue Centres/ homes
established
1 2

168
Sector Outcomes Key Performance indicator Beginning of the ADP year situation
Proposed End of the ADP target
Output 5.1: Child care
facilities licensed
Proportion of child care facilities
licensed
100 100
Output 5.2: child care
facilities assessed
No. of assessments in child care
facilities
4 4
Output 5.3: Care givers
trained
No. of trainings done 2 2
Output 5.4: School buses
for children with special
needs
No. of school buses for children
with special needs acquired
0 2
Output 5.5: Sensitized
community
No. of community sensitization
meetings held
2 2
Outcome 6: Enhanced
service delivery to
Education services
Management Information Systems
in place
3 3
Policies in place 8 10
No. of Motor Vehicles 2 3
Sector Programmes- Health Key Performance Indicators Beginning of the ADP year
situation Planned Targets
Reverse the rise in NCD cases No of awareness campaigns on NCDs conducted Proportion of patients screened for cervical cancer
45% 3 -
42% 4 100
Percentage increase of fully immunized children Percentage increase of children under 1 year provided with LLITN Percentage reduction in malaria Prevalence % of HIV budget financed by the county Percentage reduction in HIV and AIDS Prevalence Percentage of HIV positive clients receiving treatment Percentage of TB clients completing treatment Increase in number of notified TB cases on treatment % School age children dewormed
85 - 48 -85 - 48 - 3615 -
89 75 35 50 6.5 90 90 4,420 20
Proportion of epidemics reported and responded to appropriately e.g. cholera, chikungunya and Dengue fever Non-polio AFP rate 4/100,000 of <15 years population
100 4
100 4

169
Key Performance Indicators Beginning of the ADP year situation
Planned Targets
Proportion of households using treated water Proportion of food handlers examined Proportion of households with functional latrines Functional community units established Number of community health dialogues conducted
73.9 - 81.2 2 168
85 100 87 8 232
% decrease of under 5 years children stunted % reduction of under 5 years children who are underweight
21 9.6
18 6.6
% reduction in prevalence of drug and substance abuse 51 35
% increase in pregnant women attending at least 4 ANC visits Reduction in number of fresh still birth rate (per 1000 lb) Reduction in number of facility-based maternal deaths
- 548 52
30 275 30
% increase in women of reproductive age accessing FP commodities % reduction in teenage pregnancies
- 20
30 15
% reached with CSE message 2 20
Number of dialysis machine and beds acquired and supplied Number of pediatric ICU cots with monitor and ventilator Number of radiotherapy machines procured Number of consultant Oncologists recruited Number of Cath lab for cardiac surgery
14 2 - 1 -
14 1 1 1 1
Number of rehab centres operationalized/Functional Three rehab centre refurbished Upgrade Portreitz mental unit to hospital status
1 3 -
1 1
Number of sub-county hospitals providing comprehensive emergency obstetric care Number of sub-county hospitals with fully functional maternity, postnatal and new born unit Number of sub-county hospitals providing comprehensive rehabilitative services(physiotherapy and occupational therapy)
2 - 1
1 1 1
% increase in deliveries assisted by skilled personnel Number of children under 5 years treated for diarrhea
ALOS (Days)
% of facilities with oxygen delivery facilities
51.2
32277
6
36
70
26144
5 50
Number of sub-county hospitals that have undergone full laboratory accreditation Number of sub-county hospitals with basic lab quipment (chemical analyzer and hematology machine) Number of QC lab established Number of lab technologists providing service Number of sub-county hospitals with Basic radiology equipment (X-ray and Ultrasound) Number of Radiographers providing service
1 - 50 2 12
1 1 1 10 1 4
Number of health care facilities conducting deliveries Number of primary care facilities providing lab services
15 27
2 3

170
Key Performance Indicators Beginning of the ADP year situation
Planned Targets
No. of health policies/ guidelines implemented & legislated Review and develop health sector investment and strategic plan % increase in resource allocation % increase in revenue collection Increased absorption of allocated funds budget
3 1 25 400 83
2 1 33 440 100
No. of health facilities accredited No of health workers trained on quality Assurance No. of functional Quality Improvement teams
- 5 1
1 20 5
Number of Performance review and reports prepared and disseminated Sector working group development Report No of data quality audits conducted/support supervision Revitalized and functional Health integrated M& E TWG Number of HRIO providing service No of facilities with revised HMIS tools No of facilities with integrated County and sub county integrated LMIS (software/hardware) No of facilities with integrated EMR Computerization of EMMS Management system in pharmacy (level 4&5)
1 1 15 1 20 50 - - -
1 1 20 1 12 240 1 1 1
Annual Forecasting and quantification reports prepared Quarterly commodity order placement Commodity order fill rate % reduction in the proportion of expired drugs No. of health workers trained on commodity management and appropriate drug use No of equipment purchased for critical and specialized services (MES equipping)
- - - - 50 -
1 4 100 3 60 2
Functional Research framework Functional data base for health research established Annual county health Research symposium
- - -
1 1 1
Hospital Management Boards for level 4. Established No of health facilities committees trained No of health workers trained on senior management No. of stakeholders meeting held
1 16 20 8
4 5 20 20
Number of level 2/3 facilities renovated/constructed with maternity unit No. of new drug rehabilitation centres in place No. facilities upgraded to level 4 No of facilities refurbished No. of new level 4 facilities completed No. of container clinics operationalized in the informal settlements
1 3 4 7 - -
1 1 1 5 4 1
No. of health workers recruited No. of staff promoted Training needs assessment report No. of staff and documents uploaded into iHRIS No. of Dashboards developed Proportion of departments on PC Proportion of staff on PAS
376 1305 - 1569 1 - -
400 245 1 2772 4 100 100

171
Health Framework
Programme Outcome Indicators Baseline Source of Data
Reporting Responsibility
Situation in 2018
Mid-term Target (2020)
Preventive and Promotive Health Services
% of adult population with BMI over 25
45% DHIS2 CECM Health Services
44% 42%
No of awareness campaigns on NCDs conducted
3 DHIS2 CECM Health Services
3 11
Proportion of patients screened for cervical cancer
- DHIS2 CECM Health Services
100 100
Percentage increase of fully immunized children
85 DHIS2 CECM Health Services
85 89
Percentage increase of children under 1 year provided with LLITN
- DHIS2 CECM Health Services
75 75
Percentage reduction in malaria Prevalence
48 DHIS2 CECM Health Services
45 35
% of HIV budget financed by the county
- County CECM Health Services
50 50
Percentage reduction in HIV and AIDS Prevalence
7.4 DHIS2 CECM Health Services
7 6.5
Percentage of HIV positive clients receiving treatment
44,422 (82%)
DHIS2 CECM Health Services
90 90
Percentage of TB clients completing treatment
87% DHIS2 CECM Health Services
88 90
Increase in number of notified TB cases on treatment
3615 DHIS2 CECM Health Services
3,654 4,420
% School age children dewormed
- DHIS2 CECM Health Services
10 20
Proportion of epidemics reported and responded to appropriately e.g. cholera, chikungunya and Dengue fever
100 DHIS2 CECM Health Services
100 100
Non-polio AFP rate 4/100,000 of <15 years population
4 DoHS CECM Health Services
3.5 4
Proportion of households using treated water
73.9 DoHS CECM Health Services
80 85

172
Programme Outcome Indicators Baseline Source of Data
Reporting Responsibility
Situation in 2018
Mid-term Target (2020)
Proportion of food handlers examined
- DHIS2 CECM Health Services
100 100
Proportion of households with functional latrines
81.2 DHIS2 CECM Health Services
83 87
Functional community units established
2 DHIS2 CECM Health Services
2 18
Number of community health dialogues conducted
168 DHIS2 CECM Health Services
168 232
% decrease of under 5 years children
stunted
21 DHIS2 CECM Health Services
20 18
% reduction of under 5 years children
who are underweight
9.6 DHIS2 CECM Health Services
8.6 6.6
% reduction in prevalence of drug and substance abuse
51 DHIS2 CECM Health Services
45 35
% increase in pregnant women attending at least 4 ANC visits
- DHIS2 CECM Health Services
10 30
Reduction in number of fresh still birth rate (per 1000 lb)
548 DHIS2 CECM Health Services
400 275
Reduction in number of facility-based maternal deaths
52 DHIS2 CECM Health Services
45 30
% increase in women of reproductive age accessing FP commodities
- DHIS2 CECM Health Services
10 30
% reduction in teenage pregnancies
20 DHIS2 CECM Health Services
20 15
% reached with CSE message 2 DHIS2 CECM Health Services
10 20
Curative and rehabilitative health services
Number of dialysis machine and beds acquired and supplied
14 DoHS CECM Health Services
14 42
Number of pediatric ICU cots with monitor and ventilator
2 DoHS CECM Health Services
1 3

173
Programme Outcome Indicators Baseline Source of Data
Reporting Responsibility
Situation in 2018
Mid-term Target (2020)
Number of radiotherapy machines procured
- DoHS CECM Health Services
1
Number of consultant Oncologists recruited
1 DoHS CECM Health Services
2
Number of Cath lab for cardiac surgery
- DoHS CECM Health Services
1 1
Number of rehab centres operationalized/Functional
1 DoHS CECM Health Services
1 3
Three rehab centre refurbished
3 DoHS CECM Health Services
1 3
Upgrade Portreitz mental unit to hospital status
- DoHS CECM Health Services
1
Number of sub-county hospitals providing comprehensive emergency obstetric care
2 DoHS CECM Health Services
1 3
Number of sub-county hospitals with fully functional maternity, postnatal and new born unit
- DoHS CECM Health Services
1 3
Number of sub-county hospitals providing comprehensive rehabilitative services(physiotherapy and occupational therapy)
1 DoHS CECM Health Services
1 3
% increase in deliveries assisted by skilled personnel
51.2 DoHS CECM Health Services
60 70
Number of children under 5 years treated for diarrhea
32,277 DoHS CECM Health Services
32,277 26,144
ALOS (Days) 6 DoHS CECM Health Services
6 5
% of facilities with oxygen delivery facilities
36 DoHS CECM Health Services
50 50
Number of sub-county hospitals that have undergone full laboratory accreditation
0 DoHS CECM Health Services
1 3

174
Programme Outcome Indicators Baseline Source of Data
Reporting Responsibility
Situation in 2018
Mid-term Target (2020)
Number of sub-county hospitals with basic lab quipment (chemical analyzer and hematology machine)
1 DoHS CECM Health Services
1 3
Number of QC lab established - DoHS CECM Health Services
1 3
Number of lab technologists providing service
50 DoHS CECM Health Services
12 34
Number of sub-county hospitals with Basic radiology equipment (X-ray and Ultrasound)
2 DoHS CECM Health Services
1 3
Number of Radiographers providing service
12 DHIS2 CECM Health Services
5 13
Number of health care facilities conducting deliveries
15 DHIS2 CECM Health Services
2 6
Number of primary care facilities providing lab services
27 DHIS2 CECM Health Services
3 9
General Administration, Planning and Support Service
No. of health policies/ guidelines implemented & legislated
3 DoHS CECM Health Services
2 5
Review and develop health sector investment and strategic plan
1 DoHS CECM Health Services
1 2
% increase in resource allocation
25 DoHS CECM Health Services
27 33
% increase in revenue collection
400 DoHS CECM Health Services
420 440
Increased absorption of allocated funds budget
83 DoHS CECM Health Services
83 100
No. of health facilities accredited
- DoHS CECM Health Services
1 3
No of health workers trained on quality Assurance
5 DoHS CECM Health Services
20 60
No. of functional Quality Improvement teams
1 DoHS CECM Health Services
5 15

175
Programme Outcome Indicators Baseline Source of Data
Reporting Responsibility
Situation in 2018
Mid-term Target (2020)
Number of Performance review and reports prepared and disseminated
1 DoHS CECM Health Services
1 3
Sector working group development Report
1 DoHS CECM Health Services
1 3
No of data quality audits conducted/support supervision
15 DoHS CECM Health Services
20 60
Revitalized and functional Health integrated M& E TWG
1 DoHS CECM Health Services
1 3
Number of HRIO providing service
20 DoHS CECM Health Services
15 42
No of facilities with revised HMIS tools
50 DoHS CECM Health Services
240 240
No of facilities with integrated County and sub county integrated LMIS (software/hardware)
- DoHS CECM Health Services
1 3
No of facilities with integrated EMR
- DoHS CECM Health Services
1 3
Computerization of EMMS Management system in pharmacy (level 4&5)
- DoHS CECM Health Services
2
Annual Forecasting and quantification reports prepared
- DoHS CECM Health Services
1 3
Quarterly commodity order placement
- DoHS CECM Health Services
4 12
Commodity order fill rate - DoHS CECM Health Services
100 100
% reduction in the proportion of expired drugs
- DoHS CECM Health Services
5 12
No. of health workers trained on commodity management and appropriate drug use
50 DoHS CECM Health Services
60 180

176
Programme Outcome Indicators Baseline Source of Data
Reporting Responsibility
Situation in 2018
Mid-term Target (2020)
No of equipment purchased for critical and specialized services (MES equipping)
- DoHS CECM Health Services
2
Functional Research framework
- DoHS CECM Health Services
1
Functional data base for health research established
- DoHS CECM Health Services
1 3
Annual county health Research symposium
- DoHS CECM Health Services
1 3
Hospital Management Boards for level 4. established
1 DoHS CECM Health Services
2 6
No of health facilities committees trained
16 DoHS CECM Health Services
5 15
No of health workers trained on senior management
20 DoHS CECM Health Services
20 60
No. of stakeholders meeting held
8 DoHS CECM Health Services
20 60
Number of level 2/3 facilities renovated/constructed with maternity unit
1 DoHS CECM Health Services
1 3
No. of new drug rehabilitation centres in place
3 DoHS CECM Health Services
2
No. facilities upgraded to level 4
4 DoHS CECM Health Services
2
No of facilities refurbished 7 DoHS CECM Health Services
10 25
No. of new level 4 facilities completed
- DoHS CECM Health Services
2 2
No. of container clinics operationalized in the informal settlements
- DoHS CECM Health Services
2 6
No. of health workers recruited
376 DoHS CECM Health Services
722 1472
No. of staff promoted 1305 DoHS CECM Health Services
326 701

177
Programme Outcome Indicators Baseline Source of Data
Reporting Responsibility
Situation in 2018
Mid-term Target (2020)
Training needs assessment report
- DoHS CECM Health Services
1
No. of staff and documents uploaded into iHRIS
1569 DoHS CECM Health Services
2291 2772
No. of Dashboards developed 1 DoHS CECM Health Services
4 12
Proportion of departments on PC
- DoHS CECM Health Services
100 100
Proportion of staff on PAS - DoHS CECM Health Services
100 100
Sector Programmes- Environmental Protection, Water and Natural Resources Key Performance Indicators Beginning of the ADP year
situation Planned Targets
Number of Sanitation blocks built in public places No of Sludge treatment Plants Developed. Number of Sanitation blocks built in public primary schools and ECD centres
20 - 13
5 1 10
No of Kilometres rehabilitated and additional sewer lines built (Km). Number of improved combined sewer overflows & storm water outlets % increase in additional connections to central sewerage system No. of pumping stations rehabilitated No. of WWTPs rehabilitated, No. of acreage acquired for WWTPs and sewerage pumping stations. Safeguards reports on resettlement action plan (RAP),/ Land acquisition plan (LAP) and no. of (project affected persons) PAPS
51 - 8000 (No.) 8 1 0.0817 Ha or 817m2 315 PAPs for Likoni livelihood restorations.
10 8 16 2 1 200 1800
No. of Vacuum Exhausters purchased to have at least one per sub-County by 2022 Policy on private exhausters management No. of trainings/ public awareness on best sanitation practices.
1 - -
2 1 6
% Reduction in NRW % Increase supply of water reaching consumers and billed.(M3)
50 20,000
43 22,800
% increase of water supply distribution pipeline laid for either new areas, replacement, rehabilitation, expansion and extension (Km) No. of water supply active connections Increase in Capacity of water storage facilities (M3) Safeguards reports on resettlement action plan (RAP),/ Land acquisition plan (LAP) and no. of (project affected persons) PAPS
80 30,000 - 315 PAPs for Likoni livelihood restorations. 341 PAPS for Lot 2B Kshs 18,845,854.16
700 2000 5,000 1800

178
Water policy developed No of desalination plants built No. of boreholes drilled within the County % increase of public institutions embracing rain water harvesting methods % increase in total amount of water produced (m3 ) Number of earth pans done No. of investor forums to increase water supply production to Mombasa
- - 10 - 40,000 - -
1 1 20 10 17 5 3
Level of implementation of the County Water and Sewerage Act 2016 % increase in automation levels & adoption of new technologies for water services Water supply , Sanitation and Natural resources policy and regulations Area of office space constructed in square meters. No. of water Bowsers purchased No. of Motor vehicles purchased (Double Cabin)
5 - - 510 2 -
40 10 1 600 1 2
County natural resource management and coordination committee established and operationalized No. of partnerships and collaborations established stakeholders in natural resource management and conservation No. of reports on level of improvement in mangrove ecosystem through collaborations with CBOs
- - -
1 2 2
No of Laws, Policies and regulations that promote participatory management of Natural resources developed (including sand harvesting and quarries) Multi sectorial and interdepartmental NR management committee established and operationalized
- -
2 7
No. of staff in relevant aspects of natural resource management and conservation Purchased and well-maintained vehicles
- -
20 2
No. of community sensitizations in management, conservation and sustainable utilization of natural resources. Community and stakeholders meeting held Percentage of public schools embracing greening through tree planting
- - -
8 8 50
Staff trained on climate change adaptation and mitigation Developed and implemented County climate change policy, legislations, and framework Community sensitization programs on climate change adaptation and mitigation through sensitization programs
- - -
10 3 12
Number of field surveys and mapping reports for transfer stations. Number of transfer stations acquired and developed Number of final disposal sites (gazette landfill, recycling plants) acquired and developed
- - -
1 2 1
Number of assorted Waste transportation equipment. Packaging policy developed No of staff capacity built and additional ones hired. Number of assorted appropriate handling tools and protective gear. Database of industries Automated and updated waste collection and transportation system.
- - - - - -
9 1 100 5000 1 1

179
Developed and implemented County environmental policy, plan, regulations and guidelines. Industrial environmental audit reports County environmental Committee established and operationalized Multi sectorial and interdepartmental environmental committee established and operational No of regulatory units established No. of developed partnerships and collaborations in environmental protection and conservation
- - - - - -
1 1 1 2 1 2
Polluter pay principle developed Air and noise pollution monitoring equipment purchased and maintained Capacity built and knowledgeable officers in monitoring air and noise pollution
- - -
1 2 5
Restored and well-maintained parks, flower beds and tree nurseries Established and well-maintained County arboretum (botanical garden) Restored, furnished and well-maintained public cemeteries
- - -
15 1 2
No of adequate and relevant technical and supporting staff capacity built. No of well-trained staff in relevant aspects of environmental conservation and protection.
-
80 50
No of adequately furnished and equipped workspaces No of purchased and well-maintained vehicles
- -
4 2
Pre- Feasibility study report Number of businesses initiated in waste to energy programs
- -
1 2
No. of staff capacity built on renewable energy production Percentage increase in number of establishments with solar panels or using wind energy Appropriate regulatory framework in place for renewable energy promotion and energy stakeholder collaboration
- - -
20 20 2
Sector/Sub-sector
Key performance indicator Beginning of the ADP year situation
Proposed End of the ADP target
Project Name
County Funded
Kashani- Vikwatani pipeline Km of pipeline laid 6.0km 10.5km
Mwakirunge Maunguja pipeline Km of pipeline laid 5.0km 10.5km
Frere town-Kisimani pipeline Km of pipeline laid 1.0km 2.6km
Coast General pipeline Km of pipeline laid 0.6km 1.0km
Completion of wells No. of wells Completed 0.0 No of wells 6.0 No Wells
Completion of Maji Mashinani Bore Hole project
No. of B/Hs Completed 10.0 No of B/Hs Completed 12.0 No of B/Hs Completed.
Rehabilitation of County Public Toilets
No of Public Toilets Rehabilitated 0.0 No of Public toilets 6.0 No Public Toilets
School WASH No of Toilet doors constructed 0.0 No of toilets doors Constructed
No of doors constructed as per regulation

180
Finalization of a Natural Resource Management policy and associated Acts
Reports 1 Natural Resource Policy 5 Natural resource acts
Bills 1 Natural Resource Policy 5 Natural resource act
Undertake a natural resource inventory and valuation
County natural resource database Lack of a county natural resource database
Natural resource database
Development of Community Forest Management Plans (Kaya Shonda and Mtongwe)
Minutes Reports 2 Community forest Management plans
0 Community management plans
2 Community forests management plans
Development of natural resource utilization revenue collection system (artisanal mining consent fee, operating licenses in community forests nurseries and private forests, operating licenses in nature-based products e.g. honey, wild fruits)
Revenue collections system Revenue
No natural resource utilization revenue collection system
Natural resource utilization collection system
Establish County arboretum Reports Plans and designs Planted trees and associated aesthetics
Lack of a county arboretum Secured land Plans and designs
Increase county forest cover Reports Trees planted
100,000 trees planted
Empower 3 women/youth groups engaged in natural resource conservation
Reports
0 women/youth groups empowered in natural resource degradation
3 women/youth groups empowered in natural resource conservation
Donor Funded
Jomvu DMA Pipeline network Km of pipeline laid 0.0km of pipeline laid 40.km pipeline laid
Nyali DMA Pipeline network. Km of pipeline laid 0.0km of pipeline laid 20 km pipeline laid
Rehabilitation/Extension of Mombasa supply distribution network-LOT 2B
Km of pipeline laid 0.0km of pipeline laid 20 km pipeline laid
Rehabilitation of Kipevu Treatment plant-electromechanical
No of pumping stations 0.0 No of pumping stations rehabilitated
5 No of pumping stations rehabilitated
Desalination project No of plants Constructed 0.0 No of Plants Constructed 50% of 2 No plant Constructed
Purchase of 4 No water bowsers
No of water Bowsers purchased 0.0 No of Water Bowsers purchased.
4 No water Bowsers purchased.
Improvement of Storm Water Outlets and combined sewer overflows in Mombasa Island
No. of storm water outlets improved
0.0 No of storm water outlets improved
17 No of storm water outlets improved.
Purchase of 2 No vacuum exhausters
No of Vacuum Exhausters purchased.
0.0 No of vacuum exhausters purchased.
2 No of Vacuum Exhausters purchased.

181
Environment Table 6: Monitoring and Evaluation Performance Indicators Matrix
Sector/Sub-sector
Key performance indicator Beginning of the ADP year situation
Proposed End of the ADP target
Administration -No. of motivated staff -No. of upgraded skill in the workforce -No. of furnished offices
75% of the staffs are motivated 20% Skilled workforce 50% furnished offices
100%Motivated Staff 60%Skilled workforce 100% Furnished Offices
Environment No. of Noise Permits issued No. of streets beautified No. of re-carpeted cemeteries No. of Mangrove Trees planted
40% Noise Permits issued 50% Streets beautified 20% re-carpeted cemeteries 40% Mangrove seedlings planted
100% Noise Permits 100%Beautified streets 50% Re-carpeted Cemeteries 80% Mangrove seedlings planted
Solid Waste Management No. of Transfer points established No. of Trucks purchased No of trips on daily Garbage collection No. of established landfills
Energy No. of renewable energy sources Climate Change
Sector Priority Programmes- Social Protection, Culture and Recreation
Key Performance Indicators Beginning of the ADP year situation
Planned Targets
Number of Youths trained on business skills
Number of Youths groups supported with business funds
Development of one stop youth resource centre
10,000
200
-
10000
100 1
Number of creative arts talent centres established
% increase in the number of youth exploiting their creative talent
-
300
1
90
% increase in the number of alcohol and substance abusers rehabilitated
% reduction in alcohol and substance abusers
Number of groups of rehabilitated alcohol and drug supported with startup kits.
Number of youths trained on leadership
400 (No.) - 10 -
25 25 15 50
% increase in the number of women supported with start-up capital
Number of women groups supported with business startup funds
3000 (No.)
230
60
100

182
Key Performance Indicators Beginning of the ADP year situation
Planned Targets
Home for the aged renovated
Proportion of elderly (60-69 years and above) supported through NHIF contributions
Proportion of elderly (60-69 years and above) supported through cash transfer
% increase in health insurance coverage under the ‘County Health Micro-Insurance Scheme’
Proportion of Community Health Workers with NHIF
Increase in number of pupils benefiting from the School Milk Program, including a daily snack under the ‘Elimu Kwanza’ program
Number of need girls supported with sanitary pads
A girls rescue centre
-
7,267 (No.)
7,267 (No.)
26.7 - 31,529
-
-
1
100
100
40 100 45,000
2000
1
Number of local youth teams assisted with sports kits
Number of local leagues organised/hosted.
Number of national and international leagues organised.
10 5 6
14 10 10
Number of new sports facilities established. Number of Sports facilities renovated
3 1
2 1
Number of community cultural festivals held Number of cultural practioners trained Proportion of cultural goods and services marketed and promoted
30 500 60
5 1000 100
No. of historical and cultural sites mapped. No. of historical and cultural sites established Historical sites preserved and managed
- - -
10 10 10
Number of film and music studio created.
Number of films and songs produced
Number of public performances held
- - -
1 10 200
Rehabilitation of public parks-mama ngina drive and Jomo kenyatta public beach. Establishment of county museum Establishment of a community cultural centre Number of sanitary facilities Provided along the public recreational spaces Number of retail kiosks at public recreational facilities.
- - - - 1
1 1 1 1 4
% increase in the number of PWDs trained on livelihood skills Proportion of county procurement funds allocated to PWDs Proportion of county buildings compliant with PWDs requirements
2000 - -
40 2 100

183
a. Sub Sector Programmes - Crop Development Key Performance Indicators Beginning of the ADP
year situation Planned Targets
Number of staff capacity build % increase in the number of famers capacity build on best farming methods Number of technical staff recruited
6 2000 (No.) 35
48 80 50
% decrease on the proportion of the food poor Input subsidy programme initiated % increase in the number of famers provided with subsidized inputs Number of community groups participating in urban farming and fishing Number of fruit trees planted Number of forums held on high-value crops, water harvesting and drought resistant crops Crop pest and disease surveillance reports Ha of land opened up for micro irrigation Ha of land opened up for crop farming
50.4 - 300 (No.) - - - - 15 18
46 1 100 30 60,000 2 4 30 30
Percentage increase in quantity of local produce accessing the retail market No. of producer groups supported Database of agricultural produce market information and update Number of groups (women and youth) capacity built in value additions Agricultural credit scheme initiated Number of value added products accessing the market
5 - - 20 - 3
8 10 1 50 1 5
Agricultural storage facilities constructed
% increase in the number of famers capacity build on post-harvest management of produce
- -
3 100
b. Sub-sector Programmes - Livestock Development Key Performance Indicators Beginning of the ADP
year situation Planned Targets
Number of staff capacity build
Number of livestock stakeholder’s capacity built
Number of technical staff recruited
Number of Animal health and animal welfare stakeholder’s capacity built
10
1000
29
500
44
4000
51
2000
% decrease on the proportion of the food poor No. of surveillance reports prepared and acted upon Veterinary laboratories (Kisauni) Quarantine station No of youth and women groups supported through poultry, beekeeping and rabbit programmes No. of livestock demonstration farms % increase in volume of animal products (kg) % increase in value of animal products (Kshs.)
50.4 - - - - - 5 -
46 2 1 1 10 1 19 15

184
Key Performance Indicators Beginning of the ADP year situation
Planned Targets
No. of surveillance reports prepared and acted upon
% increase in the number of famers reached by extension services
-
2
2
50
Percentage increase in quantity of local produce
Number of groups engaged in value addition
Percentage Increase in the number of value added products
Information database developed and updated
50 3 5 -
75 17 30 1
c. Fisheries Development Sub-sector Programmes
Key Performance Indicators Beginning of the ADP year situation
Planned Targets
Number of staff capacity built
Number of stakeholders and institutions capacity built
Number of staff recruited
3
1200 18
18
6000 39
Improved Livelihood for the fisher fork
EEZ fishing policy developed
% increase in total fish (kg) landed in the county
Number of protected breeding areas and landing sites
Proportion of BMU access roads paved and maintained
Fish stock assessment reports
Incubation and training facility constructed
Number of fish ponds constructed
1200 - 800 15 - - - -
6000 1 8000 30 100 2 1 10
Proportion of BMUs engaged in value addition
Proportion of BMUs using modern fishing technologies
No. of inspections & assessments done
No. of fish processing and storage facilities constructed
No. of cluster groups formed
Proportion of BMU with standardized storage facilities
-
-
- - - -
30
30 4 1 1 30

185
d. Cooperative Development
Key Performance Indicators Beginning of the ADP year situation
Planned Targets
Number of staff capacity built
Number of stakeholders and institutions capacity built
Number of staff recruited
Percentage increase in cooperative membership
Proportion of cooperatives complied with the legal framework
Percentage increase in the total assets in cooperatives
Percentage increase in the number of women and youth in cooperatives
Number of value chains promoted in the sector
Number of groups engaged in value addition
Proportion of cooperatives with management officials trained
No. of exchange and exhibitions held
No. of new cooperative societies formed
No. of dormant cooperative societies revived
No. of cooperatives linked to partners and markets
No. of Cooperative development policies in place
Proportion of cooperatives societies members trained
Percentage increase in the number of value-added products accessing the
market
1
300
12
62390 (No.)
100
15 Billion
-
-
-
-
-
-
-
-
-
-
3
18
8000
5
60
100
60
30
8
6
70
2
5
5
10
2
70
5
e. Land and Housing
Key Performance Indicators Beginning of the ADP year situation
Planned Targets
Land policies and regulations
Land data storage database and information system
Land registry refurbished
4
-
-
5
1
1

186
Increase in housing stock (units)
% increase in access levels to decent housing by low income
earners 4% to 10%
ABTs equipment
Housing policy, Acts and regulations
Land Use Plans, Regulations and Policies
GIS lab
Number of Mini cities developed (Mwakirunge and petro city)
Urban design unit established
Zoning plans and regulations
Zoning plans and regulations
3000
4
-
1
2
-
-
-
2
2
5200
8
2
1
2
1
1
1
2
2