coup traps: why does africa have so many coups d'etat?
TRANSCRIPT

Coup Traps: Why does Africa have so many Coups d’Etat?
Paul Collier and Anke Hoeffler,
Preliminary Draft: August 2005
Centre for the Study of African Economies, Department of Economics,
University of Oxford

2
Abstract
In Africa coup plots are by far the most common challenge to the continuity of regimes.
In this paper we investigate proneness to coups by drawing on our previous work on
proneness to civil war. The most striking aspect of our results is the similarity in the
causes of coups and civil wars. Standard indicators of grievance such as political
repression and economic inequality do not feature as significant influences. A common
core of economic factors underpins proneness to coups and civil wars: low income and a
lack of growth. Both are also subject to ‘traps’ – once a coup or civil war has occurred,
further events are much more likely. We have attempted to investigate whether policies
that favor the military reduce the risk of coups, but have found that if anything, their
effect is perverse: high military spending may even increase the risk of a coup.

3
1. Introduction
In Africa coups remain common. Since 2000 there have been successful coups in the
Central African Republic and Togo, and failed coups in Sao Tome, Principe and
Equatorial Guinea. The successful coup in Cote d’Ívoire in 1998 began a cycle of
political instability that has ruined a country once seen as the jewel of Africa. The
economic consequences for Cote d’Ívoire are not unique: such political instability has
commonly been costly (Fosu, 2001).
In this paper we investigate proneness to coups. In Section 2 we develop a theory of the
coup d’état drawing on our previous work on proneness to rebellion (Collier and
Hoeffler, 2004). Coups have obvious similarities and differences to rebellions: both
attempt to capture the state by force, and indeed, sometimes a coup that fails to oust the
government evolves into a rebellion. However, the mode of organization and recruitment
to a coup is clearly very different from the classic creation of a rebel army. In particular,
we argue that while the incentives for staging a coup are likely to be similar to those for a
rebellion, the key difference is in the barriers to feasibility. The incentives for a violent
challenge to the state are some combination of ‘greed and grievance’ – the capture of
resources, or the rectification of wrongs. The barriers to feasibility faced by a rebellion
are largely material: a rebellion needs to acquire armaments and to finance thousands of
soldiers. A coup faces no such difficulties and so overall, the barriers to a coup are likely
to be lower than those to a rebellion. However, a coup faces a different barrier: the
loyalty of the army, achieved either by a sense that a challenge is illegitimate, or by co-
opting the military into the benefits of power. Normally this sense of loyalty is the
effective barrier to a coup. The key argument of Section 2 is that should a coup
nevertheless occur, the new regime in the process destroys the basis for its own
legitimacy. Since a coup legitimizes further coups, if legitimacy is the key barrier then we
should observe ‘coup traps’: societies can collapse into political black holes of repeated
regime change generated from within the army.

4
In Section 3 we use a unique comprehensive data set on African coups, reports of coup
attempts that fail, and reports of coup plots that abort before they reach the stage of an
actual attempt (McGowan, 2003). We use these data to compare the causes of proneness
to rebellion with the causes of proneness to coups. For this we use the full range of
explanatory variables previously developed for explaining rebellion, but also develop a
new range of variables appropriate for the specific incentives faced by the government
army. In the process we test for coup traps.
2. A Theory of Coups
A coup d’état is a violent challenge to the state, analogous to a rebellion. A useful starting
point is thus to hypothesis that the two phenomena have similar causal structures. The
incentives for violent change of regime are now commonly thought of as in part
reflecting greed and partly grievance. While the incentives for rebellions and coups are at
least broadly similar, the restraints on them are radically different. We consider in turn
the two incentives of greed and grievance and then turn to the restraints.
Greed: resource rents and aid
The greed motivation for rebellion reflects the reality of the large rents to sovereignty:
leaders and their supporters invariably do well if they capture the government. For
example, when the Sudanese People’s Liberation Army becomes the government of
Southern Sudan in mid-2005 it will receive $1bn per year in oil revenues, plus an aid
inflow - the UN is currently appealing for $2.5bn. In the context of Africa the two most
important sources of the rents to sovereignty are indeed those from natural resources and
foreign aid. When we turn to empirical testing we must allow for an important difference
in the degree of endogeneity of these two sources of rents. In particular, aid is a donor
choice and so may be reflected by the risks of a coup or a rebellion. It will therefore be
necessary to instrument for aid in order to eliminate this endogeneity.

5
Although both resource rents and aid are important rents to sovereignty, in principle each
might affect the risks of rebellion and coups differently. Most rebellions last for many
years and only rarely end in rebel capture of the state. Usually, aid is not provided to
rebel groups unless and until they succeed in capturing the state. In contrast, natural
resource rents can be acquired by rebel groups even if they never succeed in capturing the
state. Resource rents merely require the partial control of some pertinent territory. For
example, both UNITA in Angola and the RUF in Sierra Leone benefited from large
resource rents from diamonds even though they never succeeded in capturing the state.
Hence, the realistic prospect for rebellion is that the leaders gain partial control of
resource rents, whereas for coups the circumstances in which the leaders gain control of
resource rents are also those in which they gain control of the aid inflows.
Hence, to the extent that state capture is important, we expect that:
Rcoup (Aid, Resources) (1a)
+ +
Rrebellion (Aid, Resources). (1b)
0 +
Grievance: National, Sectional and Military Concerns
The other likely incentive for a violent challenge to the state is grievance against it. The
potential range of such grievances is wide. In our work on the causes of rebellion we
considered economic, political and social sources of grievance. The economic grievances
were proxied by the level, growth and distribution of per capita income, although the first
two are also readily interpretable in other ways. The political sources of grievance were
proxied by the extent of political rights. The social sources of grievance were proxied by
ethnic and religious diversity. How might such grievances affect proneness to rebellion
and to coups differentially?

6
From the perspective of grievance the key difference between a rebellion and a coup is
that the army is part of the state, and indeed in Africa usually a core part of the state.
While there will be exceptions, this suggests that grievances based on the exclusion of
some section of society from power and its fruits are more likely to motivate rebellion
than a coup: those excluded from the benefits of power are unlikely to be included in the
army. Indeed, to the extent that the government is pursuing policies of sectional
redistribution, these are likely to favor the group that is dominant in the army, so that the
very policies that might increase the risk of rebellion might be expected to reduce the risk
of a coup.
To the extent that it is motivated by grievance, the army is therefore likely either to be
representing national public good concerns, or at the other extreme, concerns about its
own welfare such as military pay. The national public good concerns are less likely to
motivate rebellion since they face the standard free-rider problem. Issues that are only of
concern to the military itself are evidently unlikely to motivate rebellion.
Specifically, to the extent that grievance is important, we might thus expect:
Rcoup (Sectional grievance, national grievance, army grievance) (2a)
-? + +
Rrebellion (Sectional grievance, national grievance, army grievance). (2b)
+ +? 0
Restraints: deterrence, legitimacy and cooption
The feasibility of rebellion is determined by radically different considerations from that
of a coup. A rebellion requires the creation of a private army, which will usually need to

7
be sustained financially for several years. A coup needs no such financial resources since
the coup leaders use the government’s own army.
As discussed above, one likely source of finance for a rebel group during the rebellion is
resource rents. Hence, to the extent that finance is the key constraint on mounting a
violent challenge to the state, we would expect:
Rcoup (Resources) (3a)
0
Rrebellion (Resources). (3b)
+
Potentially, rebellion is deterred by government military spending. The perception of
such a deterrence effect is indeed one influence upon military budgets: spending rises in
response to the risk of rebellion (Collier and Hoeffler, 2005). However, this deterrence
effect can be offset by an inadvertent signal: high government military spending indicates
that the government is planning to rule by repression rather than by inclusion and this can
provoke rebellion. We find that in the frequently fragile situation of post-conflict were
typically a rebel military organization is gradually dissolving and so is atypically
concerned about government intentions, high government military spending is actually
counterproductive, significantly increasing the risk of further conflict; and that even
outside that context there is no significant deterrence effect (Collier and Hoeffler, 2005a).
While the effect of military spending on the risk of rebellion is thus ambiguous, the most
likely effect of military spending on the risk of coups is to reduce it. This could work in
two ways. Higher military spending might permit better conditions of service and so co-
opt the military into the elite: we defer consideration of this effect until a fuller discussion
of cooption. The effect on which we wish to focus at present is still within the broad
category of deterrence. A standard technique of dictators is to protect themselves from
their own military by constructing parallel military organizations: for example, the secret

8
police and the presidential guard are given a military capability matching both each other
and that of the army, so that no one organization is sure of being able to win if it launches
a coup (Luttwak, 1968). An enlarged military budget enables such a system of military
duplication. Hence, to the extent that military spending matters, we might expect:
Rcoup (Military spending) (4a)
-
Rrebellion (Military spending). (4b)
?+
Finally, we turn to the restraint of legitimacy and loyalty. It is virtually impossible for a
government to defend itself from rebellion through inculcating a sense of its legitimacy.
This is because recruits to rebellion can come from any part of society. Even in the
developed democracies there are pockets of society who see the use of violence against
the state as legitimate: Breton separatists in France, the far-left in Italy, the far-right in the
USA. However, a government can credibly aspire to building a sense of its legitimacy
within its own military. It can screen applicants so as to recruit those predisposed to
loyalty. It can promote those that demonstrate the most loyalty. It can reward the army
for its loyalty, and it can provide soldiers with selective information that reinforces
loyalty.
One source of legitimacy is recognition that the government has come to power through
means that the society accepts. Internationally, democratic elections are seen as the key
means of legitimizing the accession to power. A regime may also be seen as legitimate if
it has won a civil war since this also reflects a degree of popular support. A third source
of legitimacy is time: if the regime has been in place a long time many people will come
to see it as part of the natural order.
The type of government with the least claim to legitimacy is evidently one that has itself
recently come to power through a coup. It faces the internal contradiction that in claiming
9
that the means by which it came to power were legitimate, it thereby legitimizes an
equivalent attempt to replace it. Nor has it acquired the loyalty of tradition. This creates
the possibility for a ‘coup trap’. Consider a society in which greed and grievance favor a
coup, but where the risk of a coup is restrained by legitimacy. Let the restraint provided
by loyalty be probabilistic: that is, the risk is reduced but not eliminated. We would then
predict that if a coup occurs, the risk of further coups rises sharply. The existence of coup
traps thus becomes a test of the importance of legitimacy.
Finally, a regime on coming to power, whether through a rebellion or a coup, must find
some narrative of its own legitimacy beyond the illegitimacy of the previous regime.
Militarily successful rebellions are able to appeal to their military victory as direct
evidence of some popular support. However, successful coups lack this ability. It may be
easier to assert coup legitimacy in the context of a controlled media, where regime
change merely has to be announced on the state radio, rather than in the context of media
freedom, where a coup is likely to be criticized.
Hence, we would expect:
Rcoup (Regime origin legitimate, Regime duration, press freedom) (5a)
- - -
Rrebellion (Regime origin legitimate, regime duration, press freedom) (5b)
0 0 0
Loyalty can be achieved through cooption instead of through legitimacy. Just as the most
evident candidate for a grievance on the part of the army is its own material conditions,
the most obvious way of reducing the risk of a coup is to co-opt the military by favoring
it relative to the rest of the population. The government is thus likely to set pay levels
which reflect the risk of a coup: where there is a high risk of a coup for other reasons –
for example, other grievances or the capture of the state being unusually valuable – the

10
government can try to offset this risk by high pay. We thus expect to find an inter-
dependence between military conditions and coup risk:
Rcoup (Military conditions) (6a)
-
Rrebellion (Military conditions). (6b)
0
Military conditions (Rcoup, Rrebellion) (6c)
+ 0
Finally, because of the two forms of challenge to the state coups are much cheaper than
rebellions, we would expect a higher frequency of coups. Hence:
Rcoup > Rrebellion (7)
3. Empirical Analysis
Data and its Organization
The coup data for this analysis was collected by Patrick McGowan (McGowan, 2003)
who kindly made the original text files available to us. Using published sources this gives
a comprehensive coverage of reported coup plots that got no further than plotting, of
coup attempts that failed, and of successful coups in Africa during the period 1956 to
2001. Due to restrictions on economic data we are only considering coups from 1960

11
onwards. There were 145 plots that proceeded no further than the plot stage, 109 coup
attempts that failed, and 82 successful coups.1
Our first task was to code this data into machine-readable form. We assumed, reasonably
enough, that all actual attempted coups, successful or not, had been plotted. Thus, our
coding classified all three types of event as plots, some of which led on to coup attempts,
while in turn some of these attempts were successful.
The more problematic task was to organize the data in a way suitable for statistical
analysis. Plots, attempts and coups are rare events, but when they occur they tend to
bunch together. In two cases there were five such events in the same country in a single
year.2 Our data have the characteristics of ordered data as well as count data. No one
statistical approach appears to be ideal for this type of event and we adopt four slightly
different approaches, each of which has different disadvantages. One approach is an
annualized probit analysis. For each year during which any of these three types of event
happened - a plot, an attempt or a coup - we simply code an event. The disadvantage of
this approach is that it discards events when there is more than one event in the same
year. The second approach is a Poisson regression model which is often used for such
count data. Here the dependent variable is the number of events in a year. This has the
advantage of making some use of all events, but still misses the details of sequence. Thus,
in a year with multiple events, characteristics such as the time since the previous event
can only take the value of the average of all events in the year. The third approach is to
use an ordered probit which takes the inherent order from plot, attempt and coup into
account. Our forth approach is of our own devising and therefore likely to be subject to
errors of analysis of which we are currently unaware. Since the maximum number of
events in any year is five, we organize the data such that each year is divided into five
equal periods of 73 days. Each period may or may not have one event. To the extent
possible, events are then dated correctly within their appropriate period. In rare cases, two
1 In the published article McGowan reports a slightly lower number but since this is an ongoing data collection effort we used all of the plots, attempts and coups that were listed in the data description files, sent to us after the publication date. 2 Burkina Faso experienced three plots, one attempt and one coup in 1983 and there were five attempted coups in Togo in 1991.

12
events fall in the same 73 day period. Since we do not allow for multiple events within a
period, we notionally shift the date of the event to the nearest event-free period within the
same year. The alternative to this slight misrepresentation of the data would be to greatly
increase the number of periods into which a year is divided. In turn, this would
compound the problem of rare events, since the same number of events would be
distributed over far more observations.
With these four slightly different statistical approaches we investigate the three linked
phenomena of plots, attempts and successful coups. We begin with an analysis of the
causes of plots, defined to include all plots, whether or not they lead on to an attempt or
even to a successful coup. One rationale for starting here is statistical: this gives us the
maximum number of observations. Our analysis is also evidently constrained by the need
for observations on explanatory variables. However, we are able to get complete data on
254 plot events. The other reason for starting with the plot data is that there is a natural
temporal ordering from plots to coup attempts and from attempts to success. Hence,
starting from an analysis of plots, we can proceed to analyze what determines which plots
continue to attempts and then what determines which attempts continue to successful
coups. However, in analyzing plots a note of caution is in order. Inevitably, the only
source of information on those plots that are foiled before they become attempts is the
regime itself. There are likely to be instances in which the claim of plotting is a mere
subterfuge by which the regime justifies removal of potential enemies. Hence, our
observations of those plots that do not lead on to attempts may have substantial
measurement errors in both directions – some of our observed plots may be imaginary,
while some actual plots will inevitably have been missed. However, if for example,
repressive regimes are particularly prone to the invention of coup plots, this should show
up as distinctive explanations for plots in comparison to attempts.
Results
Table 1, column 1 presents our core regression. It uses our 73-day period as the basic unit
of observation and so maximizes the utilization of the plot data. As we will show, it is our

13
core regression also in the sense that no additional variable is significant. The core
regression has five explanatory variables, all significant. Like O’Kane (1981) we find that
economic variables are significant and robust in a number of different specifications.
These are per capita income and its growth rate, both lagged by one year in order to
reduce problems of endogeneity, ‘ethnic dominance’, the time since the most recent
previous plot, and finally, the time since Independence. At the mean of these variables,
the average country faces a risk of a plot in any 73-day period of 2.17%, so that the risk
during a year is 10.4%. Consistent with (7), this is radically higher than the risk of a
rebellion which is around 14% over a five-year period.
Holding other variables at their mean value, if per capita income is doubled, the risk is
reduced by 14.3%. If the growth rate is raised by four percentage points the risk is
reduced by 7.5%. We define ethnic dominance as a situation in which the largest ethno-
linguistic group in the society has between 45% and 90% of the population. Some 41% of
the countries in our sample are characterized by ethnic dominance. Thus defined,
countries without ethnic dominance have a 12.9% lower risk of a plot than those with
ethnic dominance. If the time elapsed since the most recent plot is doubled, the risk of a
further plot is reduced by 62.7%. Finally, in the first year of Independence, the risk is
raised by 3.7%.
Around this base we have tried a number of variants. Among the factors that have no
significant effect on the risk of a coup are the degree of democratization or political
repression, (column 2), the degree of income inequality (column 3), the extent of natural
resource, primary commodity, or oil income (column 4), the extent of religious and ethnic
fractionalization other than ethnic dominance (column 5), and the geographic dispersion
of the population (column 6).
As robustness checks to the core result we switch from the 73-day period of observation
to annual observation, first using probit formulation to see whether there is at least one
plot during the year, secondly using a Poisson formulation with the dependent variable as
the number of plots during the year and thirdly using an ordered Probit. All of these

14
approaches have the advantage of being standard, but they each sacrifice information
compared with our initial method. The results are shown in Table 2. The time since the
previous plot remains significant, but the other variables lose significance although they
do not change sign. The results are thus consistent with what might be expected if the
only difference between the methods were the loss of information.
In Table 3 we turn to the analysis of attempts and coups. We first repeat the core
regression with the changed dependent variable (columns 1 and 2). The signs of all
variables remain the same, but variables other than per capita income and the time since
the previous event lose significance. Since this loss of significance is consistent with the
reduction in sample size, we investigate whether there are any significant differences in
the determination of the three types of event: as between plots and attempts (column 3),
and between attempts and coups (column 4). There is only one significant difference
between those coup plots that fail to mature into attempts and those that do. Low per
capita income makes it significantly more likely that a plot with mature into an attempt.
Similarly, there is only one significant difference between failed coup attempts and
successful attempts. Again, low per capita income makes it more likely that a coup
attempt will be successful. These results suggest that the problem of imaginary plots used
by repressive regimes is not sufficient to contaminate the results. Because the number of
attempts and of successful coups is considerably smaller than the number of plots, the
significance levels of the variables are lower. However, it seems reasonable to regard the
core results for plots as capturing the basic causal story, with the qualification that it
underplays the importance of low income.
We now attempt to extend the analysis to the effects of military spending. We investigate
whether the size of the military, and military pay and conditions, affect the risk of a coup.
Both of these encounter evident problems of potential endogeneity. As discussed in
Section 2, the standard response to coup risk is supposedly to have a sufficiently large
military establishment to permit division into several rival components, so that no one
group of commanders can be sure of success. More prosaically, in response to coup risk
political leaders may simply raise the pay and conditions of the military.

15
We first analyze the size of the military. We proxy this by the share of military spending
in GDP. Consistent data on military spending are limited. Since our analysis is inherently
constrained by the number of plots, it is important to preserve sample size to the extent
possible. We therefore combine the two SIPRI data sets on military spending,
recognizing that the two data sources are not entirely consistent.
When military spending is introduced directly into our core regression it is insignificant
(Table 4, column 1). However, this may be due to endogeneity. We have recently
developed a regression of military spending on global data for developing countries
(Collier and Hoeffler, 2005). We find that military spending is well explained by a few
variables such as previous participation in an international war, and the military spending
of neighbors. At the present stage in our analysis we simply use the predicted level of
military spending generated by this regression for each period and country in Africa. We
should add a note of caution here: the resulting variable is a generated regressor, and we
have not yet had time to correct the standard errors of our results. With this important
qualification, the results are reported in Table 4, column 2. So instrumented, military
spending is now positive and significant: a large military actually appears to increase the
risk of a coup plot. This is not necessarily implausible: in a large military there are simply
more potential groups that might harbor resentments or ambitions.
Next, we attempt to investigate the effect of military conditions. We do not have direct
data on military pay. However, for a limited number of countries we do have the number
of military personnel, and so the best that we can do is to use as a proxy the level of
military spending relative to the number of personnel. We measure this in dollars per
‘soldier’ per year. This measure is subject to very evident weaknesses. If a government
spends heavily on military capital equipment, such as planes, this will show up in our
data as high spending per soldier and so appear to indicate a high salary. The best we can
hope for is that when the military budget per soldier is large, personnel are able to extract
some salary advantage.

16
When our proxy for military conditions is added directly into the core regression it is
insignificant (Table 4, column 3). However, this again may reflect endogeneity. We
therefore attempt to instrument for military conditions using an IV approach. We apply
the two stage probit least squares procedure as suggested by Keshk (2003). For this we
need variables which are likely to affect the current level of military conditions but do not
directly affect the current risk of a coup plot. We investigated three such possible
variables. The first is the colonial origin of the country. Specifically, Francophone
countries tended to have much higher public sector pay levels and this might be reflected
in military pay. The second is the cumulative experience of inflation since independence,
excluding current inflation. The idea here is that high past inflation may have loosened up
inherited pay structures. The third is the cumulative number of years, excluding the
present, that the government has been military: perhaps indicating that such previous
regimes have favored military salaries. The instrumentation regression is reported in
Appendix 1. So instrumented, when our proxy for military conditions is added to our core
regression it is insignificant, and indeed positive. To the extent that we can tell, better
military conditions do not reduce the risk of a coup plot. While this is a counter-intuitive
result, there are perhaps reasons why better military conditions would not reduce risk.
The intuitive approach rests on the importance of grievance: bad conditions provide a
reason to participate in a coup plot that we can appreciate and even sympathize with.
However, better military conditions may also elevate the status of the military in society
and give commanders aspirations for a wider role. Or better conditions may help to make
ordinary soldiers more cohesive and subject to the discipline of commanders, and so be
more reliable followers of their commanders’ aspirations. We should stress that this result
is work-in-progress and that we hope to get more robust results in due course.
Interpretation
We now consider the results in terms of the theory discussed in Section 2. The most
striking aspect of our results is surely the overall similarity between the factors that make
a country prone to coups and those that make it prone to rebellion. All of the components
of our core regression, with the exception of time since Independence which in any case

17
has a very small effect, are also components of our core regression of rebellion. There is,
in effect, a common core of factors inducing violent, illegitimate challenges to a regime.
The second striking feature is that this common core is predominantly economic rather
than political or social conditions. Both the level and the growth rate of per capita income
powerfully affect the risk of a coup. This provides us with a rather straightforward
explanation as to why Africa has been far more subject to coups than other regions: it has
had a markedly worse economic performance. This is reinforced by the only social
characteristic of importance – ethnic dominance. Because Africa has so much more
ethnic diversity than other regions, it is actually less characterized by ethnic dominance
than other regions. Hence, ethnic composition does not provide a satisfactory account of
why Africa has been coup-prone.
The fourth of the core explanatory variables, the time since the most recent coup, gives
rise to a strong coup trap. This, rather than a pure time trend, is the key temporal
dimension of the story. If a country can for whatever reason avoid a coup plot, it
gradually becomes much easier to avoid them. By contrast, some countries are highly
coup-prone, not because of a fixed effect, but because they never break out of the high
risk environment which prevails in the recent aftermath of a plot. The risk of rebellion
has the same feature. Happily, there is a favorable pure time trend, albeit small. This may
reflect domestic change, such as the gradual consolidation of regime power following
Independence, or the influence of international standards, since coups have clearly
become much less common elsewhere in the world.
Three variables are significant in explaining the risk of rebellion, but not the risk of coup
plots. The first of these is natural resource or primary commodity exports. One possible
explanation for this difference, as discussed in Section 2 equations 3 and 3a, is that,
regardless of their motive, rebellions need a source of finance whereas coups do not.
Predation of commodity exports is a standard source of rebel finance. The fact that
natural resource rents, or indeed oil, have no significant effect on coup risk suggests that
consideration for coup leaders or is offset by other factors. To investigate this further we
18
test hypothesis (1a) that, if greed is the key motivation, aid should be significant in
increasing proneness to coups. In Table 4, column 5 we include lagged aid as a
percentage of GDP. It has a negative sign and is significant at the ten percent level.
However, because aid is likely to be endogenous we instrument it. Following Tavares
(2003) we have already developed good instruments for aid in our previous work (Collier
and Hoeffler, 2005). Our instruments for aid received include the aid provided by the
largest five bilateral donors and their geographic, political and cultural distance from the
recipients. As with military conditions, we use a two stage Probit least squares
methodology (Keshk, 2003). Aid so instrumented is insignificant, consistent with the
absence of an effect from natural resource rents. When aid is entered without being
instrumented it is significantly negative. This difference suggests that aid is indeed
endogenous: donors successfully reduce aid in coup-prone times, but this does directly
add to the risk of a coup. Indirectly, a reduction in aid might nevertheless increase the
risk of a coup through its effect on the growth rate.
The second factor significant for rebellions but not for coups is the geographic dispersion
of the population. Again this is readily explicable in terms of the differential effects of
population dispersion on the feasibility of rebellions and coups. Rebellions need space in
which to hide from the government military, whether this is mountains or simply areas
that are remote. Such geographic aids to rebellion are likely to be irrelevant for coup
plots.
The third factor significant for rebellion but not for coups is social fractionalization.
Controlling for ethnic dominance, the more fragmented is a society by ethnic and
religious differences the less likely it is to have a rebellion. In previous work we have
suggested that that this may be because it becomes harder to achieve the minimum scale
of rebellion needed for survival as the society becomes more fractionalized. For whatever
reason, this does not seem to matter for the risk of coup plots. Perhaps this is because
typically, African armies are recruited selectively rather than being representative of the
composition of the society, so that social fractionalization in the nation does not carry
over into social fractionalization in the army.

19
What do these results imply for distinguishing between greed, grievance and feasibility?
Why should low income and low growth so consistently make countries prone to violent
illegitimate challenge, whether through rebellion or through coup plots? These two
economic variables can be interpreted in multiple ways. If we want to gloss them in terms
of ‘greed’, low income and slow growth can be interpreted as proxies for a lack of
opportunities other than those provided by controlling the state. The lack of significance
of natural resource rents and aid as explanatory variables argues against a greed-based
interpretation, but it might be that in societies that are both poor and stagnant, the rents to
sovereignty of even the most impoverished state are massively attractive relative to other
opportunities. The dream of being president may be relatively more alluring in the
Central African Republic than in the USA. The economic variables can also be
interpreted as grounds for national grievance since they translate into mass poverty and
hopelessness. The problem with such a grievance-based interpretation is the lack of
significance for the more straightforward proxies for grievance: political repression and
inequality. Low income and slow growth can also be interpreted as proxying a weak state
and so contributing to the feasibility of challenging the regime. This is the interpretation
put on the economic factors contributing to civil war risk by Fearon and Laitin (2003).
Our result that low income makes it more likely that plots turn into attempts, and that
attempts turn into successful coups, is perhaps most readily interpreted in these terms, as
indicating the importance of state weakness. In effect, plots happen where the state is not
sufficiently effective to be able to prevent them.
The strength of coup traps is consistent with the importance of legitimacy acquired over
time. However, if legitimacy is the explanation, the lack of any effect from
democratization suggests that domestic sources of legitimacy are rather different from
international sources.

20
4. Conclusion and Policy Implications
In popular liberal opinion coups are generally seen as a curse, since they emanate from
the army, whereas rebellions are frequently seen as heroic. This paper has attempted to
investigate whether such a distinction seems justified by differences in their causes.
In Africa coup plots are by far the most common challenge to the continuity of regimes.
This may reflect the evident fact that the typical coup is a lot less damaging to the society
than the typical civil war, and a lot less costly for its perpetrators. Nevertheless, the most
striking aspect of our results is the similarity in the causes of coups and rebellions. In
neither do standard indicators of grievance such as political repression and economic
inequality feature as significant influences. A common core of economic factors
underpins proneness to coups and rebellions: low income and a lack of growth. Both are
also subject to ‘traps’ – once a coup or rebellion has occurred, further events are much
more likely. We have attempted to investigate whether policies that favor the military
reduce the risk of coups, but have found that if anything, their effect is perverse: high
military spending may even increase the risk of a coup.
What are the policy implications of our analysis? It is now commonplace to ascribe
Africa’s economic problems at least in part to its poor governance. The prevalence of
coups, and the policy distortions introduced by the fear of coups are surely a part of this
poor governance. Yet we have found evidence for reversing popular causality: poor
governance, at least as proxied by coup risk, has its foundations in poor economic
performance. On our evidence, Africa looks more likely to be saved from the menace of
coups if it could achieve economic growth than by further political reform. The evident
limited appeal of economic reform for most African governments may reflect a failure to
appreciate the importance of good economic performance for their own security.

21
References Barro, R. J. ed. 1997. Determinants of Economic Growth. Cambridge, MA: MIT Press. Barrett, D. B., ed. 1982. World Christian Encyclopedia. Oxford: Oxford University Press. Collier, Paul and Anke Hoeffler. 2004 Greed and Grievance in Civil Wars. Oxford Economic Papers 56: 663-595. ----- and -----. 2005. Unintended Consequences: Does Aid Promote Arms Races? Mimeo. ----- and -----. 2005a. Military Expenditure in Post-Conflict Societies. Economics of Governance, forthcoming. Fosu, A. 2001 Political instability and economic growth in developing economies: some specification empirics. Economics Letters, Volume 70(2): 289-294. Fearon, J. and D. Laitin. 2003. Ethnicity, Insurgency, and Civil War. American Political Science Review 97(1): 75- 90. Hamilton, K. and M. Clemens. 1998. Genuine Saving Rates in Developing Countries, Worldbank, Washington D.C. available on http://lnweb18.worldbank.org/ESSD/envext.nsf/44ByDocName/GreenAccountingAdjustedNetSavings Jaggers, K. and T. R. Gurr. 1995. ‘Tracking Democracy's Third Wave with the Polity III Data’. Journal of Peace Research 32:469-482. Keshk, O. M. G. 2003. CDSIMEQ: A Program to Implement Two-stage Probit Least Squares. Stata Journal, 3(2), 157-167. Luttwak, Edward. 1968. Coup D’Etat: A Practical Handbook. London: Penguin Press. Mauro, P. 1995. ‘Corruption and Growth’. The Quarterly Journal of Economics 110:681-712. McGowan, Patrick J. 2003. African military coups d’etat, 1956-2001: frequency, trends and distribution. Journal of Modern African Studies 41(3): 339-370. O’Kane, Rosemary H.T. 1981. A Probabilistic Approach to the Causes of Coups d’Etat. British Journal of Political Science 11 (3): 287-308. Tavares, J. 2003. Does Foreign Aid Corrupt? Economics Letters 79: 99-106.

22
Tables Table 1: Determinants of Plots (1) (2) (3) (4) (5) (6) Per capita -0.102 -0.099 -0.084 -0.115 -0.097 -0.078 income t-1 (0.010)** (0.031)** (0.082)* (0.010)** (0.018)** (0.076)* Growth t-1 -0.012 -0.027 -0.002 -0.011 -0.012 -0.013 (0.023)** (0.003)*** (0.695) (0.044)** (0.026)** (0.018)** Ethnic 0.146 0.181 0.116 0.131 0.153 0.158 dominance (0.015)** (0.005)*** (0.140) (0.046)** (0.012)** (0.009)*** Time since last -0.0001 -0.0001 -0.0001 -0.0001 -0.0001 -0.0001 plot (0.000)*** (0.000)*** (0.000)*** (0.000)*** (0.000)*** (0.000)*** Years since -0.000 -0.000 0.003 -0.000 -0.000 -0.000 Independence (0.065)* (0.203) (0.037)** (0.071)* (0.061)* (0.074)* Polity t-1 0.000 (0.940) Geographic 0.018 Concentration (0.913) Social 0.000 Fractionalization (0.290) Natural 0.001 Resource Rents (0.711) Income 0.003 Inequality (0.475) Observations 6970 5835 4640 6000 6970 6780 No of events 254 Notes: Probit estimation. Robust p values in parentheses, * significant at 10%; ** significant at 5%; *** significant at 1%.

23
Table 2: Determinants of Plots (Annual Data) (1) (2) (3) Probit Poisson Ordered
Probit Per capita -0.078 -0.100 -0.106 income t-1 (0.249) (0.350) (0.110) Growth t-1 -0.013 -0.016 -0.009 (0.179) (0.202) (0.287) Ethnic 0.133 0.260 0.096 dominance (0.148) (0.062)* (0.274) Time since last -0.0003 -0.001 -0.0003 plot (0.000)*** (0.000)*** (0.000)*** Years since Independence -0.000 -0.001 -0.000 (0.164) (0.211) (0.167) Observations 1394 1394 1394 No of events 196 196 196 Notes: p values in parentheses, * significant at 10%; ** significant at 5%; *** significant at 1%.
Table 3: Coup Attempts and Coups d’Etat (1) (2) (3) (4) Attempt Coup Plots/Attempts Attempts/Coups Per capita income t-1 -0.179 -0.235 -0.266 -0.522 (0.000)*** (0.001)*** (0.051)* (0.033)** Growth t-1 -0.009 -0.009 0.005 0.012 (0.160) (0.421) (0.789) (0.684) Ethnic dominance 0.076 0.126 -0.241 0.378 (0.303) (0.196) (0.145) (0.101) Time since last event -0.000 -0.000 0.000 0.000 (0.000)*** (0.002)*** (0.556) (0.005)*** Years since Independence -0.000 -0.004 0.000 -0.011 (0.153) (0.314) (0.860) (0.310) Observations 6970 6970 254 144 No of events 144 61 144 61 Notes: Probit estimation. Robust p values in parentheses, * significant at 10%; ** significant at 5%; *** significant at 1%.

24
Table 4: Military Expenditure, Military Conditions and Aid (1) (2) (3) (4) (5) (6) Probit Includes
generated regressor
Probit 2 stage Probit Least Square
Probit 2 stage Probit Least Square
Per capita -0.101 -0.100 0.169 -0.522 -0.142 -0.133
income t-1 (0.037)** (0.069)* (0.253) (0.296) (0.002)*** (0.017)**
Growth t-1 -0.020 -0.027 -0.018 0.004 -0.023 -0.022 (0.007)*** (0.006)*** (0.545) (0.938) (0.011)** (0.019)** Ethnic 0.232 0.131 0.146 0.220 0.182 0.182 dominance (0.001)*** (0.075)* (0.599) (0.478) (0.005)*** (0.006)*** Time since last -0.0001 -0.0001 -0.00003 -0.0001 -0.0001 -0.0001 plot (0.000)*** (0.000)*** (0.394) (0.112) (0.000)*** (0.000)*** Years since -0.000 -0.000 0.000 -0.001 -0.0004 -0.0004 Independence (0.049)** (0.053)* (0.918) (0.297) (0.065)* (0.108) Military -0.006 0.237 Expenditure (0.652) (0.045)** Military -0.000 0.00006 Conditions (0.115) (0.296) Aid -0.005 -0.002 (0.075)* (0.629) Observations 5560 4630 775 775 5330 5330 Notes: p values in parentheses, * significant at 10%; ** significant at 5%; *** significant at 1%.
25
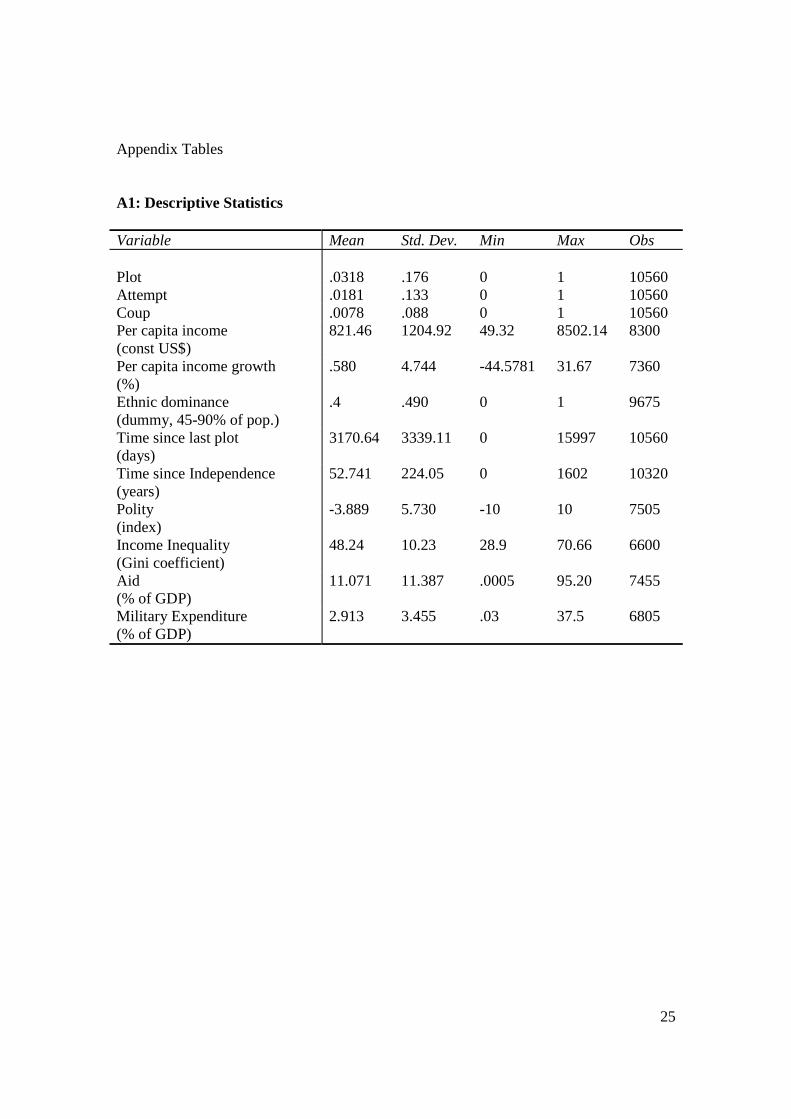
Appendix Tables A1: Descriptive Statistics Variable Mean Std. Dev. Min Max Obs Plot .0318 .176 0 1 10560 Attempt .0181 .133 0 1 10560 Coup .0078 .088 0 1 10560 Per capita income (const US$)
821.46 1204.92 49.32 8502.14 8300
Per capita income growth (%)
.580 4.744 -44.5781 31.67 7360
Ethnic dominance (dummy, 45-90% of pop.)
.4 .490 0 1 9675
Time since last plot (days)
3170.64 3339.11 0 15997 10560
Time since Independence (years)
52.741 224.05 0 1602 10320
Polity (index)
-3.889 5.730 -10 10 7505
Income Inequality (Gini coefficient)
48.24 10.23 28.9 70.66 6600
Aid (% of GDP)
11.071 11.387 .0005 95.20 7455
Military Expenditure (% of GDP)
2.913 3.455 .03 37.5 6805

26
Table A2: Instrumenting Military Conditions and Aid: First Stage Regressions (1) (2) Military Conditons Aid
Per capita income t-1 8380.34 -4.168
(0.000)*** (0.000)*** Growth t-1 -386.5 -0.080 (0.000)*** (0.007)*** Ethnic dominance -1440.54 1.136 (0.000)*** (0.000)*** Time since last plot 0.553 0.0003 (0.000)*** (0.000)*** Years since independence 5.192 -0.0001 (0.000)*** (0.856) Cumulated inflation 0.101 (0.000)*** Ex-French colony 5269.74 (0.000)*** Cumulated military leadership 210.500 (0.000)*** French Aid x language -0.567 (0.000)*** French Aid x religion -0.332 (0.001)*** French Aid x distance 13179.1 (0.000)*** French Aid x pol. similarity -0.297 (0.000)*** UK Aid x language -1.084 (0.000)*** UK Aid x distance 2877.463 (0.000)*** US Aid x distance -1203.441 (0.000)*** Japanese x distance 5994.791 (0.000)*** German Aid x religion 0.659 (0.000)*** German Aid x distance -4146.222 (0.000)*** Adj R2 0.81 0.54 Observations 775 5330
Notes: First stage regression results, p values p values in parentheses, * significant at 10%; ** significant at 5%; *** significant at 1%.

27
Data Sources: Coups d’Etat, attempted coups and plots Source: McGowan, 2003. Economic growth Using WDI 2003 data for GDP per capita we calculated the annual growth rates. GDP per capita We measure GDP per capita annually. Data are measured in constant 1995 US dollars and the data source is WDI 2003. Natural Resource Rents Using data from the World Bank’s adjusted savings project we calculated the rents for each commodity by subtracting the cost from the commodity price. We then multiplied the rents per unit by the amount extracted and summed across the different commodities. We then calculated the share of rents in GDP. Since the rents are provided in current US dollars we used the WDI 2003 GDP in current dollars to calculate this share. Natural resources for which rent data were available are: oil, gas, coal, lignite, bauxite, copper, iron, lead, nickel, phosphate, tin, zinc, silver and gold. The data are are described in Hamilton and Clemens (1998) and available from: http://lnweb18.worldbank.org/ESSD/envext.nsf/44ByDocName/GreenAccountingAdjustedNetSavings Polity ‘Polity’ is the combined score of democracy and autocracy and ranges from –10 (least democratic) to +10 (most democratic). The data are described in Jaggers and Gurr (1995). Source: http://www.cidcm.umd.edu/polity/index.html. Geographic Dispersion of the Population We constructed a dispersion index of the population on a country by country basis. Based on population data for 400km2 cells we generated a Gini coefficient of population dispersion for each country. A value of 0 indicates that the population is evenly distributed across the country and a value of 1 indicates that the total population is concentrated in one area. Data is available for 1990 and 1995. For years prior to 1990 we used the 1990 data. We would like to thank Uwe Deichman of the World Bank’s Geographic Information System Unit for generating this data. He used the following data sources: Center for International Earth Science Information Network (CIESIN), Columbia University; International Food Policy Research Institute (IFPRI); and World Resources Institute (WRI). 2000. Gridded Population of the World (GPW), Version 2. Palisades, NY: IESIN, Columbia University. Available at http://sedac.ciesin.org/plue/gpw. Ethnolinguistic and religious fractionalization We proxy social fractionalization in a combined measure of ethnic and religious fractionalization. Ethnic fractionalization is measured by the ethno-linguistic fractionalization index. It measures the probability that two randomly drawn individuals

28
from a given country do not speak the same language. Data are only available for 1960. In the economics literature this measure was first used by Mauro (1995). Using data from Barrett (1982) on religious affiliations we constructed an analogous religious fractionalization index. Following Barro (1997) we aggregated the various religious affiliations into nine categories: Catholic, Protestant, Muslim, Jew, Hindu, Buddhist, Eastern Religions (other than Buddhist), Indigenous Religions and no religious affiliation. The fractionalization indices range from zero to 100. A value of zero indicates that the society is completely homogenous whereas a value of 100 would characterize a completely heterogeneous society. We calculated our social fractionalization index as the product of the ethno-linguistic fractionalization and the religious fractionalization index plus the ethno-linguistic or the religious fractionalization index, whichever is the greater. By adding either index we avoid classifying a country as homogenous (a value of zero) if the country is ethnically homogenous but religiously divers, or vice versa.