course title: marginal and absorption costing
TRANSCRIPT

Professional Development Programme on Enriching Knowledge of the Business, Accounting and Financial Studies
(BAFS) Curriculum <Elective Part>
Course Title: Marginal and Absorption Costing
1
Learning Outcomes
Upon completion of this course, teacher participants should be able to:
•compare and contrast between marginal costing and absorption costing;
•calculate and present net profit under marginal costing and absorption costing; and
•explain and evaluate the uses of marginal costing and absorption costing.
2
Syllabus in HKDSE Examination• Compare the use of marginal and absorption costing in preparing:(i) Manufacturing accounts
(ii) Income statements
• Compare the advantages and disadvantagesof adopting marginal and absorption costing
• Compare the use of marginal and absorption costing in preparing:(i) Manufacturing accounts
(ii) Income statements
• Compare the advantages and disadvantagesof adopting marginal and absorption costing
3
Operating StatementsOperating Statements
Contents• Segregation of cost into variable and fixed elements
(Illustration 1)
• Marginal costing vs. absorption costing (Illustrations 2‐5)
• Normal absorption costing (Illustration 6)
• Overhead absorption rate (Illustration 6)
• Calculation and treatment of overhead over‐absorbed/under‐absorbed (Illustration 6)
• Advantages and disadvantages of marginal costing and absorption costing
• Case study – integrated illustrative question
4
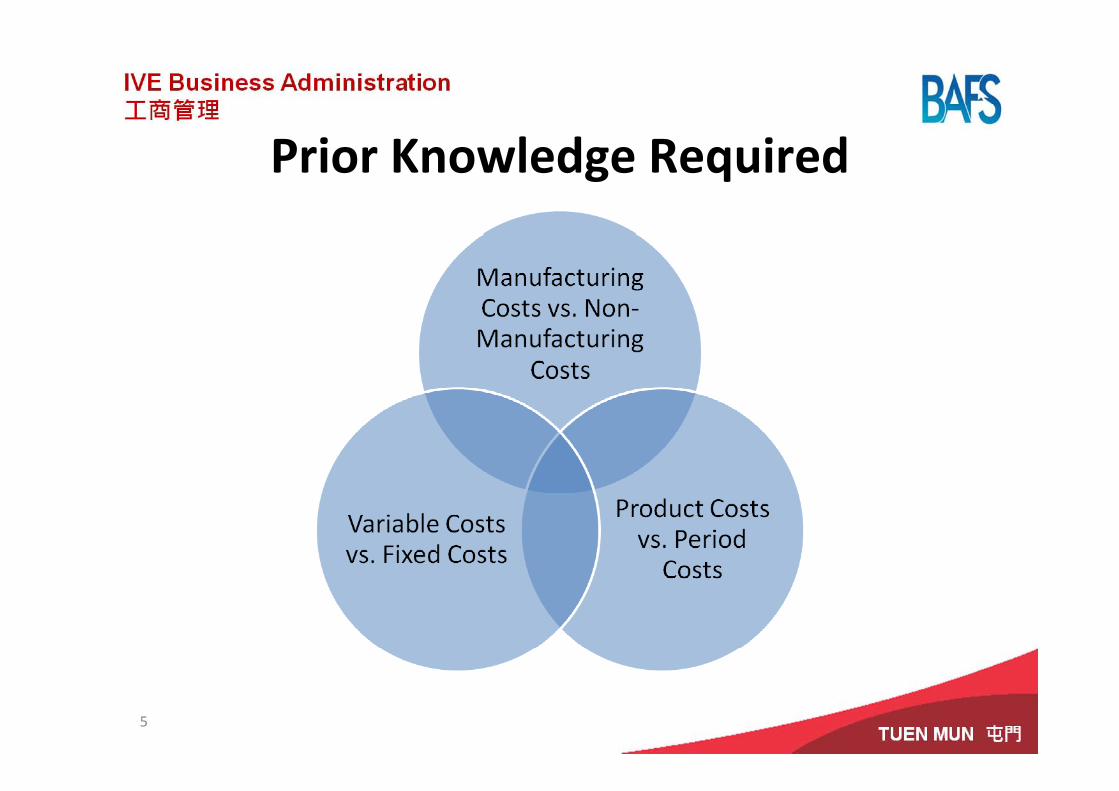
Prior Knowledge Required
5

Segregation of Cost into Variable and Fixed Elements
6

Illustration 1Segregation of Cost into Variable and Fixed Elements
The manufacturing cost varies with production volumes as follows:
7
Production Volume Total Manufacturing Cost
1,000 units $400,000
1,800 units $600,000
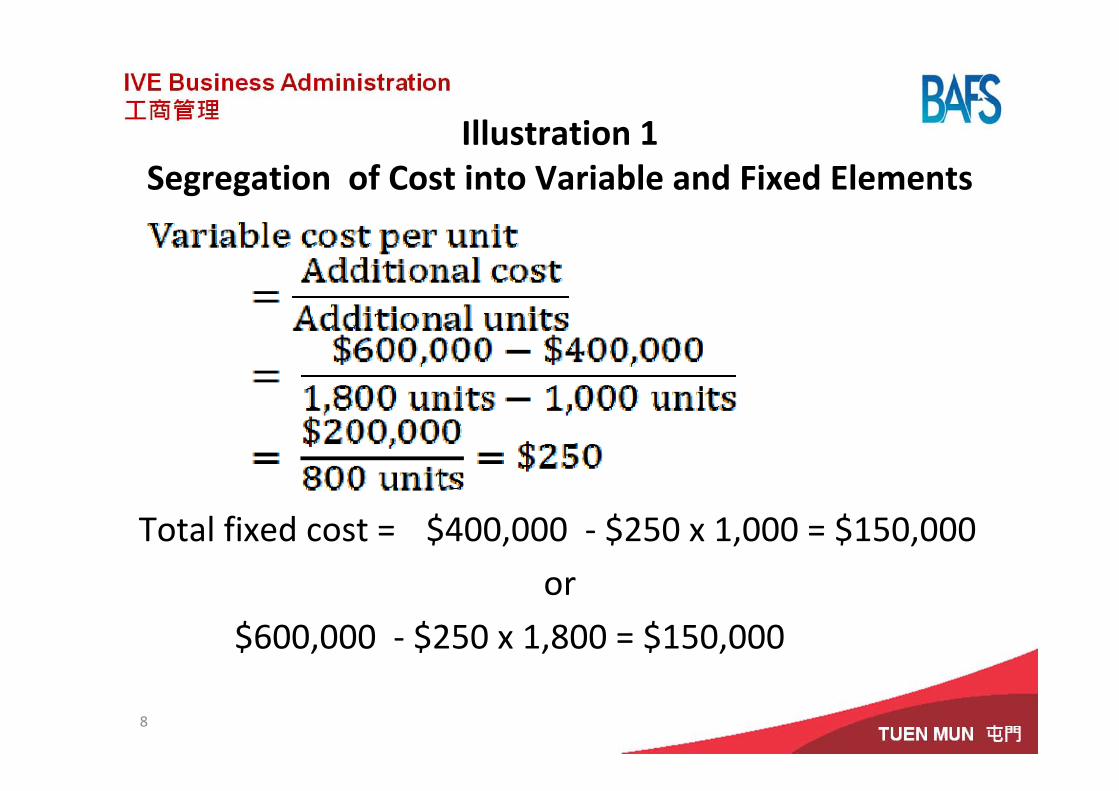
Illustration 1Segregation of Cost into Variable and Fixed Elements
Total fixed cost = $400,000 ‐ $250 x 1,000 = $150,000
or
$600,000 ‐ $250 x 1,800 = $150,000
8
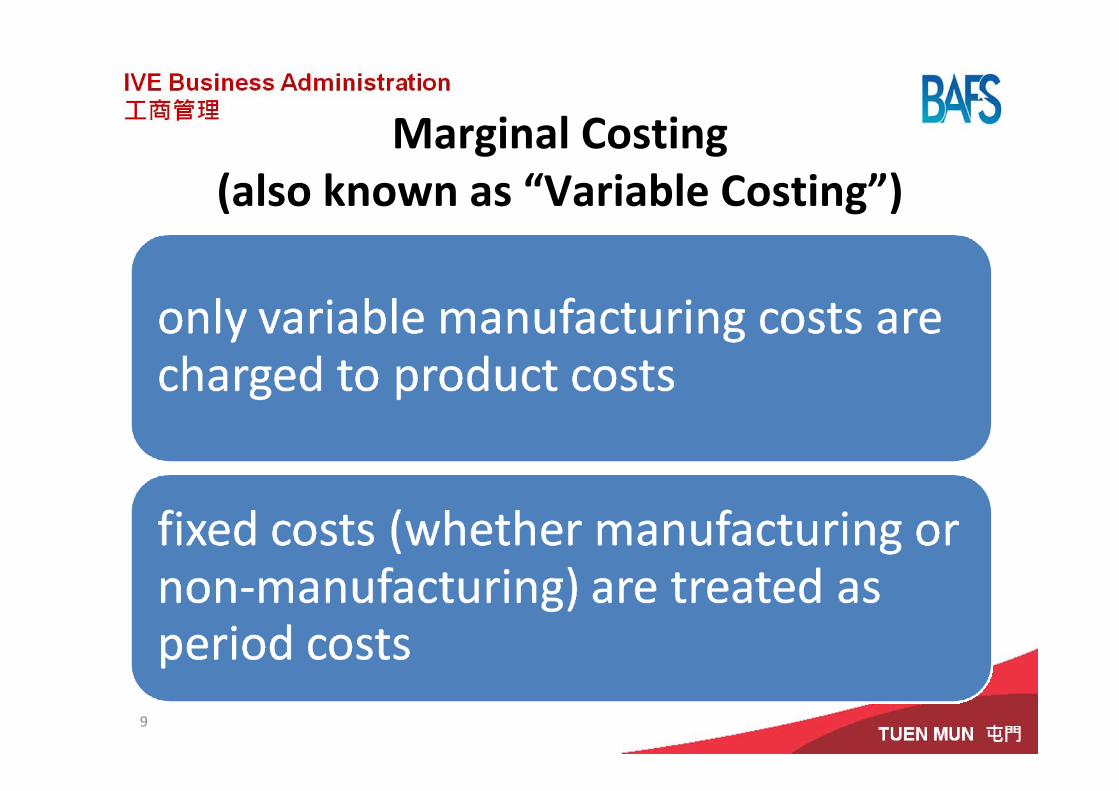
Marginal Costing (also known as “Variable Costing”)
9
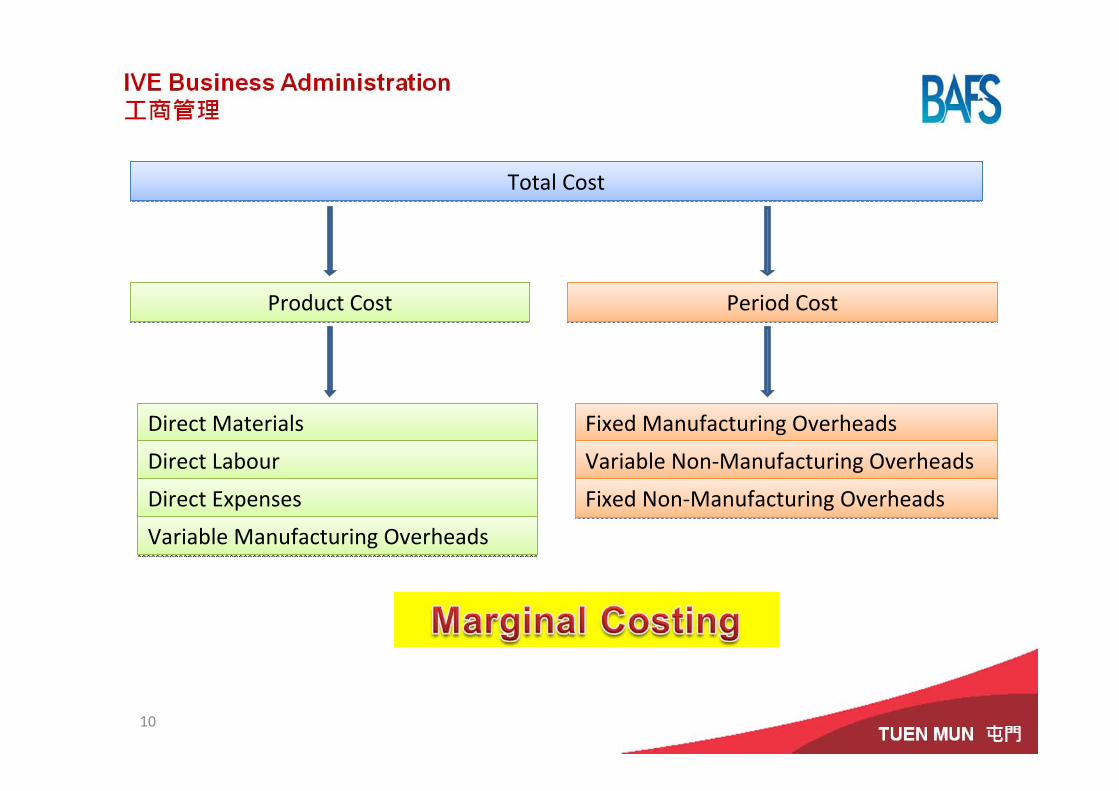
Direct MaterialsDirect Materials
Direct LabourDirect Labour
Direct ExpensesDirect Expenses
Variable Manufacturing OverheadsVariable Manufacturing Overheads
Fixed Manufacturing OverheadsFixed Manufacturing Overheads
Total CostTotal Cost
Product CostProduct Cost Period CostPeriod Cost
Variable Non‐Manufacturing OverheadsVariable Non‐Manufacturing Overheads
Fixed Non‐Manufacturing OverheadsFixed Non‐Manufacturing Overheads
10

Absorption Costing(also known as “Full Costing”)
11
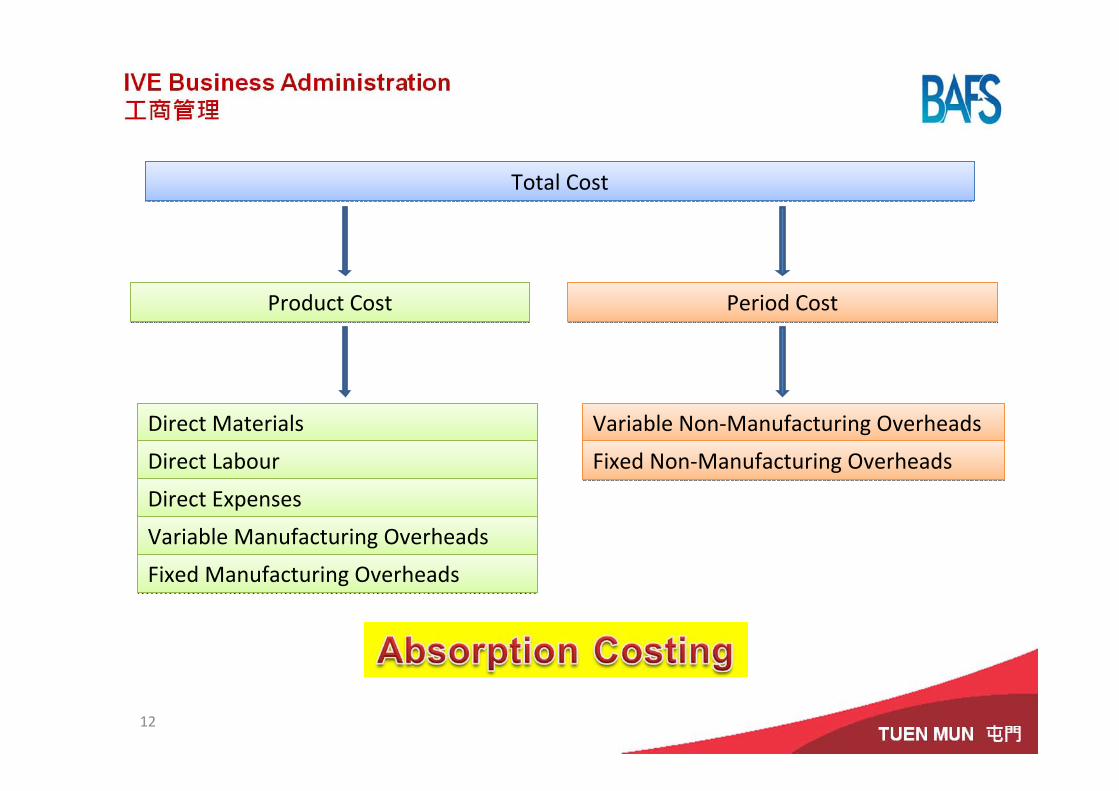
Direct MaterialsDirect Materials
Direct LabourDirect Labour
Direct ExpensesDirect Expenses
Variable Manufacturing OverheadsVariable Manufacturing Overheads
Fixed Manufacturing OverheadsFixed Manufacturing Overheads
Total CostTotal Cost
Product CostProduct Cost Period CostPeriod Cost
Variable Non‐Manufacturing OverheadsVariable Non‐Manufacturing Overheads
Fixed Non‐Manufacturing OverheadsFixed Non‐Manufacturing Overheads
12
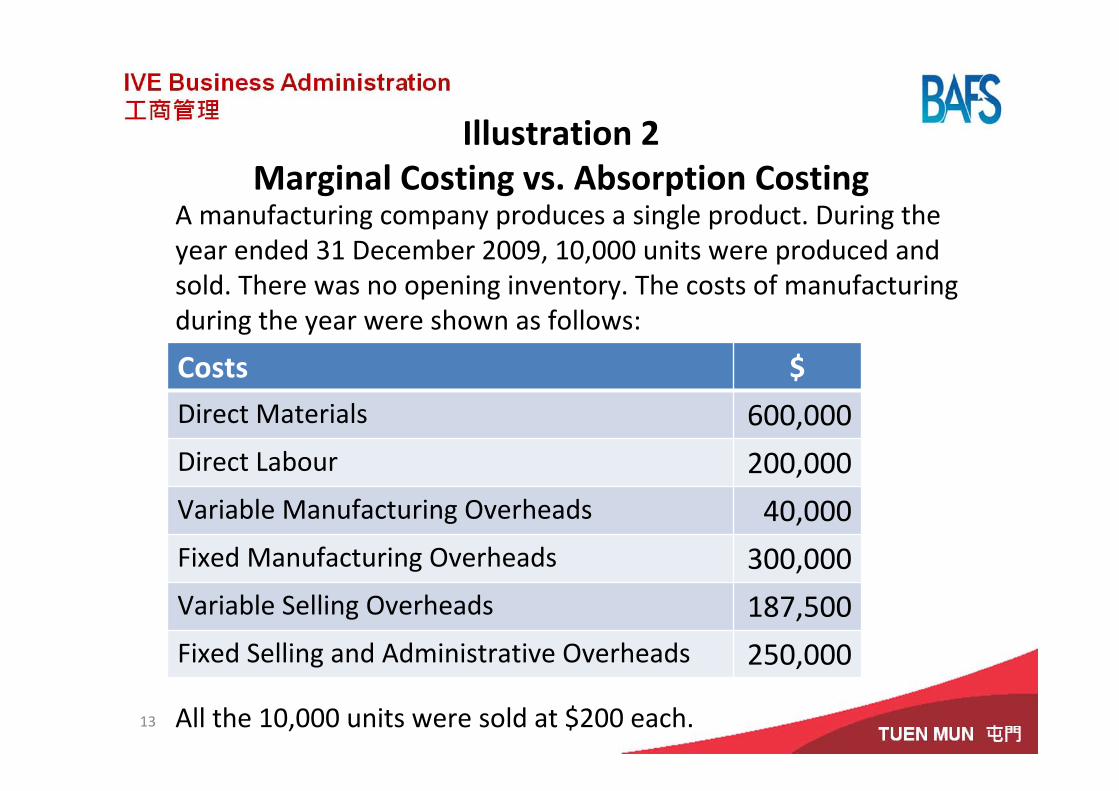
Illustration 2Marginal Costing vs. Absorption Costing
A manufacturing company produces a single product. During the year ended 31 December 2009, 10,000 units were produced and sold. There was no opening inventory. The costs of manufacturingduring the year were shown as follows:
All the 10,000 units were sold at $200 each.
Costs $Direct Materials 600,000Direct Labour 200,000Variable Manufacturing Overheads 40,000Fixed Manufacturing Overheads 300,000Variable Selling Overheads 187,500Fixed Selling and Administrative Overheads 250,000
13
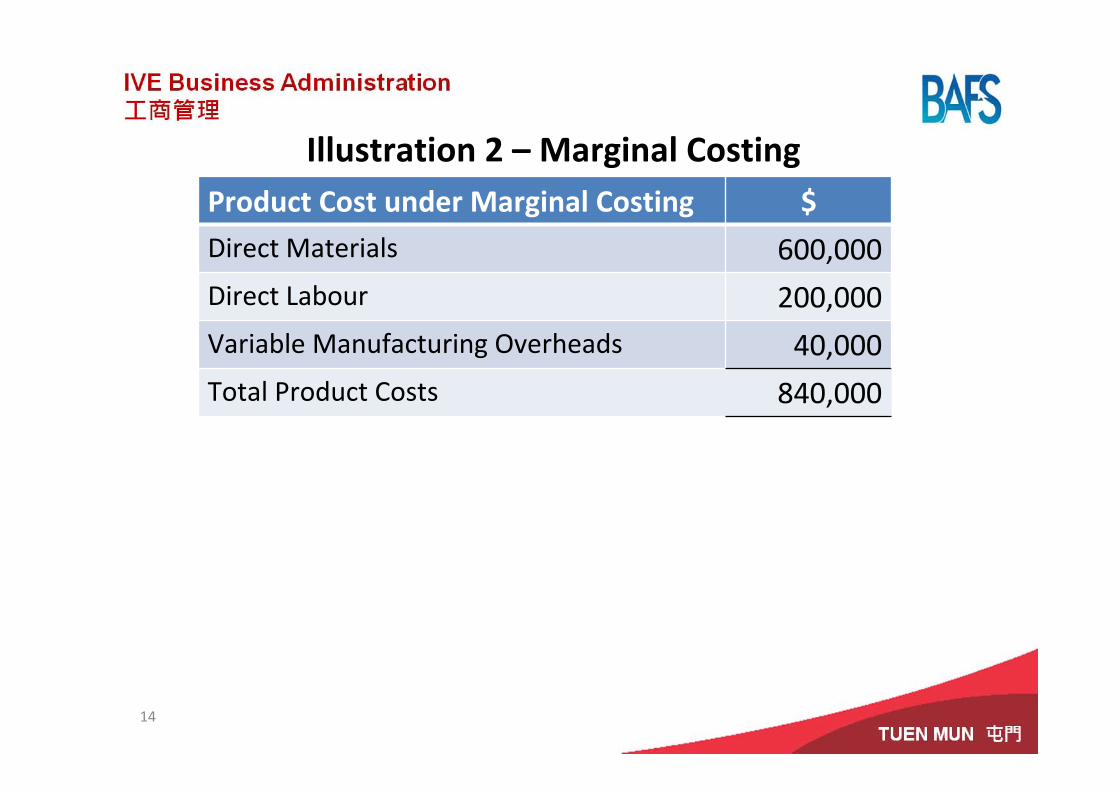
Illustration 2 – Marginal CostingProduct Cost under Marginal Costing $Direct Materials 600,000Direct Labour 200,000Variable Manufacturing Overheads 40,000Total Product Costs 840,000
14

Illustration 2 – Marginal Costing
Period Cost under Marginal Costing $Fixed Manufacturing Overheads 300,000Variable Selling Overheads 187,500Fixed Selling and Administrative Overheads 250,000Total Period Cost charged to Income Statement 737,500
15
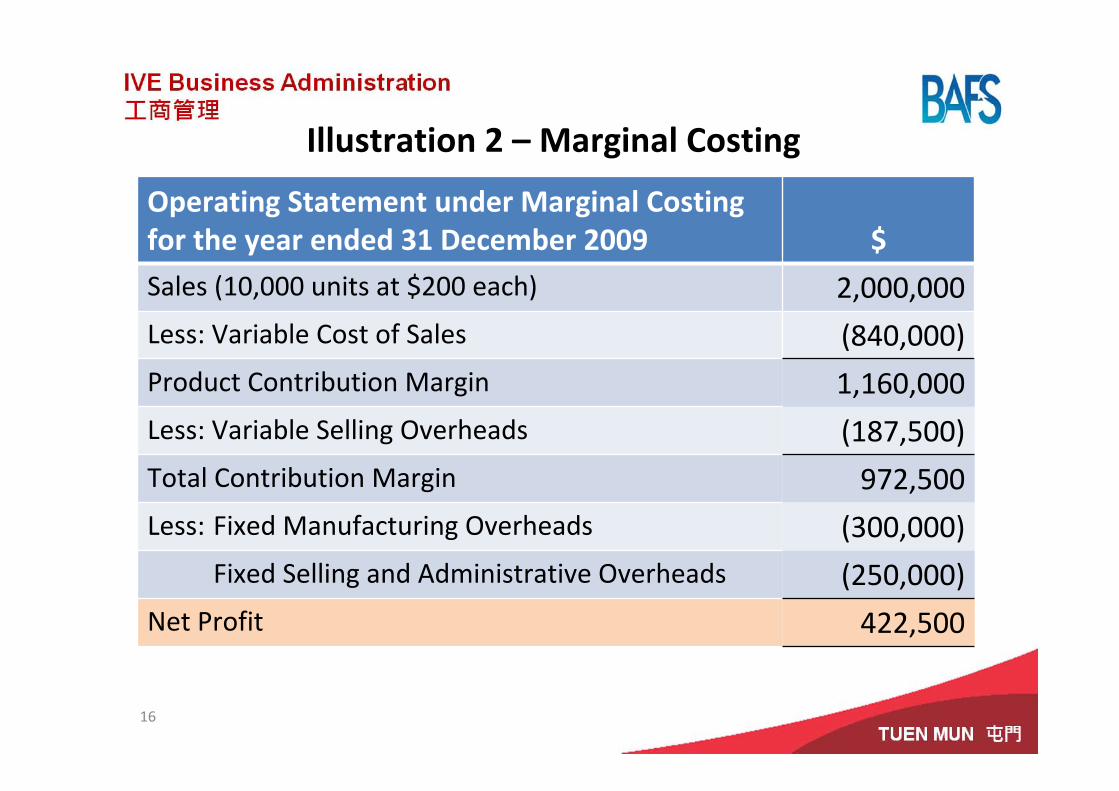
Illustration 2 – Marginal Costing
Operating Statement under Marginal Costingfor the year ended 31 December 2009 $Sales (10,000 units at $200 each) 2,000,000Less: Variable Cost of Sales (840,000)Product Contribution Margin 1,160,000Less: Variable Selling Overheads (187,500)Total Contribution Margin 972,500Less: Fixed Manufacturing Overheads (300,000)
Fixed Selling and Administrative Overheads (250,000)Net Profit 422,500
16
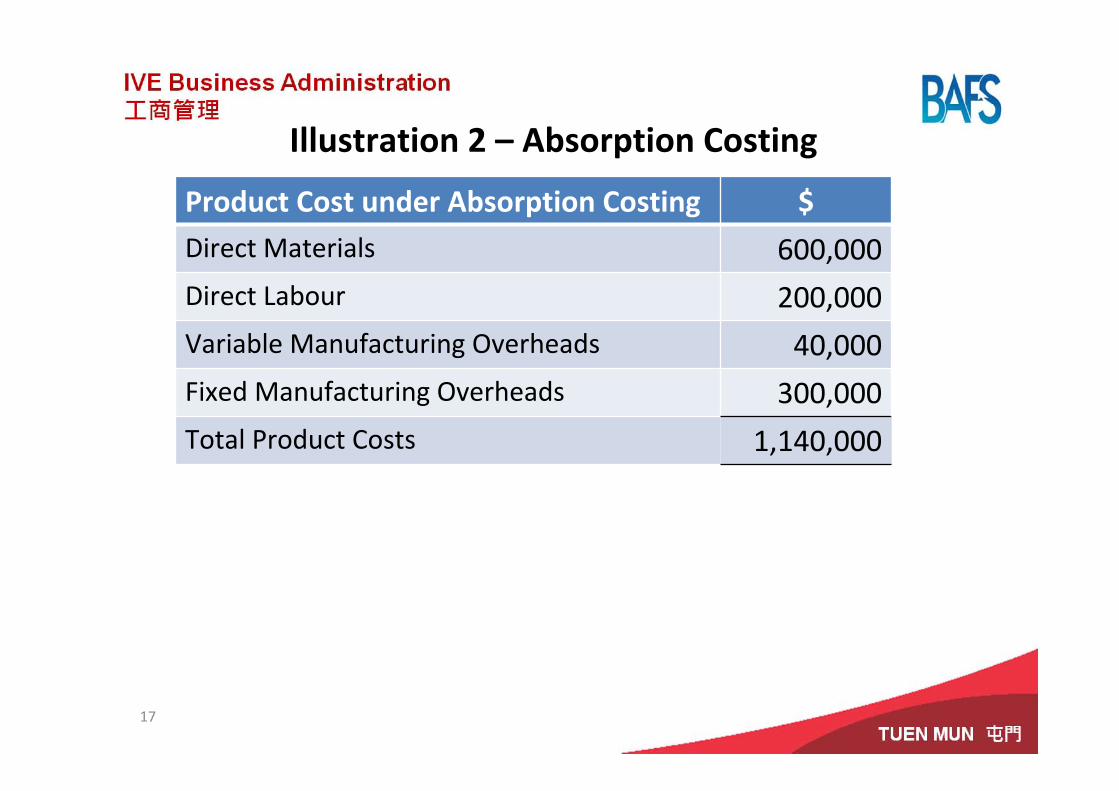
Illustration 2 – Absorption Costing
Product Cost under Absorption Costing $Direct Materials 600,000Direct Labour 200,000Variable Manufacturing Overheads 40,000Fixed Manufacturing Overheads 300,000Total Product Costs 1,140,000
17
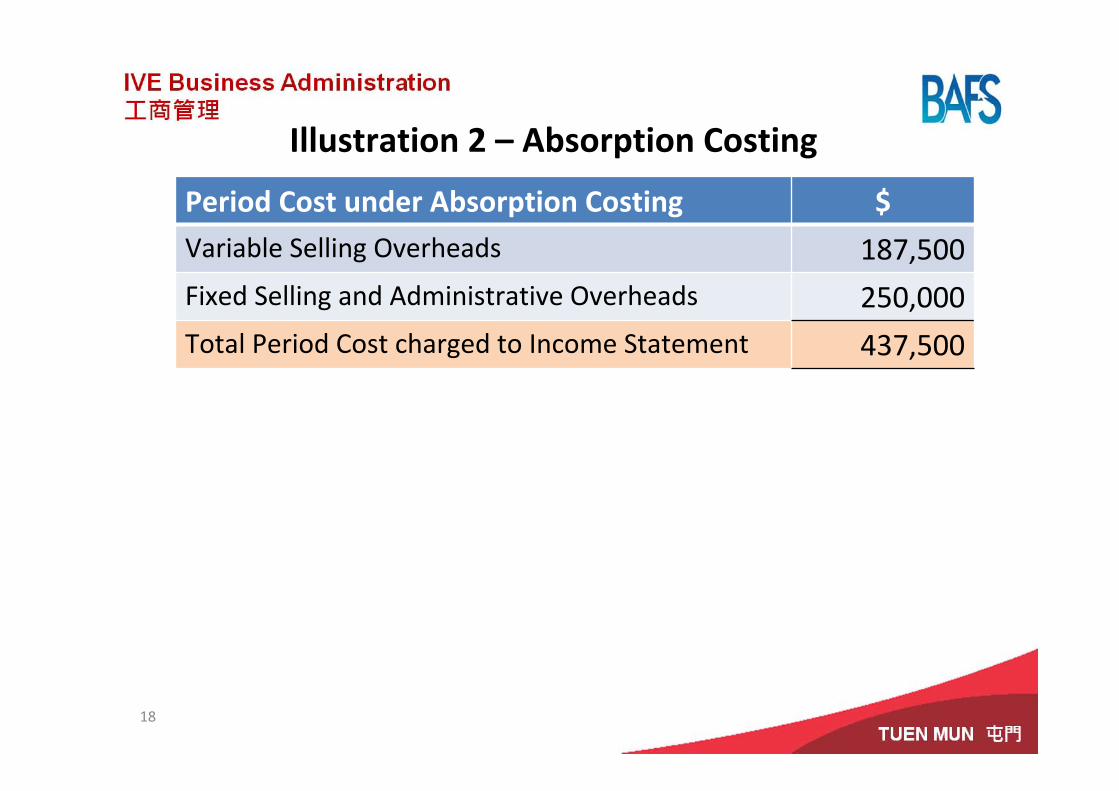
Illustration 2 – Absorption Costing
Period Cost under Absorption Costing $Variable Selling Overheads 187,500Fixed Selling and Administrative Overheads 250,000Total Period Cost charged to Income Statement 437,500
18

Illustration 2 – Absorption Costing
Operating Statement under Absorption Costingfor the year ended 31 December 2009
$Sales (10,000 units at $200 each) 2,000,000Less: Cost of Sales (1,140,000)Gross Profit 860,000Less: Variable Selling Overheads (187,500)
Fixed Selling and Administrative Overheads (250,000)Net Profit 422,500
19
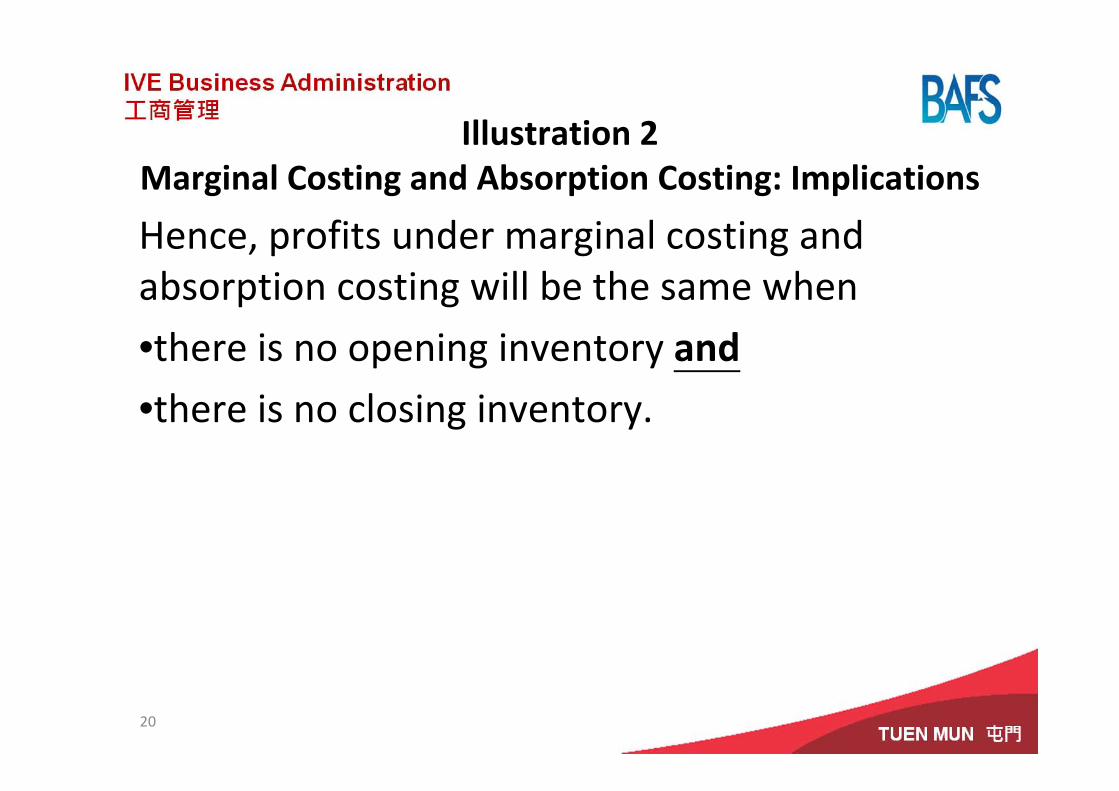
Illustration 2Marginal Costing and Absorption Costing: Implications
Hence, profits under marginal costing and absorption costing will be the same when
•there is no opening inventory and•there is no closing inventory.
20

21
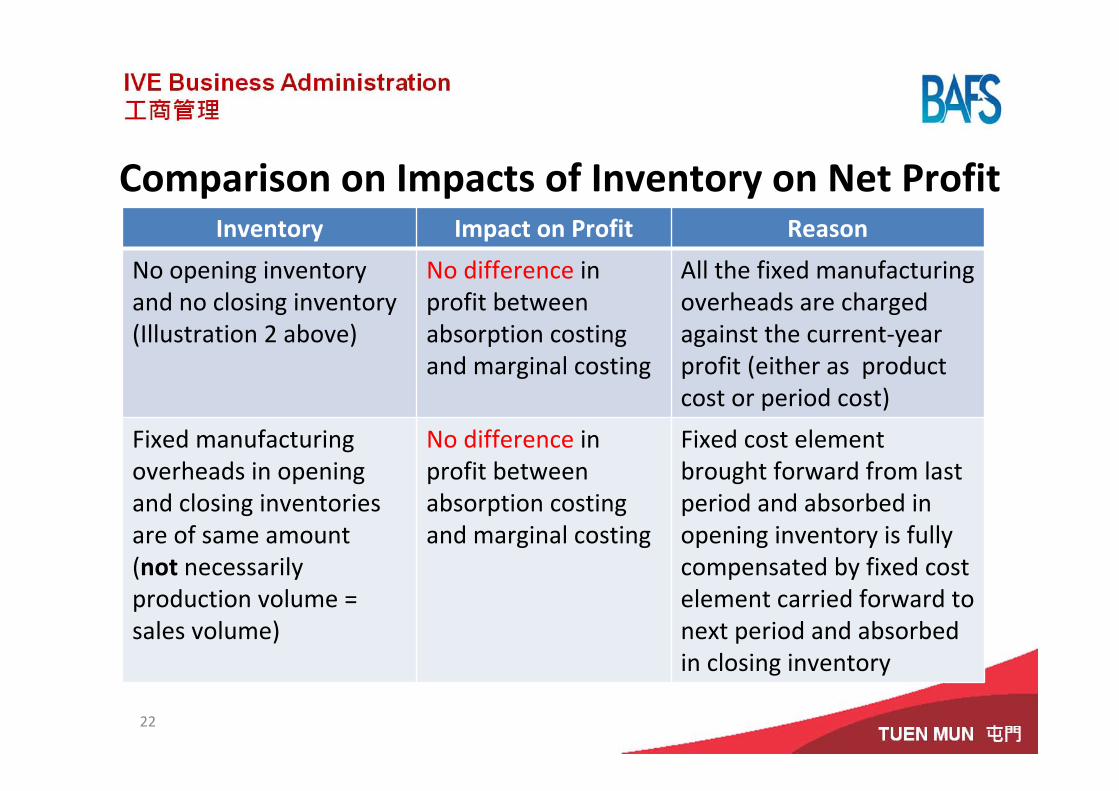
Comparison on Impacts of Inventory on Net ProfitInventory Impact on Profit Reason
No opening inventory and no closing inventory(Illustration 2 above)
No difference in profit between absorption costing and marginal costing
All the fixed manufacturing overheads are charged against the current‐year profit (either as product cost or period cost)
Fixed manufacturing overheads in opening and closing inventories are of same amount(not necessarily production volume = sales volume)
No difference in profit between absorption costing and marginal costing
Fixed cost element brought forward from last period and absorbed in opening inventory is fully compensated by fixed cost element carried forward to next period and absorbed in closing inventory
22
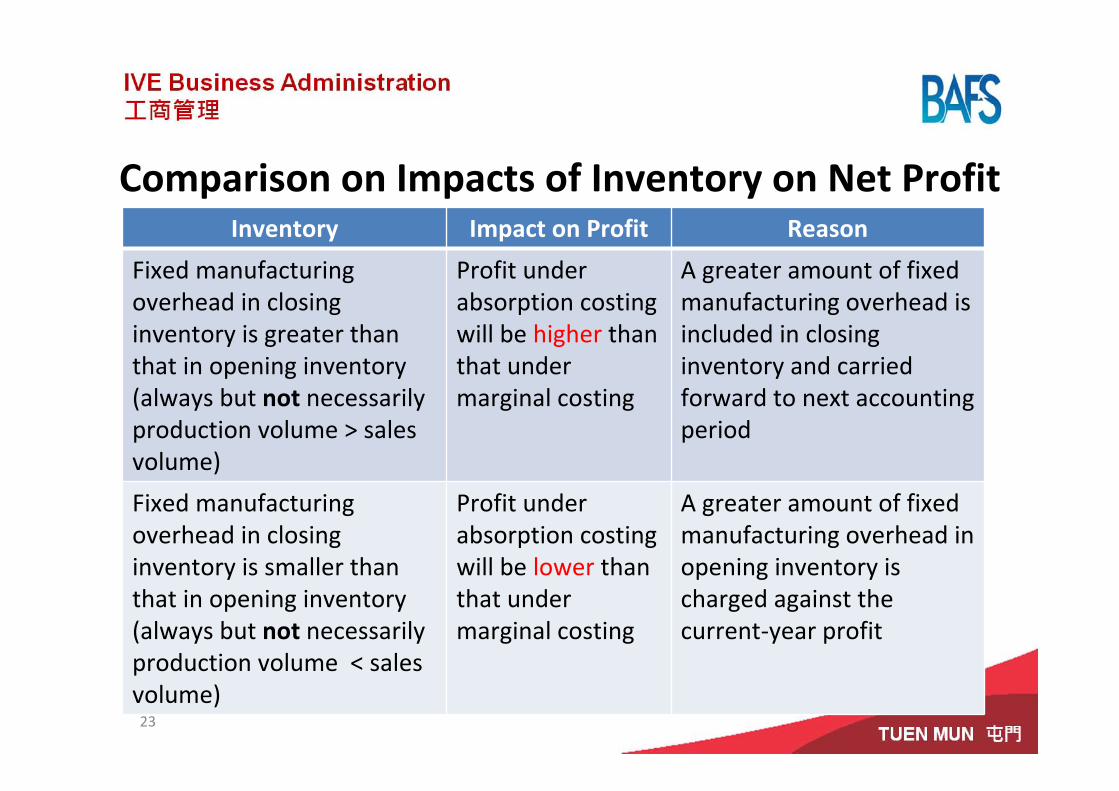
Comparison on Impacts of Inventory on Net ProfitInventory Impact on Profit Reason
Fixed manufacturing overhead in closing inventory is greater than that in opening inventory(always but not necessarily production volume > sales volume)
Profit under absorption costing will be higher than that under marginal costing
A greater amount of fixed manufacturing overhead is included in closing inventory and carried forward to next accounting period
Fixed manufacturing overhead in closing inventory is smaller than that in opening inventory (always but not necessarily production volume < sales volume)
Profit under absorption costingwill be lower than that under marginal costing
A greater amount of fixed manufacturing overhead in opening inventory is charged against the current‐year profit
23
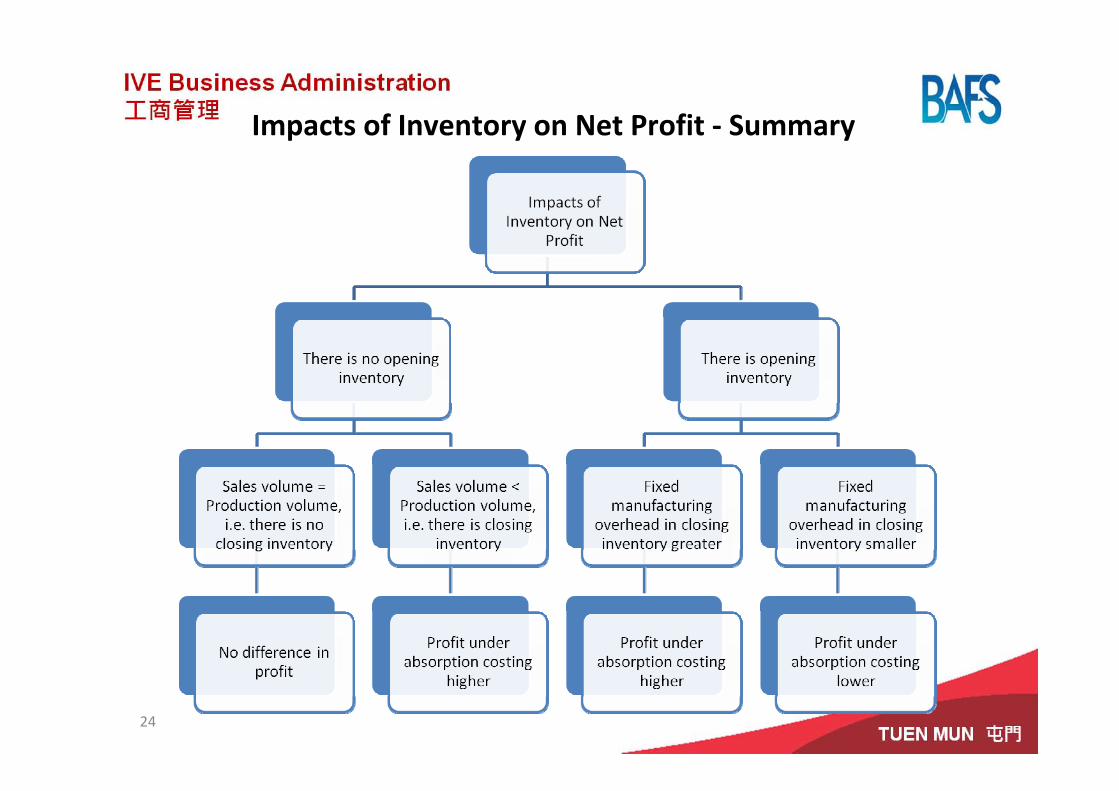
Impacts of Inventory on Net Profit ‐ Summary
24
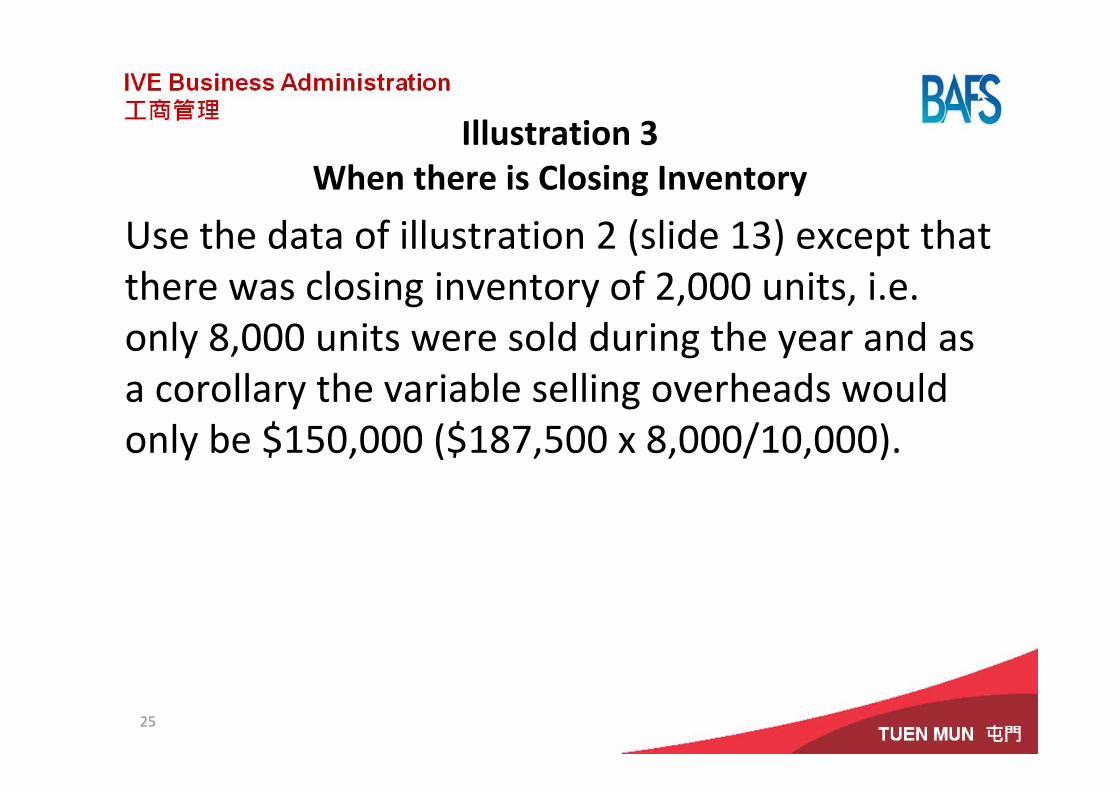
Illustration 3When there is Closing Inventory
Use the data of illustration 2 (slide 13) except that there was closing inventory of 2,000 units, i.e. only 8,000 units were sold during the year and as a corollary the variable selling overheads would only be $150,000 ($187,500 x 8,000/10,000).
25
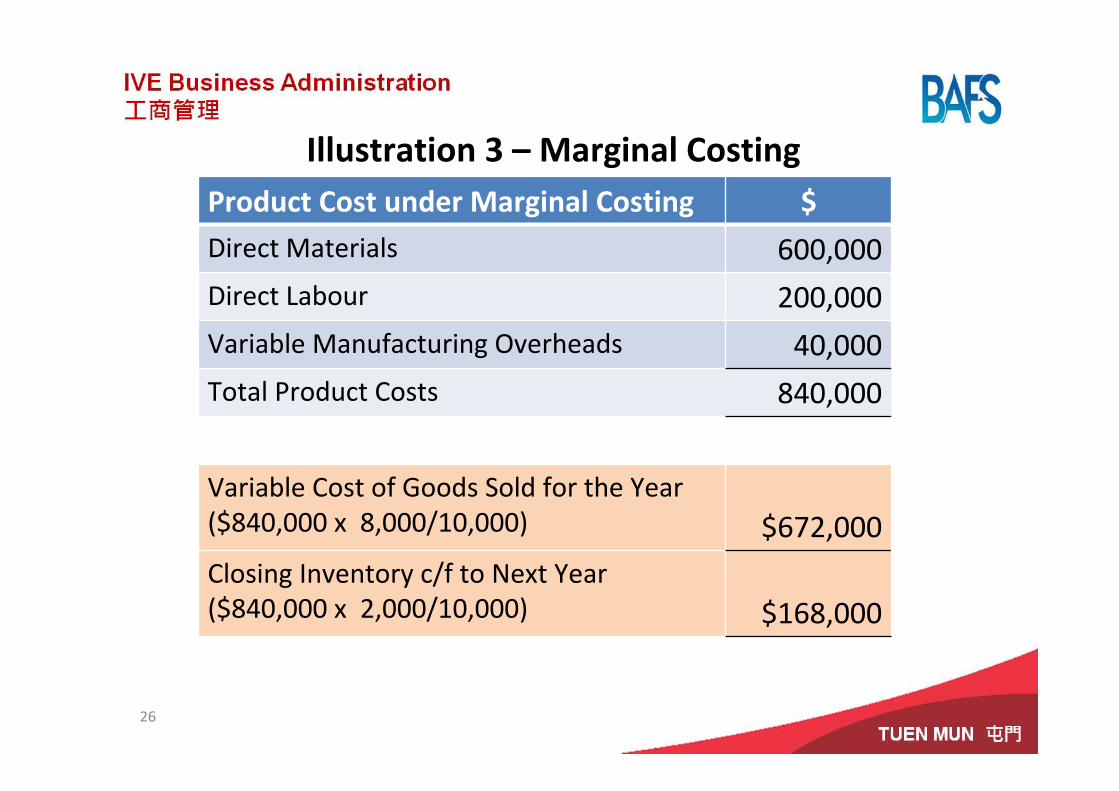
Illustration 3 – Marginal CostingProduct Cost under Marginal Costing $Direct Materials 600,000Direct Labour 200,000Variable Manufacturing Overheads 40,000Total Product Costs 840,000
Variable Cost of Goods Sold for the Year ($840,000 x 8,000/10,000) $672,000Closing Inventory c/f to Next Year($840,000 x 2,000/10,000) $168,000
26
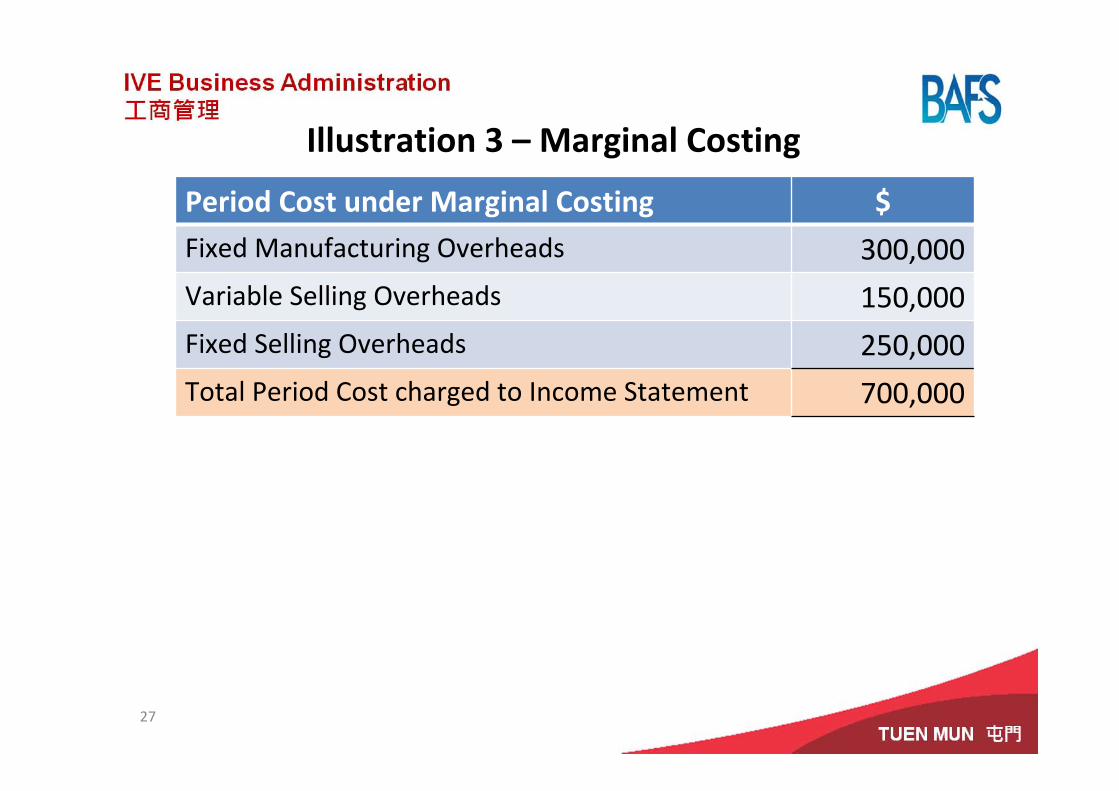
Illustration 3 – Marginal Costing
Period Cost under Marginal Costing $Fixed Manufacturing Overheads 300,000Variable Selling Overheads 150,000Fixed Selling Overheads 250,000Total Period Cost charged to Income Statement 700,000
27
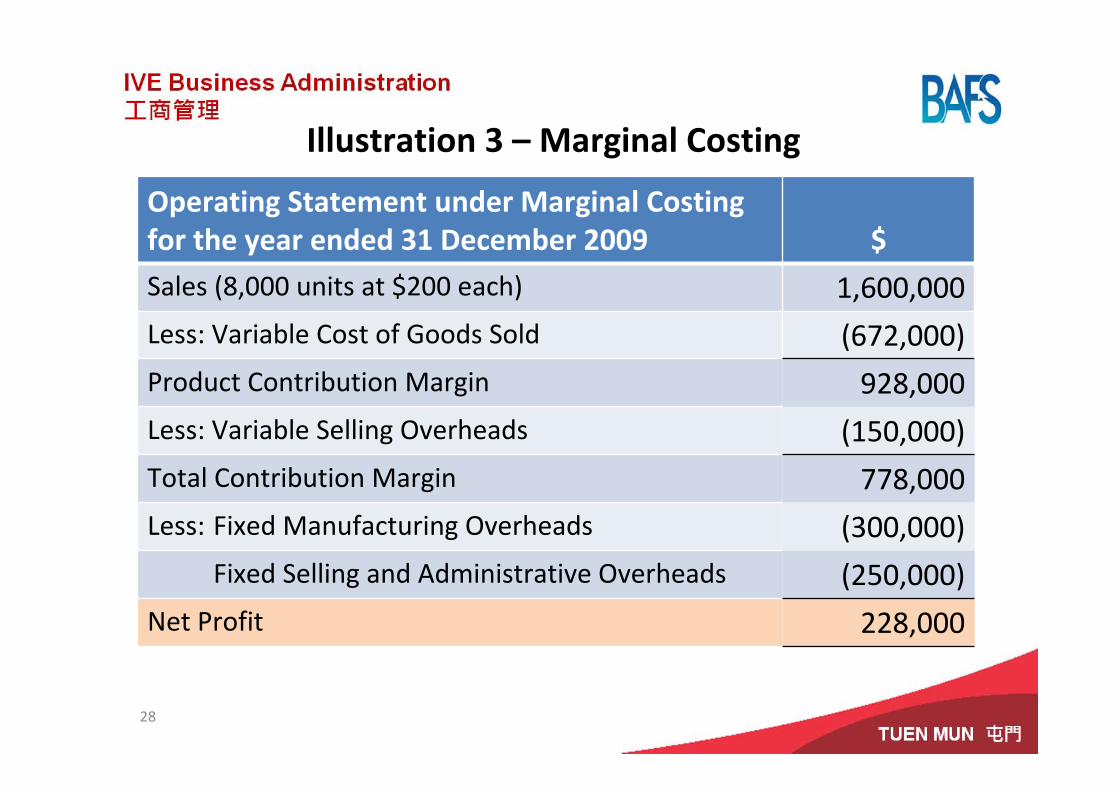
Illustration 3 – Marginal Costing
Operating Statement under Marginal Costingfor the year ended 31 December 2009 $Sales (8,000 units at $200 each) 1,600,000Less: Variable Cost of Goods Sold (672,000)Product Contribution Margin 928,000Less: Variable Selling Overheads (150,000)Total Contribution Margin 778,000Less: Fixed Manufacturing Overheads (300,000)
Fixed Selling and Administrative Overheads (250,000)Net Profit 228,000
28

Illustration 3 – Absorption Costing
Product Cost under Absorption Costing $Direct Materials 600,000Direct Labour 200,000Variable Manufacturing Overheads 40,000Fixed Manufacturing Overheads 300,000Total Product Costs 1,140,000
Cost of Goods Sold for the Year ($1,140,000 x 8,000/10,000) $912,000Closing Inventory c/f to Next Year($1,140,000 x 2,000/10,000) $228,000
29

Illustration 3 – Absorption Costing
Period Cost under Absorption Costing $Variable Selling Overheads 150,000Fixed Selling and Administrative Overheads 250,000Total Period Cost charged to Income Statement 400,000
30
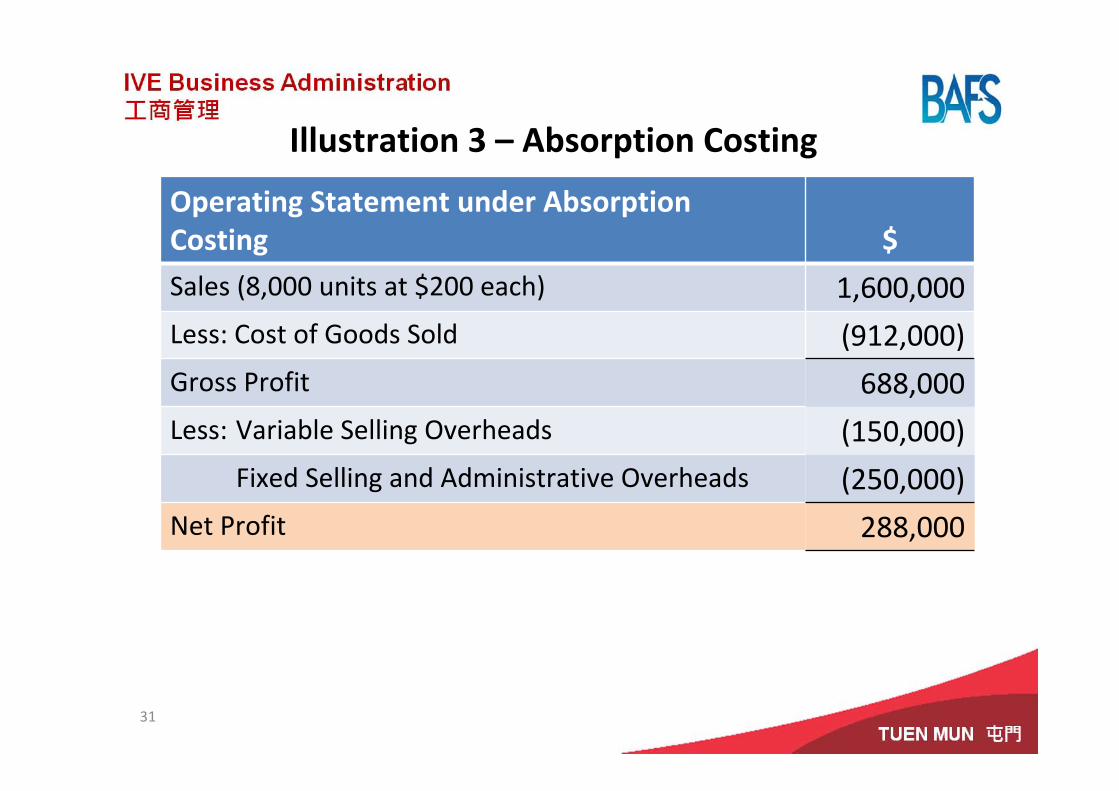
Illustration 3 – Absorption Costing
Operating Statement under Absorption Costingfor the year ended 31 December 2009
$Sales (8,000 units at $200 each) 1,600,000Less: Cost of Goods Sold (912,000)Gross Profit 688,000Less: Variable Selling Overheads (150,000)
Fixed Selling and Administrative Overheads (250,000)Net Profit 288,000
31
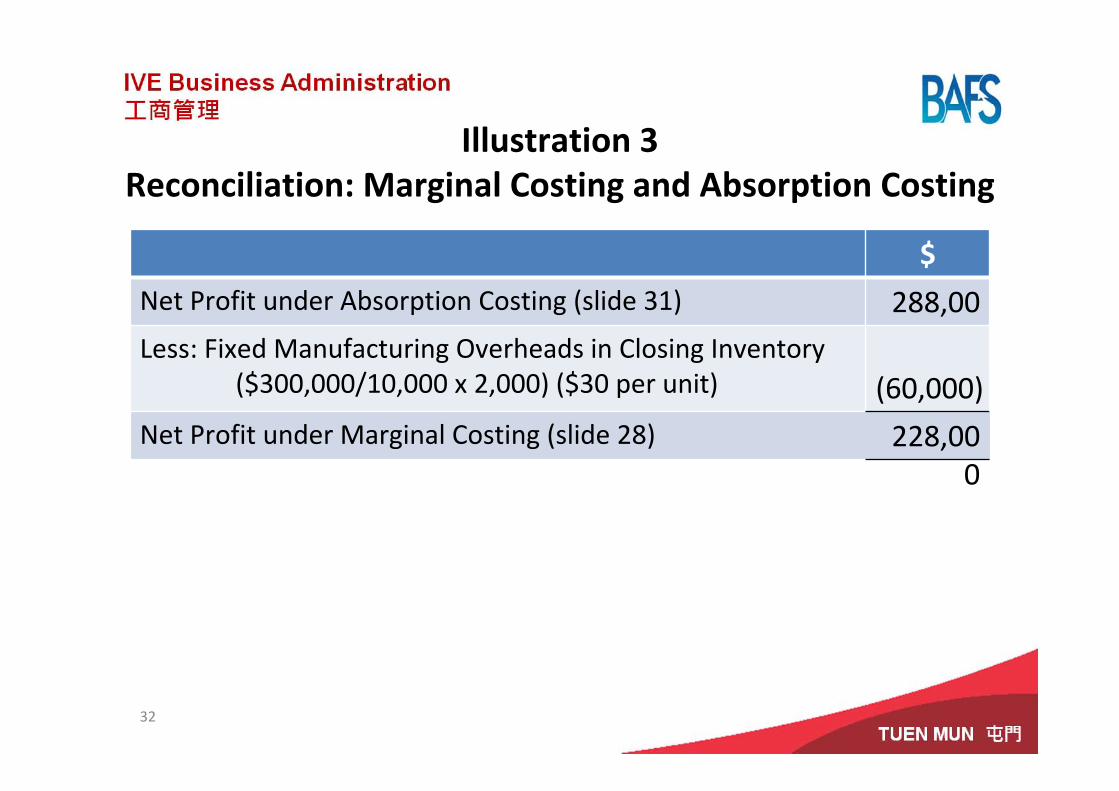
Illustration 3Reconciliation: Marginal Costing and Absorption Costing
$Net Profit under Absorption Costing (slide 31) 288,00
0Less: Fixed Manufacturing Overheads in Closing Inventory($300,000/10,000 x 2,000) ($30 per unit) (60,000)
Net Profit under Marginal Costing (slide 28) 228,000
32
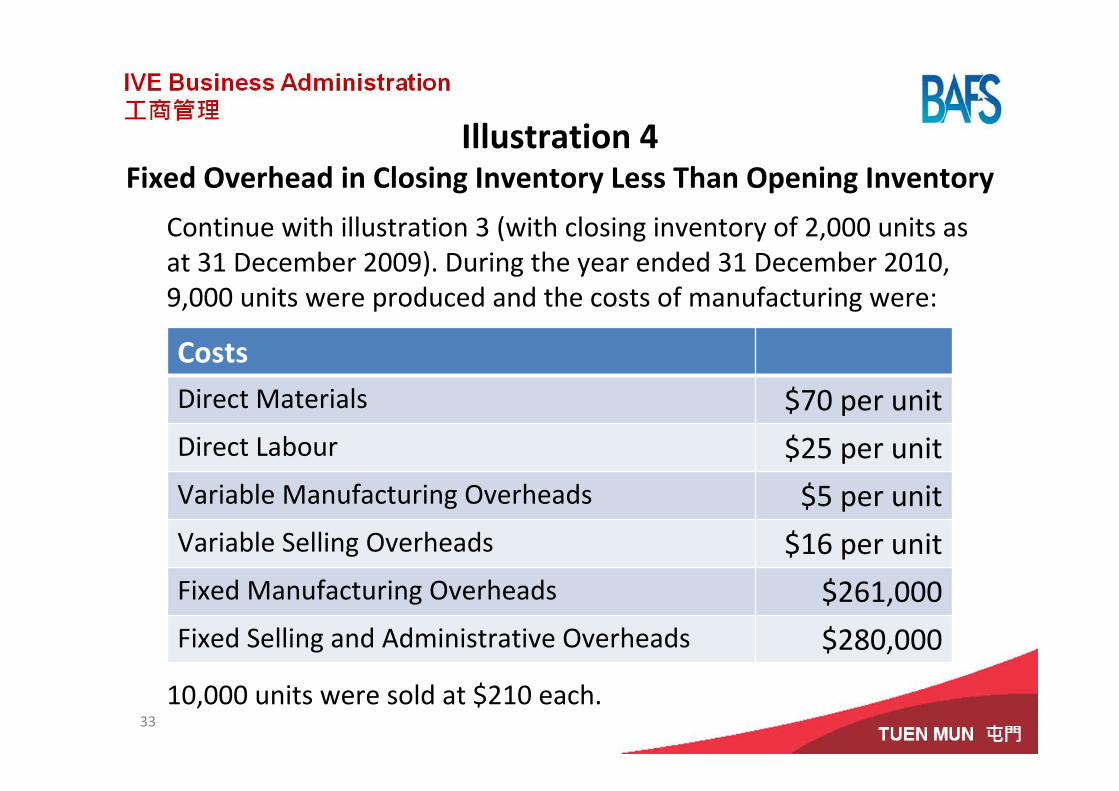
Illustration 4Fixed Overhead in Closing Inventory Less Than Opening Inventory
Continue with illustration 3 (with closing inventory of 2,000 units as at 31 December 2009). During the year ended 31 December 2010, 9,000 units were produced and the costs of manufacturing were:
10,000 units were sold at $210 each.
CostsDirect Materials $70 per unitDirect Labour $25 per unitVariable Manufacturing Overheads $5 per unitVariable Selling Overheads $16 per unitFixed Manufacturing Overheads $261,000Fixed Selling and Administrative Overheads $280,000
33

Illustration 4 – Marginal CostingOperating Statement under Marginal Costingfor the year ended 31 December 2010 $ $Sales ($210 x 10,000) 2,100,000
Less: Cost of Goods Sold:
Opening Inventory ($84 x 2,000) (slide 26) 168,000
Variable Cost of Goods Completed ($100 x 9,000) 900,000
Less: Closing Inventory (assuming FIFO, $100 x 1,000) (100,000) (968,000)
Product Contribution Margin 1,132,000
Less: Variable Selling Overheads ($16 x 10,000) (160,000)
Total Contribution Margin 972,000
Less: Fixed Manufacturing Overheads (261,000)
Fixed Selling and Administrative Overheads (280,000)
Net Profit 431,000
34

Illustration 4 – Absorption CostingOperating Statement under Absorption Costing for the year ended 31 December 2010 $ $Sales ($210 x 10,000) 2,100,000
Less: Cost of Goods Sold:
Opening Inventory ($114 x 2,000) (slide 29) 228,000
Cost of Goods Completed ($100 x 9,000 + $261,000) 1,161,000
Less: Closing Inventory [assuming FIFO, [($100 + $261,000/9,000) x 1,000] (129,000) (1,260,000)
Gross Profit 840,000
Less: Variable Selling Overheads ($16 x 10,000) (160,000)
Fixed Selling and Administrative Overheads (280,000)
Net Profit 400,000
35
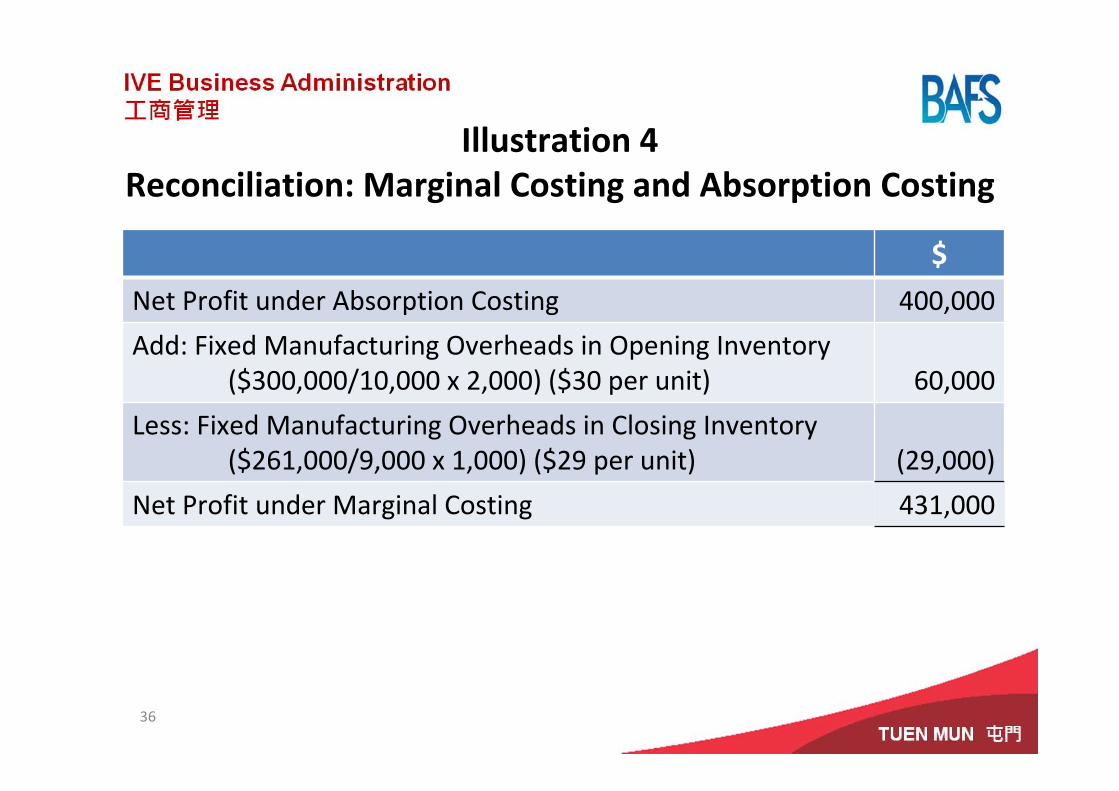
Illustration 4Reconciliation: Marginal Costing and Absorption Costing
$Net Profit under Absorption Costing 400,000
Add: Fixed Manufacturing Overheads in Opening Inventory($300,000/10,000 x 2,000) ($30 per unit) 60,000
Less: Fixed Manufacturing Overheads in Closing Inventory($261,000/9,000 x 1,000) ($29 per unit) (29,000)
Net Profit under Marginal Costing 431,000
36
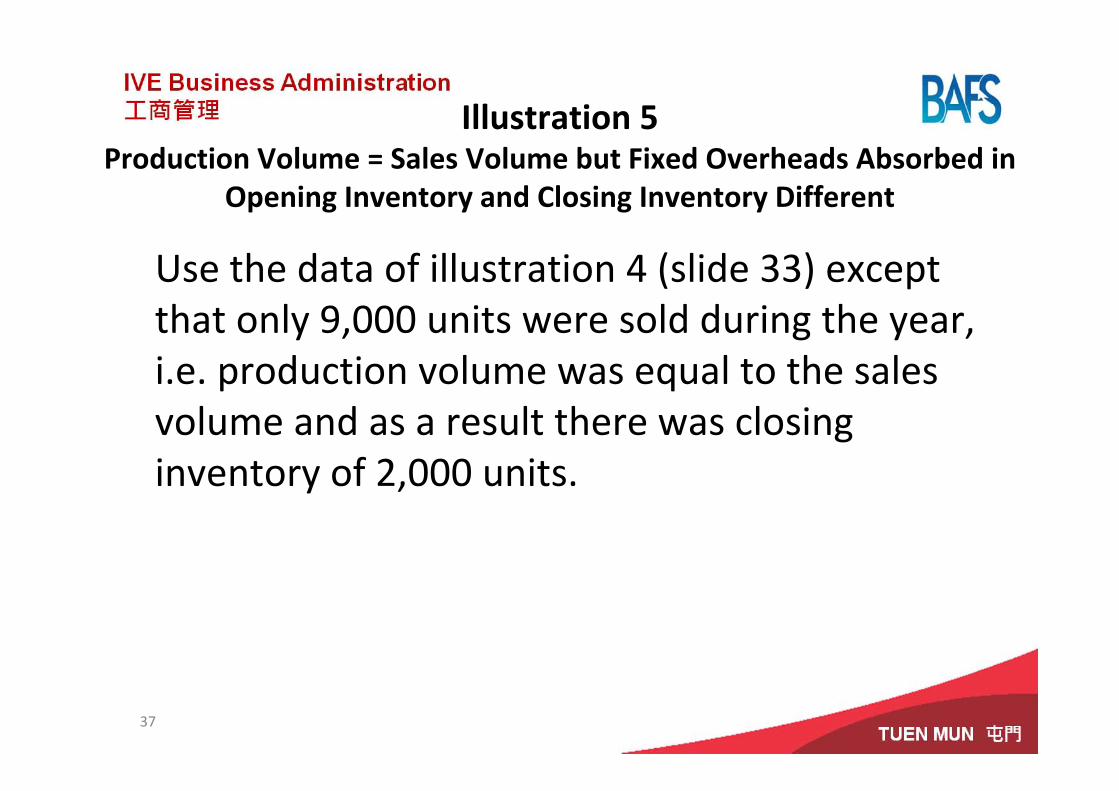
Illustration 5Production Volume = Sales Volume but Fixed Overheads Absorbed in
Opening Inventory and Closing Inventory Different
Use the data of illustration 4 (slide 33) except that only 9,000 units were sold during the year, i.e. production volume was equal to the sales volume and as a result there was closing inventory of 2,000 units.
37
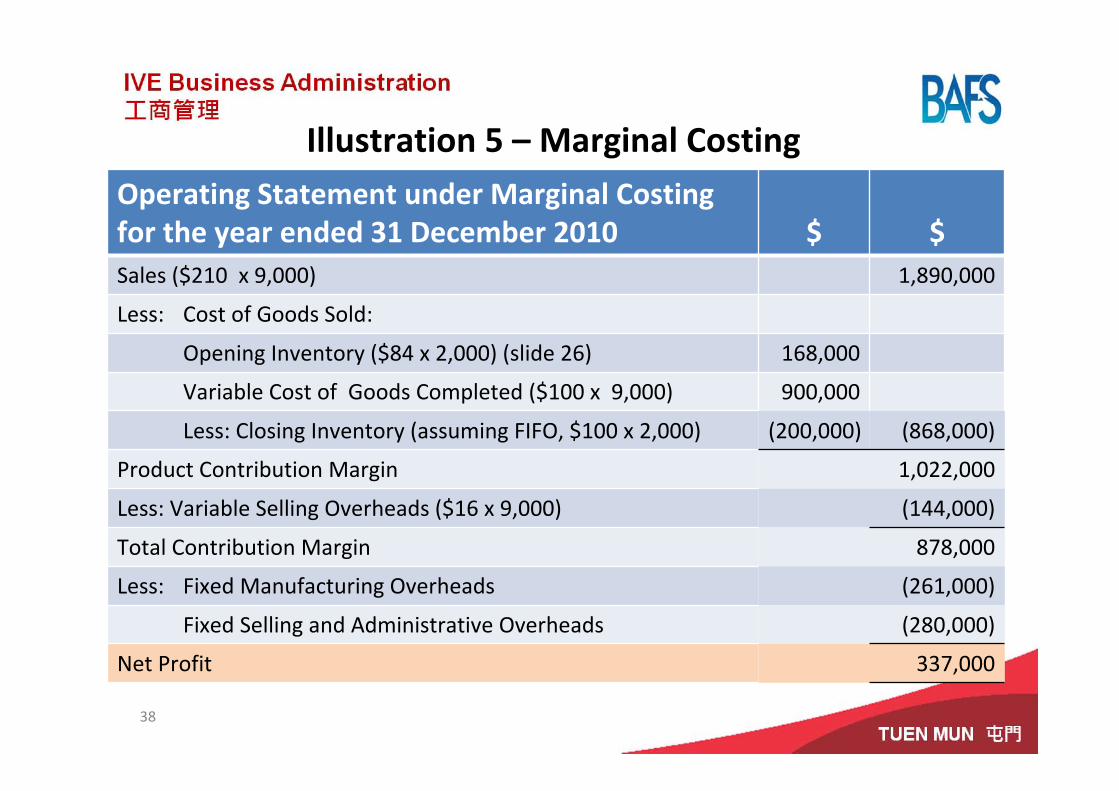
Illustration 5 – Marginal CostingOperating Statement under Marginal Costingfor the year ended 31 December 2010 $ $Sales ($210 x 9,000) 1,890,000
Less: Cost of Goods Sold:
Opening Inventory ($84 x 2,000) (slide 26) 168,000
Variable Cost of Goods Completed ($100 x 9,000) 900,000
Less: Closing Inventory (assuming FIFO, $100 x 2,000) (200,000) (868,000)
Product Contribution Margin 1,022,000
Less: Variable Selling Overheads ($16 x 9,000) (144,000)
Total Contribution Margin 878,000
Less: Fixed Manufacturing Overheads (261,000)
Fixed Selling and Administrative Overheads (280,000)
Net Profit 337,000
38
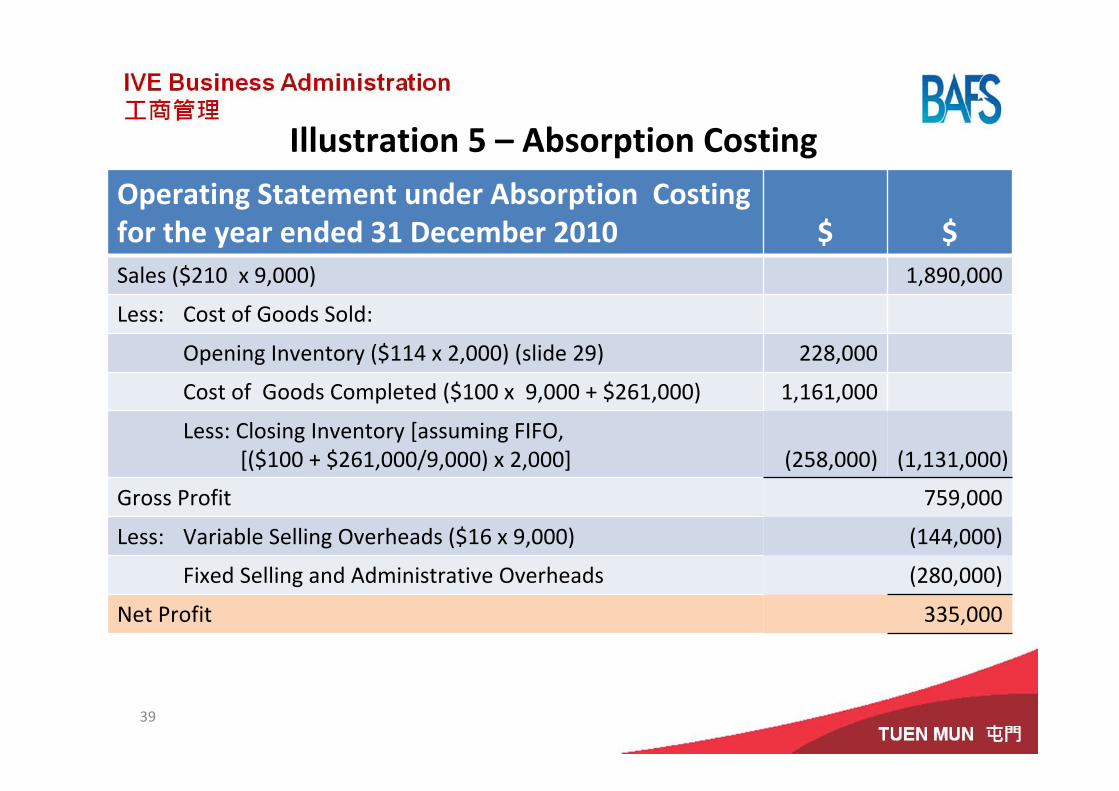
Illustration 5 – Absorption CostingOperating Statement under Absorption Costing for the year ended 31 December 2010 $ $Sales ($210 x 9,000) 1,890,000
Less: Cost of Goods Sold:
Opening Inventory ($114 x 2,000) (slide 29) 228,000
Cost of Goods Completed ($100 x 9,000 + $261,000) 1,161,000
Less: Closing Inventory [assuming FIFO, [($100 + $261,000/9,000) x 2,000] (258,000) (1,131,000)
Gross Profit 759,000
Less: Variable Selling Overheads ($16 x 9,000) (144,000)
Fixed Selling and Administrative Overheads (280,000)
Net Profit 335,000
39
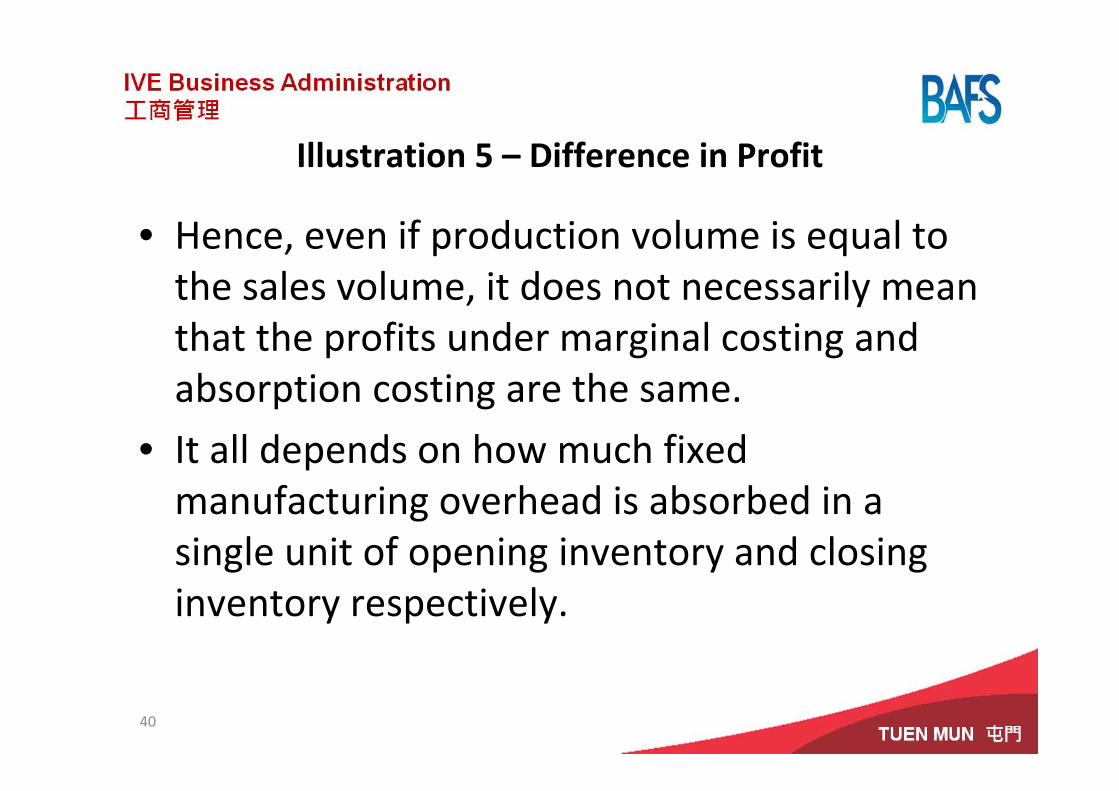
Illustration 5 – Difference in Profit
• Hence, even if production volume is equal to the sales volume, it does not necessarily mean that the profits under marginal costing and absorption costing are the same.
• It all depends on how much fixed manufacturing overhead is absorbed in a single unit of opening inventory and closing inventory respectively.
40

Illustration 5Reconciliation: Marginal Costing and Absorption Costing
$Net Profit under Absorption Costing (slide 39) 335,000
Add: Fixed Manufacturing Overheads in Opening Inventory($300,000/10,000 x 2,000) ($30 per unit) 60,000
Less: Fixed Manufacturing Overheads in Closing Inventory($261,000/9,000 x 2,000) ($29 per unit) (58,000)
Net Profit under Marginal Costing (slide 38) 337,000
41
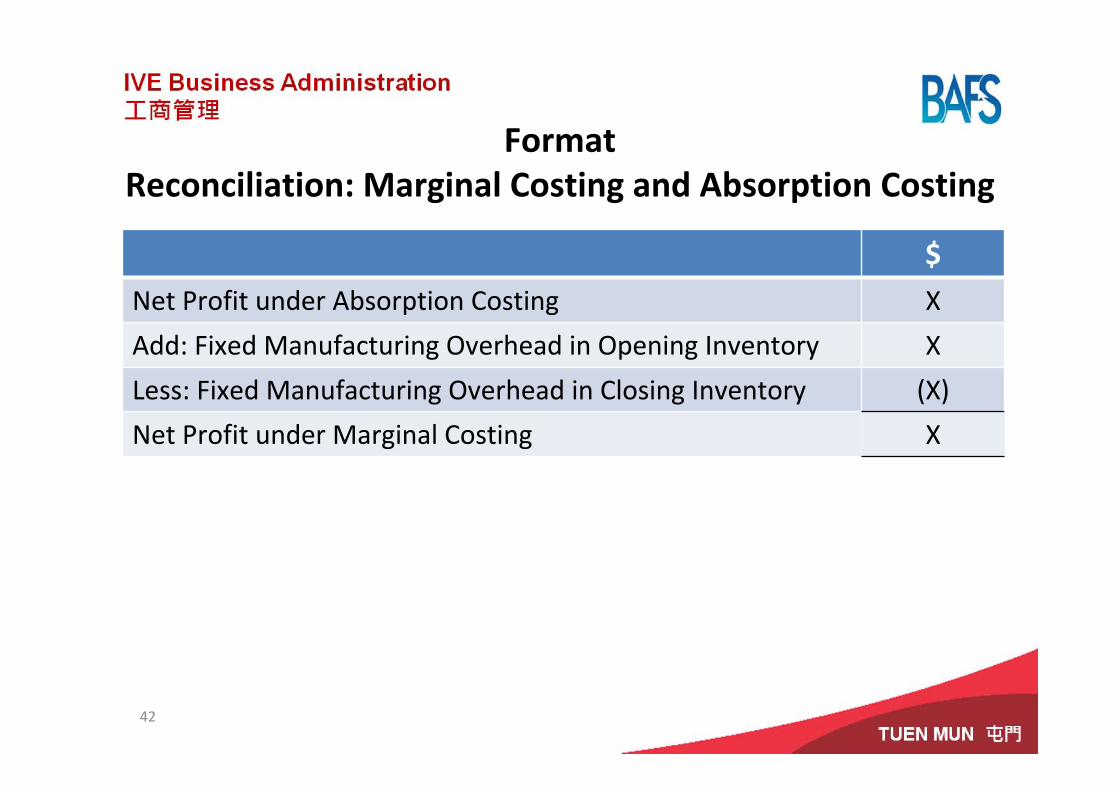
FormatReconciliation: Marginal Costing and Absorption Costing
$Net Profit under Absorption Costing X
Add: Fixed Manufacturing Overhead in Opening Inventory X
Less: Fixed Manufacturing Overhead in Closing Inventory (X)
Net Profit under Marginal Costing X
42
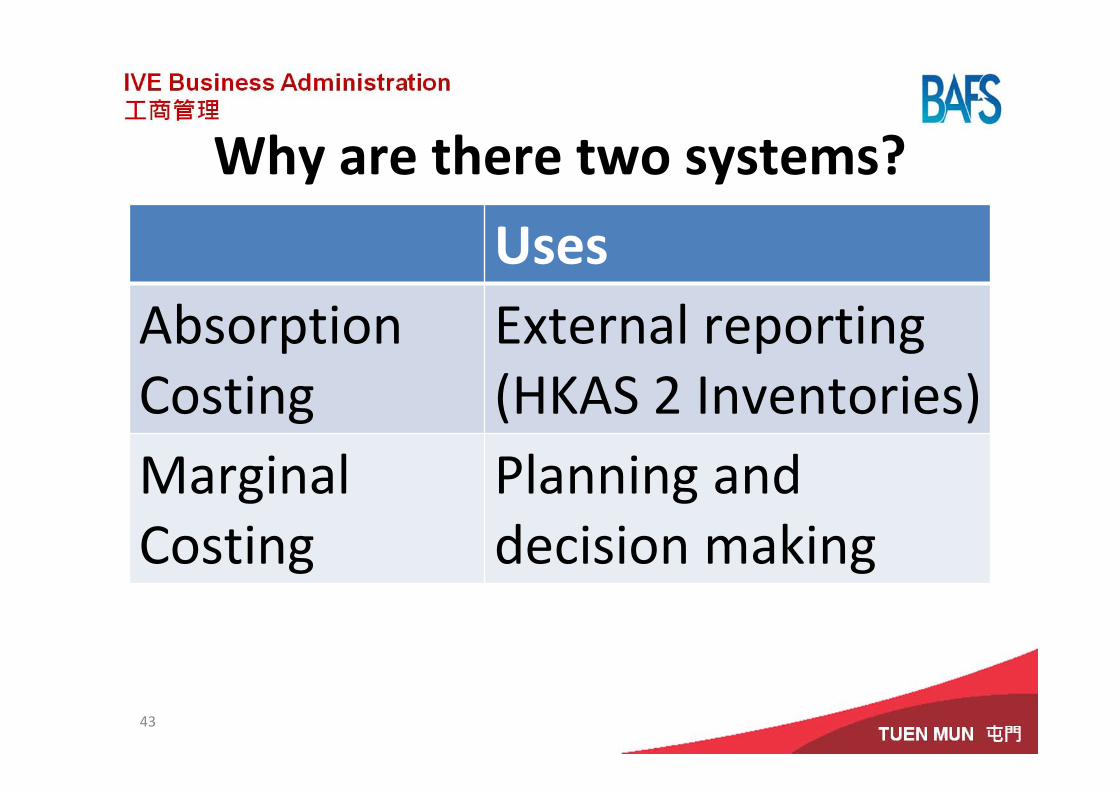
Why are there two systems?
UsesAbsorption Costing
External reporting (HKAS 2 Inventories)
Marginal Costing
Planning and decision making
43
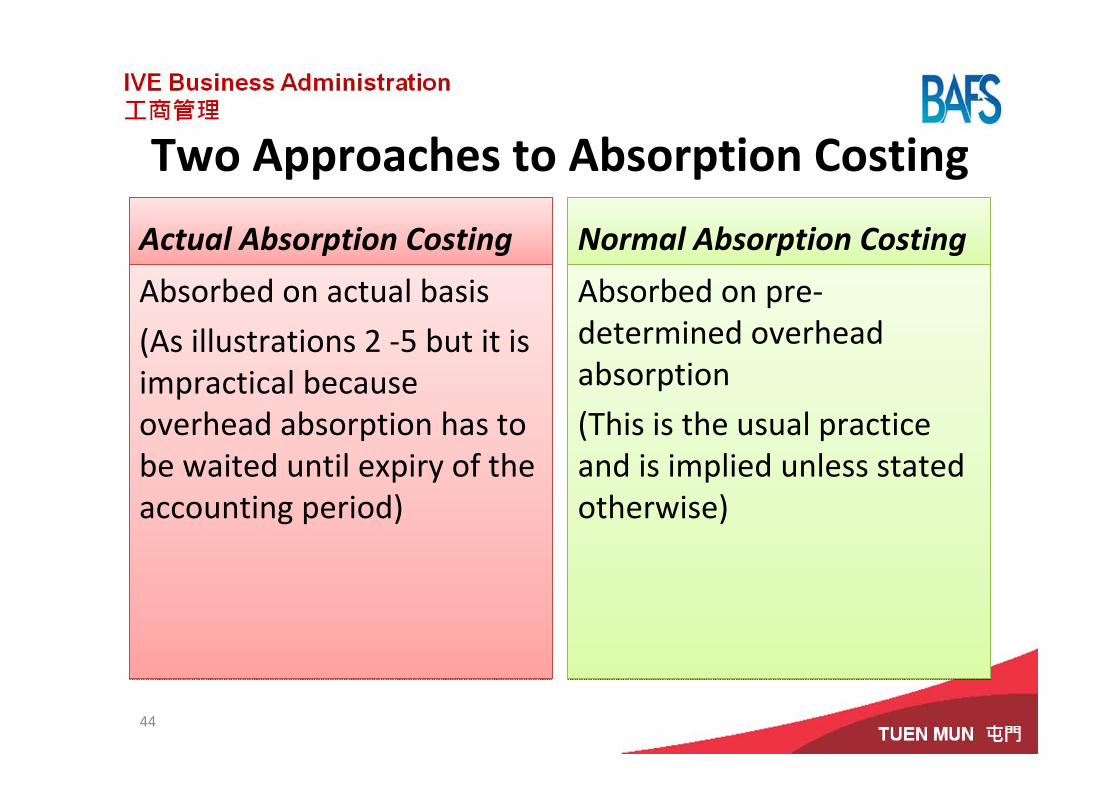
Two Approaches to Absorption Costing
Actual Absorption CostingActual Absorption Costing
Absorbed on actual basis
(As illustrations 2 ‐5 but it is impractical because overhead absorption has to be waited until expiry of the accounting period)
Absorbed on actual basis
(As illustrations 2 ‐5 but it is impractical because overhead absorption has to be waited until expiry of the accounting period)
Normal Absorption CostingNormal Absorption Costing
Absorbed on pre‐determined overhead absorption
(This is the usual practice and is implied unless stated otherwise)
Absorbed on pre‐determined overhead absorption
(This is the usual practice and is implied unless stated otherwise)
44
Issues for Normal Absorption Costing
45
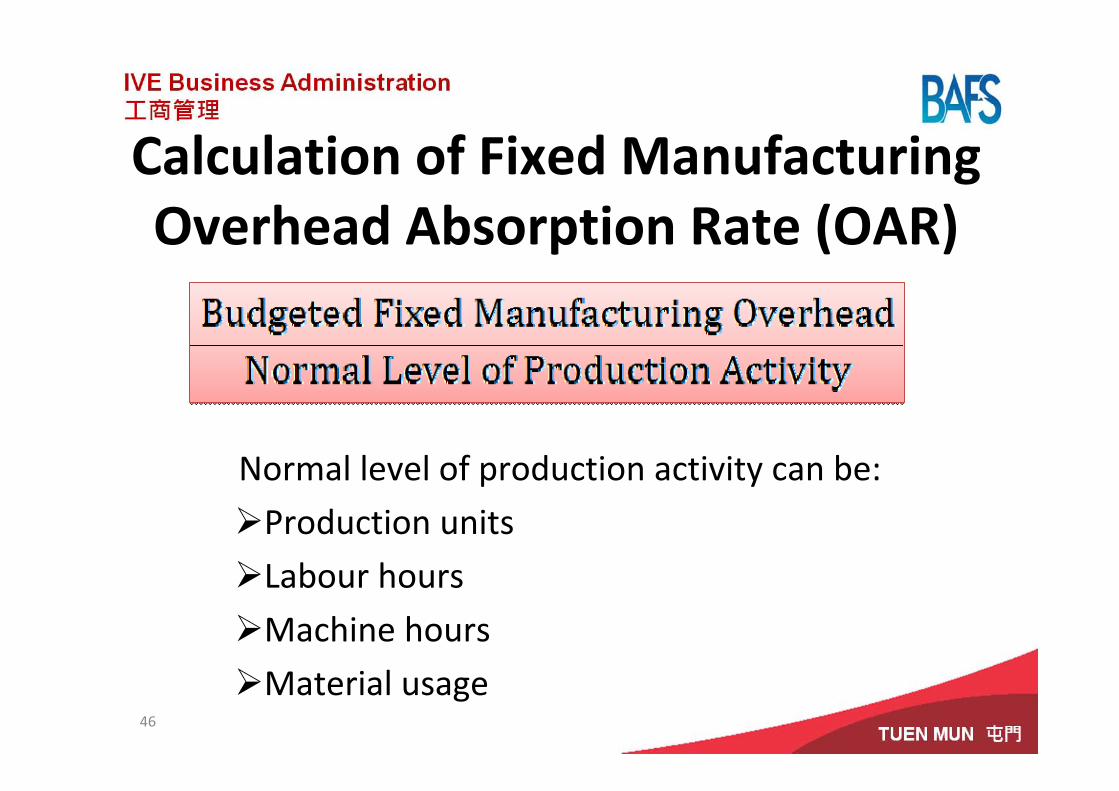
Calculation of Fixed Manufacturing Overhead Absorption Rate (OAR)
Normal level of production activity can be:
Production units
Labour hours
Machine hours
Material usage46
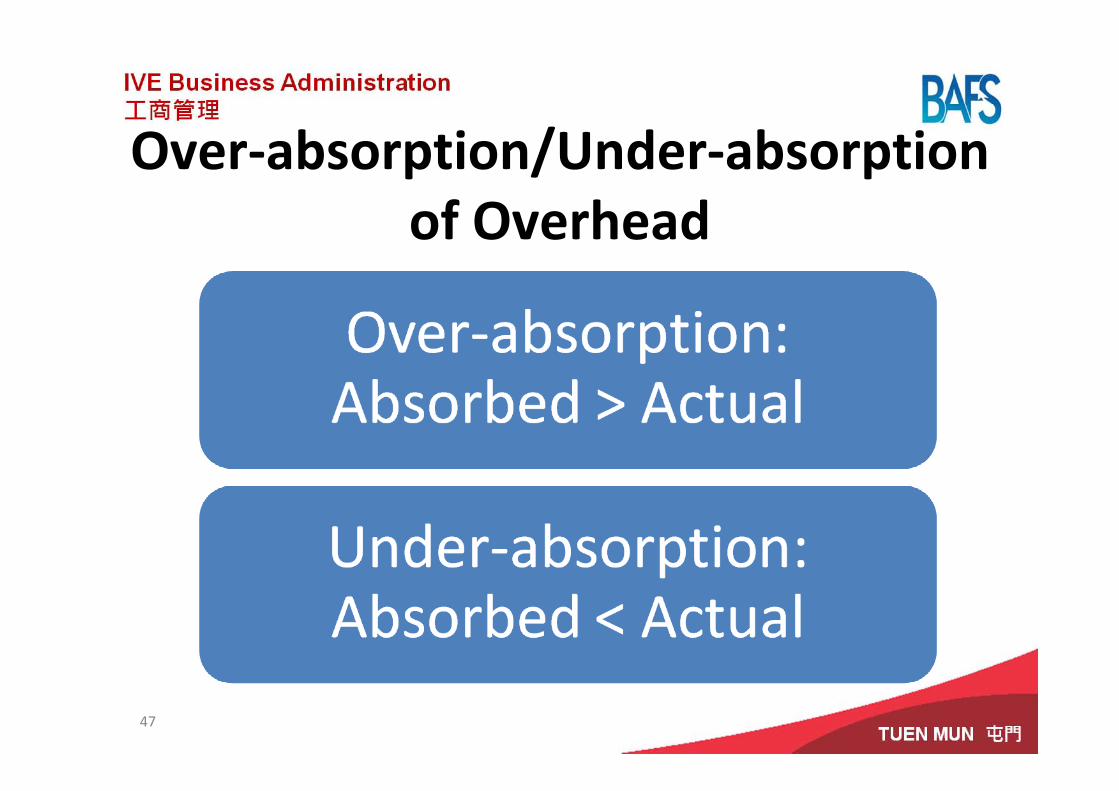
Over‐absorption/Under‐absorption of Overhead
47
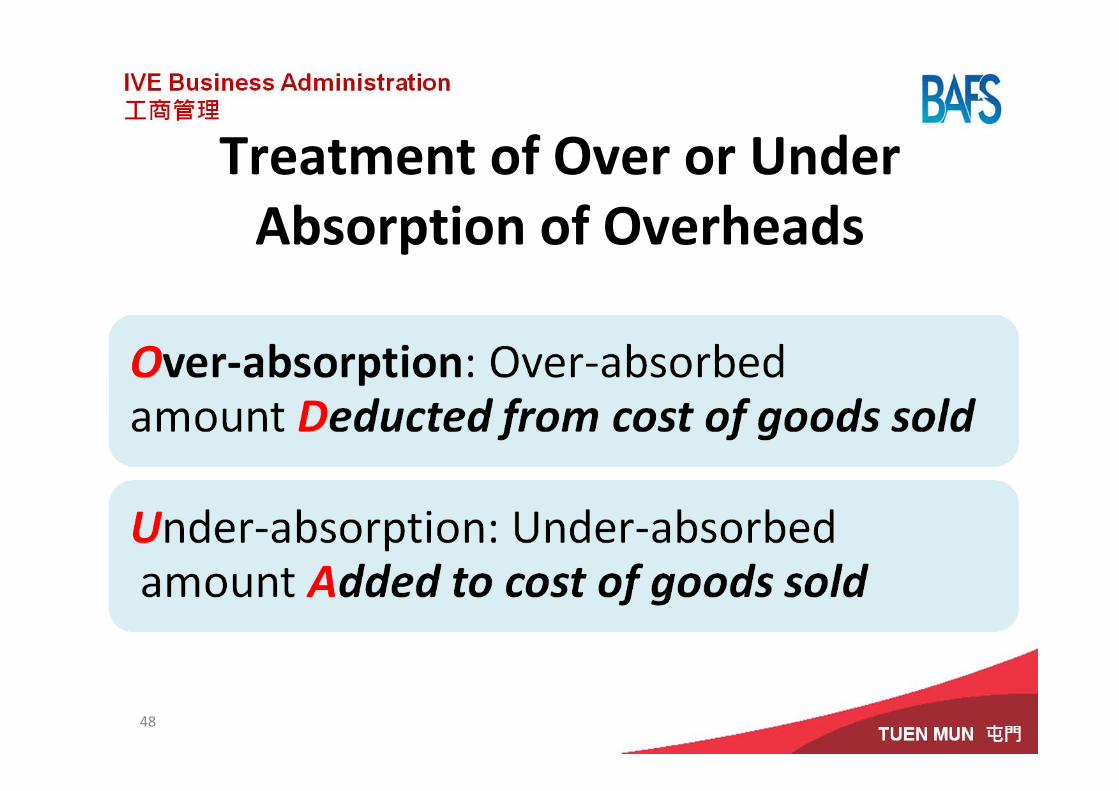
Treatment of Over or Under Absorption of Overheads
48

Illustration 6Normal Absorption Costing
Refer to illustration 4 (slide 33). Assume for the year ended 31 December 2010, the budgeted fixed manufacturing overhead was $300,000 and the normal level of production activity was 10,000 units.
49
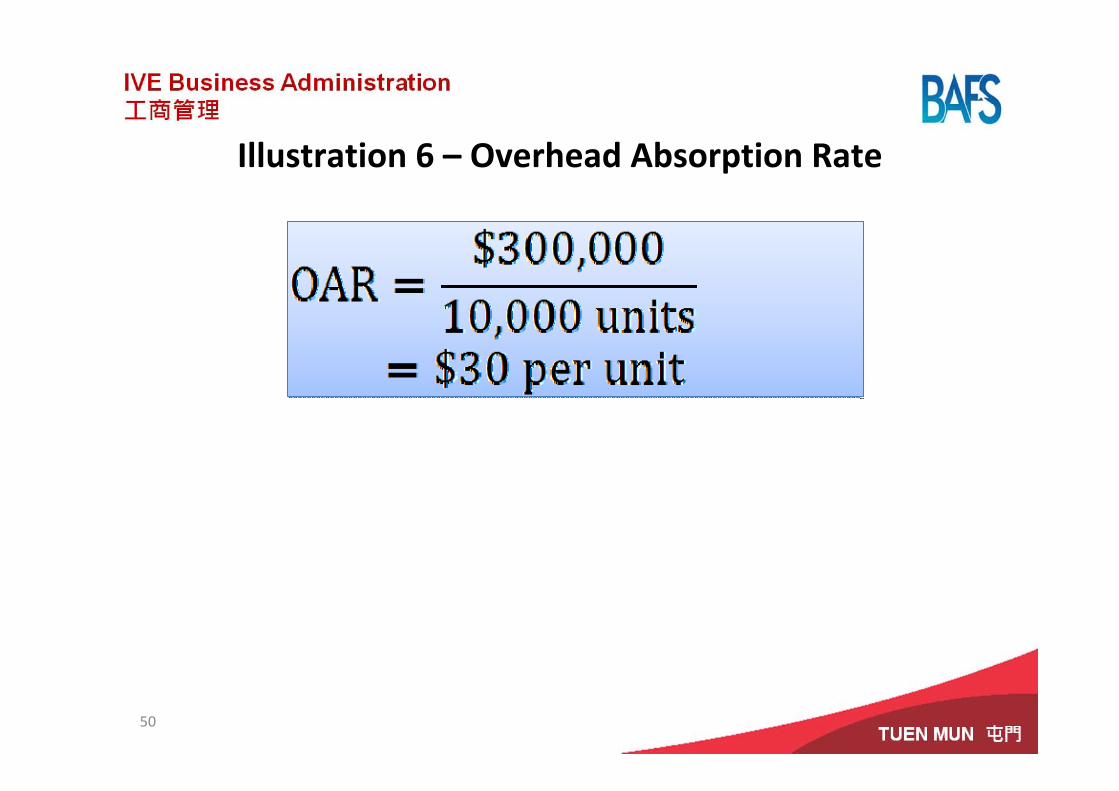
Illustration 6 – Overhead Absorption Rate
50
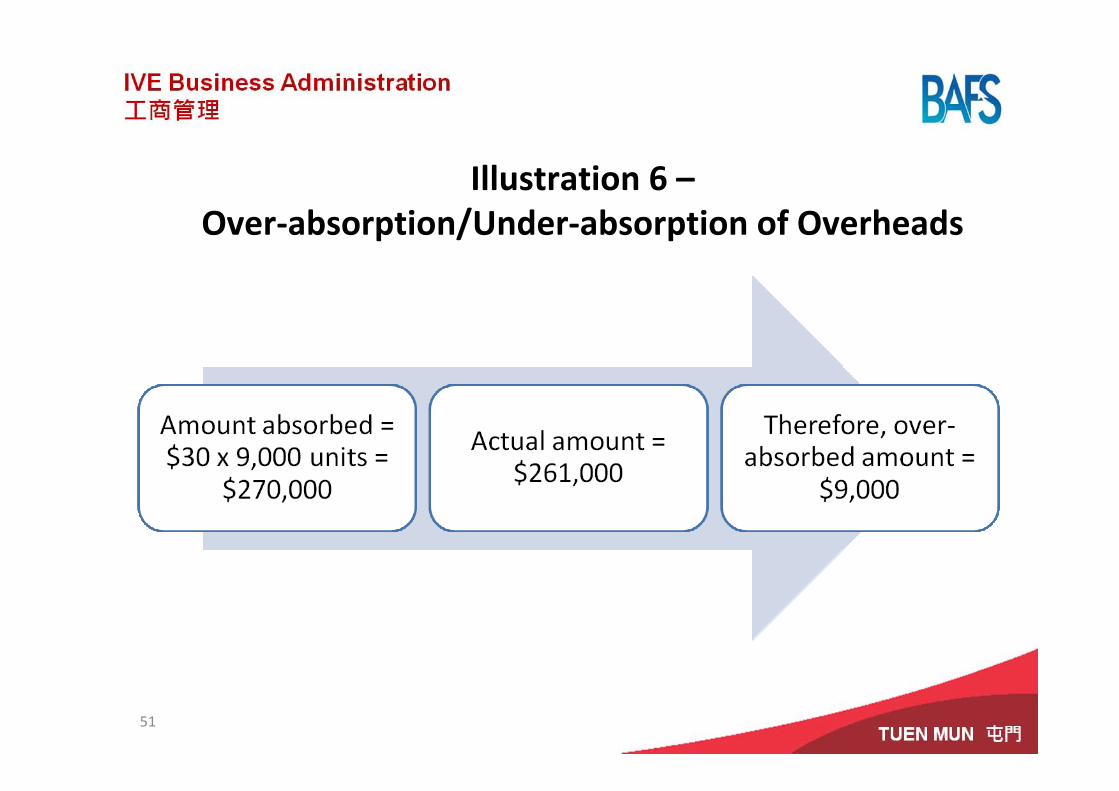
Illustration 6 –Over‐absorption/Under‐absorption of Overheads
51
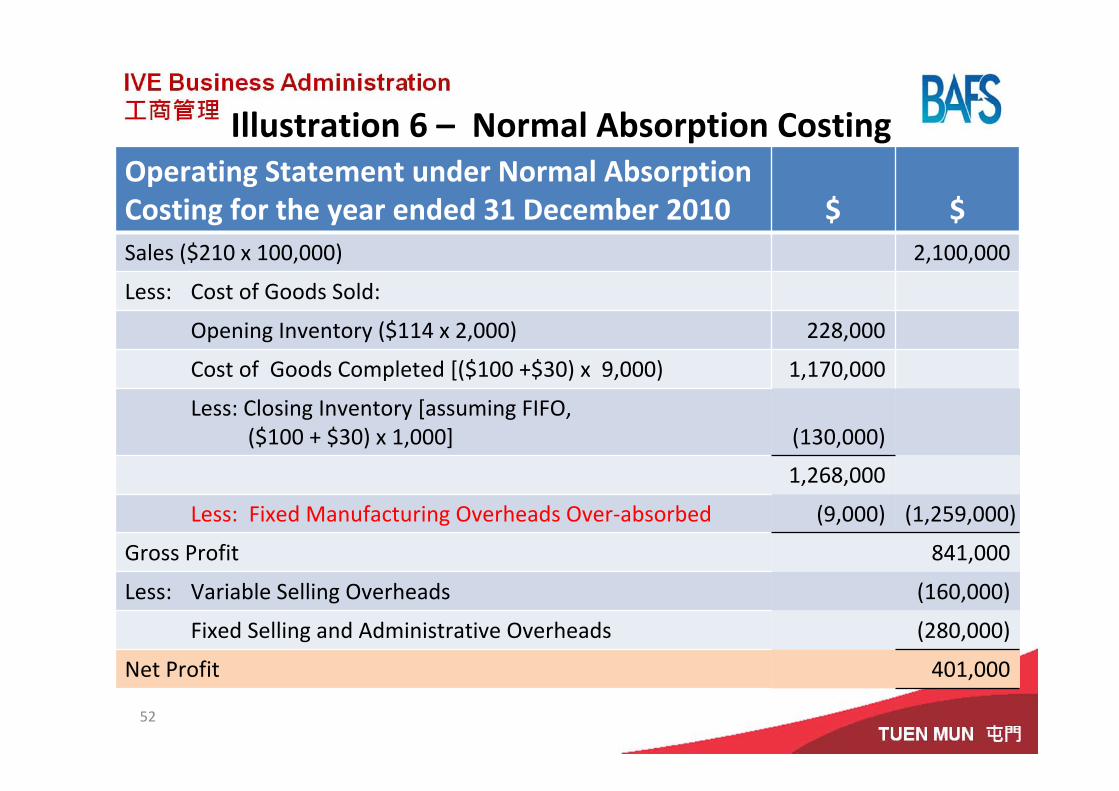
Illustration 6 – Normal Absorption CostingOperating Statement under Normal Absorption Costing for the year ended 31 December 2010 $ $Sales ($210 x 100,000) 2,100,000
Less: Cost of Goods Sold:
Opening Inventory ($114 x 2,000) 228,000
Cost of Goods Completed [($100 +$30) x 9,000) 1,170,000
Less: Closing Inventory [assuming FIFO, ($100 + $30) x 1,000] (130,000)
1,268,000
Less: Fixed Manufacturing Overheads Over‐absorbed (9,000) (1,259,000)
Gross Profit 841,000
Less: Variable Selling Overheads (160,000)
Fixed Selling and Administrative Overheads (280,000)
Net Profit 401,000
52
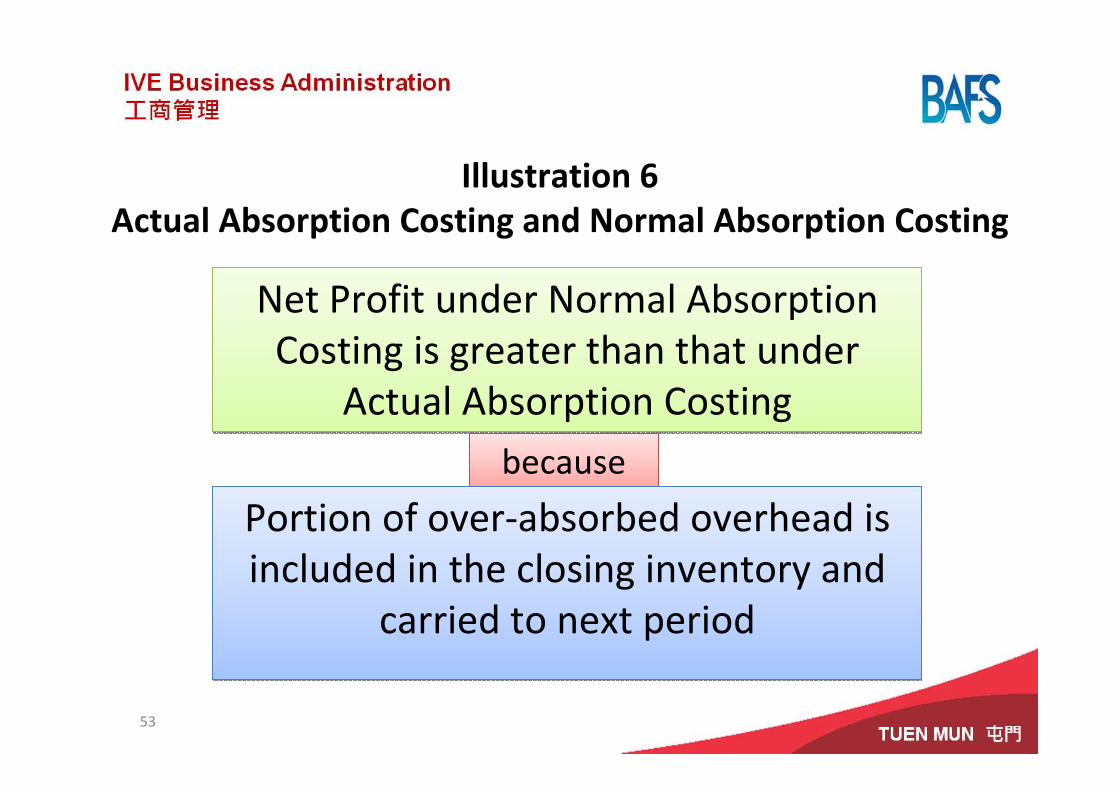
Illustration 6Actual Absorption Costing and Normal Absorption Costing
53
Net Profit under Normal Absorption Costing is greater than that under
Actual Absorption Costing
Net Profit under Normal Absorption Costing is greater than that under
Actual Absorption Costing
becausebecause
Portion of over‐absorbed overhead is included in the closing inventory and
carried to next period
Portion of over‐absorbed overhead is included in the closing inventory and
carried to next period
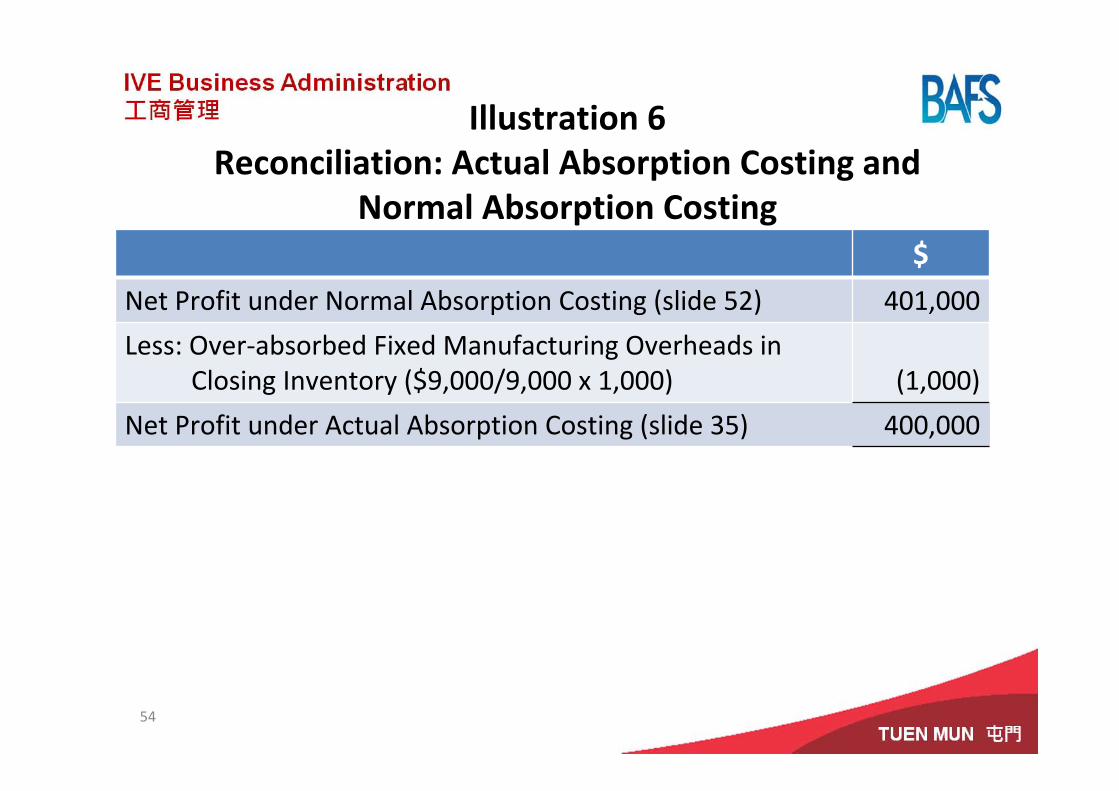
Illustration 6Reconciliation: Actual Absorption Costing and
Normal Absorption Costing$
Net Profit under Normal Absorption Costing (slide 52) 401,000
Less: Over‐absorbed Fixed Manufacturing Overheads inClosing Inventory ($9,000/9,000 x 1,000) (1,000)
Net Profit under Actual Absorption Costing (slide 35) 400,000
54

Illustration 6Reconciliation: Normal Absorption Costing and
Marginal Costing$
Net Profit under Normal Absorption Costing (slide 52) 401,000
Add: Fixed Manufacturing Overheads in Opening Inventory($300,000/10,000 x 2,000) 60,000
Less: Fixed Manufacturing Overheads in Closing Inventory($300,000/10,000 x 1,000) (30,000)
Net Profit under Marginal Costing (slide 34) 431,000
55
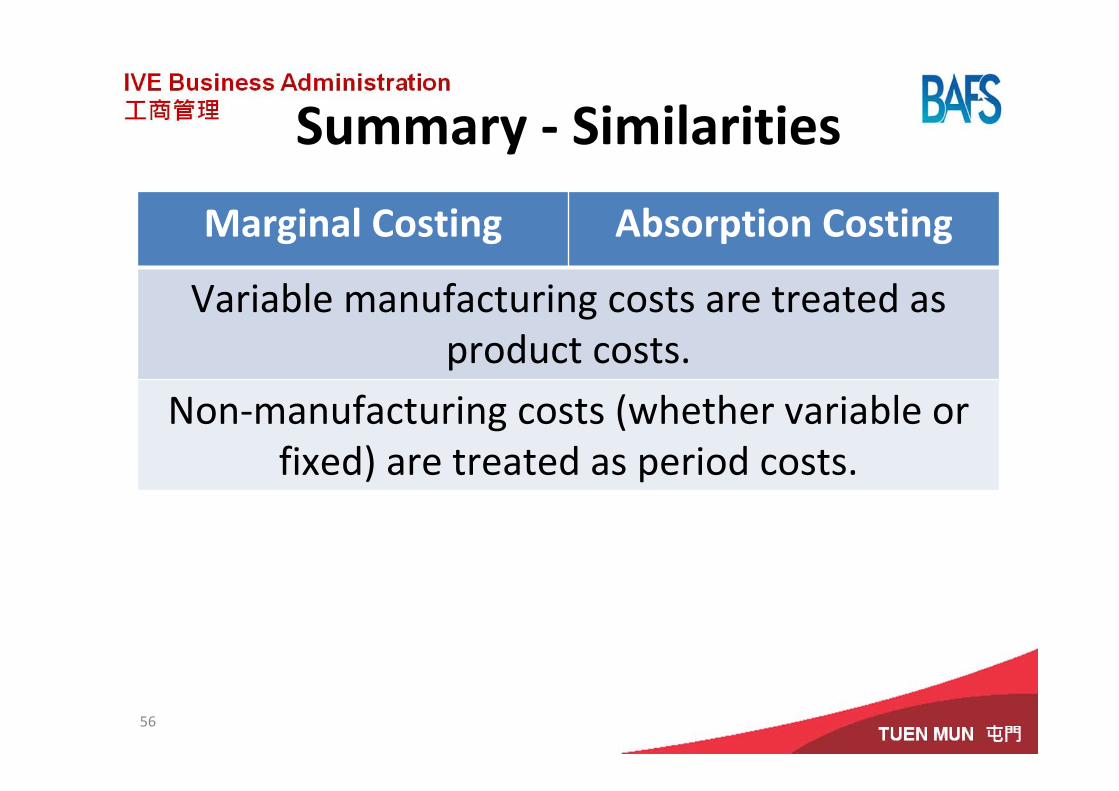
Summary ‐ Similarities
Marginal Costing Absorption Costing
Variable manufacturing costs are treated as product costs.
Non‐manufacturing costs (whether variable or fixed) are treated as period costs.
56
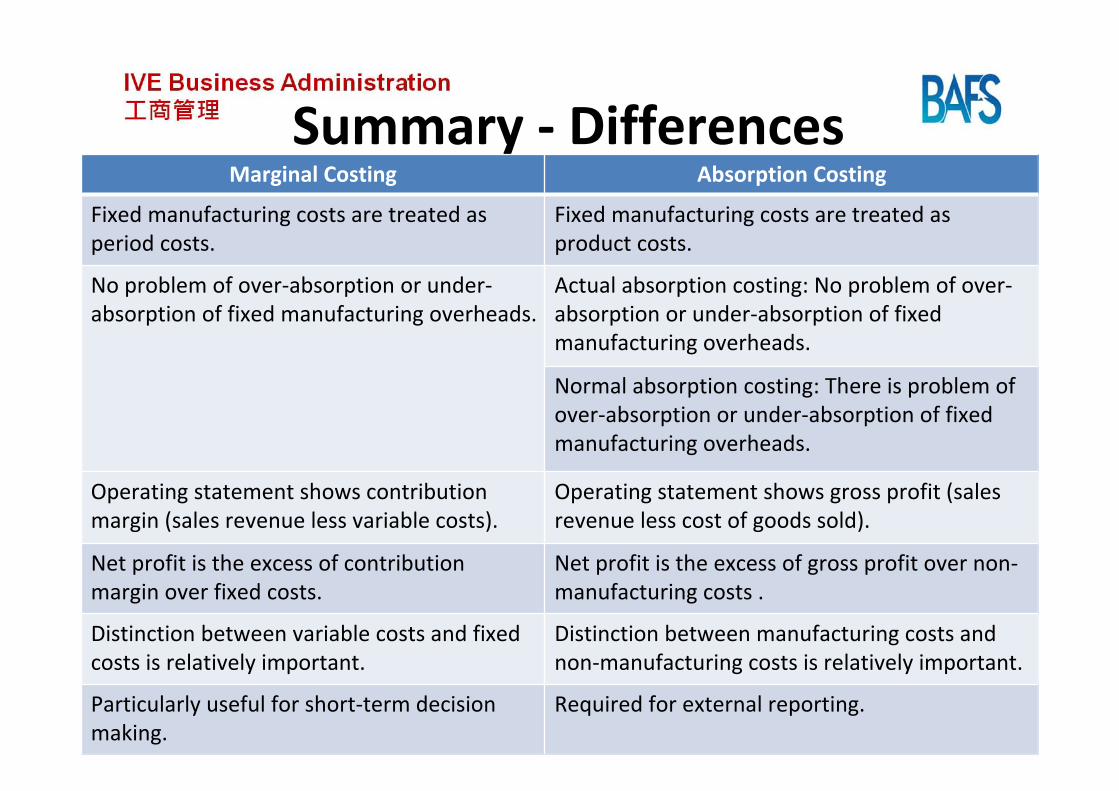
Summary ‐ DifferencesMarginal Costing Absorption Costing
Fixed manufacturing costs are treated as period costs.
Fixed manufacturing costs are treated as product costs.
No problem of over‐absorption or under‐absorption of fixed manufacturing overheads.
Actual absorption costing: No problem of over‐absorption or under‐absorption of fixed manufacturing overheads.
Normal absorption costing: There is problem of over‐absorption or under‐absorption of fixed manufacturing overheads.
Operating statement shows contribution margin (sales revenue less variable costs).
Operating statement shows gross profit (sales revenue less cost of goods sold).
Net profit is the excess of contribution margin over fixed costs.
Net profit is the excess of gross profit over non‐manufacturing costs .
Distinction between variable costs and fixed costs is relatively important.
Distinction between manufacturing costs and non‐manufacturing costs is relatively important.
Particularly useful for short‐term decision making.
Required for external reporting.
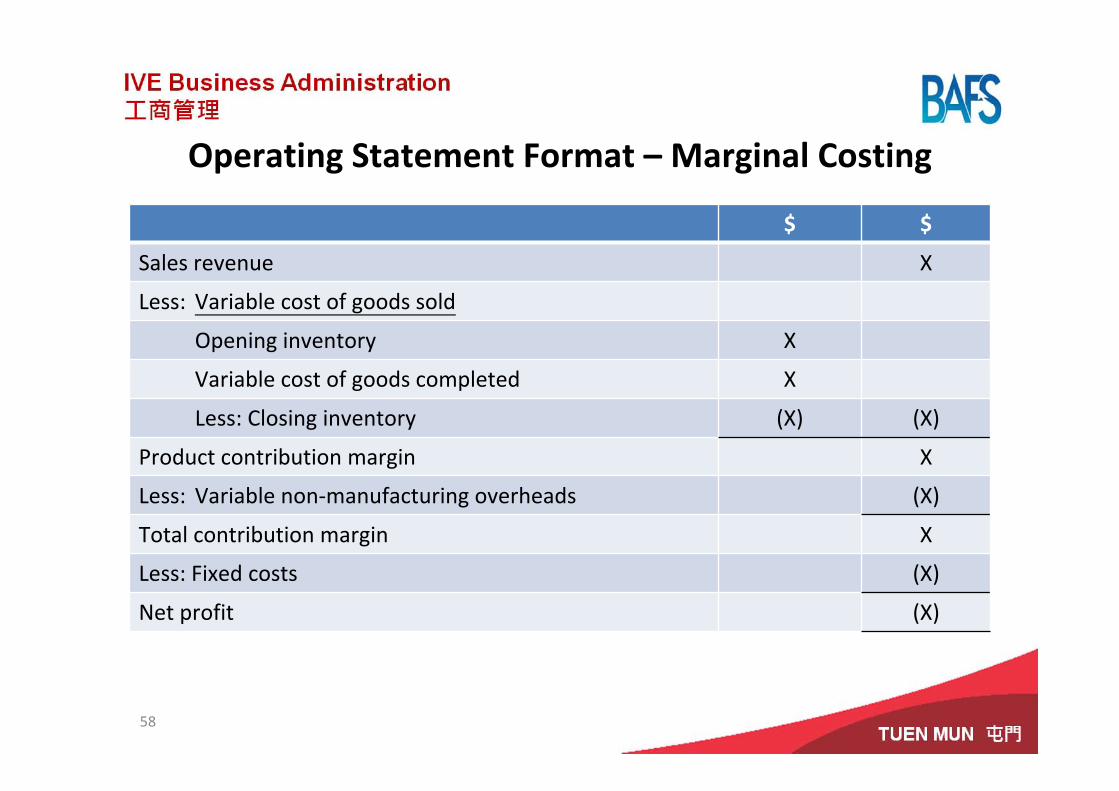
Operating Statement Format – Marginal Costing
$ $
Sales revenue X
Less: Variable cost of goods sold
Opening inventory X
Variable cost of goods completed X
Less: Closing inventory (X) (X)
Product contribution margin X
Less: Variable non‐manufacturing overheads (X)
Total contribution margin X
Less: Fixed costs (X)
Net profit (X)
58
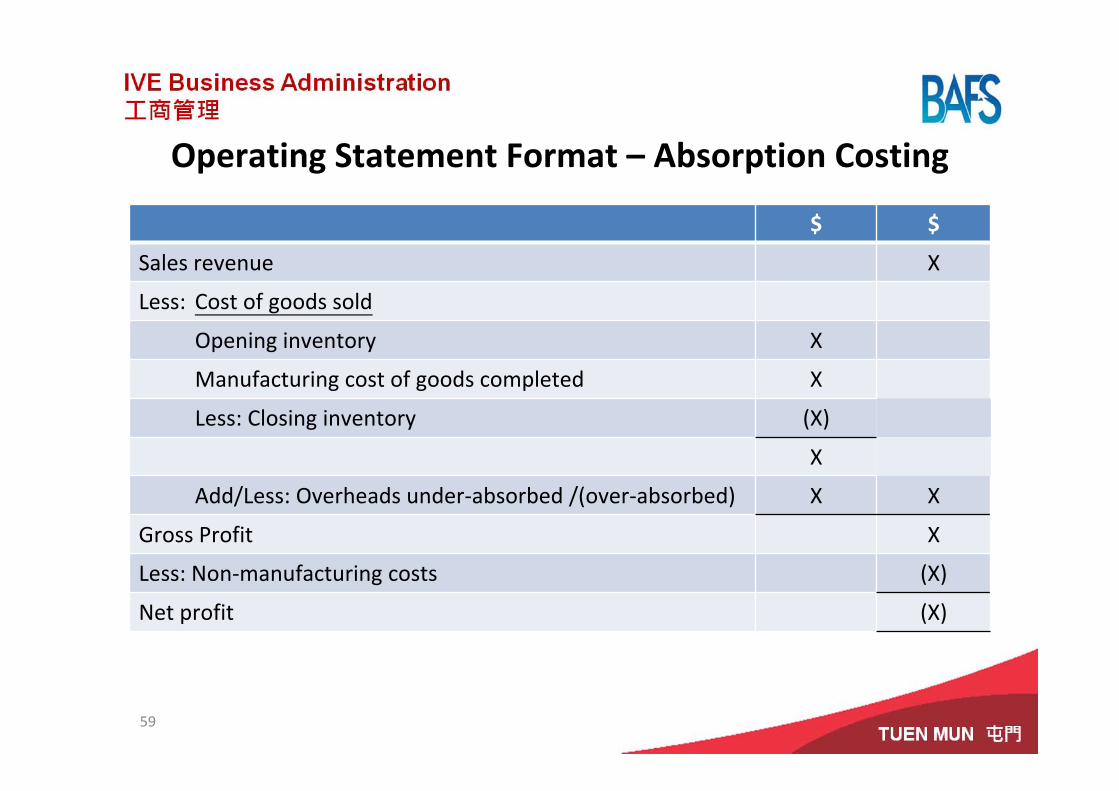
Operating Statement Format – Absorption Costing
59
$ $
Sales revenue X
Less: Cost of goods sold
Opening inventory X
Manufacturing cost of goods completed X
Less: Closing inventory (X)
X
Add/Less: Overheads under‐absorbed /(over‐absorbed) X X
Gross Profit X
Less: Non‐manufacturing costs (X)
Net profit (X)

ActivityIntegrated Illustrative Question
60
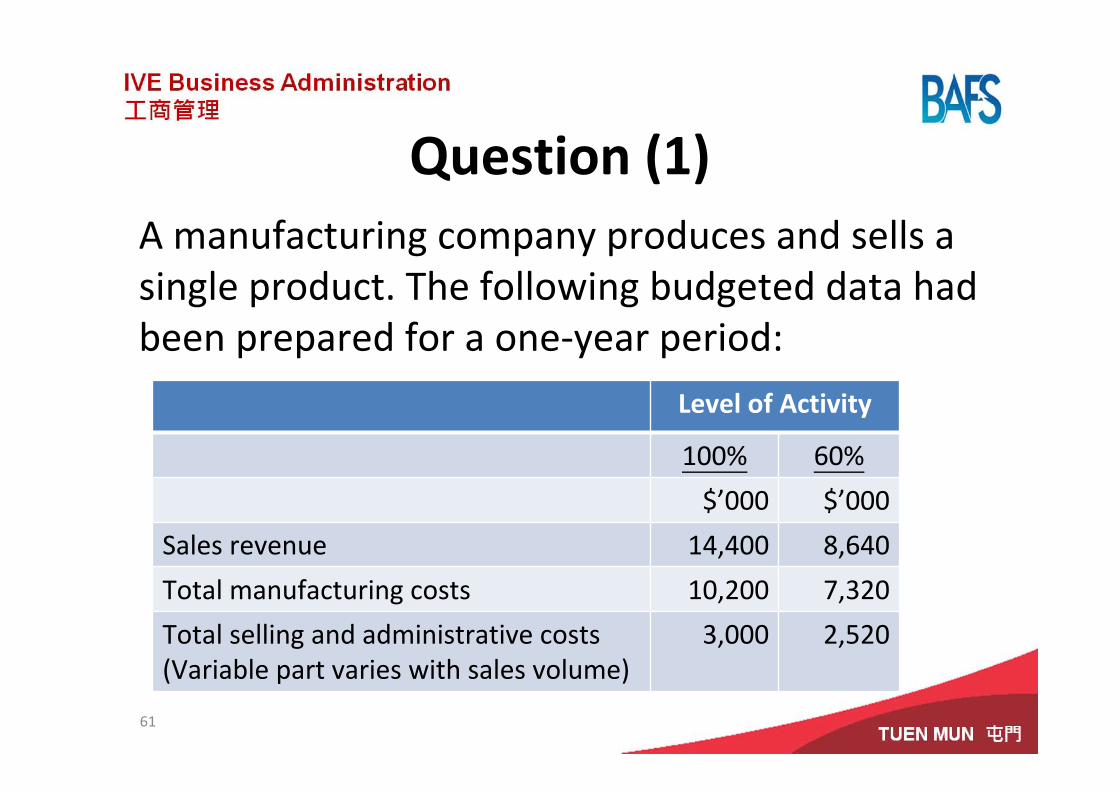
Question (1)A manufacturing company produces and sells a single product. The following budgeted data had been prepared for a one‐year period:
61
Level of Activity
100% 60%
$’000 $’000
Sales revenue 14,400 8,640
Total manufacturing costs 10,200 7,320
Total selling and administrative costs(Variable part varies with sales volume)
3,000 2,520
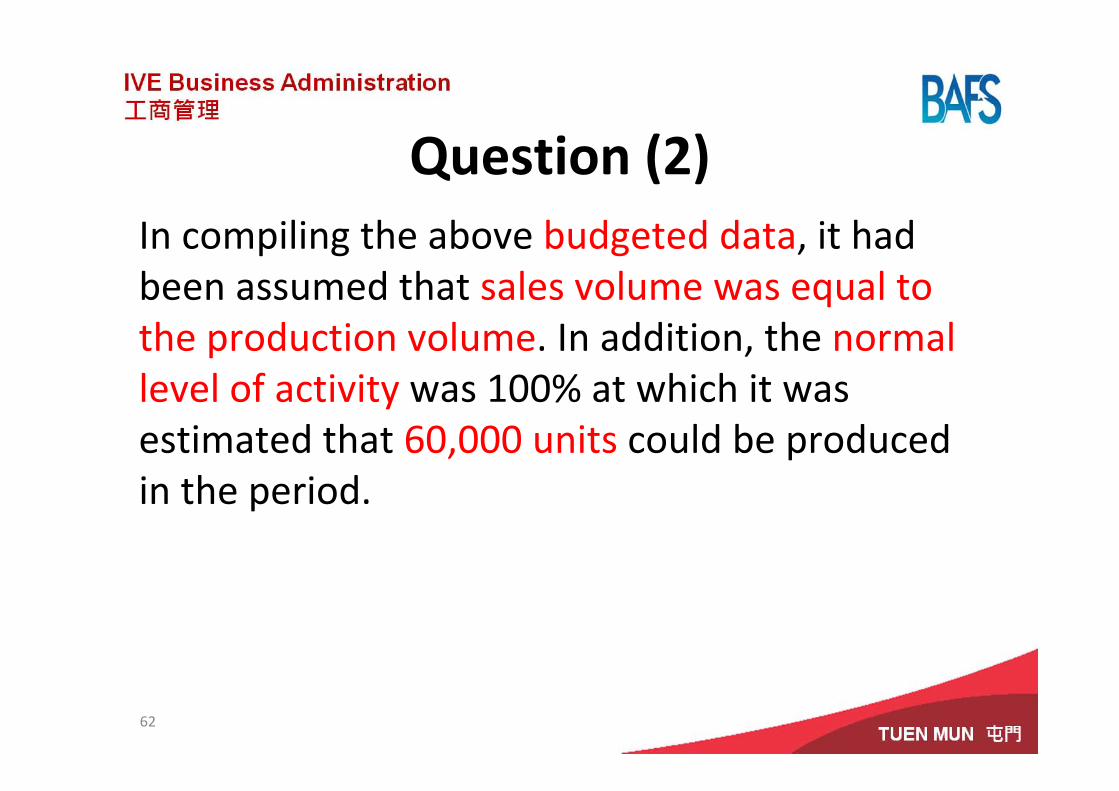
Question (2)In compiling the above budgeted data, it had been assumed that sales volume was equal to the production volume. In addition, the normal level of activity was 100% at which it was estimated that 60,000 units could be produced in the period.
62
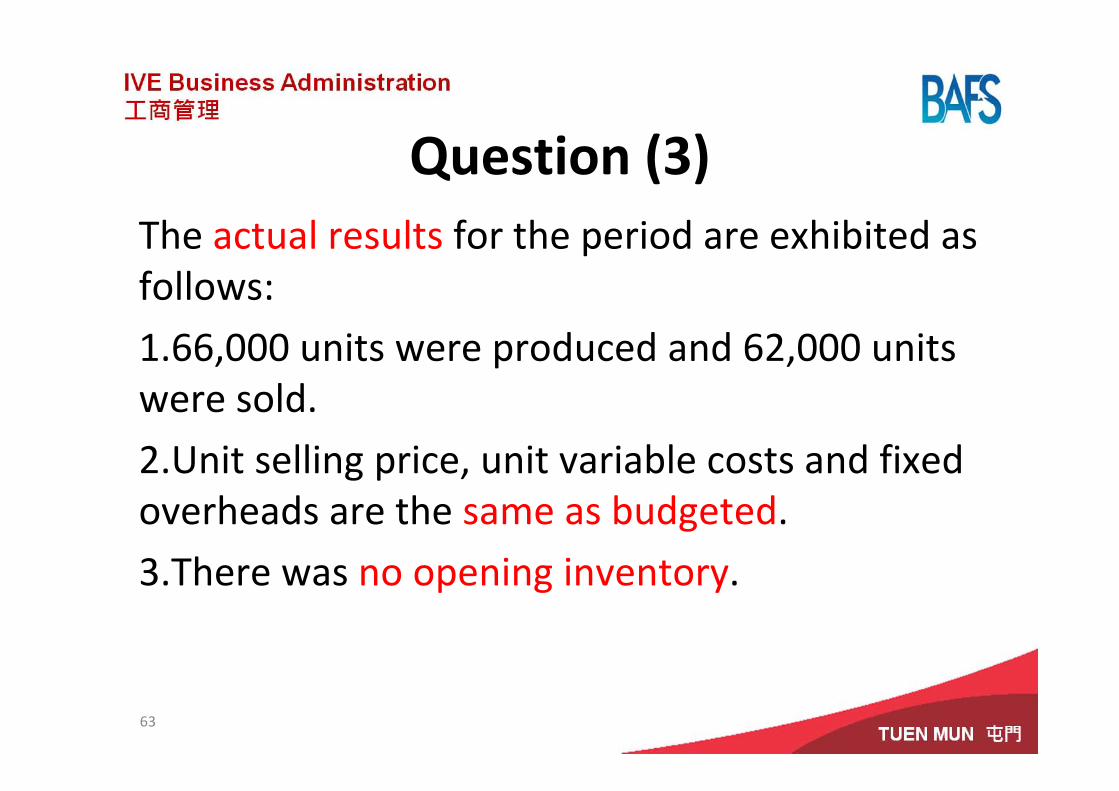
Question (3)The actual results for the period are exhibited as follows:
1.66,000 units were produced and 62,000 units were sold.
2.Unit selling price, unit variable costs and fixed overheads are the same as budgeted.
3.There was no opening inventory.
63
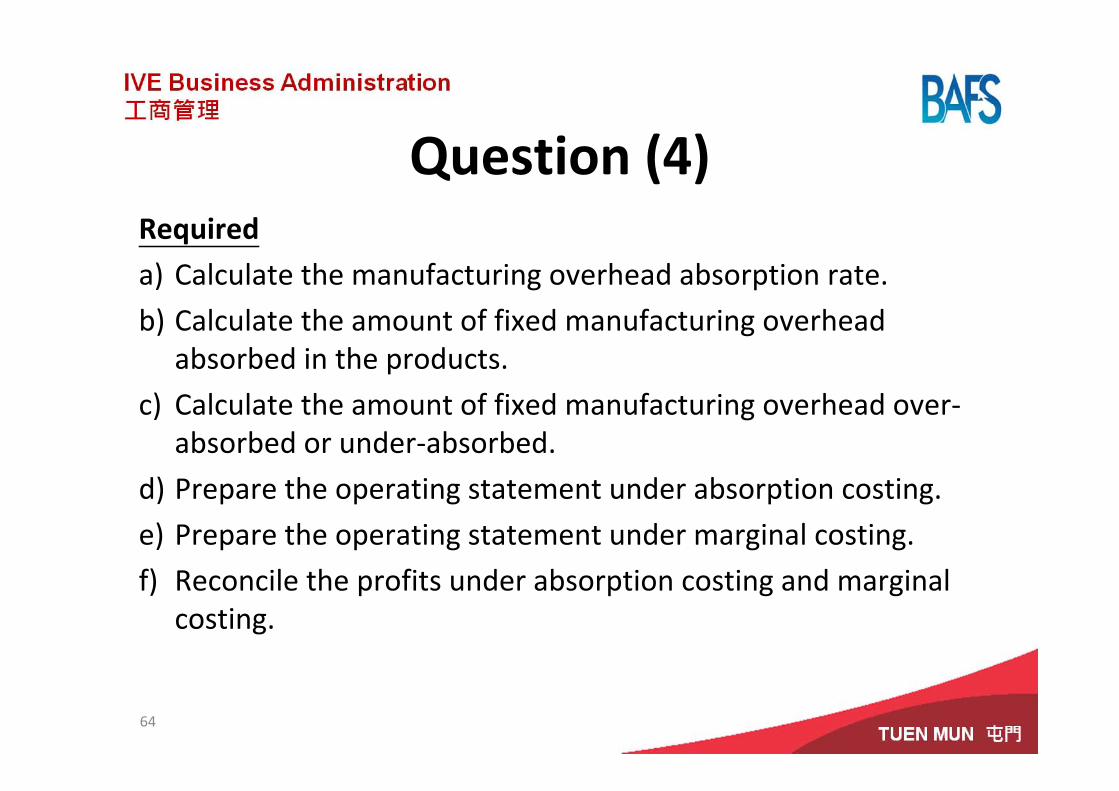
Question (4)Required
a) Calculate the manufacturing overhead absorption rate.
b) Calculate the amount of fixed manufacturing overhead absorbed in the products.
c) Calculate the amount of fixed manufacturing overhead over‐absorbed or under‐absorbed.
d) Prepare the operating statement under absorption costing.
e) Prepare the operating statement under marginal costing.
f) Reconcile the profits under absorption costing and marginal costing.
64
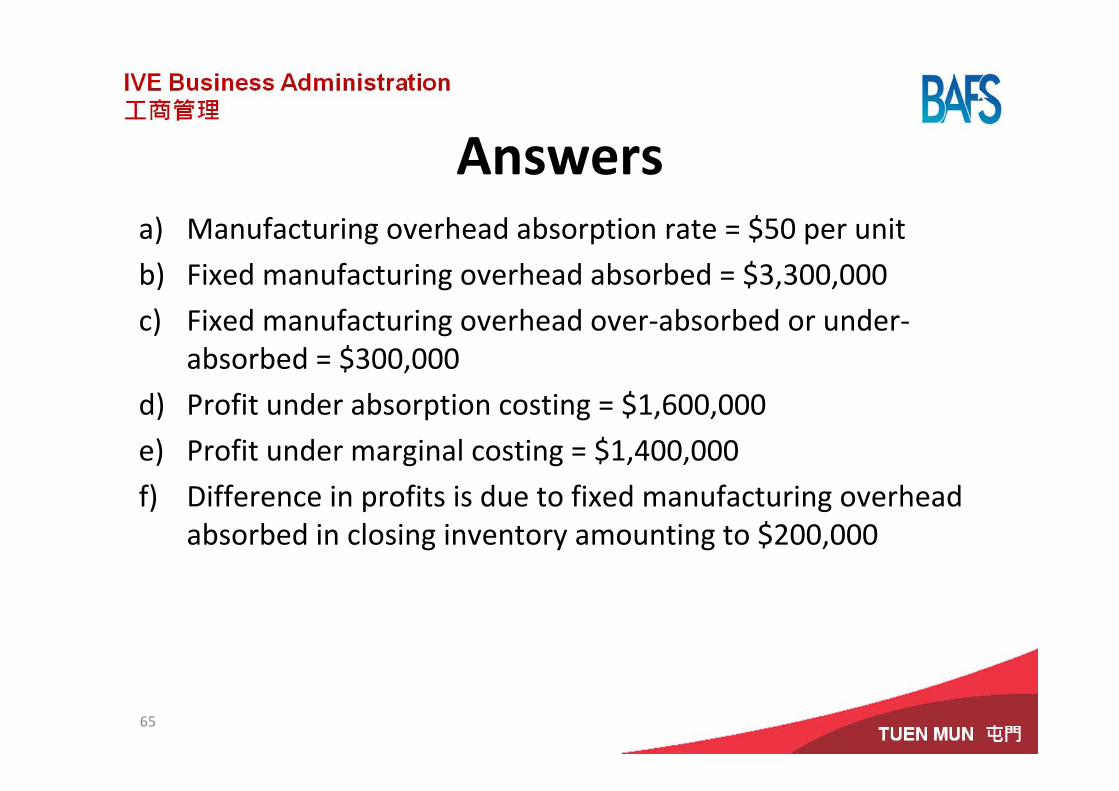
Answersa) Manufacturing overhead absorption rate = $50 per unit
b) Fixed manufacturing overhead absorbed = $3,300,000
c) Fixed manufacturing overhead over‐absorbed or under‐absorbed = $300,000
d) Profit under absorption costing = $1,600,000
e) Profit under marginal costing = $1,400,000
f) Difference in profits is due to fixed manufacturing overhead absorbed in closing inventory amounting to $200,000
65
Advantages of Absorption Costing
• It is consistent with the matching concept in which manufacturing costs of sales are matched with the sales revenue. This is why financial reporting standard requires absorption costing.
• It facilitates cost‐plus pricing strategy. In the long run for survival and profitability, prices must cover fixed costs.
66
Disadvantages of Absorption Costing
• Absorption of manufacturing fixed overheads to product units by means of overhead absorption rate can sometimes be arbitrary.
• Reported profits can be manipulated by adjusting inventory level in the short run. For example, reported profit can be boosted by inventory piling at the year end.
67
Advantages of Marginal Costing
• It facilitates various short‐term decisions making, e.g. breakeven analysis.
• It is relatively simple in the sense that it avoids overhead apportionment and absorption problems.
68
Disadvantages of Marginal Costing
• Segregation of manufacturing overheads into fixed and variable elements can sometimes be difficult and impracticable.
• It gives the wrong impression that fixed manufacturing overheads have no relationship with the manufacturing because it is excluded from product costs.
69
Further ReadingsBurgstahler, D., Horngren, C., Schatzberg, J., Stratton, W., & Sundem,
G. (2008). Introduction to Management Accounting, 14th ed. Upper Saddle River: Prentice Hall. Chapters 4 & 13.
Drury, C. (2008). Management and Cost Accounting, 7th ed. London: South‐Western Cengage Learning. Chapters 7 & 10.
Horngren, C. T., Datar, S. M., Foster, G., Raian, M. & Ittner, C. (2009). Cost Accounting: A Managerial Emphasis, 13th ed. Upper Saddle River: Prentice Hall. Chapters 5 & 9.
Lucey, T. (2009). Costing, 7th ed. London: South‐Western CengageLearning. Chapter 19.
70