covid-19 performance update · 2020-03-30 · performance metrics in three patterns: • the first...
TRANSCRIPT

March 30, 2020
Insights
COVID-19 PERFORMANCE UPDATE
915 Broadway, Suite 601 | New York, NY 10010 | 646-854-5258 | [email protected]
Wei Wu, Ph.D., CFA, Principal Data ScientistVadim Verkhoglyad, CFA, Principal Analyst
Alex Kale, UX Engineer

Data as of March 30, 2020COVID-19 Performance Report, March 30, 2020
915 Broadway, Suite 601 | New York, NY 10010 | 646-854-5258 | [email protected]
IntroductionLike the sudden and aggressive nature of COVID-19 itself, the virus has sent shockwaves throughout the financial system and the economy at large. Thus far, there have been dramatic asset price moves and speculation around the future impact on loan performance.
As local and state governments continue to impose shutdowns, unemployment claims hit record highs and the federal government injects $2 trillion into the economy, market watchers are anxiously waiting to see the full effect on loan performance across asset classes.
Because performance data is only available on a monthly basis—the typical payment frequency—and is usually reported with a lag, there has been little loan performance information available to see how consumers and businesses are responding to the slowdown.
In advance of the full payment period, dv01 is releasing the first published consumer credit report to show the up-to-date impact of COVID-19 on loan performance. Since dv01 connects directly with the largest online lenders in the consumer world to cleanse, validate and normalize loan data, we are able to make weekly observations based on daily loan performance.
This report offers an initial analysis on overall delinquency levels and new delinquency trends. Based on the data, we’ve gleaned the following insights
• There has been observed delinquency increases in the past few days related to the economic impact of COVID-19.
• Due dates on loans are spread out throughout the month, so the immediate full impact will continue to be seen over the next few weeks.
• The marketplace issuers have put programs in place to help borrowers mitigate economic hardships.
MethodologyThe data in this report represents loan performance activity reported from January 2019 through March 25, 2020. The report looked at over 1 million active loans with a total outstanding balance of over $10 billion from leading U.S. marketplace lenders. The loans have a weighted average FICO of 701, weighted average coupon (WAC) of 15.7%, and an average balance of approximately $9,600. dv01 accessed and analyzed these loans via securitizations, pass-through certificates and aggregated platform-level reporting.
Beyond looking solely at aggregate performance, dv01 filtered, and stratified performance based on a number of attributes. Among the most commonly reviewed attributes is loan grade, which is an
issuer-defined categorization of their loan portfolio based on credit attributes and linked to underlying loan interest rates.
Because of the varying grade classifications used by different issuers, dv01 utilized heuristic assumptions to group grades into 3 categories for an apples-to-apples comparison:
• Top grade representing the lower risk, lower interest rate loans
• Middle grade representing the medium risk, medium interest rate loans
• Bottom grade representing the higher risk, higher interest rate loans
Only issuers that report loan information on a daily cadence are included in this report. The report is based on the full population of loans, without any filtering or sampling, for the most accurate and complete picture. All issuer information is aggregated and no issuer-specific commentary was provided.
Investors interested in reviewing consumer unsecured loan performance can do so via our Market Surveillance, Portfolio Surveillance, and Securitization offerings. Users can reconcile daily cash flows, anticipated payment schedules, due dates, and view daily delinquency trends.
Description of presentation methodAll the charts found in this report represent day-over-day performance metrics in three patterns:
• The first chart set, labeled Figure X.1, shows aggregate performance for each calendar day, going back to the beginning of 2019.
• The second chart set, labeled Figure X.2, shows performance by day of month in 2020. All monthly performances in 2019 have been aggregated and grouped as “All 2019.” These charts show monthly performance over the course of a year, and removes the effect of seasonality.
• The third set set, found in the Appendix, labeled Figure X.3 shows the 2019 year performance by day of the month. These charts show how performance varies month to month throughout the year due to typical seasonality trends. Note: Seasonality trends are typically elevated in times of higher borrowing, such as during the shopping season.

Data as of March 30, 2020COVID-19 Performance Report, March 30, 2020
915 Broadway, Suite 601 | New York, NY 10010 | 646-854-5258 | [email protected]
Distribution of Loan Payment Due DateIn order to understand daily delinquency trends, we must first look at the distribution of loan due dates in a given month, which is the contractual date by which a borrower’s loan payment is due each month. If a loan does not receive a payment by the due date it becomes delinquent.
Figure 1.1 and 1.2 illustrate the distribution of loan payment due date and show that loan due dates are not evenly distributed. The largest portions of loans are due at the beginning of the month, with a smaller spike around the 15th and significantly level off toward the end of the month. Note: The dramatic spike at the tail end of February is due to the month only having 29 days.
By the time of the first observed increase in delinquency—around March 18th—many borrowers had already made their March payment prior to the full fallout from the novel coronavirus, so continued fallout in the delinquency trends discussed below will continue through that period.

Data as of March 30, 2020COVID-19 Performance Report, March 30, 2020
915 Broadway, Suite 601 | New York, NY 10010 | 646-854-5258 | [email protected]
Delinquency Trend analysisFigure 2.1 and 2.2 illustrate the total percentage of loans that are past due on their loans. The charts show a material and sustained increase in total percent of delinquency beginning on March 18th—and are continuing through today.
Data as of March 30, 2020COVID-19 Performance Report, March 30, 2020
915 Broadway, Suite 601 | New York, NY 10010 | 646-854-5258 | [email protected]
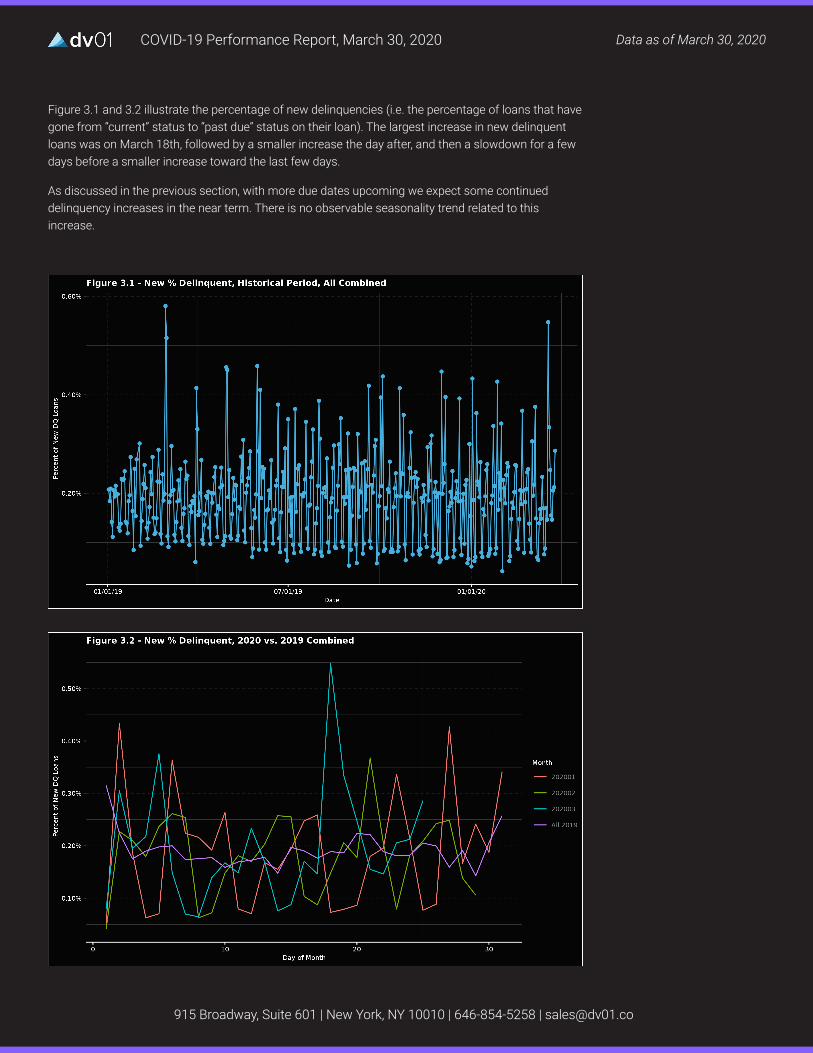
Figure 3.1 and 3.2 illustrate the percentage of new delinquencies (i.e. the percentage of loans that have gone from “current” status to “past due” status on their loan). The largest increase in new delinquent loans was on March 18th, followed by a smaller increase the day after, and then a slowdown for a few days before a smaller increase toward the last few days.
As discussed in the previous section, with more due dates upcoming we expect some continued delinquency increases in the near term. There is no observable seasonality trend related to this increase.

Data as of March 30, 2020COVID-19 Performance Report, March 30, 2020
915 Broadway, Suite 601 | New York, NY 10010 | 646-854-5258 | [email protected]
Performance Analysis By Loan GradeAs described in the methodology section, dv01 filtered and stratified loans into 3 categories and analyzed their performance. The charts below show the most significant increase in delinquencies since the 18th for the Bottom Grade, a less pronounced increase in the Middle Grade and the smallest change in the Top Grade. Although still very early in performance metrics, grade analysis shows that underwriting still plays a significant role in credit performance, despite an external disruption unrelated origination characteristics.

Data as of March 30, 2020COVID-19 Performance Report, March 30, 2020
915 Broadway, Suite 601 | New York, NY 10010 | 646-854-5258 | [email protected]
Closing RemarksGiven the growing uncertainty with COVID-19, marketplace lenders have put programs in place to aid struggling borrowers through loan modification, payment deferral or term extension. The programs have had material impact on performance thus far and will continue to do so over the coming months. The programs vary across issuers in scope, size, type of modifications and time of establishment. As these programs are standardized, dv01 users can compare the programs and offerings across our products. A full overview of the initial modification response will be forthcoming shortly.
Although the market reaction has already been swift, the economic malaise stemming from COVID-19 will be unpredictable and visible for the near future. dv01 has observed an initial increase in delinquencies, and anticipate further behavior as more loans become due. To counteract the rise, the aforementioned aid programs established by the issuers will serve as a performance bulwark, which will be discussed further in coming reports.
With the dv01 suite of offerings, investors can prepare for the torrent of performance changes with daily information on consumer patterns. Investors can stratify and filter for characteristics more relevant to their existing or potential portfolios, review trends and drill down to loan-level detail, incorporate updated assumptions to value future cash flows and create portfolio reports. dv01, in its role in providing transparency to investors and issuers in consumer credit markets, will continue to monitor trends and provide commentary as we see continuing developments.
About dv01As the world’s first end-to-end data management, reporting and analytics platform for loan-level consumer lending data, dv01 is bringing unparalleled transparency and intelligence to every securitization for every investor.
With 380+ securitizations on the platform, dv01 has partnered with 20+ issuers and provided securitization reporting and analytics across $88 billion consumer unsecured and mortgage transactions. Additionally, in 2019, dv01 onboarded the CRT dataset, consisting of 81 transactions for a total notional balance of $2.4 trillion.
By building the most comprehensive library of MBS and ABS data, dv01 is empowering the capital markets with world-class tools to make safer data-driven decisions. Learn more at dv01.co or contact [email protected] for more information.

Data as of March 30, 2020COVID-19 Performance Report, March 30, 2020
915 Broadway, Suite 601 | New York, NY 10010 | 646-854-5258 | [email protected]
Appendix—2019 Combined broken into Month-to-Month charts

Data as of March 30, 2020COVID-19 Performance Report, March 30, 2020
915 Broadway, Suite 601 | New York, NY 10010 | 646-854-5258 | [email protected]

Data as of March 30, 2020COVID-19 Performance Report, March 30, 2020
915 Broadway, Suite 601 | New York, NY 10010 | 646-854-5258 | [email protected]
Disclaimer• This report is intended as a general overview and discussion. It does not constitute an offer to sell
or a solicitation of an offer to buy any security.
• dv01 does not make an effort to differentiate or opine on specific issuers or issuer performance trends within a specific sector.
• dv01 also does not seek to influence future performance or opine on the investment returns of any particular investment strategy.
• Investors should consider this publication as only a single factor in making their investment decision.
• Past performance is not a guarantee of future performance.
• All opinions, projections, and estimates constitute the judgment of the author as of the date of publication and are subject to change without notice.
• No material, non-public information was used to derive the findings and analysis of this report.
• dv01 has established policies and procedures to maintain the confidentiality of certain nonpublic information received in the course of its business operations.
• This report has been prepared independently of any issuer of securities mentioned herein. In no instance is this report being published in connection with any proposed offering of securities or as an agent of any issuer of any securities.
• dv01 does not have any authority whatsoever to make any representation or warranty on behalf of an issuer.
• dv01 does and seeks to do business with companies covered in this research report. As a result, investors should be aware that dv01 may have a conflict of interest that could affect the objectivity of this report. However, readers should also note that dv01 has in place organizational and administrative arrangements to manage potential conflicts of interest of this nature.
• No part of the author’s compensation was, is, or will be, directly or indirectly, related to the specific recommendations or views expressed by the author in this report.
• While dv01 has obtained information from sources it believes to be reliable, dv01 undertakes no duty of due diligence or independent verification of any information it receives.
• dv01 does not accept any liability whatsoever for any direct, indirect or consequential damages or losses arising from any use of this information including out of actions taken or not taken on this basis of this publication.
• dv01 assumes no obligation to make any updates following publication in any form or format.