covid deaths of people with learning disabilities
TRANSCRIPT
1
Deaths of people identified as having learning disabilities with COVID-19 in England in the spring of 2020
2
Contents Summary .................................................................................................................... 4
Aim of the review .................................................................................................... 4
Methods .................................................................................................................. 4
The number of people identified as having learning disabilities who died with COVID-19 ........................................................................................................ 4
Sections of the population with learning disabilities at greatest risk........................ 6
Deaths in care settings ........................................................................................... 7
Introduction ................................................................................................................ 9
Approaches and assumptions............................................................................... 10
Main sources of data ................................................................................................ 17
Learning Disabilities Mortality Review (LeDeR) .................................................... 17
Hospital deaths dataset ........................................................................................ 17
Notifications to the CQC of deaths of people receiving social care ...................... 18
Population with learning disabilities ...................................................................... 18
General population mortality data ......................................................................... 19
Outbreaks of COVID-19 in residential care settings ............................................. 19
How many people identified as having learning disabilities have died with COVID-19? ............................................................................................................... 20
Main messages ..................................................................................................... 20
Introduction ........................................................................................................... 22
Weekly trend in deaths with COVID-19 ................................................................ 29
Sections of the population with learning disabilities at greatest risk ......................... 34
Main messages ..................................................................................................... 34
Introduction ........................................................................................................... 36
Age ....................................................................................................................... 36
Sex ....................................................................................................................... 44
Ethnic group ......................................................................................................... 49
Areas of the country .............................................................................................. 51
Social deprivation ................................................................................................. 54
Deaths in care settings ............................................................................................. 55
3
Main Messages ..................................................................................................... 55
Introduction ........................................................................................................... 56
Residential social care .......................................................................................... 57
Community based social care ............................................................................... 64
Discussion ................................................................................................................ 65
Limitations ............................................................................................................ 65
References ............................................................................................................... 69
Annexe 1. The commission ...................................................................................... 73
Terms of reference ............................................................................................... 73
Purpose ................................................................................................................ 73
Data ...................................................................................................................... 73
Analysis required .................................................................................................. 73
Annexe 2. Data sources and methods ..................................................................... 75
Population data ..................................................................................................... 75
Ethnic groups ........................................................................................................ 76
Learning Disabilities Mortality Review (LeDeR) .................................................... 77
Completeness of LeDeR data ............................................................................... 78
NHS England COVID-19 Patient Notification System ........................................... 83
Calculations of rates ............................................................................................. 83
4
Summary Aim of the review The Department of Health and Social Care, with the support of the Chief Medical Officer for England, commissioned Public Health England (PHE) to review the available data on the deaths of people with learning disabilities in England during the COVID-19 pandemic. The review looked at: • deaths from COVID-19 of people with learning disabilities • factors impacting the risk of death from COVID-19 of people with learning
disabilities • deaths in care settings of people with learning disabilities
Methods The review used 3 main sources of data: 1. English Learning Disabilities Mortality Review (LeDeR) Programme (1). 2. NHS England’s COVID-19 Patient Notification System (CPNS), which
records deaths in hospital settings (2). 3. Care Quality Commission (CQC) statutory notifications of deaths of
people receiving social care (3). Where possible, findings are compared to the general population of England.
The number of people identified as having learning disabilities who died with COVID-19 PHE used data from the LeDeR and CPNS datasets to establish the number of people in England, identified as having learning disabilities, who definitely or possibly died from COVID-19 from the start of the pandemic to 5 June 2020. LeDeR and CPNS identify deaths of people known to adult services as having learning disabilities. The introductory section sets out the evidence that this is a small proportion of the people identified by schools as having learning disabilities. There is no data source that provides data about deaths
5
in this wider group of adults whose learning disabilities are not identified by health or social service. LeDeR and CPNS are incomplete sources. The study estimated that only 65% of eligible deaths are reported to LeDeR and 25% of deaths reported to CPNS have learning disabilities status recorded as ‘not known’. This means that calculations of rates of deaths per 100,000 population using either are likely to underestimate the real figures. Where rates are presented, 2 figures are given. The rate using the actual reported number of deaths of people with learning disabilities is given first. Alongside this an estimate of the likely rate is given based on an estimate of the extent of under-reporting for LeDeR data or a proportionate distribution of deaths with learning disabilities status ‘not known’ for CPNS data. Main findings LeDeR received 623 reports of deaths of people with learning disabilities considered definitely or possibly COVID-19 related occurring between the start of February and 5 June. On the basis of the likely level of under-notification, this suggests an estimated national total of 956 deaths. The number of deaths occurring between the start of February and 5 June reported to LeDeR as possibly or definitely due to COVID-19 represents a crude rate of 240 deaths per 100,000 adults with learning disabilities, 2.3 times the rate in the general population for the same period. The estimated rate, adjusting for the likely level of under-notification, was 369 per 100,000 adults with learning disabilities, 3.6 times the rate in the general population. CPNS recorded 490 deaths of adults with learning disabilities with COVID-19 up to 5 June. This represents a rate of 192 deaths per 100,000 adults with learning disabilities, 3.1 times the rates for adults without learning disabilities. If people dying with learning disabilities status ‘not known’ included the same proportion with learning disabilities as those for whom a status was recorded, there would have been 651 deaths of adults with learning disabilities, giving a rate of 254 per 100,000 population, 4 times the rate for adults without learning disabilities. In 2018 and 2019, 60% of deaths of people with learning disabilities occurred in hospital settings. In 2020, 82% of COVID-19 deaths, and 45% of deaths from other causes occurred in hospitals. In the general population a smaller proportion of COVID-19 deaths (63%) occurred in hospitals (4). Information on the numbers of deaths of people with learning disabilities in registered care settings was available for the period 10 April to 15 May 2020.
6
The overall number of deaths from all causes was 2.3 times that recorded in the same period the previous year. More information can be found in the ‘Deaths in care settings among people with learning disabilities’ section. During the peak 3 weeks, number of deaths from all causes for people with learning disabilities was 3 times the average reported for the corresponding period in the 2 previous years. For the general population in the same weeks, the number was 2 times the average for the 2 previous years. Out of the deaths recorded in the CPNS system up to 5 June, 1.8% were of people recorded having had learning disabilities. GPs in England recognise only 0.57% of adults registered with them as having learning disabilities. So, adults with learning disabilities were over-represented by at least 3.1 times among those dying. The disparity was much larger in younger age groups.
Sections of the population with learning disabilities at greatest risk COVID-19 has affected different sections of the population to different degrees. In the general population, death rates have been higher for older people, males, people from Black and minority ethnic groups and people living in areas of greater socioeconomic deprivation (5). PHE looked at the impact of these factors on the numbers and rates of death for people with learning disabilities between 21 March and 5 June 2020. Main findings Age COVID-19 deaths in people with learning disabilities were spread more widely across the adult age groups than in the general population. The 10 year age band with the largest number of deaths was 55 to 64 years for people with learning disabilities but over 75 for the general population. This reflects the pattern of deaths in previous years, and in 2020 from causes other than COVID-19. COVID-19 increased the number of deaths for people with learning disabilities by a greater margin than for the general population across the adult age spectrum. Age specific COVID-19 death rates per 100,000 population were higher for people with learning disabilities in all adult age groups but by a greater margin in younger age groups.
7
Sex The age standardised COVID-19 death rate was higher for men than for women with learning disabilities by 1.4 times in LeDeR notifications and 1.6 times in CPNS records of hospital deaths. This was slightly less than the corresponding differentials for the general population and for hospital patients without learning disabilities.
Standardising for age and sex, the rate of COVID-19 deaths notified to LeDeR, from 21 March to 5 June, was 451 per 100,000 for people with learning disabilities, 4.1 times the rate for the general population of England (109 per 100,000). Adjusting this to allow for the likely level of under-notification to LeDeR suggests a rate of 692 per 100,000, 6.3 times the general population rate.
Ethnic group The proportions of COVID-19 deaths in people with learning disabilities that were of a person from an Asian or Asian British group, or a Black or Black British group were around 3 times the proportions of deaths from all causes seen in these groups in corresponding periods of the 2 previous years, and greater than the proportions in deaths from other causes in 2020.
The number of deaths of people with learning disabilities from all causes in 2020 for White groups was 1.9 times the number in the 2 previous years. For Asian and Asian British groups it was 4.5 times the number and for Black and Black British groups, 4.4 times.
Regions of the country The number of deaths from all causes in the period studied rose for people with learning disabilities by 3.7 times in London but by only 1.6 times in the South West. Other regions had intermediate levels of increase.
The data available was not adequate to support more detailed analysis of area level social deprivation.
Deaths in care settings Social care carries potential additional risk of transmission of respiratory viruses because of frequent contact with staff and other care recipients. The study looked at the extent to which people with learning disabilities appear to have been at additional risk from COVID-19 due to the types of social care they receive.
8
Death rates in care settings were estimated from numbers of notifications to the CQC and numbers reported as receiving social care for learning disabilities in annual social care statistics. CQC data covered a shorter period from 10 April to 15 May 2020. Main findings COVID-19 accounted for 54% of deaths of adults with learning disabilities in residential care in this period, slightly less than for people with learning disabilities generally, but still much more than in the general population. The crude rate of COVID-19 deaths for adults with learning disabilities in residential care was higher than the rates of COVID-19 deaths of adults with learning disabilities generally as estimated from LeDeR. It was 2.3 times the rate calculated from actual LeDeR notifications and 1.5 times the estimated rate adjusting for likely under-notification. This difference is likely in part to reflect the greater age and disability in people in residential care. Data from PHE indicates that care homes looking after adults with learning disabilities were less likely than other care homes to have had COVID-19 outbreaks. This is likely to be related to the fact they have fewer bed spaces. COVID-19 accounted for 53% of deaths of adults with learning disabilities receiving community-based social care. It is hard to comment on the overall scale of deaths in these contexts because the numbers of people receiving care from providers likely to report their deaths is not clear. This level of additional mortality is similar to that seen in residential care.
9
Introduction There are clear reasons to be concerned about the impact of the Severe Acute Respiratory Syndrome Coronavirus 2 (COVID-19) pandemic on people with learning disabilities. Their physical health problems have been widely documented in both research and National Health Service (NHS) statistics. Among many other issues they have substantially higher death rates from respiratory infections than the general population and higher rates of some important risk factors for COVID-19 including diabetes and obesity (6,7,8). Substantial numbers of adults with learning disabilities receive some form of social care on a continuous basis. According to the most recently available figures, GPs have 255,575 adults on learning disabilities registers (9,10). Local authorities report 29,590 (equivalent to 12%) living in residential care and a further 111,190 (equivalent to 44%) receiving some form of community based social care (11). Most types of social care involve mixing with staff, and many involve mixing with other care recipients. This poses a risk of transmission of respiratory viruses. A substantial number of people identified as having learning disabilities by their GP, as well as a much larger number identified in schools but not subsequently identified by health or social care services, are also likely to have had problems during the COVID-19 pandemic. Many are likely to have had difficulty following government advice about self-isolation, social distancing and infection prevention and control. They may not have grasped the new significance of key symptoms or the advice to get tested if they develop these. Many have difficulty accessing healthcare in ordinary times and are likely to have had more difficulty negotiating the new ways to do this if needed. All these factors suggest people with learning disabilities are likely to have been more vulnerable than others in the various stages of the COVID-19 pandemic (12). This study is only able to report on deaths of people identified as having learning disabilities who are known to adult health or social care services, or who have family or friends likely to report their deaths to LeDeR. A study for Improvement Cymru identified deaths in 2020 and 4 earlier years in a cohort of just over 15,000 people with earlier hospital diagnoses of learning disabilities (13). It found a standardised COVID-19 death rate between 1 March and 26 May 2020 for this group which was between 3 and 8 times higher than the rate for the general population of Wales. The Chief Medical Officer for England commissioned PHE to analyse available data on deaths of people with learning disabilities with COVID-19
10
“to inform policy and practice to reduce the risk and impact going forward of COVID-19 on people with learning disabilities”. The terms of reference are set out in Annexe 1. Other than data relating to deaths, there is limited statistical information currently collected which provides national information about the health and healthcare of people with learning disabilities in the rapid way needed for monitoring epidemic diseases. Data about COVID-19 test results, hospital admissions and intensive care does not record usable information about whether the people involved had learning disabilities. There are 3 sources of information about deaths, which cover the whole of England and in which learning disabilities status has been systematically recorded during the pandemic. The terms of reference directed the work specifically to these. They are: • the English Learning Disabilities Mortality Review (LeDeR) Programme (1) • NHS England’s COVID-19 Patient Notification System (CPNS) which
records deaths in hospital settings (2) • Care Quality Commission (CQC) statutory notifications of deaths of people
receiving social care (3) This report sets out what this data shows about the impact of COVID-19 on deaths of people known to have learning disabilities.
Approaches and assumptions The study aimed to establish how badly the community of people with learning disabilities was hit by the first wave of the COVID-19 pandemic. Ideally, this would have required information about the numbers and details of all the people who had died, and the size and structure of the population from which they were drawn. Unfortunately, none of the available sources presented a complete picture of deaths among people with learning disabilities. The only one with a comprehensive scope (LeDeR) has known limitations in coverage (14). Information about the population with learning disabilities in England was also incomplete (see Annexe 2). This section sets out the approaches used to get as clear a picture of the situation as possible given the uncertainties arising from the limitations of the data. Two main approaches were used: examination of numbers of deaths and calculation of rates.
11
Analyses of numbers of deaths The simpler approach, less demanding in terms of the completeness of the data, was to look at changes in the number of deaths between 2020 and previous years. Changes in numbers of deaths of people with learning disabilities were compared to changes for the general population. For this approach it is not essential that the data source captures all deaths of people with learning disabilities, as long as the proportion captured does not alter substantially. LeDeR is described in more detail in the next section. It started collecting data in July 2016. For this study, data on numbers of deaths reported to it was available from the start of 2018 and to June 2020. In interpreting trends in numbers of deaths, the stability of reporting of deaths to LeDeR is important. For practical purposes the study assumed that referral channels to LeDeR remained roughly stable over the period from the start of 2018 to the study end point in early June 2020. There are two reasons why this assumption may not completely hold. The first is that as the system was new and becoming embedded over this period. Increasing awareness of it could have increased the number of relevant deaths being notified. This could have made it appear as though numbers of deaths were rising. However, deaths can be, and are, notified to LeDeR months or years after they happen. As people became more aware of the service, they could have reported deaths which occurred at any time after its inception. The other reason for questioning the assumption of stable reporting is that the exceptional circumstances of the pandemic could have increased or decreased the likelihood of deaths being notified in this context. The approach of comparing numbers of deaths in 2020 with an earlier period was also used with the CQC data which provided counts of death notifications for a comparable period of 2019. This is a statutory notification process, so reporting of eligible deaths is likely to be more dependable. It could not be used for the hospital deaths data in the CPNS as this covers only the pandemic period and only deaths attributed to COVID-19. Rates and population A more commonly used and more satisfactory approach to quantifying the extent of deaths in population subgroups is calculation of rates of death per unit of population, per unit of time. In addition to numbers of deaths, this requires data about the size of the population in which the deaths have occurred. If sufficiently detailed data is available about the age and sex structure of the population, rates can be standardised to take account of differences in the composition of population groups compared.
12
Identifying the numbers in the population with learning disabilities is not simple. Learning disability is distributed on a continuum from mild to profound. Epidemiological studies of the proportion of populations with learning disabilities have given widely differing results (15). In part this reflects a distinction between the ‘administrative’ prevalence, which is the number known to health, social, educational or other types of service providers, and the ‘true’ prevalence, which is the number of people who actually have learning disabilities, many of whom may not have been identified as needing services. True prevalence figures can only be established by population-based survey methods. Administrative prevalence estimates vary depending on the purpose served by the data source used. Studies in the United States and Australia have demonstrated that estimates based on data from education services give much higher figures than those from health or social care services (16,17). This is reflected in current English administrative prevalence data. Schools identify that 4.15% of children have learning difficulties arising from intellectual disabilities (3.50% moderate learning difficulties and a further 0.65% severe or profound learning difficulties) (18), general practices identify 0.50% of patients on their learning disabilities registers (9), and local authority social services departments provide long term social care supports to 0.34% of adults (11). Previous PHE publications have discussed this range of prevalence figures (19). An important issue when interpreting the deaths data available for this study is which of these levels of ascertainment is likely to be reflected in referrals made to the LeDeR programme and recording of learning disabilities in respect of deceased individuals on the CPNS system. LeDeR developed out of the Confidential Inquiry into Premature Deaths of People with Learning Disabilities (CIPOLD) (20). CIPOLD was one of the initiatives to address the deficiencies identified by the independent inquiry into Access to Healthcare for People with Learning Disabilities (21). CIPOLD and LeDeR have formed part of a decade of work by the NHS and partner agencies to increase awareness of the needs of people with learning disabilities in healthcare settings. In primary care services this has involved learning disabilities registers and annual health checks. More widely it has involved the appointment of hospital liaison nurses, primary care liaison nurses, initiatives to improve the accessibility of health services, enhancing communication between different elements of health services and between health and social care services, and monitoring uptake by people with learning disabilities of key interventions such as cancer screening and influenza immunisation. All these initiatives centre round GP learning disabilities registers, and drives to ensure that everyone with learning disabilities is registered to ensure they get the benefits.

13
LeDeR depends on voluntary notifications of deaths by people familiar with deceased individuals. When deaths of adults with learning disabilities are notified to the programme, it is usually done by health or care staff but some are notified by relatives. Publicity to encourage notification has been focussed through professional networks and third sector campaigning groups. The process of undertaking reviews of deaths notified to LeDeR is organised by staff in NHS region offices. Reviews increase awareness of the process through local health and social services. This positioning suggests that the population whose deaths are likely to be reported to LeDeR is probably most closely approximated by the population on GP learning disabilities registers. Unfortunately, there is no current direct evidence on this point. The CIPOLD study specifically asked whether deceased individuals had been on learning disabilities registers. It found that in 92% of the deaths referred to them they had been (20). The regular LeDeR dataset does not ask this question. However, LeDeR care reviews do ask whether deceased individuals had a learning disabilities health check with their GP in the year prior to their death. This data is not published as its accuracy is difficult to verify, but the proportion of cases in which records show the deceased did have a health check is consistently higher than the national coverage of the health check programme. This suggests that a large proportion of reports to LeDeR are the deaths of people whose learning disabilities were known to their GP. By contrast, the CPNS system was set up to monitor all deaths from COVID-19 occurring in English hospitals. The question in this case is what characterises the people who nursing or medical staff identify and record as having had learning disabilities. During the period covered by this study, the relevant acute facilities of hospitals were under intense pressure from the large number of patients. Patients would probably only have been admitted to hospital in extreme clinical conditions. Staff would have faced great pressure managing patients’ physical needs and many patients who would usually have had no cognitive impairment, would have been admitted in febrile states, or nursed under sedation, making assessment of their intellectual faculties difficult or impossible until they moved into a recovery phase. It seems likely that hospital staff would initially have depended on information provided by referring doctors, relatives or care homes for details of whether patients had learning disabilities. For patients who died it seems unlikely they would have explored further. So, the people hospital staff identified as having learning disabilities are likely to have been those with established care networks who
14
were on their GPs register. The large proportion (25%) of deceased patients whose learning disabilities status was reported as ‘not known’ seems to reflect the extreme physical state in which many patients were admitted to hospital care. On this basis the study assumed that GP learning disabilities registers provide a rough working definition of the population whose deaths are reported to LeDeR and who are likely to have been recorded as having had learning disabilities in CPNS. Data about the size and age and sex structure of this population is available from the Learning Disabilities Health and Care (LDHC) dataset. Unfortunately, it does not provide information about ethnicity. There is no satisfactory official source of data about the ethnic makeup of the adult population with learning disabilities in England (22). Data is available about children with learning disabilities from school special educational needs statistics (18). However, for a study of COVID-19 deaths, adult data is needed. The Office for National Statistics (ONS) has made estimates of the ethnic composition of the whole population of England up to 2018, although there are significant reservations about their reliability (23). They do not have the status of either official statistics or ONS experimental statistics. But there is no basis for estimating the proportion of adults in each ethnic group who have learning disabilities. Completeness of data Both the LeDeR and the CPNS datasets have other problems. In the case of LeDeR, the annual report for 2018 raised the issue of how completely deaths within the scope of the programme are reported (14). It estimated that in most NHS regions the number of deaths notified to them was between 70% and 88% of the likely number of deaths of people on learning disabilities registers. In one region there were 22% more notifications than estimated deaths, suggesting that deaths from previous years were being notified late. In the case of CPNS the 25% of deaths where the learning disabilities status of the deceased is not known has already been mentioned. As one aim of this study was to compare COVID-19 mortality rates in people with and without learning disabilities, some approach was needed to address these gaps. Rates calculated from LeDeR notifications using simply the numbers of cases reported would underestimate the national rates. Rates calculated from CPNS data using only the numbers of deaths where learning disabilities status was known and recorded would also be likely to produce an underestimate.
15
In the case of LeDeR data, the scale of the likely under-reporting can be estimated from the LDHC dataset (10). This collects data annually, from general practices, comparing the health and care of people on learning disabilities registers to that of other people registered with the same practices. It is described further below as it is one of the sources from which the population data for this study is drawn. As well as health and population data, the LDHC records annual numbers of deaths of people on learning disabilities registers from practices able to contribute data. Currently it covers just over half of England. This is the source on which earlier estimates of the completeness of notification to LeDeR were based. For this study, the estimate of under-reporting was revised with the most recent LDHC data (April 2018 to March 2019). This is described fully in Annexe 2. This report presents basic rates from LeDeR data, using just the numbers of deaths reported and the population estimates from LDHC. Alongside these it presents estimates of the probable rates assuming likely levels of under-notification. In the case of CPNS data, there is no obvious steer as to how the deaths with learning disabilities status recorded as ‘not known’ should be considered. This study took two approaches. Basic calculations of rates for people with learning disabilities definitely recorded, assumed that where the deceased’s learning disabilities status was recorded as ‘not known’ they did not to have learning disabilities. Alongside these, a second set of estimates was calculated assuming that people whose status was ‘not known’ had the same likelihood of having learning disabilities as those whose status was known and they were distributed accordingly. This is described further in section 3. Terms of reference and presentation The terms of reference requested PHE to look at the peak 6 weeks of the COVID-19 pandemic. The start of the period of high death rates in England is reasonably clear, the end is less distinct. Numbers of deaths of people with learning disabilities are also relatively low for statistical analysis. Therefore, the period for most of the analyses was extended to the 11 weeks from 21 March to 5 June 2020. This end date was arbitrary, arising from the need to finalise datasets. Only the deaths of adults were included in most of the analyses as very few deaths of children were reported in the 3 datasets, and population data for children with learning disabilities is less reliable than for adults. Several of the areas set out in the terms of reference naturally overlap. So, findings are organised around 3 main questions:
16
• How many people with learning disabilities have died with COVID-19? • What characteristics identify which people with learning disabilities are at
greater risk than others? • Is there evidence of specific risks related to social care provision? The report begins with a brief description of the main datasets used. This is followed by 3 results sections and a short discussion of the findings. Additional details about the data sources and a fuller description of the approaches to calculating the various measures is given in Annexe 2.
17
Main sources of data Learning Disabilities Mortality Review (LeDeR) LeDeR is a continuing national survey of deaths of people in England with learning disabilities. The LeDeR methodology is described in their most recently annual report (1). Data collection started in July 2016 (24). Deaths are notified to a national team based in Bristol. Reviews of deaths are conducted locally to where the deceased lived, so the Bristol team initially collects only the limited data required to provide regional co-ordinators with the information they need to initiate their work. As full reviews usually take several months, initial notification data was used for the study. During March 2020 the Bristol team identified a number of deaths in which COVID-19 was reported as a cause of death. In early April they added a question to their notification form asking, ‘Do you believe the death is related to COVID-19 (coronavirus)?’ Notifiers could answer ‘No’, ‘Possibly’, ‘Yes - confirmed COVID19’, or ‘Not known’. Deaths are often notified several weeks after they occur and are also commonly reported to LeDeR by more than one person. A small number of notifications are made more than a year after the death. If notification data is incomplete, multiple notifications are not always clear. If not initially obvious, they are usually identified by regional review co-ordinators and corrected on the main data system. To allow for these eventualities as far as possible, the initial data extract on which most of the work for this study was done was updated with an extract taken on 4 September, 3 months after the period being described.
Hospital deaths dataset The COVID-19 Patient Notifications System (CPNS) was set up as part of the national management of the pandemic in the English NHS. Hospitals are required to record deaths on this system when either the deceased had a positive COVID-19 test result or COVID-19 was cited as a main or contributory cause on the death certificate (2). On 24 March the system was modified to include a question asking whether the deceased had learning disabilities and/or autism. When a death is recorded noting that the deceased did have learning disabilities or autism, a
18
further question asks which (learning disabilities, autism or both). In 92% of cases where a person was recorded as having learning disabilities this field was left blank. In 4 cases it was recorded that the person had autism but not learning disabilities. These were placed in the ‘no learning disabilities’ group. Because autism was so rarely reported, for brevity, this data item is referred to in this report as the ‘learning disabilities status’. Anonymised statistical data from this source is available to PHE. An initial data extraction was made in July for the analyses in this report. This was updated on 8 September. A quarter (25%) of records in CPNS had the learning disabilities field either marked as ‘not known’ or including no entry. For brevity these are both referred to as having this status ‘not known’.
Notifications to the CQC of deaths of people receiving social care Registered social care providers are required to report deaths of people for whom they are providing care to the CQC under Section 16 of the Registration Regulations (25). Notifications are made using a standard form which includes a question on whether the deceased had learning disabilities. The form was modified on 10 April in response to the rapidly developing numbers of deaths related to COVID-19. From that date it included a question asking, ‘Was the death as a result of: Confirmed coronavirus? or Suspected coronavirus?’ (26). Forms documenting all deaths notified between 10 April and 15 May were collated by the CQC, along with the forms documenting deaths notified in the corresponding period of 2019 for comparison. Findings from this exercise were published by the CQC in June and extracts from the data was made available to PHE (3).
Population with learning disabilities The NHS produces 2 annual measures of the number of people with learning disabilities in England. General practitioners are required to keep a register of patients registered with them who have learning disabilities. An annual count of the number of these is reported in the NHS Digital Quality and Outcomes Framework (QOF) statistics (9). This provides only a total number for each general practice. Further details about the age and sex breakdown, some health characteristics and the numbers of deaths in the preceding year are
19
collected annually, also by NHS Digital, in the LDHC dataset (10). This dataset is unfortunately only collected from just over half of general practices. Annexe 2 describes how these 2 data sources were used to produce full population estimates for this study. Unfortunately, neither of these data sources gives information about the ethnic profile of patients.
General population mortality data Data about the numbers of deaths with COVID-19 or from other causes was taken from the provisional national mortality tables collated by the ONS and made available to PHE.
Outbreaks of COVID-19 in residential care settings Data about outbreaks of COVID-19 in residential care homes comes from the software system PHE centres and regions use to record infectious disease outbreaks reported to them. The extract used for this study was taken on 29 July 2020.
20
How many people identified as having learning disabilities have died with COVID-19? Main messages Both LeDeR and CPNS are incomplete sources. The study estimated that only 65% of eligible deaths are reported to LeDeR. Twenty-five percent of deaths reported to CPNS have learning disabilities status recorded as ‘not known’. This means that calculations of rates of deaths per 100,000 population using either are likely to underestimate the real figures. Where rates are presented, 2 figures are given. The rate using the actual reported number of deaths of people with learning disabilities is given first. Alongside this, an estimate of the rate is given based on an estimate of the extent of under-reporting for LeDeR data, or a proportionate distribution of deaths with learning disabilities status ‘not known’ for CPNS data. LeDeR received 623 reports of deaths of people with learning disabilities considered definitely or possibly COVID-19 related occurring between the start of February and 5 June. On the basis of the likely level of under-notification, this suggests an estimated national total of 956 deaths. The number of deaths occurring between the start of February and 5 June, reported to LeDeR as possibly or definitely due to COVID-19 represents a crude rate of 240 deaths per 100,000 adults with learning disabilities, 2.3 times the rate in the general population for the same period. The estimated rate, adjusting for the likely level of under-notification, was 369 per 100,000 adults, 3.6 times the rate in the general population. CPNS recorded 490 deaths of adults with learning disabilities with COVID-19 up to 5 June. This represents a rate of 192 deaths per 100,000 adults with learning disabilities, 3.1 times the rate for adults without learning disabilities. If people dying with learning disabilities status ‘not known’ included the same proportion with learning disabilities as those for whom a status was recorded, there would have been 651 deaths of adults with learning disabilities, giving a rate of 254 per 100,000 population, 4 times the rate for adults without learning disabilities.
21
In 2018 and 2019, 60% of deaths of people with learning disabilities occurred in hospital settings. In 2020, 82% of COVID-19 deaths, and 45% of deaths from other causes occurred in hospitals. In the general population a smaller proportion of COVID-19 deaths (63%) occurred in hospitals (4). The number of deaths of people with learning disabilities notified to the CQC in registered care settings were available for 5 weeks starting during the peak period of the pandemic. The overall number of deaths from all causes was 2.3 times that notified in the same period the previous year. During the peak 3 weeks of the pandemic, the number of deaths from all causes for people with learning disabilities was 3 times the average reported for the corresponding period in the 2 previous years. For the general population in the same weeks, the number was 2 times the average for the 2 previous years. Of the deaths recorded in the CPNS system up to 5 June, 1.8% were people recorded as having learning disabilities. GPs in England recognise only 0.57% of adults registered with them as having learning disabilities. Adults with learning disabilities were over-represented by at least 3.1 times. The disparity was much larger in younger age groups.
22
Introduction The 3 available data sources cover different parts of the whole picture of deaths of people with learning disabilities in the COVID-19 pandemic. This section aims to establish the overall scale of deaths and to clarify the overlap of the 3 sources. Data from the LeDeR and CPNS datasets was used to try and establish the number of people in England with learning disabilities known to services who died, definitely or possibly, as a result of COVID-19 up to 5 June 2020. This provides a way to check the extent to which the 2 data sources agree with each other, allowing for differences in scope. Data from the CQC covers a more limited time period and was compared with LeDeR data for the same period.
Learning disabilities mortality review data LeDeR data identified 623 deaths, occurring up to 5 June, for which COVID-19 was identified as a possible or definite cause. Of these, 614 were adults and 9 were children or young people aged under 18. The 2 earliest occurred in February, a few weeks before the earliest deaths recorded by ONS for which COVID-19 was given as a certified cause. Larger numbers began to appear in the middle of March. LeDeR consider the completeness of their data by comparing the number of deaths of people with learning disabilities reported to them with national number estimated from general practice data published regularly by NHS Digital in the LDHC dataset (14). This calculation was repeated with the most recent LDHC data (covering April 2018 to March 2019) (10) and is set out in Annexe 2, Table A2. It suggested that the deaths reported to LeDeR in that period represented around 65% of the number of deaths of people with learning disabilities estimated from general practice data. The estimate ranged from 58% to 74% between regions. No evidence is yet available about whether deaths with COVID-19, or during the pandemic period, would be more or less likely to be under-reported to LeDeR than deaths in recent years. However, it is worth noting that the table in Annexe 2 shows that for adults, the extent of under-reporting is greater at older ages. So, for a condition such as COVID-19, where deaths tend to be at older ages, the extent of under-reporting is potentially greater than for adults overall. However, it is also possible that the unusual circumstances of the pandemic may have led to more complete reporting.
23
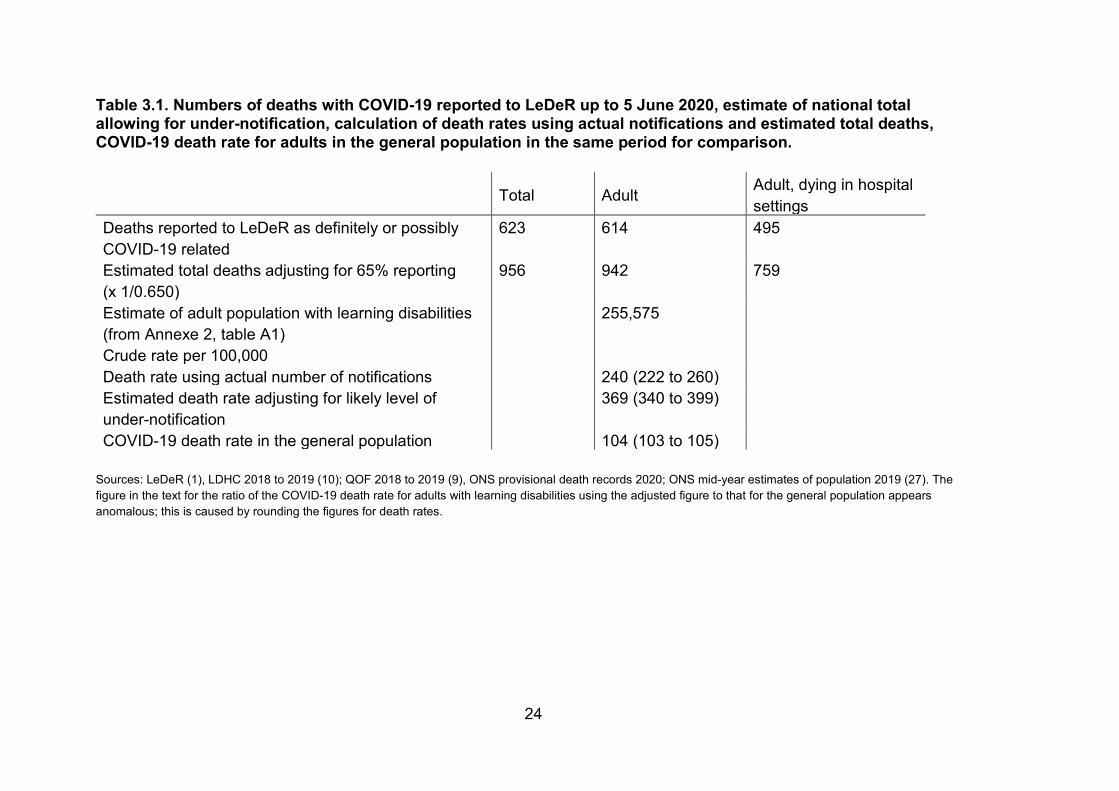
The calculation of the estimate of the number of deaths of people with learning disabilities with COVID-19 in England, up to 5 June, is set out in Table 3.1. Assuming 65% notification, the reported number suggests an estimated total of 956, with 942 of them being adults. Crude rates are calculated by dividing the number of deaths by the number in the population. This makes no allowance for differences in the age or sex composition of groups being compared. The crude rate of deaths with COVID-19 for the general adult population of England for the period was 104 per 100,000 adults. Table 3.1 shows that the number of deaths reported to LeDeR gives a rate of 240 per 100,000 adults with learning disabilities. This was 2.3 times the general population rate. The estimate of the likely rate, allowing for only 65% notification of deaths was 369 per 100,000, 3.5 times the general population rate. LeDeR initial notification records ask where the person died. Table 3.1 also shows the number of adults with learning disabilities reported to LeDeR as dying with COVID-19 in hospital settings, and an estimate of the total allowing for 65% reporting, for comparison with the recorded hospital deaths set out in the next table. In the analyses using LeDeR data that follows in this report, where population-based rates are calculated for comparison with general population data, the same 2 estimates are presented. One used the actual reported numbers and a second estimated the figure based on the estimate that only 65% of relevant deaths were being reported to LeDeR. Where analyses present simply numbers of deaths, usually comparing numbers for 2020 with numbers for 2018 and 2019, adjustment is not necessary and has not been used. Table and figure legends indicate where the data has been adjusted.
24
Table 3.1. Numbers of deaths with COVID-19 reported to LeDeR up to 5 June 2020, estimate of national total allowing for under-notification, calculation of death rates using actual notifications and estimated total deaths, COVID-19 death rate for adults in the general population in the same period for comparison. Total Adult Adult, dying in hospital
settings Deaths reported to LeDeR as definitely or possibly COVID-19 related
623 614 495
Estimated total deaths adjusting for 65% reporting (x 1/0.650)
956 942 759
Estimate of adult population with learning disabilities (from Annexe 2, table A1)
255,575
Crude rate per 100,000 Death rate using actual number of notifications 240 (222 to 260) Estimated death rate adjusting for likely level of under-notification
369 (340 to 399)
COVID-19 death rate in the general population 104 (103 to 105) Sources: LeDeR (1), LDHC 2018 to 2019 (10); QOF 2018 to 2019 (9), ONS provisional death records 2020; ONS mid-year estimates of population 2019 (27). The figure in the text for the ratio of the COVID-19 death rate for adults with learning disabilities using the adjusted figure to that for the general population appears anomalous; this is caused by rounding the figures for death rates.
25
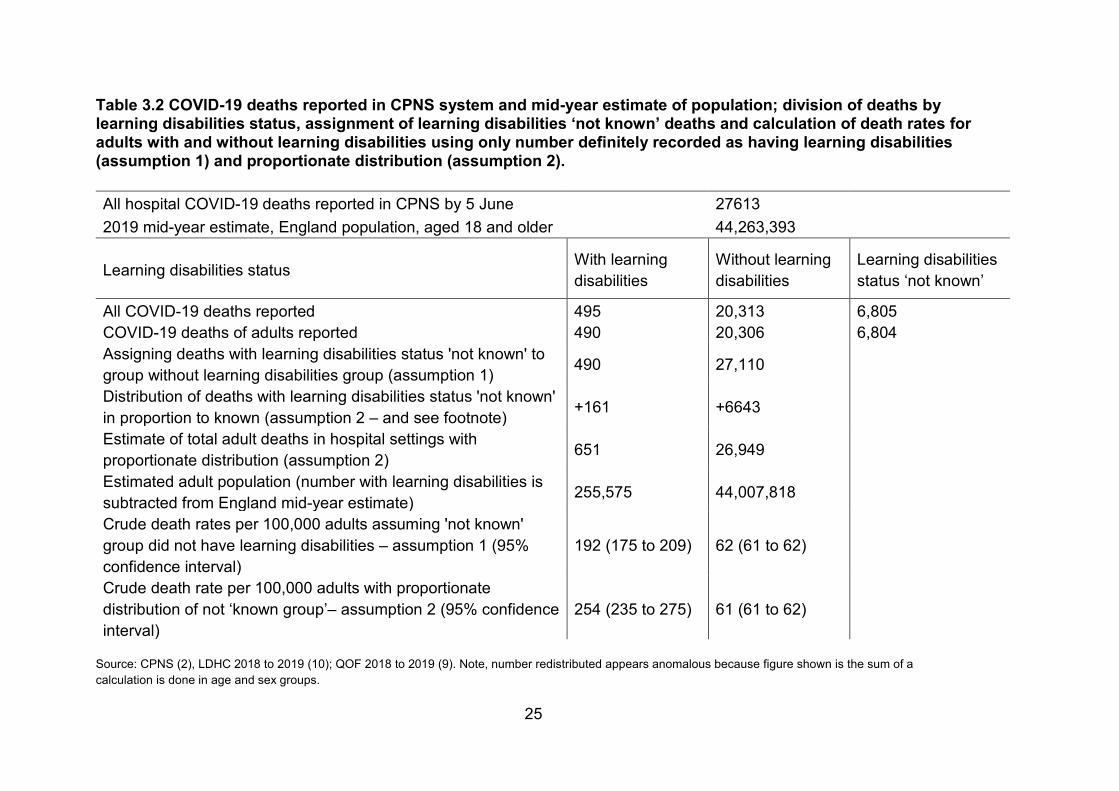
Table 3.2 COVID-19 deaths reported in CPNS system and mid-year estimate of population; division of deaths by learning disabilities status, assignment of learning disabilities ‘not known’ deaths and calculation of death rates for adults with and without learning disabilities using only number definitely recorded as having learning disabilities (assumption 1) and proportionate distribution (assumption 2).
All hospital COVID-19 deaths reported in CPNS by 5 June 27613 2019 mid-year estimate, England population, aged 18 and older 44,263,393
Learning disabilities status With learning disabilities
Without learning disabilities
Learning disabilities status ‘not known’
All COVID-19 deaths reported 495 20,313 6,805 COVID-19 deaths of adults reported 490 20,306 6,804 Assigning deaths with learning disabilities status 'not known' to group without learning disabilities group (assumption 1) 490 27,110
Distribution of deaths with learning disabilities status 'not known' in proportion to known (assumption 2 – and see footnote) +161 +6643
Estimate of total adult deaths in hospital settings with proportionate distribution (assumption 2) 651 26,949
Estimated adult population (number with learning disabilities is subtracted from England mid-year estimate) 255,575 44,007,818
Crude death rates per 100,000 adults assuming 'not known' group did not have learning disabilities – assumption 1 (95% confidence interval)
192 (175 to 209) 62 (61 to 62)
Crude death rate per 100,000 adults with proportionate distribution of not ‘known group’– assumption 2 (95% confidence interval)
254 (235 to 275) 61 (61 to 62)
Source: CPNS (2), LDHC 2018 to 2019 (10); QOF 2018 to 2019 (9). Note, number redistributed appears anomalous because figure shown is the sum of a calculation is done in age and sex groups.
26
Records of hospital deaths At the time the data for this study was taken, the CPNS database had recorded 27,613 COVID-19 deaths in hospital settings occurring on or before 5 June. Table 3.2 sets out the figures. For 495 of the deaths (including 5 aged under 18) the deceased was recorded as having had learning disabilities. For 6,805 (25%, 1 of these aged under 18) the learning disabilities status of the deceased was recorded as ‘not known’. The proportion of deaths with learning disabilities status ‘not known’ ranged from 15% to 32% between NHS regions.
For calculating rates in relation to the population, the number with learning disabilities status ‘not known’ was too large to ignore. It is possible that some of these may have had learning disabilities. Since the largest estimate of the proportion of the population who have learning disabilities was below 5% (see introduction), it is likely that the great majority did not. Two assumptions could be made.
1. None of these people had learning disabilities.2. The proportion of the ‘not known’ group who had learning disabilities in
each age and sex group was the same as the proportion of thosewhose learning disabilities status was recorded.
Assumption 2 added 161 deaths from the ‘not known group’ to the group with learning disabilities. Here, and in later rate calculations in this report, figures are given for these 2 possible assumptions.
The choice of assumption made little difference to the rate of hospital COVID-19 deaths among people without learning disabilities. The crude rate, up to 5 June, was 62 per 100,000 adults using the assumption 1, and 61 per 100,000, using the assumption 2. The crude COVID-19 death rate for people identified in CPNS as having learning disabilities (assumption 1) was 192 per 100,000 adults, 3 times the rate for people without learning disabilities. Adding a proportionate number of deaths from the ‘not known’ group (assumption 2) gave an estimated crude rate of 254 per 100,000, 4 times the rate for people without learning disabilities.
It was not possible to match individuals in the LeDeR and CPNS datasets because neither source allowed access to person identifying information. So, the only available approach for analysing how closely these 2 sources align was to compare the overall numbers. LeDeR notifications indicated that 495 of the deaths of adults with definite or possible COVID-19 notified to them occurred in hospital settings. Adjusting for under-notification as described above suggested this reflected an estimated total of 759. This was 17%
27
higher than the estimated total from the hospital deaths dataset allowing for proportionate distribution of deaths with unknown status (assumption 2). If the estimate of the level of under-reporting to LeDeR is correct, this would suggest that people with learning disabilities were more likely than others to have their status recorded as ‘not known’ in the CPNS. The 2 unadjusted figures were very similar. However, the factors likely to introduce incompleteness in the two sources are quite different so this should be seen as a coincidence.
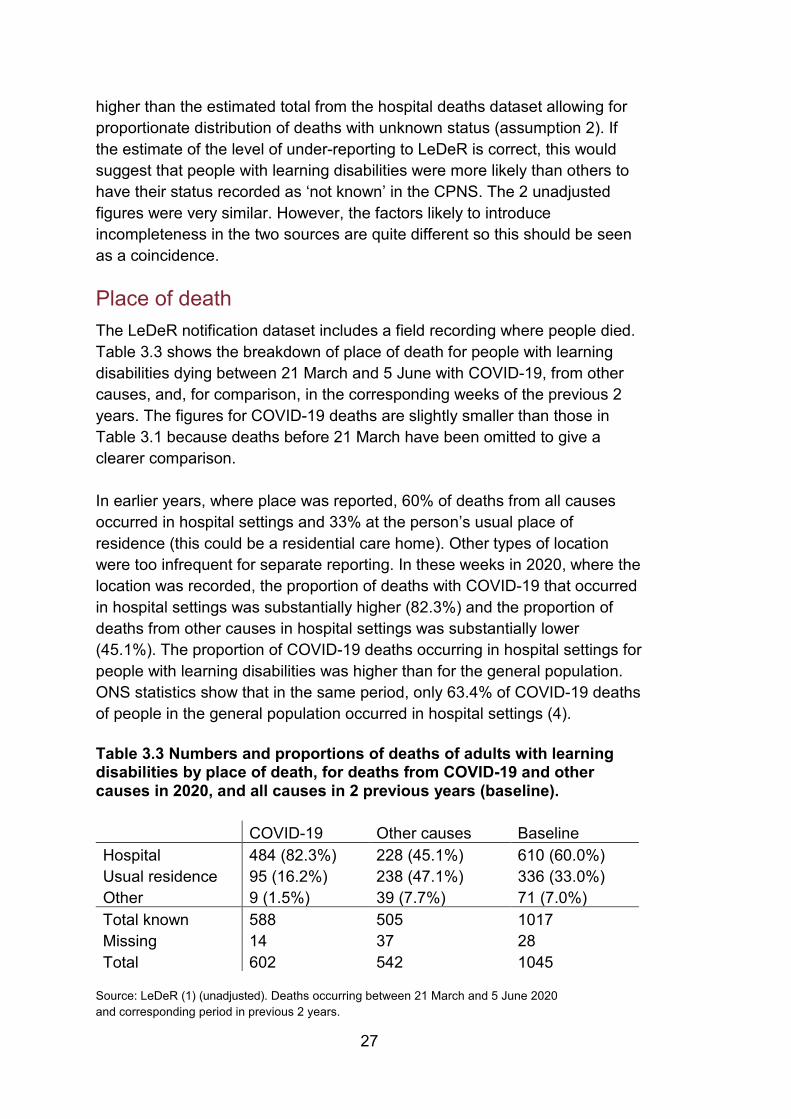
Place of death The LeDeR notification dataset includes a field recording where people died. Table 3.3 shows the breakdown of place of death for people with learning disabilities dying between 21 March and 5 June with COVID-19, from other causes, and, for comparison, in the corresponding weeks of the previous 2 years. The figures for COVID-19 deaths are slightly smaller than those in Table 3.1 because deaths before 21 March have been omitted to give a clearer comparison.
In earlier years, where place was reported, 60% of deaths from all causes occurred in hospital settings and 33% at the person’s usual place of residence (this could be a residential care home). Other types of location were too infrequent for separate reporting. In these weeks in 2020, where the location was recorded, the proportion of deaths with COVID-19 that occurred in hospital settings was substantially higher (82.3%) and the proportion of deaths from other causes in hospital settings was substantially lower (45.1%). The proportion of COVID-19 deaths occurring in hospital settings for people with learning disabilities was higher than for the general population. ONS statistics show that in the same period, only 63.4% of COVID-19 deaths of people in the general population occurred in hospital settings (4).
Table 3.3 Numbers and proportions of deaths of adults with learning disabilities by place of death, for deaths from COVID-19 and other causes in 2020, and all causes in 2 previous years (baseline).
COVID-19 Other causes Baseline Hospital 484 (82.3%) 228 (45.1%) 610 (60.0%) Usual residence 95 (16.2%) 238 (47.1%) 336 (33.0%) Other 9 (1.5%) 39 (7.7%) 71 (7.0%) Total known 588 505 1017 Missing 14 37 28 Total 602 542 1045
Source: LeDeR (1) (unadjusted). Deaths occurring between 21 March and 5 June 2020 and corresponding period in previous 2 years.
28
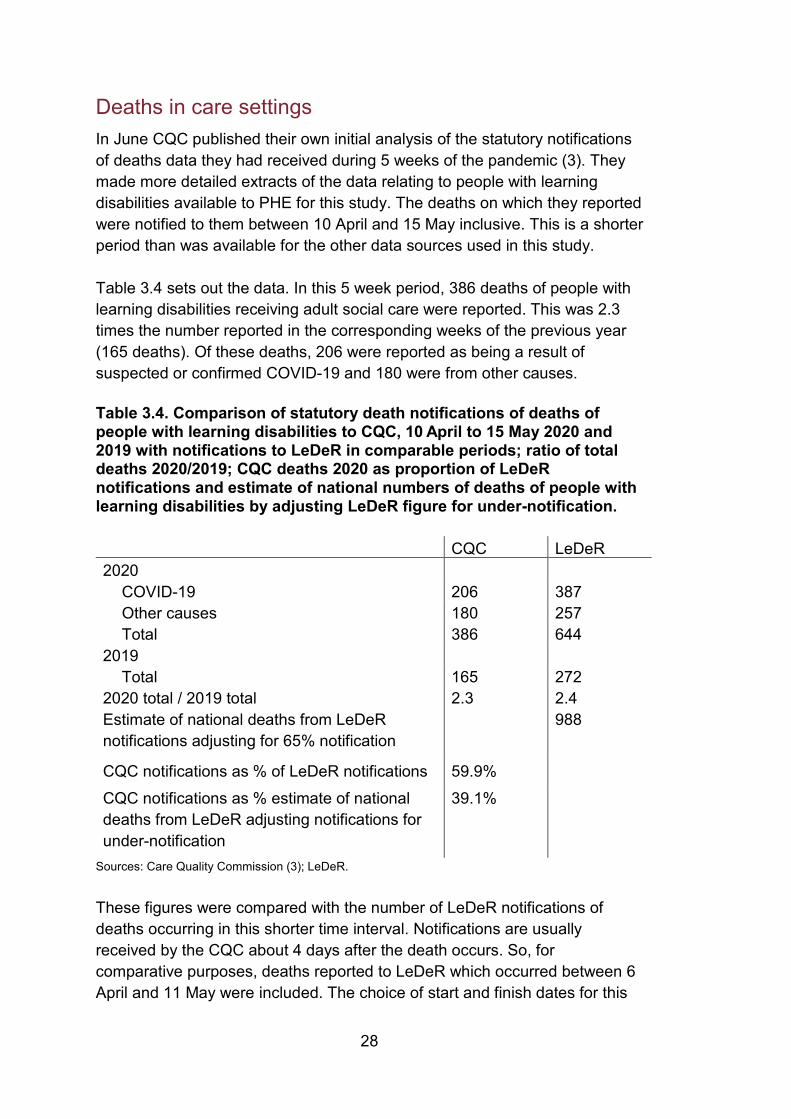
Deaths in care settings In June CQC published their own initial analysis of the statutory notifications of deaths data they had received during 5 weeks of the pandemic (3). They made more detailed extracts of the data relating to people with learning disabilities available to PHE for this study. The deaths on which they reported were notified to them between 10 April and 15 May inclusive. This is a shorter period than was available for the other data sources used in this study.
Table 3.4 sets out the data. In this 5 week period, 386 deaths of people with learning disabilities receiving adult social care were reported. This was 2.3 times the number reported in the corresponding weeks of the previous year (165 deaths). Of these deaths, 206 were reported as being a result of suspected or confirmed COVID-19 and 180 were from other causes.
Table 3.4. Comparison of statutory death notifications of deaths of people with learning disabilities to CQC, 10 April to 15 May 2020 and 2019 with notifications to LeDeR in comparable periods; ratio of total deaths 2020/2019; CQC deaths 2020 as proportion of LeDeR notifications and estimate of national numbers of deaths of people with learning disabilities by adjusting LeDeR figure for under-notification.
CQC LeDeR 2020
COVID-19 206 387 Other causes 180 257 Total 386 644
2019
Total 165 272 2020 total / 2019 total 2.3 2.4 Estimate of national deaths from LeDeR notifications adjusting for 65% notification
988
CQC notifications as % of LeDeR notifications 59.9% CQC notifications as % estimate of national deaths from LeDeR adjusting notifications for under-notification
39.1%
Sources: Care Quality Commission (3); LeDeR.
These figures were compared with the number of LeDeR notifications of deaths occurring in this shorter time interval. Notifications are usually received by the CQC about 4 days after the death occurs. So, for comparative purposes, deaths reported to LeDeR which occurred between 6 April and 11 May were included. The choice of start and finish dates for this
29
period are important because the numbers of daily deaths were changing fast at this time. A total of 644 deaths of adults were reported to LeDeR that occurred in this period, 387 attributed to COVID-19 and 257 to other causes. In the same period the previous year 272 deaths had been notified, giving a similar increase (2.4 times). The number of deaths reported to the CQC in 2020 was just under 60% of the number of notifications to LeDeR. If the LeDeR number is adjusted for the likely level of under-notification it suggests an estimated total of 988 deaths of people with learning disabilities in this period from all causes. The CQC figure would represent 39% of this figure. Many people with learning disabilities do not receive social care. Annual social care statistics for 2018 to 2019 record a total of 140,780 people receiving some type of social care for a primary need of learning disabilities (11). Numerically this is equivalent to 55% of the adults on GP learning disabilities registers, although it does not necessarily mean that they are all on GP registers. Under the provisions of the 2014 Care Act, a number of people who are recorded in the social care statistics would be receiving care managed and purchased by themselves, or by family members, social workers or other personal assistants, using direct payments from local authorities. It is likely that many of these people purchase care from non-registered providers so their deaths would not be reported to the CQC.
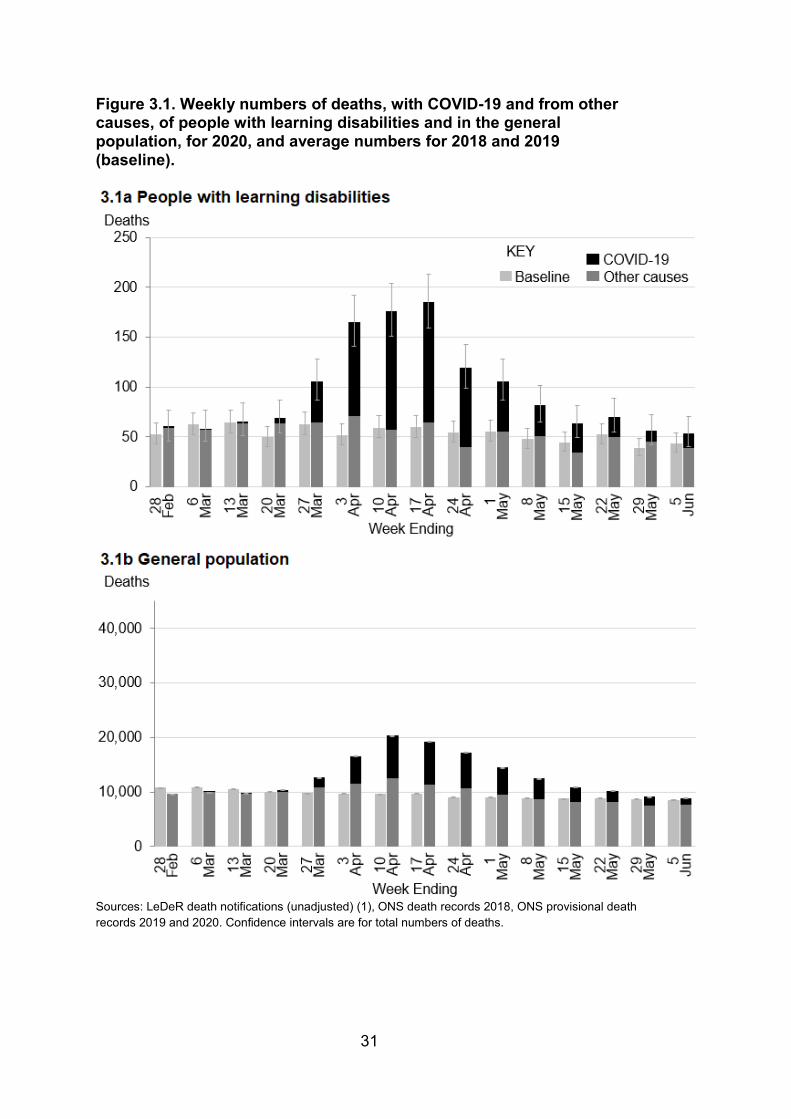
Weekly trend in deaths with COVID-19 Figure 3.1 shows the weekly numbers of deaths (unadjusted) reported to LeDeR occurring in the weeks from 22 February to 5 June 2020. Dark grey sections in the bars show the numbers of deaths not considered to be COVID-19 related, black sections show the numbers where the notifier reported that the death was possibly or definitely the result of COVID-19. The light grey bars alongside show the average number of deaths reported for the corresponding weeks in the 2 previous years. Figure 3.1a shows the pattern for people with learning disabilities, figure 3.1b shows the corresponding pattern for the general population. The question of whether there may be any important trend in the LeDeR data collection arising from increasing familiarity with the system was raised in the introduction. To check this, the number of deaths in 2020 from causes other than COVID-19 was compared with the numbers in the 2 previous years. The total for the 15 week period shown was 816 compared with an average of 803 in the two previous years which is a rise of 2%. This might occur through random fluctuation. There were 4 occasions when the number of deaths from
30
causes other than COVID-19 lay outside the 95% confidence intervals of the figure for the 2 previous years. On 2 occasions it was below and on 2 occasions it was above. This gave no indication of a trend likely to distort comparisons of 2020 with 2018 and 2019. The number of deaths of people with learning disabilities from all causes rose sharply in the week to 27 March. Over the next 3 weeks, assuming that the level of completeness of reporting of COVID-19 deaths of people with learning disabilities to LeDeR was similar to the level for deaths in previous years, there were around 3 times the average number of deaths seen in the corresponding weeks of the 2 previous years. The pattern of this peak for people with learning disabilities was similar to that seen for the general population, possibly starting slightly earlier, but the degree of excess was greater. In the same weeks for the general population the total number of deaths was around 2 times the baseline number. By the end of the period for which data was available, there were still substantial numbers of COVID-19 deaths each week for both groups.
31
Figure 3.1. Weekly numbers of deaths, with COVID-19 and from other causes, of people with learning disabilities and in the general population, for 2020, and average numbers for 2018 and 2019 (baseline).
Sources: LeDeR death notifications (unadjusted) (1), ONS death records 2018, ONS provisional death records 2019 and 2020. Confidence intervals are for total numbers of deaths.

32
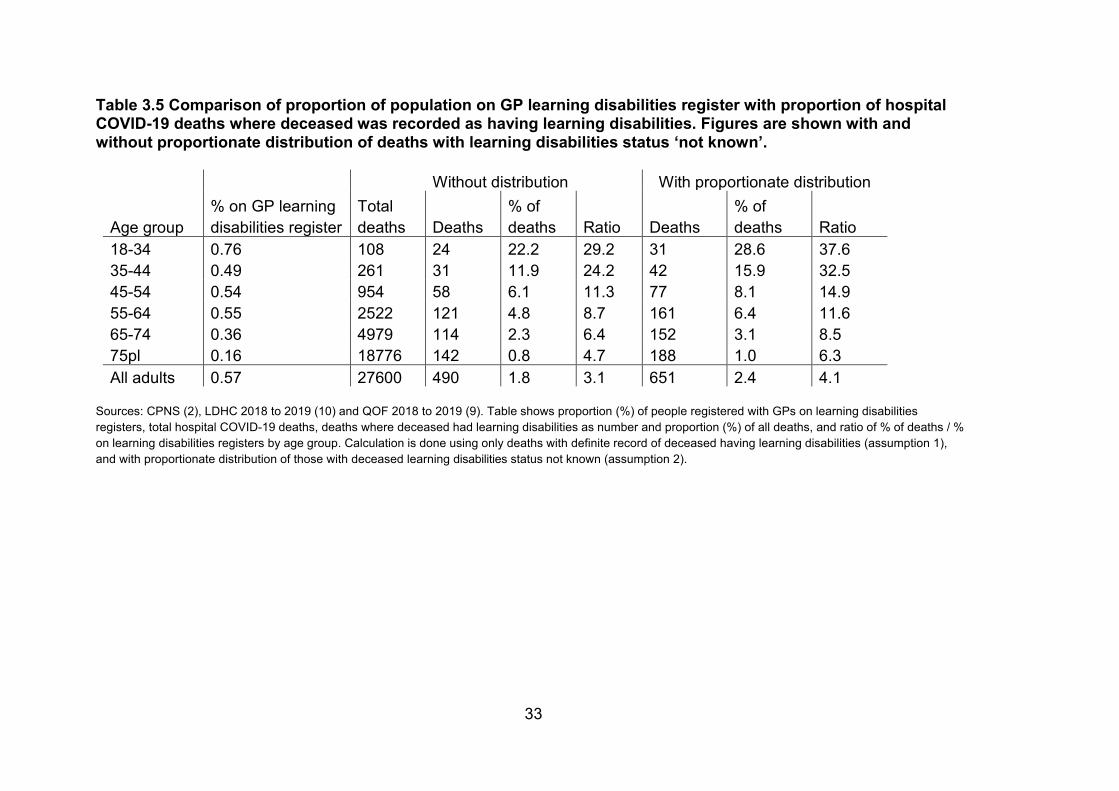
Proportions of deaths where the deceased had learning disabilities The terms of reference for this report asked PHE to consider the proportion of deaths in which the deceased person had learning disabilities, comparing this with the prevalence of learning disabilities in the population. The CPNS dataset allows this because it treats deaths of people with and without learning disabilities identically. Table 3.5 shows the comparison by age group. The first column shows the proportion of adults registered with GPs on learning disabilities registers. The second gives the total numbers of hospital COVID-19 deaths up to 5 June. The comparison calculation is then done twice, first including only those deaths where the deceased was recorded as having learning disabilities (assumption 1), then including a proportionate number of people with learning disabilities status ‘not known’ (assumption 2). In each case the number and proportion of deaths is shown, followed by the ratio of the proportion of deaths to the proportion of people on learning disabilities registers. In both sets of calculations, the table shows that the proportion of people dying in hospital settings with COVID-19 who had learning disabilities was much higher than would be expected from their numbers in the population. The difference was much larger for younger age groups. When a proportionate share of the deaths with learning disabilities status ‘not known’ was assigned to the learning disabilities group, the differences were larger but the pattern was the same. The ratios for the oldest age group in this table are likely to be slightly overestimated. This is because the proportion of deaths attributed to COVID-19 which occurred in hospital settings, and so appear in this analysis, was higher for people with learning disabilities than for the general population. Table 3.3 shows it to have been 82.3% for people with learning disabilities while ONS weekly provisional death figures show it to have been 63.5% for the general population in the same period (4). The ONS table shows that the difference was caused by the high proportion of general population COVID-19 deaths that occurred in care homes, a difference only likely to have affected the oldest age group.
33
Table 3.5 Comparison of proportion of population on GP learning disabilities register with proportion of hospital COVID-19 deaths where deceased was recorded as having learning disabilities. Figures are shown with and without proportionate distribution of deaths with learning disabilities status ‘not known’.
Without distribution With proportionate distribution
Age group % on GP learning disabilities register
Total deaths Deaths
% of deaths Ratio Deaths
% of deaths Ratio
18-34 0.76 108 24 22.2 29.2 31 28.6 37.6 35-44 0.49 261 31 11.9 24.2 42 15.9 32.5 45-54 0.54 954 58 6.1 11.3 77 8.1 14.9 55-64 0.55 2522 121 4.8 8.7 161 6.4 11.6 65-74 0.36 4979 114 2.3 6.4 152 3.1 8.5 75pl 0.16 18776 142 0.8 4.7 188 1.0 6.3 All adults 0.57 27600 490 1.8 3.1 651 2.4 4.1
Sources: CPNS (2), LDHC 2018 to 2019 (10) and QOF 2018 to 2019 (9). Table shows proportion (%) of people registered with GPs on learning disabilities registers, total hospital COVID-19 deaths, deaths where deceased had learning disabilities as number and proportion (%) of all deaths, and ratio of % of deaths / % on learning disabilities registers by age group. Calculation is done using only deaths with definite record of deceased having learning disabilities (assumption 1), and with proportionate distribution of those with deceased learning disabilities status not known (assumption 2).
34
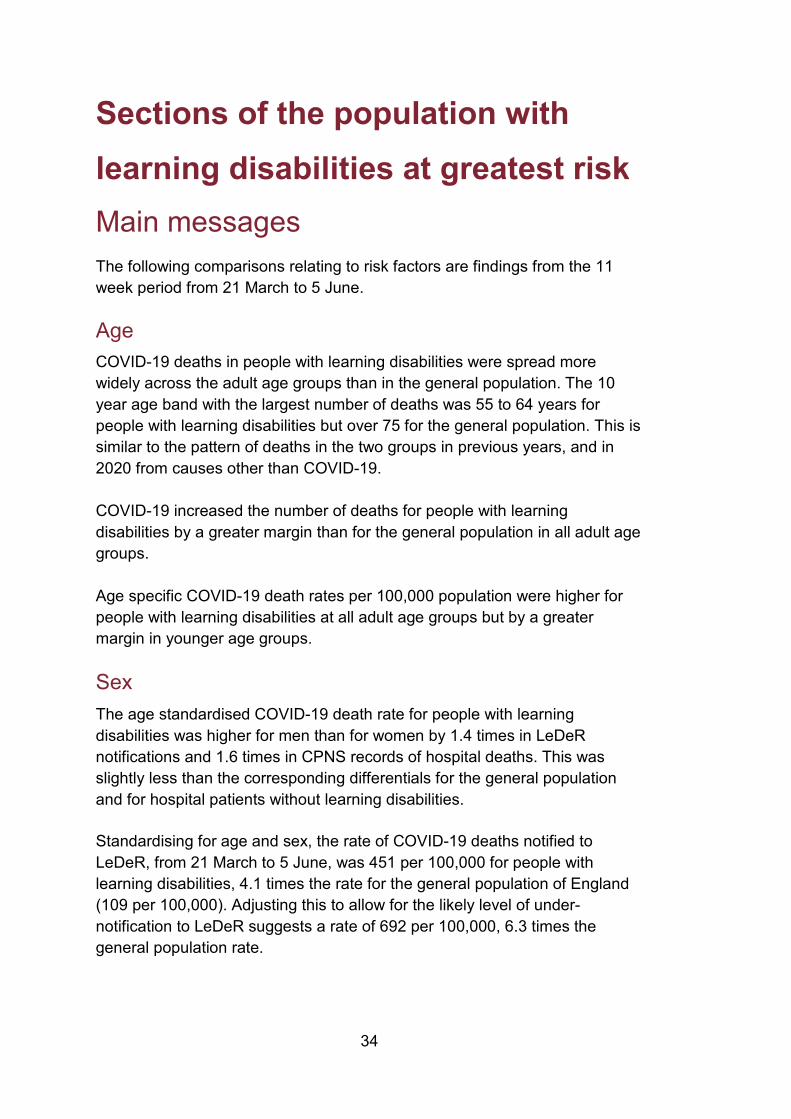
Sections of the population with learning disabilities at greatest risk Main messages The following comparisons relating to risk factors are findings from the 11 week period from 21 March to 5 June. Age COVID-19 deaths in people with learning disabilities were spread more widely across the adult age groups than in the general population. The 10 year age band with the largest number of deaths was 55 to 64 years for people with learning disabilities but over 75 for the general population. This is similar to the pattern of deaths in the two groups in previous years, and in 2020 from causes other than COVID-19.
COVID-19 increased the number of deaths for people with learning disabilities by a greater margin than for the general population in all adult age groups.
Age specific COVID-19 death rates per 100,000 population were higher for people with learning disabilities at all adult age groups but by a greater margin in younger age groups. Sex The age standardised COVID-19 death rate for people with learning disabilities was higher for men than for women by 1.4 times in LeDeR notifications and 1.6 times in CPNS records of hospital deaths. This was slightly less than the corresponding differentials for the general population and for hospital patients without learning disabilities. Standardising for age and sex, the rate of COVID-19 deaths notified to LeDeR, from 21 March to 5 June, was 451 per 100,000 for people with learning disabilities, 4.1 times the rate for the general population of England (109 per 100,000). Adjusting this to allow for the likely level of under-notification to LeDeR suggests a rate of 692 per 100,000, 6.3 times the general population rate.
35
Ethnic group The proportions of COVID-19 deaths in people with learning disabilities that were of a person from an Asian or Asian British group, or a Black or Black British group were around 3 times the proportions of deaths from all causes seen from these groups in corresponding periods of previous years, and greater than the proportions of deaths from other causes in 2020. The number of deaths of people with learning disabilities from all causes in 2020 for White groups was 1.9 times the number in the 2 previous years. For Asian and Asian British groups it was 4.5 times the number and for Black and Black British groups, 4.4 times. Regions of the country The number of deaths from all causes in the period studied rose for people with learning disabilities by 3.7 times in London but by only 1.6 times in the South West. Other regions had intermediate levels of increase. The data available was not adequate to support more detailed analysis of area level social deprivation.
36
Introduction COVID-19 has affected different sections of the population to different degrees. In the general population death rates have been higher for males, people from Black and minority ethnic groups, people living in areas of greater socio-economic deprivation, and, above all, older people (5). This section explores the impact of these factors on numbers and rates of death for people with learning disabilities.
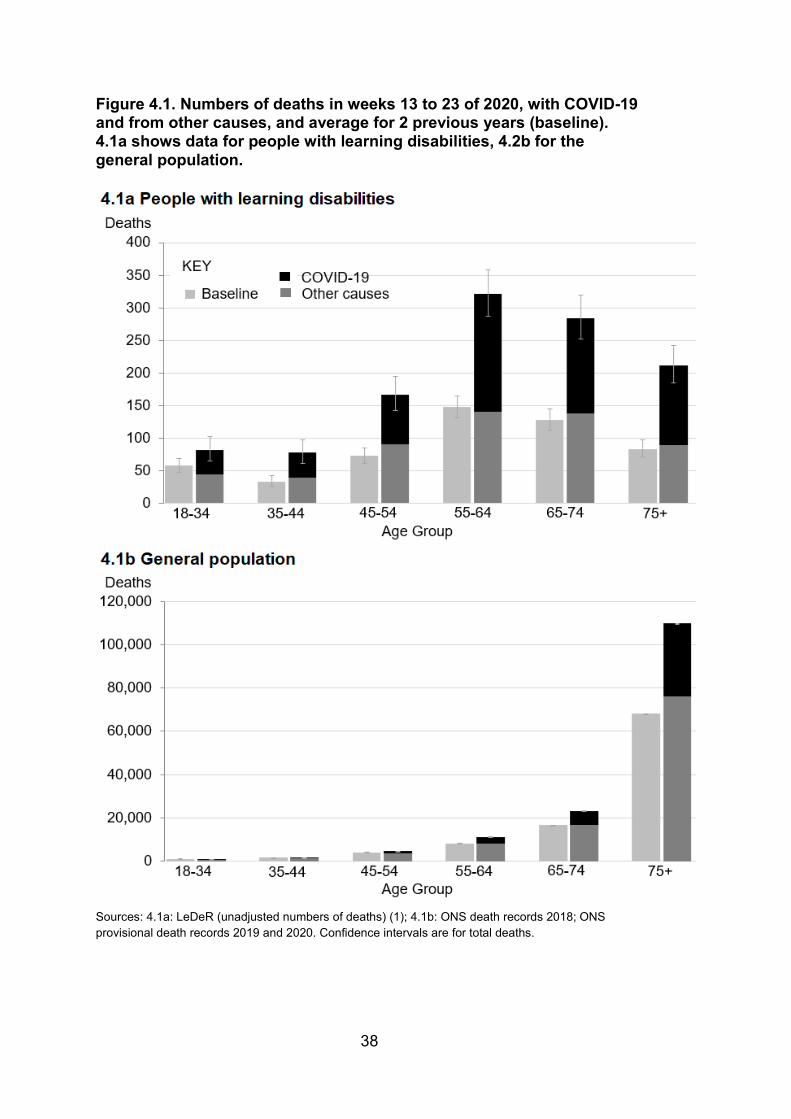
Age LeDeR data Figure 4.1 shows overall numbers of deaths by age group. Figure 4.1a shows the number of deaths notified to LeDeR that occurred between 21 March and 5 June. Figure 4.1b shows deaths in the general population of England in the same period. Bars are split into an upper black section representing COVID-19 deaths and a lower dark grey section representing deaths from all other causes. Adjacent light grey bars show average numbers of deaths in the corresponding period in the 2 previous years. In this 11 week period in 2020, 1,144 deaths of people with learning disabilities were reported to LeDeR, 2.2 times the average figure for the 2 previous years. 53% of the deaths were attributed to COVID-19. In the general population of England, 151,512 deaths were registered, 1.5 times the average for the 2 previous years, with 30% including COVID-19 among the registered causes. Deaths of people with learning disabilities were more widely spread across the age groups than deaths in the general population. This is usually the case as can be seen from the pattern of deaths in the 2 years prior to 2020. The 10 year age band with the largest number of deaths was 55 to 64. The number and age distribution of deaths from causes other than COVID-19 in 2020 was not significantly different from the average for the 2 previous years. The additional deaths with COVID-19 were spread across the age range but adding greater increments at older ages. At ages 18 to 34 the additional deaths were 0.7 times the average for all causes for the previous 2 years, from age 35 to age 74 they were 1.2 times the previous average, and older ages they were 1.5 times the previous average. Taking all adult age groups together, the number of deaths with COVID-19 was 1.2 times the previous average number from all causes.
37
For the general population the number of deaths from causes other than COVID-19 at ages below 55 fell to 0.8 times the average for the 2 previous years. At ages 75 and older it rose to 1.1 times the previous average. In the 18 to 34 age group the additional deaths due to COVID-19 were 0.1 times the average number from all causes in the previous 2 years. This rose steadily across the age groups to reach 0.5 times the previous average number of deaths from all causes in the age group 75 and older. Taking all adult age groups together the number of deaths with COVID-19 was 0.45 times the previous average from all causes. In summary, COVID-19 increased the number of deaths for people with learning disabilities by a greater margin than for the general population, and deaths were more widely spread across the adult age spectrum.
38
Figure 4.1. Numbers of deaths in weeks 13 to 23 of 2020, with COVID-19 and from other causes, and average for 2 previous years (baseline). 4.1a shows data for people with learning disabilities, 4.2b for the general population.
Sources: 4.1a: LeDeR (unadjusted numbers of deaths) (1); 4.1b: ONS death records 2018; ONS provisional death records 2019 and 2020. Confidence intervals are for total deaths.
39
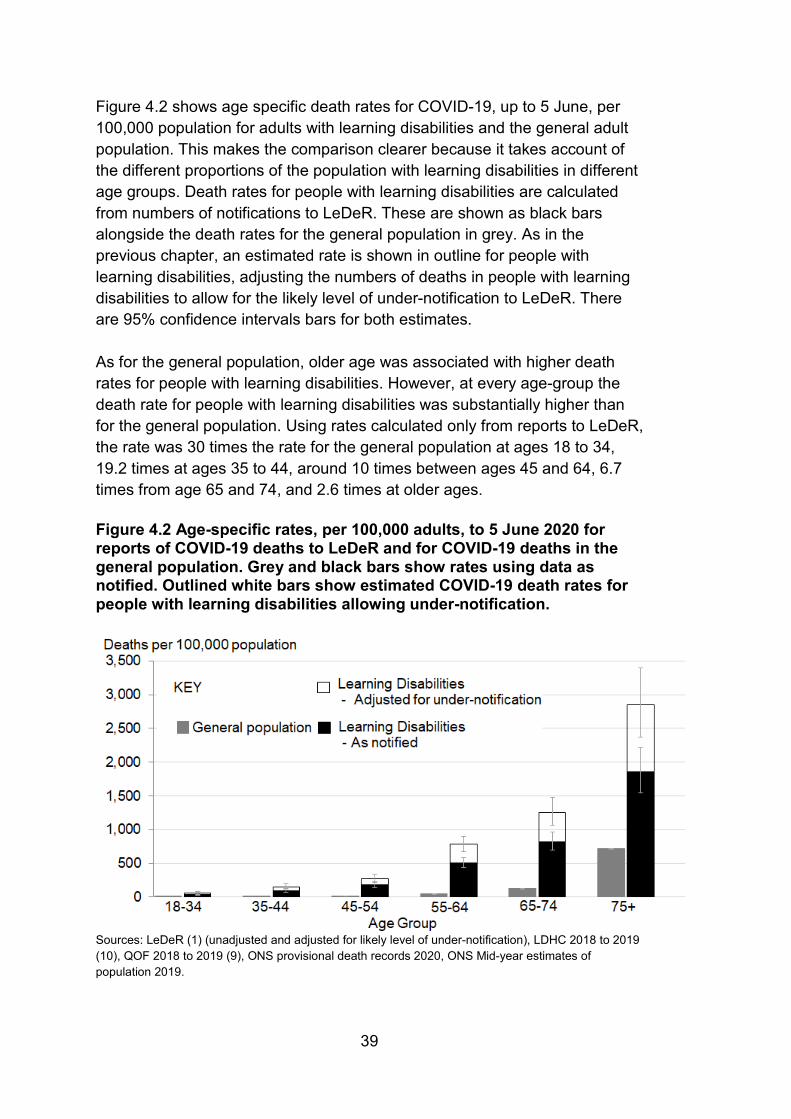
Figure 4.2 shows age specific death rates for COVID-19, up to 5 June, per 100,000 population for adults with learning disabilities and the general adult population. This makes the comparison clearer because it takes account of the different proportions of the population with learning disabilities in different age groups. Death rates for people with learning disabilities are calculated from numbers of notifications to LeDeR. These are shown as black bars alongside the death rates for the general population in grey. As in the previous chapter, an estimated rate is shown in outline for people with learning disabilities, adjusting the numbers of deaths in people with learning disabilities to allow for the likely level of under-notification to LeDeR. There are 95% confidence intervals bars for both estimates. As for the general population, older age was associated with higher death rates for people with learning disabilities. However, at every age-group the death rate for people with learning disabilities was substantially higher than for the general population. Using rates calculated only from reports to LeDeR, the rate was 30 times the rate for the general population at ages 18 to 34, 19.2 times at ages 35 to 44, around 10 times between ages 45 and 64, 6.7 times from age 65 and 74, and 2.6 times at older ages. Figure 4.2 Age-specific rates, per 100,000 adults, to 5 June 2020 for reports of COVID-19 deaths to LeDeR and for COVID-19 deaths in the general population. Grey and black bars show rates using data as notified. Outlined white bars show estimated COVID-19 death rates for people with learning disabilities allowing under-notification.
Sources: LeDeR (1) (unadjusted and adjusted for likely level of under-notification), LDHC 2018 to 2019 (10), QOF 2018 to 2019 (9), ONS provisional death records 2020, ONS Mid-year estimates of population 2019.
40
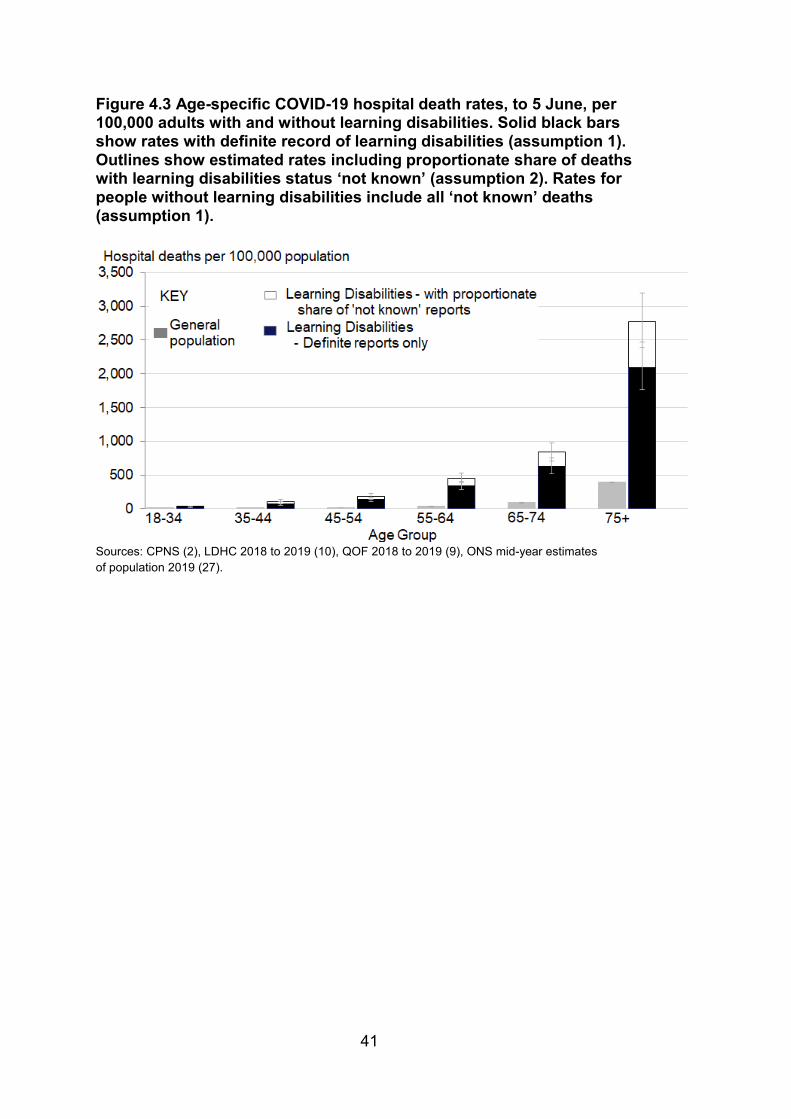
Hospital deaths data Figure 4.3 shows age-specific rates to 5 June for deaths in hospital settings reported through the CPNS dataset. Rates are shown for people with and without learning disabilities. For people with learning disabilities, 2 estimates are shown using the 2 assumptions set out alongside table 3.2. Solid black bars show the rate calculated using only deaths of people identified in CPNS as having learning disabilities (assumption 1). Outline bars above the black bars show an estimated rate assuming that the proportion of those with unknown status who had learning disabilities in each age and sex group was the same as the proportion in those for whom status was recorded (assumption 2). Death rates rose sharply with age for both those with and without learning disabilities. Rates for people with learning disabilities were much higher than for those without at all ages. Using rates calculated with assumption 1, assigning all deaths with learning disabilities status ‘not known’ to the group without learning disabilities, the rate for people with learning disabilities at ages:
• 18 to 34 was 31.7 times the rate for the general population • 35 to 44 was 23.3 times the rate for the general population • 45 and 64 was around 10 times the rate for the general population • 65 to 74 was 7.1 times the rate for the general population • 75 and older was 5.4 times the rate for the general population
These differentials are similar to those seen in the previous chart. The exception is the oldest age group for which, as explained in relation to table 3.5, the comparison may be affected by a lower proportion of deaths of people without learning disabilities happening outside hospital.
41
Figure 4.3 Age-specific COVID-19 hospital death rates, to 5 June, per 100,000 adults with and without learning disabilities. Solid black bars show rates with definite record of learning disabilities (assumption 1). Outlines show estimated rates including proportionate share of deaths with learning disabilities status ‘not known’ (assumption 2). Rates for people without learning disabilities include all ‘not known’ deaths (assumption 1).
Sources: CPNS (2), LDHC 2018 to 2019 (10), QOF 2018 to 2019 (9), ONS mid-year estimates of population 2019 (27).
42
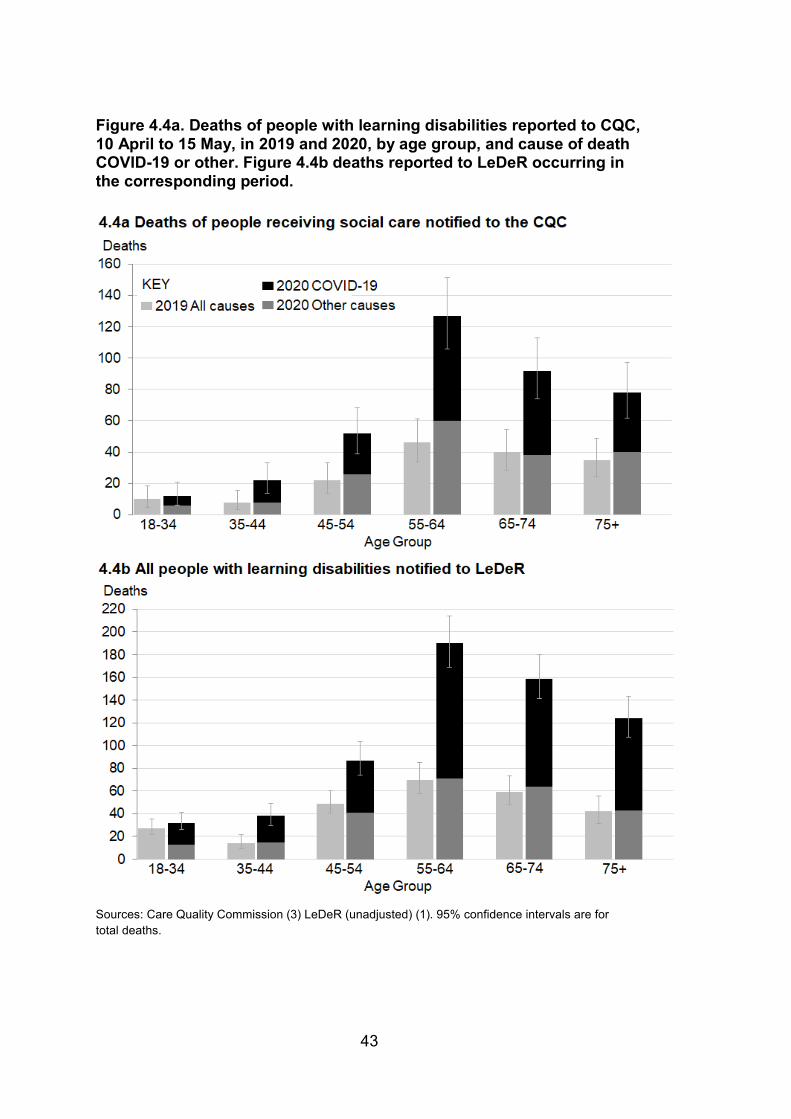
Deaths of people receiving social care The CQC published a limited amount of data about the age breakdown of the people whose deaths had been reported to them as resulting from COVID-19 (3). It is not possible to calculate age-specific death rates for people with learning disabilities in residential care because there is no detailed data about the ages of people receiving care. Instead, figure 4.4a shows an age profile of the numbers of people with learning disabilities who died, comparing the total deaths in the same period of 2019 with numbers of deaths reported for 2020, separated into suspected or confirmed COVID-19, and other causes of death. For comparison, figure 4.4b shows the LeDeR data covering the shorter period for which the CQC reported and using only a single comparator year, 2019. The overall numbers of deaths reported to LeDeR were consistently higher than those reported to the CQC as noted above. But the change between the 2 years for each was similar.
43
Figure 4.4a. Deaths of people with learning disabilities reported to CQC, 10 April to 15 May, in 2019 and 2020, by age group, and cause of death COVID-19 or other. Figure 4.4b deaths reported to LeDeR occurring in the corresponding period.
Sources: Care Quality Commission (3) LeDeR (unadjusted) (1). 95% confidence intervals are for total deaths.
44
Sex In the general population, there have been higher death rates with COVID-19 in men than women (5). To compare sex-specific death rates for people with learning disabilities to those seen for the general population, the smaller proportion of people with learning disabilities in the older age groups must be considered. Direct standardisation shows what the death rates would be in a population with a standard structure if the age and sex specific death rates seen in relevant groups had applied.
LeDeR data Figure 4.5 shows directly age standardised COVID-19 death rates for men and women with learning disabilities from LeDeR data set alongside rates for the general population. The solid black bars in the chart show the rates for people with learning disabilities calculated using numbers of deaths reported to LeDeR. Estimates of the rates after adjustment for under-notification are shown in outline. Grey bars show the standardised rates for the general population. Table 4.1 shows the standardised rates, using both unadjusted and adjusted numbers of deaths for male and female adults with learning disabilities and the overall rates for persons, standardised for both age and sex.
The age standardised death rate for men with learning disabilities was 1.4 times that for women with learning disabilities. This is similar to the pattern in the general population for whom the age standardised death rate for men was 1.5 times that for women. However, the rates for people with learning disabilities were substantially higher than those for the general population. Using rates calculated from numbers reported to LeDeR, the age standardised death rate for men with learning disabilities was 4 times the rate for men in the general population, for women 4.3 times and for persons 4.1 times. Using estimates that take account of the likely level of under-notification, the corresponding ratios are 6.1 for men, 6.6 for women and 6.3 for persons.
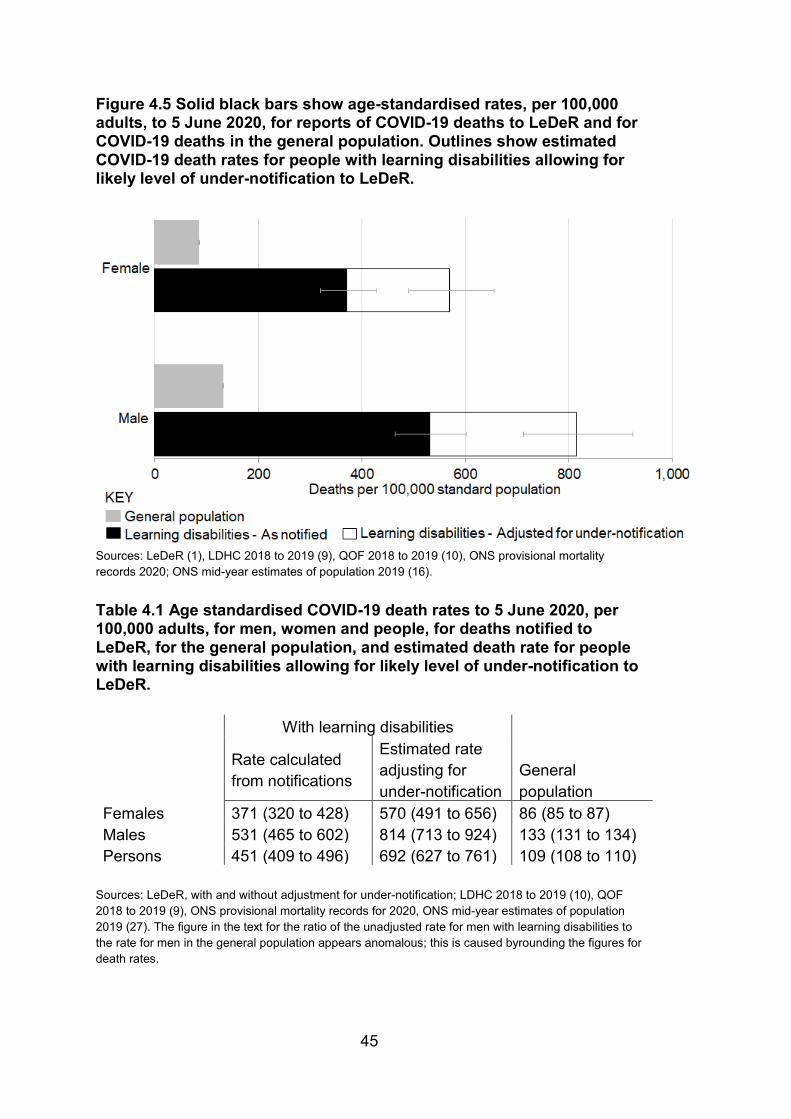
45
Figure 4.5 Solid black bars show age-standardised rates, per 100,000 adults, to 5 June 2020, for reports of COVID-19 deaths to LeDeR and for COVID-19 deaths in the general population. Outlines show estimated COVID-19 death rates for people with learning disabilities allowing for likely level of under-notification to LeDeR.
Sources: LeDeR (1), LDHC 2018 to 2019 (9), QOF 2018 to 2019 (10), ONS provisional mortality records 2020; ONS mid-year estimates of population 2019 (16).
Table 4.1 Age standardised COVID-19 death rates to 5 June 2020, per 100,000 adults, for men, women and people, for deaths notified to LeDeR, for the general population, and estimated death rate for people with learning disabilities allowing for likely level of under-notification to LeDeR.
With learning disabilities
General population
Rate calculated from notifications
Estimated rate adjusting for under-notification
Females 371 (320 to 428) 570 (491 to 656) 86 (85 to 87) Males 531 (465 to 602) 814 (713 to 924) 133 (131 to 134) Persons 451 (409 to 496) 692 (627 to 761) 109 (108 to 110)
Sources: LeDeR, with and without adjustment for under-notification; LDHC 2018 to 2019 (10), QOF 2018 to 2019 (9), ONS provisional mortality records for 2020, ONS mid-year estimates of population 2019 (27). The figure in the text for the ratio of the unadjusted rate for men with learning disabilities to the rate for men in the general population appears anomalous; this is caused byrounding the figures for death rates.
46
Hospital deaths data Figure 4.6 shows directly age standardised rates of COVID-19 deaths in hospital settings for men and women, to 5 June. Rates are shown for people with and without learning disabilities. For people with learning disabilities solid black bars show the rate calculated using only deaths of people with learning disabilities identified in CPNS (assumption 1). Outline bars show the estimated rates assigning a proportion of those with learning disabilities status ‘not known’ to the learning disabilities group (assumption 2). Table 4.2 shows the standardised rates, for male and female adults with learning disabilities, using both assumptions, along with the overall rates for persons, standardised for both age and sex using assumption 1.
Using only deaths where learning disabilities was specified (assumption 1), the age-standardised rate for men with learning disabilities was 1.6 times that for women with learning disabilities. For men without learning disabilities the rate was 1.9 times the rate for women without learning disabilities. Again, using only deaths where learning disabilities was specified, the age standardised rate for men with learning disabilities, was 5.8 times that for men without learning disabilities. The corresponding rate for women was 7.1 times the rate for women without learning disabilities. These ratios, comparing men and women with learning disabilities to their counterparts without is a minimum estimate for the real difference. Using assumption 2, the corresponding ratios were 7.7 times for men and 9.4 times for women.
For people with learning disabilities, the sex differential seen here (figure 4.6) was similar to that for the LeDeR data (figure 4.5). For people without learning disabilities the differential was greater than that in the general population seen in figure 4.5. The greater difference between the sexes in the hospital death rate for the general population could reflect a difference between the sexes in the likelihood of hospitalisation.
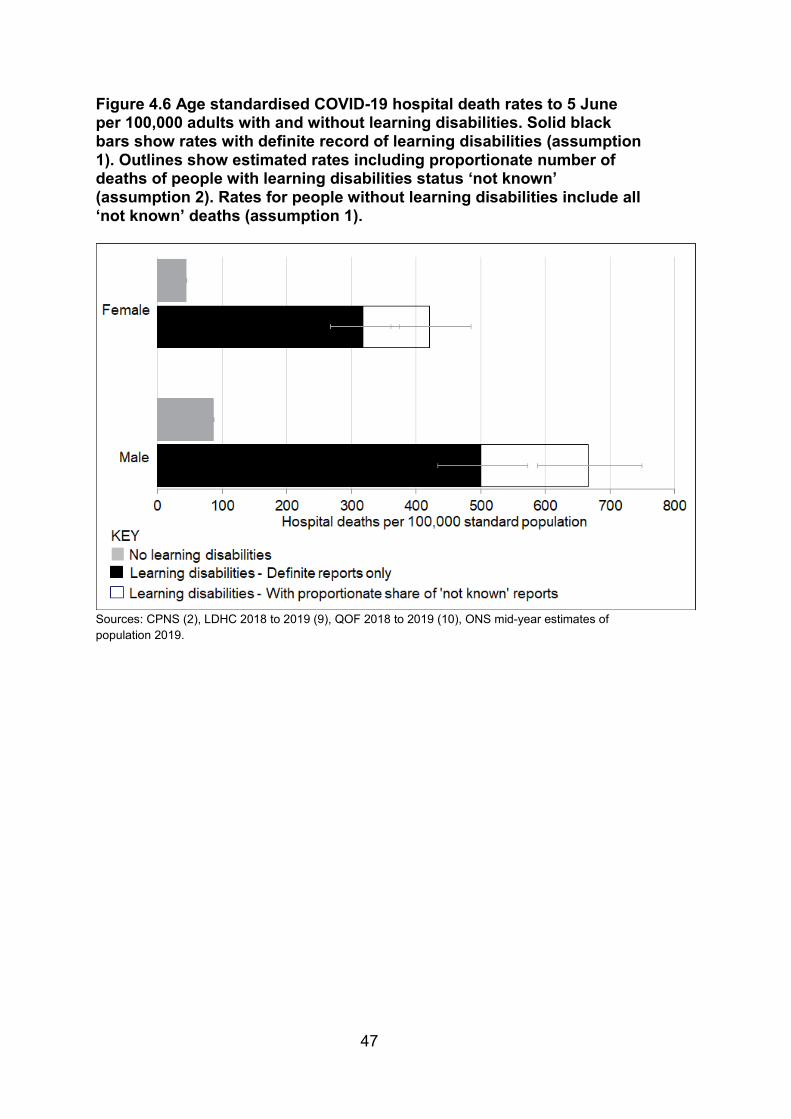
47
Figure 4.6 Age standardised COVID-19 hospital death rates to 5 June per 100,000 adults with and without learning disabilities. Solid black bars show rates with definite record of learning disabilities (assumption 1). Outlines show estimated rates including proportionate number of deaths of people with learning disabilities status ‘not known’ (assumption 2). Rates for people without learning disabilities include all ‘not known’ deaths (assumption 1).
Sources: CPNS (2), LDHC 2018 to 2019 (9), QOF 2018 to 2019 (10), ONS mid-year estimates of population 2019.
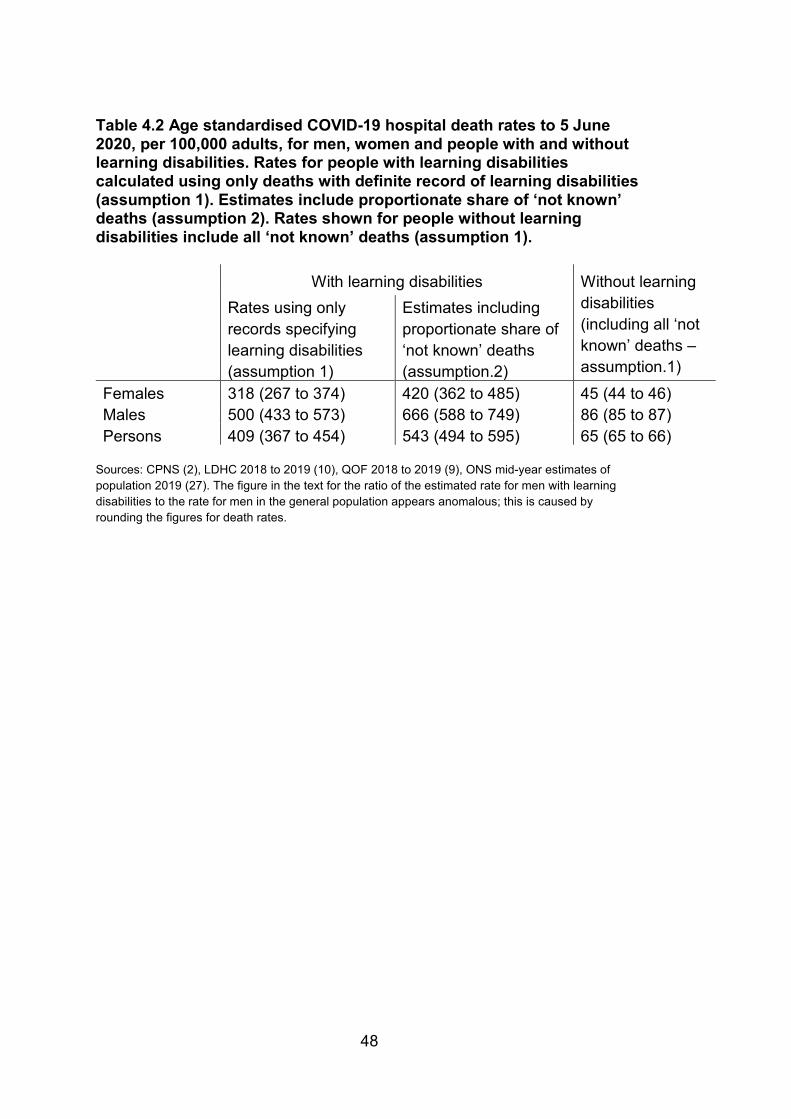
48
Table 4.2 Age standardised COVID-19 hospital death rates to 5 June 2020, per 100,000 adults, for men, women and people with and without learning disabilities. Rates for people with learning disabilities calculated using only deaths with definite record of learning disabilities (assumption 1). Estimates include proportionate share of ‘not known’ deaths (assumption 2). Rates shown for people without learning disabilities include all ‘not known’ deaths (assumption 1).
With learning disabilities Without learning disabilities (including all ‘not known’ deaths – assumption.1)
Rates using only records specifying learning disabilities (assumption 1)
Estimates including proportionate share of ‘not known’ deaths (assumption.2)
Females 318 (267 to 374) 420 (362 to 485) 45 (44 to 46) Males 500 (433 to 573) 666 (588 to 749) 86 (85 to 87) Persons 409 (367 to 454) 543 (494 to 595) 65 (65 to 66)
Sources: CPNS (2), LDHC 2018 to 2019 (10), QOF 2018 to 2019 (9), ONS mid-year estimates of population 2019 (27). The figure in the text for the ratio of the estimated rate for men with learning disabilities to the rate for men in the general population appears anomalous; this is caused by rounding the figures for death rates.
49
Ethnic group Both the LeDeR and CPNS collect information about the ethnic group of people dying. UK statistics identify 18 ethnic groups. Numbers of deaths of people with learning disabilities were too small for reporting in this level of detail. The 18 groups were therefore condensed into 4 broad groupings. Details are given in Annexe 2.
As noted in the introduction there are no robust estimates of the numbers of people in the population with learning disabilities by ethnic group for the age groups relevant to this study. So, instead of calculating rates of death per 100,000 population, analysis was limited to comparing numbers of deaths in 2020 with the 2 previous years using LeDeR data.
Table 4.3 shows the numbers of deaths reported to LeDeR in 2020 for COVID-19 and other causes broken down by ethnic group. The average number of deaths in the corresponding period of the 2 previous years is shown for comparison, as is the ratio of the total number of deaths in 2020 to the average number in the 2 previous years.
The overall number of deaths for White people with learning disabilities in 2020 was 1.9 times the average number in the 2 previous years. For both Asian or Asian British, and Black or Black British people it was more than 4 times the previous average. The columns showing the split between deaths with COVID-19 and deaths from other causes show that the increase for these 2 groups was largely the result of deaths with COVID-19. There was also an increase in the proportion of deaths where the ethnic group of the deceased was not recorded. These differences were too large to be a chance finding. The observation in respect of Asian or Asian British, and Black or Black British adults with learning disabilities is similar to findings about the impact of COVID-19 on these groups reported by PHE (5).
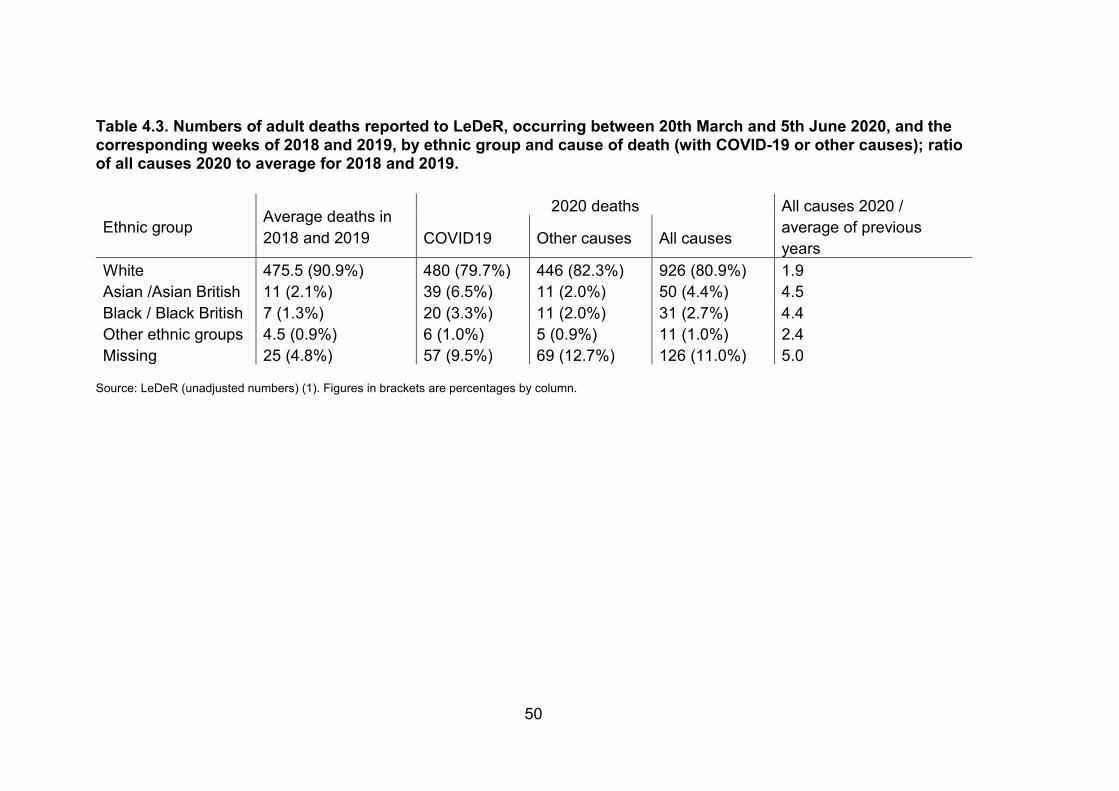
50
Table 4.3. Numbers of adult deaths reported to LeDeR, occurring between 20th March and 5th June 2020, and the corresponding weeks of 2018 and 2019, by ethnic group and cause of death (with COVID-19 or other causes); ratio of all causes 2020 to average for 2018 and 2019.
Ethnic group Average deaths in 2018 and 2019
2020 deaths All causes 2020 / average of previous years COVID19 Other causes All causes
White 475.5 (90.9%) 480 (79.7%) 446 (82.3%) 926 (80.9%) 1.9 Asian /Asian British 11 (2.1%) 39 (6.5%) 11 (2.0%) 50 (4.4%) 4.5 Black / Black British 7 (1.3%) 20 (3.3%) 11 (2.0%) 31 (2.7%) 4.4 Other ethnic groups 4.5 (0.9%) 6 (1.0%) 5 (0.9%) 11 (1.0%) 2.4 Missing 25 (4.8%) 57 (9.5%) 69 (12.7%) 126 (11.0%) 5.0
Source: LeDeR (unadjusted numbers) (1). Figures in brackets are percentages by column.
51
Areas of the country Regional patterns of deaths in the LeDeR and CPNS datasets were checked for consistency. As noted above, the completeness of the data varied greatly between regions in both. For deaths in hospital settings, there was a gap in the recording of the learning disabilities and autism status in the CPNS dataset. Overall, a quarter of deaths reported had this recorded as 'not known', but the proportion varied substantially between regions. Analyses of differences in rates of death between regions are not reliable when the completeness of recording varies so much. So, for differences by ethnic group, the distribution of numbers of deaths reported to LeDeR in previous years was compared to those reported in 2020.
Figure 4.7 and table 4.4 show a regional breakdown of the numbers of deaths reported to LeDeR occurring between 21 March and 5 June 2020, and the annual average for the 2 previous years. The columns for 2020 distinguish deaths with COVID-19 and those from other causes.
The numbers of deaths of people with learning disabilities reported from causes other than COVID-19 were similar to those reported in previous years. The increase in the additional deaths with COVID-19 varied considerably between regions. In London the number of deaths from all causes was 3.7 times the previous average, in the South West it was 1.6 times. The increase in other regions was between 1.8 and 2.3 times. The pattern of the highest level of excess in London and the lowest in the South West matches that reported by PHE for regional inequalities in the general population COVID-19 death rates (5).
Statistical testing showed that the distribution of deaths from causes other than COVID-19 between regions in this period was not significantly different from the distribution of deaths in previous years. However, as a result of the very different distribution of deaths related to COVID-19, the overall distribution of deaths was different to an extent unlikely to have occurred through random fluctuation.
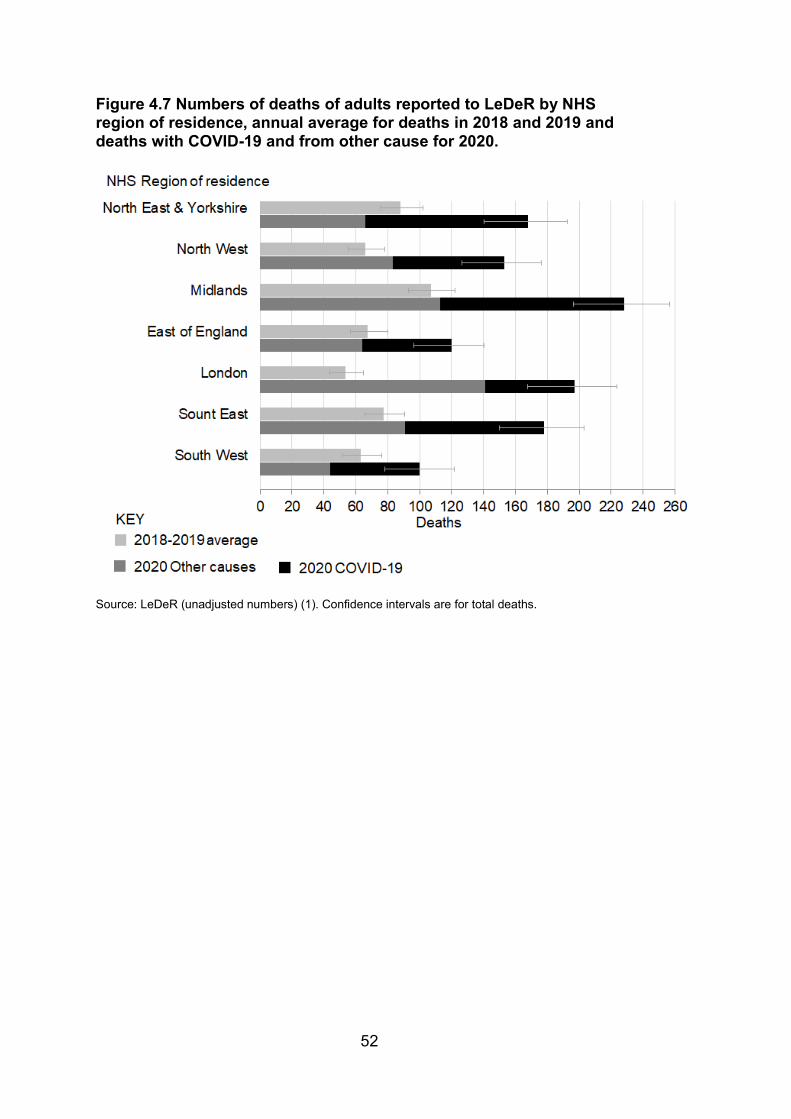
52
Figure 4.7 Numbers of deaths of adults reported to LeDeR by NHS region of residence, annual average for deaths in 2018 and 2019 and deaths with COVID-19 and from other cause for 2020.
Source: LeDeR (unadjusted numbers) (1). Confidence intervals are for total deaths.
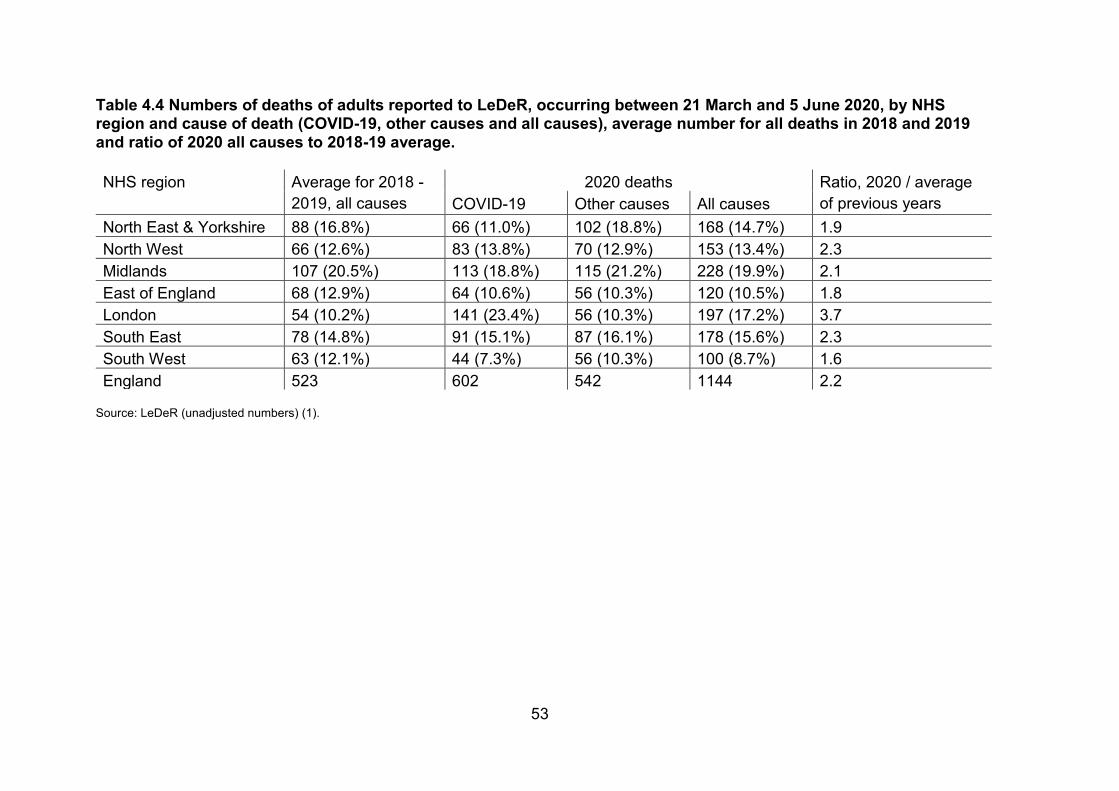
53
Table 4.4 Numbers of deaths of adults reported to LeDeR, occurring between 21 March and 5 June 2020, by NHS region and cause of death (COVID-19, other causes and all causes), average number for all deaths in 2018 and 2019 and ratio of 2020 all causes to 2018-19 average.
NHS region Average for 2018 - 2019, all causes
2020 deaths Ratio, 2020 / average of previous years COVID-19 Other causes All causes
North East & Yorkshire 88 (16.8%) 66 (11.0%) 102 (18.8%) 168 (14.7%) 1.9 North West 66 (12.6%) 83 (13.8%) 70 (12.9%) 153 (13.4%) 2.3 Midlands 107 (20.5%) 113 (18.8%) 115 (21.2%) 228 (19.9%) 2.1 East of England 68 (12.9%) 64 (10.6%) 56 (10.3%) 120 (10.5%) 1.8 London 54 (10.2%) 141 (23.4%) 56 (10.3%) 197 (17.2%) 3.7 South East 78 (14.8%) 91 (15.1%) 87 (16.1%) 178 (15.6%) 2.3 South West 63 (12.1%) 44 (7.3%) 56 (10.3%) 100 (8.7%) 1.6 England 523 602 542 1144 2.2
Source: LeDeR (unadjusted numbers) (1).
54
Social deprivation PHE’s report ‘Disparities in the risk and outcomes of COVID-19’ review identified strong associations between residence in areas of social deprivation and age standardised COVID-19 mortality rates (5). It was not possible to report on this for people with learning disabilities with either of the main data sources used in this study as neither had available information linking individuals to geographic areas smaller than regions.
55
Deaths in care settings Main Messages Death rates in social care settings were estimated from numbers of notifications to the CQC and numbers reported as receiving social care for learning disabilities in annual social care statistics. Findings in this section cover the shorter period, from 10 April to 15 May, for which the CQC collated data from statutory notifications of deaths of people receiving social care from registered providers.
COVID-19 accounted for 54% of deaths of adults with learning disabilities in residential care in the period, slightly less than for people with learning disabilities generally, but still much more than in the general population.
The crude rate of COVID-19 deaths for adults with learning disabilities in residential care was higher than the rate of COVID-19 deaths of adults with learning disabilities generally as estimated from LeDeR. It was 2.3 times the rate calculated from actual LeDeR notifications and 1.5 times the estimated rate adjusting for likely under-notification. This difference is likely in part to reflect the greater age and disability in people in residential care.
Data from PHE indicate that care homes looking after adults with learning disabilities was less likely than other care homes to have had COVID-19 outbreaks. This is likely to be related to the fact they have fewer bed spaces.
COVID-19 accounted for 53% of deaths of adults with learning disabilities receiving community-based social care. It is hard to comment on the overall scale of deaths in these contexts because the number of people receiving care from providers likely to report their deaths is not clear. This level of additional mortality is similar to that seen in residential care.
56
Introduction This section explores the question of whether people with learning disabilities appear to have been at additional risk in relation to the types of social care they receive. Some people with learning disabilities live in residential care homes. A larger number receive various levels of home support which, in normal times, would involve regular contact with care staff.
Residential care homes have a number of characteristics that put residents at additional risk in outbreaks of respiratory viruses. Residents typically have high levels of chronic illness or impairment. They frequently live in close proximity with other residents making quarantining difficult. Hand washing may not be routine for some residents and many residents may have difficulty understanding the need for infection control measures. In normal circumstances care staff come into frequent contact with many residents, adding to the risk of transmission (28). COVID-19 has been associated with high mortality in care home residents in many countries, though a systematic review of reports of outbreaks identified wide variation in the success of their containment (29).
CQC prepared a dataset of the statutory deaths notifications they had received in the 5 week period from 10 April to 15 May and the corresponding period of 2019. They published a report on this data in June 2020 (3). More detailed extracts of the dataset were made available to PHE for this study. As noted in section 3, the time period covered was shorter than that for the other 2 sources discussed in this report. The 5 weeks covered represent roughly two-thirds of the peak in deaths (see figure 3.1), starting during the second of the 3 weeks with the largest numbers of deaths (as recorded in the LeDeR data) and omitting the long tail of deaths.
In publishing the data, CQC distinguished between residential and non-residential social care and community-based adult social care. Making sense of this data would require the numbers of people with learning disabilities receiving each of these the types of care. The data available provides very little detail specifically about people receiving social care with learning disabilities. The short and long term support tables in the Adult Social Care Activity and Finance Report statistics provide only total numbers of people receiving residential care, categorised into residential and nursing care, and 4 categories of non-residential care categorised by the type of funding arrangement (6).
57
Residential social care The CQC reported 195 deaths of adults with learning disabilities in the period covered (105 with COVID-19, 90 from other causes).
Table 5.1 shows crude adult death rates calculated using these figures. These rates are not comparable with the rates reported in section 3 and 4 because of the shorter time period they cover and because they are not standardised for age and sex. For comparison, adult COVID-19 death rates for this shorter period for the whole population with learning disabilities from LeDeR (as notified to LeDeR and with adjustment for the estimated level of under-notification) and for the whole general adult population from ONS statistics are also shown in the table.
During this peak period, the crude rates of deaths with COVID-19 and other causes for adults with learning disabilities in residential care were respectively 2.3 times and 3.0 times the corresponding rates for people with learning disabilities overall notified to LeDeR. They were respectively 1.5 times and 2.0 times the corresponding rates after adjusting for likely levels of under-reporting. It is not surprising that they were higher since people with learning disabilities living in residential care are likely to be older and have multiple or more severe disabilities than those living more independently.
The COVID-19 death rate and the death rate from other causes among people with learning disabilities in residential care were 5.5 times and 2.7 times the corresponding rates in the general population during this peak of the pandemic wave. These comparisons are not standardised for the large age and sex profile differences or the fact that the residential care population are likely to be older and have multiple or more severe disabilities than adults with learning disabilities generally. In this period, COVID-19 was considered to have caused 53.8% of all deaths for adults with learning disabilities in residential care. This was slightly less than in reports to LeDeR, where COVID-19 was given as the possible or definite cause for 60.1% of deaths. It is not surprising that this was much higher than in the general adult population, where COVID-19 was given as a cause for only 36.2% of deaths.
Other figures published by the CQC indicate that the crude death rate for all adults receiving social care in residential settings was much higher than those for people with learning disabilities in residential care (3). This reflects the fact that people in residential care who do not have learning disabilities are a much older and frailer group with inevitably higher death rates. However, it is notable that for this group, only 44% of the total deaths during the period the CQC studied were COVID-19 related. The proportion of deaths
58
in residential care that were COVID-19 related for people with learning disabilities was 53.8%.
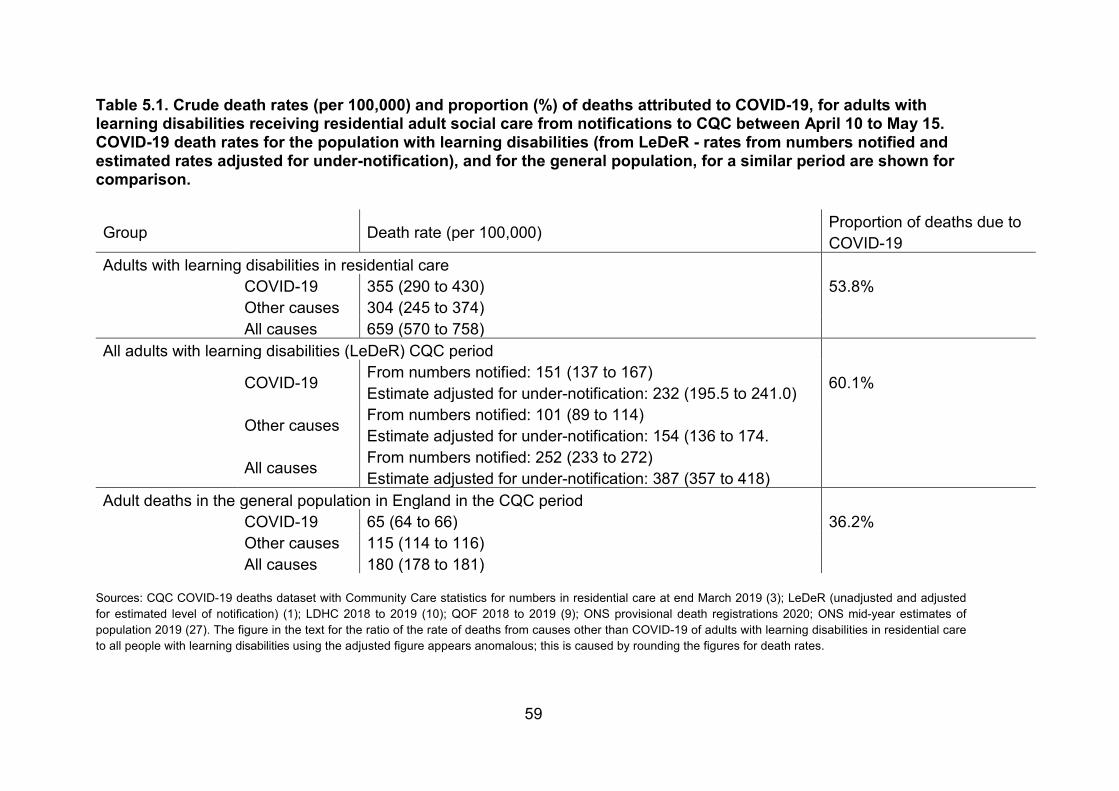
59
Table 5.1. Crude death rates (per 100,000) and proportion (%) of deaths attributed to COVID-19, for adults with learning disabilities receiving residential adult social care from notifications to CQC between April 10 to May 15. COVID-19 death rates for the population with learning disabilities (from LeDeR - rates from numbers notified and estimated rates adjusted for under-notification), and for the general population, for a similar period are shown for comparison.
Group Death rate (per 100,000) Proportion of deaths due to COVID-19
Adults with learning disabilities in residential care COVID-19 355 (290 to 430) 53.8% Other causes 304 (245 to 374) All causes 659 (570 to 758)
All adults with learning disabilities (LeDeR) CQC period
COVID-19 From numbers notified: 151 (137 to 167) Estimate adjusted for under-notification: 232 (195.5 to 241.0) 60.1%
Other causes From numbers notified: 101 (89 to 114) Estimate adjusted for under-notification: 154 (136 to 174.
All causes From numbers notified: 252 (233 to 272) Estimate adjusted for under-notification: 387 (357 to 418)
Adult deaths in the general population in England in the CQC period COVID-19 65 (64 to 66) 36.2% Other causes 115 (114 to 116) All causes 180 (178 to 181)
Sources: CQC COVID-19 deaths dataset with Community Care statistics for numbers in residential care at end March 2019 (3); LeDeR (unadjusted and adjusted for estimated level of notification) (1); LDHC 2018 to 2019 (10); QOF 2018 to 2019 (9); ONS provisional death registrations 2020; ONS mid-year estimates of population 2019 (27). The figure in the text for the ratio of the rate of deaths from causes other than COVID-19 of adults with learning disabilities in residential care to all people with learning disabilities using the adjusted figure appears anomalous; this is caused by rounding the figures for death rates.
60
Characteristics of homes where deaths occurred To explore the characteristics of residential homes associated with COVID-19 deaths of people with learning disabilities, the CQC supplied PHE with identifiers of the homes in which deaths had occurred and the dates on which deaths had occurred. These were linked to details of homes from the CQC registration directory (30) and to notifications of COVID-19 outbreaks made to PHE’s health protection teams.
Only limited conclusions can be drawn because there is no register of which residential care locations are currently providing social care to people with learning disabilities or in what numbers, and care home registration categories combine learning disabilities and autism in a single category. Care homes frequently obtain registration to provide care for a wider range of clients than they actually go on to look after at any point in time.
At the time to which the data relates, 5,552 social care locations with a primary inspection category of ‘residential social care’ in England were registered to look after people with learning disabilities or autistic people (omitting 33 locations with no registered number of beds). Table 5.2 summarises the available information about outbreaks and COVID-19 deaths of people with learning disabilities in these facilities.
There were 1,447 homes registered to provide care only for a single ‘service user band’, namely 'learning disabilities or autistic spectrum disorders'. The remaining 4,105 homes were registered for this and other service user bands. Between them these homes were registered to provide 65,944 beds. Adult social care statistics give the total number of people with learning disabilities receiving all types of residential care at the end of March 2019 as 29,590 (11). This data source has no category for autism. So, not all these beds, and probably not all these locations, were looking after adults with learning disabilities. If all the beds in the learning disabilities and autism only homes were occupied by people with learning disabilities, this would mean that around 19,000 residential care recipients with learning disabilities were receiving care alongside people with other types of need in the remaining 4,105 units. They would form roughly a third of the residents in this group of homes.
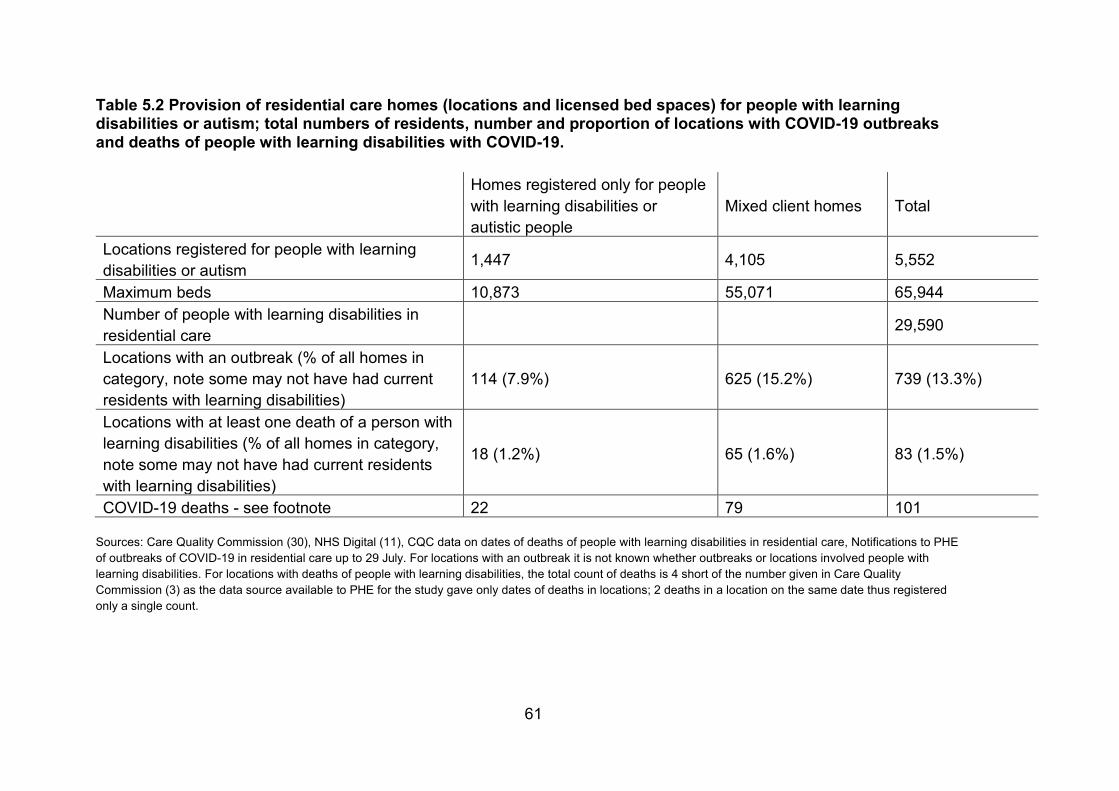
61
Table 5.2 Provision of residential care homes (locations and licensed bed spaces) for people with learning disabilities or autism; total numbers of residents, number and proportion of locations with COVID-19 outbreaks and deaths of people with learning disabilities with COVID-19.
Homes registered only for people with learning disabilities or autistic people
Mixed client homes Total
Locations registered for people with learning disabilities or autism 1,447 4,105 5,552
Maximum beds 10,873 55,071 65,944 Number of people with learning disabilities in residential care 29,590
Locations with an outbreak (% of all homes in category, note some may not have had current residents with learning disabilities)
114 (7.9%) 625 (15.2%) 739 (13.3%)
Locations with at least one death of a person with learning disabilities (% of all homes in category, note some may not have had current residents with learning disabilities)
18 (1.2%) 65 (1.6%) 83 (1.5%)
COVID-19 deaths - see footnote 22 79 101
Sources: Care Quality Commission (30), NHS Digital (11), CQC data on dates of deaths of people with learning disabilities in residential care, Notifications to PHE of outbreaks of COVID-19 in residential care up to 29 July. For locations with an outbreak it is not known whether outbreaks or locations involved people with learning disabilities. For locations with deaths of people with learning disabilities, the total count of deaths is 4 short of the number given in Care Quality Commission (3) as the data source available to PHE for the study gave only dates of deaths in locations; 2 deaths in a location on the same date thus registered only a single count.
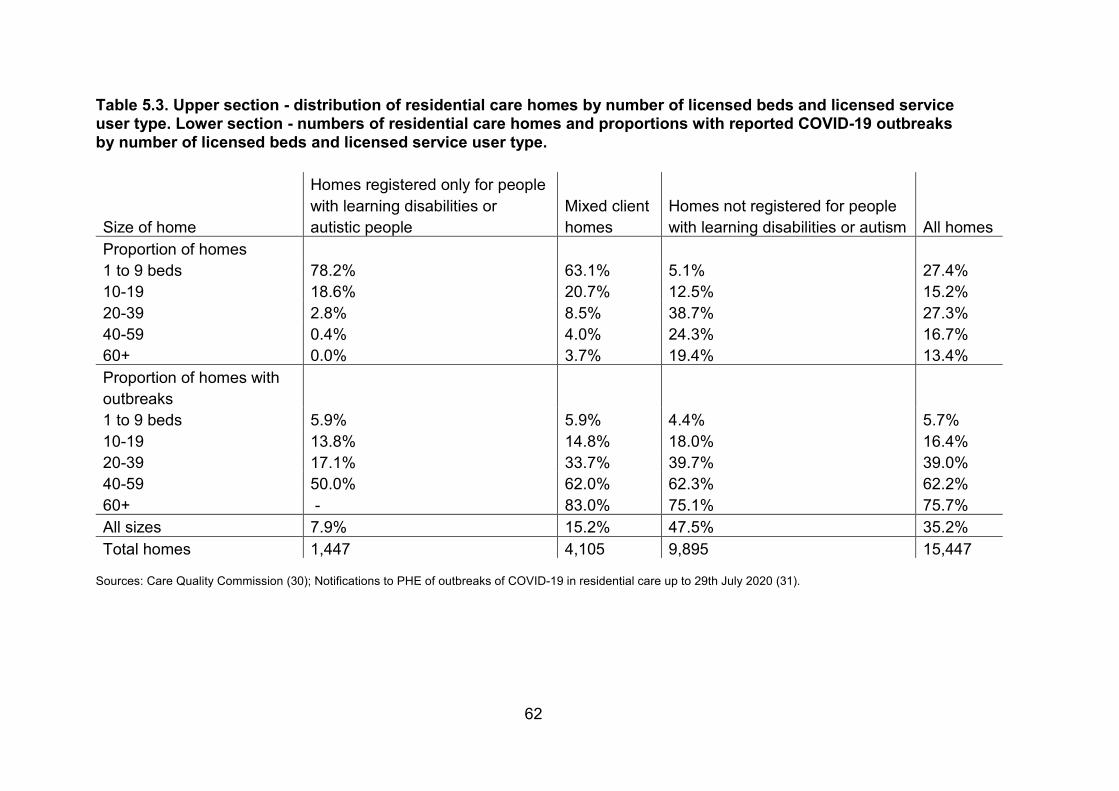
62
Table 5.3. Upper section - distribution of residential care homes by number of licensed beds and licensed service user type. Lower section - numbers of residential care homes and proportions with reported COVID-19 outbreaks by number of licensed beds and licensed service user type.
Size of home
Homes registered only for people with learning disabilities or autistic people
Mixed client homes
Homes not registered for people with learning disabilities or autism All homes
Proportion of homes 1 to 9 beds 78.2% 63.1% 5.1% 27.4% 10-19 18.6% 20.7% 12.5% 15.2% 20-39 2.8% 8.5% 38.7% 27.3% 40-59 0.4% 4.0% 24.3% 16.7% 60+ 0.0% 3.7% 19.4% 13.4% Proportion of homes with outbreaks 1 to 9 beds 5.9% 5.9% 4.4% 5.7% 10-19 13.8% 14.8% 18.0% 16.4% 20-39 17.1% 33.7% 39.7% 39.0% 40-59 50.0% 62.0% 62.3% 62.2% 60+ - 83.0% 75.1% 75.7% All sizes 7.9% 15.2% 47.5% 35.2% Total homes 1,447 4,105 9,895 15,447
Sources: Care Quality Commission (30); Notifications to PHE of outbreaks of COVID-19 in residential care up to 29th July 2020 (31).
63
Out of the units registered only for services users with learning disabilities or autistic service users, 114 had an outbreak of COVID-19 and 18 had at least one death of a resident with learning disabilities with COVID-19. Also, 625 of the mixed user-group units had an outbreak and 65 had at least one death of a person with learning disabilities. The table shows these figures as percentages of all homes in the category. However, it is not possible to say what proportions of homes caring for people with learning disabilities these numbers constitute, as the number of homes with residents with learning disabilities is not known. In the case of the units registered only for service users with learning disabilities or autism this is probably a closer guide than for the mixed user-group units.
One feature of residential care homes for people with learning disabilities or autism likely to have reduced their risk of COVID-19 outbreaks is that they are relatively small. The average size of homes registered only for people with learning disabilities or autistic people was 7.5 beds whereas for mixed purpose units it was 13.4 beds. Residential homes registered for other groups (mainly older people) are substantially larger with an average of 39.5 beds.
Table 5.3 shows the size of residential units in relation to the range of clients for which they are registered, and how this has been associated with COVID-19 outbreaks. Total numbers of homes are at the bottom of the table. The top section shows the distribution of numbers of beds for homes registered for each client group. Homes registered to care for people with learning disabilities or autistic people are much smaller than homes not registered to care for these groups. The bottom section of the table shows the proportions of homes in which COVID-19 outbreaks were recorded by number of beds. There was a strong association.
In summary, people with learning disabilities in residential care had significantly higher death rates than people with learning disabilities generally. COVID-19 accounted for more than half of deaths of those with learning disabilities in residential care during the peak period. The small size of the residential homes in which they live is likely to have been an important factor in avoiding a much worse outcome.
64
Community based social care The situation for community based social care is much harder to assess. The CQC were notified of 98 deaths with COVID-19, and 86 from other causes, among people with learning disabilities receiving community-based adult social care from registered providers in the 5 weeks on which they reported (3). This means that 53% of the deaths of people with learning disabilities receiving community-based care in the period were with COVID-19.
There is no record of the numbers of clients for whom registered providers are currently providing care. Social care statistics show total numbers receiving social care classified by the type of funding package, but since the implementation of the 2014 Care Act, people assessed as needing social care have a wider range of options about the types of provider from which this can be obtained. If they wish, they, or their family carers, can make their own arrangements to get care from individuals who do not need to be registered with the CQC. In these cases, their death, if it occurred, would not be reported to the CQC.
The CQC supplied us with the details of providers of non-residential care where a death had been reported. This data was harder to interpret than data relating to residential care. Non-residential care is provided by a wider range of types of provider. Exactly 7,316 care locations were registered to provide potentially relevant services for people with learning disabilities, though, as with residential care, it is not clear how many of these were doing so at the time. Also, 85 (1.2%) of these care organisations reported at least one COVID-19 death of a service user with learning disabilities in the period covered by the CQC data with 73 services reporting a single death and 12 reporting more than one.
65
Discussion The key finding of this study was that people with learning disabilities had significantly and substantially higher death rates in the first wave of COVID-19 in England than the general population. Making no allowance for the younger age and different sex ratio of people with learning disabilities, the rate of deaths notified to LeDeR in this group was 2.3 times the death rate in the general population. If this figure is adjusted to allow for the likely level of under-notification to LeDeR it was 3.5 times the general population rate. After standardisation for age and sex the rate calculated just from notifications to LeDeR was 4.1 times the general population rate. Adjusting for the likely level of under-notification it was 6.3 times the general population rate.
The total number of deaths in adults with learning disabilities for the 11 weeks from 21 March to 5 June was 2.2 times the average number for the corresponding period in the 2 previous years. By contrast, the number of deaths in the general population was 1.5 times the average for the 2 previous years.
Deaths with COVID-19 in adults with learning disabilities were spread more widely across the age groups than those in the general population. As in the general population, the COVID-19 death rate in people with learning disabilities was higher for men than for women. The overall increase in deaths was also greater in Asian or Asian-British, and Black or Black-British people.
Residential care homes providing care for people with learning disabilities do not appear to have had the very high rates of outbreaks of COVID-19 seen in homes providing care for other groups, mainly older people. This appears to be related to their smaller number of beds.
Limitations The study was severely hampered by the limitations and deficiencies of data collected to monitor the health and care of people with learning disabilities in England. The 2 major data sources used, LeDeR and CPNS, both had substantial levels of incompleteness. The patchy nature of the gaps in both these systems made regional analyses unreliable.
The LeDeR system is designed to support qualitative reviews of deaths of people with learning disabilities. It is not primarily intended to report numbers of deaths, or to provide reports within weeks of the occurrence of deaths.
66
Unlike reviews of child deaths, which are required by law, reviews of the deaths of people with learning disabilities are not mandatory so professionals attending deaths are not required to report them to LeDeR. There is no automatic communication to LeDeR of the deaths of people on GP learning disabilities registers. This makes it likely that notifications of deaths to LeDeR will be incomplete.
A measure of under-notification to LeDeR was available from comparison with the number of deaths of GP patients on learning disabilities registers recorded in the most recent LDHC dataset (covering April 2018 to March 2019). Since LeDeR is a relatively new system, it would have been desirable to check not only the level of completeness of reporting of deaths, but also whether any trend in this was apparent as the system became better known. It was not possible to do this with LDHC as there was only a single overlapping period in the available data. However, the evidence from comparing numbers of deaths from causes other than COVID-19 with numbers of deaths in the 2 previous years set out alongside chart 3.1 does not suggest there is major distortion from this type of influence. The LDHC dataset is also incomplete, offering a sample of data from just over half of England as described in the ‘Main sources of data’ section (above) and Annexe 2. Its coverage varies considerably between regions, making assessment of LeDeR coverage between regions unreliable.
LeDeR operates under strict information governance rules. These meant it was not possible to identify the local areas where deceased people lived, precluding analysis of any differential impact of COVID-19 on areas of social deprivation. They also precluded making direct links between notifications to LeDeR and records in the CPNS system. This made it impossible to identify the precise extent of overlap and thus estimate the total number of hospital deaths of people with learning disabilities. Questions about the variability of completeness in both LeDeR and CPNS limited the analysis of regional patterns to changes in local numbers.
The difficulties arising from the lack of recording of learning disabilities status for 25% of deaths notified in the CPNS system have been described in the report. The inability to record this in such a large proportion of cases is understandable given the context, as outlined in the introduction.
For calculating rates of death per 100,000 population, the study assumed that the people identified as having learning disabilities in LeDeR and CPNS were broadly people who were on their GPs’ learning disabilities registers. The reasons are set out in the introduction. If in reality LeDeR or CPNS capture
67
deaths in a narrower or broader group of people, rates would be under- or over-estimated as a result.
The most important gap in population data was the lack of data about numbers of people with learning disabilities in Black and minority ethnic groups. Without this, analysis of rate differences between these groups was not possible. As with regional differences, analysis was limited to changes in numbers of deaths between years.
With the problems of under-reporting of deaths to LeDeR, and gaps in recording of learning disabilities status in CPNS, the approach to providing estimates of death rates (per 100,000 population) was, in most cases, to present 2 calculations. One used numbers of deaths recorded as being of people with learning disabilities. These provide a marker of the lowest rates compatible with the data. In the case of LeDeR data they definitely represent under-estimates, and in the case of CPNS they almost certainly do. However, the differences between these rates and those for the general population, or the population assumed not to have learning disabilities, were stark.
The second set of rates represented an estimate of the likely numbers of deaths using all the data available. The accuracy of these will have depended on the validity of the assumptions on which they were based. In all cases the findings suggested even greater differences than the unadjusted figures.
In the case of rates from LeDeR data, the key assumption was about the rate of under-notification. Our estimate of this was based on data from April 2018 to March 2019. It is possible that notification rates may have risen since March 2019, but the data shown in figure 3.1 suggests it is unlikely this would have been by a large margin. In the case of CPNS data the key assumption was that the frequency of learning disabilities in people whose status was recorded as ‘not known’ would have been the same as in those for whom it was known in each age and sex group. There is no realistic way to test this.
Finally, it is important to reiterate a point made in the introduction. This study was only able to report on mortality in people whose learning disabilities were recognised and recorded by health services or reported to LeDeR by family or friends. There is 0.57% of adults registered with GPs who are on learning disabilities registers. As set out in the introduction, this figure is substantially lower than the numbers currently identified as having the special educational needs of moderate, severe, or profound and multiple learning difficulties in English schools (22). The great majority of people recognised as having
68
learning disabilities in schools are not recognised as such by health services in adulthood (32).
Those missed are likely to be those with mild or moderate (as opposed to severe or profound) intellectual disabilities without major accompanying physical syndromes. This group are known to have poor physical health, including higher rates of obesity and diabetes, putting them at increased risk of death from COVID-19 (33). They are also likely to have less capacity to understand and follow guidance on social distancing (12).
69
References 1. Heslop, P., Calkin, R., Byrne, V., Huxor, A., & Gielnik, K. (2020). TheLearning Disability Mortality Review (LeDeR) Programme: Annual Report2019. http://www.bristol.ac.uk/media-library/sites/sps/leder/LeDeR_2019_annual_report_FINAL.pdf
2. Arden & Gem, & NHS England. (2020). COVID-19 patient notificationsystem user guide. https://www.england.nhs.uk/statistics/statistical-work-areas/covid-19-daily-deaths/
3. Care Quality Commission. (2020b). COVID 19 INSIGHT: Issue 2.https://www.cqc.org.uk/publications/covid-19-insight-issue-2 (in relation topage 65 see slide 31)
4. Office for National Statistics. (2020). Weekly provisional figures on deathsregistered weekly in England and Wales.https://www.ons.gov.uk/peoplepopulationandcommunity/birthsdeathsandmarriages/deaths/datasets/weeklyprovisionalfiguresondeathsregisteredinenglandandwales
5. Public Health England. (2020). Disparities in the risk and outcome ofCOVID-19. https://www.gov.uk/government/publications/covid-19-review-of-disparities-in-risks-and-outcomes
6.O'Hara J., McCarthy J. & Bouras N. (2010) Intellectual Disability and IllHealth. Cambridge University Press, Cambridge UK.
7. NHS Digital and Public Health England. (2016). Health and care of peoplewith learning disabilities 2014-15.http://www.content.digital.nhs.uk/catalogue/PUB22607/Health-care-learning-disabilities-2014-15-summary.pdf
8. Glover, G., Williams, R., Heslop, P., Oyinlola, J., & Grey, J. (2017).Mortality in people with intellectual disabilities in England. Journal ofIntellectual Disability Research, 61(1). https://doi.org/10.1111/jir.12314
9. NHS Digital. (2019b). Quality and Outcomes Framework, Achievement,prevalence and exceptions data 2018-19 [PAS]. https://digital.nhs.uk/data-and-information/publications/statistical/quality-and-outcomes-framework-achievement-prevalence-and-exceptions-data/2018-19-pas
70
10. NHS Digital. (2020). Health and care of people with learning disabilities,experimental statistics 2018 to 2019. https://digital.nhs.uk/data-and-information/publications/statistical/health and-care-of-people-with-learning-disabilties/experimenal-statistics-2018-to-2019
11. NHS Digital. (2019a). Adult Social Care Activity and Finance Report,England - 2018-19 [PAS]. https://digital.nhs.uk/data-and-information/publications/statistical/adult-social-care-activity-and-finance-report/2018-19
12. Courtenay, K., & Perera, B. (2020). COVID-19 and people withintellectual disability: impacts of a pandemic. Irish Journal of PsychologicalMedicine, 1–6. https://doi.org/10.1017/ipm.2020.45
13. Watkin, A. (2020). COVID-19-related deaths in Wales amongst Peoplewith Learning Disabilities from 1st March to 26th May 2020.https://www.ldw.org.uk/wp-content/uploads/2020/09/200729-COVID-19-related-deaths-amongst-PwLD.pdf
14. Heslop, P., Calkin, R., & Huxor, A. (2019). The Learning DisabilityMortality Review (LeDeR) Programme: Annual report 2018.http://www.bristol.ac.uk/media-library/sites/sps/leder/LeDeR_Annual_Report_2018 published May 2019.pdf
15. Roeleveld N., Zielhuis G. & Gabreels, F. (1997) The prevalence of mentalretardation: a critical review of recent literature. Developmental Medicine andChild Neurology. 39: 125-132.
16. Yeargin-Allsopp M., Murphy C., Oakley G. & Sikes K. (1992) A multiple-source method for studying the trevalence of developmental disabilities inchildren: the Metropolitan Atlanta Developmental Disabilities Study.Pediatrics 89: 624-630.
17. Leonard H., & Wen, X. (2002). The epidemiology of mental retardation:challenges and opportunities in the new millennium. Mental Retardation andDevelopmental Disabilities Research Reviews 8: 117–134
18. Department for Education. (2020). Special educational needs in England:January 2020. https://www.gov.uk/government/statistics/special-educational-needs-in-england-january-2020
19. Public Health England (2016) People with learning disabilities in England2015. Published online at
71
https://www.gov.uk/government/publications/people-with-learning-disabilities-in-england-2015 (accessed 18/10/2020)
20. Heslop, P., Blair, P., Fleming, P., Hoghton, M., & Marriott, A. (2013)..Confidential Inquiry into premature deaths of people with learning disabilities(CIPOLD). Final report. www.bris.ac.uk/cipold/fullfinalreport.pdf
21. Michael J. (chair) (2008). Healthcare for all: report of the independent inquiry into access to healthcare for people with learning disabilities. Available online at https://webarchive.nationalarchives.gov.uk/20130105064250/http://www.dh.gov.uk/e n/Publicationsandstatistics/Publications/PublicationsPolicyAndGuidance/DH_099255 (accessed 18/10/2020)
22. Office for National Statistics (2017) New approaches for producingpopulation estimates by ethnic group report. Published online at:https://www.ons.gov.uk/peoplepopulationandcommunity/populationandmigration/populationestimates/methodologies/populationestimatesbyethnicgroup(accessed 17/10/2020)
23. Office for National Statistics (2018) Population denominators by ethnicgroup, regions and countries: England and Wales, 2011 to 2018. Publishedonline at:https://www.ons.gov.uk/peoplepopulationandcommunity/populationandmigration/populationestimates/adhocs/008780populationdenominatorsbyethnicgrou pregionsandcountriesenglandandwales2011to2017 (accessed 17/10/2020)
24. Learning Disabilities Mortality Review (LeDeR) Programme. (2017).Annual Report December 2017.http://www.bristol.ac.uk/sps/leder/resources/annual-reports/
25. UK Parliament (2009) Care Quality Commission (Registration)Regulations. 2009. Statutory Instrument 2009 No 3112. Available online atwww.legislation.gov.uk/search?title=&year=2009&number=3112&type=uksi
26. Care Quality Commission. (2020). Death of a person using the service –notification form. https://www.cqc.org.uk/guidance-providers/notifications/death-person-using-service-–-notification-form
27. Office for National Statistics. (2020). All data related to Populationestimates for the UK, England and Wales, Scotland and Northern Ireland:mid-2019.https://www.ons.gov.uk/peoplepopulationandcommunity/populationandmigration/populationestimates/bulletins/annualmidyearpopulationestimates/mid2019 estimates/relateddata
72
28. Barnett, M. L., & Grabowski, D. C. (2020). Nursing Homes Are GroundZero for COVID-19. JAMA Health Forum.doi:10.1001/jamahealthforum.2020.0369
29. Salcher-Konrad, M., Jhass, A., Naci, H., Tan, M., El-Tawi, Y., Comas-Herrera, A., & Salcher-Konrad, V. O. P. (2020). COVID-19 related mortalityand spread of disease in long-term care: a living systematic review ofemerging evidence. MedRxiv Preprint.https://doi.org/10.1101/2020.06.09.20125237
30. Care Quality Commission (2020). Care directory with filters.https://www.cqc.org.uk/about-us/transparency/using-cqc-data
31. Public Health England (2020) COVID-19: number of outbreaks in care homes -management information Published online athttps://www.gov.uk/government/statistical-data-sets/covid-19-number-of-outbreaks-in-care-homes-management-information (accessed 18/10/2020)
32. Emerson, E., & Glover, G. (2012). The “transition cliff” in theadministrative prevalence of learning disabilities in England. Tizard LearningDisability Review, 17(3), 139–143.
33. Emerson, E., Hatton, C., Baines, S., & Robertson, J. (2016). The physicalhealth of British adults with intellectual disability: Cross sectional study.International Journal for Equity in Health, 15(1).https://doi.org/10.1186/s12939-016-0296-x
34. Strand, S., & Lindorff, A. (2018). Ethnic disproportionality in theidentification of Special Educational Needs (SEN) in England: Extent, causesand consequences. http://www.education.ox.ac.uk/wp-content/uploads/2018/12/Combined-Report_2018-12-20.pdf
35. Eurostat (2013) Revision of the European Standard Population. Report ofEurostat's task force. Available online atec.europa.eu/eurostat/documents/3859598/5926869/KS-RA-13-028-EN.PDF/e713fa79-1add-44e8-b23d-5e8fa09b3f8f (accessed 19/10/2020)
73
Annexe 1. The commission Terms of reference Further analysis of data related to the deaths of people with learning disabilities from COVID-19.
This document sets out the formal commission from Department of Health and Social Care, with the support of the Chief Medical Officer, to Public Health England. It establishes the parameters for the requested piece of work, namely further analysis of data related to the deaths of people with learning disabilities (LD) from COVID-19.
Purpose To conduct analysis, which will inform policy and practice to reduce the risk and impact going forward, of COVID-19 on people with learning disabilities.
Data The analysis will draw upon all available data regarding the deaths of people with LD from COVID-19. This includes:
1. Deaths in acute settings by long term condition (NHS England) with adiagnosis of COVID-19.
2. Reported deaths to the Learning Disabilities Mortality Review(LeDeR).
3. Death notifications to the Care Quality Commission.
Analysis required The following metrics have been identified as priority by stakeholders. Analysis should be primarily focused on the peak 6 weeks of the COVID-19 pandemic.
1. Age, ethnicity and gender split of existing data.2. Comparison to deaths for people with learning disabilities reported in
the same period of the previous year.3. Compare the proportion of COVID-19 deaths among people with
learning disabilities to the proportion of people with learning disabilities

74
in the general population (using appropriate learning disabilities prevalence data).
4. Comparison of mortality rates between people with learning disabilitiesand the general population making allowance for the differences in theage/sex profile of the 2 groups.
5. Scoping possibility of analysis of LeDeR data to establish where thereare high numbers of deaths in single addresses.
6. Breakdown of deaths by setting (those happening in hospital settingsand those happening in other types of location).
7. Age and gender standardised mortality rates.
75
Annexe 2. Data sources and methods Population data There is no good source of data about the population of people with learning disabilities in England. In order to calculate rates of death in relation to age, sex or ethnic groups, population data broken down by these characteristics are required. Two sources were used to estimate the size and breakdown by age and sex, both drawn from general practice (GP) information systems and both based on the learning disabilities registers GPs are asked to keep as part of the Quality and Outcomes Framework (QOF).
The first source was the annual QOF data collection (10). This is collected in an automated data extraction from participating general practices. It provides a total figure for number of people on the practice learning disabilities register. Almost all practices participate. Register totals from the 2019 QOF dataset were used to give the total number of people in England identified as having learning disabilities for healthcare provision purposes. However, this source gives no further information about the composition of the population.
The second source was the LDHC dataset (9). This is also collected by direct annual extraction from GP practice information systems. Reports are at clinical commissioning group (CCG) level and include numbers on learning disabilities registers by age group and sex. Data from the most recent (2018 to 2019) extraction provided this population data as at March 2019. It also gave the number of people on learning disabilities registers who died in the year to March 2019. These sources were used to estimate the completeness of the LeDeR data as described below.
However, the LDHC dataset only manages to collect data from practices covering a little over 50% of the population of England each year (9). It is intended to be complete but to date it has not been possible to obtain data from practices using one of the 2 common GP practice information systems. The calculations used to estimate the overall population of England with learning disabilities known to GPs by age group and sex are set out below alongside the estimate of completeness of reporting of deaths of people with learning disabilities to LeDeR.
A further limitation of LDHC data, and inevitably also QOF data, is that the coverage of children and young people is very incomplete. This is because they are counting numbers of people GPs have recorded as on learning
76
disabilities registers. GPs often do not record this until late in childhood or in adolescence when transition to adult care is being planned.
Ethnic groups Both LeDeR and the hospital deaths datasets use the full UK national ethnic group coding. For most groups there were insufficient cases for separate analysis, so these were condensed as shown in box 1.
The possibility of making estimates of the size of the population with learning disabilities in minority ethnic groups was explored. The approach taken was to use ONS estimates of the total population in ethnic minority groups calculated from the 2011 census, combined with estimates of the proportion of children with learning disabilities in minority ethnic groups from school special educational needs statistics (25). This seemed an unreliable approach as it combined the uncertainty of forward projection of minority ethnic populations without correction for international migration with further uncertainty about the relevance of patterns of learning disabilities in people of school age to people in the middle and older age groups where death with COVID-19 is mainly seen. Reported numbers of deaths of people from minority ethnic groups were relatively small, making the statistical confidence intervals of rates relatively wide. The resulting rate calculations were all
Box 1 Ethnic Groupings used. White included: White – British, White – Irish, White - Gypsy or Irish Traveller, White - any other White background
Asian / Asian British included: Asian / Asian British – Indian, Asian / Asian British – Pakistani, Asian / Asian British – Bangladeshi, Asian / Asian British – Chinese, Asian / Asian British - any other Asian background
Black / Black British included: Black / Black British – Caribbean, Black / Black British – African, Black / Black British - any other Black background
Other ethnic groups included: Mixed / multiple - White and Asian, Mixed / multiple - White and Black Caribbean, Mixed / multiple - White and Black African, any other Mixed / multiple background, Other ethnic group – Arab, Other ethnic group - any other ethnic group
77
statistically inconclusive. For this reason, the analysis presented here is confined to analysis of trends in numbers of deaths.
Learning Disabilities Mortality Review (LeDeR) LeDeR is a continuing survey of deaths of people with learning disabilities. In its national form it is a relatively recent development, set up in 2015, in response to the Confidential Inquiry into Premature Deaths of People with Learning Disabilities (CIPOLD) (20). It started collecting data in July 2016. Deaths are reported as they occur to the national team in Bristol. Only limited data is collected at this ‘notification’ stage. This is primarily intended to provide regional teams, responsible for undertaking the reviews, with the information they need to initiate their work. However, as the full review process in most cases takes several months, it would not be sufficiently timely for a study such as this. Instead the initial notification data was used. The LeDeR methodology is described in their most recently published annual report (1).
The LeDeR team provided data for all notifications since the start of January 2018. This provided comparison data for the 2 previous years. Notifications for years before 2017 were more substantially incomplete. The initial data extract, on which the report was developed, was drawn on 19 June 2020, covering deaths on or up to 5 June. This was refreshed with an update extract taken on 4 September. The September refresh identified 147 relevant deaths not in the initial extract and allowed deletion of 24 records which were either duplicates or which had proved to be outside the scope of LeDeR.
Notifications to LeDeR have become quicker over the last 2 years. Comparing deaths occurring up to 5 June in each of the 3 years for which data was available, in 2018, 92% of the deaths currently known about had been notified by 4 September in the same year with a median interval from death to notification of 7 days. In 2019, 94% had been notified by 4th September with a median interval of 6 days. In 2020, the median interval from death to notification for the deaths notified by 4 September was 4 days.
The data provided included LeDeR ID number, date of death, date of notification, sex, age at death, ethnicity, type of place of death, first part of postcode of place of normal residence, and COVID-19 status.
The COVID-19 questions were added to the notification process from 3 April 2020. A pre-existing question asked notifiers to report the cause of death if
78
they were able. During March 2020 a number of notifiers reported COVID-19 as a suspected or confirmed cause. Local area contacts, responsible for organising reviews have subsequently been asked to advise whether COVID-19 was a suspected or confirmed cause in all deaths occurring in 2020. For this report if the local contact has provided information this has been taken to be more reliable than that provided by notifiers. If not, the information from the notifier was used.
For the epidemic curve (figure 3.1) all deaths were included. For most of the report only deaths of adults are included. This is for consistency. There are no usable population data for calculating death rates for people with learning disabilities aged under 18 and the number of deaths was too small for such calculations to produce usable results.
Many analyses compare deaths in the epidemic period to deaths in the corresponding period in earlier years. For these, the epidemic period was taken to be 21 March to 5 June. The start point is clearer from the epidemic curve than the end point. The end point was a pragmatic choice reflecting the latest point for which reasonably complete data was available at the time the analysis was undertaken.
Completeness of LeDeR data There is no mandatory requirement for deaths of people with learning disabilities to be reported to LeDeR. It depends on goodwill and wide publicity in a well networked community. Anyone can report deaths either through the LeDeR website or by contacting the LeDeR office at Bristol University. The team scrutinise notifications to identify multiple reports. The numbers of deaths notified stabilised in 2018 and 2019 but the overall number is significantly lower than would be expected based on estimates from the LDHC dataset (1,13).
Estimating the extent to which reporting of deaths to LeDeR is incomplete is critical both for the initial estimate of the total number of deaths with COVID-19 to 5 June and all subsequent calculations of rates of death per 100,000 population. Estimates of the gaps described above in reporting to the LDHC dataset are also critical to estimates of the overall number of deaths. These 2 sets of estimates are linked. Because of their central importance to many findings in this report, this calculation is set out in detail in tables A1 and A2. The calculations here are shown at national level. For the study, most calculations were done at CCG level to allow local populations and estimates of deaths to be calculated for NHS regions. The exceptions, where it was
79
necessary to undertake a single national calculation, are indicated in the following descriptions.
Table A1 covers estimating the size and structure of the population. Columns A and B show totals for the number of people on learning disabilities registers at the end of March 2019, and the numbers of deaths recorded in the year to March 2019 reported in the LDHC dataset. Deaths are likely to be almost completely recorded in this dataset and the learning disabilities register status of each deceased person is available. The total number of people on learning disabilities registers in practices contributing data to the LDHC dataset was 150,982 (column A total). A total of 1,959 deaths were recorded.
The annual QOF data returns for the same point in time indicate that, nationally, 297,174 people were on their GPs’ learning disabilities register. LDHC had thus covered 50.8% of people on learning disabilities registers. Column C of the calculation shows the proportion of people on learning disabilities registers in each age and sex grouping used (calculated nationally). In column D, the missing 146,192 people on registers (297,174 minus 150,982) were shared between the age and sex groups in proportion to the population for whom these details were available. Column E shows the estimated population in each age and sex group, the sum of columns A and D.
The calculations for the number of deaths likely to have occurred is shown in table A2. The total numbers of deaths of people on learning disabilities registers is shown in table A1, column B. Column F of table A2 shows the age and sex-specific death rates per 1000 people with learning disabilities. These were calculated nationally, dividing column B in table A1 by column A in table A1. Using these, an estimate of the likely number of deaths in the missing population was calculated by multiplying the estimates of the number of missing registered people in column D of table A1 by the death rates for the people recorded in the LDHC dataset (column F). This was added to the number of deaths reported in the LDHC dataset to give the estimated total deaths of people on learning disabilities registers in column H. The total for this column suggests that a little under 3,860 people on learning disabilities registers are likely to have died in 2018 to 2019. Column I shows the numbers of deaths reported to LeDeR, for the same age and sex groupings, occurring in the year to the end of March 2019. Column J shows these numbers as a percentage of the expected numbers in column H. This is termed the ‘completeness’ of reporting.
The estimate of the completeness shows very different patterns for children and adults. For adults, reporting appears to have been most complete in the
80
younger age groups. It declined noticeably in the 3 oldest age groups (above age 55) for both sexes. The pattern for children was different, with numbers of deaths reported to LeDeR exceeding 5 times the expected number estimated from the LDHC dataset. This probably arises from 2 causes. As noted above, the LDHC dataset is a poor record of children and young adolescents with learning disabilities. This is clear from the fact that the number of people on learning disabilities registers in the 18 year interval from birth to age 17 is smaller than the number in the 7 year interval from 18 to 24 (column A). Deaths of people not on learning disabilities registers will therefore also not be recorded in the LDHC dataset. By contrast, childhood is the time when reporting to LeDeR is most secure. All deaths of children are subject to statutory child death reviews. Cross-reporting from these to LeDeR is an established process which happens almost automatically when a child death review identifies that a deceased child had learning disabilities.
For analytic purposes in this report the issue of incompleteness has been managed in 2 ways. A number of analyses report primarily on changes in numbers of deaths from 2018 and 2019 to 2020. For these analyses no adjustments have been made. In some analyses (table 3.1, figure 4.2, figure 4.5, table 4.1, table 5.1) rates per 100,000 population are calculated. For each of these calculations 2 results are presented. One uses the lowest possible estimate of the number of deaths of people with learning disabilities, the number reported to LeDeR. The other increases this figure by a factor assuming the observed notification rate of 65% applies across all adult age groups.
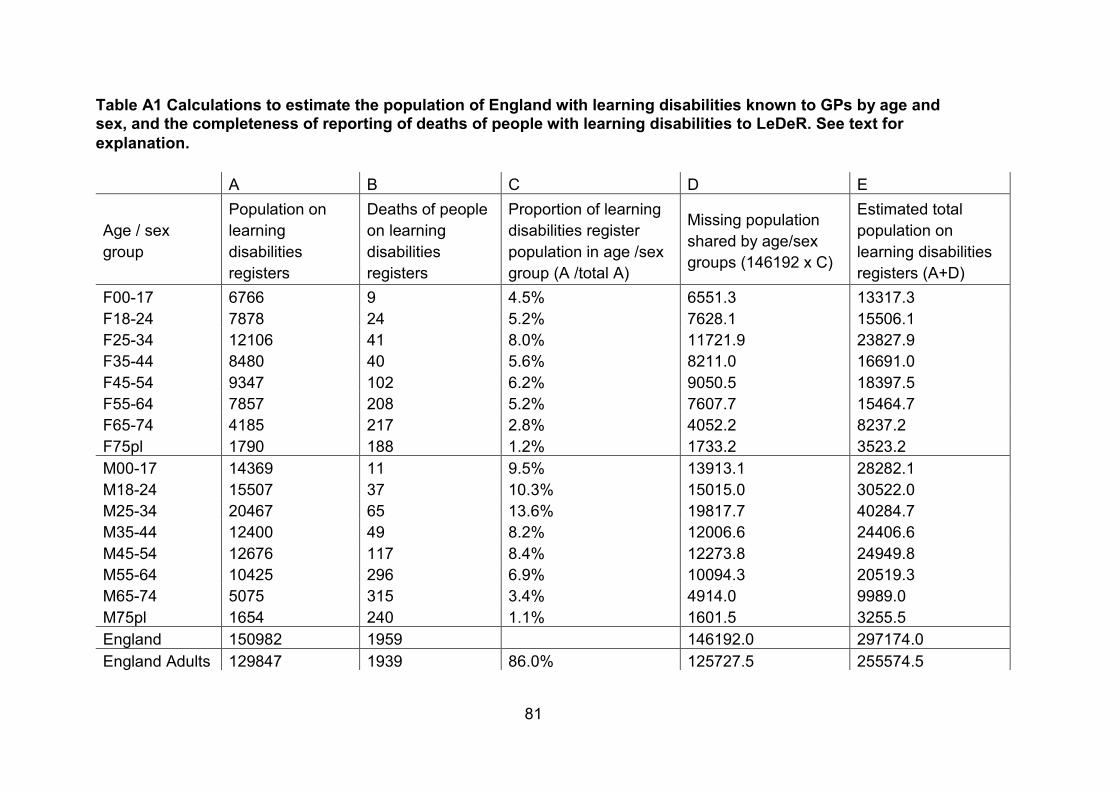
81
Table A1 Calculations to estimate the population of England with learning disabilities known to GPs by age and sex, and the completeness of reporting of deaths of people with learning disabilities to LeDeR. See text for explanation.
A B C D E
Age / sex group
Population on learning disabilities registers
Deaths of people on learning disabilities registers
Proportion of learning disabilities register population in age /sex group (A /total A)
Missing population shared by age/sex groups (146192 x C)
Estimated total population on learning disabilities registers (A+D)
F00-17 6766 9 4.5% 6551.3 13317.3 F18-24 7878 24 5.2% 7628.1 15506.1 F25-34 12106 41 8.0% 11721.9 23827.9 F35-44 8480 40 5.6% 8211.0 16691.0 F45-54 9347 102 6.2% 9050.5 18397.5 F55-64 7857 208 5.2% 7607.7 15464.7 F65-74 4185 217 2.8% 4052.2 8237.2 F75pl 1790 188 1.2% 1733.2 3523.2 M00-17 14369 11 9.5% 13913.1 28282.1 M18-24 15507 37 10.3% 15015.0 30522.0 M25-34 20467 65 13.6% 19817.7 40284.7 M35-44 12400 49 8.2% 12006.6 24406.6 M45-54 12676 117 8.4% 12273.8 24949.8 M55-64 10425 296 6.9% 10094.3 20519.3 M65-74 5075 315 3.4% 4914.0 9989.0 M75pl 1654 240 1.1% 1601.5 3255.5 England 150982 1959 146192.0 297174.0 England Adults 129847 1939 86.0% 125727.5 255574.5
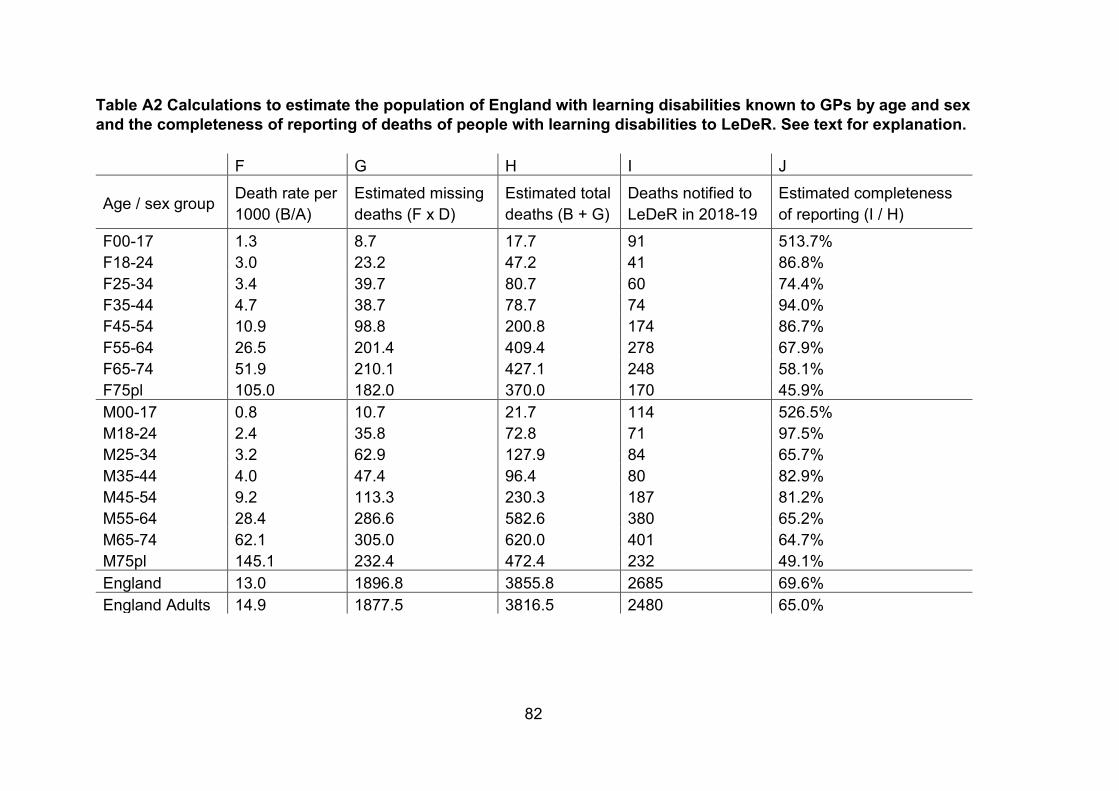
82
Table A2 Calculations to estimate the population of England with learning disabilities known to GPs by age and sex and the completeness of reporting of deaths of people with learning disabilities to LeDeR. See text for explanation.
F G H I J
Age / sex group Death rate per 1000 (B/A)
Estimated missing deaths (F x D)
Estimated total deaths (B + G)
Deaths notified to LeDeR in 2018-19
Estimated completeness of reporting (I / H)
F00-17 1.3 8.7 17.7 91 513.7% F18-24 3.0 23.2 47.2 41 86.8% F25-34 3.4 39.7 80.7 60 74.4% F35-44 4.7 38.7 78.7 74 94.0% F45-54 10.9 98.8 200.8 174 86.7% F55-64 26.5 201.4 409.4 278 67.9% F65-74 51.9 210.1 427.1 248 58.1% F75pl 105.0 182.0 370.0 170 45.9% M00-17 0.8 10.7 21.7 114 526.5% M18-24 2.4 35.8 72.8 71 97.5% M25-34 3.2 62.9 127.9 84 65.7% M35-44 4.0 47.4 96.4 80 82.9% M45-54 9.2 113.3 230.3 187 81.2% M55-64 28.4 286.6 582.6 380 65.2% M65-74 62.1 305.0 620.0 401 64.7% M75pl 145.1 232.4 472.4 232 49.1% England 13.0 1896.8 3855.8 2685 69.6% England Adults 14.9 1877.5 3816.5 2480 65.0%
Main title goes here as running header
83
NHS England COVID-19 Patient Notification System Data on COVID-19 deaths in hospital settings is taken from the NHS England COVID-19 Patient Notification System (2). This is one of the data sources set up early in 2020 specifically for managing the COVID-19 emergency. Tables were extracted of numbers of deaths by age group, sex and ethnic group, by age –group, sex and NHS region and by provider trust.
The data source contains records of all patients dying in hospital settings with a laboratory confirmation of the diagnosis of COVID-19 or a mention of this diagnosis among the certified causes of death. Since 24 March there has been a field in the dataset specifying whether or not the deceased patient had learning disabilities. For about a quarter of COVID-19 deaths records up to 5 June 2020 the learning disabilities status was either not entered or recorded as not known.
For most analyses in this report, these deaths with unknown learning disabilities status have been handled in 2 ways. The first approach, giving the lowest possible estimate of the number of deaths of people with learning disabilities is to assume that all deceased individuals with status not known did not have learning disabilities. They are thus all assigned to the not learning disabled group. The alternative approach used, which seems likely to be closer to reality, was to assign deaths with status not known to the learning disabilities and not learning disabled groups in proportion to the numbers with clearly reported status in those groups in each age and sex group.
Calculations of rates Death rates in this report, are specified either as rates up to 5 June or rates in a specific shorter period. Death rates are normally calculated as deaths per unit population per year. If the observations on which they are based are more or less than a year, it is conventional to scale them up or down to this time period to facilitate comparison. This has not been done here because the set of deaths being reported on represent a distinct period of very high death rates for short duration.
Calculations of standardised rates use the 2013 European Standard Population (35).
84
Published November 2020 PHE gateway number: GW-1687
www.gov.uk/phe Twitter: @PHE_uk www.facebook.com/PublicHealthEngland
© Crown copyright 2020
Prepared by: Gyles Glover