cr kendall mine amended closure plan...
TRANSCRIPT
C:\Users\Jim\Documents\Kendall\Reclamation\2012 Kendall Closure Plan\Final Kendall Mine Closure Mgmt Plan.Docx\JIM VOLBERDING
P.O. BOX 501
LEWISTOWN, MT 59457\7/26/12\065 7/26/12\11:53 AM
CR KENDALL MINE
AMENDED CLOSURE PLAN
WATER MANAGEMENT
Prepared for:
CR Kendall Corp.
PO Box 799
Hilger, MT 59451
Prepared by:
Hydrometrics, Inc. 300 Learn Lane
Kalispell, MT 59901
And
CR Kendall Corp.
July 2012
C:\Users\Jim\Documents\Kendall\Reclamation\2012 Kendall Closure Plan\Final Kendall Mine Closure Mgmt Plan.Docx\JIM VOLBERDING
P.O. BOX 501
LEWISTOWN, MT 59457\7/26/12\065
ii 7/26/12\11:53 AM
TABLE OF CONTENTS
LIST OF TABLES ...........................................................................................................iv
LIST OF FIGURES .........................................................................................................v
LIST OF APPENDICES ..................................................................................................vi
LIST OF EXHIBITS ........................................................................................................vi
1.0 INTRODUCTION .....................................................................................................1-1
1.1 PURPOSE AND SCOPE ...............................................................................1-3
1.2 SUMMARY OF MINE OPERATIONAL HISTORY ..................................1-3
1.3 SUMMARY OF MINE RECLAMATION HISTORY .................................1-4
1.4 SUMMARY OF PROPOSED FINAL WATER MANAGEMENT PLAN ..1-5
1.4.1 Water Management Goals ...............................................................1-5
1.4.2 Flow Augmentation ........................................................................1-6
1.4.3 Process Pad Drainage ......................................................................1-7
1.4.4 Groundwater Capture Systems .......................................................1-7
1.4.5 Water Quality Parameters of Concern ............................................1-8
1.4.6 Water Storage, Treatment and Discharge .......................................1-8
1.4.7 Stormwater ......................................................................................1-9
2.0 PROCESS PADS CAPPING AND FINAL RECLAMATION ................................2-1
2.1 DESCRIPTION OF COVER ALTERNATIVES ..........................................2-1
2.1.1 Barrier Covers .................................................................................2-1
2.1.2 Reduced Permeability Layer Cover ................................................2-2
2.1.3 Water Balance Soil Cover ...............................................................2-2
2.1.4 Modified Water Balance Cover – Final Selected Pad Cap .............2-3
2.2 PROPOSED FINAL PAD CAP CONSTRUCTION .....................................2-4
2.3 FINAL PAD CAP HYDRAULIC PERFORMANCE ...................................2-5
2.3.1 Observed Precipitation ....................................................................2-5
2.3.2 Observed Constructed Partial Cap Drainage ..................................2-6
2.3.3 Predicted Complete Cap Drainage ..................................................2-8
2.4 PAD DRAINAGE WATER QUALITY ........................................................2-14
C:\Users\Jim\Documents\Kendall\Reclamation\2012 Kendall Closure Plan\Final Kendall Mine Closure Mgmt Plan.Docx\JIM VOLBERDING
P.O. BOX 501
LEWISTOWN, MT 59457\7/26/12\065
iii 7/26/12\11:53 AM
3.0 GROUNDWATER CAPTURE SYSTEM FLOWS
AND WATER QUALITY ......................................................................................3-1
3.1 CAPTURE SYSTEM FLOWS ......................................................................3-1
3.2 CAPTURE SYSTEM WATER QUALITY...................................................3-1
3.2.1 Muleshoe Branch of Little Dog Creek (KVPB-6 Pumpback
System) ...........................................................................................3-1
3.2.2 Barnes-King Gulch (KVPB-2 Pumpback System) .........................3-3
3.2.3 Mason Canyon (TMW-26 Pumpback System) ...............................3-3
3.2.4 South Fork of Last Chance Creek (KVPB-5 Pumpback System)...3-6
4.0 INFLOW TO WATER TREATMENT SYSTEM ....................................................4-1
4.1 CONCEPTUAL MODEL ..............................................................................4-1
4.2 UNCERTAINTIES AND LIMITATIONS OF THE MIXING MODEL......4-5
4.3 POND INFLOW RATES ..............................................................................4-7
4.4 POND INFLOW CHEMISTRY ....................................................................4-10
4.5 STORAGE POND CHEMICAL CONCENTRATIONS ..............................4-11
4.6 TREATMENT PLANT INFLOW CONCENTRATIONS ............................4-13
5.0 WATER TREATMENT ALTERNATIVES .............................................................5-1
5.1 ALTERNATIVES EVALUATED AND NOT SELECTED ........................5-1
5.1.1 Reverse Osmosis .............................................................................5-1
5.1.2 Biological Treatment ......................................................................5-1
5.1.3 Sulfide Precipitation........................................................................5-3
5.2 ZEOLITE PILOT TEST RESULTS ..............................................................5-3
5.2.1 Steelhead Clinoptilolite ...................................................................5-4
5.2.2 St. Cloud Clinoptilolite ...................................................................5-5
6.0 PROPOSED WATER TREATMENT SYSTEM ......................................................6-1
6.1 DESIGN CRITERIA .....................................................................................6-1
6.2 STORAGE OF WATERS BEFORE TREATMENT ....................................6-3
6.3 SUSPENDED SOLIDS REMOVAL .............................................................6-4
6.4 THALLIUM REMOVAL ..............................................................................6-4
6.5 TREATED WATER DISPOSAL ..................................................................6-6
C:\Users\Jim\Documents\Kendall\Reclamation\2012 Kendall Closure Plan\Final Kendall Mine Closure Mgmt Plan.Docx\JIM VOLBERDING
P.O. BOX 501
LEWISTOWN, MT 59457\7/26/12\065
iv 7/26/12\11:53 AM
6.6 CHARACTERISTICS AND DISPOSAL OF TREATMENT
RESIDUALS ..............................................................................................6-6
7.0 OPERATION, MAINTENANCE AND MONITORING .........................................7-1
7.1 SUPPORT FACILITIES ................................................................................7-1
7.2 MANPOWER REQUIREMENTS ................................................................7-2
7.3 FUEL AND POWER .....................................................................................7-2
7.4 TRANSPORTATION ....................................................................................7-2
7.5 WASTE ..........................................................................................................7-3
7.6 MONITORING ..............................................................................................7-3
7.7 CONTINGENCY ACTIONS ........................................................................7-3
7.7.1 Pond Mixing....................................................................................7-3
7.7.2 Land Application ............................................................................7-4
7.7.3 Zeolite Disposal ..............................................................................7-5
8.0 REFERENCES ..........................................................................................................8-1
LIST OF TABLES
TABLE 2-1. HELP MODEL SOIL INPUT PARAMETERS ....................................2-9
TABLE 2-2. HELP MODEL CLIMATE INPUT PARAMETERS ...........................2-10
TABLE 2-3. SUMMARY OF HELP MODEL PREDICTION OF PAD
DRAINAGE WITH MODIFIED WATER BALANCE COVER ........2-11
TABLE 2-4. SUMMARY OF PROCESS PAD DRAINAGE WATER QUALITY .2-16
TABLE 3-1. SUMMARY OF KVPB-6 (MULESHOE BRANCH LITTLE DOG
CREEK) WATER QUALITY ..............................................................3-4
TABLE 3-2. SUMMARY OF KVPB-2 BARNES-KING GULCH WATER
QUALITY .............................................................................................3-5
TABLE 3-3. SUMMARY OF PUMPBACK TMW-26 (MASON CANYON)
WATER QUALITY ..............................................................................3-7
C:\Users\Jim\Documents\Kendall\Reclamation\2012 Kendall Closure Plan\Final Kendall Mine Closure Mgmt Plan.Docx\JIM VOLBERDING
P.O. BOX 501
LEWISTOWN, MT 59457\7/26/12\065
v 7/26/12\11:53 AM
TABLE 3-4. SUMMARY OF PUMPBACK KVPB-5 (SOUTH FORK LAST
CHANCE CREEK) WATER QUALITY .............................................3-8
TABLE 4-1. PREDICTED WATER TREATMENT PLANT INFLUENT
CONCENTRATIONS ...........................................................................4-15
TABLE 5-1. BIOLOGICAL PASSIVE TREATMENT STUDIES...........................5-2
TABLE 6-1. MULTIMEDIA FILTER COMPOSITION ..........................................6-4
TABLE 6-2. SPENT ZEOLITE TOTAL METALS AND LEACH TEST
RESULTS ..............................................................................................6-7
TABLE 6-3. ESTIMATED ANNUAL ZEOLITE REQUIREMENTS .....................6-8
LIST OF FIGURES
FIGURE 1-1. LOCATION MAP, KENDALL MINE .................................................1-2
FIGURE 2-1. ANNUAL PRECIPITATION 1993 - 2010 ...........................................2-5
FIGURE 2-2. AVERAGE MONTHLY PRECIPITATION ........................................2-6
FIGURE 2-3. LEACH PAD DRAINAGE FLOW 2000 THROUGH 2010 ................2-7
FIGURE 2-4. PROCESS PAD DRAINAGE VOLUME AS PERCENT OF
PRECIPITATION .................................................................................2-8
FIGURE 2-5. HELP MODEL RESULTS FOR MODIFIED WATER BALANCE
COVER (VOLUME/YEAR) .................................................................2-12
FIGURE 2-6. HELP MODEL RESULTS FOR MODIFIED WATER BALANCE
COVER – PERCENT OF PRECIPITATION .......................................2-13
FIGURE 2-7. HELP MODEL RESULTS FOR MODIFIED WATER BALANCE
COVER – PAD DRAINAGE (GPM) ...................................................2-14
FIGURE 3-1. AVERAGE WEEKLY PUMP BACK FLOWS 1999 – 2010 ..............3-2
FIGURE 4-1. FLOW AND WATER QUALITY COMPONENTS
OF CONCEPTUAL MODEL ...............................................................4-2
FIGURE 4-2. COMPUTATIONAL APPROACH TO MIXING MODEL .................4-4
FIGURE 4-3. PUMPBACK SYSTEM FLOW SCENARIOS IN MIXING MODEL 4-9
C:\Users\Jim\Documents\Kendall\Reclamation\2012 Kendall Closure Plan\Final Kendall Mine Closure Mgmt Plan.Docx\JIM VOLBERDING
P.O. BOX 501
LEWISTOWN, MT 59457\7/26/12\065
vi 7/26/12\11:53 AM
FIGURE 4-4. PAD DRAINAGE FLOW SCENARIOS IN MIXING MODEL .........4-10
FIGURE 4-5. PREDICTED NITRATE CONCENTRATION OF STORAGE
POND INFLOW ...................................................................................4-12
FIGURE 4-6. PREDICTED NITRATE + NITRITE CONCENTRATION IN
STORAGE POND AND POND OUTFLOW ......................................4-14
FIGURE 6-1. WATER TREATMENT SYSTEM SCHEMATIC ...............................6-2
LIST OF APPENDICES
APPENDIX A HELP MODEL
APPENDIX B WATER QUALITY STATISTICAL SUMMARIES
APPENDIX C WATER QUALITY GRAPHS AND TREND ANALYSIS
APPENDIX D PREDICTED WEEKLY POND OUTFLOW CONCENTRATIONS
APPENDIX E STEELHEAD CLINOPTILOLITE ZEOLITE PILOT TEST
APPENDIX F ST. CLOUD CLINOPTILOLITE ZEOLITE PILOT TEST
LIST OF EXHIBITS
EXHIBIT 1 MINE FACILITIES AND RECLAMATION STATUS
EXHIBIT 2 WATER MANAGEMENT SYSTEM

C:\Users\Jim\Documents\Kendall\Reclamation\2012 Kendall Closure Plan\Final Kendall Mine Closure Mgmt Plan.Docx\JIM VOLBERDING
P.O. BOX 501
LEWISTOWN, MT 59457\7/26/12\065
1-1 7/26/12\11:53 AM
CR KENDALL MINE
AMENDED CLOSURE PLAN
WATER MANAGEMENT
1.0 INTRODUCTION
On April 30, 2012, CR Kendall Corporation (CR Kendall) and the Montana Department of
Environmental Quality (MDEQ) entered into an Agreement under which CR Kendall would
submit a Request for Amendment to Mine Operating Permit #00122 and defining the terms
under which MDEQ would conduct an Environmental Analysis. As part of the agreement
CR Kendall agreed to submit a revised final reclamation plan to address the remaining
reclamation items at the site, namely final capping and reseeding of the former process pads,
final design and installation of water treatment facilities, and long-term reclamation
monitoring and maintenance. Capping of the process pads is discussed in detail in CR
Kendall’s Application for Minor Permit Amendment #11-001 which was approved by
MDEQ in October 2011 and is discussed in detail herein. This document describes the
proposed Closure Water Management plan which includes water treatment, discussion of
facilities to be retained, and a discussion of long-term maintenance and monitoring of the
system.
The Kendall Mine is located in the North Moccasin Mountains in Fergus County, Montana,
approximately 8 miles west of Hilger, Montana and 25 miles north of Lewistown, Montana
(Figure 1-1).
All of the components of this Closure Water Management plan (watershed flow
augmentation, groundwater capture, zeolite water treatment, discharge of treated water to the
Kendall Pit) have been employed at the Kendall Mine since approximately 1998 and have
been proven to be effective under a variety of conditions. A number of alternative water
management methods, in particular water treatment options, have also been evaluated since
C:\Users\Jim\Documents\Kendall\Reclamation\2012 Kendall Closure Plan\Final Kendall Mine Closure Mgmt Plan.Docx\JIM VOLBERDING
P.O. BOX 501
LEWISTOWN, MT 59457\7/26/12\065
1-2 7/26/12\11:53 AM
FIGURE 1-1. LOCATION MAP, KENDALL MINE

C:\Users\Jim\Documents\Kendall\Reclamation\2012 Kendall Closure Plan\Final Kendall Mine Closure Mgmt Plan.Docx\JIM VOLBERDING
P.O. BOX 501
LEWISTOWN, MT 59457\7/26/12\065
1-3 7/26/12\11:53 AM
1996, but none were found to perform as well or as reliably as the currently operating and
proposed system.
1.1 PURPOSE AND SCOPE
The purpose of this Final Closure Water Management Plan is to modify the existing
reclamation plan to allow for long-term management of water from spent ore process pads
and waste rock repositories including:
1. Capture and temporary storage of process pad and waste rock drainage;
2. Long-term treatment of process pad and waste rock drainage by zeolites to remove
thallium;
3. Disposal of spent zeolites in Pond 7;
4. Discharge of treated water to groundwater in the Kendall pit;
5. Maintenance of ponds, buildings, pipelines and other infrastructure needed to support
the water management/treatment system;
6. Monitoring and mitigation plans for water management facilities; and
7. Augmentation of stream flows to supply down-gradient water users.
Although the final capping of the process pads is part of the approved reclamation plan and is
not modified by this Closure Water Management Plan, performance of the pad cover system
is an important component of the water management system and thus is described in this
plan. Similarly, the watershed flow augmentation system is approved/required by an existing
Administrative Order and is not modified by this plan but is described as part of the overall
long-term water management plan.
1.2 SUMMARY OF MINE OPERATIONAL HISTORY
The Kendall Mine area is an historic mining area that has been mined intermittently since
approximately 1880, initially with placer operations and later with hard rock mining and
cyanide mills from approximately 1900 to 1941. The current CR Kendall Mine is an open
pit/heap process gold mine permitted and operated under Hard Rock Mining Permit #00122.

C:\Users\Jim\Documents\Kendall\Reclamation\2012 Kendall Closure Plan\Final Kendall Mine Closure Mgmt Plan.Docx\JIM VOLBERDING
P.O. BOX 501
LEWISTOWN, MT 59457\7/26/12\065
1-4 7/26/12\11:53 AM
Modern cyanide heap process operations were initiated by Triad Resources in 1981 and
continued by Greyhall Resources through 1986. Canyon Resources Corporation voluntarily
took over the management of the site to prevent uncontrolled discharges of cyanide process
solution during the bankruptcy of Greyhall Resources in 1987. Canyon Resources
Corporation formed a joint venture with Addwest Gold Corporation called Kendall Venture
and resumed mining in 1988. In 1990, Canyon Resources Corporation took over sole
management of the property through its subsidiary CR Kendall Corporation (CR Kendall).
Mining ceased in February 1995. Gold recovery by CR Kendall continued through the fall of
1997.
1.3 SUMMARY OF MINE RECLAMATION HISTORY
The reclamation status of facilities and land areas at the Kendall Mine is shown on Exhibit 1.
With the exception of process pads 3 and 4 and facilities that will be retained for use in the
water management system, all major disturbed areas at Kendall have been reclaimed.
Montana Department of Environmental Quality (MDEQ) approval for reclamation of process
pads 3 and 4, including the proposed pad capping system, has been granted by MDEQ
(Revision #11-001 to Permit #00122), but the cap is only partially installed. The process pad
capping system is scheduled to be completed during the 2012 field season. CR Kendall has
posted additional bond to cover the eventuality that the proposed pad cover system does not
meet reclamation objectives and must be removed or modified.
The following mine facilities are fully reclaimed and no further reclamation activities other
than monitoring and maintenance are proposed:
1. Horseshoe Pit and Horseshoe Waste Repository;
2. Muleshoe Pit, North Muleshoe Pit and Muleshoe Waste Repository;
3. Barnes-King Pit;
4. Haul Road Pit; and
5. Kendall Pit and Kendall Waste Repository.

C:\Users\Jim\Documents\Kendall\Reclamation\2012 Kendall Closure Plan\Final Kendall Mine Closure Mgmt Plan.Docx\JIM VOLBERDING
P.O. BOX 501
LEWISTOWN, MT 59457\7/26/12\065
1-5 7/26/12\11:53 AM

C:\Users\Jim\Documents\Kendall\Reclamation\2012 Kendall Closure Plan\Final Kendall Mine Closure Mgmt Plan.Docx\JIM VOLBERDING
P.O. BOX 501
LEWISTOWN, MT 59457\7/26/12\065
1-6 7/26/12\11:53 AM
The following mine facilities are components of the long-term water management system and
will be retained in an operational state:
1. Groundwater capture/pump back facilities (wells, pumps and piping);
2. Ponds 2B, 3B, 7 and 8;
3. Storm water control structures;
4. Water treatment and maintenance facilities;
5. Support facilities (roads, power distribution, pipelines, etc.); and
6. Land application area for contingency water treatment and discharge.
1.4 SUMMARY OF PROPOSED FINAL WATER MANAGEMENT PLAN
The proposed water management plan will ensure public safety and protect water resources
by maintaining flow to downstream water users, minimizing contact of water with spent ore
on the process pads, capturing and treating mine water and groundwater that does not meet
groundwater standards and returning the treated water to the groundwater system. Since
concentrations of thallium, cyanide, nitrate and other parameters in mine water are
decreasing (improving), water treatment is not expected to be needed beyond approximately
10 to 40 years. Water treatment will cease once water quality standards and or background
levels are met. Treatment in perpetuity is not proposed. The location of water management
plan components are shown on Exhibit 2.
1.4.1 Water Management Goals
The overall goal of the water management plan is to ensure public safety and protect water
resources in accordance with the Metal Mine Reclamation Act:
“(10) The reclamation plan must provide sufficient measures to ensure public safety
and to prevent the pollution of air or water and the degradation of adjacent lands.
(11) A reclamation plan must be approved by the department if it adequately provides
for the accomplishment of the requirements and standards set forth in this section.
(12) The reclamation plan must provide for permanent landscaping and contouring to
minimize the amount of precipitation that infiltrates into disturbed areas that are to be

C:\Users\Jim\Documents\Kendall\Reclamation\2012 Kendall Closure Plan\Final Kendall Mine Closure Mgmt Plan.Docx\JIM VOLBERDING
P.O. BOX 501
LEWISTOWN, MT 59457\7/26/12\065
1-7 7/26/12\11:53 AM
graded, covered, or vegetated, including but not limited to tailings impoundments and
waste rock repositories. The plan must also provide measures to prevent
objectionable post-mining groundwater discharges.” (MCA 82-4-336)
A supplemental goal is to attain conditions such that no active water treatment is required.
Since concentrations of thallium, cyanide, nitrate and other parameters in mine water are
decreasing (improving), water treatment is not expected to be needed beyond approximately
10 to 40 years.
1.4.2 Flow Augmentation
Kendall augments surface water flows in the Little Dog Creek and South Fork of Last
Chance Creek drainages pursuant to an Administrative Order (FID 151) which was issued in
May of 2000. Kendall must deliver water to these drainages from April 15th to August 30th,
and the amount of water must equal or exceed the entire amount of water collected and
pumped out of the drainages the previous year. Typically, Kendall greatly exceeds the
amount of water required to be augmented in both drainages, averaging 162% of the required
amount in Little Dog Creek and 123% of the required amount in South Fork Last Chance
Creek. Kendall also typically delivers water to these drainages for a greater time period than
the April to August time frame.
The sources of the augmentation water are as follows:
Little Dog Creek
o Spring water from the Little Dog Creek Spring above the mine site.
o Groundwater from Water Wells 6 and/or 7.
South Fork Last Chance Creek
o Spring water from the Mason Canyon Spring above the mine site.
o Ground water from Water Well 6.
Spring water is the primary source of augmentation water to both drainages. Ground water
from wells is only used to make up the differential should the springs not produce enough

C:\Users\Jim\Documents\Kendall\Reclamation\2012 Kendall Closure Plan\Final Kendall Mine Closure Mgmt Plan.Docx\JIM VOLBERDING
P.O. BOX 501
LEWISTOWN, MT 59457\7/26/12\065
1-8 7/26/12\11:53 AM
water to meet required volumes. Kendall maintains totalizing flow meters on all sources of
augmentation water, and flows and volumes are reported monthly to MDEQ, and yearly to
the DNRC.
1.4.3 Process Pad Drainage
Process pads 3 and 4 are currently in a partially capped state. MDEQ-approved Revision
#11-001 to Permit #00122 provides for placement of 17 inches of topsoil and lining of
drainage ditches to minimize infiltration and pad drainage and to provide effective re-
vegetation. The proposed final cover will consist of a subsoil/bentonite-amended subsoil
basal layer (currently in place) with topsoil cap and geosynthetic-lined drainage ditches that
will reduce long-term infiltration and drainage from the process pads to an estimated annual
average of less than five gallons per minute (gpm).
Under the proposed Closure Water Management Plan, drainage from the process pads will
continue to flow to the existing Ponds 7 and 8 for temporary storage prior to pumping to a
central water treatment system at the former processing plant. At the treatment facility, the
water will be temporarily stored and then treated to remove thallium via zeolite adsorption.
During storage and treatment, pad drainage will be co-mingled with groundwater and waste
rock drainage from the waste rock groundwater capture systems. Treated mine water will
meet all groundwater quality standards and will be discharged to groundwater via the
Kendall Pit. Spent zeolites from the water treatment system will be stored in Pond 7.
1.4.4 Groundwater Capture Systems
Groundwater capture systems have been used to control seepage from the waste rock
repositories, pads and historic tailings since 1998. Operation of the existing capture systems
will continue for long-term water management. These systems will capture alluvial
groundwater in the South Fork Last Chance Creek, Mason Canyon (Process Valley), Barnes-
King Gulch, and Little Dog Creek drainages via groundwater capture wells. Captured
groundwater will then be pumped to storage ponds and then to the water treatment site for
treatment to remove thallium via zeolites. During storage and treatment, captured

C:\Users\Jim\Documents\Kendall\Reclamation\2012 Kendall Closure Plan\Final Kendall Mine Closure Mgmt Plan.Docx\JIM VOLBERDING
P.O. BOX 501
LEWISTOWN, MT 59457\7/26/12\065
1-9 7/26/12\11:53 AM
groundwater will be co-mingled with process pad drainage. Treated mine water will meet all
groundwater quality standards and will be discharged to groundwater via the Kendall Pit.
1.4.5 Water Quality Parameters of Concern
The primary parameter of concern in mine water (groundwater capture/pumpback system and
process pad drainage flows) is thallium. Thallium concentrations routinely exceed applicable
water quality standards in all mine water sources, and therefore thallium concentrations must
be reduced by zeolite water treatment prior to release of mine water to groundwater.
Cyanide, nitrate, antimony, arsenic, and selenium are secondary parameters of concern.
Concentrations of these secondary parameters of concern may exceed water quality standards
in one or more mine water sources at some times. Management of water storage to achieve a
thorough blending of mine waters is required to reduce the concentrations of these
parameters to better than applicable standards prior to release of mine water to groundwater.
Other trace metals (e.g., cadmium, chromium, copper, lead, silver, strontium, uranium, zinc)
do not routinely occur in mine water at concentrations of environmental concern. Thallium,
cyanide, nitrate, antimony, arsenic, and selenium are therefore the primary focus of this water
management plan.
1.4.6 Water Storage, Treatment and Discharge
All process pad drainage and captured groundwater is pumped through a series of storage
ponds prior to treatment and discharge. Water from all sources initially is pumped to Pond 7
(5.47 Mgal) where initial mixing and primary storage of mine water occurs. Pond 7 is
connected via overflow line to Pond 8 (13.3 Mgal), which is used for storage during high
inflow periods of the year. Water in Pond 7 is pumped to Ponds 2B and 3B prior to treatment
at the zeolite treatment system located at the existing process plant/mine office building.
The proposed closure water treatment system is a slightly modified version of the zeolite
adsorption system that Kendall has used to effectively treat mine water for removal of
thallium since 1998. The system has been proven to be highly effective and reliably removes
thallium to levels that are lower than local background concentrations and lower than the MT

C:\Users\Jim\Documents\Kendall\Reclamation\2012 Kendall Closure Plan\Final Kendall Mine Closure Mgmt Plan.Docx\JIM VOLBERDING
P.O. BOX 501
LEWISTOWN, MT 59457\7/26/12\065
1-10 7/26/12\11:53 AM
groundwater standard (2 ppb). The existing treatment system will be modified slightly to 1)
provide for the use of zeolites with a higher adsorption capacity; and 2) provide pre-treatment
filtration to remove suspended solids prior to zeolite treatment. Water treatment wastes
(spent zeolites and filtered solids (sediment and algae)) will be non-hazardous and will be
disposed in Pond 7. Since concentrations of thallium, cyanide, nitrate and other parameters
in mine water are decreasing (improving), water treatment is not expected to be needed
beyond approximately 10 to 40 years. Water treatment will cease once water quality
standards and/or background levels are met. Treatment in perpetuity is not proposed.
Treated water will be discharged to groundwater at the Kendall Pit using existing pipelines.
Treated water will be tested monthly to confirm treatment effectiveness.
The mine has a permitted land application area that has been used effectively for treatment
and discharge of mine water. The land application area is fully reclaimed and revegetated.
Although use of the land application is not anticipated, it will be retained as a contingency
component of the water management system. If unforeseen conditions arise, the land
application area could be used as a supplemental water treatment method for removal of
nitrogen compounds (nitrate, nitrite, ammonia, cyanide) by vegetative uptake.
1.4.7 Stormwater
No changes to the approved stormwater management plan are proposed. Stormwater
management will continue in accordance with the existing Stormwater General Permit
(Permit #300026) and approved Stormwater Pollution Prevention Plan (SWPPP).
C:\Users\Jim\Documents\Kendall\Reclamation\2012 Kendall Closure Plan\Final Kendall Mine Closure Mgmt Plan.Docx\JIM VOLBERDING
P.O. BOX 501
LEWISTOWN, MT 59457\7/26/12\065
2-1 7/26/12\11:53 AM
2.0 PROCESS PADS CAPPING AND FINAL RECLAMATION
As described above, the overall goal of Kendall Mine reclamation is to achieve comparable
stability and utility as the surrounding environment in terms of vegetative cover, soil
stability, water and safety. An additional goal for the process pads is to minimize drainage
from the pads in order to reduce water treatment needs. The planned and recently approved
pad cap (modified water balance cover) will reduce pad drainage flows to rates that can be
effectively and efficiently handled by the zeolite water treatment system.
2.1 DESCRIPTION OF COVER ALTERNATIVES
The planned pad cap was selected after evaluation of many capping alternatives. The
following section summarizes the alternatives evaluated and describes why the currently
planned cap is believed to be the optimal system for pad capping at the Kendall Mine.
2.1.1 Barrier Covers
Barrier covers were considered by Kendall but are not proposed due to concerns about the
geotechnical stability of the covers on the 3:1 slopes of the pads, poorer vegetation growth
compared to soil/water balance caps, cost, and insignificant reduction in pad drainage flow
compared to water balance covers. MDEQ/CDM (2004) also considered a variety of barrier
covers that incorporate low-permeability synthetic liners (e.g., PVC), clay layers, and
geocomposite liners (GCLs, a combination of synthetic materials with natural clay
materials). The covers considered by MDEQ consisted of:
16 to 24 inches of topsoil;
18 inches of subsoil;
A gravel or geosynthetic drain layer; and
A clay, synthetic or GCL low-permeability layer.
Barrier covers were evaluated for effectiveness of excluding water from the pad (CDM,
2004) as part of the EIS process, but a detailed evaluation of technical issues such as slope

C:\Users\Jim\Documents\Kendall\Reclamation\2012 Kendall Closure Plan\Final Kendall Mine Closure Mgmt Plan.Docx\JIM VOLBERDING
P.O. BOX 501
LEWISTOWN, MT 59457\7/26/12\065
2-2 7/26/12\11:53 AM
stability was not conducted. The EIS evaluation predicted that at best, barrier covers could
reduce pad drainage flows by a few gallons per minute (gpm). Since the currently operating
and proposed final water treatment system is designed to handle up to 100 gpm, the potential
flow reduction is not significant, and the disadvantages of barrier covers do not justify the
potential reduction in flows of a few gpm.
2.1.2 Reduced Permeability Layer Cover
The originally approved and permitted capping plan was to construct a “reduced permeability
layer” (RPL) cap consisting of (from top down):
10- to 14-inch topsoil layer;
18-inch subsoil layer;
12 inches of coarse rock drainage layer (limestone); and
12 inches of on-site clayey materials placed on top of the processed ore.
Limitations and disadvantages of the RPL cap were:
1. The materials available to construct the coarse rock drainage layer appear to leach
thallium (CDM, 2004; Womack and Associates, 2005) and it is likely that water
draining from this layer would need to be treated. Therefore, the RPL cap would not
function to reduce the amount of water requiring treatment.
2. The on-site clayey materials (mined from mudstones and siltstones of the Kibbey
Formation) do not appear to contain as much clay and are not as low in permeability
as originally estimated (CDM, 2004). Therefore, the cap would not function to
reduce infiltration and drainage from the pad to the extent originally estimated.
2.1.3 Water Balance Soil Cover
The second approved and permitted cover system was a “water balance soil cover.” This
cover system, proposed by Kendall in 1999 and approved by MDEQ in 2000, consisted of
the following layers:
C:\Users\Jim\Documents\Kendall\Reclamation\2012 Kendall Closure Plan\Final Kendall Mine Closure Mgmt Plan.Docx\JIM VOLBERDING
P.O. BOX 501
LEWISTOWN, MT 59457\7/26/12\065
2-3 7/26/12\11:53 AM
17 inches of topsoil; over
19 inches of subsoil.
The water balance cover was evaluated by MDEQ in 2001 in a draft Environmental
Assessment (EA) (MDEQ, 2001). The Draft EA concluded that the water balance cover
would provide a suitable growth media for vegetation and the water balance cover was
selected by MDEQ as the preferred alternative in the Draft EA. However, the Final EA
concluded that an EIS was warranted based on public comment. The water balance cover
was further evaluated for MDEQ in 2004 (CDM, 2004) as part of the EIS process. In the
summer of 2004, Kendall initiated process pad reclamation beginning with re-grading the
process pads to their final reclamation slopes; lining the area between process pads 3 and 4;
and installing the final, approved reclamation cap over this area.
2.1.4 Modified Water Balance Cover – Proposed Final Pad Cap
Kendall’s currently approved cover is a modified water balance cover composed of the
following:
17 inches of topsoil; over
6 inches of subsoil basal layer material amended with 5 to 8 percent sodium
bentonite; over
12 inches of subsoil basal layer material.
This cover is similar to the previously proposed and evaluated water balance cover with the
exception of sodium bentonite amendment of the upper part of the basal layer and a slight
reduction in basal layer thickness from 19 to 18 inches. Addition of bentonite clay to the
basal layer reduces the subsoil permeability and enhances evapotranspiration, thus decreasing
infiltration and subsequent drainage from the pad. As described in Section 2.2 below, the
addition of sodium bentonite to the basal layer more than compensates for the slight
reduction in basal layer thickness.

C:\Users\Jim\Documents\Kendall\Reclamation\2012 Kendall Closure Plan\Final Kendall Mine Closure Mgmt Plan.Docx\JIM VOLBERDING
P.O. BOX 501
LEWISTOWN, MT 59457\7/26/12\065
2-4 7/26/12\11:53 AM
In November of 2005, Kendall submitted a Request for Minor Permit Revision, which
changed the nature of the capping system’s basal layer from 19 inches of subsoil to 6 inches
of minus 1.25-inch screened subsoil amended with sodium bentonite at 5 to 8 percent by
volume over 12 inches of minus 6-inch screened subsoil. MDEQ approved this change in
May of 2006 as Minor Permit Revision #05-001 and Kendall placed the basal layer on
process pads 3 and 4 during the 2006 and 2008 field seasons. In July 2011, Kendall
submitted a Request for Minor Permit Revision to allow placement of the 17-inch topsoil
layer on top of the previously approved and placed 18-inch modified subsoil basal layer.
This Permit Revision was approved by MDEQ in October 2011. The topsoil layer is
scheduled to be constructed during the 2012 field season.
2.2 PROPOSED FINAL PAD CAP CONSTRUCTION
Construction of the modified water balance cover pad capping system is described in the
Request for Permit Revision #11-001 (CR Kendall, 2011) and is summarized as follows:
The soil cover cap will be constructed using materials that have been previously
stockpiled at various locations on site.
Prior to placement of the topsoil layer, any erosion-caused rills or gullies in the
subsoil layer will be repaired. Straw wattles which were placed on the basal layer to
reduce erosion, will be removed and any basal layer material collected behind them
will be spread to restore positive drainage.
All slopes to receive topsoil will have a roughened surface; if necessary, the surface
will be scarified parallel to the slope contour taking care not to penetrate the
bentonite-enhanced layer. After the topsoil has been spread, large clods and hard
lumps will be broken up before seeding. Documentation of soil placement depths
will be conducted on a nominal 100-foot by 100-foot grid over the surface and slopes
of the process pads.
The contour drainages, which have already been lined with the 18-inch basal layer as
described above, will be lined with a geomembrane liner system consisting of a 30-
mil LLDPE (linear low density polyethylene) membrane underlain by 16-ounce non-

C:\Users\Jim\Documents\Kendall\Reclamation\2012 Kendall Closure Plan\Final Kendall Mine Closure Mgmt Plan.Docx\JIM VOLBERDING
P.O. BOX 501
LEWISTOWN, MT 59457\7/26/12\065
2-5 7/26/12\11:53 AM
woven geotextile. The contour drainages will be armored with geotechnically and
geochemically appropriate 12-inch riprap.

C:\Users\Jim\Documents\Kendall\Reclamation\2012 Kendall Closure Plan\Final Kendall Mine Closure Mgmt Plan.Docx\JIM VOLBERDING
P.O. BOX 501
LEWISTOWN, MT 59457\7/26/12\065
2-6 7/26/12\11:53 AM
PROPOSED FINAL PAD CAP HYDRAULIC PERFORMANCE
Estimates of the performance of the proposed final cap in reducing pad drainage flows can be
derived in part from empirical evidence of flow reductions prior to, and after, placement of
the partial cap and from simulation of pad drainage with numeric hydrologic models.
2.2.1 Observed Precipitation
Precipitation and other climate data have been collected at the mine site since 1993. Total
annual precipitation and average monthly precipitation for the period of record are shown in
Figures 2-1 and 2-2. Average annual precipitation for the period of 1993 to 2010 is 24.55
inches.
FIGURE 2-1. ANNUAL PRECIPITATION 1993 - 2010
C:\Users\Jim\Documents\Kendall\Reclamation\2012 Kendall Closure Plan\Final Kendall Mine Closure Mgmt Plan.Docx\JIM VOLBERDING
P.O. BOX 501
LEWISTOWN, MT 59457\7/26/12\065
2-7 7/26/12\11:53 AM
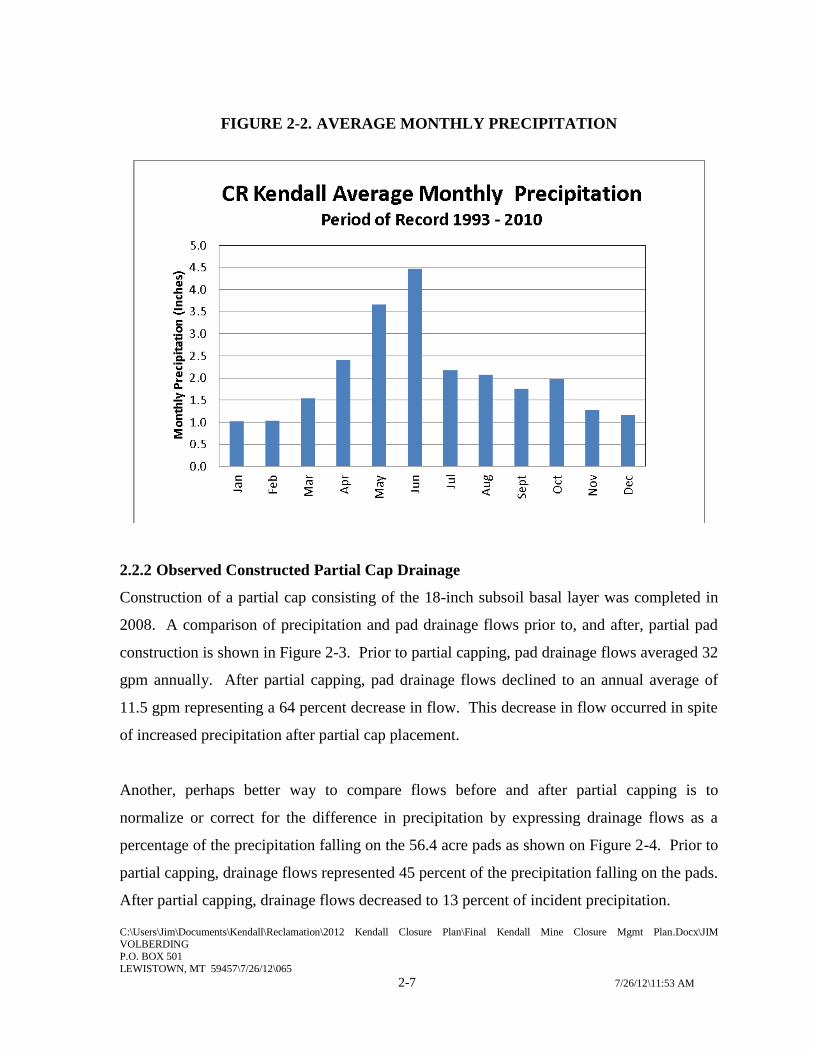
FIGURE 2-2. AVERAGE MONTHLY PRECIPITATION
2.2.2 Observed Constructed Partial Cap Drainage
Construction of a partial cap consisting of the 18-inch subsoil basal layer was completed in
2008. A comparison of precipitation and pad drainage flows prior to, and after, partial pad
construction is shown in Figure 2-3. Prior to partial capping, pad drainage flows averaged 32
gpm annually. After partial capping, pad drainage flows declined to an annual average of
11.5 gpm representing a 64 percent decrease in flow. This decrease in flow occurred in spite
of increased precipitation after partial cap placement.
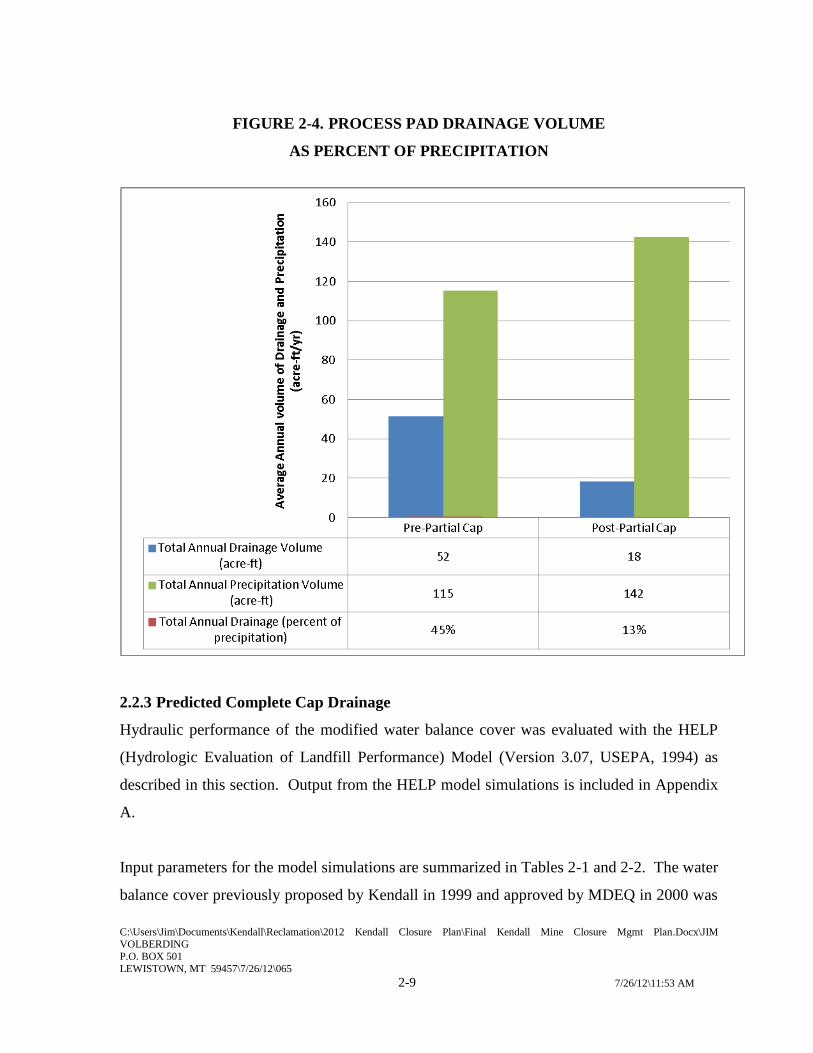
Another, perhaps better way to compare flows before and after partial capping is to
normalize or correct for the difference in precipitation by expressing drainage flows as a
percentage of the precipitation falling on the 56.4 acre pads as shown on Figure 2-4. Prior to
partial capping, drainage flows represented 45 percent of the precipitation falling on the pads.
After partial capping, drainage flows decreased to 13 percent of incident precipitation.

C:\Users\Jim\Documents\Kendall\Reclamation\2012 Kendall Closure Plan\Final Kendall Mine Closure Mgmt Plan.Docx\JIM VOLBERDING
P.O. BOX 501
LEWISTOWN, MT 59457\7/26/12\065
2-8 7/26/12\11:53 AM
FIGURE 2-3. LEACH PAD DRAINAGE FLOW 2000 THROUGH 2010
CR Kendall Mine
Process Pad Drainage Flow 2000 through 2010
0
20
40
60
80
100
120
1 4 7 10 13 16 19 22 25 28 31 34 37 40 43 46 49 52
Week
Flo
w (
gp
m)
Pre-Partial Cap Average Flow 2000-2008 (Average Precipitation for Period = 24.5inches)
Post-Partial Cap Average Flow 2009-2010 (Average Precipitation for Period = 30.3inches)
C:\Users\Jim\Documents\Kendall\Reclamation\2012 Kendall Closure Plan\Final Kendall Mine Closure Mgmt Plan.Docx\JIM VOLBERDING
P.O. BOX 501
LEWISTOWN, MT 59457\7/26/12\065
2-9 7/26/12\11:53 AM
FIGURE 2-4. PROCESS PAD DRAINAGE VOLUME
AS PERCENT OF PRECIPITATION
2.2.3 Predicted Complete Cap Drainage
Hydraulic performance of the modified water balance cover was evaluated with the HELP
(Hydrologic Evaluation of Landfill Performance) Model (Version 3.07, USEPA, 1994) as
described in this section. Output from the HELP model simulations is included in Appendix
A.
Input parameters for the model simulations are summarized in Tables 2-1 and 2-2. The water
balance cover previously proposed by Kendall in 1999 and approved by MDEQ in 2000 was

C:\Users\Jim\Documents\Kendall\Reclamation\2012 Kendall Closure Plan\Final Kendall Mine Closure Mgmt Plan.Docx\JIM VOLBERDING
P.O. BOX 501
LEWISTOWN, MT 59457\7/26/12\065
2-10 7/26/12\11:53 AM
evaluated with the HELP Model by CDM (2004) as part of the MDEQ EIS process. For
modeling the final modified water balance cover, soil input parameters matched those used
by CDM (2004) with the following exceptions:
Subsoil thickness was reduced from 19 to 18 inches to match the final cap design.
Characteristics of the subsoil basal layer material were updated to reflect the material
that was actually placed on the pads. This material was characterized through test
pits, borings, and geotechnical and geochemical analysis by Womack and Associates
(2005).
The top 6 inches of the basal subsoil layer was assumed to contain 5 sodium percent
bentonite, therefore hydraulic conductivity (ksat) and other parameters of the soil were
adjusted to reflect the addition of sodium bentonite to the subsoil.
Model simulations were run for a 100-year period to allow attainment of steady-state
moisture conditions.
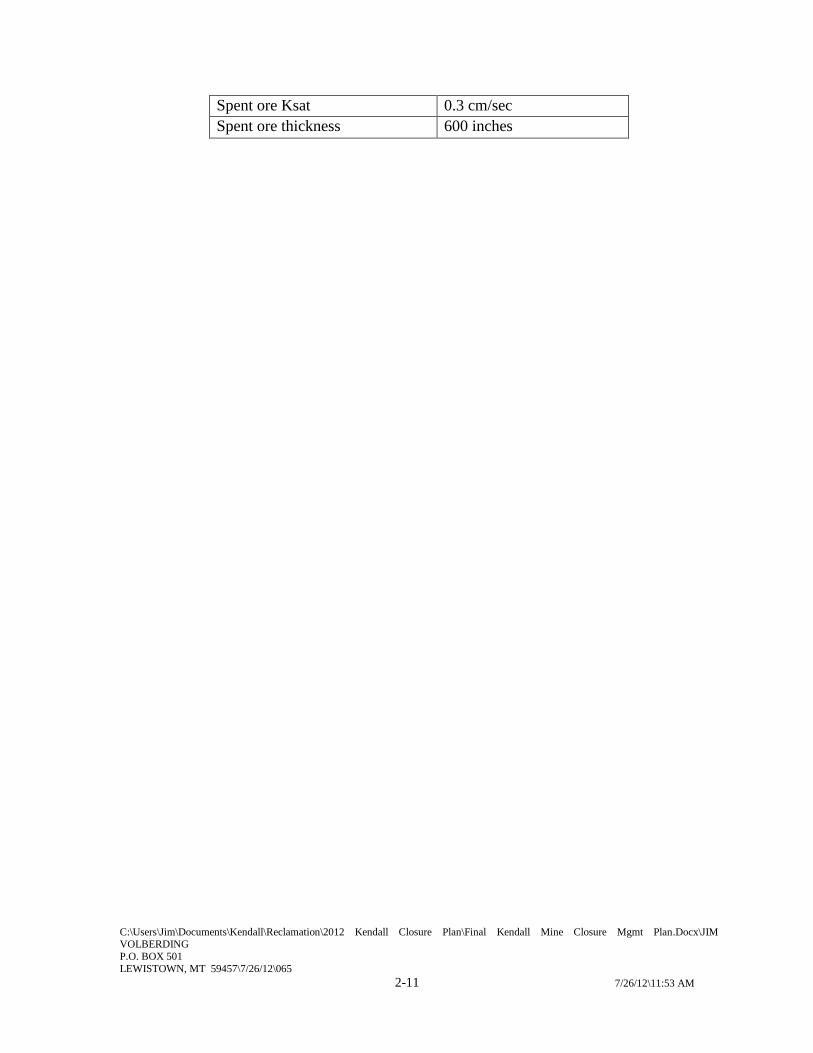
TABLE 2-1. HELP MODEL SOIL INPUT PARAMETERS
Parameter Input Input & Units
Topsoil porosity 0.4 (unitless)
Topsoil texture Loam
Topsoil field capacity 0.232 (unitless)
Topsoil wilting point 0.116 (unitless)
Topsoil Ksat 3.7 x 10⁻⁴ cm/sec
Topsoil thickness 17 inches
Subsoil porosity 0.4 (unitless)
Subsoil texture Sandy clay loam
Subsoil field capacity 0.34 (unitless)
Subsoil wilting point 0.24 (unitless)
Subsoil Ksat 1.14 x 10⁻⁴ cm/sec
Subsoil thickness 18 inches
5% Bentonite soil porosity 0.427 (unitless)
5% Bentonite soil ksat 7.0 x 10⁻⁷ cm/sec
5% Bentonite soil thickness 6 inches
Spent ore porosity 0.397 (unitless)
Spent ore field capacity .032 (unitless)
Spent ore wilting point .013 (unitless)
C:\Users\Jim\Documents\Kendall\Reclamation\2012 Kendall Closure Plan\Final Kendall Mine Closure Mgmt Plan.Docx\JIM VOLBERDING
P.O. BOX 501
LEWISTOWN, MT 59457\7/26/12\065
2-11 7/26/12\11:53 AM
Spent ore Ksat 0.3 cm/sec
Spent ore thickness 600 inches
C:\Users\Jim\Documents\Kendall\Reclamation\2012 Kendall Closure Plan\Final Kendall Mine Closure Mgmt Plan.Docx\JIM VOLBERDING
P.O. BOX 501
LEWISTOWN, MT 59457\7/26/12\065
2-12 7/26/12\11:53 AM
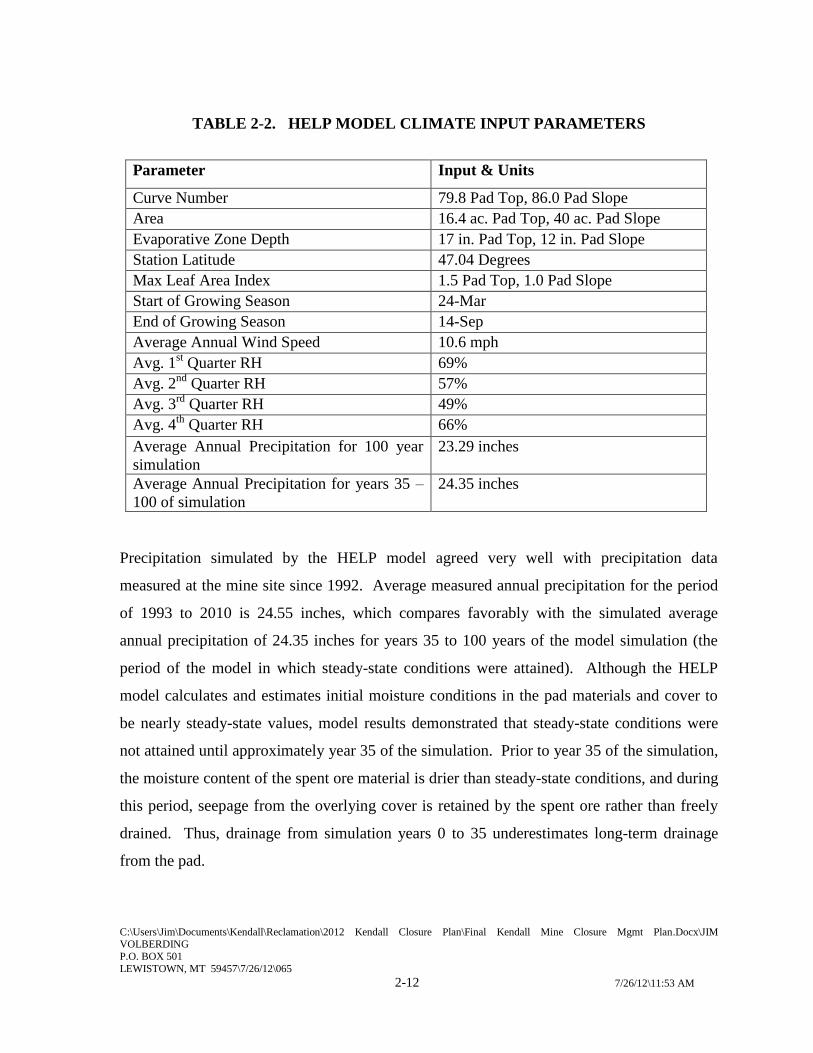
TABLE 2-2. HELP MODEL CLIMATE INPUT PARAMETERS
Parameter Input & Units
Curve Number 79.8 Pad Top, 86.0 Pad Slope
Area 16.4 ac. Pad Top, 40 ac. Pad Slope
Evaporative Zone Depth 17 in. Pad Top, 12 in. Pad Slope
Station Latitude 47.04 Degrees
Max Leaf Area Index 1.5 Pad Top, 1.0 Pad Slope
Start of Growing Season 24-Mar
End of Growing Season 14-Sep
Average Annual Wind Speed 10.6 mph
Avg. 1st Quarter RH 69%
Avg. 2nd
Quarter RH 57%
Avg. 3rd
Quarter RH 49%
Avg. 4th
Quarter RH 66%
Average Annual Precipitation for 100 year
simulation
23.29 inches
Average Annual Precipitation for years 35 –
100 of simulation
24.35 inches
Precipitation simulated by the HELP model agreed very well with precipitation data
measured at the mine site since 1992. Average measured annual precipitation for the period
of 1993 to 2010 is 24.55 inches, which compares favorably with the simulated average
annual precipitation of 24.35 inches for years 35 to 100 years of the model simulation (the
period of the model in which steady-state conditions were attained). Although the HELP
model calculates and estimates initial moisture conditions in the pad materials and cover to
be nearly steady-state values, model results demonstrated that steady-state conditions were
not attained until approximately year 35 of the simulation. Prior to year 35 of the simulation,
the moisture content of the spent ore material is drier than steady-state conditions, and during
this period, seepage from the overlying cover is retained by the spent ore rather than freely
drained. Thus, drainage from simulation years 0 to 35 underestimates long-term drainage
from the pad.
C:\Users\Jim\Documents\Kendall\Reclamation\2012 Kendall Closure Plan\Final Kendall Mine Closure Mgmt Plan.Docx\JIM VOLBERDING
P.O. BOX 501
LEWISTOWN, MT 59457\7/26/12\065
2-13 7/26/12\11:53 AM
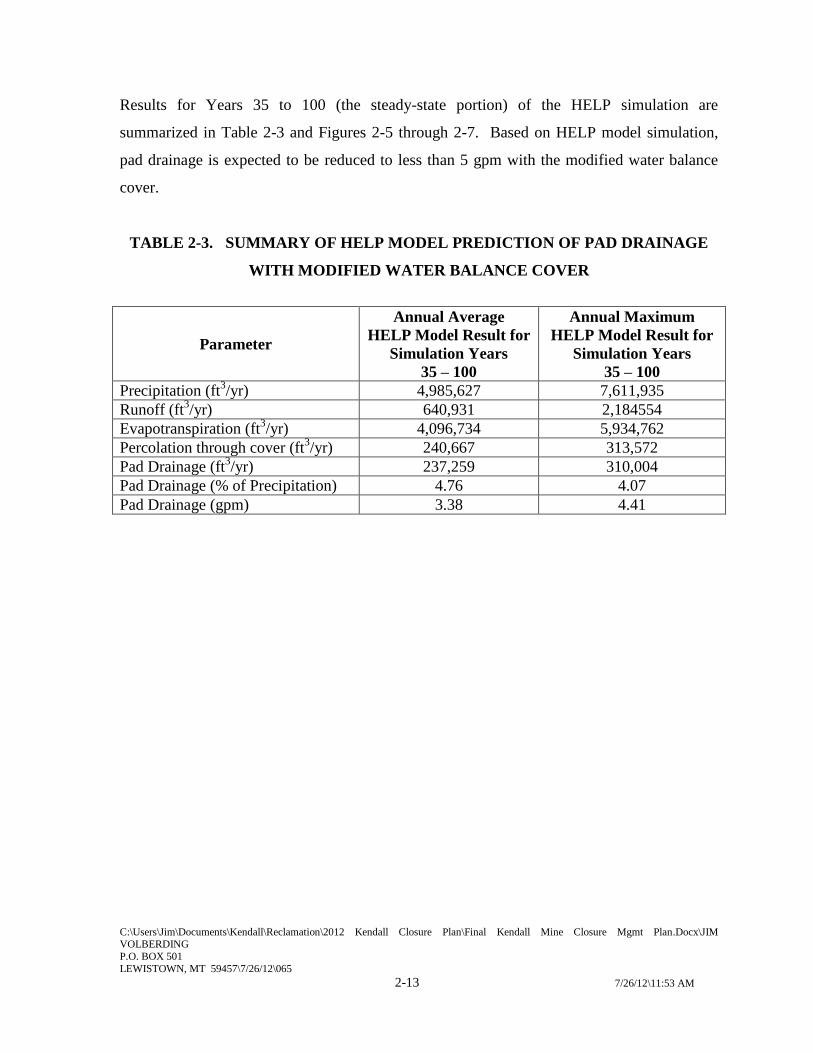
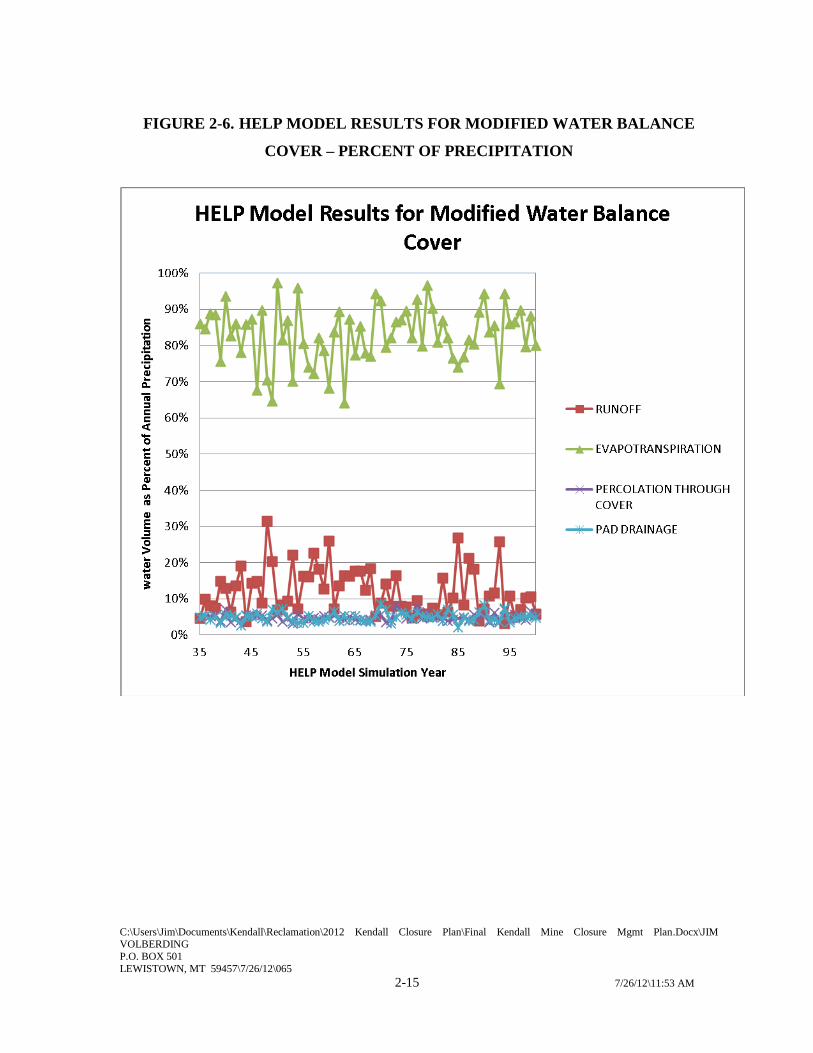
Results for Years 35 to 100 (the steady-state portion) of the HELP simulation are
summarized in Table 2-3 and Figures 2-5 through 2-7. Based on HELP model simulation,
pad drainage is expected to be reduced to less than 5 gpm with the modified water balance
cover.
TABLE 2-3. SUMMARY OF HELP MODEL PREDICTION OF PAD DRAINAGE
WITH MODIFIED WATER BALANCE COVER
Parameter
Annual Average
HELP Model Result for
Simulation Years
35 – 100
Annual Maximum
HELP Model Result for
Simulation Years
35 – 100
Precipitation (ft3/yr) 4,985,627 7,611,935
Runoff (ft3/yr) 640,931 2,184554
Evapotranspiration (ft3/yr) 4,096,734 5,934,762
Percolation through cover (ft3/yr) 240,667 313,572
Pad Drainage (ft3/yr) 237,259 310,004
Pad Drainage (% of Precipitation) 4.76 4.07
Pad Drainage (gpm) 3.38 4.41

C:\Users\Jim\Documents\Kendall\Reclamation\2012 Kendall Closure Plan\Final Kendall Mine Closure Mgmt Plan.Docx\JIM VOLBERDING
P.O. BOX 501
LEWISTOWN, MT 59457\7/26/12\065
2-14 7/26/12\11:53 AM
FIGURE 2-5. HELP MODEL RESULTS FOR MODIFIED
WATER BALANCE COVER (VOLUME/YEAR)
HELP Model Results for Modified Water Balance
Cover
100000
1000000
10000000
35 45 55 65 75 85 95
HELP Model Simulation Year
wa
ter V
olu
me
(cu
bic
feet
/ye
ar)
PRECIPITATION
RUNOFF
EVAPOTRANSPIRATION
PERCOLATION THROUGHCOVER
PAD DRAINAGE
C:\Users\Jim\Documents\Kendall\Reclamation\2012 Kendall Closure Plan\Final Kendall Mine Closure Mgmt Plan.Docx\JIM VOLBERDING
P.O. BOX 501
LEWISTOWN, MT 59457\7/26/12\065
2-15 7/26/12\11:53 AM
FIGURE 2-6. HELP MODEL RESULTS FOR MODIFIED WATER BALANCE
COVER – PERCENT OF PRECIPITATION

C:\Users\Jim\Documents\Kendall\Reclamation\2012 Kendall Closure Plan\Final Kendall Mine Closure Mgmt Plan.Docx\JIM VOLBERDING
P.O. BOX 501
LEWISTOWN, MT 59457\7/26/12\065
2-16 7/26/12\11:53 AM
FIGURE 2-7. HELP MODEL RESULTS FOR MODIFIED WATER BALANCE
COVER – PAD DRAINAGE (GPM)
2.3 PAD DRAINAGE WATER QUALITY
Application of process solutions to the process pad ceased in 1997 and gold recovery from
the pads ceased in fall 1997. Partial capping of the pads did not begin until summer 2006,
and thus natural precipitation was allowed to infiltrate and rinse the spent ore on the pads for
approximately nine years. Over this nine-year rinsing period, it is estimated (based on
average pad drainage over the period) that approximately 160 million gallons of rainwater
and snowmelt infiltrated and rinsed the spent ore on the pads.

C:\Users\Jim\Documents\Kendall\Reclamation\2012 Kendall Closure Plan\Final Kendall Mine Closure Mgmt Plan.Docx\JIM VOLBERDING
P.O. BOX 501
LEWISTOWN, MT 59457\7/26/12\065
2-17 7/26/12\11:53 AM
A statistical summary of all available water quality data for pad drainage is provided in
Appendix B. Graphs showing thallium, cyanide and other chemical parameter
concentrations in pad drainage over time and trend analysis estimates of future
concentrations are provided in Appendix C. Table 2-4 summarizes current concentrations
and trends for parameters of interest for pad drainage.
The cessation of cyanide leaching and rinsing of the spent ore with rain has resulted in a
steady improvement in pad drainage water quality over time. Total cyanide concentrations
decreased from nearly 300 mg/L in 1991 to less than 10 mg/L in 1997 when gold recovery
ceased. From 2009 through August 2011, total cyanide concentrations varied between
approximately 0.6 to 0.2 mg/L, equal to or slightly higher than the Montana groundwater
quality standard and federal drinking water standard (maximum contaminant limit or MCL)
of 0.2 mg/L. Based on projections of the observed cyanide trend (Appendix C) it is
estimated that average total cyanide concentrations should drop below the groundwater
quality standard within the next few years (based on linear projection) to a decade (based on
exponential projection). This extrapolation assumes that the observed trends, which have
occurred during a period of partial pad capping, will continue in the future after the pad cap
is completed.
The concentrations of other parameters of concern have also decreased as described in Table
2-4 and are expected to meet water quality standards (MDEQ-7 numeric criteria for
groundwater or background concentrations) within the next 5 to 40 years. The Montana
Water Quality Act (MCA 75-5-306) provides that it is not necessary to treat water to purer
than background concentrations. Background concentrations were estimated by MDEQ
(MDEQ, 1999) and Water Management Consultants (WMC, 2003) based on metal
concentrations in a variety of water, soil, rock, and historic mining waste materials in the
Mason Canyon area.

C:\Users\Jim\Documents\Kendall\Reclamation\2012 Kendall Closure Plan\Final Kendall Mine Closure Mgmt Plan.Docx\JIM VOLBERDING
P.O. BOX 501
LEWISTOWN, MT 59457\7/26/12\065
2-18 7/26/12\11:53 AM
Nitrate concentrations in pad drainage decreased from a peak of nearly 200 mg/L in 1998 to
an average of approximately 40 mg/L currently. Based on projections of the observed nitrate
trend it is estimated that average nitrate concentrations should drop below the groundwater

C:\Users\Jim\Documents\Kendall\Reclamation\2012 Kendall Closure Plan\Final Kendall Mine Closure Mgmt Plan.Docx\JIM VOLBERDING
P.O. BOX 501
LEWISTOWN, MT 59457\7/26/12\065
2-16 7/26/12\11:53 AM
TABLE 2-4. SUMMARY OF PROCESS PAD DRAINAGE WATER QUALITY
Period of
Record for
Average and
Maximum
Concentrations
Process Pad Drainage
Predicted Years to Meet
Water Quality Standards or
Background Concentrations * Water Quality Standards
Average
Concentration
(mg/L)
Maximum
Concentration
(mg/L)
Observed
Trend
(2005 -
2011)
Linear
Extrapolation
Exponential
or
Polynomial
Extrapolation
Groundwater
Quality
Standard in
MDEQ-7
(mg/L)
Estimated Background
Concentration in
Mason Canyon
Parameter
MDEQ
((1999)
(mg/L)
Water
Management
Consultants
(2003)
(mg/L)
Total
Cyanide 2011 0.321 0.51 Decreasing 5 or longer 5 or longer 0.2
Nitrate +
Nitrite 2011 49.93 61.4 Decreasing 5 or longer 20 or longer 10
Antimony 2005-2011 0.02 0.024 Steady 15 or longer 30 or longer 0.006
Arsenic 2010-2011 0.148 0.158 Decreasing 15 or longer 40 or longer 0.01 0.05 0.05
Selenium 2010-2011 0.06 0.078 Decreasing 5 or longer 5 or longer 0.05 0.01 0.05
Thallium 2010-2011 0.734 0.931 Decreasing 40 or longer 15 or longer 0.002 0.05 0.1
Notes:
* Predicted years assuming continuation of current trends.

C:\Users\Jim\Documents\Kendall\Reclamation\2012 Kendall Closure Plan\Final Kendall Mine Closure Mgmt Plan.Docx\JIM VOLBERDING
P.O. BOX 501
LEWISTOWN, MT 59457\7/26/12\065
2-17 7/26/12\11:53 AM
quality standard of 10 mg/L within the next five (based on linear projection) to twenty years
(based on exponential projection).
Antimony concentrations in pad drainage have decreased from approximately 0.033 mg/L in
1998 to less than 0.02 mg/L currently. Based on projections of the observed antimony trend
(Appendix C) it is estimated that average antimony concentration should drop below the
groundwater quality standard of 0.006 mg/L within the next fifteen (based on linear
projection) to thirty years (based on exponential projection).
Arsenic concentrations in pad drainage decreased from approximately 0.3 mg/L in 1998 to
approximately 0.15 mg/L currently. Based on projections of the observed arsenic trend
(Appendix C) it is estimated that average arsenic concentrations should drop below the
groundwater quality standard of 0.01 mg/L within the next fifteen (based on linear
projection) to forty years (based on exponential projection).
Selenium concentrations in pad drainage decreased from approximately 0.2 mg/L in 1998 to
approximately 0.08 mg/L currently. Based on projections of the observed selenium trend it is
estimated that average selenium concentrations should drop below the groundwater quality
standard of 0.05 mg/L within the next few years (based on linear and exponential
projections).
Thallium concentrations in pad drainage decreased from a peak of around 1 mg/L in 1998 to
an average of approximately 0.7 mg/L currently. Based on projections of the observed
thallium trend (Appendix C) it is estimated that average thallium concentration should drop
below the groundwater quality standard of 0.002 mg/L within the next fifteen (based on
polynomial projection) to forty years (based on exponential projection).

C:\Users\Jim\Documents\Kendall\Reclamation\2012 Kendall Closure Plan\Final Kendall Mine Closure Mgmt Plan.Docx\JIM VOLBERDING
P.O. BOX 501
LEWISTOWN, MT 59457\7/26/12\065
3-1 7/26/12\11:53 AM
3.0 GROUNDWATER CAPTURE SYSTEM FLOWS
AND WATER QUALITY
Flow rate varies between the individual pumpback systems and also varies with annual and
seasonal fluctuations in precipitation. In addition, several chemical parameters such as
nitrate and thallium exhibit long-term declining concentration trends. Flow rates and water
quality of each groundwater capture/pumpback system are described in this section. Current
and expected future water quality and flows to be treated by the water treatment plant (i.e.,
mixed or combined site-wide flows) are described in Section 4.0.
3.1 CAPTURE SYSTEM FLOWS
Flows captured by the groundwater capture systems are seasonally variable and individually
range from approximately 5 to 70 gallons per minute (gpm) (Figure 3-1). Cumulative flow
from all systems ranges from approximately 20 to 200 gpm. Peak flows occur in the period
from approximately April through July and coincide with, or somewhat lag behind, spring
snowmelt and the peak rainfall months of May and June (see Figure 2-2, Section 2.0).
3.2 CAPTURE SYSTEM WATER QUALITY
A statistical summary of water quality in the groundwater capture/pump back systems is
provided in Appendix B. Graphs showing thallium and other chemical parameter
concentrations over time and trend analysis estimates of future concentrations are provided in
Appendix C.
3.2.1 Muleshoe Branch of Little Dog Creek (KVPB-6 Pumpback System)
Portions of the Muleshoe Pit, Muleshoe Waste Repository and Horseshoe Waste Repository
are located in the Muleshoe Branch of Little Dog Creek. Shallow groundwater in the area is
captured by the KVPB-6 pumpback system, located at the toe of the Muleshoe repository.

C:\Users\Jim\Documents\Kendall\Reclamation\2012 Kendall Closure Plan\Final Kendall Mine Closure Mgmt Plan.Docx\JIM VOLBERDING
P.O. BOX 501
LEWISTOWN, MT 59457\7/26/12\065
3-2 7/26/12\11:53 AM
FIGURE 3-1. AVERAGE WEEKLY PUMP BACK FLOWS 1999 – 2010
CR Kendall Corporation
Average Weekly Pump Back Flows 1999-
2010
0
50
100
150
200
250
1 3 5 7 9 11 13 15 17 19 21 23 25 27 29 31 33 35 37 39 41 43 45 47 49 51
Calendar Week
We
ek
ly F
low
(g
pm
)
Total
North Mule Shoe KVPB-6
Barnes King KVPB-2
Mason Canyon TMW-26
South Fork KVPB-5

C:\Users\Jim\Documents\Kendall\Reclamation\2012 Kendall Closure Plan\Final Kendall Mine Closure Mgmt Plan.Docx\JIM VOLBERDING
P.O. BOX 501
LEWISTOWN, MT 59457\7/26/12\065
3-3 7/26/12\11:53 AM
Table 3-1 summarizes current concentrations and trends for parameters of interest for
KVPB-6. The concentrations of all parameters except thallium currently meet water quality
standards. Thallium concentrations in KVPB-6 have exhibited strong declining trends and
are projected to meet estimated background concentrations within the next 5 to 40 years.
Concentrations of nitrate + nitrite and selenium meet water quality standards but continue to
exhibit decreasing trends also.
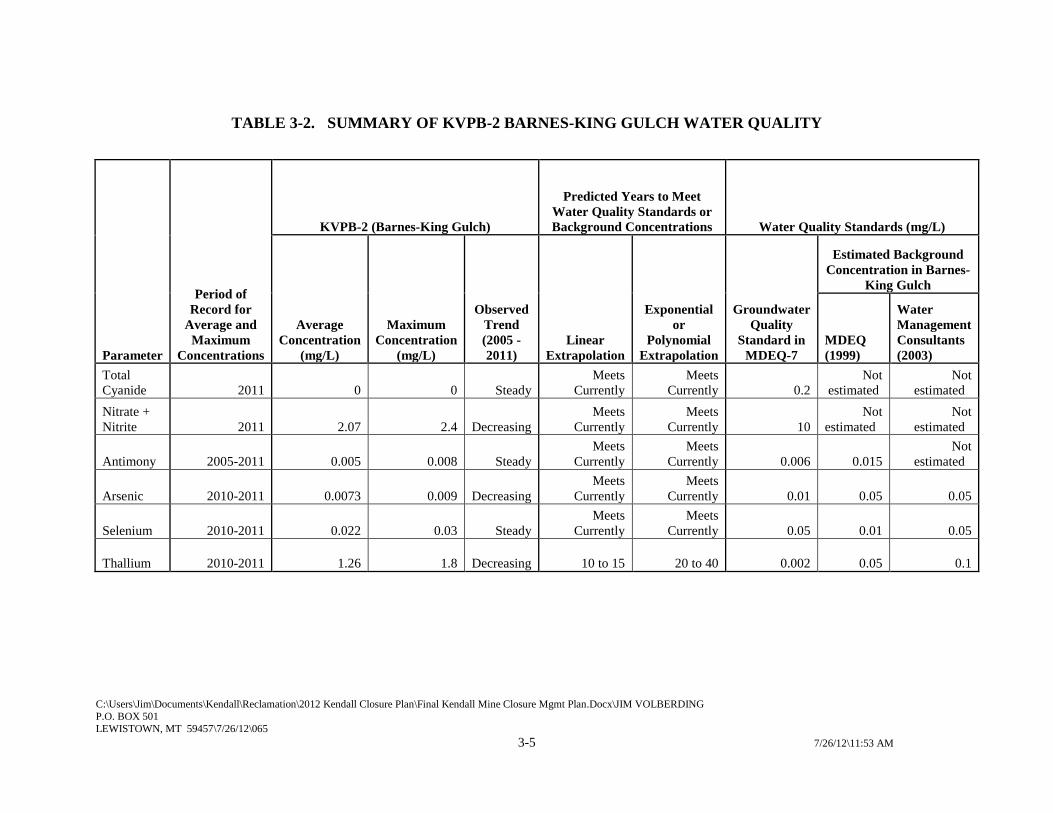
3.2.2 Barnes-King Gulch (KVPB-2 Pumpback System)
Portions of the Muleshoe Pit, North Muleshoe Pit and Muleshoe Waste Repository are
located in Barnes-King Gulch. Barnes-King Gulch was the site of the historic Barnes-King
Mill (circa 1901 – 1923) which deposited tailings throughout the drainage both on the CR
Kendall mine site and downstream of the mine site for a distance of several miles. Alluvial
groundwater in the drainage is captured by groundwater capture and pumpback system
KVPB-2. Several pilot-scale water treatment systems have been built in Barnes-King Gulch
to treat KVPB-2 water as described in Section 5.0.
Table 3-2 summarizes current concentrations and trends for parameters of interest for
KVPB-2. The concentrations of all parameters except thallium currently meet water quality
standards. Thallium concentrations in KVPB-2 have exhibited strong declining trends and
are projected to meet estimated background concentrations within the next 10 to 40 years.
Concentrations of nitrate + nitrite and arsenic meet water quality standards but continue to
exhibit decreasing trends also.
3.2.3 Mason Canyon (TMW-26 Pumpback System)
Process pads 3 and 4; Ponds 7, 8, 2B and 3B; and the water treatment (former processing and
mine support) facilities are located in Mason Canyon, also known as the Process Valley.
Process pads 3 and 4 are partially capped with a cover consisting of 18 inches of subsoil
amended with 5 percent bentonite. Stormwater runoff from the pads is routed to the natural
drainage near the downstream boundary of the mine site. Drainage from the pads flows to
Pond 7.

C:\Users\Jim\Documents\Kendall\Reclamation\2012 Kendall Closure Plan\Final Kendall Mine Closure Mgmt Plan.Docx\JIM VOLBERDING
P.O. BOX 501
LEWISTOWN, MT 59457\7/26/12\065
3-4 7/26/12\11:53 AM
TABLE 3-1. SUMMARY OF KVPB-6 (MULESHOE BRANCH LITTLE DOG CREEK) WATER QUALITY
Period of
Record for
Average and
Maximum
Concentrations
KVPB-6 (Muleshoe Branch Little Dog
Creek)
Predicted Years to Meet
Water Quality Standards or
Background Concentrations * Water Quality Standards
Average
Concentration
(mg/L)
Maximum
Concentration
(mg/L)
Observed
Trend
(2005 -
2011)
Linear
Extrapolation
Exponential
or
Polynomial
Extrapolation
Groundwater
Quality
Standard in
MDEQ-7
Estimated Background
Concentration in
Muleshoe Branch Little
Dog Creek
Parameter
MDEQ
(1999)
Water
Management
Consultants
(2003)
Total
Cyanide 2011 0 0 Steady
Meets
Currently
Meets
Currently 0.2
Not
estimated
Not
estimated
Nitrate +
Nitrite 2011 2.68 3.17 Decreasing
Meets
Currently
Meets
Currently 10
Not
estimated
Not
estimated
Antimony 2005-2011 0.0013 0.002 Steady
Meets
Currently
Meets
Currently 0.006
Not
estimated
Not
estimated
Arsenic 2010-2011 0.01 0.011 Steady
Meets
Currently
Meets
Currently 0.01
Not
estimated 0.025
Selenium 2010-2011 0.05 0.059 Decreasing
Meets
Currently
Meets
Currently 0.05 0.01 0.05
Thallium 2010-2011 0.356 0.46 Decreasing 10 to 15 20 to 40 0.002 0.01 0.02
C:\Users\Jim\Documents\Kendall\Reclamation\2012 Kendall Closure Plan\Final Kendall Mine Closure Mgmt Plan.Docx\JIM VOLBERDING
P.O. BOX 501
LEWISTOWN, MT 59457\7/26/12\065
3-5 7/26/12\11:53 AM
TABLE 3-2. SUMMARY OF KVPB-2 BARNES-KING GULCH WATER QUALITY
Period of
Record for
Average and
Maximum
Concentrations
KVPB-2 (Barnes-King Gulch)
Predicted Years to Meet
Water Quality Standards or
Background Concentrations Water Quality Standards (mg/L)
Average
Concentration
(mg/L)
Maximum
Concentration
(mg/L)
Observed
Trend
(2005 -
2011)
Linear
Extrapolation
Exponential
or
Polynomial
Extrapolation
Groundwater
Quality
Standard in
MDEQ-7
Estimated Background
Concentration in Barnes-
King Gulch
Parameter
MDEQ
(1999)
Water
Management
Consultants
(2003)
Total
Cyanide 2011 0 0 Steady
Meets
Currently
Meets
Currently 0.2
Not
estimated
Not
estimated
Nitrate +
Nitrite 2011 2.07 2.4 Decreasing
Meets
Currently
Meets
Currently 10
Not
estimated
Not
estimated
Antimony 2005-2011 0.005 0.008 Steady
Meets
Currently
Meets
Currently 0.006 0.015
Not
estimated
Arsenic 2010-2011 0.0073 0.009 Decreasing
Meets
Currently
Meets
Currently 0.01 0.05 0.05
Selenium 2010-2011 0.022 0.03 Steady
Meets
Currently
Meets
Currently 0.05 0.01 0.05
Thallium 2010-2011 1.26 1.8 Decreasing 10 to 15 20 to 40 0.002 0.05 0.1

C:\Users\Jim\Documents\Kendall\Reclamation\2012 Kendall Closure Plan\Final Kendall Mine Closure Mgmt Plan.Docx\JIM VOLBERDING
P.O. BOX 501
LEWISTOWN, MT 59457\7/26/12\065
3-6 7/26/12\11:53 AM
Mason Canyon is the former site of the historic Kendall Mill (circa 1901-1912) and has been
used for cyanide processing of ore since approximately 1900. Tailings from the historic
milling operations were deposited in Mason Canyon and remain in the drainage beneath the
current pads 3 and 4. Portions of the historic tailings were incorporated into the process pad
underliner. Alluvial groundwater in the drainage is impacted by the contact with historic
mine tailings and process water. Migration of the alluvial groundwater off-site is controlled
with pumpback system TMW-26.
Table 3-3 summarizes current concentrations and trends for parameters of interest for
pumpback system TMW-26. The concentrations of all parameters except thallium currently
meet water quality standards. Thallium concentrations in TMW-26 have exhibited strong
declining trends and are projected to meet estimated background concentrations within the
next 10 to 40 years. Concentrations of nitrate + nitrite meet water quality standards but
continue to exhibit decreasing trends also.
3.2.4 South Fork of Last Chance Creek (KVPB-5 Pumpback System)
The Kendall Waste Rock Repository is located in the South Fork of Last Chance Creek. The
Kendall Repository is fully reclaimed and re-vegetated and no further reclamation or
disturbance of this facility is proposed. Drainage from the waste repository is controlled with
pump back system KVPB-5. Under this proposed water management plan, treated mine
water would be discharged to groundwater in the Kendall Pit. The Kendall Pit is located in
the headwaters of Mason Canyon close to the surface water divide with South Fork of Last
Chance Creek. Since groundwater divides do not always exactly match surface water
divides, it is possible that current and future flows from the Kendall Pit may flow beneath the
South Fork of Last Chance Creek watershed in addition to the Mason Canyon watershed.
Table 3-4 summarizes current concentrations and trends for parameters of interest for
pumpback system KVPB-5. The concentrations of all parameters except thallium currently
meet water quality standards. Thallium concentrations in KVPB-5 have exhibited declining
trends and are projected to meet estimated background concentrations within the next 5 to 10
years. Concentrations of nitrate + nitrite and selenium meet water quality standards but
continue to exhibit decreasing trends also.

C:\Users\Jim\Documents\Kendall\Reclamation\2012 Kendall Closure Plan\Final Kendall Mine Closure Mgmt Plan.Docx\JIM VOLBERDING
P.O. BOX 501
LEWISTOWN, MT 59457\7/26/12\065
3-7 7/26/12\11:53 AM
TABLE 3-3. SUMMARY OF PUMPBACK TMW-26 (MASON CANYON) WATER QUALITY
Period of
Record for
Average and
Maximum
Concentrations
TMW-26 (Mason Canyon)
Predicted Years to Meet
Water Quality Standards or
Background Concentrations Water Quality Standards (mg/L)
Average
Concentration
(mg/L)
Maximum
Concentration
(mg/L)
Observed
Trend
(2005 -
2011)
Linear
Extrapolation
Exponential
or
Polynomial
Extrapolation
Groundwater
Quality
Standard in
MDEQ-7
Estimated Background
Concentration in
Mason Canyon
Parameter
MDEQ
(1999)
Water
Management
Consultants
(2003)
Total
Cyanide 2011 0 0 Steady
Meets
Currently
Meets
Currently 0.2
Nitrate +
Nitrite 2011 2.36 2.95 Decreasing
Meets
Currently
Meets
Currently 10
Antimony 2005-2011 0.00139 0.0015 Steady
Meets
Currently
Meets
Currently 0.006
Arsenic 2010-2011 0.0031 0.005 Steady
Meets
Currently
Meets
Currently 0.01 0.05 0.05
Selenium 2010-2011 0.013 0.02 Steady
Meets
Currently
Meets
Currently 0.05 0.01 0.05
Thallium 2010-2011 0.038 0.067 Steady
Occasionally
Meets
Occasionally
Meets 0.002 0.05 0.1

C:\Users\Jim\Documents\Kendall\Reclamation\2012 Kendall Closure Plan\Final Kendall Mine Closure Mgmt Plan.Docx\JIM VOLBERDING
P.O. BOX 501
LEWISTOWN, MT 59457\7/26/12\065
3-8 7/26/12\11:53 AM
TABLE 3-4. SUMMARY OF PUMPBACK KVPB-5 (SOUTH FORK LAST CHANCE CREEK) WATER QUALITY
Period of
Record for
Average and
Maximum
Concentrations
KVPB-5 (South Fork Last Chance Creek)
Predicted Years to Meet
Water Quality Standards or
Background Concentrations Water Quality Standards (mg/L)
Average
Concentration
(mg/L)
Maximum
Concentration
(mg/L)
Observed
Trend
(2005 -
2011)
Linear
Extrapolation
Exponential
or
Polynomial
Extrapolation
Groundwater
Quality
Standard in
MDEQ-7
Estimated Background
Concentration in
Mason Canyon
Parameter
MDEQ
(1999)
Water
Management
Consultants
(2003)
Total
Cyanide 2011 0 0 Steady
Meets
Currently
Meets
Currently 0.2
Nitrate +
Nitrite 2011 2.39 2.98 Decreasing
Meets
Currently
Meets
Currently 10
Antimony 2005-2011 0.00125 0.0015 Steady
Meets
Currently
Meets
Currently 0.006
Arsenic 2010-2011 0.0034 0.005 Steady
Meets
Currently
Meets
Currently 0.01 0.05
Selenium 2010-2011 0.016 0.022 Decreasing
Meets
Currently
Meets
Currently 0.05 0.02
Thallium 2010-2011 0.024 0.037 Decreasing 5 to 10 5 to 10 0.002 0.01 0.02

C:\Users\Jim\Documents\Kendall\Reclamation\2012 Kendall Closure Plan\Final Kendall Mine Closure Mgmt Plan.Docx\JIM VOLBERDING
P.O. BOX 501
LEWISTOWN, MT 59457\7/26/12\065
4-1 7/26/12\11:53 AM
4.0 INFLOW TO WATER TREATMENT SYSTEM
This section describes the estimation of the range of future water treatment plant inflow rates
and chemical concentrations that are expected based on observed and predicted pumpback
and pad drainage conditions. The estimation is made using mixing equations (i.e., a
spreadsheet-based mathematical mixing model) that are based on the site conceptual model.
Inflow to the water treatment system is comprised of water from the groundwater
capture/pumpback systems combined with pad drainage flows. These flows are routed
through, and mixed in, a series of storage ponds (2B, 3B, 7 and 8) before water treatment.
As described in Sections 2.0 and 3.0, flow rates of individual pumpback systems and pad
drainage varies with annual and seasonal fluctuations in precipitation. Chemical
concentrations are also variable, and some chemical parameters such as cyanide, nitrate,
arsenic, selenium and thallium exhibit long-term declining concentration trends in both
pumpback and pad drainage flows. In addition, the retention time in the storage ponds
affects the interval over which inflows are mixed and as a result, the water quality of pond
outflow/water treatment plant inflow is dependent on the active storage volume of the ponds.
Thus, the flow rate and chemical concentration of inflow to the treatment plant is a function
of several variables that must be considered in the site conceptual model and in the
mathematical mixing model.
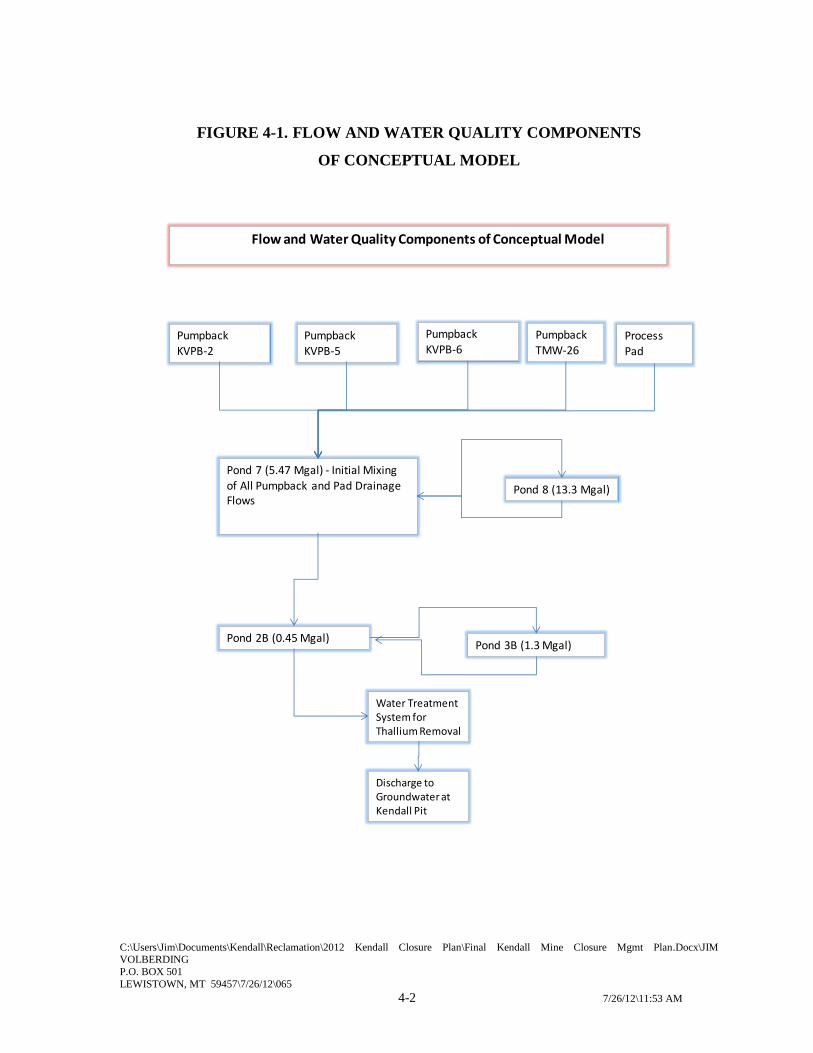
4.1 CONCEPTUAL MODEL
The site conceptual model for water treatment plant inflow reflects the existing and proposed
future management system for water from the pumpback systems and pad drainage. The
conceptual model is illustrated in Figure 4-1 and is described as follows:
1. The sources of water for treatment include the four pumpback systems and pad
drainage, each with unique flow hydrographs and water chemistries. Water flows and
chemical concentrations are variable and cyanide, nitrate, arsenic, selenium and
thallium concentrations exhibit long-term declining concentration trends.
C:\Users\Jim\Documents\Kendall\Reclamation\2012 Kendall Closure Plan\Final Kendall Mine Closure Mgmt Plan.Docx\JIM VOLBERDING
P.O. BOX 501
LEWISTOWN, MT 59457\7/26/12\065
4-2 7/26/12\11:53 AM
FIGURE 4-1. FLOW AND WATER QUALITY COMPONENTS
OF CONCEPTUAL MODEL
Flow and Water Quality Components of Conceptual Model
Pumpback
KVPB-2Pumpback
KVPB-5
Pumpback
KVPB-6Pumpback TMW-26
Process Pad
Pond 7 (5.47 Mgal) - Initial Mixing
of All Pumpback and Pad Drainage Flows
Pond 8 (13.3 Mgal)
Pond 3B (1.3 Mgal)Pond 2B (0.45 Mgal)
Water Treatment System for Thallium Removal
Discharge to Groundwater at Kendall Pit

C:\Users\Jim\Documents\Kendall\Reclamation\2012 Kendall Closure Plan\Final Kendall Mine Closure Mgmt Plan.Docx\JIM VOLBERDING
P.O. BOX 501
LEWISTOWN, MT 59457\7/26/12\065
4-3 7/26/12\11:53 AM
2. Water from all sources initially flows or is pumped to Pond 7 where the water
becomes mixed and is stored.
3. Pond 7 has an overflow line that conveys water to Pond 8 when Pond 7 is full and
inflow exceeds outflow (to Pond 2B and treatment). Pond 8 is typically operated as
an overflow pond with no outflow except a return line to Pond 7.
4. From Pond 7, water is pumped to Pond 2B which functions as the feed water pond for
the water treatment plant.
5. Pond 3B is connected to Pond 2B via overflow line and Pond 3B functions as a surge
pond to help buffer (balance) Pond 2B inflows with water treatment plant
withdrawals.
6. Water is pumped from Pond 2B to the treatment plant for thallium removal.
7. Treated water is discharged to groundwater in the Kendall Pit.
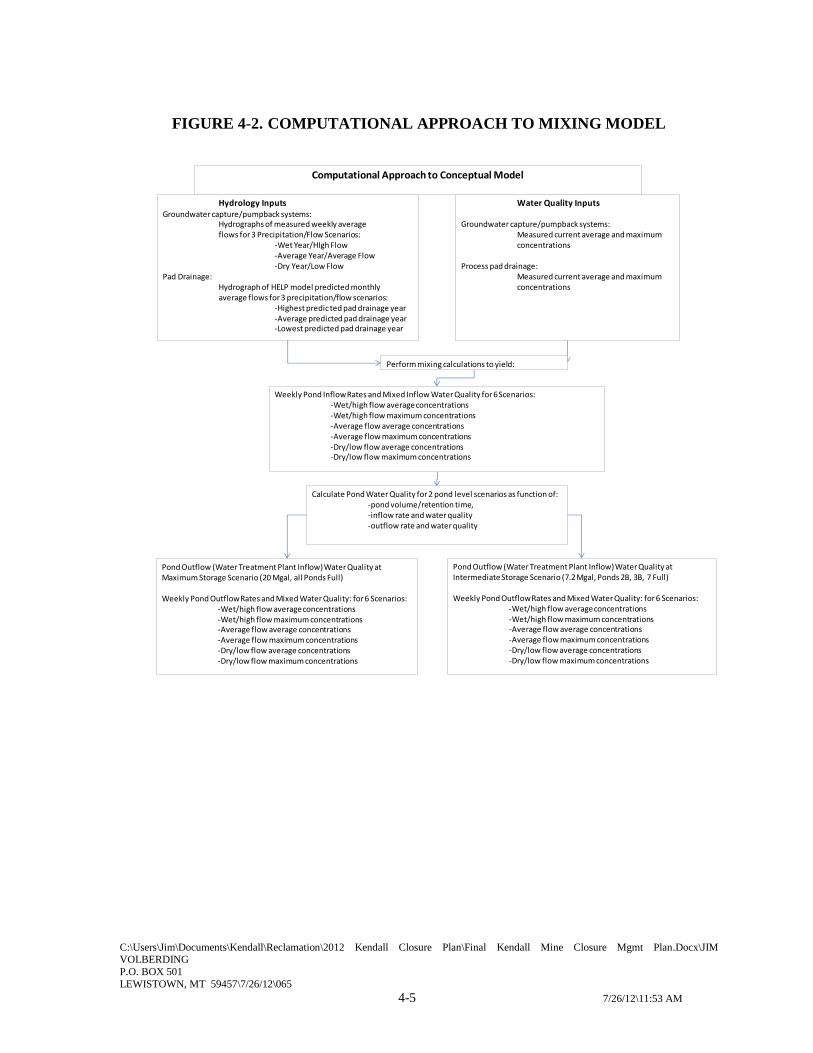
The computational approach to representing the conceptual model is described in Figure 4-2
and is summarized as follows:
1. Inputs to the model consist of:
a. Measured weekly pumpback flows for three precipitation/flow conditions
(wet, average, dry).
b. Predicted monthly pad drainage flows (from the HELP Model as described in
Section 2.4).
c. Measured average and maximum chemical concentrations for the pumpback
and pad drainage flows.
d. Combination of the three flow and two water quality scenarios yields six sets
of input conditions:
i. wet year average concentration;
ii. wet year maximum concentration;
iii. average year average concentration;
iv. average year maximum concentration;
v. dry year average concentration; and
vi. dry year maximum concentration.

C:\Users\Jim\Documents\Kendall\Reclamation\2012 Kendall Closure Plan\Final Kendall Mine Closure Mgmt Plan.Docx\JIM VOLBERDING
P.O. BOX 501
LEWISTOWN, MT 59457\7/26/12\065
4-4 7/26/12\11:53 AM
C:\Users\Jim\Documents\Kendall\Reclamation\2012 Kendall Closure Plan\Final Kendall Mine Closure Mgmt Plan.Docx\JIM VOLBERDING
P.O. BOX 501
LEWISTOWN, MT 59457\7/26/12\065
4-5 7/26/12\11:53 AM
FIGURE 4-2. COMPUTATIONAL APPROACH TO MIXING MODEL
Hydrology InputsGroundwater capture/pumpback systems:
Hydrographs of measured weekly average flows for 3 Precipitation/Flow Scenarios:
-Wet Year/HIgh Flow-Average Year/Average Flow-Dry Year/Low Flow
Pad Drainage:Hydrograph of HELP model predicted monthly average flows for 3 precipitation/flow scenarios:
-Highest predic ted pad drainage year-Average predicted pad drainage year-Lowest predicted pad drainage year
Water Quality Inputs
Groundwater capture/pumpback systems: Measured current average and maximum concentrations
Process pad drainage:Measured current average and maximum concentrations
Weekly Pond Inflow Rates and Mixed Inflow Water Quality for 6 Scenarios:-Wet/high flow average concentrations-Wet/high flow maximum concentrations-Average flow average concentrations-Average flow maximum concentrations-Dry/low flow average concentrations-Dry/low flow maximum concentrations
Pond Outflow (Water Treatment Plant Inflow) Water Quality at Maximum Storage Scenario (20 Mgal, all Ponds Full)
Weekly Pond Outflow Rates and Mixed Water Quality: for 6 Scenarios:-Wet/high flow average concentrations-Wet/high flow maximum concentrations-Average flow average concentrations-Average flow maximum concentrations-Dry/low flow average concentrations-Dry/low flow maximum concentrations
Calculate Pond Water Quality for 2 pond level scenarios as function of:-pond volume/retention time,-inflow rate and water quality-outflow rate and water quality
Pond Outflow (Water Treatment Plant Inflow) Water Quality at Intermediate Storage Scenario (7.2 Mgal, Ponds 2B, 3B, 7 Full)
Weekly Pond Outflow Rates and Mixed Water Quality: for 6 Scenarios:-Wet/high flow average concentrations-Wet/high flow maximum concentrations-Average flow average concentrations-Average flow maximum concentrations-Dry/low flow average concentrations-Dry/low flow maximum concentrations
Perform mixing calculations to yield:
Computational Approach to Conceptual Model

C:\Users\Jim\Documents\Kendall\Reclamation\2012 Kendall Closure Plan\Final Kendall Mine Closure Mgmt Plan.Docx\JIM VOLBERDING
P.O. BOX 501
LEWISTOWN, MT 59457\7/26/12\065
4-6 7/26/12\11:53 AM
2. For each of the six flow and water quality conditions, weekly average inflow to Pond
7 is calculated via mixing equations based on the rate and water quality of flow from
each water source. These mixing calculations thus yield six arrays of predicted
weekly pond inflow concentrations covering the range of flows and water quality.
3. Pond and pond outflow water qualities differ from short-term inflow water quality
due to the large capacity of the ponds relative to inflow rates and the mixing that
occurs in the pond over the long retention times. The larger the active storage volume
of the ponds, the longer the retention and mixing time of the ponds and the less pond
water quality is affected by short term fluctuations in inflow rate and water quality
(i.e., the more closely pond water quality reflects long-term average inflow rate and
quality). Conversely, the smaller the active storage volume of the ponds, the more
closely pond water quality reflects short-term variations in inflow water quality. The
final step in the estimation of pond outflow/water treatment plant inflow water quality
is to calculate pond outflow water quality for the six flow and water quality
conditions for two different pond active storage area conditions:
a. Maximum storage available (20.5 Mgal), all ponds utilized, such as might
occur during an extreme wet/high flow period.
b. Intermediate storage (7.2 Mgal), only Ponds 2B, 3B, and 7 utilized, such as
might occur during dry or average periods.
4. Final output of the mixing calculation are twelve sets of weekly predicted pond
outflow chemical concentrations that cover the range of expected flow, water quality,
and storage conditions:
a. Six predicted pond outflow concentrations for intermediate pond storage
condition.
b. Six predicted pond outflow concentrations for a maximum pond storage
conditions.
4.2 UNCERTAINTIES AND LIMITATIONS OF THE MIXING MODEL
As for any model or prediction of future events, the mixing model has uncertainties and
limitations. The purpose of identifying these limitations is twofold: 1) understanding these
uncertainties and limitations aids in the interpretation of model predictions; and 2)
C:\Users\Jim\Documents\Kendall\Reclamation\2012 Kendall Closure Plan\Final Kendall Mine Closure Mgmt Plan.Docx\JIM VOLBERDING
P.O. BOX 501
LEWISTOWN, MT 59457\7/26/12\065
4-7 7/26/12\11:53 AM
identifying the uncertainties guides the development of contingency actions that could be
implemented if future conditions differ from model assumptions or predictions (see Section
7.0). In spite of these identified uncertainties and limitations, the mixing model is an
appropriate tool for evaluating the proposed water management system.
The identified limitations or uncertainties of the mixing model are:
Future precipitation conditions;
HELP predictions of pad drainage flow;
Timing of flows;
Assumption of full mixing in ponds;
Combination of maximum concentrations; and
Concentration trends will continue.
The mixing model assumes that future precipitation conditions will be similar to past
conditions measured at the site and similar to those predicted by the HELP model synthetic
climate record. If future precipitation were to be wetter or drier than historic measurements
and HELP model predictions, then pumpback and pad drainage flows could be higher or
lower than evaluated in the mixing model. If this were to occur, the chemical concentrations
of mixed water treatment inflow could vary from those predicted by the mixing model. The
mixing model evaluates the most extreme conditions previously observed at the site, thus it is
unlikely that future conditions will greatly exceed mixing model conditions and therefore,
chemical concentrations predicted by the mixing model are not likely to be exceeded by
future conditions.
The mixing model incorporates pad drainage flow predictions of the HELP model. The
HELP model has inherent uncertainties and actual future flows could differ somewhat from
predictions. However, the ultimate driver for pad flows is precipitation and the consideration
of extreme precipitation years in the mixing model provides a conservative basis for the
HELP predictions. Moreover, the HELP model predicted timing of pad flows (i.e., flow
hydrograph) is out of phase with pumpback flow hydrographs. This hydrograph prediction is

C:\Users\Jim\Documents\Kendall\Reclamation\2012 Kendall Closure Plan\Final Kendall Mine Closure Mgmt Plan.Docx\JIM VOLBERDING
P.O. BOX 501
LEWISTOWN, MT 59457\7/26/12\065
4-8 7/26/12\11:53 AM
subject to some uncertainty, but this also represents a conservative case as it results in higher
predicted mixed water concentrations.
The mixing model considers maximum measured concentrations for pumpback and pad
drainage water and evaluates the case where all of the maximum concentrations occur
simultaneously at one time. Since there are a finite number of measured concentrations,
there is a small statistical probability that higher concentrations could occur in the future.
However, evaluating maximum measured concentrations is believed to be conservative for
two reasons: 1) Concentrations for most parameters exhibit strong declining trends which
makes it less likely that the observed maximums will be exceeded in the future; and 2) it is
unlikely that maximum concentrations would occur in all water sources at the same time,
thus the mixing model tends to overestimate potential maximum mixed water concentrations.
Although it is theoretically possible that the declining concentration trends could reverse it is
not believed to be likely, in particular for chemicals that do not occur naturally in the native
rock material to any significant extent but rather are present as the result of mining or ore
processing (i.e., cyanide from ore processing; nitrate + nitrite from blasting residues and/or
cyanide degradation). The combination of a finite and ever-decreasing amount of cyanide
and nitrogen compounds in waste rock and spent ore with the observed, ongoing decreases in
mine water concentrations of cyanide and nitrogen compounds in mine water; make it highly
unlikely that cyanide and nitrogen concentrations in mine water will increase in the future.
The pond water quality portion of the mixing model assumes that full mixing occurs in the
storage ponds. In theory, this assumption is never completely true, but given the large pond
volumes, long retention time, and multiple pond layout this is a fair approximation for the
purpose of this mixing analysis.
4.3 POND INFLOW RATES
Pond inflows consist of the groundwater capture/pumpback system flows and pad drainage.
Monitoring of actual pumpback system and pad drainage flows and HELP model predictions
of future pad drainage flows demonstrate the strong correlation between precipitation on the
site and pumpback and pad drainage flows (see Sections 2.3 and 3.1). To evaluate the

C:\Users\Jim\Documents\Kendall\Reclamation\2012 Kendall Closure Plan\Final Kendall Mine Closure Mgmt Plan.Docx\JIM VOLBERDING
P.O. BOX 501
LEWISTOWN, MT 59457\7/26/12\065
4-9 7/26/12\11:53 AM
expected range of pond inflow rates arising from observed and future expected precipitation
conditions, the mixing model incorporates pumpback and pad drainage flows for three
precipitation scenarios (wet, average, and dry) represented by the following conditions:
The driest year measured at the mine site (2001, 17.72 inches of rainfall);
Average annual precipitation (24.53 inches of rainfall); and
The wettest year measured at the mine site (2010, 35.05 inches of rainfall).
For the pumpback systems, the weekly flow rates used in the mixing model are the actual
measured flows from years 2001, 2010, and the average for the period of 1999-2010 as
shown in Figure 4-3. Pad drainage flows are predicted to decline after the completion of the
pad cover system (as described in Section 2.4) and therefore future flows are expected to be
substantially less than currently or previously measured. For pad drainage flows, HELP
model predicted monthly average flows for model simulation years with similar precipitation
to the observed dry, average, and wet years were used (i.e., model years 40, 47, and 48 with
annual precipitation of 17.81, 24.39, and 37.18 inches, respectively) as shown in Figure 4-4.
A comparison of Figures 4-3 and 4-4 reveals that the HELP model predicts a future pad
drainage flow hydrograph that is the inverse of the currently observed pumpback and pad
drainage flow hydrographs. The currently observed pumpback and pad drainage flow
hydrographs generally mimic, with a short time lag, precipitation and snowmelt with highest
flows in the spring and early summer. However, the HELP model predicts a longer time lag
between precipitation/snowmelt inputs and pad drainage flows, such that highest future pad
drainage is predicted to occur during fall and winter. In other words, the HELP model
predicts that the pad cover will not only reduce the amount of water infiltrating the pad, but
also slow down the movement of water through the cover such that there is a delayed
response of pad drainage to precipitation inputs. The effect of the non-synchronicity of
future pumpback and pad flow hydrographs is that inflows are predicted to have a higher
proportion of pad drainage flows during the winter.

C:\Users\Jim\Documents\Kendall\Reclamation\2012 Kendall Closure Plan\Final Kendall Mine Closure Mgmt Plan.Docx\JIM VOLBERDING
P.O. BOX 501
LEWISTOWN, MT 59457\7/26/12\065
4-10 7/26/12\11:53 AM
FIGURE 4-3. PUMPBACK SYSTEM FLOW SCENARIOS IN MIXING MODEL

C:\Users\Jim\Documents\Kendall\Reclamation\2012 Kendall Closure Plan\Final Kendall Mine Closure Mgmt Plan.Docx\JIM VOLBERDING
P.O. BOX 501
LEWISTOWN, MT 59457\7/26/12\065
4-11 7/26/12\11:53 AM
FIGURE 4-4. PAD DRAINAGE FLOW SCENARIOS IN MIXING MODEL
4.4 POND INFLOW CHEMISTRY
Pond inflow chemistry is dependent on the future water quality of the various inflow sources.
Water quality of the various sources is variable over time. Therefore, the mixing model
incorporates estimates of likely future typical and potential extreme water quality conditions
to account for this variability. In the model, typical conditions are represented by measured
average chemical concentrations while extreme conditions are represented by measured
maximum concentrations. Nearly all parameters exhibit declining trends reflecting the
general site-wide water quality improvement that has occurred. Therefore, the more recent
water quality data is more representative of likely future water quality conditions than older
data. The selected data period of record, average and maximum concentration, and current
observed trends for parameters of interest for each inflow water source used in the mixing
model are summarized in Table 2-1 (Section 2.4) and Tables 3-1 through 3-4 (Section 3.2).
C:\Users\Jim\Documents\Kendall\Reclamation\2012 Kendall Closure Plan\Final Kendall Mine Closure Mgmt Plan.Docx\JIM VOLBERDING
P.O. BOX 501
LEWISTOWN, MT 59457\7/26/12\065
4-12 7/26/12\11:53 AM
The mixing model calculates the combined inflow water quality for each week according to
the equation:
CInflow= ((QKVPB2CKVPB2)+(QKVPB5CKVPB5)+(QKVPB6CKVPB6)+(QTMW26CTMW26)+(QPADCPAD))/(Total Flow)
Where: QKVPB2 = flow rate of water source;
CKVPB2 = chemical concentration of water source; and
Total Flow = sum of all flows (QKVPB2+QKVPB5+QKVPB6+QTMW26+QPAD)
Mixing model predicted weekly nitrate + nitrite concentrations of pond inflow for the six
precipitation/chemical concentration scenarios are shown in Figure 4-5. The model predicts
that nitrate + nitrite concentrations flowing into Pond 7 will vary from approximately 3 to 6
mg/L during the summer months to 8 to 16 mg/L during the winter months. These predicted
seasonal cycles reflect the difference in timing of high and low pumpback flows compared to
pad drainage flows and the much higher nitrate + nitrite concentration of pad drainage flows.
4.5 STORAGE POND CHEMICAL CONCENTRATIONS
Water quality in the pond is a function of pond retention time (length of time that water is
retained in the pond), pond inflow rates and water quality, and pond outflow rates and water
quality. The mixing model calculates the pond water quality for each week according to the
equation:
CPond Week t = ((VInflowCInflow)+(VPondCPond) - (VOutflowCOutflow))/(VPond)
Where VPond = Volume or active storage capacity of pond available for mixing;
VInflow = Volume of water flowing into pond each week;
VOutflow = Volume of water flowing out of pond each week (assumed to equal
VInflow to maintain steady pond volume);
CInflow = chemical concentration in mixed inflow water;
CPond Week t = chemical concentration in pond for week t; and
COutflow = chemical concentration flowing out of pond for week t (assumed to
C:\Users\Jim\Documents\Kendall\Reclamation\2012 Kendall Closure Plan\Final Kendall Mine Closure Mgmt Plan.Docx\JIM VOLBERDING
P.O. BOX 501
LEWISTOWN, MT 59457\7/26/12\065
4-13 7/26/12\11:53 AM
equal pond concentration for the previous week (CPond Week t-1 )).
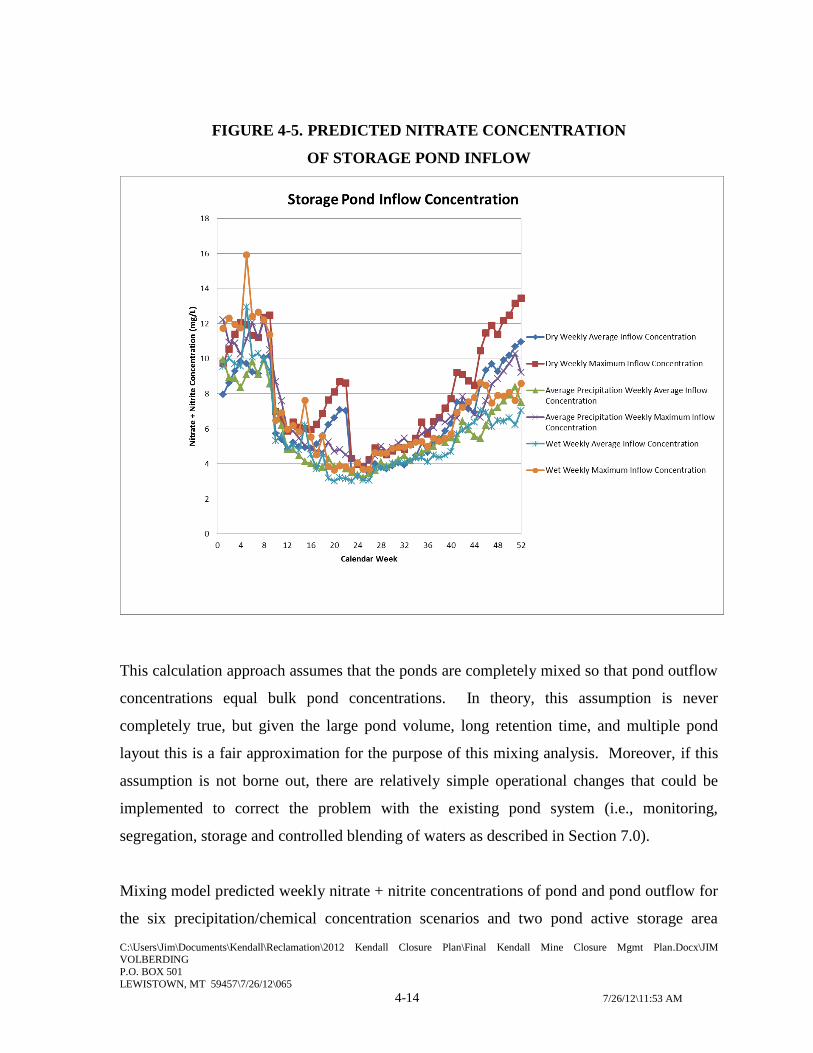
C:\Users\Jim\Documents\Kendall\Reclamation\2012 Kendall Closure Plan\Final Kendall Mine Closure Mgmt Plan.Docx\JIM VOLBERDING
P.O. BOX 501
LEWISTOWN, MT 59457\7/26/12\065
4-14 7/26/12\11:53 AM
FIGURE 4-5. PREDICTED NITRATE CONCENTRATION
OF STORAGE POND INFLOW
This calculation approach assumes that the ponds are completely mixed so that pond outflow
concentrations equal bulk pond concentrations. In theory, this assumption is never
completely true, but given the large pond volume, long retention time, and multiple pond
layout this is a fair approximation for the purpose of this mixing analysis. Moreover, if this
assumption is not borne out, there are relatively simple operational changes that could be
implemented to correct the problem with the existing pond system (i.e., monitoring,
segregation, storage and controlled blending of waters as described in Section 7.0).
Mixing model predicted weekly nitrate + nitrite concentrations of pond and pond outflow for
the six precipitation/chemical concentration scenarios and two pond active storage area
C:\Users\Jim\Documents\Kendall\Reclamation\2012 Kendall Closure Plan\Final Kendall Mine Closure Mgmt Plan.Docx\JIM VOLBERDING
P.O. BOX 501
LEWISTOWN, MT 59457\7/26/12\065
4-15 7/26/12\11:53 AM
conditions are shown in Figure 4-6. Model predicted weekly concentrations of cyanide,
antimony, arsenic, selenium, and thallium in the pond and pond outflow are included in
Appendix D. The model predicts that the variability in nitrate+nitrite concentrations in the
ponds will be reduced compared to the variability of pond inflow concentrations. Pond and
pond outflow concentrations are predicted to range from approximately 3 to 6 mg/L during
the summer months to 5 to 9 mg/L during the winter months.
4.6 TREATMENT PLANT INFLOW CONCENTRATIONS
Water stored in the ponds will be pumped to the water treatment plant for thallium removal.
The average and maximum predicted concentrations in treatment plant influent for the twelve
mixing model scenarios are given in Table 4-1 along with relevant Montana groundwater
quality standards. With the exception of thallium, influent concentrations of all parameters
are lower (better than) water quality standards or background groundwater concentrations in
the area of the Kendall Pit (Mason Canyon and South Fork of Last Chance Creek), for all
scenarios. The Kendall Pit is located in the headwaters of Mason Canyon close to the surface
water divide with South Fork of Last Chance Creek. Since groundwater divides do not
always exactly match surface water divides, it is possible that current and future flows from
the Kendall Pit may flow beneath Mason Canyon and/or the South Fork of Last Chance
Creek watersheds. Background concentrations were estimated by MDEQ (1999) and Water
Management Consultants (WMC, 2003) based on metal concentrations in a variety of water,
soil, rock, and historic mining waste materials in the area.

C:\Users\Jim\Documents\Kendall\Reclamation\2012 Kendall Closure Plan\Final Kendall Mine Closure Mgmt Plan.Docx\JIM VOLBERDING
P.O. BOX 501
LEWISTOWN, MT 59457\7/26/12\065
4-14 7/26/12\11:53 AM
FIGURE 4-6. PREDICTED NITRATE + NITRITE CONCENTRATION IN
STORAGE POND AND POND OUTFLOW

C:\Users\Jim\Documents\Kendall\Reclamation\2012 Kendall Closure Plan\Final Kendall Mine Closure Mgmt Plan.Docx\JIM VOLBERDING
P.O. BOX 501
LEWISTOWN, MT 59457\7/26/12\065
4-15 7/26/12\11:53 AM
TABLE 4-1. PREDICTED WATER TREATMENT PLANT INFLUENT CONCENTRATIONS
Parameter
Pond
Storage
Scenario
Concentration
Statistic
Flow and Concentration Scenarios
Mo
nta
na
Gro
un
dw
ate
r Q
ua
lity
Sta
nd
ard
(MD
EQ
-7)
(mg
/L)
Lo
w F
low
Av
era
ge
Co
nce
ntr
ati
on
(m
g/L
)
Lo
w F
low
Ma
xim
um
Co
nce
ntr
ati
on
Av
era
ge
Flo
w A
ver
ag
e C
on
cen
tra
tio
n
(mg
/L)
Av
era
ge
Flo
w M
ax
imu
m C
on
cen
tra
tio
n
(mg
/L)
Ma
xim
um
Flo
w A
ver
ag
e C
on
cen
tra
tio
n
(mg
/L)
Ma
xim
um
Flo
w M
ax
imu
m C
on
cen
tra
tio
n
(mg
/L)
Cyanide
20.5 Mgal
Annual Average 0.02 0.03 0.02 0.02 0.01 0.02 0.200
Weekly Maximum 0.02 0.03 0.02 0.03 0.02 0.03
7.2 Mgal
Annual Average 0.02 0.03 0.02 0.03 0.02 0.02
Weekly Maximum 0.03 0.04 0.03 0.04 0.03 0.03
Nitrate + Nitrite
20.5 Mgal
Annual Average 5.28 6.46 4.68 5.71 4.34 5.28 10
Weekly Maximum 5.62 6.88 5.34 6.52 5.27 6.43
7.2 Mgal
Annual Average 5.29 6.47 4.84 5.90 4.73 5.77
Weekly Maximum 6.34 7.76 6.51 7.97 6.96 8.52
Antimony
20.5 Mgal
Annual Average 0.003 0.004 0.003 0.004 0.003 0.004 0.006
Weekly Maximum 0.003 0.004 0.003 0.004 0.003 0.004
7.2 Mgal
Annual Average 0.003 0.004 0.003 0.004 0.003 0.004
Weekly Maximum 0.004 0.004 0.004 0.005 0.004 0.005
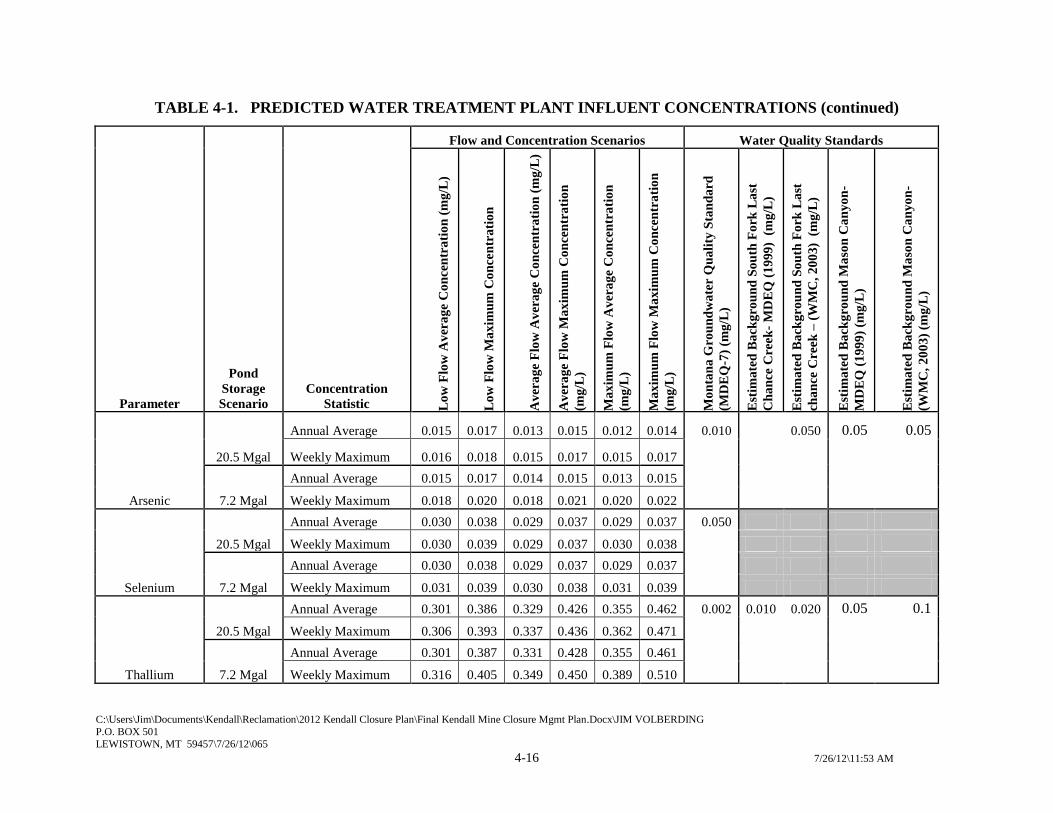
C:\Users\Jim\Documents\Kendall\Reclamation\2012 Kendall Closure Plan\Final Kendall Mine Closure Mgmt Plan.Docx\JIM VOLBERDING
P.O. BOX 501
LEWISTOWN, MT 59457\7/26/12\065
4-16 7/26/12\11:53 AM
TABLE 4-1. PREDICTED WATER TREATMENT PLANT INFLUENT CONCENTRATIONS (continued)
Parameter
Pond
Storage
Scenario
Concentration
Statistic
Flow and Concentration Scenarios Water Quality Standards
Lo
w F
low
Av
era
ge
Co
nce
ntr
ati
on
(m
g/L
)
Lo
w F
low
Ma
xim
um
Co
nce
ntr
ati
on
Av
era
ge
Flo
w A
ver
ag
e C
on
cen
tra
tio
n (
mg
/L)
Av
era
ge
Flo
w M
ax
imu
m C
on
cen
tra
tio
n
(mg
/L)
Ma
xim
um
Flo
w A
ver
ag
e C
on
cen
tra
tio
n
(mg
/L)
Ma
xim
um
Flo
w M
ax
imu
m C
on
cen
tra
tio
n
(mg
/L)
Mo
nta
na
Gro
un
dw
ate
r Q
ua
lity
Sta
nd
ard
(MD
EQ
-7)
(mg
/L)
Est
ima
ted
Ba
ckg
rou
nd
So
uth
Fo
rk L
ast
Ch
an
ce C
reek
- M
DE
Q (
19
99
) (
mg
/L)
Est
ima
ted
Ba
ckg
rou
nd
So
uth
Fo
rk L
ast
cha
nce
Cre
ek –
(W
MC
, 2
00
3)
(m
g/L
)
Est
ima
ted
Ba
ckg
rou
nd
Ma
son
Ca
ny
on
-
MD
EQ
(1
99
9)
(mg
/L)
Est
ima
ted
Ba
ckg
rou
nd
Ma
son
Ca
ny
on
-
(WM
C,
20
03
) (m
g/L
)
Arsenic
20.5 Mgal
Annual Average 0.015 0.017 0.013 0.015 0.012 0.014 0.010 0.050 0.05 0.05
Weekly Maximum 0.016 0.018 0.015 0.017 0.015 0.017
7.2 Mgal
Annual Average 0.015 0.017 0.014 0.015 0.013 0.015
Weekly Maximum 0.018 0.020 0.018 0.021 0.020 0.022
Selenium
20.5 Mgal
Annual Average 0.030 0.038 0.029 0.037 0.029 0.037 0.050
Weekly Maximum 0.030 0.039 0.029 0.037 0.030 0.038
7.2 Mgal
Annual Average 0.030 0.038 0.029 0.037 0.029 0.037
Weekly Maximum 0.031 0.039 0.030 0.038 0.031 0.039
Thallium
20.5 Mgal
Annual Average 0.301 0.386 0.329 0.426 0.355 0.462 0.002 0.010 0.020 0.05 0.1
Weekly Maximum 0.306 0.393 0.337 0.436 0.362 0.471
7.2 Mgal
Annual Average 0.301 0.387 0.331 0.428 0.355 0.461
Weekly Maximum 0.316 0.405 0.349 0.450 0.389 0.510
C:\Users\Jim\Documents\Kendall\Reclamation\2012 Kendall Closure Plan\Final Kendall Mine Closure Mgmt Plan.Docx\JIM VOLBERDING
P.O. BOX 501
LEWISTOWN, MT 59457\7/26/12\065
5-1 7/26/12\11:53 AM
5.0 WATER TREATMENT ALTERNATIVES
The proposed water treatment for long-term water management is thallium removal via
zeolite adsorption as detailed in the following Section 6.0. A variety of treatment options
have been evaluated and tested at Kendall. Most recently (2010-2011), two long-term pilot
scale tests have been conducted with the zeolite treatment system. This section summarizes
water treatment alternatives that have been tested and describes the results of the long-term
zeolite pilot tests.
5.1 ALTERNATIVES EVALUATED AND NOT SELECTED
A thorough summary of early water treatment studies conducted at CR Kendall is provided in
a report by Golder (2006). Water treatment methods that have been considered include a
variety of biological systems and sulfide precipitation.
5.1.1 Reverse Osmosis
A full-scale reverse osmosis (RO) system was operated at Kendal during mine closure. This
system was able to treat cyanide and nitrate but was only partially effective in thallium
removal. The zeolite system was initially tested and installed as a polishing step to
supplement the RO system. Reverse osmosis treatment was discontinued due to the better
performance of the zeolite system.
5.1.2 Biological Treatment
Biological treatment has been considered and evaluated at Kendall for many years as
summarized in Table 5-1.
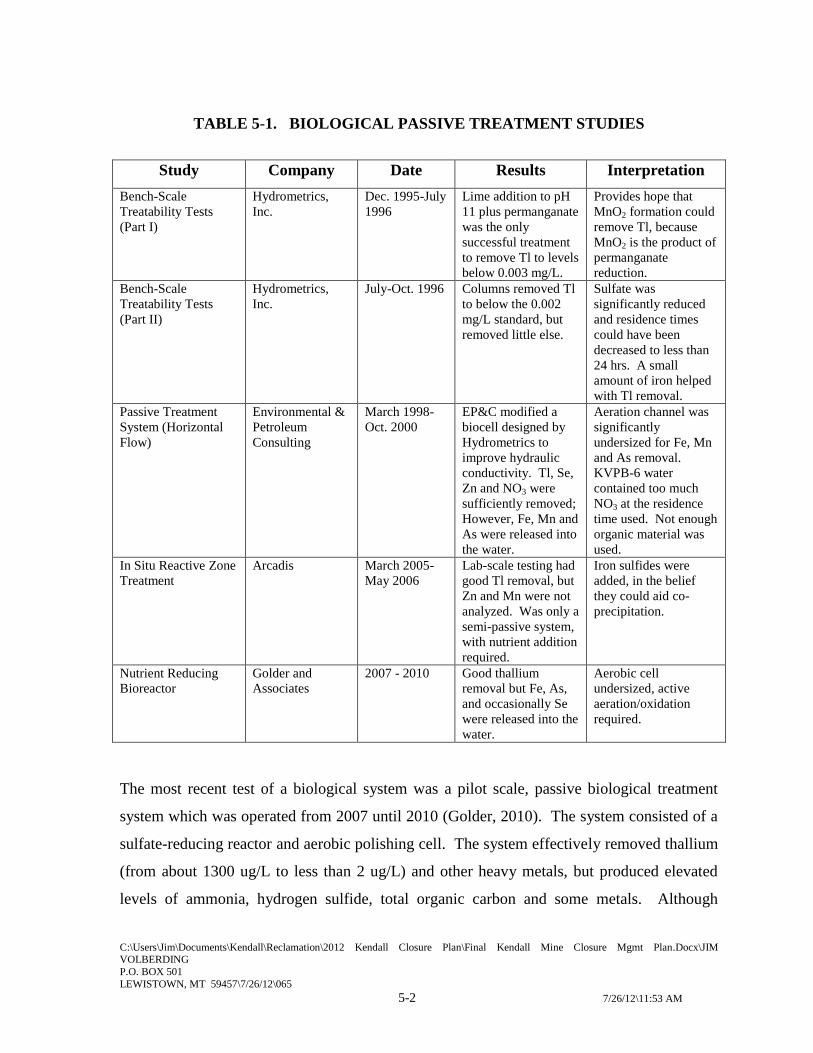
C:\Users\Jim\Documents\Kendall\Reclamation\2012 Kendall Closure Plan\Final Kendall Mine Closure Mgmt Plan.Docx\JIM VOLBERDING
P.O. BOX 501
LEWISTOWN, MT 59457\7/26/12\065
5-2 7/26/12\11:53 AM
TABLE 5-1. BIOLOGICAL PASSIVE TREATMENT STUDIES
Study Company Date Results Interpretation
Bench-Scale
Treatability Tests
(Part I)
Hydrometrics,
Inc.
Dec. 1995-July
1996
Lime addition to pH
11 plus permanganate
was the only
successful treatment
to remove Tl to levels
below 0.003 mg/L.
Provides hope that
MnO2 formation could
remove Tl, because
MnO2 is the product of
permanganate
reduction.
Bench-Scale
Treatability Tests
(Part II)
Hydrometrics,
Inc.
July-Oct. 1996 Columns removed Tl
to below the 0.002
mg/L standard, but
removed little else.
Sulfate was
significantly reduced
and residence times
could have been
decreased to less than
24 hrs. A small
amount of iron helped
with Tl removal.
Passive Treatment
System (Horizontal
Flow)
Environmental &
Petroleum
Consulting
March 1998-
Oct. 2000
EP&C modified a
biocell designed by
Hydrometrics to
improve hydraulic
conductivity. Tl, Se,
Zn and NO3 were
sufficiently removed;
However, Fe, Mn and
As were released into
the water.
Aeration channel was
significantly
undersized for Fe, Mn
and As removal.
KVPB-6 water
contained too much
NO3 at the residence
time used. Not enough
organic material was
used.
In Situ Reactive Zone
Treatment
Arcadis March 2005-
May 2006
Lab-scale testing had
good Tl removal, but
Zn and Mn were not
analyzed. Was only a
semi-passive system,
with nutrient addition
required.
Iron sulfides were
added, in the belief
they could aid co-
precipitation.
Nutrient Reducing
Bioreactor
Golder and
Associates
2007 - 2010 Good thallium
removal but Fe, As,
and occasionally Se
were released into the
water.
Aerobic cell
undersized, active
aeration/oxidation
required.
The most recent test of a biological system was a pilot scale, passive biological treatment
system which was operated from 2007 until 2010 (Golder, 2010). The system consisted of a
sulfate-reducing reactor and aerobic polishing cell. The system effectively removed thallium
(from about 1300 ug/L to less than 2 ug/L) and other heavy metals, but produced elevated
levels of ammonia, hydrogen sulfide, total organic carbon and some metals. Although

C:\Users\Jim\Documents\Kendall\Reclamation\2012 Kendall Closure Plan\Final Kendall Mine Closure Mgmt Plan.Docx\JIM VOLBERDING
P.O. BOX 501
LEWISTOWN, MT 59457\7/26/12\065
5-3 7/26/12\11:53 AM
effective for thallium removal, this system produced a poor overall effluent quality that
would require a large active aeration/oxidation system to remedy.
5.1.3 Sulfide Precipitation
Sodium sulfide addition was evaluated in bench tests in the 1990s, with mixed results
(Hydrometrics, 1996). Thallium was effectively removed, probably through coprecipitation,
when concentrations of iron, zinc or manganese were relatively high. Sulfide precipitation
was viewed as a possible pretreatment step, to reduce thallium concentrations prior to
“polishing” with zeolites or biological treatment. It may be possible to improve the
efficiency of sulfide precipitation through modifications such as pH adjustment, longer
residence times or use of sodium hydrosulfide in place of sodium sulfide. However, based
on the simplicity and effectiveness of zeolite treatment, sulfide precipitation was not pursued
further.
5.2 ZEOLITE PILOT TEST RESULTS
Zeolites have been proven to very effective in removing thallium from mine water through
bench- and pilot-scale testing, and through operating a 100 gpm, full-scale treatment system
at the Kendall Mine for over 10 years. This zeolite treatment system is advantageous in that
it is effective, simple to operate and generates an innocuous, non-hazardous waste product
(spent zeolites). TCLP testing indicates that the thallium is effectively sequestered on the
zeolites, with less than one percent of the thallium being mobile.
Although the current full-scale operating system is very effective, a review of previous
bench-scale testing, current operational results, and discussions with zeolite providers
suggested that higher loading capacities might be achievable with different zeolite mineral
species. Previous zeolite systems at Kendall have employed the zeolite chabazite. To
evaluate performance of the zeolite clinoptilolite, several sets of bench tests were run using
clinoptilolite of different size gradations and from different suppliers in 2010. The bench test
results were promising and led Kendall personnel to operate two pilot tests on-site as
described in the following subsections.

C:\Users\Jim\Documents\Kendall\Reclamation\2012 Kendall Closure Plan\Final Kendall Mine Closure Mgmt Plan.Docx\JIM VOLBERDING
P.O. BOX 501
LEWISTOWN, MT 59457\7/26/12\065
5-4 7/26/12\11:53 AM

C:\Users\Jim\Documents\Kendall\Reclamation\2012 Kendall Closure Plan\Final Kendall Mine Closure Mgmt Plan.Docx\JIM VOLBERDING
P.O. BOX 501
LEWISTOWN, MT 59457\7/26/12\065
5-5 7/26/12\11:53 AM
5.2.1 Steelhead Clinoptilolite
The first pilot test using 14x40 mesh clinoptilolite (zeolite) from Steelhead Specialty
Minerals was operated at the Kendall site from November 29, 2010 until February 2, 2011
(65 days). Operation and results of the pilot test are described in Appendix E and are
summarized as follows:
Five small columns (24-inch diameter, each containing approximately 8 cubic feet or
400 lbs of zeolite material) were operated in series using gravity flow at a constant
flow rate.
Influent concentration was 0.6 mg/L thallium, which is very representative of
anticipated site conditions.
The test was terminated after thallium breakthrough above the minimum detection
limit of 0.0002 mg/L was consistently measured in final column effluent.
Nearly 500,000 gallons of North End pumpback water were treated successfully
during the test.
A higher thallium adsorption capacity (delayed breakthrough) was noted at a lower
flow rate.
Water quality parameters other than thallium were not affected by zeolite treatment.
Clinoptilolite in the first column achieved a thallium loading of 0.376 percent.
Spent zeolite material was tested by TCLP and the adsorbed thallium was found to be
essentially non-leachable as less than 1 percent of the thallium was liberated.
Overall, the pilot test was highly successful as mine water was treated for over 65 days with
no thallium detected in the effluent and no operational difficulties.
C:\Users\Jim\Documents\Kendall\Reclamation\2012 Kendall Closure Plan\Final Kendall Mine Closure Mgmt Plan.Docx\JIM VOLBERDING
P.O. BOX 501
LEWISTOWN, MT 59457\7/26/12\065
5-6 7/26/12\11:53 AM
5.2.2 St. Cloud Clinoptilolite
The second pilot test using 16x50 mesh St. Cloud clinoptilolite was operated immediately
after the first test, from February 7, 2011 until June 6, 2011 (120 days). Operation and
results of the pilot test are described in Appendix F and are summarized as follows:
The same five small columns used in the first test were operated in series using
gravity flow and constant flow rate.
The average influent thallium concentration of 0.379 mg/L in this test was somewhat
lower than the first test but is still within anticipated future mixed mine water quality
as described in Section 4.0.
The test was terminated after a thallium concentration above the minimum detection
limit of 0.0002 mg/L (“breakthrough”) was consistently measured in Column 5
effluent. Approximately 869,000 gallons of North End pumpback water were treated
during the St. Cloud Clinoptilolite test.
A low flow rate of 5 gpm was used throughout the test because a higher thallium
adsorption capacity (delayed breakthrough) was noted at this low flow rate in Test #1.
Water quality parameters other than thallium were again unaffected by zeolite
treatment.
Clinoptilolite in the first column achieved a thallium loading of 0.32 percent.
Spent zeolite material was tested by TCLP and the adsorbed thallium was found to be
essentially non-leachable as less than 1 percent of the thallium was liberated.
Overall, the pilot test was highly successful as mine water was treated for 120 days with no
thallium detected in the effluent. It was noted in this test that some clogging of the media
occurred due to suspended solids (primarily algae) in the influent water. The solids were
effectively removed by pre-filtration and as the result of this experience; the long-term water
treatment system incorporates media-filtration prior to zeolite treatment.

C:\Users\Jim\Documents\Kendall\Reclamation\2012 Kendall Closure Plan\Final Kendall Mine Closure Mgmt Plan.Docx\JIM VOLBERDING
P.O. BOX 501
LEWISTOWN, MT 59457\7/26/12\065
6-1 7/26/12\11:53 AM
6.0 PROPOSED WATER TREATMENT SYSTEM
The selected method for long-term removal of thallium from mine waters is zeolite
adsorption. The proposed water treatment system (Figure 6-1) consists of the following
steps/elements:
Primary water storage will be provided by Pond 7 with supplemental storage by Pond
8.
The treatment system will be located at the existing water treatment building.
Existing storage Pond 2B will serve as a feed water pond with surge capacity
provided by existing Pond 3B.
Media filtration will be provided to remove suspended solids prior to zeolite
treatment.
Zeolite treatment will occur in the existing zeolite columns using primarily
clinoptilolite zeolite. Chabazite zeolite may also be used.
Effluent will be monitored as needed to ensure proper operation and thallium removal
prior to discharge to the Kendall Pit.
Water treatment residuals (spent zeolites and suspended solids) will be placed in Pond
7.
6.1 DESIGN CRITERIA
The design criteria for the zeolite treatment system are:
1. Inflow rates to storage ponds will be seasonally variable and similar to previously
observed pumpback system flow rates and HELP model predicted pad drainage rates
as described in Sections 3.0 and 4.0. Total average annual flow is expected to be
approximately 65 gpm (61 gpm pumpback flows and 4 gpm pad drainage).
2. Typical treatment flow rates average 80 gpm but could range from 60 to 100 gpm. If
inflow rates do not provide sufficient water to meet minimum treatment system flows,
continuous treatment will be temporarily suspended until sufficient water is available
(i.e., treatment plant will run in batch mode).

C:\Users\Jim\Documents\Kendall\Reclamation\2012 Kendall Closure Plan\Final Kendall Mine Closure Mgmt Plan.Docx\JIM VOLBERDING
P.O. BOX 501
LEWISTOWN, MT 59457\7/26/12\065
6-2 7/26/12\11:53 AM
FIGURE 6-1. WATER TREATMENT SYSTEM SCHEMATIC
C:\Users\Jim\Documents\Kendall\Reclamation\2012 Kendall Closure Plan\Final Kendall Mine Closure Mgmt Plan.Docx\JIM VOLBERDING
P.O. BOX 501
LEWISTOWN, MT 59457\7/26/12\065
6-3 7/26/12\11:53 AM
3. Influent water quality initially will be similar to the range of concentrations predicted
by the mixing model (summarized in Table 4-1) and will be treated to remove
thallium as necessary to meet water quality standards.
4. Future influent thallium concentrations will decrease due to diminishing mine water
concentrations.
5. Influent and effluent water quality will be monitored routinely to ensure compliance
with water quality standards. In the event effluent water quality does not meet
discharge limits, contingency actions will be taken to prevent release to groundwater.
Contingency actions are described in Section 7.0 and would include storage and
blending of water, return of treated water to storage ponds, or land application of
water to reduce nitrate or cyanide concentrations.
6.2 STORAGE OF WATERS BEFORE TREATMENT
Prior to treatment, water will be stored in a series of four ponds with a total capacity of
approximately 20.5 million gallons (see Figure 4-1, Section 4.0). Typical operation of the
ponds is as follows:
1. Water from all sources initially flows or is pumped to Pond 7 (5.47 Mgal) where the
water becomes mixed and is stored.
2. Pond 7 has an overflow line that conveys water to Pond 8 (13.3 Mgal) when Pond 7 is
full and inflow exceeds outflow to Pond 2B and treatment. Pond 8 is typically
operated as an overflow pond with no outflow except a return line to Pond 7.
3. From Pond 7, water is pumped to Pond 2B (0.45 Mgal) which functions as the feed
water pond for the water treatment plant.
4. Pond 3B (1.32 Mgal) is connected to Pond 2B via overflow line and Pond 3B
functions as a surge pond to help buffer Pond 2B inflows with water treatment plant
withdrawals.
5. Water is pumped from Pond 2B to the treatment plant for thallium removal.
Other water routing options are possible with the existing pond layout and alternative
operating approaches could be used for pond maintenance or for other contingency purposes.
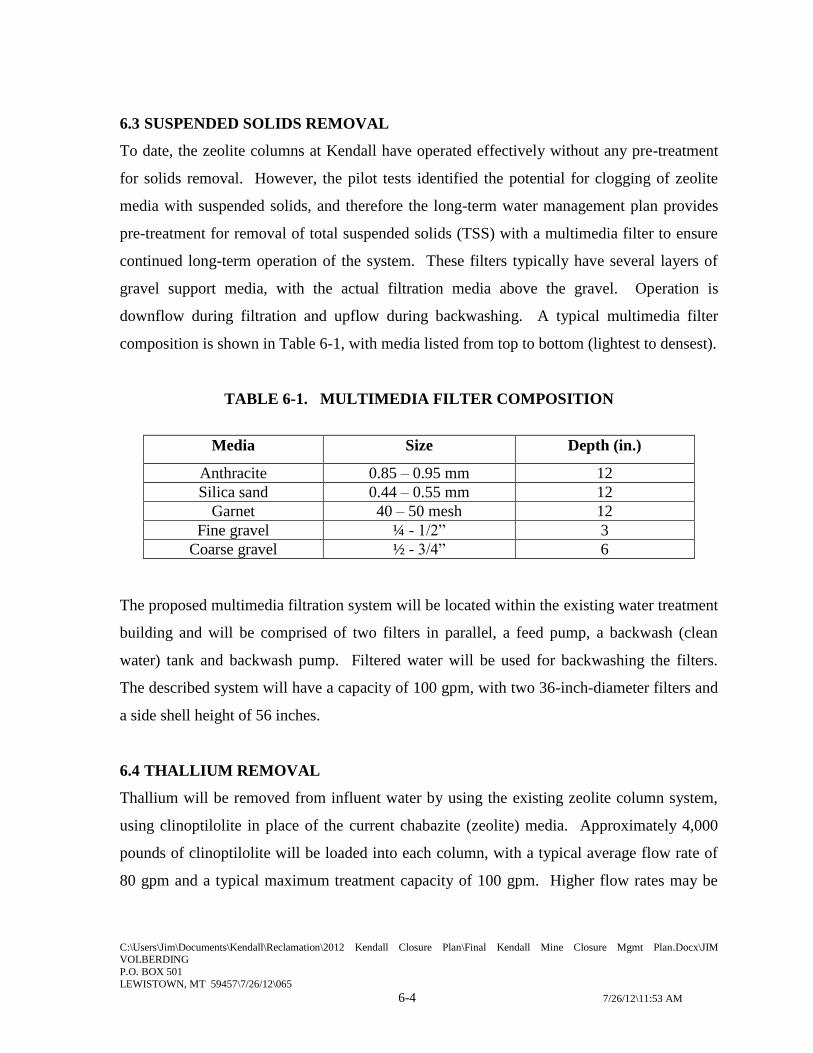
C:\Users\Jim\Documents\Kendall\Reclamation\2012 Kendall Closure Plan\Final Kendall Mine Closure Mgmt Plan.Docx\JIM VOLBERDING
P.O. BOX 501
LEWISTOWN, MT 59457\7/26/12\065
6-4 7/26/12\11:53 AM
6.3 SUSPENDED SOLIDS REMOVAL
To date, the zeolite columns at Kendall have operated effectively without any pre-treatment
for solids removal. However, the pilot tests identified the potential for clogging of zeolite
media with suspended solids, and therefore the long-term water management plan provides
pre-treatment for removal of total suspended solids (TSS) with a multimedia filter to ensure
continued long-term operation of the system. These filters typically have several layers of
gravel support media, with the actual filtration media above the gravel. Operation is
downflow during filtration and upflow during backwashing. A typical multimedia filter
composition is shown in Table 6-1, with media listed from top to bottom (lightest to densest).
TABLE 6-1. MULTIMEDIA FILTER COMPOSITION
Media Size Depth (in.)
Anthracite 0.85 – 0.95 mm 12
Silica sand 0.44 – 0.55 mm 12
Garnet 40 – 50 mesh 12
Fine gravel ¼ - 1/2” 3
Coarse gravel ½ - 3/4” 6
The proposed multimedia filtration system will be located within the existing water treatment
building and will be comprised of two filters in parallel, a feed pump, a backwash (clean
water) tank and backwash pump. Filtered water will be used for backwashing the filters.
The described system will have a capacity of 100 gpm, with two 36-inch-diameter filters and
a side shell height of 56 inches.
6.4 THALLIUM REMOVAL
Thallium will be removed from influent water by using the existing zeolite column system,
using clinoptilolite in place of the current chabazite (zeolite) media. Approximately 4,000
pounds of clinoptilolite will be loaded into each column, with a typical average flow rate of
80 gpm and a typical maximum treatment capacity of 100 gpm. Higher flow rates may be

C:\Users\Jim\Documents\Kendall\Reclamation\2012 Kendall Closure Plan\Final Kendall Mine Closure Mgmt Plan.Docx\JIM VOLBERDING
P.O. BOX 501
LEWISTOWN, MT 59457\7/26/12\065
6-5 7/26/12\11:53 AM
accommodated with the system but would generally be avoided as higher flow rates would
result in lower thallium loadings and greater zeolite consumption.
Pilot testing showed that thallium adsorption was enhanced at lower flow rates, but full-scale
experience demonstrates this enhancement occurs only up to a point. In the full-scale
system, treatment efficiency is reduced at very low flow rates due to lack of fluidization of
the zeolite media. Therefore, the typical minimum flow rate to the system will be 60 gpm. If
flows to the treatment plant are too low to maintain a consistent flow of 60 gpm or greater,
the system will be operated in batch mode (i.e., cycled on and off as needed). Since thallium
adsorption to zeolites is a physical/chemical process, this operation at “non-steady state” will
not compromise treatment efficiency.
Pilot testing and previous full-scale operations have shown that zeolites will adsorb more
thallium when exposed to higher concentrations, as is typical with adsorbents. To maximize
thallium loading on the zeolite material, zeolite in each column will be transferred backward
(upstream) periodically, with fresh material being loaded into Column 5 (the effluent, or
downstream end of the system) and material from Column 1 (the beginning or influent end of
the system) being discarded. It is anticipated that zeolite will be transferred by slurrying it
with treated water, and pumping it from one column to another. In addition, influent
concentrations may be managed by adjusting source flows (i.e., pumpback systems and pad
drainage flows) to increase removal efficiency.
The design of the proposed treatment system is primarily, but not exclusively, based on the
use of clinoptilolite zeolite media since testing has shown that this zeolite species has the
highest thallium loading capacity at the lowest cost. Two suppliers (St. Cloud Minerals and
Steelhead Specialty Minerals) of clinoptilolite zeolite have been identified and their products
have been tested extensively during the pilot tests. It is likely that both clinoptilolite
suppliers could be used from time to time. However, it should also be noted that chabazite
(zeolite) was used to remove thallium at Kendall for many years, and chabazite continues to
constitute an effective treatment media, capable of reaching the required effluent
concentrations, but at somewhat lower loading rates, and potentially higher cost, than

C:\Users\Jim\Documents\Kendall\Reclamation\2012 Kendall Closure Plan\Final Kendall Mine Closure Mgmt Plan.Docx\JIM VOLBERDING
P.O. BOX 501
LEWISTOWN, MT 59457\7/26/12\065
6-6 7/26/12\11:53 AM
clinoptilolite. Therefore, it is also possible that chabazite media may be used in the future
should the need arise (e.g., a lapse in clinoptilolite production) or should conditions favor
chabazite (e.g., excessive clinoptilolite cost).
6.5 TREATED WATER DISPOSAL
Treated water will flow to the backwash water tank (capacity of approximately 1,000
gallons) for re-use in the multi-media filtration system or to groundwater discharge at the
Kendall Pit.
6.6 CHARACTERISTICS AND DISPOSAL OF TREATMENT RESIDUALS
Treatment residuals will consist of TSS from multimedia backwashing and spent zeolite
media. Backwash water containing TSS from the water multimedia filter will be transferred
back to Pond 7. Spent zeolites will also be placed and disposed in Pond 7.
Operational experience with the full size zeolite columns and the pilot test columns indicates
that the TSS material is largely algae or other biological growth and very fine-grained
sediment (clay and silt) and possibly mineral precipitates (i.e., iron and manganese oxides or
other scale).
Spent zeolites contain approximately 0.3 percent thallium adsorbed from water in the
treatment system. At the conclusion of the pilot tests, spent zeolites from column 1 (highest
loaded material) was subjected to whole rock or total digestion metals analysis, Toxicity
Characteristic Leaching Procedure (TCLP), and Synthetic Precipitation Leaching Procedure
(SPLP) tests. Each sample was a composite sample from within the column, as the zeolites
were mixed with an air hose prior to sampling. Leaching results for the eight RCRA metals
plus thallium for pilot test zeolites are shown in Table 6-2. Since all metals other than
thallium were non-detect, this spent material is classified as nonhazardous waste. In
addition, the SPLP results indicate a low leachability of thallium with precipitation water,
thus the zeolites are not expected to release thallium to the mine water during disposal in
Pond 7.

C:\Users\Jim\Documents\Kendall\Reclamation\2012 Kendall Closure Plan\Final Kendall Mine Closure Mgmt Plan.Docx\JIM VOLBERDING
P.O. BOX 501
LEWISTOWN, MT 59457\7/26/12\065
6-7 7/26/12\11:53 AM
TABLE 6-2. SPENT ZEOLITE TOTAL METALS AND LEACH TEST RESULTS
St. Cloud Clinoptiloloite Steelhead Clinoptilolite
Metal
Total
Metals
(mg/kg)
TCLP
(mg/L)
SPLP
(mg/L)
Total
Metals
(mg/kg)
TCLP
(mg/L)
SPLP
(mg/L)
Arsenic 10 < 0.5 < 0.5 13 < 0.5 < 0.5
Barium 232 < 10 < 1 784 < 10 < 1
Cadmium <1 < 0.1 < 0.1 <1 < 0.1 < 0.1
Chromium <5 < 0.5 < 0.5 <5 < 0.5 < 0.5
Lead 5 < 0.5 < 0.5 8 < 0.5 < 0.5
Mercury <1 < 0.02 < 0.02 <1 < 0.02 < 0.02
Selenium <5 < 0.1 < 0.1 <5 < 0.1 < 0.1
Silver <5 < 0.5 < 0.5 <5 < 0.5 < 0.5
Thallium 3,160 1.89 0.08 3,760 2.66 <0.5
The quantity of zeolites required in the treatment system can be estimated based on the range
of flow rates and thallium concentrations of predicted water treatment plant inflow. Table
6-3 shows the zeolite requirements for the dry, normal, and wet flow conditions and thallium
concentration ranges evaluated in the mixing model (Section 4.0). Annual zeolite
requirements are predicted to average approximately 32,000 lbs/yr and could range from less
than 15,000 to nearly 70,000 lbs/yr. The quantity of zeolites required is expected to decrease
in the future as site-wide thallium concentrations continue to decrease.
The volume of spent zeolites requiring disposal in Pond 7 can be similarly estimated as
shown in Table 6-3. Given a zeolite density of 50 lbs/cubic foot, on average approximately
650 cubic feet or a little less than 5,000 gallons of zeolite would be generated each year. At
this initial zeolite generation rate, disposal of spent zeolites in Pond 7 (5.47 Mgal) would
consume a little less than 0.1 percent of the storage capacity in Pond 7 per year or 5 percent
of Pond 7 storage capacity over the next 50 years. Since all pumpback water and pad
drainage is predicted to meet water quality standards within the next 50 years, disposal of
zeolites in Pond 7 is not expected to significantly reduce the available pond water storage
capacity.
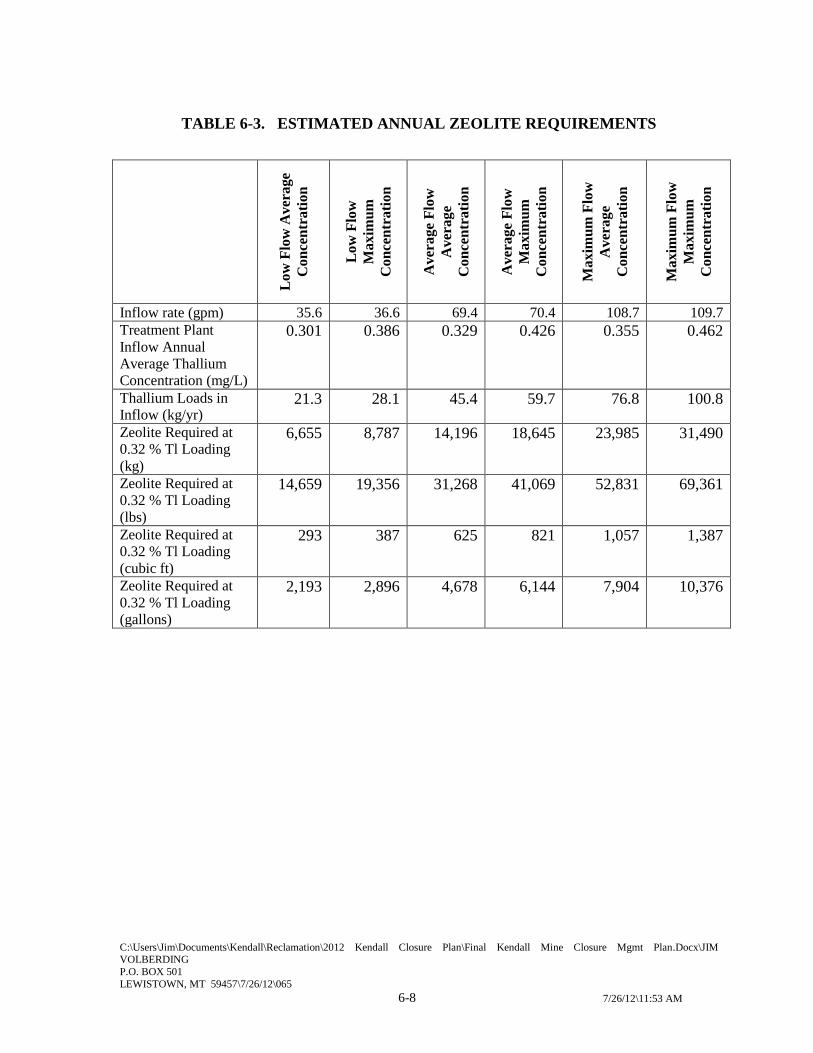
C:\Users\Jim\Documents\Kendall\Reclamation\2012 Kendall Closure Plan\Final Kendall Mine Closure Mgmt Plan.Docx\JIM VOLBERDING
P.O. BOX 501
LEWISTOWN, MT 59457\7/26/12\065
6-8 7/26/12\11:53 AM
TABLE 6-3. ESTIMATED ANNUAL ZEOLITE REQUIREMENTS
Lo
w F
low
Av
era
ge
Co
nce
ntr
ati
on
Lo
w F
low
Ma
xim
um
Co
nce
ntr
ati
on
Av
era
ge
Flo
w
Av
era
ge
Co
nce
ntr
ati
on
Av
era
ge
Flo
w
Ma
xim
um
Co
nce
ntr
ati
on
Ma
xim
um
Flo
w
Av
era
ge
Co
nce
ntr
ati
on
Ma
xim
um
Flo
w
Ma
xim
um
Co
nce
ntr
ati
on
Inflow rate (gpm) 35.6 36.6 69.4 70.4 108.7 109.7
Treatment Plant
Inflow Annual
Average Thallium
Concentration (mg/L)
0.301 0.386 0.329 0.426 0.355 0.462
Thallium Loads in
Inflow (kg/yr) 21.3 28.1 45.4 59.7 76.8 100.8
Zeolite Required at
0.32 % Tl Loading
(kg)
6,655 8,787 14,196 18,645 23,985 31,490
Zeolite Required at
0.32 % Tl Loading
(lbs)
14,659 19,356 31,268 41,069 52,831 69,361
Zeolite Required at
0.32 % Tl Loading
(cubic ft)
293 387 625 821 1,057 1,387
Zeolite Required at
0.32 % Tl Loading
(gallons)
2,193 2,896 4,678 6,144 7,904 10,376

C:\Users\Jim\Documents\Kendall\Reclamation\2012 Kendall Closure Plan\Final Kendall Mine Closure Mgmt Plan.Docx\JIM VOLBERDING
P.O. BOX 501
LEWISTOWN, MT 59457\7/26/12\065
7-1 7/26/12\11:53 AM
7.0 OPERATION, MAINTENANCE AND MONITORING
7.1 SUPPORT FACILITIES
The primary support facilities for the water management system are:
1. The water treatment system, consisting of the multi-media filter system, zeolite
columns and associated buildings, piping, pumps and controls.
2. The pumpback system consisting of wells, pumps and piping.
3. The storage pond system consisting of Ponds 2B, 3B, 7 and 8 and associated piping.
Operation, maintenance and monitoring of the treatment, pumpback, and piping systems has
been conducted routinely by Kendall personnel for the past fifteen years and is expected to
continue throughout the water management plan. These systems consist of materials and
equipment that are commonly used and readily available in the construction industry. Repair
and replacement of these systems is expected to be an ongoing, but routine part of the water
management plan. At times, it may be necessary to temporarily shut down the water
treatment system in order to make repairs. In this case, water will be stored in the ponds until
the treatment system is operational. The zeolite system is not negatively affected by
cessation of flows.
Operation, maintenance and monitoring of the pond systems also has been conducted
routinely by Kendall personnel for the past fifteen years and is expected to continue for the
duration of the water management plan. At times it may be necessary to suspend use of a
pond in order to make repairs or to replace or overlay a pond liner. Because of the ample
storage capacity of the pond system and the multi-pond configuration, this is easily
achievable by taking the pond out of service while the repair is made. The most likely
scenarios would be:
1. In the event Pond 7 needs repair, all pumpback and drainage flows would be diverted
to Pond 8, which would act as the primary mixing and storage pond.

C:\Users\Jim\Documents\Kendall\Reclamation\2012 Kendall Closure Plan\Final Kendall Mine Closure Mgmt Plan.Docx\JIM VOLBERDING
P.O. BOX 501
LEWISTOWN, MT 59457\7/26/12\065
7-2 7/26/12\11:53 AM
2. In the event Pond 8 needs repair, the Pond 7 overflow line to Pond 8 would be closed
until the repair is made.
3. In the event, Pond 2B needs repair, water would be pumped from Ponds 7 or 8
directly to Pond 3B, which would act as the feedwater pond. In this case the
treatment plant would most likely be run in batch mode to ensure a consistent flow of
water.
4. In the event Pond 3B needs repair, 2B would operate in normal mode as the feedwater
pond but the treatment plant would most likely be run in batch mode to ensure a
consistent flow of water.
7.2 MANPOWER REQUIREMENTS
It is anticipated that the water treatment plant will require minimal operator attention, for
tasks including periodic sampling and checking multimedia filter operation, zeolite column
operation and flow rates. An operator may be required for as little as two hours a day, three
times a week. Controls will be used to automatically start and shut down the treatment
system depending on pond levels. An “auto-dialer” will be used to notify an
operator/supervisor off-site in the event of any alarm conditions.
7.3 FUEL AND POWER
The existing power system will be maintained because electricity will be required to operate
the pumpback systems, pump water from the storage ponds to the treatment system, run the
multi-media filtration system, and control the zeolite water treatment system.
Fuel for support vehicles (gasoline and diesel) and propane for heating purposes will be
stored in existing storage tanks on the mine site.
7.4 TRANSPORTATION
The existing road system will be used for transportation of personnel, equipment and water
treatment supplies (zeolites). As described in Section 6.0, an average of approximately 16
tons of zeolites will be required per year.

C:\Users\Jim\Documents\Kendall\Reclamation\2012 Kendall Closure Plan\Final Kendall Mine Closure Mgmt Plan.Docx\JIM VOLBERDING
P.O. BOX 501
LEWISTOWN, MT 59457\7/26/12\065
7-3 7/26/12\11:53 AM

C:\Users\Jim\Documents\Kendall\Reclamation\2012 Kendall Closure Plan\Final Kendall Mine Closure Mgmt Plan.Docx\JIM VOLBERDING
P.O. BOX 501
LEWISTOWN, MT 59457\7/26/12\065
7-4 7/26/12\11:53 AM
7.5 WASTE
The primary waste from the water management system is spent zeolites and suspended solids
from the water treatment plant which will be permanently disposed in Pond 7. Routine
domestic waste will be collected by a waste management contractor and disposed at a
licensed off-site landfill. Oily waste, if any, will be temporarily stored on-site and
periodically removed for recycling or disposal by a licensed handler. No hazardous waste
will be generated, disposed or stored on-site.
7.6 MONITORING
Routine monitoring will continue under the approved water monitoring plan. The water
monitoring plan provides for monitoring of surface water and groundwater throughout the
mine site. Monitoring to support the water management plan will include:
Pumpback flow rates and water quality;
Pad drainage flow rates and water quality;
Water treatment plant inflow and effluent rates and water quality; and
Storage pond water quality.
Monitoring will include field monitoring and analyses (e.g., pH, conductivity, nitrate) to
support treatment plant operation and ensure compliance.
7.7 CONTINGENCY ACTIONS
Contingency actions are actions that could be taken to address non-routine or unexpected
conditions that may arise. Potential contingency actions, and the conditions which may
trigger the need for contingency actions, are described below.
7.7.1 Pond Mixing
As described in Section 4.0, inflow to the storage ponds could exceed applicable water
quality standards or effluent limits for some parameters (particularly nitrate + nitrite) for
short periods of time. However, water quality in the ponds and quality of water flowing to
the water treatment plant is not expected to exceed water quality standards for parameters

C:\Users\Jim\Documents\Kendall\Reclamation\2012 Kendall Closure Plan\Final Kendall Mine Closure Mgmt Plan.Docx\JIM VOLBERDING
P.O. BOX 501
LEWISTOWN, MT 59457\7/26/12\065
7-5 7/26/12\11:53 AM
other than thallium, due to mixing in the ponds. To ensure that sufficient mixing occurs, the
ponds will be routinely monitored for pH, specific conductivity, and nitrate using field
meters or a field test kit (Hach kit or equivalent). If pond water is found to exceed the water
quality standard for nitrate (10 mg/L), one or more of the following contingency actions
would be taken:
1. A water sample will be collected and submitted for laboratory confirmation analysis
to determine if the sample meets water quality standards for all parameters except
thallium (which would be removed by the water treatment system). If laboratory
analysis indicates that water quality standards are met (except for thallium) then the
water will be treated for thallium and released according to normal operating
protocols.
2. If laboratory analysis indicates that water quality standards are not met only for
nitrate +nitrite or cyanide, the water could be treated for thallium removal and then
land applied for nitrate + nitrite and cyanide removal in accordance with the mine
operating permit.
3. Water could be held further in the ponds to allow for more mixing and dilution.
4. The ponds could be modified to promote better mixing (e.g., baffles, curtains,
pumping or other means to control circulation and mixing).
7.7.2 Land Application
The land application area has been used effectively for treatment and discharge of mine
water. The land application area is fully reclaimed and re-vegetated and will not be disturbed
by application of water at agronomic uptake rates. Although use of the land application area
is not anticipated, it will be retained as a contingency component of the water management
system. If unforeseen conditions arise, the land application area could be used as a
supplemental water treatment method for removal of nitrogen compounds (nitrate, nitrite,
ammonia, cyanide) by vegetative uptake after thallium removal.

C:\Users\Jim\Documents\Kendall\Reclamation\2012 Kendall Closure Plan\Final Kendall Mine Closure Mgmt Plan.Docx\JIM VOLBERDING
P.O. BOX 501
LEWISTOWN, MT 59457\7/26/12\065
7-6 7/26/12\11:53 AM
7.7.3 Zeolite Disposal
Spent zeolite material has been tested and found to be non-hazardous and non-leaching. The
volume of zeolites that will be generated annually is expected to comprise less than 0.1
percent of Pond 7 volume and less than 0.02 percent of the total pond capacity. The quantity
of zeolite waste generated is expected to decrease as thallium concentrations in mine water
continue to decline. Based on current declining trends, thallium concentrations are predicted
to meet water quality standards (background concentrations) within the next 40 years, at
which time zeolite treatment for thallium removal will no longer be needed and spent zeolite
generation will cease.
In the event that zeolite generation is higher than anticipated and adversely affects pond
storage capacity and/or water treatment plant operation, zeolites would either be 1)
transported off-site and disposed at a non-hazardous landfill; or 2) stored in a purpose-built,
on-site repository.

C:\Users\Jim\Documents\Kendall\Reclamation\2012 Kendall Closure Plan\Final Kendall Mine Closure Mgmt Plan.Docx\JIM VOLBERDING
P.O. BOX 501
LEWISTOWN, MT 59457\7/26/12\065
8-1 7/26/12\11:53 AM
8.0 REFERENCES
CDM, 2004. Draft CR Kendall Process Pad Cover Alternatives. Memorandum to Kathy
Johnson (MDEQ) from Randy Huffsmith and Steve Downs (CDM).
CR Kendall, 2011. Request for Permit Revision #11-001 to Operating Permit #00122. July
6, 2011.
Golder, 2006. Kendall Mine Passive Treatment Data Assessment. July.
Golder, 2010. Nuisance Constituents in Passive Water Treatment Systems—a Specific Case
Study, presented at the 2010 National Meeting of the American Society of Mining and
Reclamation.
Hydrometrics, Inc., 1996. Bench-Scale Treatability Tests for Surface Water at the CR
Kendall Mine, Part II. July.
MDEQ, 1999. Background Hydrochemistry Conditions. Memo by Terry Webster (MDEQ).
February 22, 1999.
MDEQ, 2001. Draft Checklist Environmental Assessment on the Final Reclamation Plan for
the CR Kendall Mine” August 21, 2001
USEPA, 1994. “The Hydrologic Evaluation of Landfill Performance (HELP) Model Version
3.07,” EPA/600/9-94. U.S. Environmental Protection Agency Risk Reduction
Engineering Laboratory. 1994. Version 3.07, revised November 1, 1997.
Water Management Consultants (WMC), 2003. Kendall Mine Evaluation of Recent
Monitoring Data and Updated Assessment of Background Chemistry. Prepared for
Kendall Mine. December, 2003.
Womack and Associates, Inc., 2005. CR Kendall 2004 Geotechnical Summary – Cover
Materials Sampling and Testing. Prepared for CR Kendall, June 2005.
C:\Users\Jim\Documents\Kendall\Reclamation\2012 Kendall Closure Plan\Final Kendall Mine Closure Mgmt Plan.Docx\JIM
VOLBERDING P.O. BOX 501
LEWISTOWN, MT 59457\7/26/12\065
7/26/12\11:53 AM
APPENDIX A
HELP MODEL

C:\Users\Jim\Documents\Kendall\Reclamation\2012 Kendall Closure Plan\Final Kendall Mine Closure Mgmt Plan.Docx\JIM
VOLBERDING P.O. BOX 501
LEWISTOWN, MT 59457\7/26/12\065
7/26/12\11:53 AM
APPENDIX B
WATER QUALITY STATISTICAL SUMMARIES

C:\Users\Jim\Documents\Kendall\Reclamation\2012 Kendall Closure Plan\Final Kendall Mine Closure Mgmt Plan.Docx\JIM
VOLBERDING P.O. BOX 501
LEWISTOWN, MT 59457\7/26/12\065
7/26/12\11:53 AM
APPENDIX C
WATER QUALITY GRAPHS
AND TREND ANALYSIS

C:\Users\Jim\Documents\Kendall\Reclamation\2012 Kendall Closure Plan\Final Kendall Mine Closure Mgmt Plan.Docx\JIM
VOLBERDING P.O. BOX 501
LEWISTOWN, MT 59457\7/26/12\065
7/26/12\11:53 AM
APPENDIX D
PREDICTED WEEKLY POND
OUTFLOW CONCENTRATIONS

C:\Users\Jim\Documents\Kendall\Reclamation\2012 Kendall Closure Plan\Final Kendall Mine Closure Mgmt Plan.Docx\JIM
VOLBERDING P.O. BOX 501
LEWISTOWN, MT 59457\7/26/12\065
7/26/12\11:53 AM
APPENDIX E
STEELHEAD CLINOPTILOLITE
ZEOLITE PILOT TEST
C:\Users\Jim\Documents\Kendall\Reclamation\2012 Kendall Closure Plan\Final Kendall Mine Closure Mgmt Plan.Docx\JIM
VOLBERDING P.O. BOX 501
LEWISTOWN, MT 59457\7/26/12\065
7/26/12\11:53 AM
APPENDIX F
ST. CLOUD CLINOPTILOLITE
ZEOLITE PILOT TEST

C:\Users\Jim\Documents\Kendall\Reclamation\2012 Kendall Closure Plan\Final Kendall Mine Closure Mgmt Plan.Docx\JIM
VOLBERDING P.O. BOX 501
LEWISTOWN, MT 59457\7/26/12\065
7/26/12\11:53 AM
EXHIBIT 1
MINE FACILITIES AND RECLAMATION STATUS

C:\Users\Jim\Documents\Kendall\Reclamation\2012 Kendall Closure Plan\Final Kendall Mine Closure Mgmt Plan.Docx\JIM
VOLBERDING P.O. BOX 501
LEWISTOWN, MT 59457\7/26/12\065
7/26/12\11:53 AM
EXHIBIT 2
WATER MANAGEMENT SYSTEM


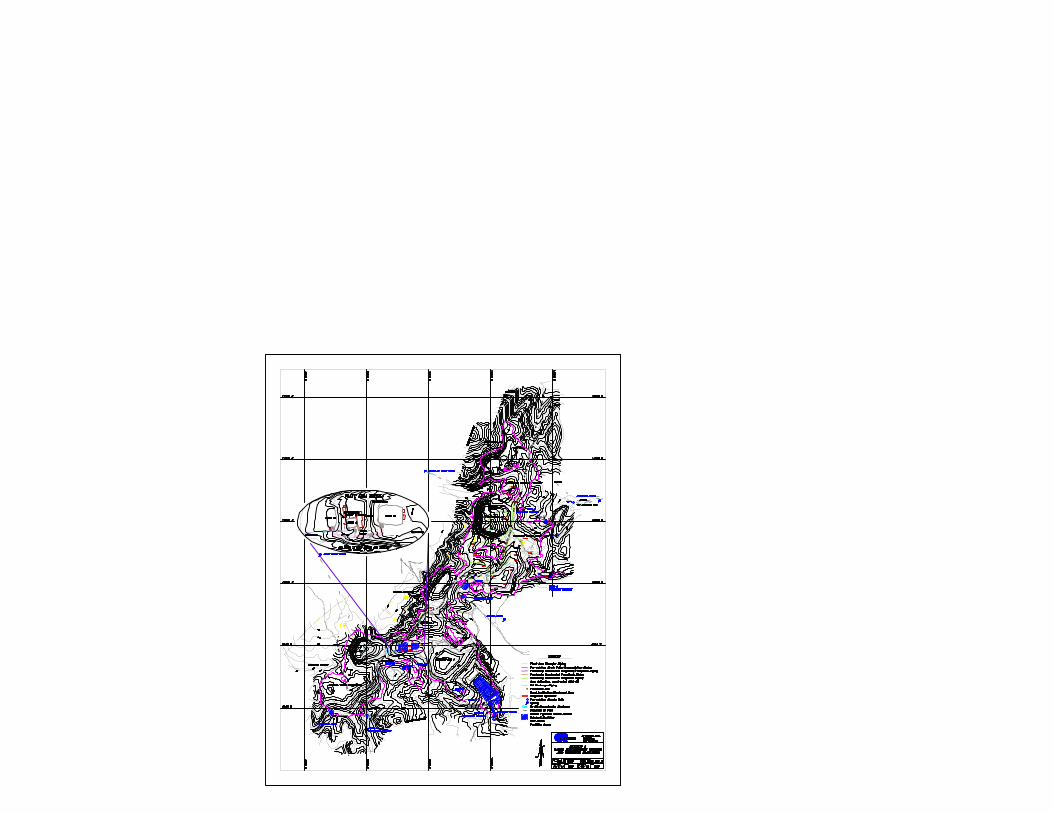
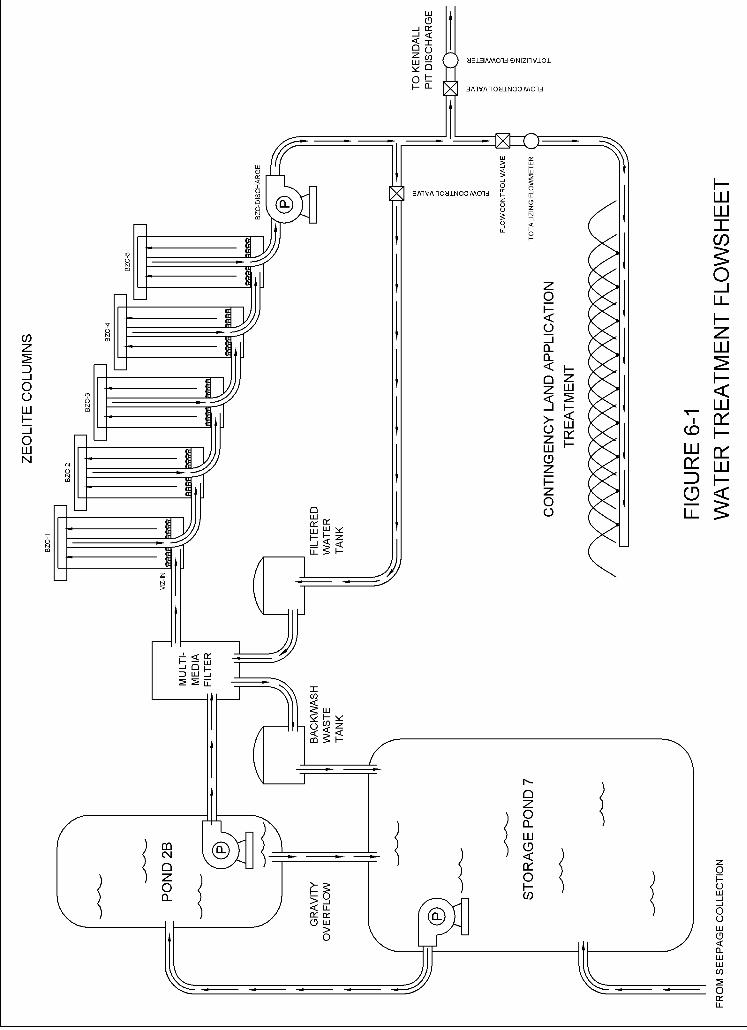

C:\Users\Jim\Documents\Kendall\Reclamation\2012 Kendall Closure Plan\Appendix E Zeolite Pilot Test 1.Doc\Jim Volberding
P.O. Box 501
Lewistown, MT 59457\7/26/12\065
1 7/26/12 11:52 AM
TECHNICAL MEMORANDUM
DATE: December 7, 2011
TO: Scott Mason
Jim Volberding
FROM: Mark Reinsel
SUBJECT: Summary Report - Zeolite Pilot Test #1, Steelhead Clinoptilolite
Summary
Pilot Test #1 using 14x40 mesh clinoptilolite (zeolite) from Steelhead Specialty Minerals was
operated at the Kendall site from November 29, 2010 until February 2, 2011 (65 days). Five
small columns were operated in series using gravity flow. The test was terminated after thallium
breakthrough above the minimum detection limit of 0.0002 mg/L was consistently measured in
Column 5 effluent. Nearly 500,000 gallons of North End pumpback water were treated during
the test.
The pilot test was operated at constant flow to avoid bed packing. A higher thallium adsorption
capacity (delayed breakthrough) was noted at a lower flow rate. Water quality parameters other
than thallium were not affected by zeolite treatment. The influent concentration of 0.6 mg/L
thallium in this test was very representative of anticipated site conditions.
Leach testing of the spent zeolites showed that they are classified as nonhazardous waste. A
thallium loading of 0.376% was measured in the Column 1 material. A mass balance between
the thallium adsorbed to the zeolites, and the thallium removed from water passing through the
columns, agreed within about 20 percent.
Test Setup
On November 29, 2010, Kendall Mine personnel began operating a pilot test using zeolites of a
different type and smaller size, compared to the zeolites used in the old carbon columns at the
site. The new material, 14x40 mesh clinoptilolite from Steelhead Specialty Minerals, was used
in Zeolite Pilot Test #1. The previous zeolites are 8x20 mesh chabazite from St. Cloud Minerals.
A schematic of the pilot test system using “mini-columns” is shown in Figure 1. Figure 2 is a
photo of the system.
Phone: 406-493-0368 Fax: 406-493-0368 Email: [email protected]
4050 Fieldstone Crossing Missoula, MT 59802
http://apexengineering.us
Apex Engineering, PLLC

C:\Users\Jim\Documents\Kendall\Reclamation\2012 Kendall Closure Plan\Appendix E Zeolite Pilot Test 1.Doc\Jim Volberding
P.O. Box 501
Lewistown, MT 59457\7/26/12\065
2 7/26/12 11:52 AM
FIGURE 1. MINI ZEOLITE COLUMN PROFILE
FIGURE 2. MINI-COLUMNS FOR PILOT TESTING
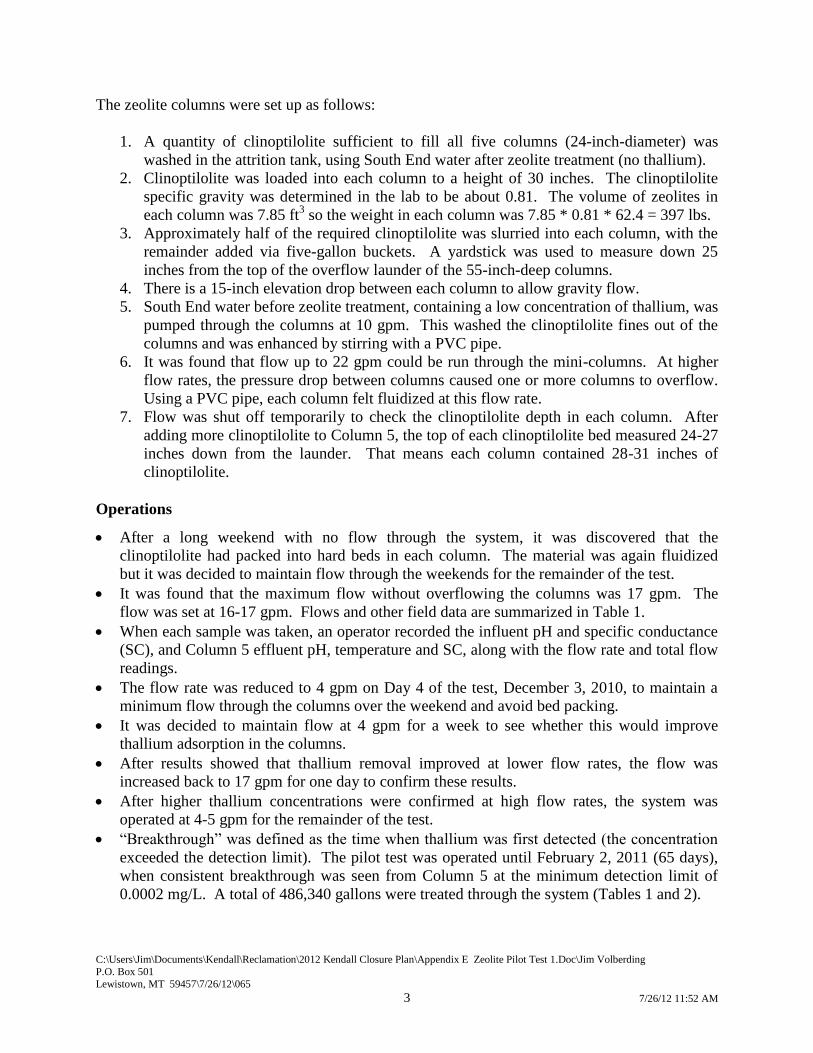
C:\Users\Jim\Documents\Kendall\Reclamation\2012 Kendall Closure Plan\Appendix E Zeolite Pilot Test 1.Doc\Jim Volberding
P.O. Box 501
Lewistown, MT 59457\7/26/12\065
3 7/26/12 11:52 AM
The zeolite columns were set up as follows:
1. A quantity of clinoptilolite sufficient to fill all five columns (24-inch-diameter) was
washed in the attrition tank, using South End water after zeolite treatment (no thallium).
2. Clinoptilolite was loaded into each column to a height of 30 inches. The clinoptilolite
specific gravity was determined in the lab to be about 0.81. The volume of zeolites in
each column was 7.85 ft3 so the weight in each column was 7.85 * 0.81 * 62.4 = 397 lbs.
3. Approximately half of the required clinoptilolite was slurried into each column, with the
remainder added via five-gallon buckets. A yardstick was used to measure down 25
inches from the top of the overflow launder of the 55-inch-deep columns.
4. There is a 15-inch elevation drop between each column to allow gravity flow.
5. South End water before zeolite treatment, containing a low concentration of thallium, was
pumped through the columns at 10 gpm. This washed the clinoptilolite fines out of the
columns and was enhanced by stirring with a PVC pipe.
6. It was found that flow up to 22 gpm could be run through the mini-columns. At higher
flow rates, the pressure drop between columns caused one or more columns to overflow.
Using a PVC pipe, each column felt fluidized at this flow rate.
7. Flow was shut off temporarily to check the clinoptilolite depth in each column. After
adding more clinoptilolite to Column 5, the top of each clinoptilolite bed measured 24-27
inches down from the launder. That means each column contained 28-31 inches of
clinoptilolite.
Operations
After a long weekend with no flow through the system, it was discovered that the
clinoptilolite had packed into hard beds in each column. The material was again fluidized
but it was decided to maintain flow through the weekends for the remainder of the test.
It was found that the maximum flow without overflowing the columns was 17 gpm. The
flow was set at 16-17 gpm. Flows and other field data are summarized in Table 1.
When each sample was taken, an operator recorded the influent pH and specific conductance
(SC), and Column 5 effluent pH, temperature and SC, along with the flow rate and total flow
readings.
The flow rate was reduced to 4 gpm on Day 4 of the test, December 3, 2010, to maintain a
minimum flow through the columns over the weekend and avoid bed packing.
It was decided to maintain flow at 4 gpm for a week to see whether this would improve
thallium adsorption in the columns.
After results showed that thallium removal improved at lower flow rates, the flow was
increased back to 17 gpm for one day to confirm these results.
After higher thallium concentrations were confirmed at high flow rates, the system was
operated at 4-5 gpm for the remainder of the test.
“Breakthrough” was defined as the time when thallium was first detected (the concentration
exceeded the detection limit). The pilot test was operated until February 2, 2011 (65 days),
when consistent breakthrough was seen from Column 5 at the minimum detection limit of
0.0002 mg/L. A total of 486,340 gallons were treated through the system (Tables 1 and 2).
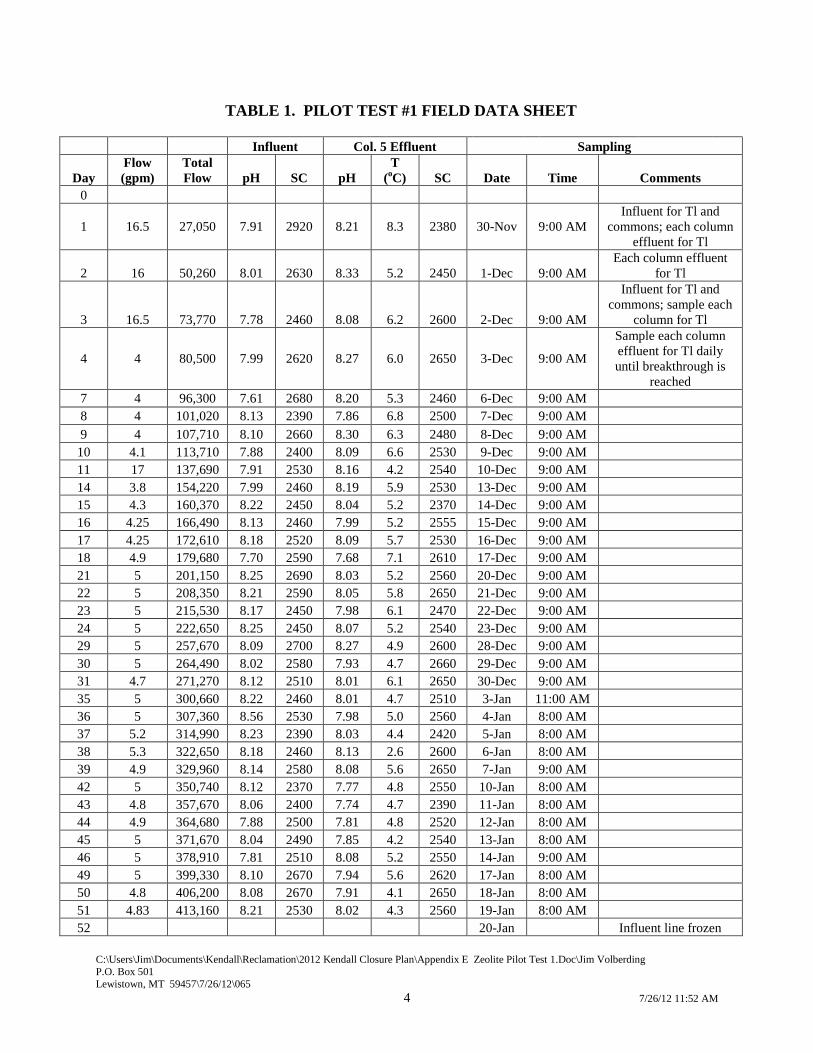
C:\Users\Jim\Documents\Kendall\Reclamation\2012 Kendall Closure Plan\Appendix E Zeolite Pilot Test 1.Doc\Jim Volberding
P.O. Box 501
Lewistown, MT 59457\7/26/12\065
4 7/26/12 11:52 AM
TABLE 1. PILOT TEST #1 FIELD DATA SHEET
Influent Col. 5 Effluent Sampling
Day
Flow
(gpm)
Total
Flow pH SC pH
T
(oC) SC Date Time Comments
0
1 16.5 27,050 7.91 2920 8.21 8.3 2380 30-Nov 9:00 AM
Influent for Tl and
commons; each column
effluent for Tl
2 16 50,260 8.01 2630 8.33 5.2 2450 1-Dec 9:00 AM
Each column effluent
for Tl
3 16.5 73,770 7.78 2460 8.08 6.2 2600 2-Dec 9:00 AM
Influent for Tl and
commons; sample each
column for Tl
4 4 80,500 7.99 2620 8.27 6.0 2650 3-Dec 9:00 AM
Sample each column
effluent for Tl daily
until breakthrough is
reached
7 4 96,300 7.61 2680 8.20 5.3 2460 6-Dec 9:00 AM
8 4 101,020 8.13 2390 7.86 6.8 2500 7-Dec 9:00 AM
9 4 107,710 8.10 2660 8.30 6.3 2480 8-Dec 9:00 AM
10 4.1 113,710 7.88 2400 8.09 6.6 2530 9-Dec 9:00 AM
11 17 137,690 7.91 2530 8.16 4.2 2540 10-Dec 9:00 AM
14 3.8 154,220 7.99 2460 8.19 5.9 2530 13-Dec 9:00 AM
15 4.3 160,370 8.22 2450 8.04 5.2 2370 14-Dec 9:00 AM
16 4.25 166,490 8.13 2460 7.99 5.2 2555 15-Dec 9:00 AM
17 4.25 172,610 8.18 2520 8.09 5.7 2530 16-Dec 9:00 AM
18 4.9 179,680 7.70 2590 7.68 7.1 2610 17-Dec 9:00 AM
21 5 201,150 8.25 2690 8.03 5.2 2560 20-Dec 9:00 AM
22 5 208,350 8.21 2590 8.05 5.8 2650 21-Dec 9:00 AM
23 5 215,530 8.17 2450 7.98 6.1 2470 22-Dec 9:00 AM
24 5 222,650 8.25 2450 8.07 5.2 2540 23-Dec 9:00 AM
29 5 257,670 8.09 2700 8.27 4.9 2600 28-Dec 9:00 AM
30 5 264,490 8.02 2580 7.93 4.7 2660 29-Dec 9:00 AM
31 4.7 271,270 8.12 2510 8.01 6.1 2650 30-Dec 9:00 AM
35 5 300,660 8.22 2460 8.01 4.7 2510 3-Jan 11:00 AM
36 5 307,360 8.56 2530 7.98 5.0 2560 4-Jan 8:00 AM
37 5.2 314,990 8.23 2390 8.03 4.4 2420 5-Jan 8:00 AM
38 5.3 322,650 8.18 2460 8.13 2.6 2600 6-Jan 8:00 AM
39 4.9 329,960 8.14 2580 8.08 5.6 2650 7-Jan 9:00 AM
42 5 350,740 8.12 2370 7.77 4.8 2550 10-Jan 8:00 AM
43 4.8 357,670 8.06 2400 7.74 4.7 2390 11-Jan 8:00 AM
44 4.9 364,680 7.88 2500 7.81 4.8 2520 12-Jan 8:00 AM
45 5 371,670 8.04 2490 7.85 4.2 2540 13-Jan 8:00 AM
46 5 378,910 7.81 2510 8.08 5.2 2550 14-Jan 9:00 AM
49 5 399,330 8.10 2670 7.94 5.6 2620 17-Jan 8:00 AM
50 4.8 406,200 8.08 2670 7.91 4.1 2650 18-Jan 8:00 AM
51 4.83 413,160 8.21 2530 8.02 4.3 2560 19-Jan 8:00 AM
52
20-Jan
Influent line frozen

C:\Users\Jim\Documents\Kendall\Reclamation\2012 Kendall Closure Plan\Appendix E Zeolite Pilot Test 1.Doc\Jim Volberding
P.O. Box 501
Lewistown, MT 59457\7/26/12\065
5 7/26/12 11:52 AM
53
21-Jan
Influent line frozen
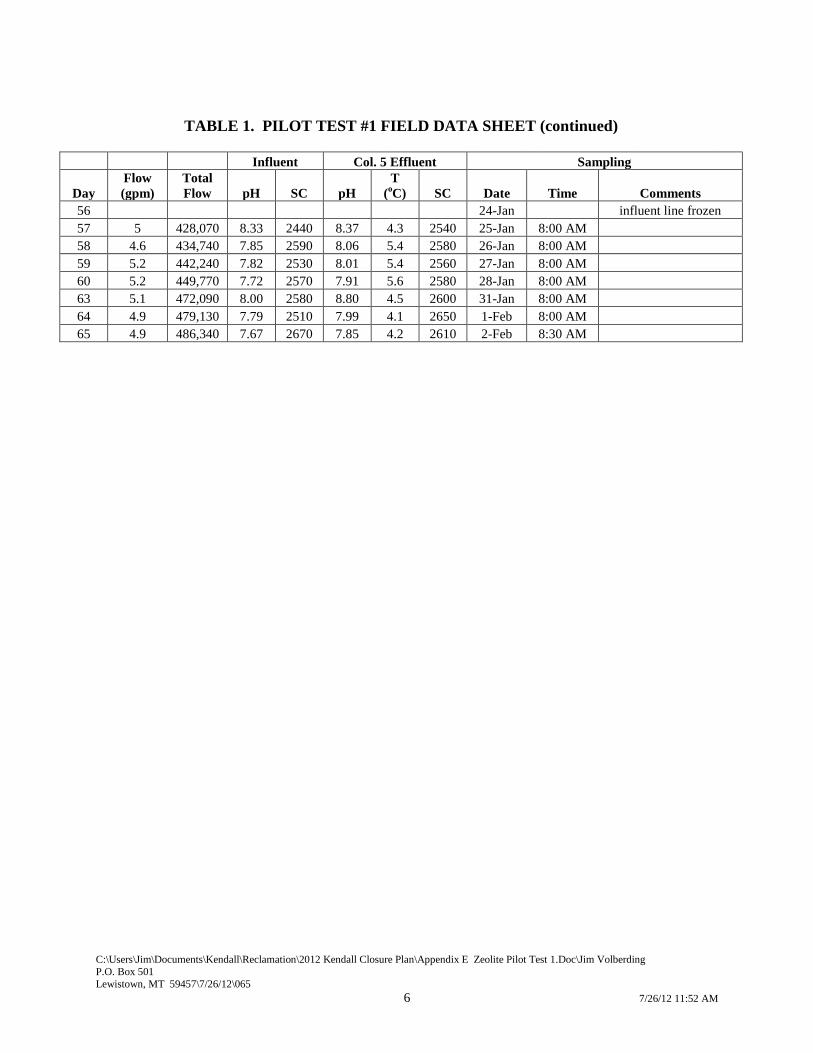
C:\Users\Jim\Documents\Kendall\Reclamation\2012 Kendall Closure Plan\Appendix E Zeolite Pilot Test 1.Doc\Jim Volberding
P.O. Box 501
Lewistown, MT 59457\7/26/12\065
6 7/26/12 11:52 AM
TABLE 1. PILOT TEST #1 FIELD DATA SHEET (continued)
Influent Col. 5 Effluent Sampling
Day
Flow
(gpm)
Total
Flow pH SC pH
T
(oC) SC Date Time Comments
56
24-Jan
influent line frozen
57 5 428,070 8.33 2440 8.37 4.3 2540 25-Jan 8:00 AM
58 4.6 434,740 7.85 2590 8.06 5.4 2580 26-Jan 8:00 AM
59 5.2 442,240 7.82 2530 8.01 5.4 2560 27-Jan 8:00 AM
60 5.2 449,770 7.72 2570 7.91 5.6 2580 28-Jan 8:00 AM
63 5.1 472,090 8.00 2580 8.80 4.5 2600 31-Jan 8:00 AM
64 4.9 479,130 7.79 2510 7.99 4.1 2650 1-Feb 8:00 AM
65 4.9 486,340 7.67 2670 7.85 4.2 2610 2-Feb 8:30 AM
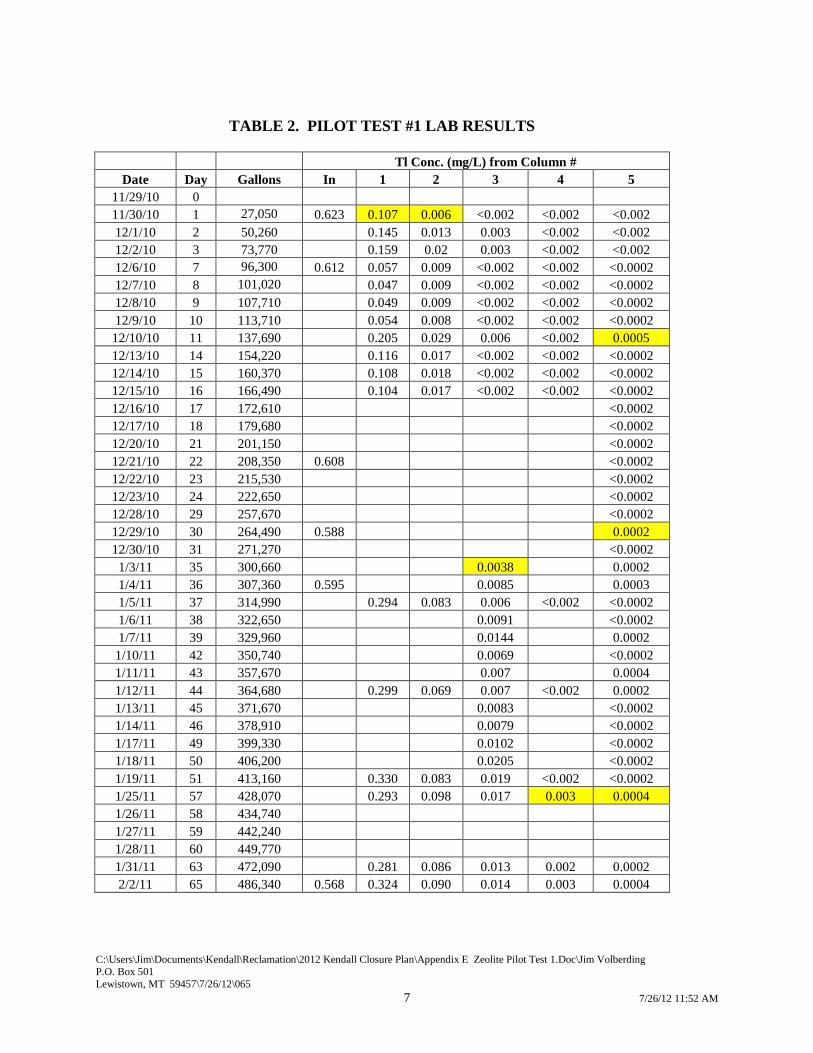
C:\Users\Jim\Documents\Kendall\Reclamation\2012 Kendall Closure Plan\Appendix E Zeolite Pilot Test 1.Doc\Jim Volberding
P.O. Box 501
Lewistown, MT 59457\7/26/12\065
7 7/26/12 11:52 AM
TABLE 2. PILOT TEST #1 LAB RESULTS
Tl Conc. (mg/L) from Column #
Date Day Gallons In 1 2 3 4 5
11/29/10 0
11/30/10 1 27,050 0.623 0.107 0.006 <0.002 <0.002 <0.002
12/1/10 2 50,260
0.145 0.013 0.003 <0.002 <0.002
12/2/10 3 73,770
0.159 0.02 0.003 <0.002 <0.002
12/6/10 7 96,300 0.612 0.057 0.009 <0.002 <0.002 <0.0002
12/7/10 8 101,020
0.047 0.009 <0.002 <0.002 <0.0002
12/8/10 9 107,710
0.049 0.009 <0.002 <0.002 <0.0002
12/9/10 10 113,710
0.054 0.008 <0.002 <0.002 <0.0002
12/10/10 11 137,690
0.205 0.029 0.006 <0.002 0.0005
12/13/10 14 154,220
0.116 0.017 <0.002 <0.002 <0.0002
12/14/10 15 160,370
0.108 0.018 <0.002 <0.002 <0.0002
12/15/10 16 166,490
0.104 0.017 <0.002 <0.002 <0.0002
12/16/10 17 172,610
<0.0002
12/17/10 18 179,680
<0.0002
12/20/10 21 201,150
<0.0002
12/21/10 22 208,350 0.608
<0.0002
12/22/10 23 215,530
<0.0002
12/23/10 24 222,650
<0.0002
12/28/10 29 257,670
<0.0002
12/29/10 30 264,490 0.588
0.0002
12/30/10 31 271,270
<0.0002
1/3/11 35 300,660
0.0038
0.0002
1/4/11 36 307,360 0.595
0.0085
0.0003
1/5/11 37 314,990
0.294 0.083 0.006 <0.002 <0.0002
1/6/11 38 322,650
0.0091
<0.0002
1/7/11 39 329,960
0.0144
0.0002
1/10/11 42 350,740
0.0069
<0.0002
1/11/11 43 357,670
0.007
0.0004
1/12/11 44 364,680
0.299 0.069 0.007 <0.002 0.0002
1/13/11 45 371,670
0.0083
<0.0002
1/14/11 46 378,910
0.0079
<0.0002
1/17/11 49 399,330
0.0102
<0.0002
1/18/11 50 406,200
0.0205
<0.0002
1/19/11 51 413,160
0.330 0.083 0.019 <0.002 <0.0002
1/25/11 57 428,070
0.293 0.098 0.017 0.003 0.0004
1/26/11 58 434,740
1/27/11 59 442,240
1/28/11 60 449,770
1/31/11 63 472,090
0.281 0.086 0.013 0.002 0.0002
2/2/11 65 486,340 0.568 0.324 0.090 0.014 0.003 0.0004

C:\Users\Jim\Documents\Kendall\Reclamation\2012 Kendall Closure Plan\Appendix E Zeolite Pilot Test 1.Doc\Jim Volberding
P.O. Box 501
Lewistown, MT 59457\7/26/12\065
8 7/26/12 11:52 AM
Sampling and Analysis
All water samples were filtered and sent to Energy Labs, with most submitted for rush (24-
hour) analysis.
We began the test by sampling effluent (overflow) from all five columns every day, using the
standard detection limit of 0.002 mg/L. After several days, we requested the minimum
detection limit of 0.0002 mg/L for Column 5 samples.
Influent water from the pond was sampled on Day 1 and periodically throughout the test.
Results and Discussion
Field data from throughout the pilot test are shown in Table 1. SC remained near 2500 uS during
the test, with little difference seen between the influent and Column 5 effluent. The Day 1
influent SC was 2920 uS but all other readings were less than 2700 uS.
pH values were near 8.0 throughout the test, with little difference between the influent and
Column 5 effluent. The water temperature ranged from 2.6 to 8.3oC during the test.
Thallium concentrations from all five columns are shown in Table 2. The influent concentration
steadily decreased from 0.623 mg/L to 0.568 during the test, probably due to dilution from
precipitation. Breakthrough was noted on Day 1 from Columns 1 and 2 at the higher flow rate of
16 gpm, at a total flow of 27,050 gallons. Concentrations decreased substantially when the flow
rate decreased to 4 gpm on Day 7, but were still measurable in Columns 1 and 2. It is difficult to
estimate when breakthrough from these columns would have occurred with an initial flow rate of
4 gpm.
Breakthrough from Column 3 was noted on Day 35, at a total flow of about 300,000 gallons
(Table 2). Column 3 had last been sampled after 166,000 gallons, so breakthrough occurred
sometime between 166,000 and 300,000 gallons.
Breakthrough from Column 4 was first noted on Day 57, after 428,000 gallons had been treated
(Table 2). Breakthrough from the first four columns was compared to the standard detection
limit of 0.002 mg/L.
At the lower detection limit of 0.0002 mg/L, Column 5 breakthrough was first noted on Day 11
after 137,000 gallons. This occurred, however, when the flow rate was temporarily increased to
17 gpm. Thallium was not again detected after Column 5 at this lower detection limit until Day
30 (264,000 gallons), as shown in Table 2. Periodic breakthrough was then seen throughout the
test. The last three readings all had measurable thallium concentrations, suggesting that
consistent breakthrough occurred at 428,000 gallons. These breakthrough marks are highlighted
in yellow in Table 2.
Pilot test results are shown graphically in Figure 3, which shows the large effect of flow on
thallium concentrations in Column 1. To better show the low-concentration data, the same
results are shown in Figure 4 using a log scale.
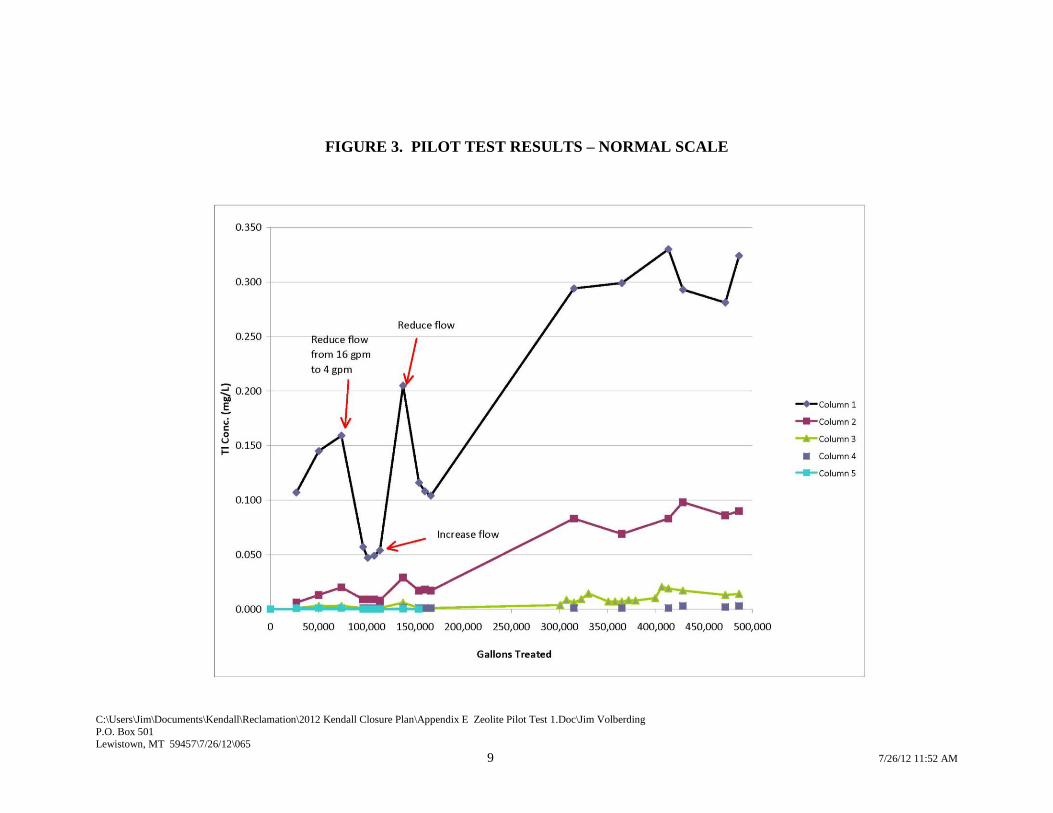
C:\Users\Jim\Documents\Kendall\Reclamation\2012 Kendall Closure Plan\Appendix E Zeolite Pilot Test 1.Doc\Jim Volberding
P.O. Box 501
Lewistown, MT 59457\7/26/12\065
9 7/26/12 11:52 AM
FIGURE 3. PILOT TEST RESULTS – NORMAL SCALE

C:\Users\Jim\Documents\Kendall\Reclamation\2012 Kendall Closure Plan\Appendix E Zeolite Pilot Test 1.Doc\Jim Volberding
P.O. Box 501
Lewistown, MT 59457\7/26/12\065
10 7/26/12 11:52 AM
FIGURE 4. PILOT TEST #1 RESULTS – LOG SCALE

C:\Users\Jim\Documents\Kendall\Reclamation\2012 Kendall Closure Plan\Appendix E Zeolite Pilot Test 1.Doc\Jim Volberding
P.O. Box 501
Lewistown, MT 59457\7/26/12\065
11 7/26/12 11:52 AM
Other Parameters
Samples were taken on 11/30/10, near the beginning of the test, and analyzed for parameters
other than thallium. These results are shown in Table 3.
TABLE 3. OTHER PARAMETERS
Sampling on 11/30/10
Concentration (mg/L)
Parameter Influent Column 5
pH (s.u.) 7.9
Conductivity (uS) 2340
Alkalinity 265
Bicarbonate 323
Sulfate 1200
Hardness 1370
Phosphorus 0.009
Arsenic 0.011 0.006
Calcium 339
Magnesium 127
Potassium 7
Selenium 0.025 0.029
Sodium 41
Zeolite Analysis
Near the conclusion of the test, the Toxicity Characteristic Leaching Procedure (TCLP) and
Synthetic Precipitation Leaching Procedure (SPLP) were performed on a sample of the
Column 1 zeolites, which would have contained the highest loading of any material used.
This was a composite sample from within the column, as the zeolites were mixed with an air
hose prior to sampling. Those leaching results for the eight RCRA metals plus thallium are
shown in Table 4. Since all metals other than thallium were non-detect, this spent material
would be classified as nonhazardous waste. The TCLP test is conducted with a ratio of 50 g
of zeolite to 1 L of leach solution. Assuming that the 50 g sample of zeolite leached in the
TCLP test contains 3,760 mg/kg thallium (as measured in the whole rock analysis described
below), the zeolite sample would have contained a total of approximately 188 mg of thallium
prior to the leach test. In the TCLP test, 2.66 mg or 1.4 percent of thallium was leached from
the zeolite sample. These leach results are similar to previous leach tests of St. Cloud
chabazite and suggests that the thallium retained by the zeolites is not readily leachable.

C:\Users\Jim\Documents\Kendall\Reclamation\2012 Kendall Closure Plan\Appendix E Zeolite Pilot Test 1.Doc\Jim Volberding
P.O. Box 501
Lewistown, MT 59457\7/26/12\065
12 7/26/12 11:52 AM
TABLE 4. LEACHING RESULTS
Column 1, sampled on 1/20/11
Concentration (mg/L)
Metal TCLP SPLP
Arsenic < 0.5 < 0.5
Barium < 10 < 10
Cadmium < 0.1 < 0.1
Chromium < 0.5 < 0.5
Lead < 0.5 < 0.5
Mercury < 0.02 < 0.02
Selenium < 0.1 < 0.1
Silver < 0.5 < 0.5
Thallium 2.66 < 0.5
At the conclusion of the test, samples from each column were directly analyzed for the same
parameters by strong acid digestion (“whole rock analysis”); results are in Table 5. Each
column sample was a blended composite from throughout the column, as the material had
been removed from the columns and placed in bags. The decreasing amounts of thallium
adsorbed to the zeolites are in line with the decreasing concentrations exiting each successive
column (Figure 4).
TABLE 5. WHOLE ROCK ANALYSIS
Sampled on 2/2/11
Concentration (mg/kg)
Metal Col. 1 Col. 2 Col. 3 Col. 4 Col. 5
Arsenic 13 13 10 13 13
Barium 784 660 603 805 826
Cadmium < 1 < 1 < 1 < 1 < 1
Chromium < 5 < 5 < 5 < 5 < 5
Lead 8 8 7 11 15
Mercury < 1 < 1 < 1 < 1 < 1
Selenium < 5 < 5 < 5 < 5 < 5
Silver < 5 < 5 < 5 < 5 < 5
Thallium 3760 1010 170 33 10

C:\Users\Jim\Documents\Kendall\Reclamation\2012 Kendall Closure Plan\Appendix E Zeolite Pilot Test 1.Doc\Jim Volberding
P.O. Box 501
Lewistown, MT 59457\7/26/12\065
13 7/26/12 11:52 AM
A thallium mass balance from each column shows that we removed the following quantities
of thallium:
Column 1: 400 lbs * 1 kg/2.2 lb * 3760 mg/kg = 684,000 mg Tl
Column 2: 400/2.2 * 1010 = 184,000 mg
Column 3: 400/2.2 * 170 = 31,000 mg
Column 4: 400/2.2 * 33 = 6,000 mg
Column 5: 400/2.2 * 10 = 2,000 mg
907,000 mg
Now we can compare this to the amount theoretically removed from the water. The influent
thallium concentration steadily decreased during the test; let’s assume it was the average of
the high reading at the beginning (0.623 mg/L) and the low reading at the end (0.568 mg/L),
or 0.596 mg/L. According to our flowmeter, we treated 486,340 gallons. Therefore, we
removed the following quantity of thallium:
0.596 mg/L * 486,340 gal * 3.785 L/gal = 1,097,100 mg
This quantity is 21% higher than the 907,000 mg calculated from the whole rock analysis.
Both numbers are in the same range but it is unclear why the difference is so high.
Adsorption Capacity
The Table 5 numbers show a thallium adsorption capacity of 3760 mg/kg (0.376%) in
Column 1, with lesser amounts in the following columns. At the beginning of the pilot test,
we had estimated thallium loading of 0.2% in the lead column, based on bench testing and
the adsorption isotherms generated. Therefore, we obtained substantially better results in the
pilot test than anticipated. Had we run another iteration of Pilot Test #1 with partially loaded
zeolites, I anticipate we would have seen breakthrough before 486,000 gallons. This would
mean a slightly lower loading rate.
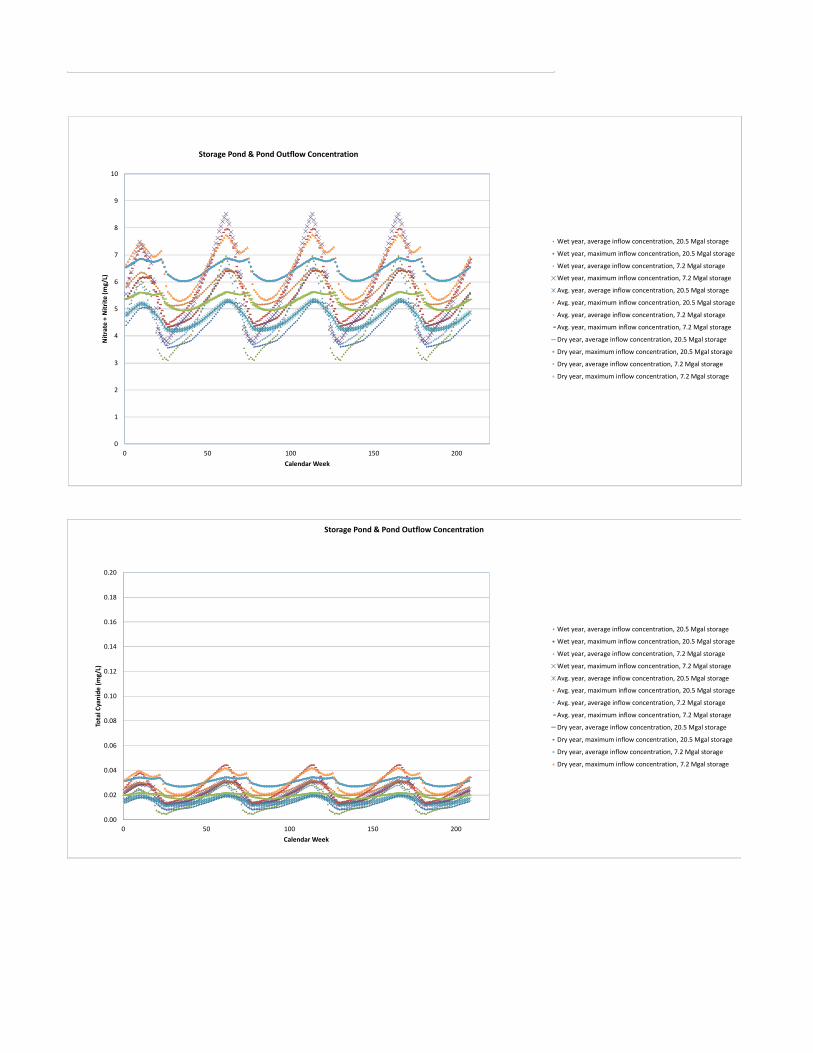
0
1
2
3
4
5
6
7
8
9
10
0 50 100 150 200
Nitrate + Nitrite (mg/L)
Calendar Week
Storage Pond & Pond Outflow Concentration
Wet year, average inflow concentration, 20.5 Mgal storage
Wet year, maximum inflow concentration, 20.5 Mgal storage
Wet year, average inflow concentration, 7.2 Mgal storage
Wet year, maximum inflow concentration, 7.2 Mgal storage
Avg. year, average inflow concentration, 20.5 Mgal storage
Avg. year, maximum inflow concentration, 20.5 Mgal storage
Avg. year, average inflow concentration, 7.2 Mgal storage
Avg. year, maximum inflow concentration, 7.2 Mgal storage
Dry year, average inflow concentration, 20.5 Mgal storage
Dry year, maximum inflow concentration, 20.5 Mgal storage
Dry year, average inflow concentration, 7.2 Mgal storage
Dry year, maximum inflow concentration, 7.2 Mgal storage
0.00
0.02
0.04
0.06
0.08
0.10
0.12
0.14
0.16
0.18
0.20
0 50 100 150 200
Total Cyanide (mg/L)
Calendar Week
Storage Pond & Pond Outflow Concentration
Wet year, average inflow concentration, 20.5 Mgal storage
Wet year, maximum inflow concentration, 20.5 Mgal storage
Wet year, average inflow concentration, 7.2 Mgal storage
Wet year, maximum inflow concentration, 7.2 Mgal storage
Avg. year, average inflow concentration, 20.5 Mgal storage
Avg. year, maximum inflow concentration, 20.5 Mgal storage
Avg. year, average inflow concentration, 7.2 Mgal storage
Avg. year, maximum inflow concentration, 7.2 Mgal storage
Dry year, average inflow concentration, 20.5 Mgal storage
Dry year, maximum inflow concentration, 20.5 Mgal storage
Dry year, average inflow concentration, 7.2 Mgal storage
Dry year, maximum inflow concentration, 7.2 Mgal storage

0.000
0.001
0.002
0.003
0.004
0.005
0.006
0 50 100 150 200
Antimony (m
g/L)
Calendar Week
Storage Pond & Pond Outflow Concentration
Wet year, average inflow concentration, 20.5 Mgal storage
Wet year, maximum inflow concentration, 20.5 Mgal storage
Wet year, average inflow concentration, 7.2 Mgal storage
Wet year, maximum inflow concentration, 7.2 Mgal storage
Avg. year, average inflow concentration, 20.5 Mgal storage
Avg. year, maximum inflow concentration, 20.5 Mgal storage
Avg. year, average inflow concentration, 7.2 Mgal storage
Avg. year, maximum inflow concentration, 7.2 Mgal storage
Dry year, average inflow concentration, 20.5 Mgal storage
Dry year, maximum inflow concentration, 20.5 Mgal storage
Dry year, average inflow concentration, 7.2 Mgal storage
Dry year, maximum inflow concentration, 7.2 Mgal storage
0.000
0.005
0.010
0.015
0.020
0.025
0 50 100 150 200
Arsenic (mg/L)
Calendar Week
Storage Pond & Pond Outflow Concentration
Wet year, average inflow concentration, 20.5 Mgal storage
Wet year, maximum inflow concentration, 20.5 Mgal storage
Wet year, average inflow concentration, 7.2 Mgal storage
Wet year, maximum inflow concentration, 7.2 Mgal storage
Avg. year, average inflow concentration, 20.5 Mgal storage
Avg. year, maximum inflow concentration, 20.5 Mgal storage
Avg. year, average inflow concentration, 7.2 Mgal storage
Avg. year, maximum inflow concentration, 7.2 Mgal storage
Dry year, average inflow concentration, 20.5 Mgal storage
Dry year, maximum inflow concentration, 20.5 Mgal storage
Dry year, average inflow concentration, 7.2 Mgal storage
Dry year, maximum inflow concentration, 7.2 Mgal storage

0.00
0.01
0.02
0.03
0.04
0.05
0 50 100 150 200
Selenium (mg/L)
Calendar Week
Storage Pond & Pond Outflow Concentration
Wet year, average inflow concentration, 20.5 Mgal storage
Wet year, maximum inflow concentration, 20.5 Mgal storage
Wet year, average inflow concentration, 7.2 Mgal storage
Wet year, maximum inflow concentration, 7.2 Mgal storage
Avg. year, average inflow concentration, 20.5 Mgal storage
Avg. year, maximum inflow concentration, 20.5 Mgal storage
Avg. year, average inflow concentration, 7.2 Mgal storage
Avg. year, maximum inflow concentration, 7.2 Mgal storage
Dry year, average inflow concentration, 20.5 Mgal storage
Dry year, maximum inflow concentration, 20.5 Mgal storage
Dry year, average inflow concentration, 7.2 Mgal storage
Dry year, maximum inflow concentration, 7.2 Mgal storage
0.00
0.10
0.20
0.30
0.40
0.50
0.60
0 50 100 150 200
Thalliu
m (mg/L)
Calendar Week
Storage Pond & Pond Outflow Concentration
Wet year, average inflow concentration, 20.5 Mgal storage
Wet year, maximum inflow concentration, 20.5 Mgal storage
Wet year, average inflow concentration, 7.2 Mgal storage
Wet year, maximum inflow concentration, 7.2 Mgal storage
Avg. year, average inflow concentration, 20.5 Mgal storage
Avg. year, maximum inflow concentration, 20.5 Mgal storage
Avg. year, average inflow concentration, 7.2 Mgal storage
Avg. year, maximum inflow concentration, 7.2 Mgal storage
Dry year, average inflow concentration, 20.5 Mgal storage
Dry year, maximum inflow concentration, 20.5 Mgal storage
Dry year, average inflow concentration, 7.2 Mgal storage
Dry year, maximum inflow concentration, 7.2 Mgal storage
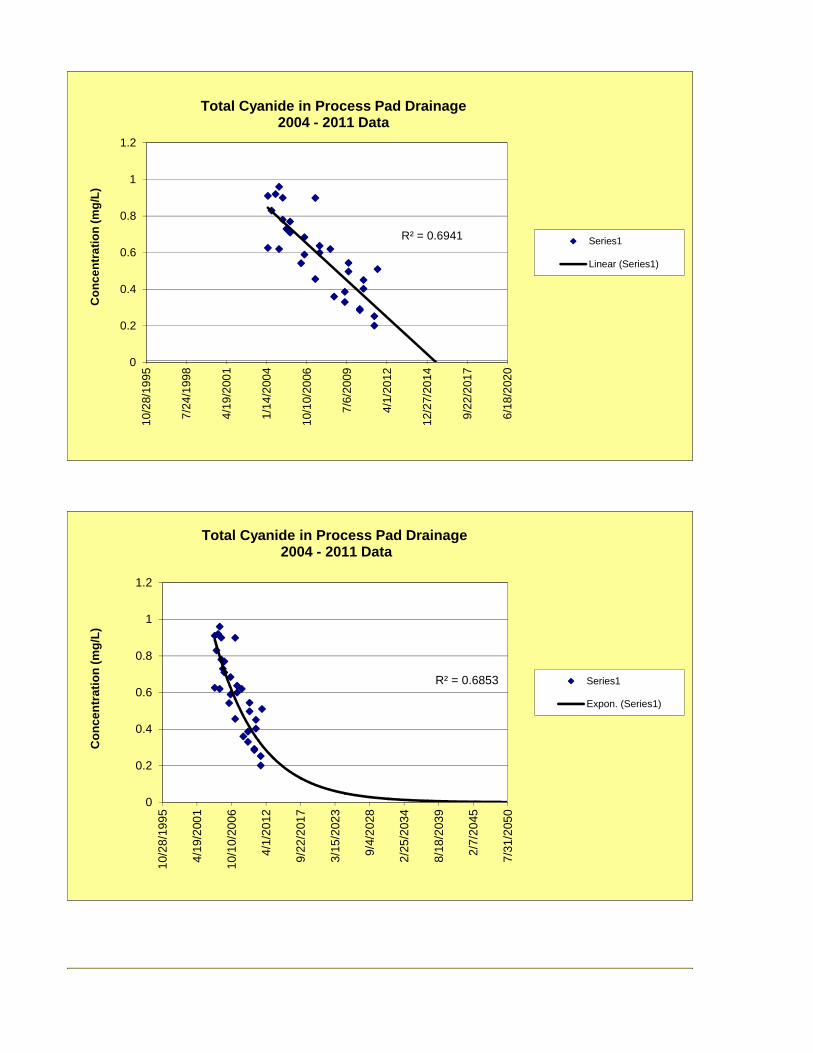
R² = 0.6941
0
0.2
0.4
0.6
0.8
1
1.21
0/2
8/19
95
7/2
4/1
998
4/1
9/2
001
1/1
4/2
004
10/
10/
2006
7/6
/20
09
4/1
/20
12
12/
27/
2014
9/2
2/2
017
6/1
8/2
020
Co
nc
en
tra
tio
n (
mg
/L)
Total Cyanide in Process Pad Drainage 2004 - 2011 Data
Series1
Linear (Series1)
R² = 0.6853
0
0.2
0.4
0.6
0.8
1
1.2
10/
28
/19
95
4/1
9/2
001
10/
10
/20
06
4/1
/20
12
9/2
2/2
017
3/1
5/2
023
9/4
/20
28
2/2
5/2
034
8/1
8/2
039
2/7
/20
45
7/3
1/2
050
Co
nce
ntr
atio
n (
mg
/L)
Total Cyanide in Process Pad Drainage2004 - 2011 Data
Series1
Expon. (Series1)

R² = 0.741
0
20
40
60
80
100
120
140
160
180
0/2
8/19
95
4/1
9/2
001
0/1
0/20
06
4/1
/20
12
9/2
2/2
017
3/1
5/2
023
9/4
/20
28
2/2
5/2
034
8/1
8/2
039
2/7
/20
45
7/3
1/2
050
Co
nc
en
tra
tio
n (
mg
/L)
Nitrate + Nitrite in Process Pad Drainage1998-2011 Data
R² = 0.6459
0
20
40
60
80
100
120
140
160
180
10/
28/
1995
4/1
9/2
001
10/
10/
2006
4/1
/20
12
9/2
2/2
017
3/1
5/2
023
9/4
/20
28
2/2
5/2
034
8/1
8/2
039
2/7
/20
45
7/3
1/2
050
Co
nc
en
tra
tio
n (
mg
/L)
Nitrate + Nitrite in Process Pad Drainage1998-2011 Data

y = -2E-06x + 0.1031R² = 0.6576
0
0.005
0.01
0.015
0.02
0.025
0.031
0/2
8/19
95
4/1
9/2
001
10/
10/
2006
4/1
/20
12
9/2
2/2
017
3/1
5/2
023
9/4
/20
28
2/2
5/2
034
8/1
8/2
039
2/7
/20
45
Co
nc
en
tra
tio
n (
mg
/L)
Antimony in Process Pad 2005 - 2011 Data
y = 1.1155e-1E-04x
R² = 0.6554
0
0.005
0.01
0.015
0.02
0.025
0.03
10/
28/
1995
4/1
9/2
001
10/
10/
2006
4/1
/20
12
9/2
2/2
017
3/1
5/2
023
9/4
/20
28
2/2
5/2
034
8/1
8/2
039
2/7
/20
45
Co
nc
en
tra
tio
n (
mg
/L)
Antimony in Process Pad 2005 - 2011 Data
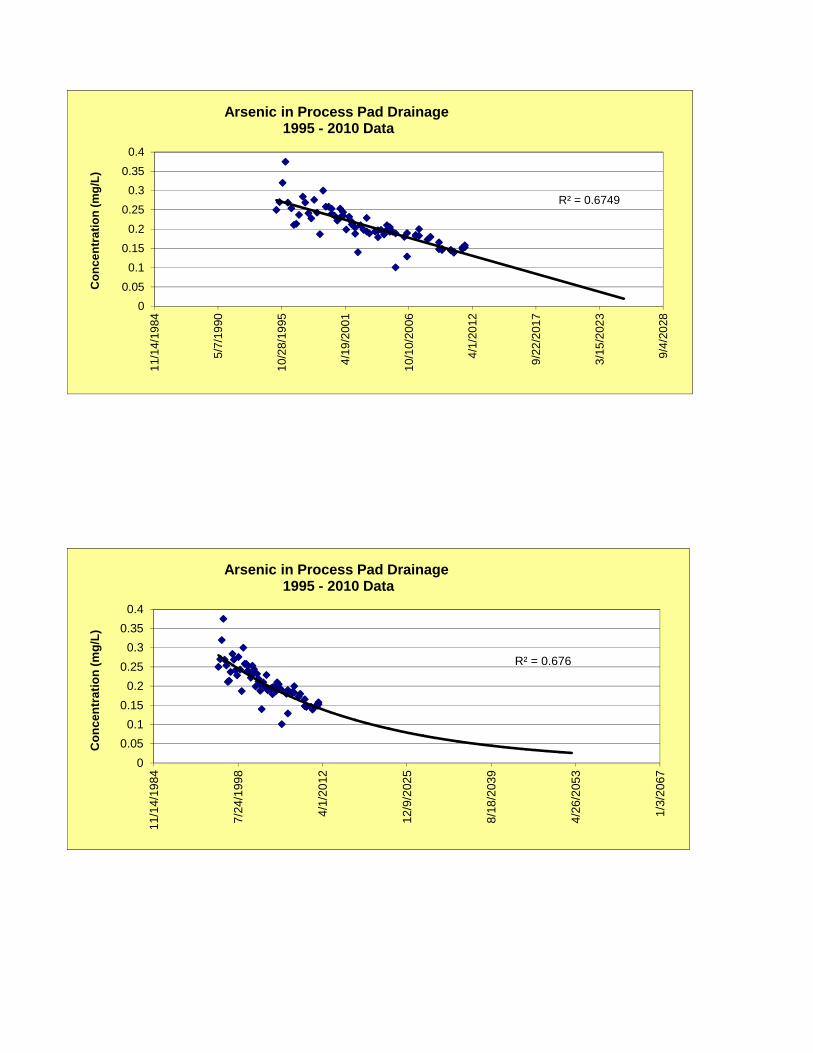
R² = 0.6749
0
0.05
0.1
0.15
0.2
0.25
0.3
0.35
0.41
1/1
4/19
84
5/7
/19
90
10/
28/
1995
4/1
9/2
001
10/
10/
2006
4/1
/20
12
9/2
2/2
017
3/1
5/2
023
9/4
/20
28
Co
nc
en
tra
tio
n (
mg
/L)
Arsenic in Process Pad Drainage1995 - 2010 Data
R² = 0.676
0
0.05
0.1
0.15
0.2
0.25
0.3
0.35
0.4
11/
14
/19
84
7/2
4/1
998
4/1
/20
12
12/
9/2
025
8/1
8/2
039
4/2
6/2
053
1/3
/20
67
Co
nce
ntr
atio
n (
mg
/L)
Arsenic in Process Pad Drainage1995 - 2010 Data

y = 165e-2E-04x
R² = 0.7119
0
0.02
0.04
0.06
0.08
0.1
0.12
0.14
0.16
0.18
0.2
11/
14/
1984
7/2
4/1
998
4/1
/20
12
12/
9/2
025
8/1
8/2
039
Co
nc
en
tra
tio
n (
mg
/L)
Selenium in Process Pad Drainage1998 - 2011 Data
y = -2E-05x + 0.7619R² = 0.6907
0
0.02
0.04
0.06
0.08
0.1
0.12
0.14
0.16
0.18
0.2
11/
14/
1984
5/7
/19
90
10/
28/
1995
4/1
9/2
001
10/
10/
2006
4/1
/20
12
9/2
2/2
017
3/1
5/2
023
Co
nc
en
tra
tio
n (
mg
/L)
Selenium in Process Pad Drainage1998 - 2011 Data

y = -5E-05x + 2.5293R² = 0.1916
0
0.2
0.4
0.6
0.8
1
1.2
11/
14/
1984
7/2
4/1
998
4/1
/20
12
12/
9/2
025
8/1
8/2
039
4/2
6/2
053
1/3
/20
67
Co
nc
en
tra
tio
n (
mg
/L)
Thallium in Process Pad Drainage2000-2011 Data
y = -1E-08x2 + 0.001x - 17.917R² = 0.2131
0
0.2
0.4
0.6
0.8
1
1.2
11/
14/
1984
5/7
/19
90
10/
28/
1995
4/1
9/2
001
10/
10/
2006
4/1
/20
12
9/2
2/2
017
3/1
5/2
023
9/4
/20
28
Co
nc
en
tra
tio
n (
mg
/L)
Thallium in Process Pad Drainage2000-2011 Data
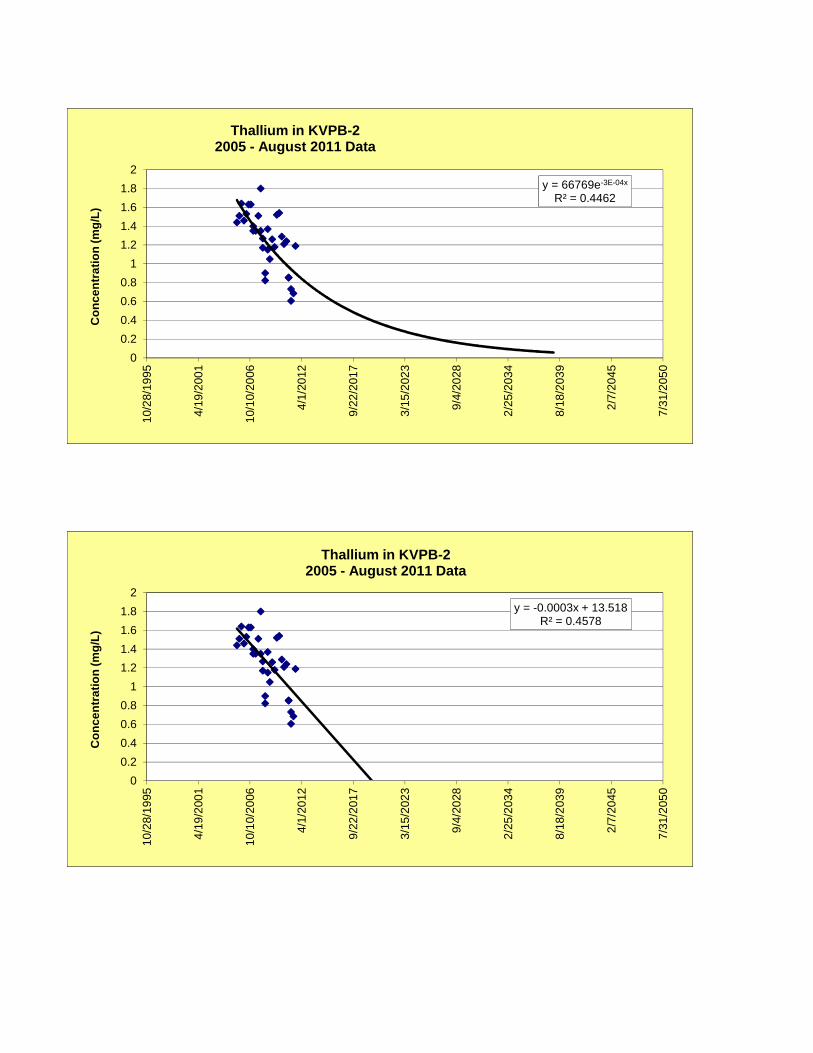
y = 66769e-3E-04x
R² = 0.4462
0
0.2
0.4
0.6
0.8
1
1.2
1.4
1.6
1.8
2
10/
28/
1995
4/1
9/2
001
10/
10/
2006
4/1
/20
12
9/2
2/2
017
3/1
5/2
023
9/4
/20
28
2/2
5/2
034
8/1
8/2
039
2/7
/20
45
7/3
1/2
050
Co
nc
en
tra
tio
n (
mg
/L)
Thallium in KVPB-2 2005 - August 2011 Data
y = -0.0003x + 13.518R² = 0.4578
0
0.2
0.4
0.6
0.8
1
1.2
1.4
1.6
1.8
2
10/
28/
1995
4/1
9/2
001
10/
10/
2006
4/1
/20
12
9/2
2/2
017
3/1
5/2
023
9/4
/20
28
2/2
5/2
034
8/1
8/2
039
2/7
/20
45
7/3
1/2
050
Co
nc
en
tra
tio
n (
mg
/L)
Thallium in KVPB-2 2005 - August 2011 Data
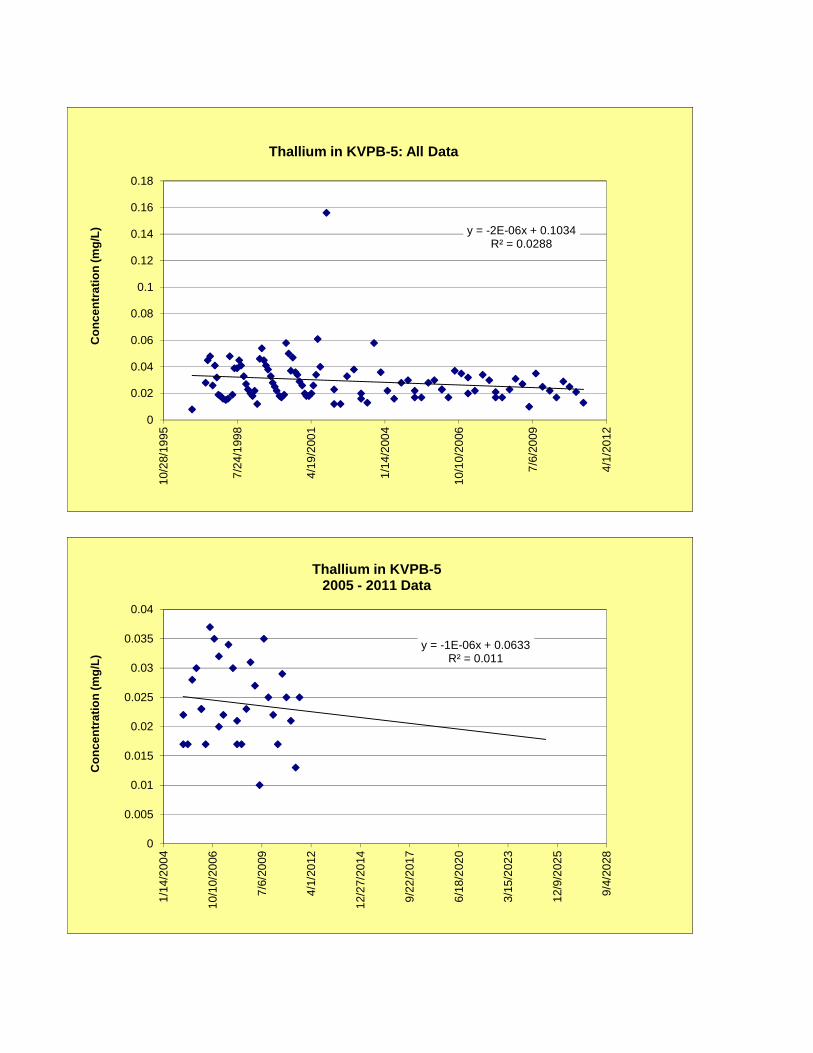
y = -2E-06x + 0.1034R² = 0.0288
0
0.02
0.04
0.06
0.08
0.1
0.12
0.14
0.16
0.18
10/
28/
1995
7/2
4/1
998
4/1
9/2
001
1/1
4/2
004
10/
10/
2006
7/6
/20
09
4/1
/20
12
Co
nc
en
tra
tio
n (
mg
/L)
Thallium in KVPB-5: All Data
y = -1E-06x + 0.0633R² = 0.011
0
0.005
0.01
0.015
0.02
0.025
0.03
0.035
0.04
1/1
4/2
004
10/
10/
2006
7/6
/20
09
4/1
/20
12
12/
27/
2014
9/2
2/2
017
6/1
8/2
020
3/1
5/2
023
12/
9/2
025
9/4
/20
28
Co
nc
en
tra
tio
n (
mg
/L)
Thallium in KVPB-52005 - 2011 Data

y = 70.271e-1E-04x
R² = 0.4788
0
0.05
0.1
0.15
0.2
0.25
0.3
0.35
0.4
0.45
0.5
1/1
4/2
004
7/6
/20
09
12/
27/
2014
6/1
8/2
020
12/
9/2
025
6/1
/20
31
11/
21/
2036
5/1
4/2
042
Co
nc
en
tra
tio
n (
mg
/L)
Thallium in KVPB-62004-2011 Data
y = 0.1611e-5E-05x
R² = 0.0135
0
0.005
0.01
0.015
0.02
0.025
0.03
0.035
0.041
/14
/200
4
10/
10/
2006
7/6
/20
09
4/1
/20
12
12/
27/
2014
9/2
2/2
017
6/1
8/2
020
3/1
5/2
023
12/
9/2
025
9/4
/20
28
Co
nc
en
tra
tio
n (
mg
/L)
Thallium in KVPB-52005 - 2011 Data

y = -5E-05x + 2.2509R² = 0.4861
0
0.05
0.1
0.15
0.2
0.25
0.3
0.35
0.4
0.45
0.5
1/1
4/2
004
10/
10/
2006
7/6
/20
09
4/1
/20
12
12/
27/
2014
9/2
2/2
017
6/1
8/2
020
3/1
5/2
023
12/
9/2
025
9/4
/20
28
6/1
/20
31
Co
nc
en
tra
tio
n (
mg
/L)
Thallium in KVPB-62004-2011 Data
0
0.01
0.02
0.03
0.04
0.05
0.06
0.07
0.08
9/1
/20
02
1/1
4/2
004
5/2
8/2
005
10/
10/
2006
2/2
2/2
008
7/6
/20
09
11/
18/
2010
4/1
/20
12
Co
nc
en
tra
tio
n (
mg
/L)
Thallium in TMW-26: 2004 - 2011

y = 1E-06x - 0.007R² = 0.0054
0
0.01
0.02
0.03
0.04
0.05
0.06
0.07
0.08
9/1
/20
02
1/1
4/2
004
5/2
8/2
005
10/
10/
2006
2/2
2/2
008
7/6
/20
09
11/
18/
2010
4/1
/20
12
Co
nc
en
tra
tio
n (
mg
/L)
Thallium in TMW-26: 2004 - 2011
R² = 0.6492
0
0.02
0.04
0.06
0.08
0.1
0.12
0.14
0.16
0.18
0.2
11/1
4/19
84
5/7
/199
0
10/2
8/19
95
4/1
9/20
01
10/1
0/20
06
4/1
/201
2
9/2
2/20
17
Co
nce
ntr
atio
n (
mg
/L)
Cyanide in TMW-26

y = 20045e-4E-04x
R² = 0.3503
0
0.005
0.01
0.015
0.02
0.0251/
14/2
004
10/1
0/20
06
7/6/
2009
4/1/
2012
12/2
7/20
14
9/22
/201
7
6/18
/202
0
3/15
/202
3
12/9
/202
5
9/4/
2028
Co
nce
ntr
atio
n (
mg
/L)
Cyanide in TMW-262005 - 2011 Data

0
2
4
6
8
10
12
14
16
10/
28/
1995
7/2
4/1
998
4/1
9/2
001
1/1
4/2
004
10/
10/
2006
7/6
/20
09
4/1
/20
12
12/
27/
2014
Co
nc
en
tra
tio
n (
mg
/L)
Nitrate + Nitrite in KVPB-2
y = 2E+14e-8E-04x
R² = 0.8575
0
2
4
6
8
10
12
14
16
10/
28/
1995
4/1
9/2
001
10/
10/
2006
4/1
/20
12
9/2
2/2
017
3/1
5/2
023
9/4
/20
28
2/2
5/2
034
8/1
8/2
039
2/7
/20
45
7/3
1/2
050
Co
nc
en
tra
tio
n (
mg
/L)
Nitrate + Nitrite in KVPB-2: 2005 to August 2011 Data

0
2
4
6
8
10
12
14
10/
28/
1995
7/2
4/1
998
4/1
9/2
001
1/1
4/2
004
10/
10/
2006
7/6
/20
09
4/1
/20
12
12/
27/
2014
Co
nc
en
tra
tio
n (
mg
/L)
Nitrate + Nitrite in KVPB-5
y = 33378e-2E-04x
R² = 0.6454
0
2
4
6
8
10
12
10/
28/
1995
4/1
9/2
001
10/
10/
2006
4/1
/20
12
9/2
2/2
017
3/1
5/2
023
9/4
/20
28
2/2
5/2
034
8/1
8/2
039
2/7
/20
45
7/3
1/2
050
Co
nc
en
tra
tio
n (
mg
/L)
Nitrate + Nitrite in KVPB-5 1999-2011
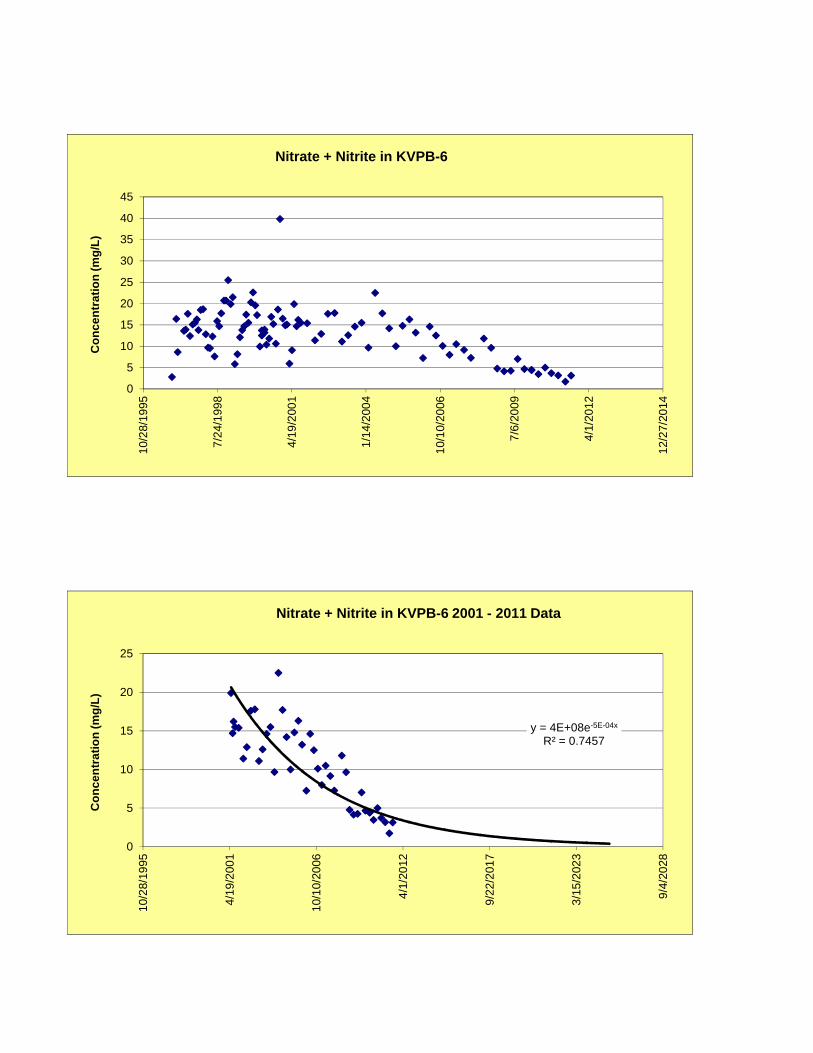
0
5
10
15
20
25
30
35
40
45
10/
28/
1995
7/2
4/1
998
4/1
9/2
001
1/1
4/2
004
10/
10/
2006
7/6
/20
09
4/1
/20
12
12/
27/
2014
Co
nc
en
tra
tio
n (
mg
/L)
Nitrate + Nitrite in KVPB-6
y = 4E+08e-5E-04x
R² = 0.7457
0
5
10
15
20
25
10/
28/
1995
4/1
9/2
001
10/
10/
2006
4/1
/20
12
9/2
2/2
017
3/1
5/2
023
9/4
/20
28
Co
nc
en
tra
tio
n (
mg
/L)
Nitrate + Nitrite in KVPB-6 2001 - 2011 Data

0
2
4
6
8
10
12
141
1/1
4/19
84
5/7
/19
90
10/
28/
1995
4/1
9/2
001
10/
10/
2006
4/1
/20
12
9/2
2/2
017
Co
nc
en
tra
tio
n (
mg
/L)
Nitrate + Nitrite in TMW-26
R² = 0.6436
0
2
4
6
8
10
12
10/2
8/19
95
4/19
/200
1
10/1
0/20
06
4/1/
2012
9/22
/201
7
3/15
/202
3
9/4/
2028
2/25
/203
4
8/18
/203
9
2/7/
2045
Co
nce
ntr
atio
n (
mg
/L)
Nitrate + Nitrite in TMW-26 1999 -2011 Data

0
0.01
0.02
0.03
0.04
0.05
0.06
10/
28/
1995
7/2
4/1
998
4/1
9/2
001
1/1
4/2
004
10/
10/
2006
7/6
/20
09
4/1
/20
12
12/
27/
2014
Co
nc
en
tra
tio
n (
mg
/L)
Arsenic in KVPB-2
y = 3E+23e-0.001x
R² = 0.7238
0
0.01
0.02
0.03
0.04
0.05
0.06
10/
10/
2006
2/2
2/2
008
7/6
/20
09
11/
18/
2010
4/1
/20
12
8/1
4/2
013
12/
27/
2014
Co
nc
en
tra
tio
n (
mg
/L)
Arsenic in KVPB-22008 - 2011 Data

0
0.01
0.02
0.03
0.04
0.05
0.06
0.07
0.08
0.09
0.11
0/2
8/19
95
7/2
4/1
998
4/1
9/2
001
1/1
4/2
004
10/
10/
2006
7/6
/20
09
4/1
/20
12
12/
27/
2014
Co
nc
en
tra
tio
n (
mg
/L)
Selenium in KVPB-2
0
200
400
600
800
1000
1200
1400
1600
1800
10/
28/
1995
7/2
4/1
998
4/1
9/2
001
1/1
4/2
004
10/
10/
2006
7/6
/20
09
4/1
/20
12
12/
27/
2014
Co
nc
en
tra
tio
n (
mg
/L)
Sulfate in KVPB-2

R² = 0.2063
0
0.005
0.01
0.015
0.02
0.025
0.031
/14
/200
4
10/
10/
2006
7/6
/20
09
4/1
/20
12
12/
27/
2014
9/2
2/2
017
6/1
8/2
020
3/1
5/2
023
12/
9/2
025
9/4
/20
28
Co
nc
en
tra
tio
n (
mg
/L)
Selenium in KVPB-5: 2006-2011 Data
Series1
Expon. (Series1)
0
500
1000
1500
2000
2500
0
0.005
0.01
0.015
0.02
0.025
0.03
10/
28/
1995
7/2
4/1
998
4/1
9/2
001
1/1
4/2
004
10/
10/
2006
7/6
/20
09
4/1
/20
12
12/
27/
2014
Co
nc
en
tra
tio
n (
mg
/L)
Selenium and Sulfate in KVPB-5: All Data
SELENIUM(SE)(DIS)
SULFATE(SO4)
Poly. (SELENIUM(SE)(DIS))
Poly. (SULFATE(SO4))

0
0.01
0.02
0.03
0.04
0.05
0.06
0.07
0.081
0/2
8/19
95
7/2
4/1
998
4/1
9/2
001
1/1
4/2
004
10/
10/
2006
7/6
/20
09
4/1
/20
12
12/
27/
2014
Co
nc
en
tra
tio
n (
mg
/L)
Selenium in KVPB-6: All Data
0200400600800
100012001400160018002000
10/
28/
1995
7/2
4/1
998
4/1
9/2
001
1/1
4/2
004
10/
10/
2006
7/6
/20
09
4/1
/20
12
Co
nc
en
tra
tio
n (
mg
/L)
Sulfate in KVPB-6: All Data

y = -4E-09x2 + 0.0003x - 6.8656R² = 0.3125
0
0.01
0.02
0.03
0.04
0.05
0.06
0.07
0.08
9/1
/20
02
1/1
4/2
004
5/2
8/2
005
10/
10/
2006
2/2
2/2
008
7/6
/20
09
11/
18/
2010
4/1
/20
12
8/1
4/2
013
12/
27/
2014
Co
nc
en
tra
tio
n (
mg
/L)
Selenium in KVPB-6: 2004-2011 Data

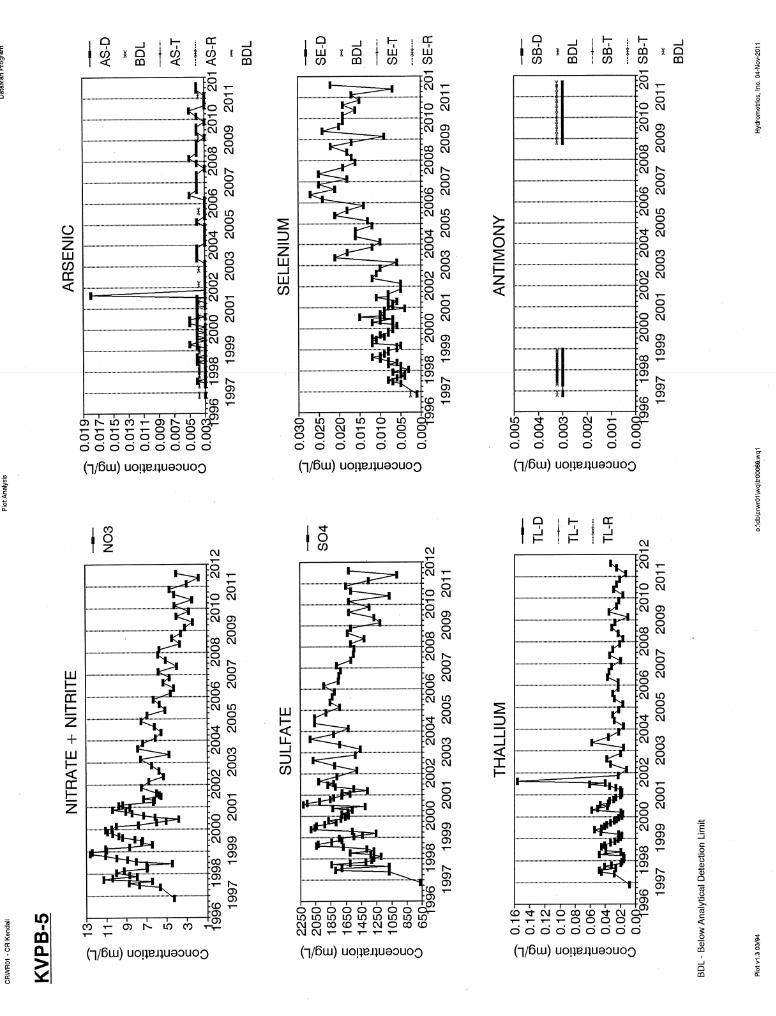
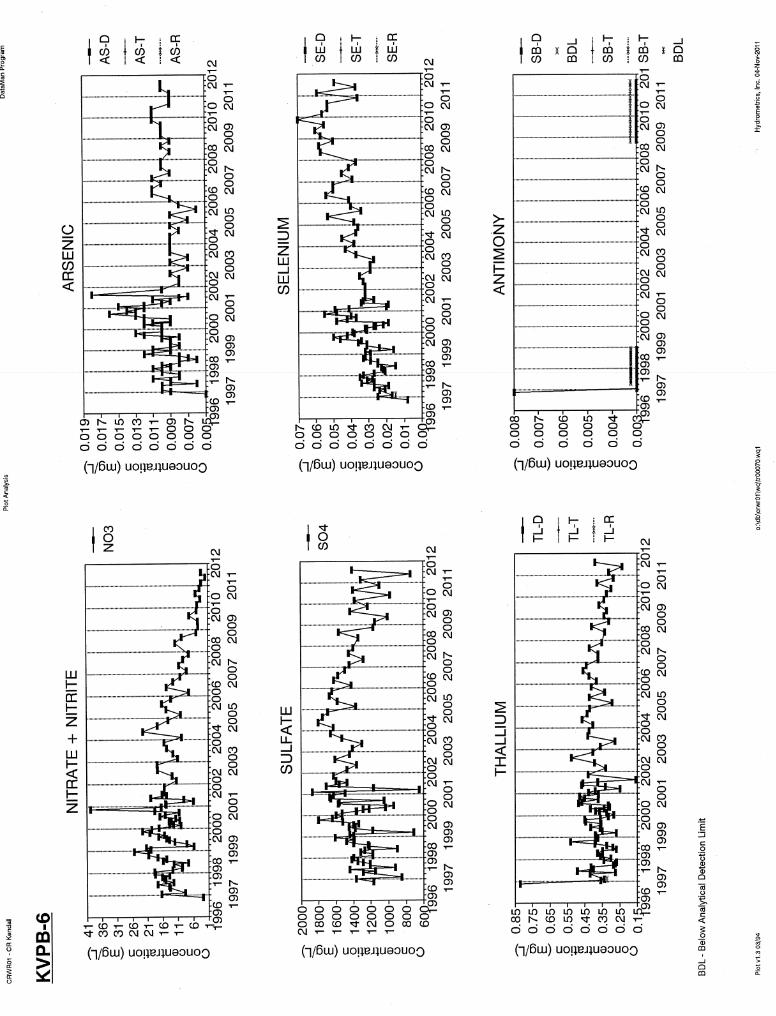

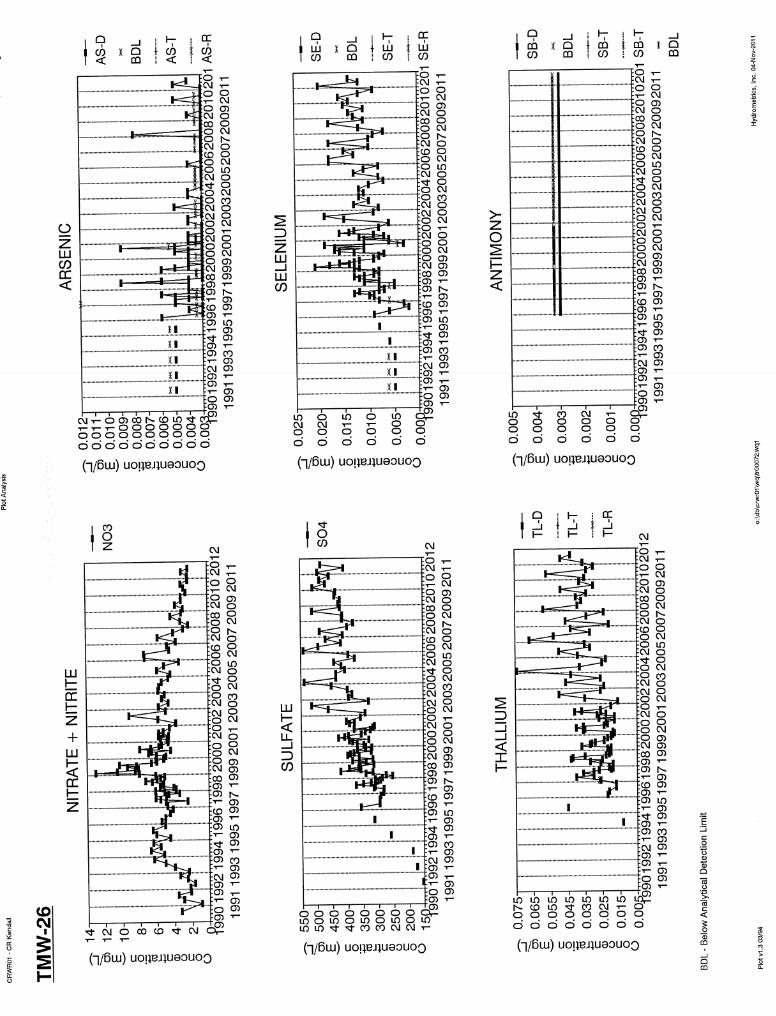


Statistical Summary CRWR01 - CR Kendall Water Resource
NOTES: All quantities in mg/L (Water) or mg/kg (Soil) unless noted. All results LABORATORY unless field (FLD) or calculated
(CALCN: Number of samples in comparison data set; # OF DET: Number of samples in data set above detection limit; SD: is
Standard Deviat50% of data set must be above lab detection limit before mean, median, standard deviation, and 95th percentile
are calculated.
HP
1 of 7 Hydrometrics, Inc. 7/26/2012
SITE: KVPB-2
# OF MEAN UPPER 95th
PARAMETER PERIOD OF DATA N DET MIN MAX MEAN MEDIAN SD + 2 SD PERCENTILE
-------------------------- --------------------- ---- ---- ---------- ---------- ---------- ---------- ---------- ---------- ----------
DEPTH TO WATER LEVEL (FEET) N/A 0 0 0.0000 0.0000 0.0000
FLOW GPM 05/23/1997-08/18/1998 8 8 0.0000 10.0000 4.8250 3.5000 3.4735 11.7719 9.6000
PH (FLD) 11/19/1996-08/08/2011 88 88 6.4800 8.0900 7.2553 7.2450 0.3532 7.9618 7.7760
PH 11/19/1996-08/08/2011 95 95 6.3000 7.8000 7.2158 7.2000 0.2574 7.7305 7.7000
SC (UMHOS/CM AT 25 C) 11/19/1996-08/08/2011 95 95 662.0000 3560.0000 2528.8632 2530.0000 354.4655 3237.7941 3002.5000
TDS (MEASURED AT 180 C) 04/28/1997-05/21/2001 7 7 2140.0000 2630.0000 2398.5714 2400.0000 168.6642 2735.8999 2605.5000
TOTAL SUSPENDED SOLIDS 02/03/1997-11/17/2008 5 0 <10.0000 <10.0000
WATER TEMPERATURE (C) (FLD) 11/19/1996-08/08/2011 87 87 4.6000 14.8000 9.7322 9.6000 2.6556 15.0433 13.9300
TOTAL HARDNESS AS CACO3 04/28/1997-05/21/2001 7 7 1560.0000 1880.0000 1760.0000 1780.0000 134.1641 2028.3282 1876.5000
CALCIUM (CA) DIS 04/28/1997-05/21/2001 7 7 379.0000 463.0000 425.2857 430.0000 28.9063 483.0982 457.4000
MAGNESIUM (MG) DIS 04/28/1997-05/21/2001 7 7 138.0000 190.0000 169.5714 174.0000 17.4533 204.4781 187.2000
SODIUM (NA) DIS 04/28/1997-05/21/2001 7 7 4.0000 9.0000 5.7143 6.0000 1.7043 9.1230 7.9500
POTASSIUM (K) DIS 04/28/1997-05/21/2001 7 7 7.0000 10.0000 8.5714 9.0000 0.9759 10.5232 9.6500
TOTAL ALKALINITY AS CACO3 04/28/1997-05/21/2001 7 7 278.0000 389.0000 350.1429 360.0000 40.9285 431.9999 386.5500
BICARBONATE (HCO3) 04/28/1997-05/21/2001 7 7 339.0000 475.0000 427.4286 440.0000 50.0095 527.4476 471.8500
CARBONATE AS CO3 04/28/1997-05/21/2001 7 5 0.0000 <1.0000 0.1429 0.0000 0.2440 0.6308 <1.0000
SULFATE (SO4) 11/19/1996-08/08/2011 95 95 572.0000 1700.0000 1375.6947 1390.0000 177.3314 1730.3575 1610.0000
CHLORIDE (CL) 04/28/1997-05/18/1998 2 2 8.0000 14.0000 11.0000 11.0000 4.2426 19.4853 13.4000
NITRATE + NITRITE AS N 11/19/1996-08/08/2011 95 95 0.8000 14.7000 4.2222 2.7600 3.3616 10.9455 11.7250
PHOSPHORUS (P) TOT 04/28/1997-05/21/2001 8 4 <0.0010 1.1600 0.1501 <0.0053 0.4081 0.9663 0.7012
ANTIMONY (SB) DIS 11/19/1996-08/08/2011 89 87 <0.0030 0.0210 0.0053 0.0050 0.0000 0.0053 0.0060
ANTIMONY (SB) TRC 02/03/1997-01/13/1998 2 2 0.0050 0.0060 0.0055 0.0055 0.0000 0.0055 0.0059
ARSENIC (AS) DIS 11/19/1996-08/08/2011 95 95 0.0060 0.0490 0.0129 0.0110 0.0063 0.0254 0.0213
ARSENIC (AS) TRC 02/03/1997-01/13/1998 2 2 0.0100 0.0200 0.0150 0.0150 0.0071 0.0291 0.0190
CADMIUM (CD) DIS 04/28/1997-11/16/1998 4 3 <0.0001 0.0002 0.0001 0.0001 0.0000 0.0001 0.0002
CHROMIUM (CR) DIS 08/14/2000-08/14/2000 1 1 0.0050 0.0050 0.0050 0.0050 0.0000 0.0050 **********
COPPER (CU) DIS 04/28/1997-11/16/1998 4 2 <0.0010 0.0040 0.0020 <0.0018 0.0000 0.0020 0.0038
IRON (FE) DIS 11/19/1996-05/21/2001 25 19 <0.0100 1.5100 0.1138 0.0600 0.2940 0.7017 0.1525
IRON (FE) TRC 02/03/1997-01/13/1998 2 2 0.0400 1.4800 0.7600 0.7600 1.0182 2.7965 1.3360
LEAD (PB) DIS 04/28/1997-11/16/1998 4 0 <0.0030 <0.0030
MANGANESE (MN) DIS 11/19/1996-05/21/2001 25 25 0.0180 0.1030 0.0572 0.0560 0.0218 0.1009 0.0900
MANGANESE (MN) TRC 02/03/1997-01/13/1998 2 2 0.0400 0.0580 0.0490 0.0490 0.0127 0.0745 0.0562
MERCURY (HG) DIS 04/28/1997-05/18/1998 2 0 <0.0006 <0.0006
NICKEL (NI) DIS 04/28/1997-05/18/1998 2 1 <0.0200 0.0400 0.0250 <0.0250 0.0212 0.0674 0.0380
SELENIUM (SE) DIS 11/19/1996-08/08/2011 95 95 0.0060 0.0300 0.0129 0.0120 0.0046 0.0222 0.0220
SELENIUM (SE) TRC 02/03/1997-01/13/1998 2 2 0.0110 0.0150 0.0130 0.0130 0.0000 0.0130 0.0146
SILVER (AG) DIS 04/28/1997-05/18/1998 2 0 <0.0030 <0.0030
THALLIUM (TL) DIS 11/19/1996-08/08/2011 95 95 0.3000 1.6900 1.1184 1.1200 0.2851 1.6887 1.5550
THALLIUM (TL) TRC 02/03/1997-01/13/1998 2 2 0.7220 0.7910 0.7565 0.7565 0.0488 0.8541 0.7841
ZINC (ZN) DIS 04/28/1997-05/21/2001 7 7 0.1700 0.3500 0.2429 0.2400 0.0594 0.3616 0.3255

Statistical Summary CRWR01 - CR Kendall Water Resource
NOTES: All quantities in mg/L (Water) or mg/kg (Soil) unless noted. All results LABORATORY unless field (FLD) or calculated
(CALCN: Number of samples in comparison data set; # OF DET: Number of samples in data set above detection limit; SD: is
Standard Deviat50% of data set must be above lab detection limit before mean, median, standard deviation, and 95th percentile
are calculated.
HP
2 of 7 Hydrometrics, Inc. 7/26/2012
SITE: KVPB-5
# OF MEAN UPPER 95th
PARAMETER PERIOD OF DATA N DET MIN MAX MEAN MEDIAN SD + 2 SD PERCENTILE
-------------------------- --------------------- ---- ---- ---------- ---------- ---------- ---------- ---------- ---------- ----------
FLOW GPM 05/23/1997-01/13/1998 6 6 4.5000 18.0000 10.9167 9.5000 5.8345 22.5857 18.0000
PH (FLD) 11/20/1996-08/09/2011 85 85 6.5200 8.0900 7.5073 7.5100 0.2935 8.0943 8.0075
PH 11/20/1996-08/09/2011 94 94 6.4000 7.9000 7.4117 7.4000 0.2290 7.8697 7.7000
SC (UMHOS/CM AT 25 C) 11/20/1996-08/09/2011 94 94 1750.0000 3370.0000 2676.4894 2730.0000 306.3300 3289.1494 3110.0000
TDS (MEASURED AT 180 C) 11/11/1997-05/21/2001 6 6 2140.0000 3300.0000 2740.0000 2820.0000 416.3172 3572.6344 3198.0000
TOTAL SUSPENDED SOLIDS 01/13/1998-11/17/2008 4 1 1.0000 <10.0000
WATER TEMPERATURE (C) (FLD) 11/20/1996-08/09/2011 86 86 3.3000 13.6000 8.5081 8.6500 2.6863 13.8808 12.5700
TOTAL HARDNESS AS CACO3 11/11/1997-05/21/2001 6 6 1610.0000 2580.0000 2003.3333 1965.0000 346.9102 2697.1537 2460.0000
CALCIUM (CA) DIS 11/11/1997-05/21/2001 6 6 331.0000 486.0000 401.8333 392.5000 54.1606 510.1545 471.3000
MAGNESIUM (MG) DIS 11/11/1997-05/21/2001 6 6 166.0000 332.0000 243.3333 256.5000 63.7924 370.9181 315.2000
SODIUM (NA) DIS 11/11/1997-05/21/2001 6 6 9.0000 12.0000 10.3333 10.0000 1.0328 12.3989 11.7000
POTASSIUM (K) DIS 11/11/1997-05/21/2001 6 6 5.0000 9.0000 6.0000 5.5000 1.5492 9.0984 8.1000
TOTAL ALKALINITY AS CACO3 11/11/1997-05/21/2001 6 6 203.0000 431.0000 293.6667 283.5000 76.4975 446.6617 394.1000
BICARBONATE (HCO3) 11/11/1997-05/21/2001 6 6 247.0000 526.0000 358.1667 346.0000 93.4717 545.1102 480.7000
CARBONATE AS CO3 11/11/1997-05/21/2001 6 4 0.0000 <1.0000 0.1667 0.0000 0.2582 0.6831 <1.0000
SULFATE (SO4) 11/20/1996-08/09/2011 94 94 673.0000 2210.0000 1650.9787 1675.0000 283.7514 2218.4815 2066.0000
CHLORIDE (CL) 05/20/1998-05/20/1998 1 1 14.0000 14.0000 14.0000 14.0000 0.0000 14.0000 **********
NITRATE + NITRITE AS N 11/20/1996-08/09/2011 94 94 1.8100 12.6000 6.8991 6.4650 2.4876 11.8744 11.1000
PHOSPHORUS (P) TOT 11/11/1997-05/21/2001 7 6 <0.0010 0.0360 0.0176 0.0180 0.0126 0.0428 0.0339
ANTIMONY (SB) DIS 11/20/1996-08/09/2011 32 0 <0.0030 <0.0030
ANTIMONY (SB) TRC 01/13/1998-01/13/1998 1 0 <0.0030 <0.0030
ARSENIC (AS) DIS 11/20/1996-08/09/2011 94 75 <0.0030 0.0180 0.0034 0.0030 0.0000 0.0034 0.0050
ARSENIC (AS) TRC 01/13/1998-01/13/1998 1 0 <0.0030 <0.0030
CADMIUM (CD) DIS 11/11/1997-11/19/1998 3 0 <0.0001 <0.0001
COPPER (CU) DIS 11/11/1997-11/19/1998 3 1 <0.0010 0.0020
IRON (FE) DIS 11/20/1996-05/21/2001 23 5 <0.0100 1.5000
IRON (FE) TRC 01/13/1998-01/13/1998 1 1 1.4900 1.4900 1.4900 1.4900 0.0000 1.4900 **********
LEAD (PB) DIS 11/11/1997-11/19/1998 3 0 <0.0030 <0.0030
MANGANESE (MN) DIS 11/20/1996-05/21/2001 23 22 <0.0050 0.3790 0.0906 0.0740 0.0765 0.2437 0.1723
MANGANESE (MN) TRC 01/13/1998-01/13/1998 1 1 0.0730 0.0730 0.0730 0.0730 0.0000 0.0730 **********
MERCURY (HG) DIS 05/20/1998-05/20/1998 1 0 <0.0006 <0.0006
NICKEL (NI) DIS 05/20/1998-05/20/1998 1 0 <0.0200 <0.0200
SELENIUM (SE) DIS 11/20/1996-08/09/2011 94 93 <0.0010 0.0270 0.0115 0.0100 0.0060 0.0234 0.0226
SELENIUM (SE) TRC 01/13/1998-01/13/1998 1 1 0.0050 0.0050 0.0050 0.0050 0.0000 0.0050 **********
SILVER (AG) DIS 05/20/1998-05/20/1998 1 0 <0.0030 <0.0030
THALLIUM (TL) DIS 11/20/1996-08/09/2011 94 94 0.0080 0.1560 0.0301 0.0270 0.0174 0.0650 0.0512
THALLIUM (TL) TRC 01/13/1998-01/13/1998 1 1 0.0160 0.0160 0.0160 0.0160 0.0000 0.0160 **********
ZINC (ZN) DIS 11/11/1997-05/21/2001 6 6 0.0200 0.0700 0.0417 0.0400 0.0172 0.0761 0.0640
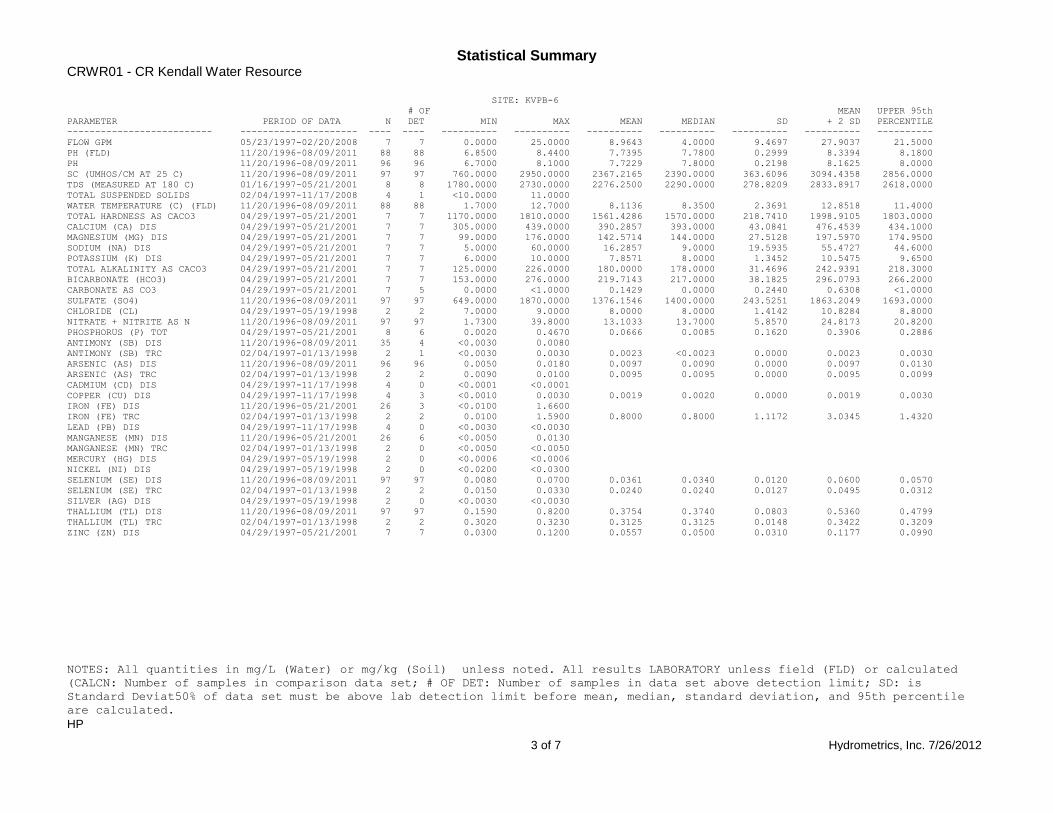
Statistical Summary CRWR01 - CR Kendall Water Resource
NOTES: All quantities in mg/L (Water) or mg/kg (Soil) unless noted. All results LABORATORY unless field (FLD) or calculated
(CALCN: Number of samples in comparison data set; # OF DET: Number of samples in data set above detection limit; SD: is
Standard Deviat50% of data set must be above lab detection limit before mean, median, standard deviation, and 95th percentile
are calculated.
HP
3 of 7 Hydrometrics, Inc. 7/26/2012
SITE: KVPB-6
# OF MEAN UPPER 95th
PARAMETER PERIOD OF DATA N DET MIN MAX MEAN MEDIAN SD + 2 SD PERCENTILE
-------------------------- --------------------- ---- ---- ---------- ---------- ---------- ---------- ---------- ---------- ----------
FLOW GPM 05/23/1997-02/20/2008 7 7 0.0000 25.0000 8.9643 4.0000 9.4697 27.9037 21.5000
PH (FLD) 11/20/1996-08/09/2011 88 88 6.8500 8.4400 7.7395 7.7800 0.2999 8.3394 8.1800
PH 11/20/1996-08/09/2011 96 96 6.7000 8.1000 7.7229 7.8000 0.2198 8.1625 8.0000
SC (UMHOS/CM AT 25 C) 11/20/1996-08/09/2011 97 97 760.0000 2950.0000 2367.2165 2390.0000 363.6096 3094.4358 2856.0000
TDS (MEASURED AT 180 C) 01/16/1997-05/21/2001 8 8 1780.0000 2730.0000 2276.2500 2290.0000 278.8209 2833.8917 2618.0000
TOTAL SUSPENDED SOLIDS 02/04/1997-11/17/2008 4 1 <10.0000 11.0000
WATER TEMPERATURE (C) (FLD) 11/20/1996-08/09/2011 88 88 1.7000 12.7000 8.1136 8.3500 2.3691 12.8518 11.4000
TOTAL HARDNESS AS CACO3 04/29/1997-05/21/2001 7 7 1170.0000 1810.0000 1561.4286 1570.0000 218.7410 1998.9105 1803.0000
CALCIUM (CA) DIS 04/29/1997-05/21/2001 7 7 305.0000 439.0000 390.2857 393.0000 43.0841 476.4539 434.1000
MAGNESIUM (MG) DIS 04/29/1997-05/21/2001 7 7 99.0000 176.0000 142.5714 144.0000 27.5128 197.5970 174.9500
SODIUM (NA) DIS 04/29/1997-05/21/2001 7 7 5.0000 60.0000 16.2857 9.0000 19.5935 55.4727 44.6000
POTASSIUM (K) DIS 04/29/1997-05/21/2001 7 7 6.0000 10.0000 7.8571 8.0000 1.3452 10.5475 9.6500
TOTAL ALKALINITY AS CACO3 04/29/1997-05/21/2001 7 7 125.0000 226.0000 180.0000 178.0000 31.4696 242.9391 218.3000
BICARBONATE (HCO3) 04/29/1997-05/21/2001 7 7 153.0000 276.0000 219.7143 217.0000 38.1825 296.0793 266.2000
CARBONATE AS CO3 04/29/1997-05/21/2001 7 5 0.0000 <1.0000 0.1429 0.0000 0.2440 0.6308 <1.0000
SULFATE (SO4) 11/20/1996-08/09/2011 97 97 649.0000 1870.0000 1376.1546 1400.0000 243.5251 1863.2049 1693.0000
CHLORIDE (CL) 04/29/1997-05/19/1998 2 2 7.0000 9.0000 8.0000 8.0000 1.4142 10.8284 8.8000
NITRATE + NITRITE AS N 11/20/1996-08/09/2011 97 97 1.7300 39.8000 13.1033 13.7000 5.8570 24.8173 20.8200
PHOSPHORUS (P) TOT 04/29/1997-05/21/2001 8 6 0.0020 0.4670 0.0666 0.0085 0.1620 0.3906 0.2886
ANTIMONY (SB) DIS 11/20/1996-08/09/2011 35 4 <0.0030 0.0080
ANTIMONY (SB) TRC 02/04/1997-01/13/1998 2 1 <0.0030 0.0030 0.0023 <0.0023 0.0000 0.0023 0.0030
ARSENIC (AS) DIS 11/20/1996-08/09/2011 96 96 0.0050 0.0180 0.0097 0.0090 0.0000 0.0097 0.0130
ARSENIC (AS) TRC 02/04/1997-01/13/1998 2 2 0.0090 0.0100 0.0095 0.0095 0.0000 0.0095 0.0099
CADMIUM (CD) DIS 04/29/1997-11/17/1998 4 0 <0.0001 <0.0001
COPPER (CU) DIS 04/29/1997-11/17/1998 4 3 <0.0010 0.0030 0.0019 0.0020 0.0000 0.0019 0.0030
IRON (FE) DIS 11/20/1996-05/21/2001 26 3 <0.0100 1.6600
IRON (FE) TRC 02/04/1997-01/13/1998 2 2 0.0100 1.5900 0.8000 0.8000 1.1172 3.0345 1.4320
LEAD (PB) DIS 04/29/1997-11/17/1998 4 0 <0.0030 <0.0030
MANGANESE (MN) DIS 11/20/1996-05/21/2001 26 6 <0.0050 0.0130
MANGANESE (MN) TRC 02/04/1997-01/13/1998 2 0 <0.0050 <0.0050
MERCURY (HG) DIS 04/29/1997-05/19/1998 2 0 <0.0006 <0.0006
NICKEL (NI) DIS 04/29/1997-05/19/1998 2 0 <0.0200 <0.0300
SELENIUM (SE) DIS 11/20/1996-08/09/2011 97 97 0.0080 0.0700 0.0361 0.0340 0.0120 0.0600 0.0570
SELENIUM (SE) TRC 02/04/1997-01/13/1998 2 2 0.0150 0.0330 0.0240 0.0240 0.0127 0.0495 0.0312
SILVER (AG) DIS 04/29/1997-05/19/1998 2 0 <0.0030 <0.0030
THALLIUM (TL) DIS 11/20/1996-08/09/2011 97 97 0.1590 0.8200 0.3754 0.3740 0.0803 0.5360 0.4799
THALLIUM (TL) TRC 02/04/1997-01/13/1998 2 2 0.3020 0.3230 0.3125 0.3125 0.0148 0.3422 0.3209
ZINC (ZN) DIS 04/29/1997-05/21/2001 7 7 0.0300 0.1200 0.0557 0.0500 0.0310 0.1177 0.0990

Statistical Summary CRWR01 - CR Kendall Water Resource
NOTES: All quantities in mg/L (Water) or mg/kg (Soil) unless noted. All results LABORATORY unless field (FLD) or calculated
(CALCN: Number of samples in comparison data set; # OF DET: Number of samples in data set above detection limit; SD: is
Standard Deviat50% of data set must be above lab detection limit before mean, median, standard deviation, and 95th percentile
are calculated.
HP
4 of 7 Hydrometrics, Inc. 7/26/2012
SITE: PROCESS PAD DRAINAGE
# OF MEAN UPPER 95th
PARAMETER PERIOD OF DATA N DET MIN MAX MEAN MEDIAN SD + 2 SD PERCENTILE
-------------------------- --------------------- ---- ---- ---------- ---------- ---------- ---------- ---------- ---------- ----------
DEPTH TO WATER LEVEL (FEET) 05/21/2001-05/21/2001 1 1 0.0000 0.0000 0.0000 0.0000 0.0000 0.0000 **********
FLOW GPM 11/17/1992-02/17/1999 3 3 0.0000 0.0000 0.0000 0.0000 0.0000 0.0000 0.0000
PH (FLD) 05/19/1992-08/10/2011 62 62 7.0600 11.7300 8.6273 8.1100 1.2350 11.0972 11.3990
PH 02/21/1989-08/10/2011 75 75 6.9000 12.0000 8.7653 7.8000 1.5069 11.7791 11.5500
SC (UMHOS/CM AT 25 C) 02/21/1989-08/10/2011 75 75 2150.0000 5370.0000 3583.2000 3520.0000 624.6408 4832.4816 4570.0000
TDS (MEASURED AT 180 C) 02/21/1989-05/21/2001 19 19 1020.0000 5100.0000 3765.7895 4040.0000 851.3148 5468.4190 4454.0000
TOTAL SUSPENDED SOLIDS 09/28/1989-08/16/2006 9 5 <1.0000 16.0000 5.6111 <10.0000 4.4284 14.4680 12.4000
WATER TEMPERATURE (C) (FLD) 05/19/1992-08/10/2011 63 63 1.7000 18.2000 9.9983 10.2000 3.1234 16.2451 13.3700
TOTAL HARDNESS AS CACO3 02/21/1989-05/21/2001 25 25 367.0000 2090.0000 1381.4800 1460.0000 431.8597 2245.1995 1822.5000
CALCIUM (CA) DIS 02/21/1989-05/21/2001 25 25 147.0000 820.0000 541.1200 584.0000 165.4102 871.9404 714.7500
MAGNESIUM (MG) DIS 02/21/1989-05/21/2001 25 19 <1.0000 21.0000 7.7200 4.0000 6.8846 21.4892 18.5000
SODIUM (NA) DIS 02/21/1989-05/21/2001 26 26 221.0000 588.0000 413.0000 441.5000 87.7118 588.4236 498.9000
POTASSIUM (K) DIS 02/21/1989-05/21/2001 25 25 6.0000 17.0000 10.7600 10.0000 2.5703 15.9007 14.7500
TOTAL ALKALINITY AS CACO3 02/21/1989-05/21/2001 26 26 25.0000 582.0000 124.0769 62.5000 149.2780 422.6329 426.5000
BICARBONATE (HCO3) 02/21/1989-05/21/2001 25 25 0.0000 79.0000 28.2000 30.0000 22.6016 73.4032 69.5000
CARBONATE AS CO3 02/21/1989-05/21/2001 25 23 0.0000 223.0000 40.3600 <1.0000 60.7136 161.7871 149.0000
SULFATE (SO4) 02/21/1989-08/10/2011 60 60 66.0000 2510.0000 1717.8833 1770.0000 443.1157 2604.1148 2250.0000
CHLORIDE (CL) 02/21/1989-02/17/1999 22 22 15.0000 83.0000 38.2727 36.0000 17.5396 73.3519 58.9000
FLUORIDE (F) 02/21/1989-02/04/1997 13 13 1.4000 5.9000 2.3600 1.9500 1.2643 4.8886 4.7950
TOTAL AMMONIA (NH3+NH4 AS N) 08/24/1995-08/20/2001 25 13 <0.0500 24.1000 4.1824 0.0500 7.8952 19.9727 21.2250
TOTAL KJELDAHL NITROGEN AS N 05/31/1990-08/20/2001 24 21 <0.1000 91.7000 26.9104 7.0000 30.3707 87.6518 82.0400
NITROGEN, TOTAL (NO3 + NO2 + 02/16/2000-02/16/2000 1 1 129.0000 129.0000 129.0000 129.0000 0.0000 129.0000 **********
NITRATE + NITRITE AS N 02/21/1989-08/10/2011 75 75 0.1700 195.0000 71.6416 84.0000 49.7558 171.1532 137.5000
ORTHOPHOSPHATE (PO4-P) 11/29/1995-11/29/1995 1 1 0.1600 0.1600 0.1600 0.1600 0.0000 0.1600 **********
PHOSPHORUS (P) TOT 08/24/1995-05/21/2001 17 14 <0.0050 0.8560 0.0823 0.0230 0.2017 0.4858 0.2219
ALUMINUM (AL) DIS 08/24/1995-02/17/1999 6 0 <0.1000 <0.1000
ALUMINUM (AL) TRC 04/29/1997-04/29/1997 1 0 <0.1000 <0.1000
ANTIMONY (SB) DIS 08/24/1995-08/10/2011 50 50 0.0110 0.0330 0.0215 0.0220 0.0038 0.0292 0.0270
ANTIMONY (SB) TRC 04/29/1997-08/16/2006 2 2 0.0180 0.0240 0.0210 0.0210 0.0042 0.0295 0.0234
ARSENIC (AS) DIS 02/21/1989-08/10/2011 55 55 0.1390 0.3750 0.2169 0.1990 0.0482 0.3134 0.3018
ARSENIC (AS) TRC 05/31/1990-08/16/2006 7 7 0.1340 0.3900 0.2237 0.2080 0.0795 0.3828 0.3354
BARIUM (BA) DIS 08/24/1995-04/29/1997 5 5 0.0160 0.0210 0.0184 0.0170 0.0000 0.0184 0.0210
BARIUM (BA) TRC 04/29/1997-04/29/1997 1 1 0.0130 0.0130 0.0130 0.0130 0.0000 0.0130 **********
BERYLLIUM (BE) DIS 08/24/1995-05/13/1996 4 0 <0.0010 <0.0010
CADMIUM (CD) DIS 02/21/1989-02/17/1999 17 12 <0.0001 0.0330 0.0058 0.0004 0.0106 0.0271 0.0322
CADMIUM (CD) TRC 05/31/1990-04/29/1997 6 6 0.0003 0.0520 0.0284 0.0250 0.0183 0.0650 0.0499
CHROMIUM (CR) DIS 08/24/1995-08/15/2000 5 2 <0.0010 0.0240
COPPER (CU) DIS 02/21/1989-02/17/1999 17 17 0.0040 3.1100 0.4390 0.0220 0.8083 2.0555 1.8180
COPPER (CU) TRC 05/31/1990-04/29/1997 6 6 0.0110 2.6100 1.6018 1.5900 0.9859 3.5737 2.6010
IRON (FE) DIS 02/21/1989-05/21/2001 21 20 <0.0100 0.3200 0.1483 0.1500 0.0753 0.2988 0.2295
IRON (FE) TRC 05/31/1990-04/29/1997 6 6 0.0600 0.4600 0.1933 0.1200 0.1576 0.5085 0.4150
LEAD (PB) DIS 02/21/1989-02/17/1999 16 6 <0.0030 0.0100
LEAD (PB) TRC 04/29/1997-04/29/1997 1 1 0.0060 0.0060 0.0060 0.0060 0.0000 0.0060 **********
MANGANESE (MN) DIS 08/24/1995-05/21/2001 18 10 <0.0050 0.0410 0.0124 <0.0128 0.0110 0.0344 0.0266
MANGANESE (MN) TRC 04/29/1997-04/29/1997 1 1 0.0290 0.0290 0.0290 0.0290 0.0000 0.0290 **********
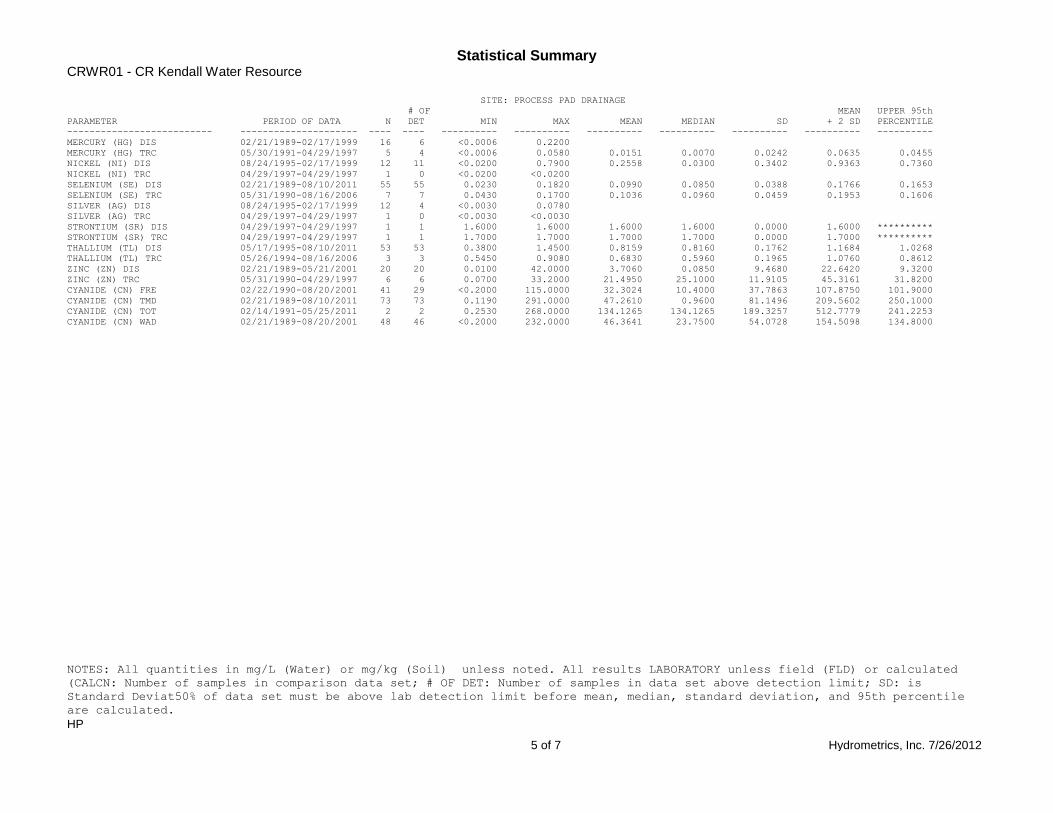
Statistical Summary CRWR01 - CR Kendall Water Resource
NOTES: All quantities in mg/L (Water) or mg/kg (Soil) unless noted. All results LABORATORY unless field (FLD) or calculated
(CALCN: Number of samples in comparison data set; # OF DET: Number of samples in data set above detection limit; SD: is
Standard Deviat50% of data set must be above lab detection limit before mean, median, standard deviation, and 95th percentile
are calculated.
HP
5 of 7 Hydrometrics, Inc. 7/26/2012
SITE: PROCESS PAD DRAINAGE
# OF MEAN UPPER 95th
PARAMETER PERIOD OF DATA N DET MIN MAX MEAN MEDIAN SD + 2 SD PERCENTILE
-------------------------- --------------------- ---- ---- ---------- ---------- ---------- ---------- ---------- ---------- ----------
MERCURY (HG) DIS 02/21/1989-02/17/1999 16 6 <0.0006 0.2200
MERCURY (HG) TRC 05/30/1991-04/29/1997 5 4 <0.0006 0.0580 0.0151 0.0070 0.0242 0.0635 0.0455
NICKEL (NI) DIS 08/24/1995-02/17/1999 12 11 <0.0200 0.7900 0.2558 0.0300 0.3402 0.9363 0.7360
NICKEL (NI) TRC 04/29/1997-04/29/1997 1 0 <0.0200 <0.0200
SELENIUM (SE) DIS 02/21/1989-08/10/2011 55 55 0.0230 0.1820 0.0990 0.0850 0.0388 0.1766 0.1653
SELENIUM (SE) TRC 05/31/1990-08/16/2006 7 7 0.0430 0.1700 0.1036 0.0960 0.0459 0.1953 0.1606
SILVER (AG) DIS 08/24/1995-02/17/1999 12 4 <0.0030 0.0780
SILVER (AG) TRC 04/29/1997-04/29/1997 1 0 <0.0030 <0.0030
STRONTIUM (SR) DIS 04/29/1997-04/29/1997 1 1 1.6000 1.6000 1.6000 1.6000 0.0000 1.6000 **********
STRONTIUM (SR) TRC 04/29/1997-04/29/1997 1 1 1.7000 1.7000 1.7000 1.7000 0.0000 1.7000 **********
THALLIUM (TL) DIS 05/17/1995-08/10/2011 53 53 0.3800 1.4500 0.8159 0.8160 0.1762 1.1684 1.0268
THALLIUM (TL) TRC 05/26/1994-08/16/2006 3 3 0.5450 0.9080 0.6830 0.5960 0.1965 1.0760 0.8612
ZINC (ZN) DIS 02/21/1989-05/21/2001 20 20 0.0100 42.0000 3.7060 0.0850 9.4680 22.6420 9.3200
ZINC (ZN) TRC 05/31/1990-04/29/1997 6 6 0.0700 33.2000 21.4950 25.1000 11.9105 45.3161 31.8200
CYANIDE (CN) FRE 02/22/1990-08/20/2001 41 29 <0.2000 115.0000 32.3024 10.4000 37.7863 107.8750 101.9000
CYANIDE (CN) TMD 02/21/1989-08/10/2011 73 73 0.1190 291.0000 47.2610 0.9600 81.1496 209.5602 250.1000
CYANIDE (CN) TOT 02/14/1991-05/25/2011 2 2 0.2530 268.0000 134.1265 134.1265 189.3257 512.7779 241.2253
CYANIDE (CN) WAD 02/21/1989-08/20/2001 48 46 <0.2000 232.0000 46.3641 23.7500 54.0728 154.5098 134.8000

Statistical Summary CRWR01 - CR Kendall Water Resource
NOTES: All quantities in mg/L (Water) or mg/kg (Soil) unless noted. All results LABORATORY unless field (FLD) or calculated
(CALCN: Number of samples in comparison data set; # OF DET: Number of samples in data set above detection limit; SD: is
Standard Deviat50% of data set must be above lab detection limit before mean, median, standard deviation, and 95th percentile
are calculated.
HP
6 of 7 Hydrometrics, Inc. 7/26/2012
SITE: TMW-26
# OF MEAN UPPER 95th
PARAMETER PERIOD OF DATA N DET MIN MAX MEAN MEDIAN SD + 2 SD PERCENTILE
-------------------------- --------------------- ---- ---- ---------- ---------- ---------- ---------- ---------- ---------- ----------
DEPTH TO WATER LEVEL (FEET) N/A 0 0 0.0000 0.0000 0.0000
ELEC COND (UMHOS/CM AT 25 C) N/A 0 0 0.0000 0.0000 0.0000
FLOW GPM 11/17/1992-11/11/1997 25 25 0.0000 23.6300 4.5252 2.0000 6.0920 16.7091 15.0000
PH (FLD) 02/19/1992-08/10/2011 103 103 3.3000 7.7800 7.1678 7.2200 0.4608 8.0893 7.6300
PH 08/28/1990-08/10/2011 117 117 6.2000 7.9000 7.2291 7.2000 0.2360 7.7011 7.6000
SC (UMHOS/CM AT 25 C) 08/28/1990-08/10/2011 117 117 802.0000 1610.0000 1334.7863 1340.0000 132.4155 1599.6173 1530.0000
TDS (MEASURED AT 180 C) 02/28/1996-05/17/2000 10 10 841.0000 1040.0000 941.0000 925.5000 63.9218 1068.8437 1025.0000
TOTAL SUSPENDED SOLIDS 02/04/1997-11/18/2008 4 1 <10.0000 62.0000
WATER TEMPERATURE (C) (FLD) 02/19/1992-08/10/2011 105 105 5.5000 13.4000 9.6486 9.6000 1.7045 13.0575 12.5500
TOTAL HARDNESS AS CACO3 05/30/1991-05/21/2001 16 16 559.0000 829.0000 716.2500 725.0000 73.5096 863.2693 811.4000
CALCIUM (CA) DIS 05/30/1991-05/21/2001 16 16 147.0000 228.0000 194.8125 200.0000 22.6281 240.0686 219.2000
MAGNESIUM (MG) DIS 05/30/1991-05/21/2001 16 16 46.0000 66.0000 56.0000 54.5000 5.3417 66.6833 65.2000
SODIUM (NA) DIS 05/30/1991-05/21/2001 16 16 12.0000 28.0000 21.3125 21.0000 4.2066 29.7258 27.2000
POTASSIUM (K) DIS 05/30/1991-05/21/2001 16 16 3.0000 4.0000 3.1875 3.0000 0.4031 3.9937 4.0000
TOTAL ALKALINITY AS CACO3 05/30/1991-05/17/2000 15 15 354.0000 449.0000 399.5333 396.0000 24.2807 448.0947 434.7500
BICARBONATE (HCO3) 05/30/1991-05/17/2000 15 15 433.0000 547.0000 487.7333 484.0000 29.4339 546.6011 530.5000
CARBONATE AS CO3 05/30/1991-05/17/2000 15 14 0.0000 <1.0000 0.0333 0.0000 0.1291 0.2915 <0.2500
SULFATE (SO4) 05/30/1991-08/10/2011 101 101 154.0000 541.0000 374.2772 376.0000 73.5664 521.4101 492.9500
CHLORIDE (CL) 05/30/1991-11/18/1998 12 12 4.0000 45.0000 28.8333 29.0000 10.9115 50.6563 42.0000
FLUORIDE (F) 05/30/1991-08/28/1996 8 8 0.4300 0.7200 0.5425 0.5050 0.1172 0.7769 0.7200
TOTAL AMMONIA (NH3+NH4 AS N) 02/28/1996-08/20/2001 22 0 <0.0500 <0.0500
TOTAL KJELDAHL NITROGEN AS N 05/30/1991-08/20/2001 20 11 <0.1000 1.1000 0.3825 0.2899 0.9622 0.8000
NITROGEN, TOTAL (NO3 + NO2 + 02/16/2000-02/16/2000 1 1 4.9000 4.9000 4.9000 4.9000 0.0000 4.9000 **********
NITRATE + NITRITE AS N 08/28/1990-08/10/2011 118 118 0.8800 13.0000 5.0417 5.0250 1.9261 8.8938 8.3140
PHOSPHORUS (P) TOT 02/28/1996-05/21/2001 12 9 <0.0050 0.1050 0.0225 0.0160 0.0287 0.0799 0.0660
ALUMINUM (AL) DIS 02/28/1996-05/14/1996 2 0 <0.1000 <0.1000
ANTIMONY (SB) DIS 02/28/1996-08/10/2011 90 0 <0.0030 <0.0030
ANTIMONY (SB) TRC 02/04/1997-01/13/1998 2 1 <0.0030 0.0030 0.0023 <0.0023 0.0000 0.0023 0.0030
ARSENIC (AS) DIS 05/30/1991-08/10/2011 102 65 <0.0030 0.0090 0.0032 0.0030 0.0000 0.0032 0.0060
ARSENIC (AS) TRC 02/04/1997-01/13/1998 2 2 0.0030 0.0120 0.0075 0.0075 0.0064 0.0202 0.0111
BARIUM (BA) DIS 02/28/1996-05/14/1996 2 2 0.0460 0.0550 0.0505 0.0505 0.0064 0.0632 0.0541
BERYLLIUM (BE) DIS 02/28/1996-05/14/1996 2 0 <0.0010 <0.0010
CADMIUM (CD) DIS 05/30/1991-11/18/1998 12 2 <0.0001 0.0006
CHROMIUM (CR) DIS 02/28/1996-08/14/2000 3 0 <0.0010 <0.0030
COPPER (CU) DIS 05/30/1991-11/18/1998 12 2 <0.0010 <0.0100
IRON (FE) DIS 05/30/1991-05/21/2001 33 9 <0.0100 0.8400
IRON (FE) TRC 02/04/1997-01/13/1998 2 2 0.9000 1.0100 0.9550 0.9550 0.0778 1.1106 0.9990
LEAD (PB) DIS 02/28/1996-11/18/1998 7 0 <0.0030 <0.0030
MANGANESE (MN) DIS 02/28/1996-05/21/2001 28 27 <0.0050 0.0640 0.0310 0.0330 0.0181 0.0671 0.0606
MANGANESE (MN) TRC 02/04/1997-01/13/1998 2 2 0.0500 0.0660 0.0580 0.0580 0.0113 0.0806 0.0644
MERCURY (HG) DIS 05/30/1991-11/18/1998 11 0 <0.0006 <0.0010
NICKEL (NI) DIS 02/28/1996-11/18/1998 6 0 <0.0200 <0.0200
SELENIUM (SE) DIS 05/30/1991-08/10/2011 102 98 <0.0030 0.0210 0.0107 0.0110 0.0042 0.0192 0.0180
SELENIUM (SE) TRC 02/04/1997-01/13/1998 2 2 0.0060 0.0060 0.0060 0.0060 0.0000 0.0060 0.0060
SILVER (AG) DIS 02/28/1996-11/18/1998 6 0 <0.0030 <0.0030

Statistical Summary CRWR01 - CR Kendall Water Resource
NOTES: All quantities in mg/L (Water) or mg/kg (Soil) unless noted. All results LABORATORY unless field (FLD) or calculated
(CALCN: Number of samples in comparison data set; # OF DET: Number of samples in data set above detection limit; SD: is
Standard Deviat50% of data set must be above lab detection limit before mean, median, standard deviation, and 95th percentile
are calculated.
HP
7 of 7 Hydrometrics, Inc. 7/26/2012
SITE: TMW-26
# OF MEAN UPPER 95th
PARAMETER PERIOD OF DATA N DET MIN MAX MEAN MEDIAN SD + 2 SD PERCENTILE
-------------------------- --------------------- ---- ---- ---------- ---------- ---------- ---------- ---------- ---------- ----------
THALLIUM (TL) DIS 05/26/1994-08/10/2011 99 99 0.0130 0.0740 0.0311 0.0300 0.0117 0.0545 0.0502
THALLIUM (TL) TRC 02/04/1997-01/13/1998 2 2 0.0190 0.0270 0.0230 0.0230 0.0057 0.0343 0.0262
ZINC (ZN) DIS 05/30/1991-05/21/2001 15 15 0.0400 0.1800 0.0853 0.0800 0.0421 0.1695 0.1650
CYANIDE (CN) FRE 05/30/1991-08/20/2001 38 0 <0.2000 <0.2000
CYANIDE (CN) TMD 08/28/1990-08/10/2011 82 64 <0.0050 1.1500 0.0397 0.0140 0.1277 0.2952 0.1033
CYANIDE (CN) TOT 05/24/2011-05/24/2011 1 0 <0.0050 <0.0050
CYANIDE (CN) WAD 08/28/1990-08/20/2001 42 31 <0.0050 <0.2000 0.0141 0.0065 0.0213 0.0566 0.0414

Jim Volberding
P.O. Box 501 Lewistown, MT 59457
M E M O R A N D U M
DATE: November 29, 2011
TO: Jim Volberding, CR Kendall
FROM: Mark Rhodes, P.E. Hydrometrics Inc.
SUBJECT: HELP Model Results for the Approved Leach Pad Soil Cover Alternative
This memorandum summarizes the results of the Hydrologic Evaluation of Landfill Performance
(HELP) model (version 3.07, Schroeder et.al., 1994) analysis for the approved soil cover at the Kendall
Mine leach pad area. Climate and soil inputs to the model were obtained from the CDM Technical
Memorandum “Draft CR Kendall Leach Pad Alternatives” (CDM 2004). The approved soil cover
alternative consists of a water balance cover with 17 inches of topsoil underlain by 6 inches of 5% to
8% (only 5% was modeled) by volume sodium bentonite amended soil and 12 inches of subsoil. The
analysis of the cover alternative was broken into two components, leach pad tops (10% slope) and
leach pad slopes (34% slope). The model was then run to simulate performance over 100 years of
precipitation input. Climate input parameters, soil input parameters and HELP model results are
summarized in Tables 1 and 2, and Attachment A respectively.
Table 1. HELP Model Design Climate Inputs
Parameter Input & Units
Curve Number 79.8 Pad Top, 86.0 Pad Slope
Area 16.4 ac. Pad Top, 40 ac. Pad Slope
Evaporative Zone Depth 17 in. Pad Top, 12 in. Pad Slope
Station Latitude 47.04 Degrees
Max LAI 1.5 Pad Top, 1.0 Pad Slope
Start of Growing Season 24-Mar
End of Growing Season 14-Sep
Average Annual Wind Speed 10.6 mph
Avg. 1st Quarter RH 69%
Avg. 2nd Quarter RH 57%
Avg. 3rd Quarter RH 49%
Avg. 4th Quarter RH 66%
Hydrometrics, Inc.
consulting scientists and engineers
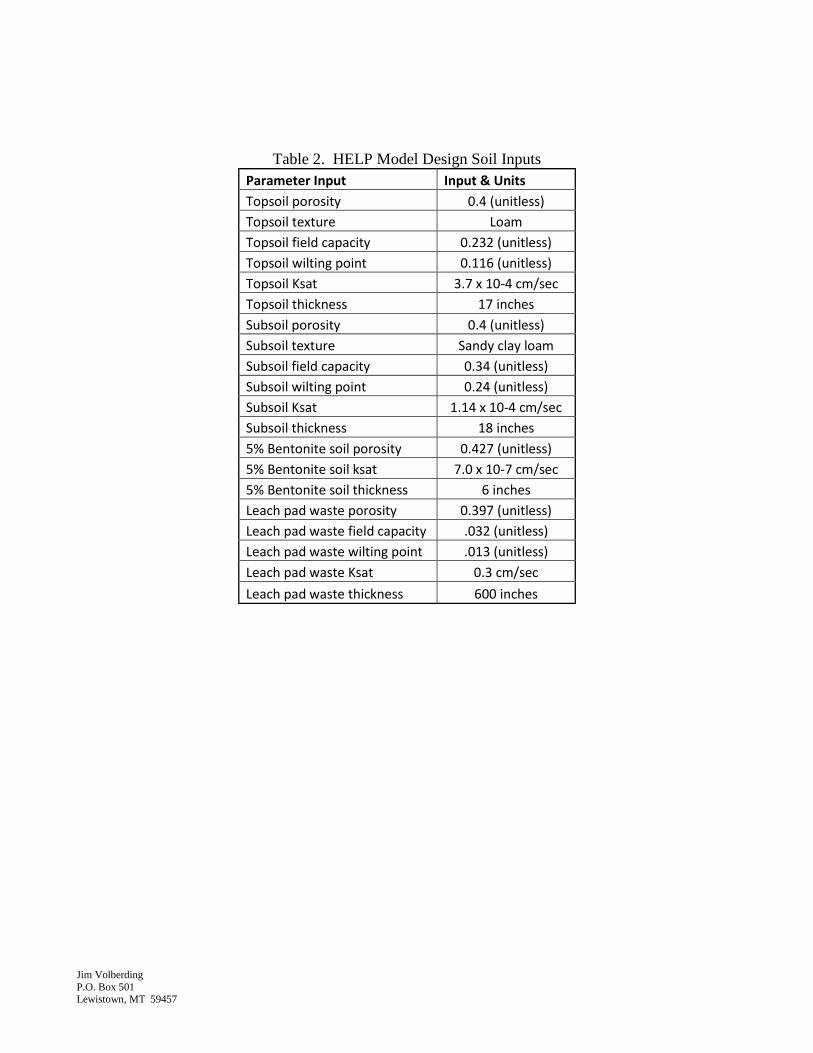
Jim Volberding
P.O. Box 501 Lewistown, MT 59457
Table 2. HELP Model Design Soil Inputs
Parameter Input Input & Units
Topsoil porosity 0.4 (unitless)
Topsoil texture Loam
Topsoil field capacity 0.232 (unitless)
Topsoil wilting point 0.116 (unitless)
Topsoil Ksat 3.7 x 10⁻⁴ cm/sec
Topsoil thickness 17 inches
Subsoil porosity 0.4 (unitless)
Subsoil texture Sandy clay loam
Subsoil field capacity 0.34 (unitless)
Subsoil wilting point 0.24 (unitless)
Subsoil Ksat 1.14 x 10⁻⁴ cm/sec
Subsoil thickness 18 inches
5% Bentonite soil porosity 0.427 (unitless)
5% Bentonite soil ksat 7.0 x 10⁻⁷ cm/sec
5% Bentonite soil thickness 6 inches
Leach pad waste porosity 0.397 (unitless)
Leach pad waste field capacity .032 (unitless)
Leach pad waste wilting point .013 (unitless)
Leach pad waste Ksat 0.3 cm/sec
Leach pad waste thickness 600 inches
Jim Volberding
P.O. Box 501 Lewistown, MT 59457
Results of the HELP model indicate the approved leach pad soil cover could reduce the amount of
leachate generation to an average of 3.4 gpm or 4.7% of total annual precipitation. It is important to
note that due to limitations of the HELP model and estimates of actual cover soil properties, the actual
seepage volumes may vary higher or lower than the predicted values. However, the results of the
analyses are useful in determining the effectiveness of the approved leach pad soil cover.
CDM, 2004. Technical Memorandum, “Draft CR Kendall Leach Pad Alternatives”.
Jim Volberding
P.O. Box 501 Lewistown, MT 59457
ATTACHMENT A
HELP MODEL RESULTS

Jim Volberding
P.O. Box 501 Lewistown, MT 59457
HELP MODEL RESULTS FOR LEACH PAD TOPS

Jim Volberding
P.O. Box 501 Lewistown, MT 59457

Jim Volberding
P.O. Box 501 Lewistown, MT 59457
****************************************************************************** ****************************************************************************** ** ** ** ** ** HYDROLOGIC EVALUATION OF LANDFILL PERFORMANCE ** ** HELP MODEL VERSION 3.07 (1 NOVEMBER 1997) ** ** DEVELOPED BY ENVIRONMENTAL LABORATORY ** ** USAE WATERWAYS EXPERIMENT STATION ** ** FOR USEPA RISK REDUCTION ENGINEERING LABORATORY ** ** ** ** ** ****************************************************************************** ****************************************************************************** PRECIPITATION DATA FILE: c:\help\KEN100Y.D4 TEMPERATURE DATA FILE: c:\help\KEND100.D7 SOLAR RADIATION DATA FILE: c:\help\KEND100.D13 EVAPOTRANSPIRATION DATA: c:\help\KEND100.D11 SOIL AND DESIGN DATA FILE: c:\help\KENDAL7.D10 OUTPUT DATA FILE: c:\help\TOP4.OUT TIME: 16:49 DATE: 11/18/2011 ****************************************************************************** TITLE: KENDALL MINE LEACH PAD TOPS-6" OF 5% BENTONITE AMENDED SOIL ****************************************************************************** NOTE: INITIAL MOISTURE CONTENT OF THE LAYERS AND SNOW WATER WERE COMPUTED AS NEARLY STEADY-STATE VALUES BY THE PROGRAM. LAYER 1 -------- TYPE 1 - VERTICAL PERCOLATION LAYER MATERIAL TEXTURE NUMBER 0 THICKNESS = 17.00 INCHES POROSITY = 0.4000 VOL/VOL FIELD CAPACITY = 0.2320 VOL/VOL WILTING POINT = 0.1160 VOL/VOL INITIAL SOIL WATER CONTENT = 0.2296 VOL/VOL EFFECTIVE SAT. HYD. COND. = 0.369999994000E-03 CM/SEC LAYER 2 -------- TYPE 3 - BARRIER SOIL LINER MATERIAL TEXTURE NUMBER 0 THICKNESS = 6.00 INCHES POROSITY = 0.4270 VOL/VOL FIELD CAPACITY = 0.4180 VOL/VOL WILTING POINT = 0.3670 VOL/VOL INITIAL SOIL WATER CONTENT = 0.4270 VOL/VOL
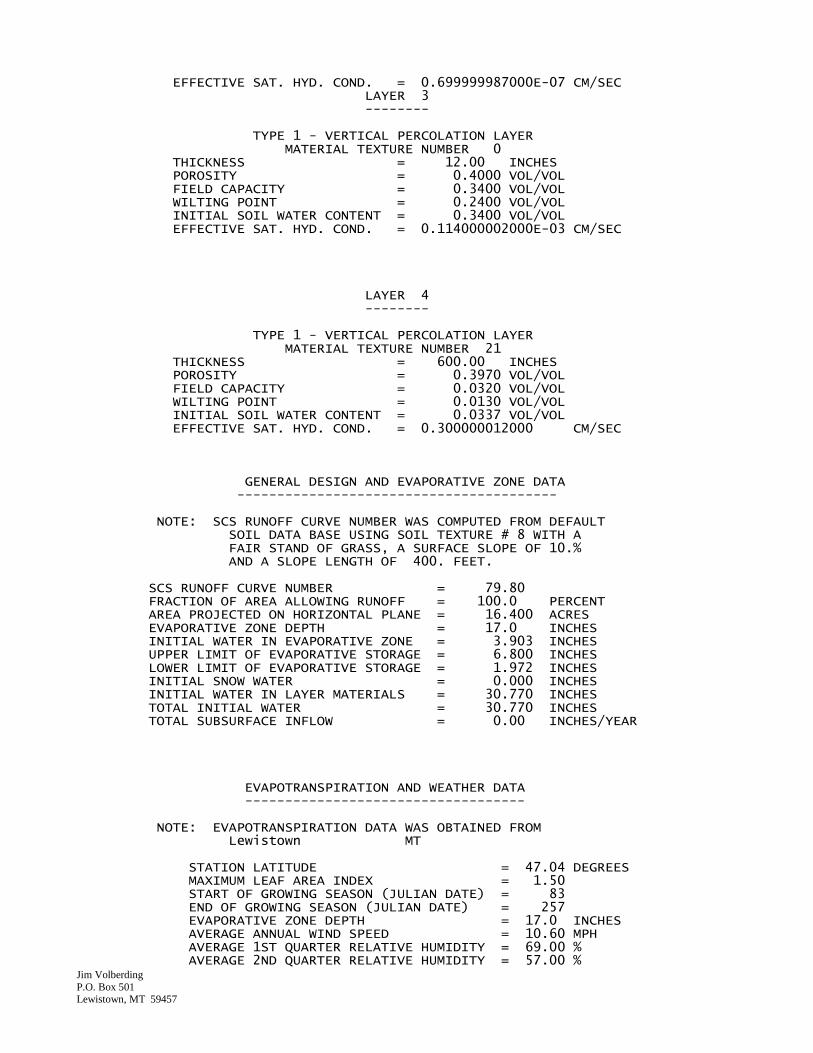
Jim Volberding
P.O. Box 501 Lewistown, MT 59457
EFFECTIVE SAT. HYD. COND. = 0.699999987000E-07 CM/SEC LAYER 3 -------- TYPE 1 - VERTICAL PERCOLATION LAYER MATERIAL TEXTURE NUMBER 0 THICKNESS = 12.00 INCHES POROSITY = 0.4000 VOL/VOL FIELD CAPACITY = 0.3400 VOL/VOL WILTING POINT = 0.2400 VOL/VOL INITIAL SOIL WATER CONTENT = 0.3400 VOL/VOL EFFECTIVE SAT. HYD. COND. = 0.114000002000E-03 CM/SEC LAYER 4 -------- TYPE 1 - VERTICAL PERCOLATION LAYER MATERIAL TEXTURE NUMBER 21 THICKNESS = 600.00 INCHES POROSITY = 0.3970 VOL/VOL FIELD CAPACITY = 0.0320 VOL/VOL WILTING POINT = 0.0130 VOL/VOL INITIAL SOIL WATER CONTENT = 0.0337 VOL/VOL EFFECTIVE SAT. HYD. COND. = 0.300000012000 CM/SEC GENERAL DESIGN AND EVAPORATIVE ZONE DATA ---------------------------------------- NOTE: SCS RUNOFF CURVE NUMBER WAS COMPUTED FROM DEFAULT SOIL DATA BASE USING SOIL TEXTURE # 8 WITH A FAIR STAND OF GRASS, A SURFACE SLOPE OF 10.% AND A SLOPE LENGTH OF 400. FEET. SCS RUNOFF CURVE NUMBER = 79.80 FRACTION OF AREA ALLOWING RUNOFF = 100.0 PERCENT AREA PROJECTED ON HORIZONTAL PLANE = 16.400 ACRES EVAPORATIVE ZONE DEPTH = 17.0 INCHES INITIAL WATER IN EVAPORATIVE ZONE = 3.903 INCHES UPPER LIMIT OF EVAPORATIVE STORAGE = 6.800 INCHES LOWER LIMIT OF EVAPORATIVE STORAGE = 1.972 INCHES INITIAL SNOW WATER = 0.000 INCHES INITIAL WATER IN LAYER MATERIALS = 30.770 INCHES TOTAL INITIAL WATER = 30.770 INCHES TOTAL SUBSURFACE INFLOW = 0.00 INCHES/YEAR EVAPOTRANSPIRATION AND WEATHER DATA ----------------------------------- NOTE: EVAPOTRANSPIRATION DATA WAS OBTAINED FROM Lewistown MT STATION LATITUDE = 47.04 DEGREES MAXIMUM LEAF AREA INDEX = 1.50 START OF GROWING SEASON (JULIAN DATE) = 83 END OF GROWING SEASON (JULIAN DATE) = 257 EVAPORATIVE ZONE DEPTH = 17.0 INCHES AVERAGE ANNUAL WIND SPEED = 10.60 MPH AVERAGE 1ST QUARTER RELATIVE HUMIDITY = 69.00 % AVERAGE 2ND QUARTER RELATIVE HUMIDITY = 57.00 %

Jim Volberding
P.O. Box 501 Lewistown, MT 59457
AVERAGE 3RD QUARTER RELATIVE HUMIDITY = 49.00 % AVERAGE 4TH QUARTER RELATIVE HUMIDITY = 66.00 % NOTE: PRECIPITATION DATA FOR LEWISTOWN MONTANA WAS ENTERED FROM AN ASCII DATA FILE. NOTE: TEMPERATURE DATA WAS SYNTHETICALLY GENERATED USING COEFFICIENTS FOR BILLINGS MONTANA NORMAL MEAN MONTHLY TEMPERATURE (DEGREES FAHRENHEIT) JAN/JUL FEB/AUG MAR/SEP APR/OCT MAY/NOV JUN/DEC ------- ------- ------- ------- ------- ------- 21.00 24.10 30.70 41.20 50.20 58.00 65.50 64.30 54.50 44.90 32.50 24.40 NOTE: SOLAR RADIATION DATA WAS SYNTHETICALLY GENERATED USING COEFFICIENTS FOR BILLINGS MONTANA AND STATION LATITUDE = 47.05 DEGREES ******************************************************************************* MONTHLY TOTALS (IN INCHES) FOR YEAR 1 ------------------------------------------------------------------------------- JAN/JUL FEB/AUG MAR/SEP APR/OCT MAY/NOV JUN/DEC ------- ------- ------- ------- ------- ------- PRECIPITATION 0.42 0.79 0.98 1.21 5.05 5.07 0.93 5.22 0.53 0.41 1.29 0.75 RUNOFF 0.000 0.000 0.042 0.382 0.273 0.753 0.000 0.560 0.000 0.000 0.000 0.000 EVAPOTRANSPIRATION 0.249 0.481 0.544 1.940 3.182 4.658 3.171 1.834 1.891 0.551 0.548 0.441 PERCOLATION/LEAKAGE THROUGH 0.0827 0.0697 0.0106 0.0468 0.1956 0.2027 LAYER 2 0.0944 0.0515 0.1253 0.1035 0.0923 0.0882 PERCOLATION/LEAKAGE THROUGH 0.0000 0.0000 0.0000 0.0000 0.0009 0.0009 LAYER 4 0.0000 0.0000 0.0013 0.0001 0.0000 0.0000 ------------------------------------------------------------------------------- MONTHLY SUMMARIES FOR DAILY HEADS (INCHES) ------------------------------------------------------------------------------- AVERAGE DAILY HEAD ON 0.723 0.270 0.005 1.829 9.896 11.025 TOP OF LAYER 2 3.321 2.200 4.521 2.414 1.756 1.167 STD. DEVIATION OF DAILY 0.144 0.122 0.014 2.498 3.148 3.211 HEAD ON TOP OF LAYER 2 2.857 3.247 1.030 0.210 0.177 0.164 *******************************************************************************

Jim Volberding
P.O. Box 501 Lewistown, MT 59457
*******************************************************************************
ANNUAL TOTALS FOR YEAR 1 ------------------------------------------------------------------------------- INCHES CU. FEET PERCENT -------- ---------- ------- PRECIPITATION 22.65 1348400.000 100.00 RUNOFF 2.010 119678.992 8.88 EVAPOTRANSPIRATION 19.488 1160148.370 86.04 PERC./LEAKAGE THROUGH LAYER 2 1.163138 69243.953 5.14 AVG. HEAD ON TOP OF LAYER 2 3.2604 PERC./LEAKAGE THROUGH LAYER 4 0.003243 193.060 0.01 CHANGE IN WATER STORAGE 1.149 68379.227 5.07 SOIL WATER AT START OF YEAR 30.770 1831800.000 SOIL WATER AT END OF YEAR 31.919 1900179.250 SNOW WATER AT START OF YEAR 0.000 0.000 0.00 SNOW WATER AT END OF YEAR 0.000 0.000 0.00 ANNUAL WATER BUDGET BALANCE 0.0000 0.299 0.00 ******************************************************************************* *******************************YEARS 2-99 NOT SHOWN***************************** ******************************************************************************* MONTHLY TOTALS (IN INCHES) FOR YEAR 100 ------------------------------------------------------------------------------- JAN/JUL FEB/AUG MAR/SEP APR/OCT MAY/NOV JUN/DEC ------- ------- ------- ------- ------- ------- PRECIPITATION 0.22 1.40 0.78 3.14 1.72 6.78 2.13 1.74 1.47 3.29 0.01 3.06 RUNOFF 0.000 0.088 0.088 0.000 0.000 0.083 0.077 0.000 0.000 0.000 0.000 0.271 EVAPOTRANSPIRATION 0.220 0.632 0.655 2.776 2.164 4.602 5.967 0.505 2.044 1.284 0.545 0.665 PERCOLATION/LEAKAGE THROUGH 0.0810 0.0581 0.0171 0.1648 0.1430 0.1701 LAYER 2 0.1040 0.0000 0.0000 0.0047 0.1140 0.1038 PERCOLATION/LEAKAGE THROUGH 0.0496 0.0414 0.0179 0.0859 0.0637 0.0284 LAYER 4 0.0234 0.0008 0.0181 0.0929 0.1176 0.1203 ------------------------------------------------------------------------------- MONTHLY SUMMARIES FOR DAILY HEADS (INCHES) ------------------------------------------------------------------------------- AVERAGE DAILY HEAD ON 0.586 0.142 0.523 7.843 5.622 8.292 TOP OF LAYER 2 3.568 0.000 0.000 0.091 3.579 2.440 STD. DEVIATION OF DAILY 0.141 0.114 1.285 2.103 0.722 3.302 HEAD ON TOP OF LAYER 2 3.819 0.000 0.000 0.407 0.359 0.181
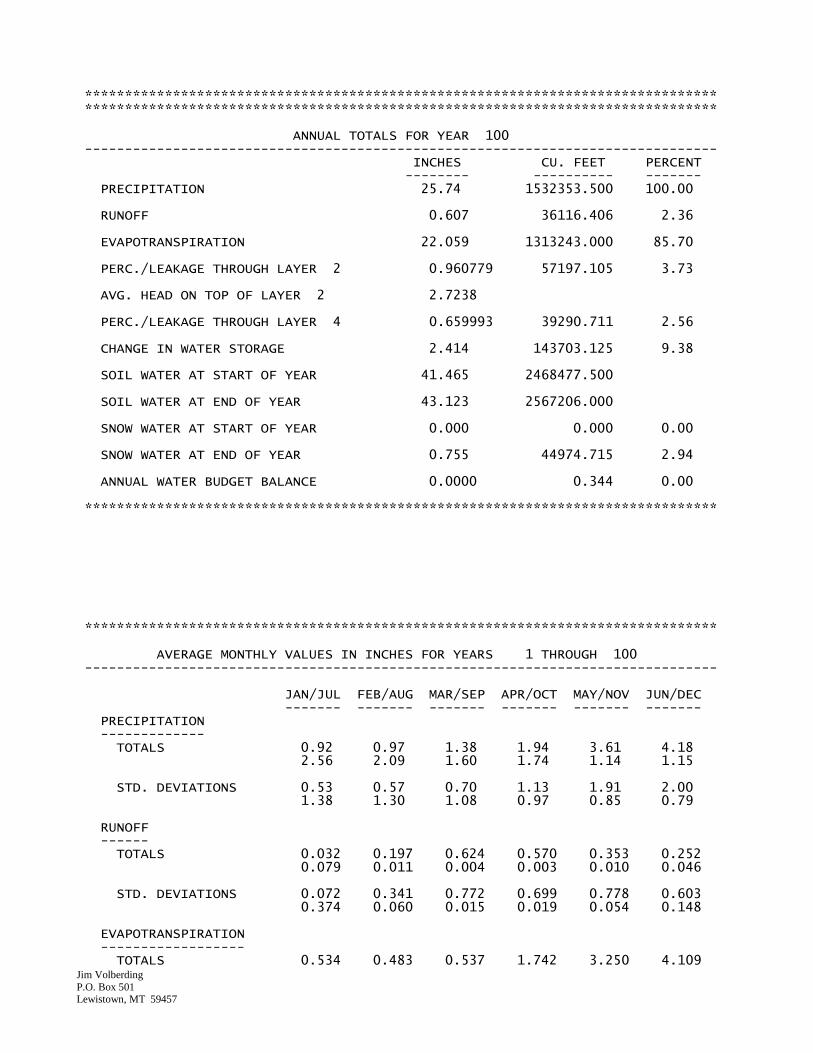
Jim Volberding
P.O. Box 501 Lewistown, MT 59457
******************************************************************************* ******************************************************************************* ANNUAL TOTALS FOR YEAR 100 ------------------------------------------------------------------------------- INCHES CU. FEET PERCENT -------- ---------- ------- PRECIPITATION 25.74 1532353.500 100.00 RUNOFF 0.607 36116.406 2.36 EVAPOTRANSPIRATION 22.059 1313243.000 85.70 PERC./LEAKAGE THROUGH LAYER 2 0.960779 57197.105 3.73 AVG. HEAD ON TOP OF LAYER 2 2.7238 PERC./LEAKAGE THROUGH LAYER 4 0.659993 39290.711 2.56 CHANGE IN WATER STORAGE 2.414 143703.125 9.38 SOIL WATER AT START OF YEAR 41.465 2468477.500 SOIL WATER AT END OF YEAR 43.123 2567206.000 SNOW WATER AT START OF YEAR 0.000 0.000 0.00 SNOW WATER AT END OF YEAR 0.755 44974.715 2.94 ANNUAL WATER BUDGET BALANCE 0.0000 0.344 0.00 ******************************************************************************* ******************************************************************************* AVERAGE MONTHLY VALUES IN INCHES FOR YEARS 1 THROUGH 100 ------------------------------------------------------------------------------- JAN/JUL FEB/AUG MAR/SEP APR/OCT MAY/NOV JUN/DEC ------- ------- ------- ------- ------- ------- PRECIPITATION ------------- TOTALS 0.92 0.97 1.38 1.94 3.61 4.18 2.56 2.09 1.60 1.74 1.14 1.15 STD. DEVIATIONS 0.53 0.57 0.70 1.13 1.91 2.00 1.38 1.30 1.08 0.97 0.85 0.79 RUNOFF ------ TOTALS 0.032 0.197 0.624 0.570 0.353 0.252 0.079 0.011 0.004 0.003 0.010 0.046 STD. DEVIATIONS 0.072 0.341 0.772 0.699 0.778 0.603 0.374 0.060 0.015 0.019 0.054 0.148 EVAPOTRANSPIRATION ------------------ TOTALS 0.534 0.483 0.537 1.742 3.250 4.109

Jim Volberding
P.O. Box 501 Lewistown, MT 59457
4.015 1.982 1.422 1.146 0.772 0.511 STD. DEVIATIONS 0.188 0.164 0.231 0.945 1.043 1.194 1.510 1.295 0.862 0.546 0.264 0.212 PERCOLATION/LEAKAGE THROUGH LAYER 2 ------------------------------------ TOTALS 0.0289 0.0231 0.0232 0.0732 0.1377 0.1321 0.0728 0.0075 0.0055 0.0144 0.0312 0.0348 STD. DEVIATIONS 0.0431 0.0365 0.0369 0.0593 0.0556 0.0594 0.0564 0.0183 0.0201 0.0346 0.0506 0.0489 PERCOLATION/LEAKAGE THROUGH LAYER 4 ------------------------------------ TOTALS 0.0530 0.0434 0.0448 0.0451 0.0523 0.0440 0.0263 0.0099 0.0115 0.0327 0.0520 0.0592 STD. DEVIATIONS 0.0355 0.0329 0.0372 0.0360 0.0372 0.0338 0.0217 0.0120 0.0179 0.0274 0.0325 0.0362 ------------------------------------------------------------------------------- AVERAGES OF MONTHLY AVERAGED DAILY HEADS (INCHES) ------------------------------------------------------------------------------- DAILY AVERAGE HEAD ON TOP OF LAYER 2 ------------------------------------- AVERAGES 0.4787 0.3259 0.3831 2.9148 5.8249 5.7471 2.6199 0.1827 0.1602 0.3781 0.9556 0.7717 STD. DEVIATIONS 0.8141 0.5981 0.8347 3.0274 3.5591 3.9035 2.5497 0.5274 0.6578 1.0819 1.9189 1.4074 ******************************************************************************* ******************************************************************************* AVERAGE ANNUAL TOTALS & (STD. DEVIATIONS) FOR YEARS 1 THROUGH 100 ------------------------------------------------------------------------------- INCHES CU. FEET PERCENT ------------------- ------------- --------- PRECIPITATION 23.29 ( 5.044) 1386458.5 100.00 RUNOFF 2.181 ( 2.0135) 129850.97 9.366 EVAPOTRANSPIRATION 20.503 ( 3.6013) 1220576.75 88.036 PERCOLATION/LEAKAGE THROUGH 0.58422 ( 0.28372) 34779.984 2.50855 LAYER 2 AVERAGE HEAD ON TOP 1.729 ( 0.998) OF LAYER 2 PERCOLATION/LEAKAGE THROUGH 0.47415 ( 0.28767) 28227.236 2.03592 LAYER 4 CHANGE IN WATER STORAGE 0.131 ( 1.4220) 7803.81 0.563 *******************************************************************************

Jim Volberding
P.O. Box 501 Lewistown, MT 59457
****************************************************************************** PEAK DAILY VALUES FOR YEARS 1 THROUGH 100 ------------------------------------------------------------------------ (INCHES) (CU. FT.) ---------- ------------- PRECIPITATION 3.90 232174.797 RUNOFF 2.526 150359.6410 PERCOLATION/LEAKAGE THROUGH LAYER 2 0.009128 543.38654 AVERAGE HEAD ON TOP OF LAYER 2 17.000 PERCOLATION/LEAKAGE THROUGH LAYER 4 0.005680 338.14426 SNOW WATER 5.53 328971.9370 MAXIMUM VEG. SOIL WATER (VOL/VOL) 0.4000 MINIMUM VEG. SOIL WATER (VOL/VOL) 0.1160 ****************************************************************************** ****************************************************************************** FINAL WATER STORAGE AT END OF YEAR 100 ---------------------------------------------------------------------- LAYER (INCHES) (VOL/VOL) ----- -------- --------- 1 5.2487 0.3087 2 2.5620 0.4270 3 4.0800 0.3400 4 31.2325 0.0521 SNOW WATER 0.755 ****************************************************************************** ******************************************************************************
Jim Volberding
P.O. Box 501 Lewistown, MT 59457
HELP MODEL RESULTS FOR LEACH PAD SLOPES

Jim Volberding
P.O. Box 501 Lewistown, MT 59457
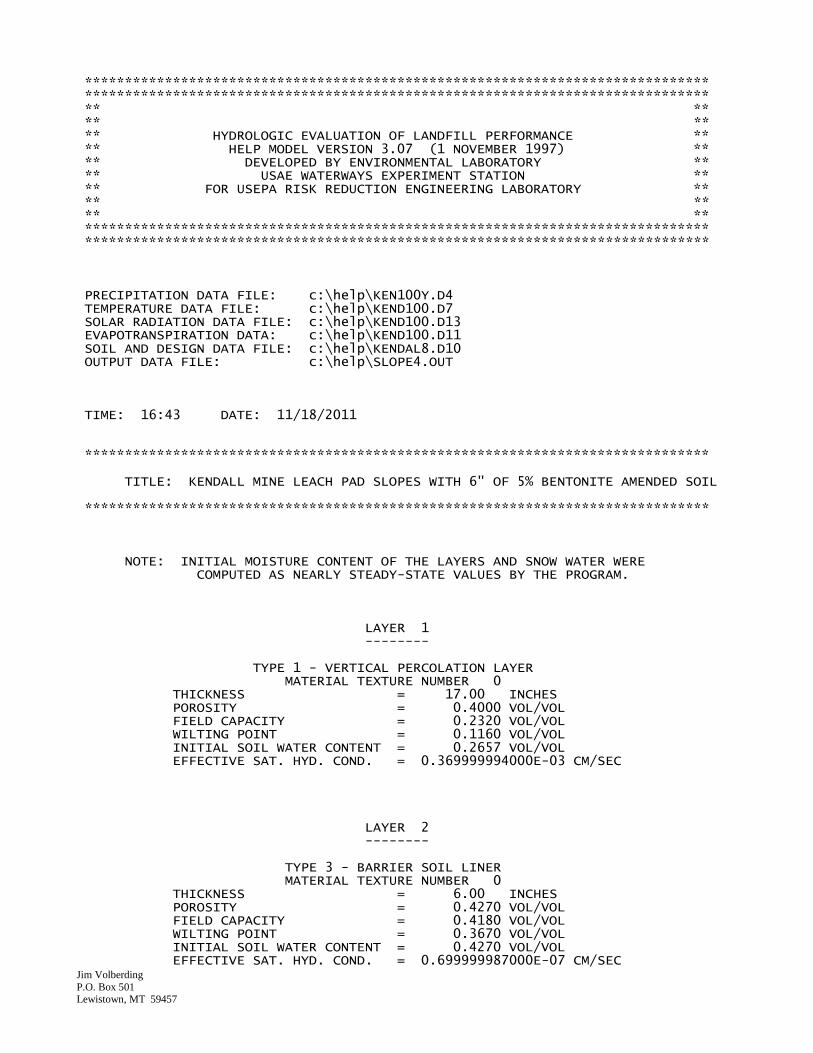
Jim Volberding
P.O. Box 501 Lewistown, MT 59457
****************************************************************************** ****************************************************************************** ** ** ** ** ** HYDROLOGIC EVALUATION OF LANDFILL PERFORMANCE ** ** HELP MODEL VERSION 3.07 (1 NOVEMBER 1997) ** ** DEVELOPED BY ENVIRONMENTAL LABORATORY ** ** USAE WATERWAYS EXPERIMENT STATION ** ** FOR USEPA RISK REDUCTION ENGINEERING LABORATORY ** ** ** ** ** ****************************************************************************** ****************************************************************************** PRECIPITATION DATA FILE: c:\help\KEN100Y.D4 TEMPERATURE DATA FILE: c:\help\KEND100.D7 SOLAR RADIATION DATA FILE: c:\help\KEND100.D13 EVAPOTRANSPIRATION DATA: c:\help\KEND100.D11 SOIL AND DESIGN DATA FILE: c:\help\KENDAL8.D10 OUTPUT DATA FILE: c:\help\SLOPE4.OUT TIME: 16:43 DATE: 11/18/2011 ****************************************************************************** TITLE: KENDALL MINE LEACH PAD SLOPES WITH 6" OF 5% BENTONITE AMENDED SOIL ****************************************************************************** NOTE: INITIAL MOISTURE CONTENT OF THE LAYERS AND SNOW WATER WERE COMPUTED AS NEARLY STEADY-STATE VALUES BY THE PROGRAM. LAYER 1 -------- TYPE 1 - VERTICAL PERCOLATION LAYER MATERIAL TEXTURE NUMBER 0 THICKNESS = 17.00 INCHES POROSITY = 0.4000 VOL/VOL FIELD CAPACITY = 0.2320 VOL/VOL WILTING POINT = 0.1160 VOL/VOL INITIAL SOIL WATER CONTENT = 0.2657 VOL/VOL EFFECTIVE SAT. HYD. COND. = 0.369999994000E-03 CM/SEC LAYER 2 -------- TYPE 3 - BARRIER SOIL LINER MATERIAL TEXTURE NUMBER 0 THICKNESS = 6.00 INCHES POROSITY = 0.4270 VOL/VOL FIELD CAPACITY = 0.4180 VOL/VOL WILTING POINT = 0.3670 VOL/VOL INITIAL SOIL WATER CONTENT = 0.4270 VOL/VOL EFFECTIVE SAT. HYD. COND. = 0.699999987000E-07 CM/SEC
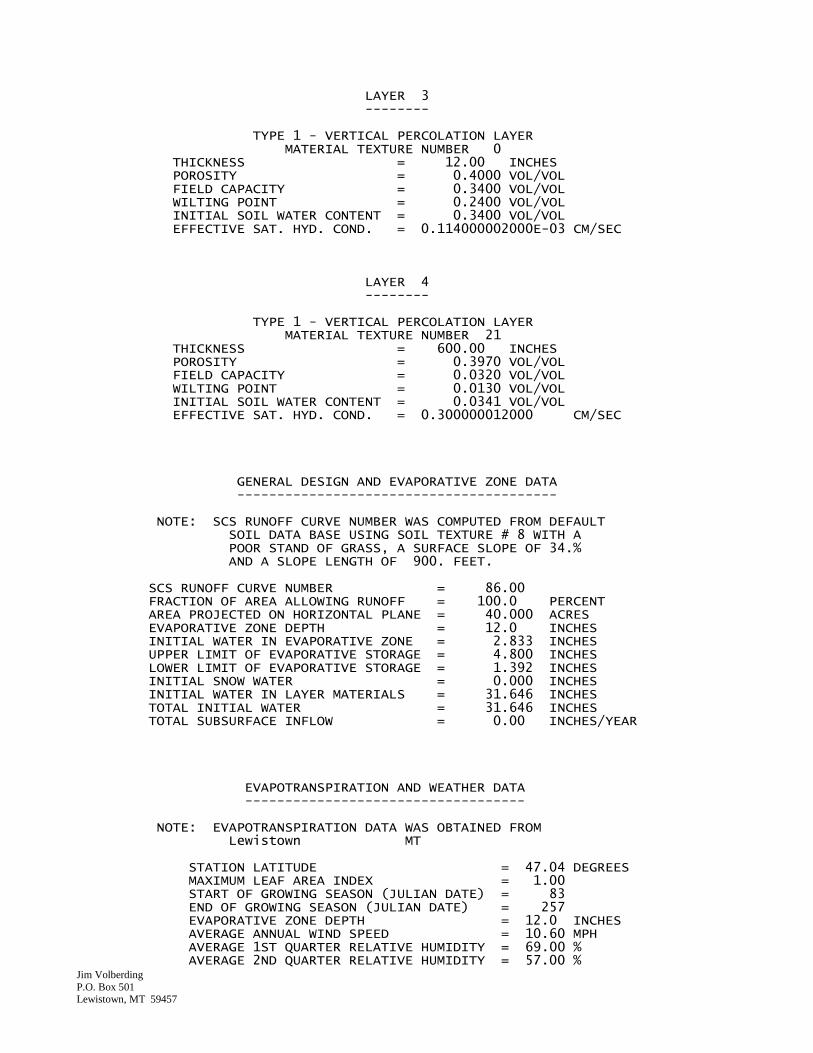
Jim Volberding
P.O. Box 501 Lewistown, MT 59457
LAYER 3 -------- TYPE 1 - VERTICAL PERCOLATION LAYER MATERIAL TEXTURE NUMBER 0 THICKNESS = 12.00 INCHES POROSITY = 0.4000 VOL/VOL FIELD CAPACITY = 0.3400 VOL/VOL WILTING POINT = 0.2400 VOL/VOL INITIAL SOIL WATER CONTENT = 0.3400 VOL/VOL EFFECTIVE SAT. HYD. COND. = 0.114000002000E-03 CM/SEC LAYER 4 -------- TYPE 1 - VERTICAL PERCOLATION LAYER MATERIAL TEXTURE NUMBER 21 THICKNESS = 600.00 INCHES POROSITY = 0.3970 VOL/VOL FIELD CAPACITY = 0.0320 VOL/VOL WILTING POINT = 0.0130 VOL/VOL INITIAL SOIL WATER CONTENT = 0.0341 VOL/VOL EFFECTIVE SAT. HYD. COND. = 0.300000012000 CM/SEC GENERAL DESIGN AND EVAPORATIVE ZONE DATA ---------------------------------------- NOTE: SCS RUNOFF CURVE NUMBER WAS COMPUTED FROM DEFAULT SOIL DATA BASE USING SOIL TEXTURE # 8 WITH A POOR STAND OF GRASS, A SURFACE SLOPE OF 34.% AND A SLOPE LENGTH OF 900. FEET. SCS RUNOFF CURVE NUMBER = 86.00 FRACTION OF AREA ALLOWING RUNOFF = 100.0 PERCENT AREA PROJECTED ON HORIZONTAL PLANE = 40.000 ACRES EVAPORATIVE ZONE DEPTH = 12.0 INCHES INITIAL WATER IN EVAPORATIVE ZONE = 2.833 INCHES UPPER LIMIT OF EVAPORATIVE STORAGE = 4.800 INCHES LOWER LIMIT OF EVAPORATIVE STORAGE = 1.392 INCHES INITIAL SNOW WATER = 0.000 INCHES INITIAL WATER IN LAYER MATERIALS = 31.646 INCHES TOTAL INITIAL WATER = 31.646 INCHES TOTAL SUBSURFACE INFLOW = 0.00 INCHES/YEAR EVAPOTRANSPIRATION AND WEATHER DATA ----------------------------------- NOTE: EVAPOTRANSPIRATION DATA WAS OBTAINED FROM Lewistown MT STATION LATITUDE = 47.04 DEGREES MAXIMUM LEAF AREA INDEX = 1.00 START OF GROWING SEASON (JULIAN DATE) = 83 END OF GROWING SEASON (JULIAN DATE) = 257 EVAPORATIVE ZONE DEPTH = 12.0 INCHES AVERAGE ANNUAL WIND SPEED = 10.60 MPH AVERAGE 1ST QUARTER RELATIVE HUMIDITY = 69.00 % AVERAGE 2ND QUARTER RELATIVE HUMIDITY = 57.00 %

Jim Volberding
P.O. Box 501 Lewistown, MT 59457
AVERAGE 3RD QUARTER RELATIVE HUMIDITY = 49.00 % AVERAGE 4TH QUARTER RELATIVE HUMIDITY = 66.00 % NOTE: PRECIPITATION DATA FOR LEWISTOWN MONTANA WAS ENTERED FROM AN ASCII DATA FILE. NOTE: TEMPERATURE DATA WAS SYNTHETICALLY GENERATED USING COEFFICIENTS FOR BILLINGS MONTANA NORMAL MEAN MONTHLY TEMPERATURE (DEGREES FAHRENHEIT) JAN/JUL FEB/AUG MAR/SEP APR/OCT MAY/NOV JUN/DEC ------- ------- ------- ------- ------- ------- 21.00 24.10 30.70 41.20 50.20 58.00 65.50 64.30 54.50 44.90 32.50 24.40 NOTE: SOLAR RADIATION DATA WAS SYNTHETICALLY GENERATED USING COEFFICIENTS FOR BILLINGS MONTANA AND STATION LATITUDE = 47.05 DEGREES ******************************************************************************* MONTHLY TOTALS (IN INCHES) FOR YEAR 1 ------------------------------------------------------------------------------- JAN/JUL FEB/AUG MAR/SEP APR/OCT MAY/NOV JUN/DEC ------- ------- ------- ------- ------- ------- PRECIPITATION 0.42 0.79 0.98 1.21 5.05 5.07 0.93 5.22 0.53 0.41 1.29 0.75 RUNOFF 0.034 0.026 0.223 0.660 0.545 0.662 0.000 1.118 0.000 0.000 0.000 0.020 EVAPOTRANSPIRATION 0.246 0.478 0.536 1.783 3.145 4.227 1.880 2.184 1.722 0.521 0.548 0.445 PERCOLATION/LEAKAGE THROUGH 0.1082 0.0912 0.0941 0.1039 0.1940 0.2050 LAYER 2 0.1636 0.1565 0.1613 0.1364 0.1217 0.1170 PERCOLATION/LEAKAGE THROUGH 0.0000 0.0000 0.0000 0.0000 0.0000 0.0000 LAYER 4 0.0000 0.0000 0.0000 0.0000 0.0000 0.0000 ------------------------------------------------------------------------------- MONTHLY SUMMARIES FOR DAILY HEADS (INCHES) ------------------------------------------------------------------------------- AVERAGE DAILY HEAD ON 2.797 2.205 1.652 2.730 9.768 11.219 TOP OF LAYER 2 7.295 6.720 7.546 5.091 4.220 3.513 STD. DEVIATION OF DAILY 0.189 0.159 0.164 2.097 2.857 3.083 HEAD ON TOP OF LAYER 2 1.227 2.958 1.218 0.377 0.210 0.204 *******************************************************************************

Jim Volberding
P.O. Box 501 Lewistown, MT 59457
******************************************************************************* ANNUAL TOTALS FOR YEAR 1 ------------------------------------------------------------------------------- INCHES CU. FEET PERCENT -------- ---------- ------- PRECIPITATION 22.65 3288780.500 100.00 RUNOFF 3.289 477599.031 14.52 EVAPOTRANSPIRATION 17.715 2572227.250 78.21 PERC./LEAKAGE THROUGH LAYER 2 1.652896 240000.562 7.30 AVG. HEAD ON TOP OF LAYER 2 5.3963 PERC./LEAKAGE THROUGH LAYER 4 0.000000 0.000 0.00 CHANGE IN WATER STORAGE 1.646 238951.547 7.27 SOIL WATER AT START OF YEAR 31.646 4595027.000 SOIL WATER AT END OF YEAR 33.292 4833978.500 SNOW WATER AT START OF YEAR 0.000 0.000 0.00 SNOW WATER AT END OF YEAR 0.000 0.000 0.00 ANNUAL WATER BUDGET BALANCE 0.0000 2.769 0.00 ******************************************************************************* *********************************YEARS 2-99 NOT SHOWN************************** ******************************************************************************* MONTHLY TOTALS (IN INCHES) FOR YEAR 100 ------------------------------------------------------------------------------- JAN/JUL FEB/AUG MAR/SEP APR/OCT MAY/NOV JUN/DEC ------- ------- ------- ------- ------- ------- PRECIPITATION 0.22 1.40 0.78 3.14 1.72 6.78 2.13 1.74 1.47 3.29 0.01 3.06 RUNOFF 0.000 0.227 0.273 0.000 0.000 0.317 0.273 0.000 0.000 0.036 0.000 0.710 EVAPOTRANSPIRATION 0.220 0.628 0.659 2.843 2.091 4.172 4.117 0.461 2.083 1.371 0.644 0.665 PERCOLATION/LEAKAGE THROUGH 0.1138 0.0991 0.0987 0.1481 0.1334 0.1629 LAYER 2 0.1501 0.1287 0.1308 0.1354 0.1700 0.1293 PERCOLATION/LEAKAGE THROUGH 0.1336 0.1317 0.1464 0.1560 0.1036 0.1158 LAYER 4 0.0894 0.1056 0.1256 0.1261 0.1288 0.0911 ------------------------------------------------------------------------------- MONTHLY SUMMARIES FOR DAILY HEADS (INCHES) ------------------------------------------------------------------------------- AVERAGE DAILY HEAD ON 3.247 2.614 2.025 6.443 4.847 7.686 TOP OF LAYER 2 6.198 4.460 4.988 5.006 8.281 4.508
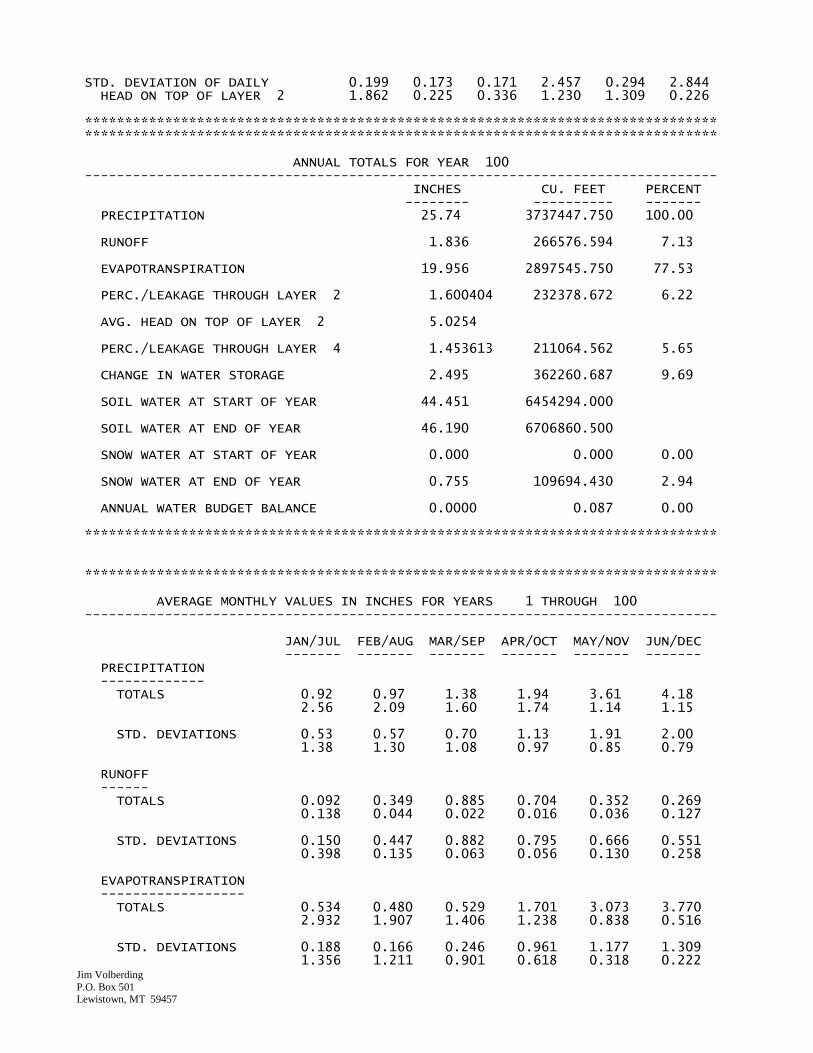
Jim Volberding
P.O. Box 501 Lewistown, MT 59457
STD. DEVIATION OF DAILY 0.199 0.173 0.171 2.457 0.294 2.844 HEAD ON TOP OF LAYER 2 1.862 0.225 0.336 1.230 1.309 0.226 ******************************************************************************* ******************************************************************************* ANNUAL TOTALS FOR YEAR 100 ------------------------------------------------------------------------------- INCHES CU. FEET PERCENT -------- ---------- ------- PRECIPITATION 25.74 3737447.750 100.00 RUNOFF 1.836 266576.594 7.13 EVAPOTRANSPIRATION 19.956 2897545.750 77.53 PERC./LEAKAGE THROUGH LAYER 2 1.600404 232378.672 6.22 AVG. HEAD ON TOP OF LAYER 2 5.0254 PERC./LEAKAGE THROUGH LAYER 4 1.453613 211064.562 5.65 CHANGE IN WATER STORAGE 2.495 362260.687 9.69 SOIL WATER AT START OF YEAR 44.451 6454294.000 SOIL WATER AT END OF YEAR 46.190 6706860.500 SNOW WATER AT START OF YEAR 0.000 0.000 0.00 SNOW WATER AT END OF YEAR 0.755 109694.430 2.94 ANNUAL WATER BUDGET BALANCE 0.0000 0.087 0.00 ******************************************************************************* ******************************************************************************* AVERAGE MONTHLY VALUES IN INCHES FOR YEARS 1 THROUGH 100 ------------------------------------------------------------------------------- JAN/JUL FEB/AUG MAR/SEP APR/OCT MAY/NOV JUN/DEC ------- ------- ------- ------- ------- ------- PRECIPITATION ------------- TOTALS 0.92 0.97 1.38 1.94 3.61 4.18 2.56 2.09 1.60 1.74 1.14 1.15 STD. DEVIATIONS 0.53 0.57 0.70 1.13 1.91 2.00 1.38 1.30 1.08 0.97 0.85 0.79 RUNOFF ------ TOTALS 0.092 0.349 0.885 0.704 0.352 0.269 0.138 0.044 0.022 0.016 0.036 0.127 STD. DEVIATIONS 0.150 0.447 0.882 0.795 0.666 0.551 0.398 0.135 0.063 0.056 0.130 0.258 EVAPOTRANSPIRATION ------------------ TOTALS 0.534 0.480 0.529 1.701 3.073 3.770 2.932 1.907 1.406 1.238 0.838 0.516 STD. DEVIATIONS 0.188 0.166 0.246 0.961 1.177 1.309 1.356 1.211 0.901 0.618 0.318 0.222

Jim Volberding
P.O. Box 501 Lewistown, MT 59457
PERCOLATION/LEAKAGE THROUGH LAYER 2 ------------------------------------ TOTALS 0.0929 0.0747 0.0752 0.0935 0.1359 0.1421 0.1339 0.1203 0.1115 0.1142 0.1134 0.1054 STD. DEVIATIONS 0.0348 0.0359 0.0397 0.0463 0.0425 0.0400 0.0330 0.0227 0.0218 0.0275 0.0356 0.0341 PERCOLATION/LEAKAGE THROUGH LAYER 4 ------------------------------------ TOTALS 0.1015 0.0988 0.1163 0.1204 0.1202 0.0906 0.0717 0.0744 0.0878 0.0999 0.0986 0.0976 STD. DEVIATIONS 0.0487 0.0454 0.0510 0.0507 0.0547 0.0434 0.0405 0.0428 0.0400 0.0441 0.0446 0.0478 ------------------------------------------------------------------------------- AVERAGES OF MONTHLY AVERAGED DAILY HEADS (INCHES) ------------------------------------------------------------------------------- DAILY AVERAGE HEAD ON TOP OF LAYER 2 ------------------------------------- AVERAGES 2.2059 1.7093 1.4051 2.9308 5.3457 6.0744 5.0440 3.9022 3.4894 3.4042 3.6902 2.9428 STD. DEVIATIONS 1.4157 1.2339 1.1774 2.5215 2.9325 3.0696 2.1848 1.3192 1.3411 1.8575 2.6305 1.8952 ******************************************************************************* ******************************************************************************* AVERAGE ANNUAL TOTALS & (STD. DEVIATIONS) FOR YEARS 1 THROUGH 100 ------------------------------------------------------------------------------- INCHES CU. FEET PERCENT ------------------- ------------- --------- PRECIPITATION 23.29 ( 5.044) 3381606.2 100.00 RUNOFF 3.034 ( 1.9904) 440606.06 13.029 EVAPOTRANSPIRATION 18.924 ( 3.5463) 2747785.50 81.257 PERCOLATION/LEAKAGE THROUGH 1.31314 ( 0.27965) 190668.000 5.63839 LAYER 2 AVERAGE HEAD ON TOP 3.512 ( 1.294) OF LAYER 2 PERCOLATION/LEAKAGE THROUGH 1.17768 ( 0.47668) 170999.312 5.05675 LAYER 4 CHANGE IN WATER STORAGE 0.153 ( 1.3399) 22215.28 0.657 *******************************************************************************

Jim Volberding
P.O. Box 501 Lewistown, MT 59457
****************************************************************************** PEAK DAILY VALUES FOR YEARS 1 THROUGH 100 ------------------------------------------------------------------------ (INCHES) (CU. FT.) ---------- ------------- PRECIPITATION 3.90 566280.000 RUNOFF 2.035 295495.0310 PERCOLATION/LEAKAGE THROUGH LAYER 2 0.009127 1325.28870 AVERAGE HEAD ON TOP OF LAYER 2 17.000 PERCOLATION/LEAKAGE THROUGH LAYER 4 0.008429 1223.86243 SNOW WATER 5.53 802370.5620 MAXIMUM VEG. SOIL WATER (VOL/VOL) 0.4000 MINIMUM VEG. SOIL WATER (VOL/VOL) 0.1160 ****************************************************************************** ****************************************************************************** FINAL WATER STORAGE AT END OF YEAR 100 ---------------------------------------------------------------------- LAYER (INCHES) (VOL/VOL) ----- -------- --------- 1 5.5153 0.3244 2 2.5620 0.4270 3 4.0800 0.3400 4 34.0331 0.0567 SNOW WATER 0.755 ****************************************************************************** ******************************************************************************
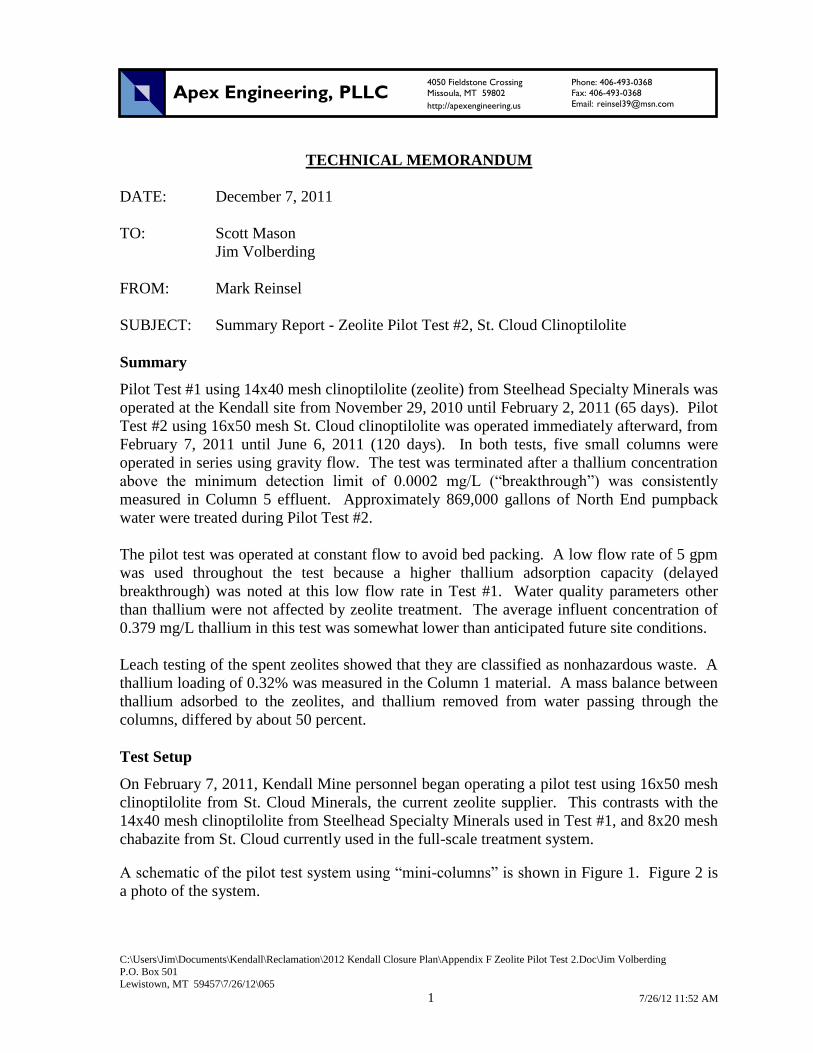
C:\Users\Jim\Documents\Kendall\Reclamation\2012 Kendall Closure Plan\Appendix F Zeolite Pilot Test 2.Doc\Jim Volberding
P.O. Box 501
Lewistown, MT 59457\7/26/12\065
1 7/26/12 11:52 AM
TECHNICAL MEMORANDUM
DATE: December 7, 2011
TO: Scott Mason
Jim Volberding
FROM: Mark Reinsel
SUBJECT: Summary Report - Zeolite Pilot Test #2, St. Cloud Clinoptilolite
Summary
Pilot Test #1 using 14x40 mesh clinoptilolite (zeolite) from Steelhead Specialty Minerals was
operated at the Kendall site from November 29, 2010 until February 2, 2011 (65 days). Pilot
Test #2 using 16x50 mesh St. Cloud clinoptilolite was operated immediately afterward, from
February 7, 2011 until June 6, 2011 (120 days). In both tests, five small columns were
operated in series using gravity flow. The test was terminated after a thallium concentration
above the minimum detection limit of 0.0002 mg/L (“breakthrough”) was consistently
measured in Column 5 effluent. Approximately 869,000 gallons of North End pumpback
water were treated during Pilot Test #2.
The pilot test was operated at constant flow to avoid bed packing. A low flow rate of 5 gpm
was used throughout the test because a higher thallium adsorption capacity (delayed
breakthrough) was noted at this low flow rate in Test #1. Water quality parameters other
than thallium were not affected by zeolite treatment. The average influent concentration of
0.379 mg/L thallium in this test was somewhat lower than anticipated future site conditions.
Leach testing of the spent zeolites showed that they are classified as nonhazardous waste. A
thallium loading of 0.32% was measured in the Column 1 material. A mass balance between
thallium adsorbed to the zeolites, and thallium removed from water passing through the
columns, differed by about 50 percent.
Test Setup
On February 7, 2011, Kendall Mine personnel began operating a pilot test using 16x50 mesh
clinoptilolite from St. Cloud Minerals, the current zeolite supplier. This contrasts with the
14x40 mesh clinoptilolite from Steelhead Specialty Minerals used in Test #1, and 8x20 mesh
chabazite from St. Cloud currently used in the full-scale treatment system.
A schematic of the pilot test system using “mini-columns” is shown in Figure 1. Figure 2 is
a photo of the system.
Phone: 406-493-0368
Fax: 406-493-0368
Email: [email protected]
4050 Fieldstone Crossing
Missoula, MT 59802
http://apexengineering.us Apex Engineering, PLLC
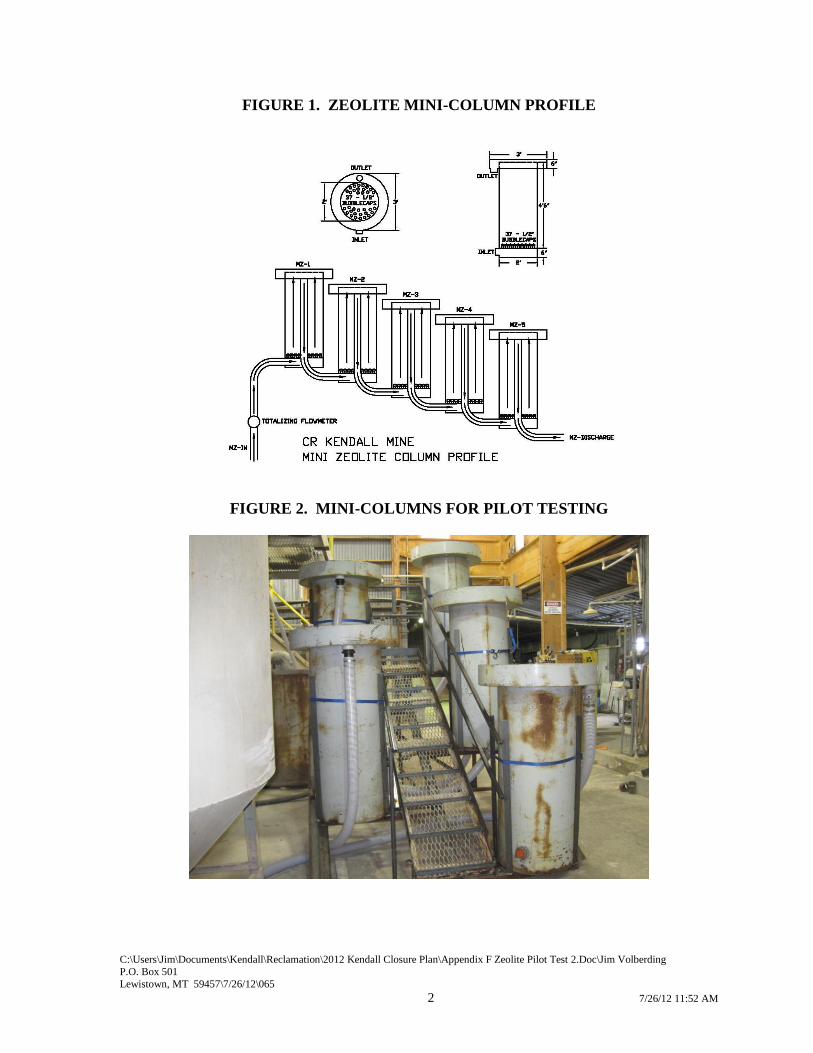
C:\Users\Jim\Documents\Kendall\Reclamation\2012 Kendall Closure Plan\Appendix F Zeolite Pilot Test 2.Doc\Jim Volberding
P.O. Box 501
Lewistown, MT 59457\7/26/12\065
2 7/26/12 11:52 AM
FIGURE 1. ZEOLITE MINI-COLUMN PROFILE
FIGURE 2. MINI-COLUMNS FOR PILOT TESTING

C:\Users\Jim\Documents\Kendall\Reclamation\2012 Kendall Closure Plan\Appendix F Zeolite Pilot Test 2.Doc\Jim Volberding
P.O. Box 501
Lewistown, MT 59457\7/26/12\065
3 7/26/12 11:52 AM
A summary of the zeolite column setup is as follows:
1. Clinoptilolite was loaded into each column to a height of 30 inches. A yardstick was
used to measure down 25 inches from the top of the overflow launder of the 55-inch-
deep columns.
2. According to the MSDS, the clinoptilolite dry density is approximately 50 lb/ft3. The
volume of zeolites in each column was 7.85 ft3 so the weight in each column was 7.85
* 50 = 393 lbs.
3. There was a 15-inch elevation drop between each column to allow gravity flow.
4. South End water before zeolite treatment, containing a low concentration of thallium,
was pumped through the columns at 10 gpm. This washed the clinoptilolite fines out
of the columns and was enhanced by stirring with a PVC pipe.
Operations
At the beginning of Test #2, the flow was set at about 5 gpm. Flows and other field data
are summarized in Table 1.
When each sample was taken, an operator recorded the influent pH and specific
conductance (SC), and Column 5 effluent pH, temperature and SC, along with the flow
rate and total flow readings.
“Breakthrough” was defined as the time when thallium was first detected (the
concentration exceeded the detection limit). The pilot test was operated until June 6,
2011 (120 days), when consistent breakthrough was seen from Column 5 at the minimum
detection limit of 0.0002 mg/L. A total of 868,930 gallons were treated through the
system (Tables 1 and 2).
Sampling and Analysis
All water samples were filtered and sent to Energy Labs, with most submitted for rush
(24-hour) analysis.
We began the test by sampling effluent (overflow) from all five columns every day, using
the standard detection limit of 0.002 mg/L for Columns 1-4 samples and the minimum
detection limit of 0.0002 mg/L for Column 5 samples.
On Day 22, we began submitting only the Column 1 sample and archiving the other
samples. When the Column 1 sample showed breakthrough on Day 22, we submitted the
Column 2 sample for that day. Samples from Columns 1 and 2 were then submitted until
Column 2 breakthrough was noted on Day 36, when samples from Column 3 were added
to the analysis. A similar procedure was followed when breakthrough was noted at
Columns 3 and 4.
Influent water was sampled on Day 1 and then approximately monthly throughout the
test.

C:\Users\Jim\Documents\Kendall\Reclamation\2012 Kendall Closure Plan\Appendix F Zeolite Pilot Test 2.Doc\Jim Volberding
P.O. Box 501
Lewistown, MT 59457\7/26/12\065
4 7/26/12 11:52 AM

C:\Users\Jim\Documents\Kendall\Reclamation\2012 Kendall Closure Plan\Appendix F Zeolite Pilot Test 2.Doc\Jim Volberding
P.O. Box 501
Lewistown, MT 59457\7/26/12\065
5 7/26/12 11:52 AM
TABLE 1. PILOT TEST #2 FIELD DATA SHEET

C:\Users\Jim\Documents\Kendall\Reclamation\2012 Kendall Closure Plan\Appendix F Zeolite Pilot Test 2.Doc\Jim Volberding
P.O. Box 501
Lewistown, MT 59457\7/26/12\065
6 7/26/12 11:52 AM

C:\Users\Jim\Documents\Kendall\Reclamation\2012 Kendall Closure Plan\Appendix F Zeolite Pilot Test 2.Doc\Jim Volberding
P.O. Box 501
Lewistown, MT 59457\7/26/12\065
7 7/26/12 11:52 AM
TABLE 1. PILOT TEST #2 FIELD DATA SHEET (continued)
TABLE 2. PILOT TEST #2 LAB RESULTS
Tl Conc. (mg/L)
Date Day Gallons In 1 2 3 4 5
2/7/11 1 7,630 0.441 <0.002 <0.002 <0.002 <0.002 <0.0002
2/14/11 8 58,550 <0.002 <0.002 <0.002 <0.002 <0.0002
2/22/11 16 116,360 <0.002 <0.002 <0.002 <0.002 <0.0002
2/28/11 22 162,010 0.020 <0.002
3/7/11 29 209,720 0.032 <0.002
3/14/11 36 260,410 0.554 0.131 0.003 <0.002
3/21/11 43 311,980 0.132 0.003 <0.002
3/28/11 50 364,920 0.178 0.008 <0.002
4/4/11 57 418,900 0.408 0.159 0.015 <0.002
4/11/11 64 468,920 0.171 0.029 <0.002
4/18/11 71 521,550 0.156 0.023 <0.002
4/25/11 78 572,610 0.325 0.190 0.029 0.005 <0.002
5/2/11 85 623,780 0.192 0.038 0.003 <0.002
5/9/11 92 671,120 0.228 0.051 0.002 0.0003
5/16/11 99 723,390 0.321 0.234 0.060 0.004 0.0004 0.0003
5/23/11 106 773,880 0.230 0.090 0.003 0.0004 <0.0002
5/31/11 114 825,880 0.200 0.090 0.017 0.0017 0.0003
6/6/11 120 868,930 0.226 0.239 0.109 0.017 0.0016 0.0004
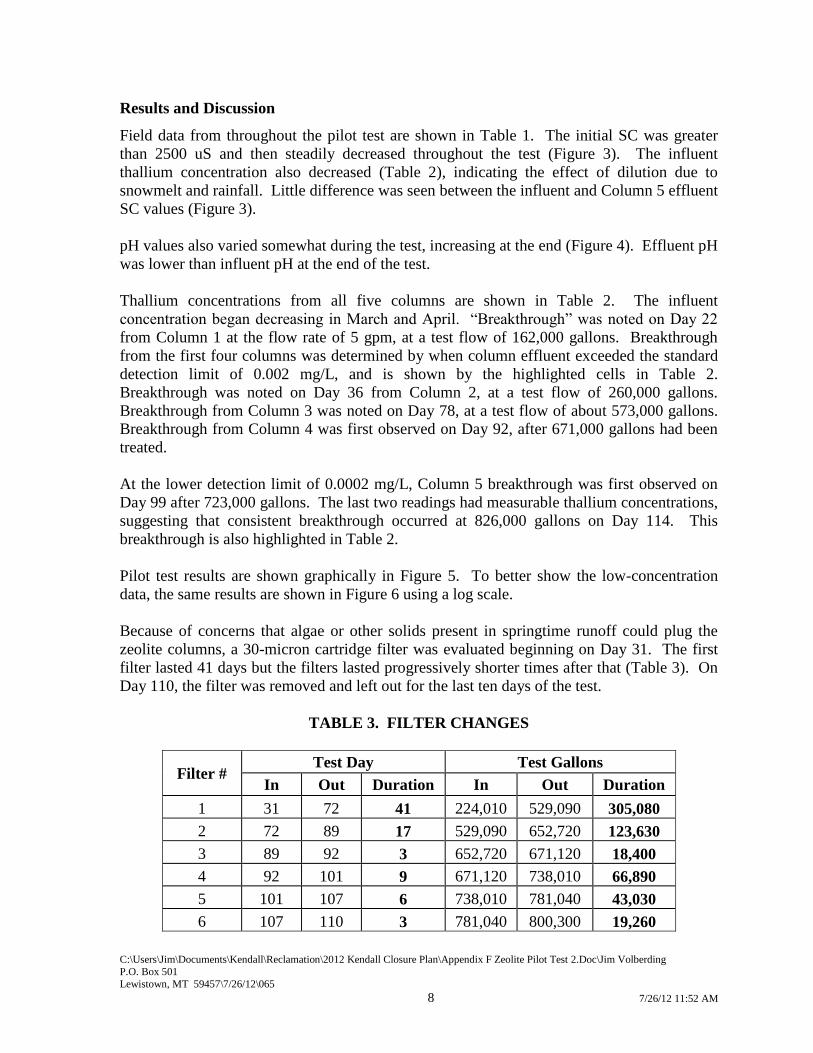
C:\Users\Jim\Documents\Kendall\Reclamation\2012 Kendall Closure Plan\Appendix F Zeolite Pilot Test 2.Doc\Jim Volberding
P.O. Box 501
Lewistown, MT 59457\7/26/12\065
8 7/26/12 11:52 AM
Results and Discussion
Field data from throughout the pilot test are shown in Table 1. The initial SC was greater
than 2500 uS and then steadily decreased throughout the test (Figure 3). The influent
thallium concentration also decreased (Table 2), indicating the effect of dilution due to
snowmelt and rainfall. Little difference was seen between the influent and Column 5 effluent
SC values (Figure 3).
pH values also varied somewhat during the test, increasing at the end (Figure 4). Effluent pH
was lower than influent pH at the end of the test.
Thallium concentrations from all five columns are shown in Table 2. The influent
concentration began decreasing in March and April. “Breakthrough” was noted on Day 22
from Column 1 at the flow rate of 5 gpm, at a test flow of 162,000 gallons. Breakthrough
from the first four columns was determined by when column effluent exceeded the standard
detection limit of 0.002 mg/L, and is shown by the highlighted cells in Table 2.
Breakthrough was noted on Day 36 from Column 2, at a test flow of 260,000 gallons.
Breakthrough from Column 3 was noted on Day 78, at a test flow of about 573,000 gallons.
Breakthrough from Column 4 was first observed on Day 92, after 671,000 gallons had been
treated.
At the lower detection limit of 0.0002 mg/L, Column 5 breakthrough was first observed on
Day 99 after 723,000 gallons. The last two readings had measurable thallium concentrations,
suggesting that consistent breakthrough occurred at 826,000 gallons on Day 114. This
breakthrough is also highlighted in Table 2.
Pilot test results are shown graphically in Figure 5. To better show the low-concentration
data, the same results are shown in Figure 6 using a log scale.
Because of concerns that algae or other solids present in springtime runoff could plug the
zeolite columns, a 30-micron cartridge filter was evaluated beginning on Day 31. The first
filter lasted 41 days but the filters lasted progressively shorter times after that (Table 3). On
Day 110, the filter was removed and left out for the last ten days of the test.
TABLE 3. FILTER CHANGES
Filter # Test Day Test Gallons
In Out Duration In Out Duration
1 31 72 41 224,010 529,090 305,080
2 72 89 17 529,090 652,720 123,630
3 89 92 3 652,720 671,120 18,400
4 92 101 9 671,120 738,010 66,890
5 101 107 6 738,010 781,040 43,030
6 107 110 3 781,040 800,300 19,260

C:\Users\Jim\Documents\Kendall\Reclamation\2012 Kendall Closure Plan\Appendix F Zeolite Pilot Test 2.Doc\Jim Volberding
P.O. Box 501
Lewistown, MT 59457\7/26/12\065
9 7/26/12 11:52 AM
FIGURE 3. PILOT TEST #2 SC

C:\Users\Jim\Documents\Kendall\Reclamation\2012 Kendall Closure Plan\Appendix F Zeolite Pilot Test 2.Doc\Jim Volberding
P.O. Box 501
Lewistown, MT 59457\7/26/12\065
10 7/26/12 11:52 AM
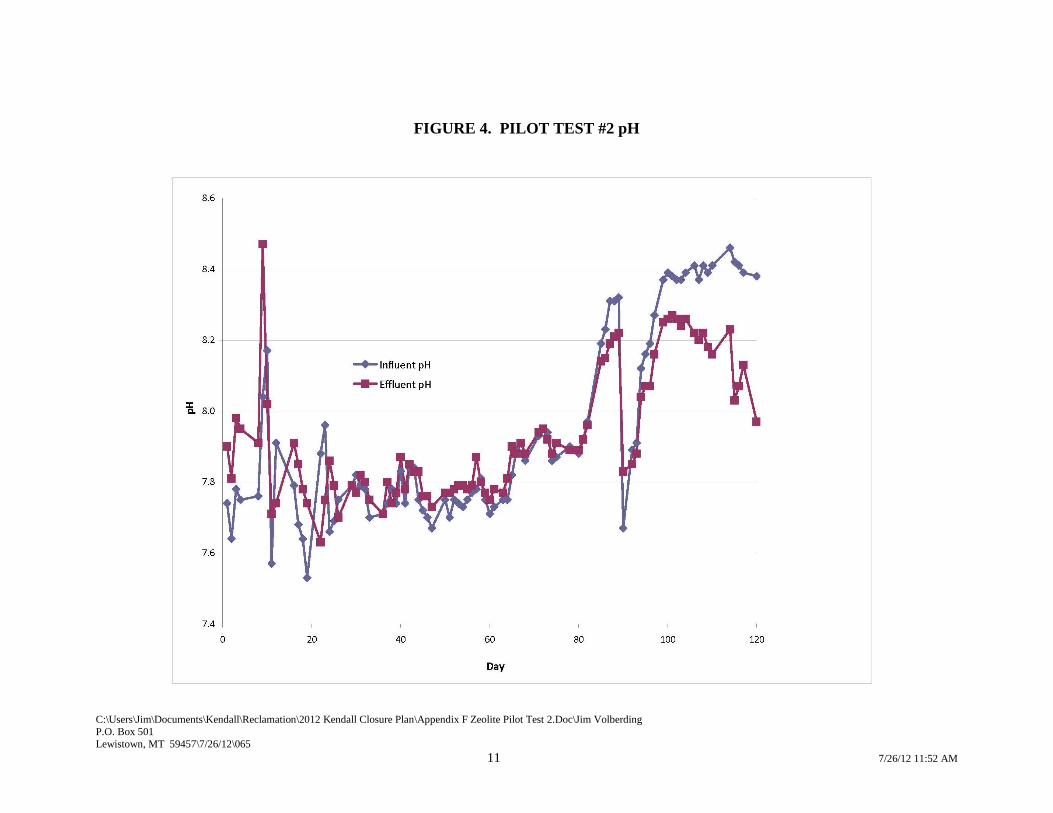
C:\Users\Jim\Documents\Kendall\Reclamation\2012 Kendall Closure Plan\Appendix F Zeolite Pilot Test 2.Doc\Jim Volberding
P.O. Box 501
Lewistown, MT 59457\7/26/12\065
11 7/26/12 11:52 AM
FIGURE 4. PILOT TEST #2 pH

C:\Users\Jim\Documents\Kendall\Reclamation\2012 Kendall Closure Plan\Appendix F Zeolite Pilot Test 2.Doc\Jim Volberding
P.O. Box 501
Lewistown, MT 59457\7/26/12\065
12 7/26/12 11:52 AM
FIGURE 5. PILOT TEST #2 RESULTS – NORMAL SCALE
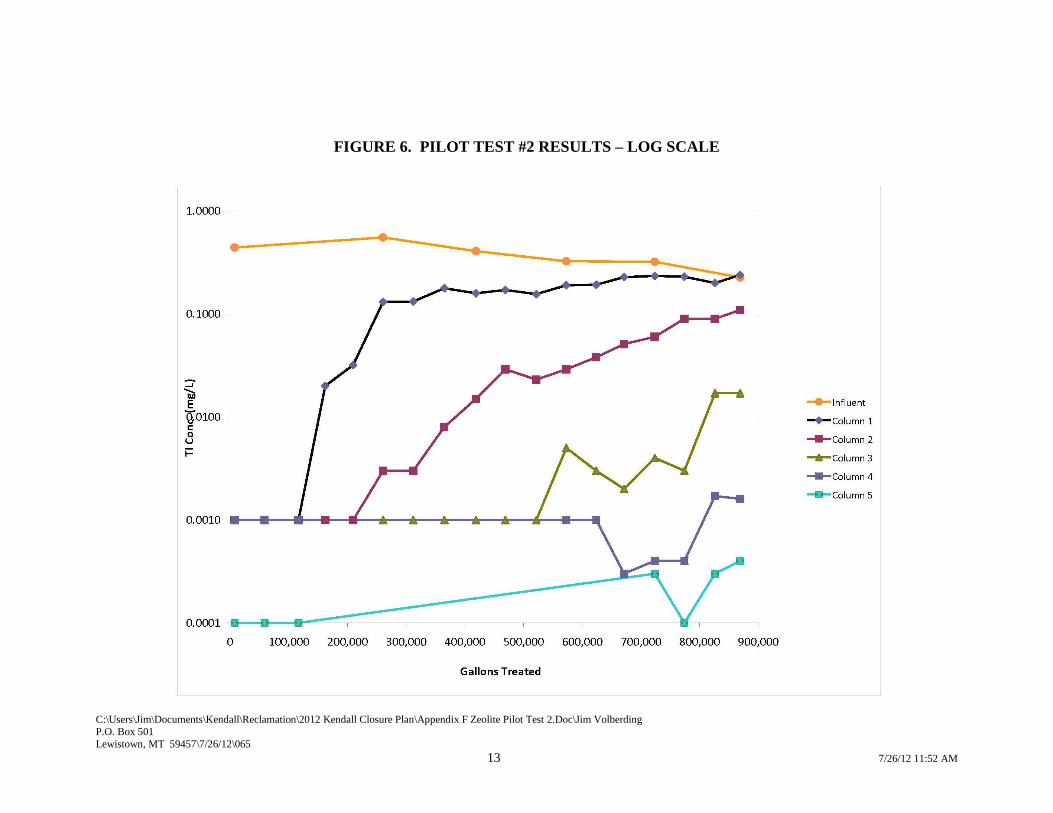
C:\Users\Jim\Documents\Kendall\Reclamation\2012 Kendall Closure Plan\Appendix F Zeolite Pilot Test 2.Doc\Jim Volberding
P.O. Box 501
Lewistown, MT 59457\7/26/12\065
13 7/26/12 11:52 AM
FIGURE 6. PILOT TEST #2 RESULTS – LOG SCALE

C:\Users\Jim\Documents\Kendall\Reclamation\2012 Kendall Closure Plan\Appendix F Zeolite Pilot Test 2.Doc\Jim Volberding
P.O. Box 501
Lewistown, MT 59457\7/26/12\065 14 7/26/12 11:52 AM
Other Parameters
Samples were taken on 2/07/11, Day 1 of the test, and analyzed for parameters other than
thallium. These results are shown in Table 4.
TABLE 4. OTHER PARAMETERS
Sampling on 2/07/11
Parameter
Concentration (mg/L)
Influent Column 5
Alkalinity 228 222
Bicarbonate 278 271
Sulfate 1,160 1,140
Hardness 1,270 1,240
Arsenic 0.006 0.005
Calcium 316 309
Magnesium 117 114
Potassium 7 4
Selenium 0.028 0.028
Sodium 31 60
Zeolite Analysis
At the conclusion of the test, the Toxicity Characteristic Leaching Procedure (TCLP) and
Synthetic Precipitation Leaching Procedure (SPLP) were performed on a sample of the
Column 1 zeolites, which would have contained the highest loading of any material used.
This was a composite sample from within the column, as the zeolites were mixed with an air
hose prior to sampling. Those leaching results for the eight RCRA metals plus thallium are
shown in Table 5. Since all metals other than thallium were non-detect, this spent material
would be classified as nonhazardous waste.
TABLE 5. LEACHING RESULTS
Column 1, sampled on 6/6/11
Metal
Concentration (mg/L)
TCLP SPLP
Arsenic < 0.5 < 0.5
Barium < 10 < 1
Cadmium < 0.1 < 0.1
Chromium < 0.5 < 0.5
Lead < 0.5 < 0.5
Mercury < 0.02 < 0.02
Selenium < 0.1 < 0.1
Silver < 0.5 < 0.5
Thallium 1.89 0.08

C:\Users\Jim\Documents\Kendall\Reclamation\2012 Kendall Closure Plan\Appendix F Zeolite Pilot Test 2.Doc\Jim Volberding
P.O. Box 501
Lewistown, MT 59457\7/26/12\065 15 7/26/12 11:52 AM
The TCLP test is conducted with a ratio of 50 g of zeolite to 1 L of leach solution. Assuming
that the 50 g sample of zeolite leached in the TCLP test contained 3,160 mg/kg thallium (as
measured in the whole rock analysis described below), the zeolite sample contained a total of
approximately 158 mg of thallium prior to the leach test. In the TCLP test, 1.89 mg or 1.2
percent of the thallium was leached from the zeolite sample. This leach result is similar to
previous leach tests of St. Cloud chabazite and to the Pilot Test 1 result, and demonstrates
that the thallium retained by the zeolites is not readily leachable.
At the conclusion of the test, samples from each column were directly analyzed for the same
parameters by strong acid digestion (“whole rock analysis”); results are in Table 6. Each
column sample was a blended composite from throughout the column. Column 1 was
analyzed for all TCLP metals plus thallium; the other columns were only analyzed for
thallium, since Pilot Test #1 analysis showed that thallium was the only metal that varied
across the columns. The decreasing amounts of thallium adsorbed to the zeolites agree with
the decreasing concentrations exiting each successive column (Figure 6).
TABLE 6. WHOLE ROCK ANALYSIS
Sampled on 6/6/11
Concentration (mg/kg)
Metal Col. 1 Col. 2 Col. 3 Col. 4 Col. 5
Arsenic 10 NA NA NA NA
Barium 232 NA NA NA NA
Cadmium < 1 NA NA NA NA
Chromium < 5 NA NA NA NA
Lead 5 NA NA NA NA
Mercury < 1 NA NA NA NA
Selenium < 5 NA NA NA NA
Silver < 5 NA NA NA NA
Thallium 3,160 1,210 214 5 < 5
A thallium mass balance from each column shows that we removed the following quantities
of thallium:
Column 1: 393 lbs * 1 kg/2.2 lb * 3,160 mg/kg = 564,000 mg Tl
Column 2: 393/2.2 * 1,210 mg/kg = 216,000 mg Tl
Column 3: 393/2.2 * 214 mg/kg = 38,000 mg Tl
Column 4: 393/2.2 * 5 mg/kg = 900 mg Tl
Column 5: 393/2.2 * 2.5 mg/kg = 400 mg Tl
819,300 mg

C:\Users\Jim\Documents\Kendall\Reclamation\2012 Kendall Closure Plan\Appendix F Zeolite Pilot Test 2.Doc\Jim Volberding
P.O. Box 501
Lewistown, MT 59457\7/26/12\065 16 7/26/12 11:52 AM
Now we can compare this to the amount theoretically removed from the water. The influent
thallium concentration steadily decreased during the test; we will assume it was the average
of the six readings taken during the test, or 0.379 mg/L. According to the flowmeter, we
treated 868,930 gallons. Therefore, we removed the following quantity of thallium:
0.379 mg/L * 868,930 gal * 3.785 L/gal = 1,246,000 mg
This quantity is 52% higher than the 819,300 mg calculated from the whole rock analysis.
Both numbers are in the same range but it is unclear why the difference is so large. The mass
balance in Pilot Test #1 differed by 21%.
Adsorption Capacity
The Table 6 numbers show a thallium adsorption capacity of 3,160 mg/kg (0.316%) in
Column 1, with lesser amounts in the following columns. In Pilot Test #1, we achieved a
thallium loading of 0.376% in Column 1.