crack nucleation and growth data and modeling
TRANSCRIPT

d:/data/McClung/presentation/TOGAA_phase1.ppt
Crack Nucleation and GrowthData and Modeling
Task Manager: Craig McClung (SwRI)Peter McKeighan (SwRI)
Peter Laz (SwRI)Lee Perocchi (GE CR&D)
Barney Lawless (GE)Yancey Gill (Honeywell)Darryl Lehmann (P&W)
5th Annual FAA/USAF/NASA/USN WorkshopApplication of Probabilistic Methods to Gas Turbine Engines

c:/data/TRMD2/charts/Cleveland.ppt
Outline
! Crack nucleation in hard alpha defects" Static and fatigue loading" Fatigue crack growth into surrounding matrix
! Thermal residual stresses in and near HA" Experimental measurement of CTE" Analytical estimation of residual stresses" Effect of residual stresses on cracking behavior
! Vacuum FCG behavior for titanium rotor alloys" Vacuum FCG testing for Ti-6-4, Ti-6-2-4-2, Ti-17" Comparisons of vacuum vs. air FCG rates
! Spin pit tests on rotors with HA defects" UT and fractographic inspections

c:/data/TRMD2/charts/Cleveland.ppt
Crack Nucleation in Hard Alpha:Motivation and Plan
! Are all HA inclusions always cracked at start of life?! Experimentally characterize crack formation in HA inclusions
" static and cyclic loading! Primary focus on testing synthetic HA inclusions
" manufactured by GE CR&D" high nitrogen core (1.6-6%) with surrounding diffusion zone
! Limited testing with natural HA inclusions" specimens extracted from RMI contaminated billets at ETC
! Characterization of cracking" nonvisual techniques (esp. AE) for real-time monitoring" post-test fractography and sectioning

c:/data/TRMD2/charts/Cleveland.ppt
Crack Nucleation in HA:Specimens
Subsurface Defect
defect
diffusion zone
0.500
0.250
large surfaceHA defect
thic
knes
s
Surface Defect
0.500
thic
knes
s

c:/data/TRMD2/charts/Cleveland.ppt
Crack Nucleation in HA:Statically Loaded Surface Defects
! Agreement between visual and nonvisual indications! Most defects crack at relatively low monotonic stresses
Applied Stress Level, ksi0 10 20 30 40 50
Visu
al C
rack
Len
gth,
inc
h
0.000
0.025
0.050
0.075
0.100
0.125PD
3.9
4.0
AE
0
5
10
15
20
25
UT
0.6
0.8
1.0crack lengthpotential drop (PD)acoustic emission (AE)ultrasonic (UT)
HA-SL-B1
AE trendUT trend
PD trend
PD currentlead (+)
PD outervoltage
probe (+)
PD innerprobes
AE micro-phone (6)
wedgegrips
griphousing
test specimen(upper grip removed)

c:/data/TRMD2/charts/Cleveland.ppt
AE Response for Statically Loaded Interior Defects
! A few early events, but most activity occurs in bursts above 80-100 ksi
STATIC LOADINGInterior Defect Tests
Stress Level, ksi0 20 40 60 80 100 120
AE
even
ts (c
umul
ativ
e)
0
100
200
300
AE
ener
gy (c
umul
ativ
e)
101
102
103
104
105
106
SHI-1 (small, high nitrogen)LHI-1 (large, high nitrogen)LLI-1 (large, low nitrogen)
solid - eventsdashed - energy
(b)
AE events (at 90 ksi)
Specimen LHI-1Large, high nitrogeninterior defectstatic loading condition
position across width thick
ness
posit
ion
posi
tion
alon
g le
ngth
position across width thick
ness
posit
ion
posi
tion
alon
g le
ngth
AE events (at 100 ksi)

c:/data/TRMD2/charts/Cleveland.ppt
Typical Cracking for Statically Loaded Interior Defects
! Shattered core in high N defects at high stress
! Limited core cracking at lower stresses! Little cracking in low N defect at 120 ksi
SHI-1
diffusionzone core
(shattered)
basemetal
(97166)
0.020
(a)
(b)
SHI-1
(97236)
diffusionzone
basemetal
cracks
0.020
(97208)
LLI-1
diffusionzone
basemetal
interface crack
0.004
(97245)
LLI-1
basemetal
cracks
diffusion zone
0.030
c:/data/TRMD2/charts/Cleveland.ppt
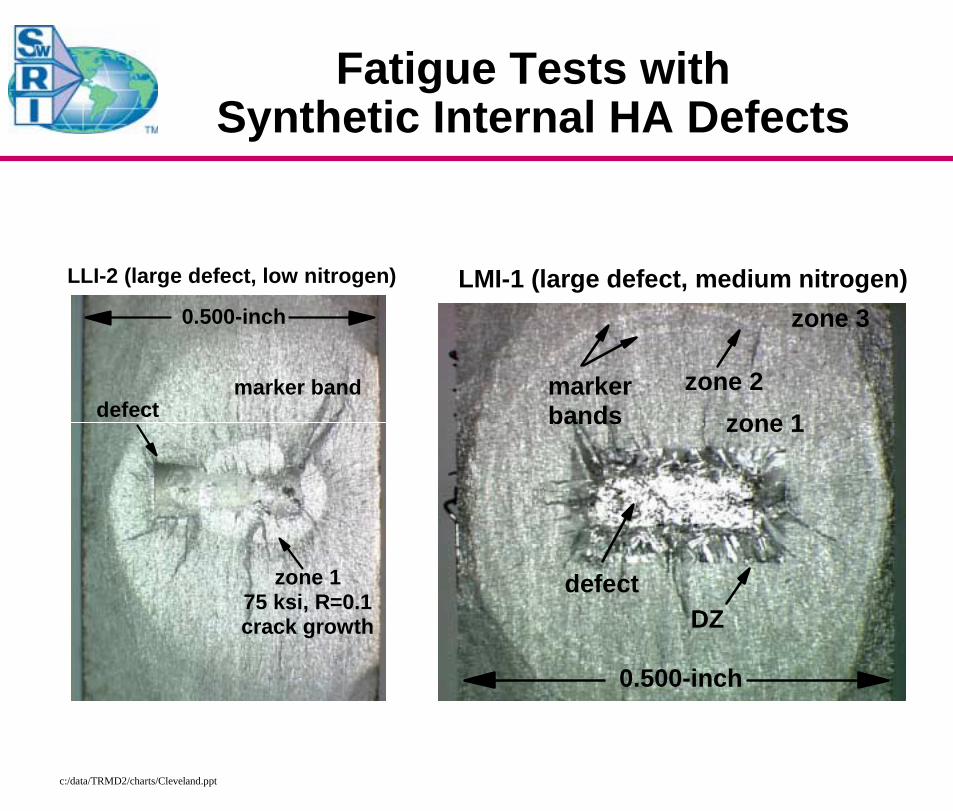
Fatigue Tests with Synthetic Internal HA Defects
0.500-inch
defect
zone 175 ksi, R=0.1crack growth
marker band
LLI-2 (large defect, low nitrogen) LMI-1 (large defect, medium nitrogen)
DZdefect
markerbands zone 1
zone 2
0.500-inch
zone 3

c:/data/TRMD2/charts/Cleveland.ppt
Fatigue Tests with Synthetic Internal HA Defects
! Marker bands confirm matrix FCG rates vs. vacuum data! AE signals indicate some early defect cracking! Calculated FCG life shorter than experimental life for
crack growth into matrix" 75 ksi σmax : 2.5K cycles predicted vs. 10K - 20K cycles applied
! Possible effects of residual stresses around defect" surface vs. internal behavior under static loading" no crack growth for nominal ∆K > ∆Kth

c:/data/TRMD2/charts/Cleveland.ppt
Specimens with Natural HA Defects
RMI billet: B1AW2
6.0
14.0
stampedend
flaw
Eflaw F
6.0
EDMcut
billet end views (from stamped end)
specimens(E1 - with defectE2 - DZ only)0.45
0.70.40
specimen F1
EDM cuts
1.0
specimen blank
EDM cutsurface
EDM cutsurface
specimenblank
0E
90E
180E
270E
0E
90E
180E
270E
0.0 from end
flaw E: 1.4 inch deep,
30E- 45E
9.7 from end
0.3 0.3
flaw F: 1.3 inch deep,
28E- 43E

c:/data/TRMD2/charts/Cleveland.ppt
Fatigue Test with Natural Surface HA Defect
! Fractography indicates crack nucleation at defect core and subsequent progressive cracking along diffusion zone and through matrix
! Diffusion zone was not extensively cracked early in life
RMI-E1 (surface)
0.375
coreDZ
region A
fracture

c:/data/TRMD2/charts/Cleveland.ppt
Fatigue Test with Natural Internal HA Defect
! Similar behavior to synthetic internal defects
! AE indicates early defect cracking! Higher stresses, more cycles
required to grow crack into matrix
RMI-F1 (interior)
core
0.50
region A
region Bfract
ure
RMI-F1natural interior defect
Applied Cycles (without marker bands), x103 0 20 40 60 80 100
AE
even
ts (c
umul
ativ
e)
102
103
104
AE
ener
gy (c
umul
ativ
e)
102
103
104
105
106
107
108
PD c
hang
e, v
olts
-0.25
0.00
0.25
0.50
0.75
1.00
AE eventsAE energyPD
62 ksiσσσσmax= 50 ksi 75 ksi 100 ksi
(b)

c:/data/TRMD2/charts/Cleveland.ppt
Residual Stresses at HAIntroduction
! Coupon tests on HA seeded specimens gave surprisingly high static and fatigue strengths for embedded defects
! Possible explanation: residual stresses at and near the HA" Caused by differential thermal expansion
! Approach" Make suitable HA specimens at a variety of N levels and measure
CTE over the relevant temperature range" Use resulting CTE values in mechanics analyses to predict the
residual stress distributions around the HA particle" Evaluate the potential effects on fatigue and fracture
→ onset of crack formation in the HA→ fatigue crack growth into the matrix

c:/data/TRMD2/charts/Cleveland.ppt
Residual Stresses at HACoefficient of Thermal Expansion
! Measurements performed by GE CR&D! HA CTE is lower than Ti-6-4 CTE
-0.2
0
0.2
0.4
0.6
0.8
1
0 500 1000 1500 2000
Ti wt.% Nitrogen
Ti-2NTi-4NTi-6NTi-9NTi-12NTi64 Forging
Expa
nsio
n(%
)
Temp.(F)Push-rod dilatometer

c:/data/TRMD2/charts/Cleveland.ppt
Residual stresses in and around a HA particle
Distance r [inch]0.00 0.05 0.10 0.15 0.20
Resid
ual S
tress
[ksi]
-50
-40
-30
-20
-10
0
10
20
30
40
50
σr(r) σc(r)
MatrixParticle
Spherical geometry - Large defect (r1=0.039")For HA-6N particle and Ti-6-4 matrix
Residual Stresses at HAResidual Stress Distribution
! Due to CTE differences during the cooling process! Based on elastic solution from Brooksbank and Andrews (1969)
" Solutions available for spherical and cylindrical particles

c:/data/TRMD2/charts/Cleveland.ppt
Residual Stresses at HAOnset of HA Cracking
! Cracking was observed in subsurface HA defects at significantly higher stresses than surface defects" Surface defects—at nominal stresses of 5-20 ksi" Subsurface defects—at nominal stresses of 80-115 ksi
! Approach" Quantify residual stresses associated with HA" Determine pressure for the existing stress state" Predict fracture using empirical model developed by Chan" Compare with experimentally observed stresses at fracture

c:/data/TRMD2/charts/Cleveland.ppt
Residual Stresses at HAFracture Strength of HA (Chan)
! Fracture strength of HA in uniaxial compression (Yn)
! Normalized fracture strength
where Yi = Fracture strength for a given stress stateP = Pressure
! Pressure determined from principal stresses
+=
nni
YPlog*0.941.4
YY
[MPa] N*31.43 382.26 Yn +=
( )( ) 3
3332211/)(P
/P
zcnomr σ+σ+σ+σ=σ+σ+σ=

c:/data/TRMD2/charts/Cleveland.ppt
-200
-150
-100
-50
0
50
100
150
-50 -25 0 25 50 75 100
Pressure P [ksi]
Yi,
σno
min
al [k
si]
Fracture Strength YiSurface DefectSubsurface Defect
+ = Compression
Fracture
- = TensionCylindrical geometry - Large defect (r1=0.039")Ti-6-4 Matrix and HA-6N
Fracture Strength and Applied Pressure
Residual Stresses at HAFracture Criteria

c:/data/TRMD2/charts/Cleveland.ppt
Residual Stresses at HAInfluence on Crack Growth into Matrix
! Phase I coupon tests on seeded specimens gave higher than expected fatigue strengths for embedded defects
! Approach" Quantify residual stresses associated with HA" Determine the stress intensity factor and R-ratio" Compare with fatigue crack growth threshold values" Evaluate impact on fatigue crack growth life (work in progress)

c:/data/TRMD2/charts/Cleveland.ppt
Residual Stresses at HAStress Intensity Factor
! K determined for a crack emanating from a particle" Superposition of
residual stresses and nominal applied stress using the weight function approach
" Initial crack size is equal to particle size
Distance r [inch]0.00 0.05 0.10 0.15
Kmax
[ksi-
√in]
-20
-10
0
10
20
30
40
Kresidual Knominal Ktotal
MatrixParticle
Spherical geometryLarge defect (r1 = 0.039")Applied stress = 75 ksi

c:/data/TRMD2/charts/Cleveland.ppt
Residual Stresses at HAAnalytical Modeling
! Residual stress causes an R-ratio shift" e.g., σmax = 75 ksi → R = -0.95" ∆Κ threshold is a function of R
! Threshold values consistent with tests
R ratio-2 -1 0 1
∆Kth
resh
old
[ksi-
√in]
0
5
10
15
20
25Walker Type Fit Experimental Data
Applied Stress [ksi]0 20 40 60 80 100 120
∆K, ∆
K thr
esho
ld [k
si-√i
n]
0
25
50
75
∆Kthreshold - Nominal ∆Kthreshold with Residual Stress (HA-6N) No Growth - Small defect (r1=0.0155") No Growth - Natural defect (r1=0.02") Growth - Natural defect (r1=0.02") No Growth - Large defect (r1=0.039") Growth - Large defect (r1=0.039")
Final CrackSizes
HA-6N
Spherical geometry

c:/data/TRMD2/charts/Cleveland.ppt
Residual Stresses at HACrack Growth Findings
! Compressive stresses in HA cause a decrease in stress ratio" Residual stresses increase the apparent threshold for growth
! Model appears to explain the experimental observations" Some ambiguities remain due to complex nature of the
problem
! Model provides guidance for design implications of residual stresses" At high stresses (above 80-90 ksi), influence is negligible" At low stresses (below 40-50 ksi), influence may be great" At intermediate stresses, influence unclear because of
ambiguities

c:/data/TRMD2/charts/Cleveland.ppt
Vacuum FCG Testing of TitaniumRotor Alloys: Background
! HA anomalies are usually subsurface" Fatigue cracks embedded for at least some of life" Isolated from atmosphere (vacuum-like environment)
! Vaccum FCG rates for Ti alloys can be very different from air! Need adequate FCG data for rotor design and reliability analysis! Data generated for four Ti rotor alloys at multiple R, T values
" Ti-6-4, Ti-6-2-4-2 (FG and CG), Ti-17" R = 0, 0.5, 0.75 (0.6 for Ti-17)" T = RT to 400°F (Ti-6-4), 1000°F (Ti-6-2-4-2), 750°F (Ti-17)" Testing currently underway on IN-718 and Waspaloy
! Follow conventional engine company FCG test procedures" Machine small SC(T) and SEN(B) specimens from production forgings" Constant load and K-gradient histories with DCPD crack measurement" Testing performed at GEAE (Barney Lawless) and Honeywell (Yancey Gill)
! Perform regressions of vacuum data for FCG eqns in DARWIN

c:/data/TRMD2/charts/Cleveland.ppt
Vacuum FCG Testing: Sample Results
∆K, ksi-in1/2
1 10 100
da/d
N, i
n/cy
cle
10-8
10-7
10-6
10-5
10-4
10-3
R=0.05R=0.5R=0.75
Ti-6-2-4-2Vacuum
75oF
∆K, ksi-in1/2
1 10 100
da/d
N, i
n/cy
cle
10-8
10-7
10-6
10-5
10-4
10-3
R=0.05R=0.5R=0.75
Ti-6-2-4-2Vacuum1000oF
c:/data/TRMD2/charts/Cleveland.ppt
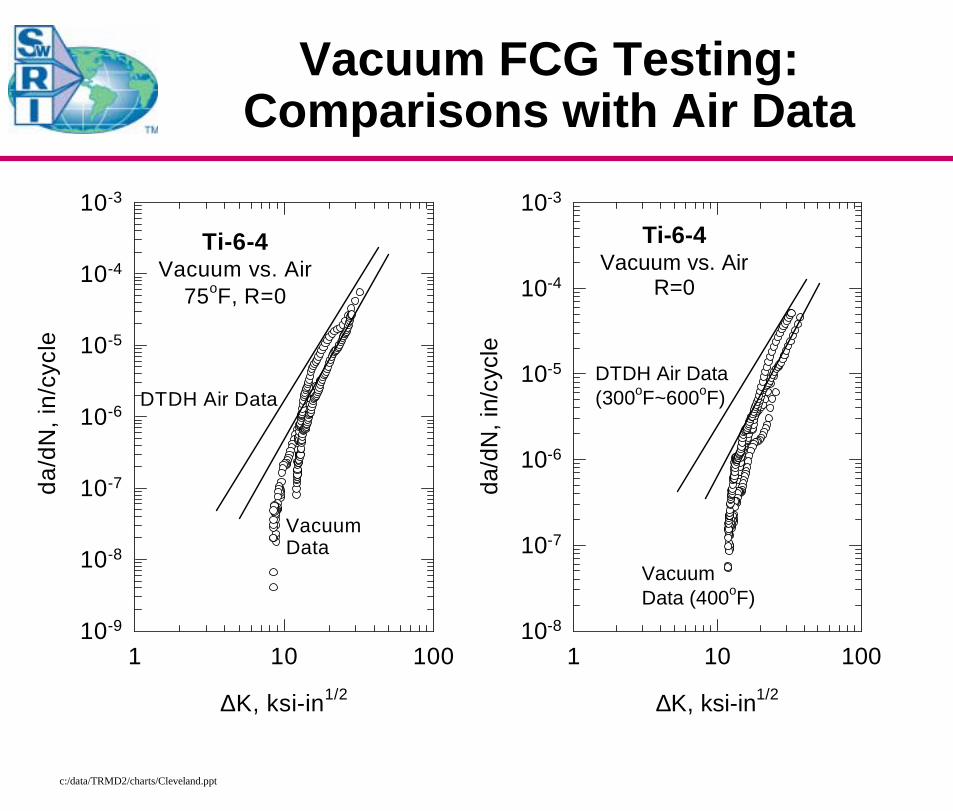
Vacuum FCG Testing:Comparisons with Air Data
∆K, ksi-in1/2
1 10 100
da/d
N, i
n/cy
cle
10-9
10-8
10-7
10-6
10-5
10-4
10-3
Ti-6-4Vacuum vs. Air
75oF, R=0
DTDH Air Data
VacuumData
∆K, ksi-in1/2
1 10 100
da/d
N, i
n/cy
cle
10-8
10-7
10-6
10-5
10-4
10-3
Ti-6-4Vacuum vs. Air
R=0
Vacuum Data (400oF)
DTDH Air Data(300oF~600oF)

c:/data/TRMD2/charts/Cleveland.ppt
Vacuum FCG Testing:Vacuum vs. Air Data for Ti-17
∆K, ksi√in1 10 100
da/d
N, i
n/cy
cle
10-8
10-7
10-6
10-5
10-4
10-3
Vacuum - R=0 (SC(T))AGARD air data - R=0.1 (C(T))AGARD air data - R=0.1 (corner crack)
Ti-17Room Temp
∆K, ksi√in1 10 100
da/d
N, i
n/cy
cle
10-8
10-7
10-6
10-5
10-4
10-3
Vacuum - R=0.6 (SC(T))AGARD air data - R=0.7 (C(T))AGARD air data - R=0.7 (corner crack)
Ti-17Room Temp

c:/data/TRMD2/charts/Cleveland.ppt
Vacuum FCG Testing:Significance for FCG Life
! How much difference does vacuum vs. air data make for calculated FCG lifetime?
! Compare for embedded flaw, Paris eqns, 75°F, R = 0
∆K (ksi√in)
1 10 100
da/d
N (i
nch/
cycl
e)
10-9
10-8
10-7
10-6
10-5
10-4
10-3
10-2
10-1
air
vacuum
Material: Ti-6-4R-ratio: 0Temperature: 75oF
vacuum and airbilinear fit
Initial Crack Radius (inch)
0.001 0.01 0.1 1
Cyc
les
to F
ailu
re
1000
10000
100000
1000000
Material: Ti-6-4R-ratio: 0.0Temperature: 75oF
Smax=50 ksi
Smax=75 ksi
Smax=100 ksi
air
vacuum
vacuum and airbilinear data

c:/data/TRMD2/charts/Cleveland.ppt
Spin Pit Tests on Rotors with HA Defects
! Make/select billets with single artificial/natural HA defect! Forge billet into sonic shape with defect in known critical
location (guidance from DEFORM calculations)! Conduct spin pit tests (goal: appreciable crack growth)! UT inspections before and after spin cycling! Post-test fractography to characterize crack growth! Compare with FCG predictions based on vacuum data
" (work in progress)
! Spin pit testing directed by P&W (Darryl Lehmann), conducted at Test Devices

c:/data/TRMD2/charts/Cleveland.ppt
Spin Pit Testing:Sonic Shape Disks
! Two disks with natural HA (from ETC CBS)! One disk with artificial HA (created by GE CR&D)

c:/data/TRMD2/charts/Cleveland.ppt
Spin Pit Testing: Summary
! Initial spins of each disk for 10,000 cycles" Speeds selected based on FCG calculations" Initial UT inspections inconclusive regarding crack growth
! Further spin testing at higher speeds" Disks SB-6 and B3W2E both burst at ~15K-16K total cycles
# Crack monitoring system did not indicate growth until last cycle# One side of fracture surface on each ruptured disk was preserved
" Disk B1BW3B successfully completed 17,500 total cycles# UT inspection clearly indicated crack growth# No further spin testing conducted# Further UT inspections to be conducted before disk is cut up

c:/data/TRMD2/charts/Cleveland.ppt
Spin Pit Testing:UT Inspection Results
! Normal UT inspections exhibited slight decreases in signal amplitude with continued cycling
! Angled UT inspections exhibited increases in amplitudes! Signal separation in angled scans indicates crack growth
0
50
100
150
200
250
300
350
400
0 5000 10000 15000 20000Accumulated Cycles
Insp
ectio
nAm
pitu
de(%
#1
FBH
)
moreseparation
someseparation

c:/data/TRMD2/charts/Cleveland.ppt
Spin Pit Testing:Post-Test Fractography
! SB-6
A
BC
D
EF
G
Core
Diffusion zone

c:/data/TRMD2/charts/Cleveland.ppt
Spin-Pit Testing:Post-Test Fractography
! B3W2E
Defect ~025” from top surface
1 2 3 4
Defect ~0.25” from top surface
A
B
C
D
EF
G
H
4 3 2 1

c:/data/TRMD2/charts/Cleveland.ppt
Crack Nucleation and Growth:Summary
! Crack nucleation in HA defects" Internal defects crack at much higher static stresses than surface " FCG into matrix occurs less easily than expected" Matrix FCG rates agree with vacuum data
! Residual stress effects on HA cracking behavior" CTE measured for HA with various N contents" Residual stress/fracture models consistent with test results
! Vacuum FCG behavior for rotor alloys" Design data generated for Ti-6-4, Ti-6-2-4-2, Ti-17 at multiple R, T" Vacuum exhibits higher ∆Kth, slower da/dN, longer N than air
! Spin pit tests on rotors with HA defects" Normal UT decreases, shear UT increases with crack growth" Fractography in progress to evaluate vacuum FCG predictions