cran - company risk assessment network - nordic innovation
TRANSCRIPT
Editors: Pernilla Arinder and Elisabeth Borch, SIK - The Swedish Institute for Food and Biotechnology, Sweden
CRAN - Company Risk Assessment Network
June 2007
• Tools for decision support and quantitative microbial assessment of food processes
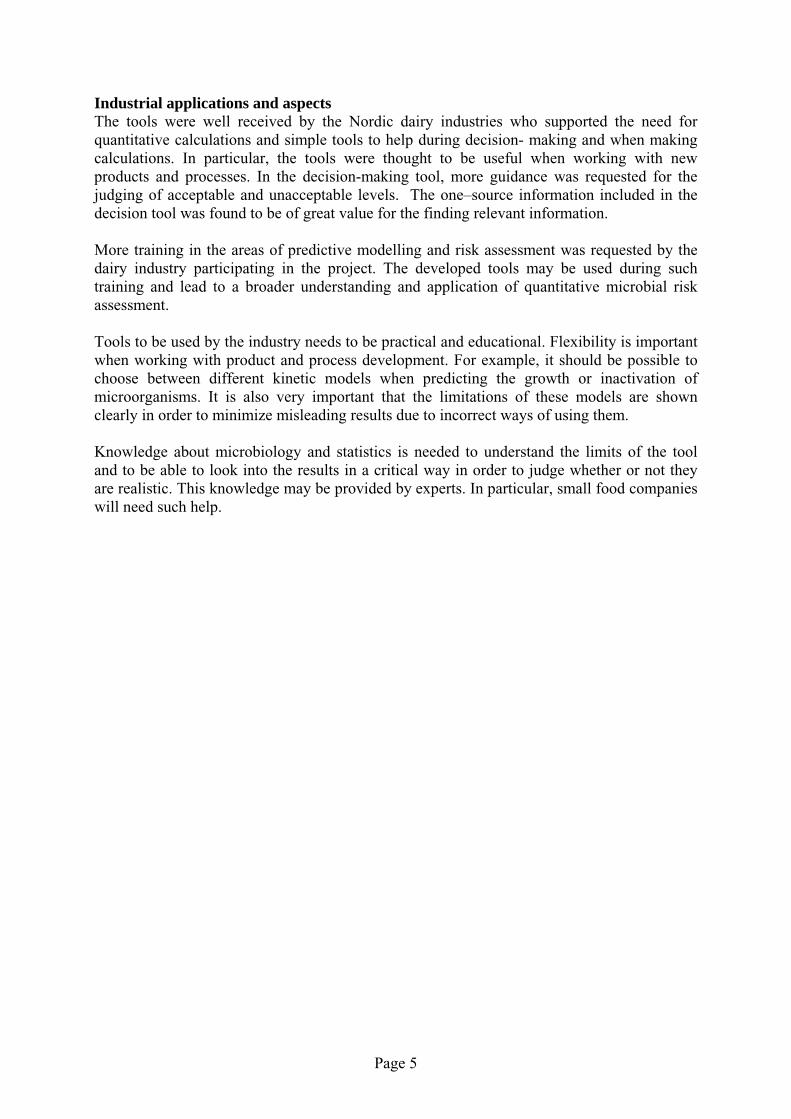
Participants: Sweden SIK- The Swedish Institute for Food and Biotechnology Pernilla Arinder Elisabeth Borch Carl-Gustav Jansson Hans Janestad Alexander Milanov Swedish Dairy Association Anders Christiansson Arla Annelie Eklöw Harriet alnås Finland EVIRA Pirkko Tuominen Riitta Maijala Terhi Virtanen Mikko Tuominen VTT Kaarina Aarnisalo Laura Raaska
Denmark Danish Dairy Board Claus Heggum Iceland MATIS Viggó Þ. Marteinsson Páll Steinþórsson Birna Gudbjornadottir Nordurmjolk Kristin Halldórsdóttir Norway Matforsk Trond Møretrø Cathrine Finne Kure Q Mejerier Liv Ljones Tine Hanne Oppegaard

Title: Company Risk Assessment Network Nordic Innovation Center (NICe) project number: 04007 Authors: Pernilla Arinder, Elisabeth Borch Institution: SIK –The Swedish Institute for Food and Biotechnology Abstract: The objective of the project was to:
• Increase knowledge of quantitative microbial hazard analysis in the Nordic food industries
• Develop computer-based tools to be used in quantitative microbial hazard analysis
and decision-making. The project has provided opportunities for both the industry and its scientific partners in the Nordic countries to increase and share knowledge of quantitative hazard analysis during workshops organized within the project. Tools demonstrating a methodology for decision-making and microbial hazard analysis were developed and evaluated during the project. Demonstrations of these tools are available at the project website (www.sik.se/cran/) and by contacting the project partners. These tools are:
• A decision-making tool that provides help during the systematic evaluation of microbial hazards and an aid for finding data and information needed during decision-making.
• A calculation tool for simulating bacterial levels along the production chain, taking into account variations in process and product parameters.
• Databases for systematically collecting the microbial and process data important for assessing bacterial concentrations along the production chain.
During workshops, the tools were demonstrated for and tested by a number of dairy industries in the Nordic countries. Topic/NICe Focus Area: Food Safety ISSN: Language: English Pages: 31 + appendicesKey words: Food, safety, microorganisms, risk assessment, hazard, exposure assessment, HACCP, decision tool, Simulation, processs variation Distributed by: Nordic Innovation Center Stenbergsgata 25 NO-0170 Oslo Norway
Contact person: Pernilla Arinder SIK Ideon SE-223 70 Lund Sweden Tel: +46 46 2868825 [email protected]
Page 3

Executive summary The objective of the project was to:
• Increase knowledge of quantitative microbial hazard analysis in the Nordic food industries
• Develop computer-based tools to be used in quantitative microbial hazard analysis and
decision-making. The project has provided opportunities for both the industry and its scientific partners in the Nordic countries to increase and share knowledge of quantitative hazard analysis during workshops organized within the project Tools demonstrating a methodology for decision-making and microbial hazard analysis were developed and evaluated during the project. Demo-versions of these tools are available at the project website (www.sik.se/cran/) and by contacting the project partners. These tools are:
• A decision-making tool that provides help during the systematic evaluation of microbial hazards and an aid for finding the data and information needed during decision-making.
• A calculation tool for simulating bacterial levels along the production chain, taking into account variations in process and product parameters.
• Databases for systematically collecting the microbial and process data important for assessing bacterial concentrations along the production chain.
During workshops, the tools were demonstrated for and tested by a number of dairy industries in the Nordic countries. Tools to be used in quantitative microbial risk assessment in food processes Computer- based tools were developed in order to demonstrate methodologies that will help food companies to improve their food safety. These tools provide guidance during quantitative microbial risk assessment and may be used for estimating bacterial levels in products along food processing lines. The effect of various process parameters on the behaviour of a specific microorganism, or the effects of contamination at different positions locations along the production chain, may be evaluated. The developed tools are useful during training and will provide a broader understanding of the applicability and benefits of quantitative microbial risk assessment. They are also useful when developing new products and processes since computer- based simulations on bacterial responses may be performed. This will result in a better identification and understanding of the relevant hazards, and critical control points leading to an improved control. For future applications, a further development and adjustment is will be necessary in order to fulfil meet the specific requirements of each addressed problem addressed. The tools have not been finally developed or validated for commercial application or for use by industry without expert back-up.
Page 4
Industrial applications and aspects The tools were well received by the Nordic dairy industries who supported the need for quantitative calculations and simple tools to help during decision- making and when making calculations. In particular, the tools were thought to be useful when working with new products and processes. In the decision-making tool, more guidance was requested for the judging of acceptable and unacceptable levels. The one–source information included in the decision tool was found to be of great value for the finding relevant information. More training in the areas of predictive modelling and risk assessment was requested by the dairy industry participating in the project. The developed tools may be used during such training and lead to a broader understanding and application of quantitative microbial risk assessment. Tools to be used by the industry needs to be practical and educational. Flexibility is important when working with product and process development. For example, it should be possible to choose between different kinetic models when predicting the growth or inactivation of microorganisms. It is also very important that the limitations of these models are shown clearly in order to minimize misleading results due to incorrect ways of using them. Knowledge about microbiology and statistics is needed to understand the limits of the tool and to be able to look into the results in a critical way in order to judge whether or not they are realistic. This knowledge may be provided by experts. In particular, small food companies will need such help.
Page 5
Participants ................................................................................................................................. 2 Executive summary .................................................................................................................... 5 Background ................................................................................................................................ 8 Networking activities ................................................................................................................. 8
Workshops.............................................................................................................................. 8 Homepage and newsletters................................................................................................... 12 Presentations on conferences and seminars ......................................................................... 12 Papers and reports ................................................................................................................ 12 Other dissemination activities .............................................................................................. 12
Tools for quantitative microbial assessment along the process chain and decision making.... 13 CRAN data base ................................................................................................................... 14
Aim................................................................................................................................... 14 Principle ........................................................................................................................... 14 Collection of bacterial data .............................................................................................. 15 Storage data ...................................................................................................................... 18
CRAN calculation tool for calculation of bacterial number along a process chain ............. 19 Aim................................................................................................................................... 19 Principle ........................................................................................................................... 19 Results using the CRAN calculation tool......................................................................... 21
CRAN decision support tool ................................................................................................ 23 Aim................................................................................................................................... 24 Principle ........................................................................................................................... 24
Thoughts from the dairy industry about tools for microbial assessment and decision making of food processes .......................................................................................................................... 25
Denmark ............................................................................................................................... 25 Finland.................................................................................................................................. 26 Iceland .................................................................................................................................. 27 Sweden ................................................................................................................................. 27
Future needs ............................................................................................................................. 28 References ................................................................................................................................ 30 Appendix 1: Demo - Decision tool ...........................................................................................31 Appendix 2: Demo - Calculation tool .......................................................................................39 Appendix 3: Demo - CRAN database .......................................................................................51
Page 6
Page 7
Background Food should not contain microorganisms in quantities that entail an unacceptable risk to human health. As a basic step to increase food safety, the risk management system HACCP is applied. However, the hazard analysis step in HACCP needs to be further improved. This is achieved by applying a quantitative approach for microbial assessment and also by decision making support. Since food safety is the responsibility of the food chain operators, it is essential to adapt to their prerequisites. Risk management relating to microbial hazards requires substantial knowledge of processing, legislation and microbiology. Many food companies are small and have limited expertise and resources in this context. Management tools are important aids in their efforts aimed at complying better with safe food requirements and carrying out cost-effective measures. Hazard analysis needs to be further developed and improved. The main shortcomings of hazard analysis today are difficulties estimating the extent and likelihood of the occurrence of a specific hazard along the production chain and quantifying the effects of control. This creates uncertainty with regard to correctly identifying hazards requiring control and the best means of their control. A substantial improvement of the microbial hazard analysis is to use quantitative microbial risk assessment. This will enable a more precise identification of the process, product and storage criteria ensuring the product safety in accordance with demands from the authorities and from the customers. Aim The objective of the project was to:
• Increase knowledge of quantitative microbial hazard analysis in the Nordic food industries
• Develop computer-based tools to be used in quantitative microbial hazard analysis and
decision-making. .
Networking activities During the project networking activities were performed in order to increase the knowledge of quantitative microbial risk assessment for the food industry in the Nordic countries. Workshops, newsletters, scientific information and a homepage were used for networking.
Workshops The workshops organized within the project are listed in the table 1.
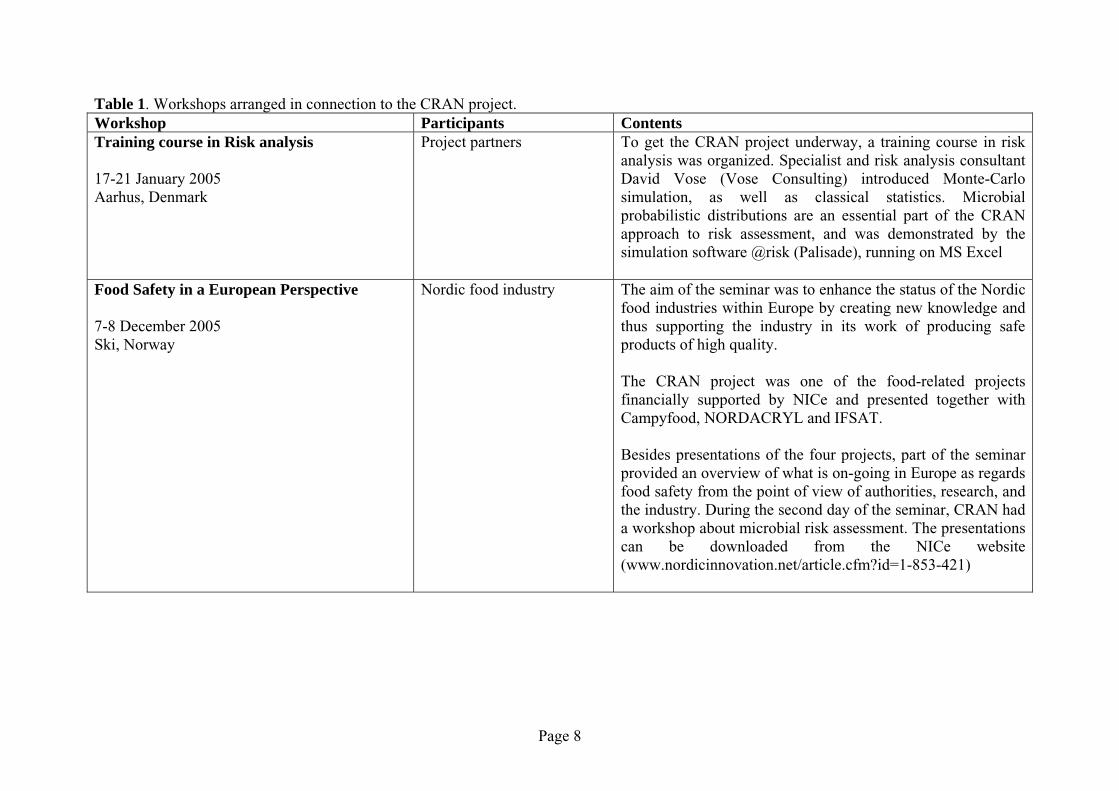
Table 1. Workshops arranged in connection to the CRAN project. Workshop Participants Contents Training course in Risk analysis 17-21 January 2005 Aarhus, Denmark
Project partners To get the CRAN project underway, a training course in risk analysis was organized. Specialist and risk analysis consultant David Vose (Vose Consulting) introduced Monte-Carlo simulation, as well as classical statistics. Microbial probabilistic distributions are an essential part of the CRAN approach to risk assessment, and was demonstrated by the simulation software @risk (Palisade), running on MS Excel
Food Safety in a European Perspective 7-8 December 2005 Ski, Norway
Nordic food industry The aim of the seminar was to enhance the status of the Nordic food industries within Europe by creating new knowledge and thus supporting the industry in its work of producing safe products of high quality. The CRAN project was one of the food-related projects financially supported by NICe and presented together with Campyfood, NORDACRYL and IFSAT. Besides presentations of the four projects, part of the seminar provided an overview of what is on-going in Europe as regards food safety from the point of view of authorities, research, and the industry. During the second day of the seminar, CRAN had a workshop about microbial risk assessment. The presentations can be downloaded from the NICe website (www.nordicinnovation.net/article.cfm?id=1-853-421)
Page 8
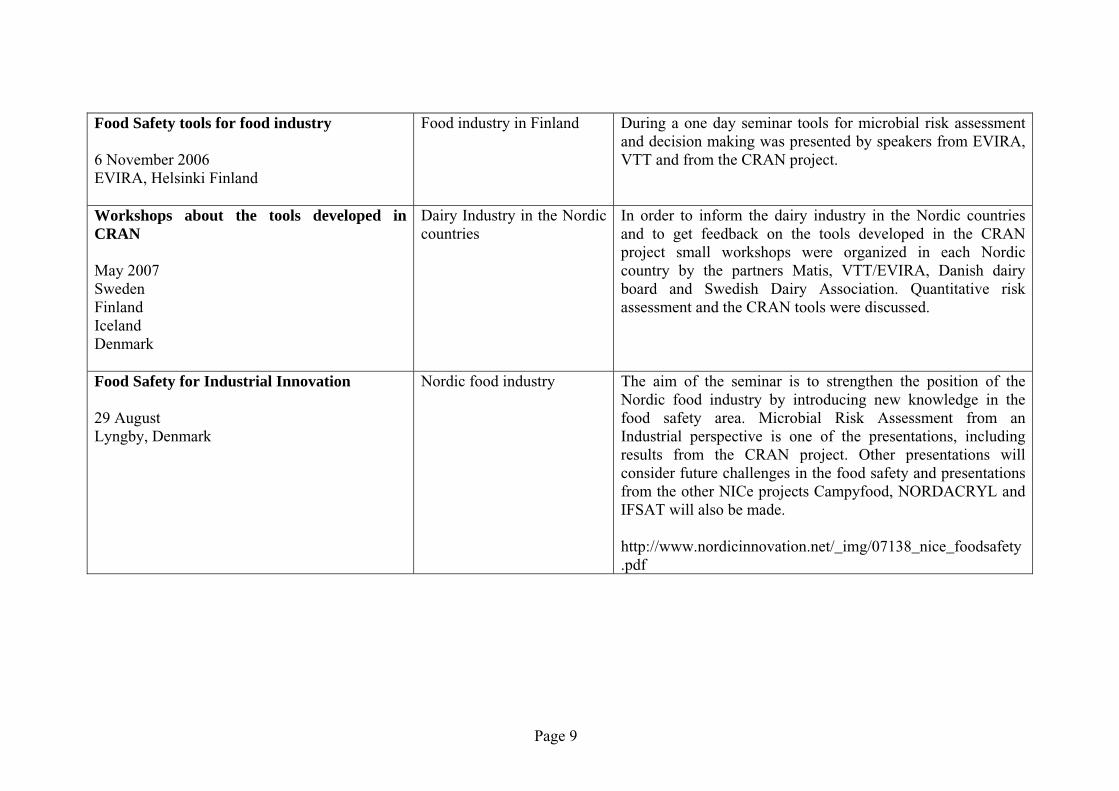
Food Safety tools for food industry 6 November 2006 EVIRA, Helsinki Finland
Food industry in Finland During a one day seminar tools for microbial risk assessment and decision making was presented by speakers from EVIRA, VTT and from the CRAN project.
Workshops about the tools developed in CRAN May 2007 Sweden Finland Iceland Denmark
Dairy Industry in the Nordic countries
In order to inform the dairy industry in the Nordic countries and to get feedback on the tools developed in the CRAN project small workshops were organized in each Nordic country by the partners Matis, VTT/EVIRA, Danish dairy board and Swedish Dairy Association. Quantitative risk assessment and the CRAN tools were discussed.
Food Safety for Industrial Innovation 29 August Lyngby, Denmark
Nordic food industry The aim of the seminar is to strengthen the position of the Nordic food industry by introducing new knowledge in the food safety area. Microbial Risk Assessment from an Industrial perspective is one of the presentations, including results from the CRAN project. Other presentations will consider future challenges in the food safety and presentations from the other NICe projects Campyfood, NORDACRYL and IFSAT will also be made. http://www.nordicinnovation.net/_img/07138_nice_foodsafety.pdf
Page 9
Page 10
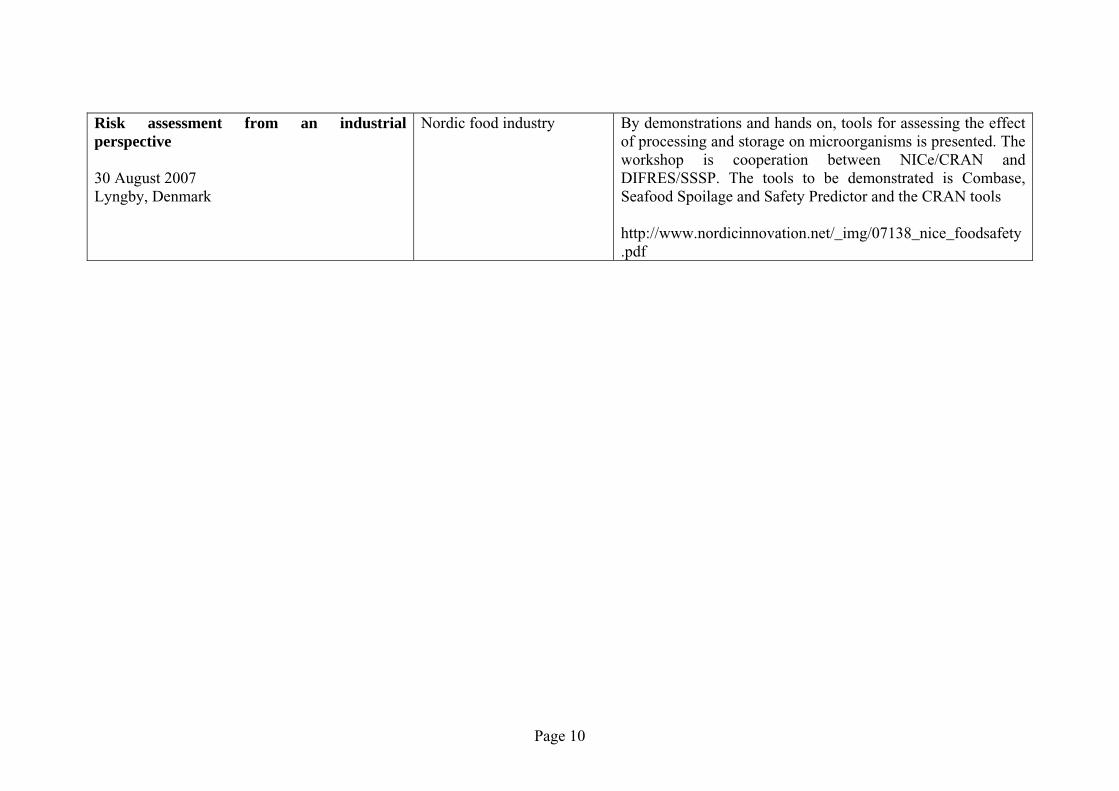
Risk assessment from an industrial perspective 30 August 2007 Lyngby, Denmark
Nordic food industry By demonstrations and hands on, tools for assessing the effect of processing and storage on microorganisms is presented. The workshop is cooperation between NICe/CRAN and DIFRES/SSSP. The tools to be demonstrated is Combase, Seafood Spoilage and Safety Predictor and the CRAN tools http://www.nordicinnovation.net/_img/07138_nice_foodsafety.pdf
Homepage and newsletters Information about the project and the subject of the project has been available on the homepage (http://www.sik.se/cran/). Reports and 2 newsletters can be found on the homepage as well as demonstrations of the tools. This homepage will remain after the project for at least 6 month (31 December 2007).
Presentations on conferences and seminars • Food Safety in a European Perspective, December 2005 in Ski.
o Oral presentations by participants in the CRAN project. • Food safety tools for food industry” for the Finnish food industry was organized at
EVIRA the 6th November 2006. The partners in the CRAN –project participated and the CRAN project was presented during the seminar.
• Food Factory of the Future 3 Symposium 7-9 June 2006 http://www.sik.se/archive/dokument/FFFprog.pdf (Poster)
• Food Micro 2006 http://www.foodmicro2006.org/home.asp (Poster) • IDF 27th International congress and world dairy summit. Shanghai 2006 (Oral
presentation) • Food Safety for Industrial Innovation, August 2007 in Lyngby
(http://www.nordicinnovation.net/article.cfm?id=1-853-538). o Oral presentations by participants in the CRAN project.
Papers and reports
• Møretrø, T. (2006). Matsikkerhet i et europeisk perspektiv. Matindustrien (2) p 29. • Møretrø,, T and Oppegaard, H. 2006 Enterobacter sakazakii i morsmelkersatninger
kan gi alvolige infeksjoner hos spedbarn. Meieriposten nr 1. • Kristensson, A and Svensson, A. 2006 Beslutsmodell för livsmedelsindustrin –hur kan
hänsyn tas till beslutsfattares värderingar? Department of Fire Safety Engineering, Lund University, Report 5199. Diplomawork. (http://130.235.7.155/publikationsdb/docs/5199.pdf)
• An English version of popular science paper on the results is produced (published on the homepage) and will be translated and published in different national popular science papers.
• Manual for the process exposure assessment tool (Only for the project partners)
Other dissemination activities • CRAN information and a link to the CRAN webpage have been included on an
internal (Svensk Mjölk) webpage.
Page 11
• The project was presented in Forskning Special 2005-06-03 Forskning Special is issued twice a month to the dairy companies.
• An information leaflet concerning projects and results from the R&D Department of the Swedish Dairy Association (Svensk Mjölk).
• CRAN information has been included in Technology News, a newsletter from SIK in English, distributed to international member companies.
• Various meetings and a seminar have been used by partners in the project to introduce the CRAN project to a larger audience.
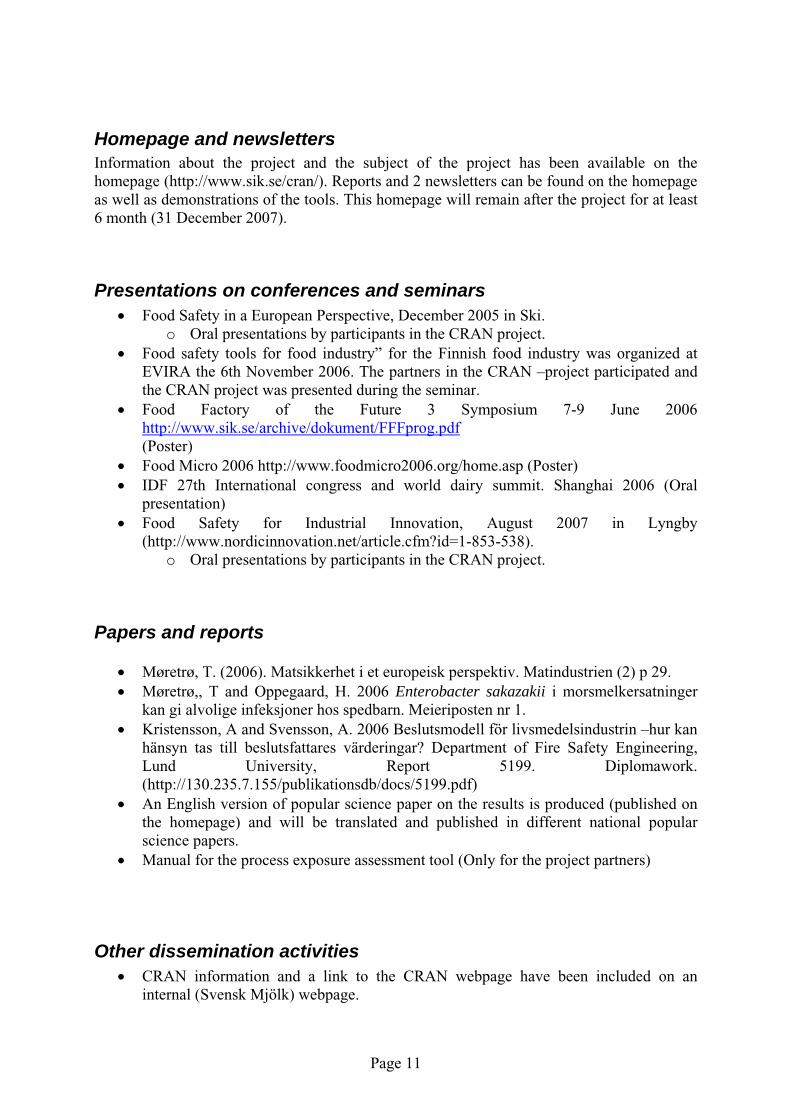
Tools for quantitative microbial assessment along the process chain and decision making The aim of the exposure assessment tools is to facilitate the assessment of the effect of the production line/production chain on the response of microbial hazards in foods. In order to make an assessment substantial information about microbial hazards and about the process and products is needed. Two databases were constructed for this. The first one is for collecting data about microbial hazards needed for the assessment. The second one is for collecting data about processes in a structured way (Figure 1). By using these bases data is collected in one place and is easily accessible. In order to assess how the microbial hazard is affected by the process, a calculation tool was developed. Using this tool, the bacterial number is calculated and simulated along the process chain as a function of process parameters and product parameters (Figure 1). The change in bacterial number is calculated for each process step, for example heat treatment or storage. The bacterial number along the production chain is calculated taking into account the bacterial change in each step. The process and product parameters can be described by the user as distribution functions demonstrating the variability in the process and product. The variability in the bacterial number is simulated using the Monte Carlo simulation technique.
Page 12
Figure 1. Schematic description of the microbial exposure assessment tool.
CRAN data base
Aim The aim of the database tool is to collect data needed for the microbial assessment of the effect the production line/production chain has on the fate of microbial hazards in foods.
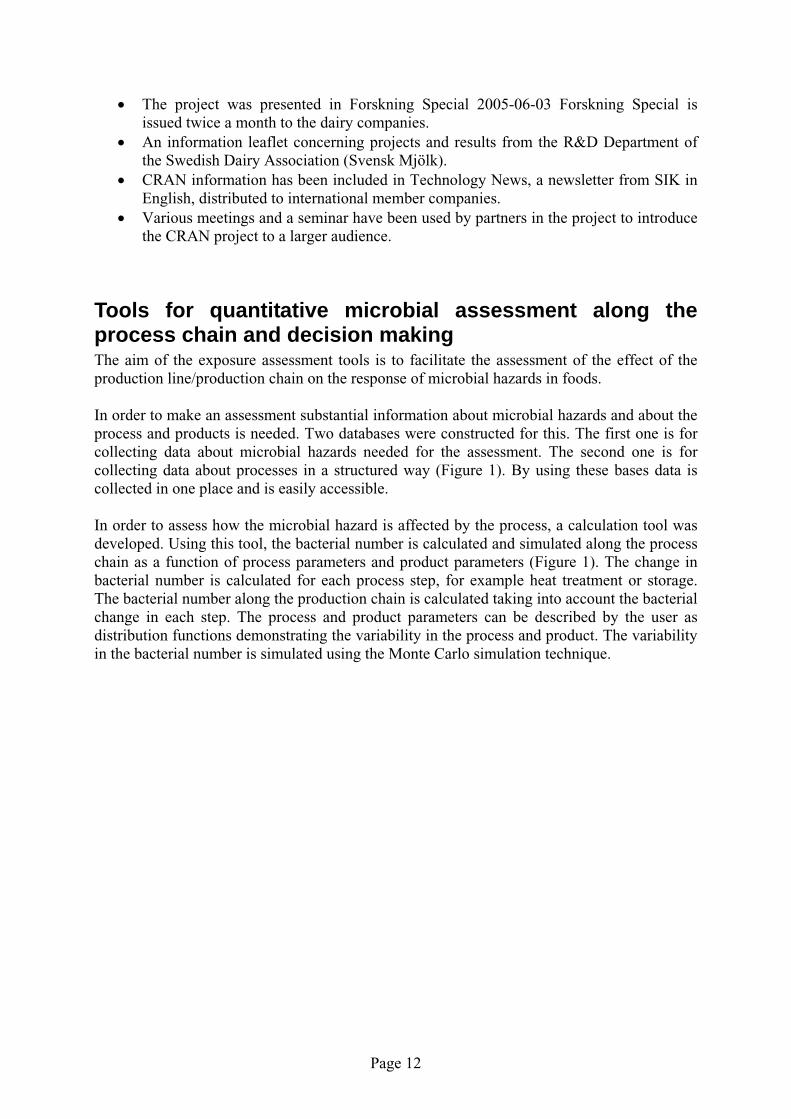
Principle Two databases were constructed. One for collecting data about microbial hazards needed for the assessment and one for collecting data about products/processes. The frame of the database tool was developed by SIK. The database for microbial hazards is divided into three levels shown in figure 2. The fist level is the type of bacteria. This tool is prepared for the bacteria Bacillus cereus, Listeria monocytogenes and Enterobacter sakazakii. The second level is the type of bacterial activity. Information is available for:
• Bacterial growth data • Bacterial growth models
Page 13
• Bacterial reduction data (survival/death) • Bacterial reduction model (survival/death) • Bacterial contamination • Bacteria in raw material (prevalence)
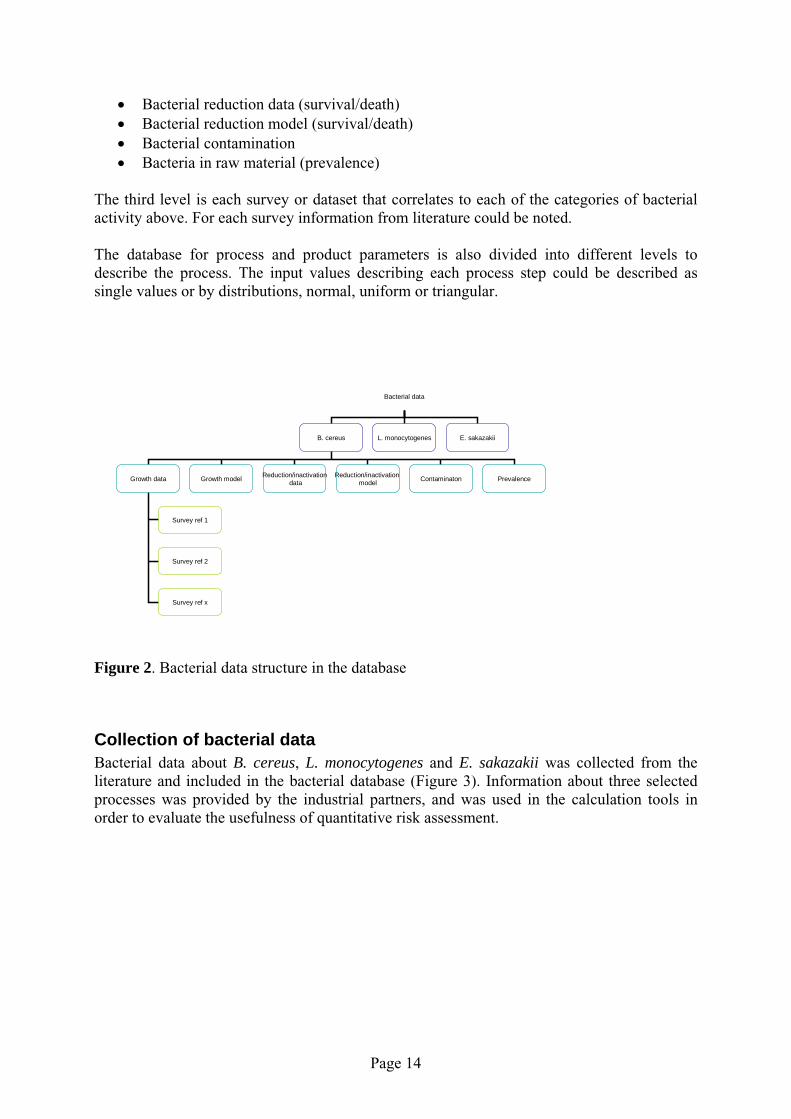
The third level is each survey or dataset that correlates to each of the categories of bacterial activity above. For each survey information from literature could be noted. The database for process and product parameters is also divided into different levels to describe the process. The input values describing each process step could be described as single values or by distributions, normal, uniform or triangular.
Bacterial data
B. cereus L. monocytogenes E. sakazakii
Growth data Growth model Reduction/inactivationdata
Reduction/inactivationmodel Contaminaton Prevalence
Survey ref 1
Survey ref 2
Survey ref x
Figure 2. Bacterial data structure in the database
Collection of bacterial data Bacterial data about B. cereus, L. monocytogenes and E. sakazakii was collected from the literature and included in the bacterial database (Figure 3). Information about three selected processes was provided by the industrial partners, and was used in the calculation tools in order to evaluate the usefulness of quantitative risk assessment.
Page 14
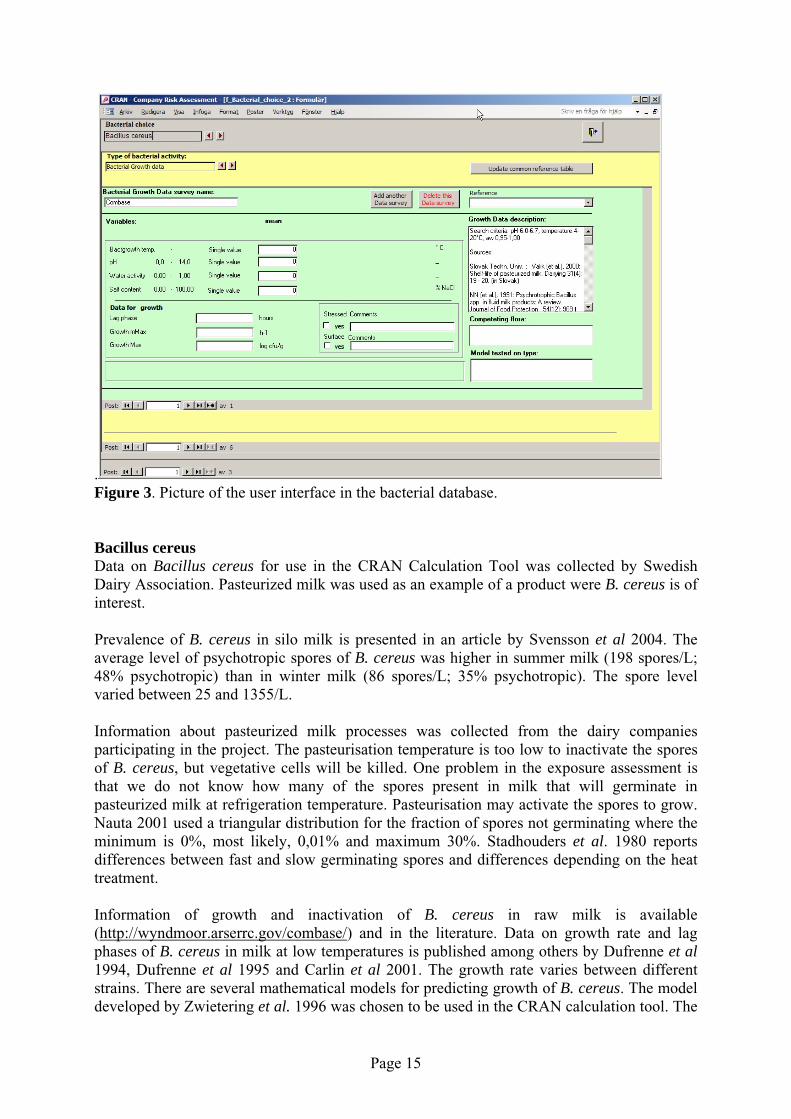
. Figure 3. Picture of the user interface in the bacterial database. Bacillus cereus Data on Bacillus cereus for use in the CRAN Calculation Tool was collected by Swedish Dairy Association. Pasteurized milk was used as an example of a product were B. cereus is of interest. Prevalence of B. cereus in silo milk is presented in an article by Svensson et al 2004. The average level of psychotropic spores of B. cereus was higher in summer milk (198 spores/L; 48% psychotropic) than in winter milk (86 spores/L; 35% psychotropic). The spore level varied between 25 and 1355/L. Information about pasteurized milk processes was collected from the dairy companies participating in the project. The pasteurisation temperature is too low to inactivate the spores of B. cereus, but vegetative cells will be killed. One problem in the exposure assessment is that we do not know how many of the spores present in milk that will germinate in pasteurized milk at refrigeration temperature. Pasteurisation may activate the spores to grow. Nauta 2001 used a triangular distribution for the fraction of spores not germinating where the minimum is 0%, most likely, 0,01% and maximum 30%. Stadhouders et al. 1980 reports differences between fast and slow germinating spores and differences depending on the heat treatment. Information of growth and inactivation of B. cereus in raw milk is available (http://wyndmoor.arserrc.gov/combase/) and in the literature. Data on growth rate and lag phases of B. cereus in milk at low temperatures is published among others by Dufrenne et al 1994, Dufrenne et al 1995 and Carlin et al 2001. The growth rate varies between different strains. There are several mathematical models for predicting growth of B. cereus. The model developed by Zwietering et al. 1996 was chosen to be used in the CRAN calculation tool. The
Page 15
predicted growth rates are in agreement with measured growth in milk (personal communication (Christiansson). Modelling the lag phase is difficult and was not included in Zwietering’s model. However, a lag phase is included in the CRAN model. The heat resistance of B. cereus spores varies between different strains. Psychrothropic strains are less heat resistant than mesophilic strains. Dufrenne 1994 reported D-values at 90ºC between 4.6 minutes and 165 minutes, 17 of 31 studied strains had a D
90 value less than 10
minutes. There have been several studies concerning B. cereus in pasteurised milk using predictive microbiology. Zwietering et al 1996 used predictive models to estimate the bacterial number at the point of consumption. Nothermans et al. 1997 has performed a risk assessment of B. cereus in pasteurised milk. There is a lack of information on dose response data for B. cereus, however a number of 105 B. cereus (toxigenic)/ml could be considered hazardous in milk (Notermans et al 1997). The number of B. cereus in pasteurised milk stored at 7+/- 0,5°C has been reported by Larsen
and Jørgensen 1997. The bacterial level varied between 1 and 106
bacteria/ml, the probability
of bacterial level between 101 and 10
4 was 77%.
Listeria monocytogenes Data on Listeria monocytogenes was collected by VTT, EVIRA and IFL. Camembert-type soft cheese made from pasteurized milk was studied. Information on prevalence of L. monocytogenes in raw milk was collected by IFL and information on data about cheese processes (e.g. flowcharts), growth and inactivation (D- and z-values) of L. monocytogenes and predictive models by EVIRA and VTT. For L. monocytogenes in soft cheeses, only very little data on predictive growth models are available (Bemrah et al., 1998; USDA/FSIS, 2003.; Sanaa et al., 2004). Best suitable growth model found for soft cheese is published by Sanaa et al. (2004), who used a modified logistic model. This model has been used in the calculation tool. Information about cheese processes was collected by the dairy companies participating in the project. Information on flow-chart, times, temperatures, pH and aw values of product in different process steps were collected. As the cheese is made from pasteurized milk, the contamination and growth of L. monocytogenes after pasteurization step of milk before the cheese is in package is most critical, especially in the ripening step of cheese (Canillac and Mourney, 1993; Gravani, 1999). The concentration of L. monocytogenes differs in different parts of the cheese (rind, core). However, the portion the consumer eats consists of both. This is recognized also by Sanaa et al. (2004). The prevalence (approx. 0-3.5%) and concentration (approx. <1 cfu/g) of L. monocytogenes in raw material, raw milk, are usually low (e.g. McLauchlin and Gilbert, 1990; Roy, 1992; Kozak et al, 1996; Gravani 1999; Frye and Donnelly, 2005), however exceptions may occur (e.g. Fernandez-Garayzabal et al, 1986). Information of growth and inactivation of L. monocytogenes in raw milk is available (http://wyndmoor.arserrc.gov/combase/). According to ICMSF (1996) D-values from 0.5 – 7.2 s have been reported for L. monocytogenes in raw milk (measured at 68.9 - 71.7°C). Several z-values of slightly over 6°C for raw milk can be found but also values over 7°C may occur (http://wyndmoor.arserrc.gov/combase/). The results vary depending on pH and fat content of milk and strain. For skimmed milk a z-value of 6.5°C (EFSA, 2006), and for sterile whole
Page 16
milk a z-value of 8°C during HTST pasteurization has been reported (Hudson et al., 2003). Casadei et al. (1998) measured z- values in TSB-broth, pasteurized half cream, UHT-treated double cream and butter for two strains. For the strain Scott A the z-values (°C) were 7.3, 6.2, 6.1 and 6.7, respectively. The level of L. monocytogenes in ready to eat food should not exceed 100 bacteria/g in the product when consumed according to microbiological criteria by the EU commission (EG no 2073/2005). Enterobacter sakazakii Data the behaviour of Enterobacter sakazakii in dry milk and infant formula for use in the CRAN Calculation Tool was collected by Danish dairy board
The preparation and handling of the reconstituted infant formula is important in order to minimize the growth possibilities of surviving E. sakazakii from the production of infant formula powder and from E. sakazakii that contaminates the product during preparation.
The growth rate of E. sakazakii has been modelled by Iversen et al 2004 . During storage of powder a bacterial reduction occurs (derived from WHO, 2004)
The heat resistance of E. sakazakii in different media has been studied and publisced in the literature (Nazarowec-White Farber, 1997; Breeuwer et al 2003; Edelson-MammelBuchanan 2004; Iversen et al 2004). There is a variation in strains from different origin. D-value at 58° is around 0.5-10 minutes for the most heat resistant strains (isolated from hospital settings).
Time did not allow for the use the data provided in a recently published new risk assessment for E. sakazakii in powdered infant formula, for example from WHO (WHO, 2006) .
Enterobacter sakazakii is an opportunistic bacterium which can cause illness in infants, especially those <28 days and with low birth weights (<2500g). The number of cases worldwide is extremely low, however the mortality rate is high, 20-50%. The infection dose is not known. The virulence varies from strain to strain.
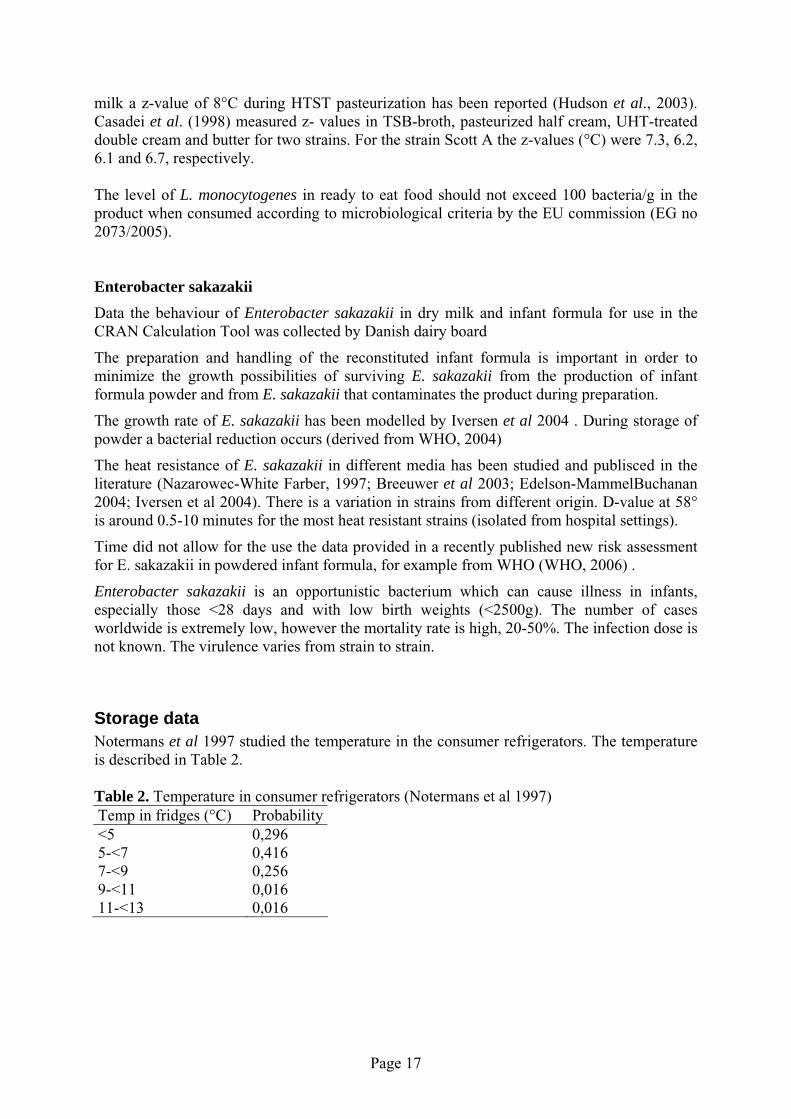
Storage data Notermans et al 1997 studied the temperature in the consumer refrigerators. The temperature is described in Table 2. Table 2. Temperature in consumer refrigerators (Notermans et al 1997) Temp in fridges (°C) Probability <5 0,296 5-<7 0,416 7-<9 0,256 9-<11 0,016 11-<13 0,016
Page 17
CRAN calculation tool for calculation of bacterial number along a process chain
Aim The aim of the CRAN calculation tool is to assess in a quantitative way how the process parameters and their variations influence the bacterial number along the production chain and in the end product.
Principle In order to assess how the microbial hazard is affected by the process, a calculation tool was developed where the bacterial numbers are calculated along the process chain. Calculation is performed along the process chain as a function of process parameters and product parameters. The change in bacterial number is calculated for each process step, for example heat treatment or storage. Furthermore, the accumulated effect along the production chain is calculated by taking into account the bacterial change in each step and adds this to the previous steps. The process and product parameters can be described as distribution functions showing the variability in the process and product parameters. The variability in the bacterial numbers are simulated using Monte Carlo simulation technique. The tool has been developed by SIK with input on the functionalities from the partners in the CRAN project. For making it easy to handle input data when describing a scenario and also to evaluate calculated results, MS Excel was used. MS Excel is the visible part of the calculation tool. The mathematical calculation is performed by a package of hidden Matlab files. This is done by a set of Matlab compiled mathematical models developed for this application but based on well known described models from the literature (Described in the manual). This technique is used since Matlab provides a fast mathematical solution, together with Monte Carlo solutions. The bacterial number is calculated along the production chain by calculating the accumulated effect of the process on the bacteria. The bacterial number in the raw material is used as an input value in the first step. Depending on the process there is an increase of bacteria due to growth, contamination or dilution, or a reduction due to inactivation or concentration. The resulting bacterial number after a certain step, is the bacterial number entering the step adjusted with an increase or decrease in bacterial number during the step. This adjustment of the bacterial number is repeated along the whole process chain according to Figure 4.
Page 18
Process 1
Process 2
Process 3
Process 4
N0
N1=N0+ΔP1
N2=N1+ΔP2
N3=N2+ΔP3
N4=N3+ΔP4
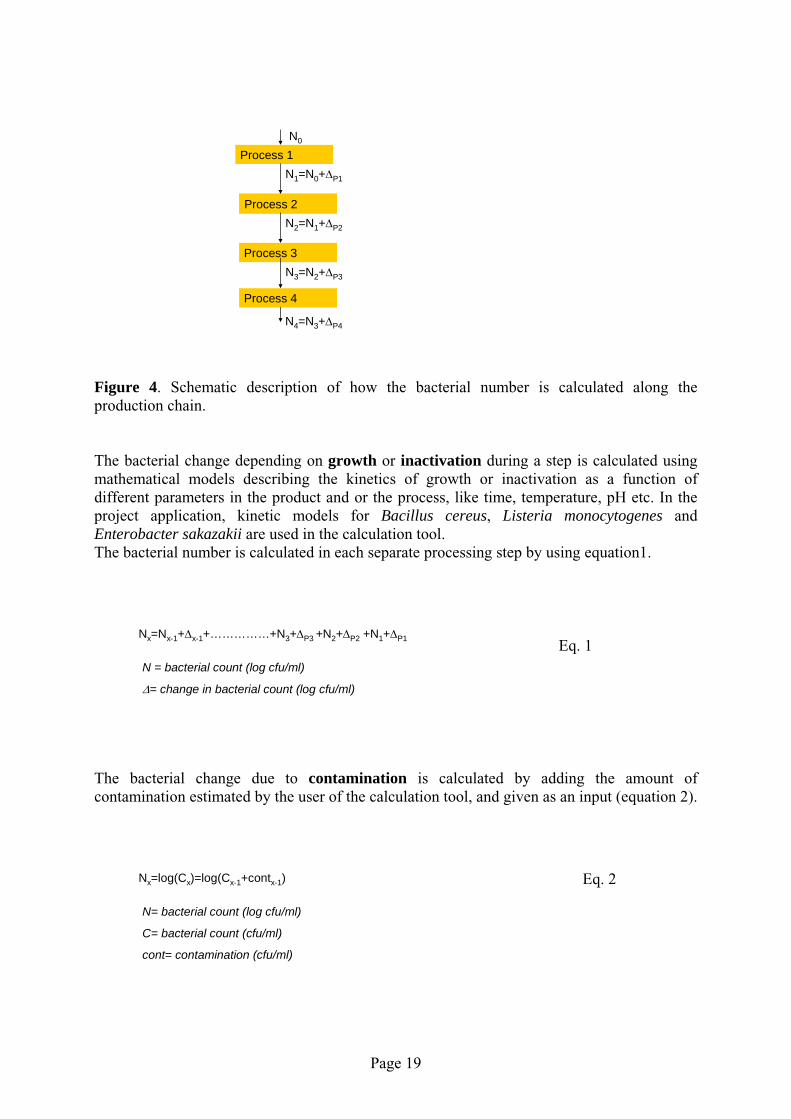
Figure 4. Schematic description of how the bacterial number is calculated along the production chain. The bacterial change depending on growth or inactivation during a step is calculated using mathematical models describing the kinetics of growth or inactivation as a function of different parameters in the product and or the process, like time, temperature, pH etc. In the project application, kinetic models for Bacillus cereus, Listeria monocytogenes and Enterobacter sakazakii are used in the calculation tool. The bacterial number is calculated in each separate processing step by using equation1.
Nx=Nx-1+Δx-1+……………+N3+ΔP3 +N2+ΔP2 +N1+ΔP1
N = bacterial count (log cfu/ml)
Δ= change in bacterial count (log cfu/ml)
Eq. 1
The bacterial change due to contamination is calculated by adding the amount of contamination estimated by the user of the calculation tool, and given as an input (equation 2).
Nx=log(Cx)=log(Cx-1+contx-1)
N= bacterial count (log cfu/ml)
C= bacterial count (cfu/ml)
cont= contamination (cfu/ml)
Eq. 2
Page 19
The bacterial change due to dilution and concentration is calculated by multiplying the bacterial count into the step with a concentration/dilution factor. By using Mote Carlo simulation technique the probability of a bacterial number is calculated by calculating the whole scenario repeated times (>100). When partitioning occurs in the process, the number of contaminated packages is simulated and after the partitioning, the number of bacteria in the contaminated packages is calculated.
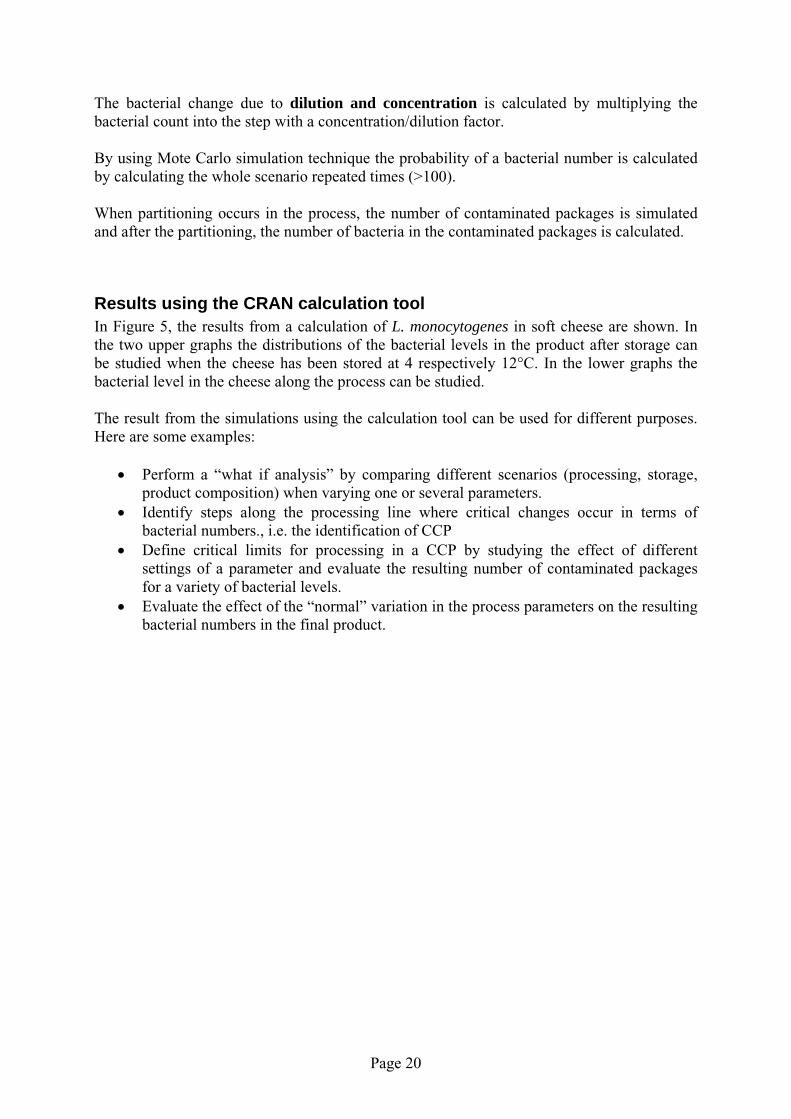
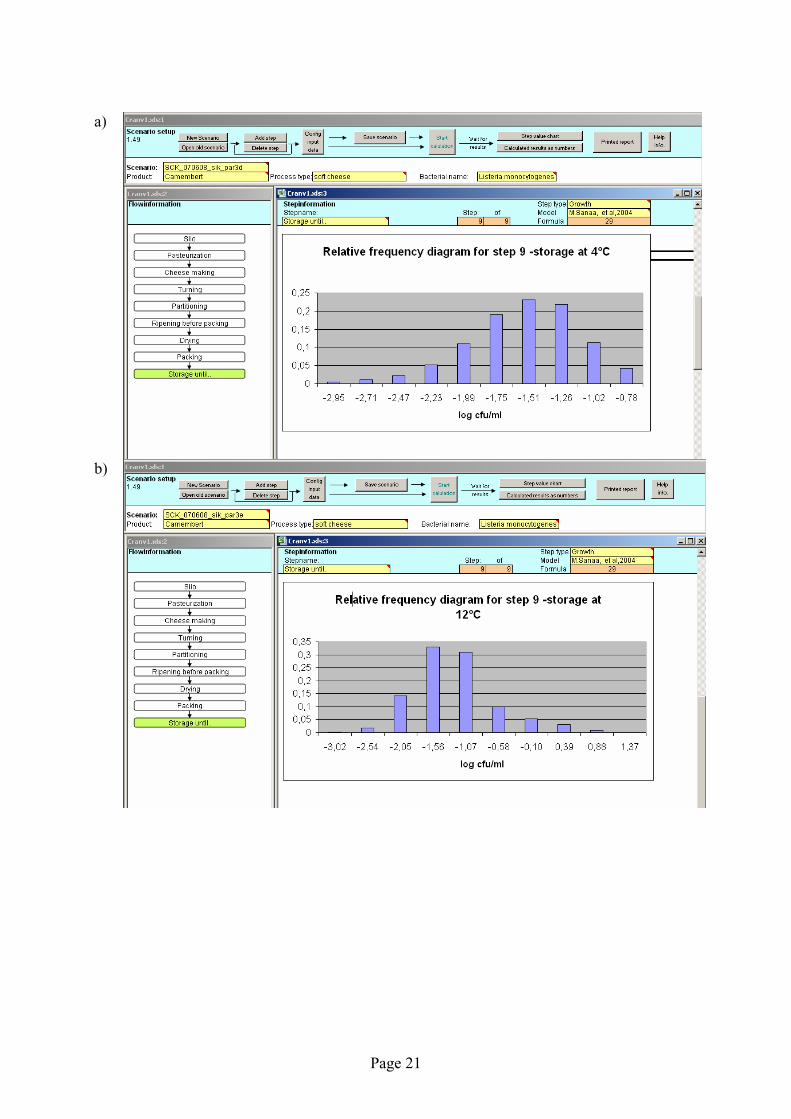
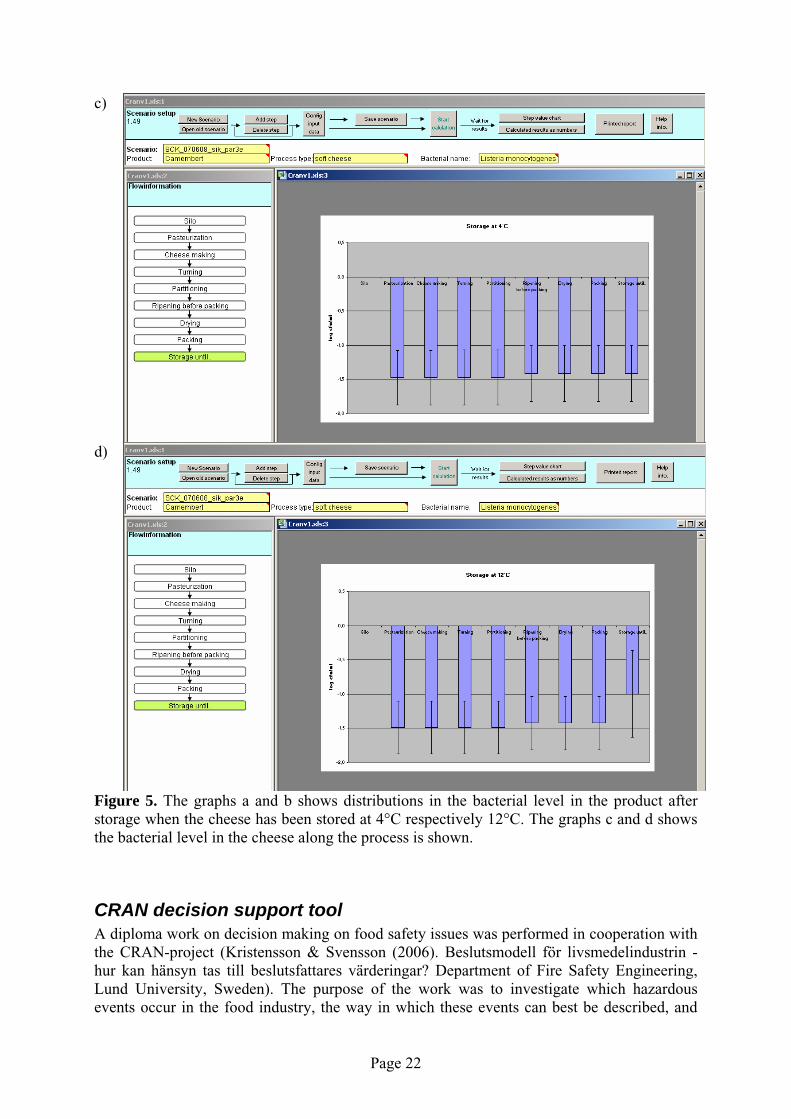
Results using the CRAN calculation tool In Figure 5, the results from a calculation of L. monocytogenes in soft cheese are shown. In the two upper graphs the distributions of the bacterial levels in the product after storage can be studied when the cheese has been stored at 4 respectively 12°C. In the lower graphs the bacterial level in the cheese along the process can be studied. The result from the simulations using the calculation tool can be used for different purposes. Here are some examples:
• Perform a “what if analysis” by comparing different scenarios (processing, storage, product composition) when varying one or several parameters.
• Identify steps along the processing line where critical changes occur in terms of bacterial numbers., i.e. the identification of CCP
• Define critical limits for processing in a CCP by studying the effect of different settings of a parameter and evaluate the resulting number of contaminated packages for a variety of bacterial levels.
• Evaluate the effect of the “normal” variation in the process parameters on the resulting bacterial numbers in the final product.
Page 20
a)
b)
Page 21
c)
d)
Figure 5. The graphs a and b shows distributions in the bacterial level in the product after storage when the cheese has been stored at 4°C respectively 12°C. The graphs c and d shows the bacterial level in the cheese along the process is shown.
CRAN decision support tool A diploma work on decision making on food safety issues was performed in cooperation with the CRAN-project (Kristensson & Svensson (2006). Beslutsmodell för livsmedelindustrin - hur kan hänsyn tas till beslutsfattares värderingar? Department of Fire Safety Engineering, Lund University, Sweden). The purpose of the work was to investigate which hazardous events occur in the food industry, the way in which these events can best be described, and
Page 22
how the food industry assesses negative events caused by the presence of pathogenic bacteria in the products. The work also presents an example of how a food company can consider the value of risk in its day-to-day work. Following a review of the events occurring, three attributes were chosen which best described the consequences of a hazardous event in the food industry. The attributes were death, illness, and direct cost. An empirical investigation was carried out in order to measure how ‘decision-makers’ values risk. The quantitative part of the investigation used two methods and the results showed that death was the most important attribute, followed by illness and direct cost. The qualitative part of the investigation showed the importance of consumer confidence and a strong brand. Finally, an example decision-making model was presented using the chosen attributes, the decision-makers’ value of risk, and the concepts of risk management. The diploma work is available on the CRAN homepage.
Aim The goal was to develop a tool for making informed decisions about the control of microbial hazards, for helping the industry to better plan and identify cost effective actions. The methodology developed is in principle generic and could be used by any type of industry. Processes in the dairy industry and bacteria relevant for those processes were selected as a case example. Matforsk was responsible for development of a decision tool, with the assistance of SIK, VTT and EVIRA .The final version of the tool was developed based on the comments from the industry.
Principle Microsoft Power Point was selected as the platform for the tool, being available to most industry. By working in Power Point the use of internal and external hyperlinks is possible, resulting in a more dynamic tool. During the work it was realised that developing a quantitative decision tool was too ambitious based on the resources available. Also, a quantitative tool would have to focus on a very small number of possible actions. Based on this we chose to develop a more generic tool where the goal is to guide the industry through decision processes and make information useful in the decision process available for the industry. The tool developed is divided into two parts, an Encyclopedia and a Decision flowchart. The tool is focusing on the three pathogenic bacteria Listeria monocytogenes, Bacillus cereus and Enterobacter sakazakii. The Encyclopedia provides background information through fact sheets and external links about legislation, HACCP, product- and process characterisation and pathogenic bacteria. This information is useful for the food industry when performing HACCP and in the decision process. By working through the decision flowchart, the user will be assisted in selecting the microbial hazards relevant for the user’s product/process. The tool will help in evaluating bacterial
Page 23
levels (e.g. from the CRAN calculation tool) against limits set in legislation. The tool will also suggest possible control measures of microbial hazards, and point out important issues to consider in the evaluations of possible actions. The decision support tool is mainly focusing on the three selected pathogens (Listeria monocytogenes, Bacillus cereus and Enterobacter sakazakii), however, information about other pathogenic microorganisms could be included, resulting in a broader tool. The developed tool will be available through the CRAN homepage for 6 months (until 31 December 2007) after the end of the CRAN project.
Thoughts from the dairy industry about tools for microbial assessment and decision making of food processes In Denmark, Finland, Iceland and Sweden workshops where organized were the tools developed in the CRAN project were presented for the dairy industry. The aim of the workshops was to get an evaluation of the usefulness of the tools for the industry. The overall thoughts were that it is a good idea to use tools for more quantitative microbial assessments and for having easy access to relevant information. In particular, the tools were expected to be useful during product development. However, the tools need to be adopted for the specific issue, process/product that they are intended to be used for. Below are the more detailed thoughts from the different workshops.
Denmark The workshop was organized by Danish Dairy Board and the participants were participants from the dairy industry.
This type of tool visualizes and demystifies to some extent the concept of probabilistic predictive microbiology in which way it encourages further developments in the direction of quantitative HACCP
The calculation tool The calculation tool could be useful, especially for training. The tool needs more user manuals and pop up failure messages in order to minimize an incorrect use of the models. In order to be more useful needs to be more transparency regarding the models used. The tool should be more flexible so that more products could be studied and it should be possible to ad more models (Comment: the tool are prepared for this but for showing the concept three types of processes/products where chosen). Additional points/sectors, that could be considered to ad to the the Calculation Tool is: 1) better models estimating probability and level of contamination from various sources (now the tool is based only on users own estimates), e.g. water & other ingredients, biofilm, aerosoles, etc. 2) additional pathogens: other Bacillus genus, Clostridium perfringens , Enterobacteria cloaceae, VTEC, Staphylococcus aureus, Yesinia enterocolitica, 3) additional processes, e.g microfiltration, cheese ripening, 4) impact of analytical testing (e.g. how much
Page 24
product would be non-accepted by testing a batch according to a certain microbiological criteria (class 2 and 3 criteria) and 5) options for choosing alternate distribution models (Weibull, Poisson, etc.). The decision tool The decision tool may be useful as backup/decision in process safety for organizing external information and links. It is easy to use. However it needs to be adapted for specific target groups. Information needed in the decision tool is: any type of information that can support hazard analysis decisions, e.g. guidance on how to judge what is unacceptable/acceptable levels (e.g. Minimal infectious doses, etc), Performances of analytical methods and D- and z-values for various substrates.
Finland The workshop was organized by VTT and EVIRA and the participants beside research scientists from VTT and EVIRA came from production plants and R&D units in the dairy industry. Basically good, if this type of information is widely found in one location. Good idea, but much too limited use as such. Can actually with help of predictive model the real situations be modelled (what cannot be seen in everyday work)? The participants at the workshop could not directly find the calculation tool and the results from it useful as it is now. The type of products that has been exemplified is too limited. However it could be useful for assessing the amount of bacteria in a process, in predicting and planning process safety and in changes of the process; testing how critical different parameters are (e.g. temperatures and storage times) The tool should be more user-friendly and clear. It is difficult to count long time periods as minutes. The scale could be different for small values (normal instead of LOG:s). Microbiological values (e.g. D-values and aw) should be readily available. The background data should be large and easily described and choosing of correct alternative easy. The bacterial database should be connected to Calculation Tool. More products should be available. In pasteurized milk B. cereus is not the most important factor limiting the shelf-life: total bacterial number and taste are important. Just pasteurized milk and B. cereus is a limited segment of the whole product assortment and factors limiting shelf-life. This questions the benefit when compared to time which must be used for producing the prediction with the Tool. The tool seems to be for ”advanced” user, good knowledge of microbiological background needed; “Critical limits” of process should be possible to insert into the program and could be seen in result diagrams and compared to results. Decision tool The Decision Tool could be useful for good basic information if the purpose of the tool is encyclopedia mainly. If useful the links to information has to be updated regularly. Finnish language needed if the tool is meant for wider use (in production plants). The tool should be
Page 25
more guiding: support actively decision making. Now the term “Decision tool” does not describe well the tool; however, as information source could be useful. Bacterial database The bacterial database should be large to be useful for various processes and products; e.g. cottage cheese, curd cheese, home-made cheese ; information on more microbes needed (e.g. coliforms, B. cereus in cheeses, S. aureus, Pseudomonas, Enterobactericeae, E.coli, Salmonella), more information of variation between strains (e.g. in tolerance for different temperatures); more variation in database (e.g. various strains); variation of processes and bacteria with regard to changes in seasons, temperatures, strains (e.g. D-values, minimum growth temperatures etc.), process times; most important information on pathogens in dried whey- and milk based products needed; information on different filtration processes in dairies needed.
Iceland The workshop was organized by MATIS and the participants were from the Icelandic Milk Industry. The calculation tool The model seems to be rather patent and not very complicated to work with. It seems to be built up in a way so not much computer competence is needed to use it. If the help information will be made more detailed and guidelines how to get started added it will be rather user friendly. It can surely give some clues about the frequency of sampling. The program is worth spending some time and money on because it seems that the program can be helpful when inspecting the process line. More types of bacteria should be added to the program. E.g. the milk industry in Iceland has been looking at total count and Salmonella. They have done sampling for many years and a lot of data exists. Data like that could be used to see if it is possible to cut down the amount of samples that have been taken over a long period. It would be better in Iceland to have the program in Scandinavian language because the milk industry knows the technical words better in Scandinavian than English. The decision tool It is easy to use and the results from it can be useful in the production. Especially if it could focus on more bacteria in the future. The user is guided well through it and it is easy to find the information needed. These two tools combined together can be helpful when developing new production line. It can also be helpful to see what can happen in each step of the production line when conditions change.
Sweden The workshop where organized by Swedish Dairy Association and the participants where people from three different dairy industries:
Page 26
The participants all had a background in quality and HACCP and to some extent microbiology. The most relevant of the three CRAN microorganisms was B. cereus in pasteurized milk, which was used as extensively in the evaluation in order to relate to the background knowledge of the participants. The aims and purpose of the CRAN project was presented and a general introduction to risk assessment and microbial growth was given. The principles of predictive modelling were introduced and tools available on the Internet (PMP and Combase) were presented and tested. Several of the participants already had some experience with these tools. After an introduction to Monte Carlo simulation and @Risk the CRAN tools were demonstrated. There was a genuine interest for predictive microbiology and quantitative simulations. The participants realised their usefulness in product development and in HACCP. They supported the basic idea of the CRAN calculation tool, i.e. to simulate the effect of process conditions and bacterial properties. However, they found the tool not so useful in its present form. The need for simulation is largest when introducing new process conditions and ingredients in product development. Under such conditions the tool is not sufficiently flexible and the companies did not want to share their knowledge with other companies in commercially available software. The output format of each process step is awkward. The process database was of no interest to the companies – they already know their processes, see also comment above. The bacterial database was more interesting, but was found to be incomplete in its present form. The companies would not be able to create completely new scenarios without further guidance. The conditions and limits for use of the equations underlying the calculations are not presented. The decision tool and the use in conjunction with the encyclopedia part were found to be interesting sources of information. One participant had experience with the Decision Tools suite and did not consider it useful. In summary the participants supported the need for quantitative calculations in HACCP and the idea of a simple simulation tool, but it needs more flexibility then the CRAN calculation tool. For some applications they considered PMP or Combase sufficient, particularly with respect to the clear presentation of results and in education. For new processes a tool could be useful. The participants stressed the need of further education in the field of quantitative simulation and the use predictive models. There is clearly a need for easily accessible databases on bacterial properties. Some companies mentioned the lack of time to access international publications. In order be able to apply quantitative HACCP companies will need further education and help from experts in the field.
Future needs In general more knowledge about quantitative microbial assessments and predictive microbiology is needed in the food industry. The dairy industries involved in discussions within this project are positive with regard to the future perspectives in using quantitative approaches in assessments of microbial hazard exposure during and after manufacturing.
Page 27
However, in order to be further implemented, more education and training in this area is needed for the industry. In order to be operational, predictive microbiology must be presented in a way that enables a quick and easy way of evaluating microbial response. The tools developed show that this is possible. As predictive microbiology provides further insight in the levels and distributions of microbial hazards, it will eventually result in replacing a lot of sampling and microbial analyses with computer modelling. Modelling tools to be used by the industry needs to be very easy to use and understand. However, a certain level of knowledge about microbiology and statistics is required to enable the user to understand the limitations of a tool and to ensure critical application of the results, e.g. to judge if they are realistic. It is important that the user is aware that predictive modelling can never stand alone but is very useful in combination with other approaches. Flexibility of the simulation tool is important, especially when working with product and process development. A clear and easy framework with sufficient amount of flexibility with regard to choice of models to predict growth, reduction etc of different microorganisms is desired. On the other hand, such tools have to be balanced between not being too complicated and still be sufficiently flexible in their scope. It is important that limitations of the tool/models can be shown in the user interface in order to minimize incorrect use of the models, and the generation of misleading results. Limitations of a model could, for instance, be that the model is only valid for a certain type of food, or for certain levels of parameters. In the literature and in software accessible on the internet, a number of models exists that describe growth and survival kinetics. These are most often too general and do not include all important parameters relevant for a specific food product. To enable the food industry to utilize the full benefits of quantitative hazard analysis, it is necessary that quantitative safe targets for the content of individual microbial hazards are defined. The concept of Food Safety Objectives (FSO), as developed by Codex Alimentarius, will eventually provide such targets. This concept of quantitative food safety targets is still developing, and only a limited number of FSO-like targets have be defined. When working with quantitative assessments it is important to be able to judge whether a certain level in a food product is safe or not. Otherwise, the simulations and calculations may only be used for comparison of different scenarios, like contamination levels, process methods, storage conditions and product properties. The tools developed within this project are only to be regarded conceptionally, as they demonstrate how computer-based tools for quantitative microbial assessments can be constructed. They are not sufficiently developed to be used for quantitative microbial hazard analysis in their present state of development. They may be used to show the food industry how quantitative microbial assessment along the production chain can be conducted and they can encourage initiatives aimed at further developing them. The quantitative approach to microbial hazard analysis needs to be more widely known and accepted within the food industry. The concept tools developed in this project may lead to a broader understanding of the usefulness and benefits of quantitative microbial hazard analysis. To meet the needs of specific industries, the simulation tool will have to be further developed into a more comprehensive and flexible simulation tool for exposure assessment along the
Page 28
production lines. The tool for decision making needs to be adapted to the needs of the specific user groups.
References Breeuwer, Lardau, Peterz and Joosten 2003, Dessication and heat tolerance of Enterobacter sakazakii, J. Applied Microbiology 2003, 95, 967-973
Canillac and Mournej, 1993, Sources of contamination by Listeria during the making of semi-soft surface ripened cheese. Sciences des aliments 13, 533-544 Carlin, Girardin, Peck, Stringer, Barker, Martinez, Fernandez, Fernandez, Waites, Movahedi, Leusden, Nauta, Moezelaar, Torre and Litman, 2000 Research on factors allowing a risk assessment of spore-forming pathogenic bacteria in cooked chilled foods containing vegetables: a FAIR collaborative project. 60(2/3): 117-135 Casadei, Esteves de Matos, Harrison and Gaze, 1998, Heat resistance of Listeria monocytogenes in dairy products as affected by the growth medium. Journal-of-Applied-Microbiology. 1998; 84(2): 234-239. Dufrenne, Bijward, Te Giffel, Beumer and Notermans 1995, Characteristics of some psychrotrophic Bacillus cereus isolates, Int. J. Food Microbiol. 27, 175-183 Dufrenne, Soentoro, Tatini, Day and Notermans 1994, Characteristics of Bacillus cereus related to safe food production, Int. J. Food Microbiol. 23, 99-109 Edelson-Mammel and Buchanan 2004, Thermal inactivation of Enterobacter sakazakii in Rehydrated Infant Formula, J. Food Protection, vol 67, no. 1, 60-63 Fernandez-Garayzabal, Dominguez, Pascual, and Collins, 1995 Phenotypic and phylogenetic characterization of some unknown coryneform bacteria isolated from bovine blood and milk: description of Sanguibacter gen.nov. Letters-in-Applied-Microbiology. 1995; 20(2): 69-75 Frye and Donnelly, 2005 Comprehensive survey of pasteurized fluid milk produced in the United States reveals a low prevalence of Listeria monocytogenes. Journal-of-Food-Protection.; 68(5): 973-979 Garvani, R. 1999. Incidence and control of Listeria monocytogenes in food-processing facilities. Teoksessa: Listeria, listeriosis and food safety. Marcel Dekker Inc, New York. 657-206 Iversen, Lane and Forsythe 2004, The Growth Profile, Thermotolerance and Biofilm Formation of Enterobacter sakazakii Grown in Infant Formula Milk, Letter of Applied Microbiology 2004, vol. 38, no 5, 378-382 Kozak,; Balmer, Byrne and Fisher,1996 Prevalence of Listeria monocytogenes in foods: incidence in dairy products. Food-Control. 1996; 7(4/5): 215-221
Page 29
Larsen and Jørgensen 1997, The occurrence of Bacillus cereus in Danish pasteurized milk, Int. J. Food Microbiol. 34: 179-186 McLauchlin, and Gilbert,1990, Listeria in food. PHLS-Microbiology-Digest. 1990; 7(3): 54-55 Nauta,2001, A modular risk model structure for quantitative microbiological assessment and its application in an exposure assessment of Bacillus cereus .RIVM rapport 149106007 Nazarowec-White and Farber, 1997, Thermal resistance of Enterobacter sakazakii in reconstituted dried infant formula, J. Applied Microbiology, 24, 9-13 Notermans, Dufrenne, Teunis, Beumer, Te Giffel and Weem, 1997, A risk assessment study of Bacillus cereus present in pasteurized milk, Food Microbiology 14, 146-151 Sanaa, Coroller, and Cerf, 2004. Risk Assessment of Listeriosis Linked to the Consumption of two soft cheeses made from raw milk: Camembert of Normandy and Brie of Meaux. Risk Analysis, 24, 389-399. Stadhouders, Hup and Langeveld 1980, Some observations on the germination, and outgrowth of fast-germinating and slow-germinating spores of Bacillus cereus in pasteurized milk, Neth. Milk Dairy J. 34 215-228 Svensson, Ekelund, Ogura and Christiansson 2004. Characterization of Bacillus cereus isolated from milk silo tanks at eight different dairy planta. Int. Dairy J. 14, 17-27 WHO, 2004: Enterobacter sakazakii and other microorganisms in powder infant formula: meeting report, MRA Series 6. ISBN: 92 4 156262 5; WHO, 2006: Enterobacter sakazakii and Salmonella in powdered infant formula: meeting report, MRA Series 10. ISBN 92 4 156331 1. Zwietering, De Wit, and Notermans, 1996, Application of predictive microbiology to estimate the number of Bacillus cereus in pasteurized milk at the point of consumption, Int. J. Food Microbiol. 30, 55-70
Page 30
Demo-Decision tool
Provide background information, and guide the user through different phases in the decision process
Page 31
About Decision tool
• The tool is in principle generic, however it focuses on the following bacteria and products
– Bacillus cereus - pasteurized milk
– Listeria monocytogenes - soft cheeses
– Enterobacter sakazakii - dry milk
• The tool is provided as a Microsoft Powerpoint presentation
– By using internal and external links the user can navigate throughthe file
Page 32
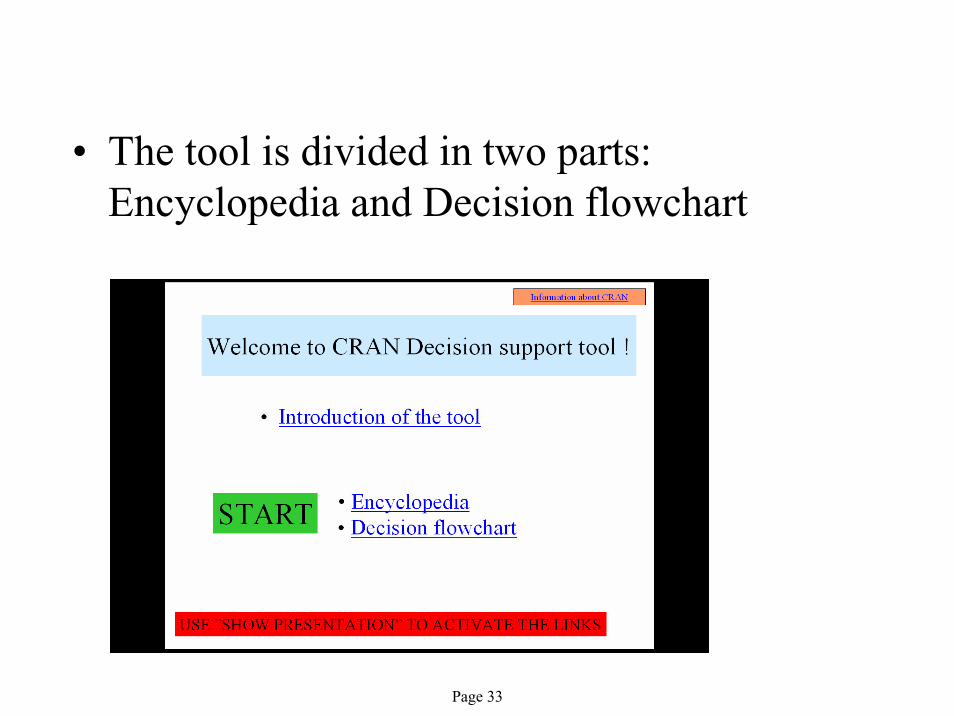
• The tool is divided in two parts: Encyclopedia and Decision flowchart
Page 33

The Encyclopedia provides background information useful in the decision process
Page 34
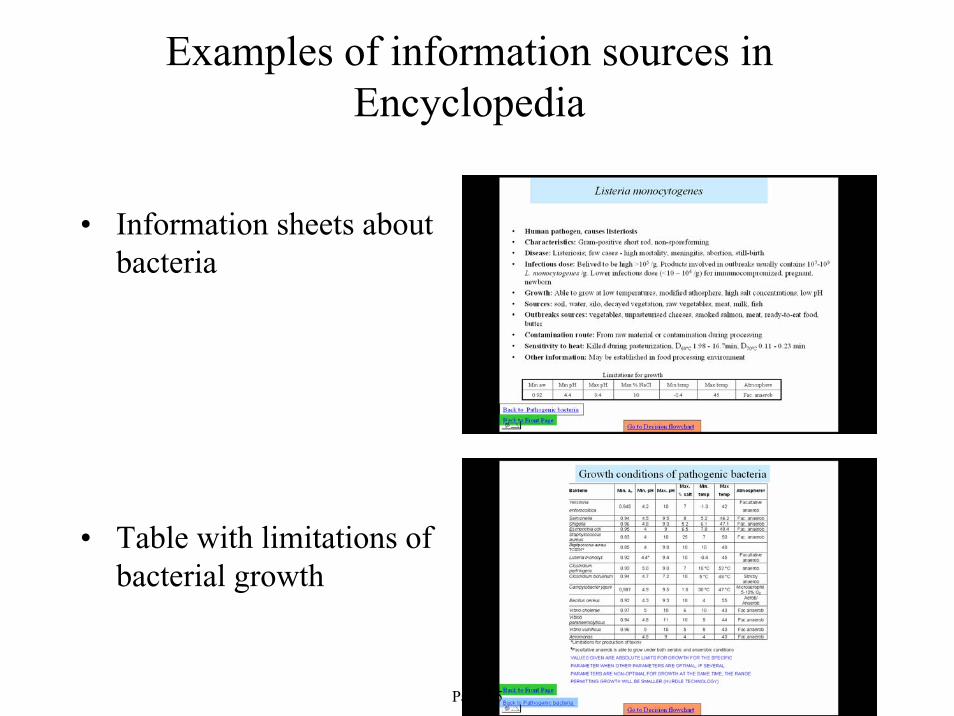
Examples of information sources in Encyclopedia
• Information sheets about bacteria
• Table with limitations of bacterial growth
Page 35
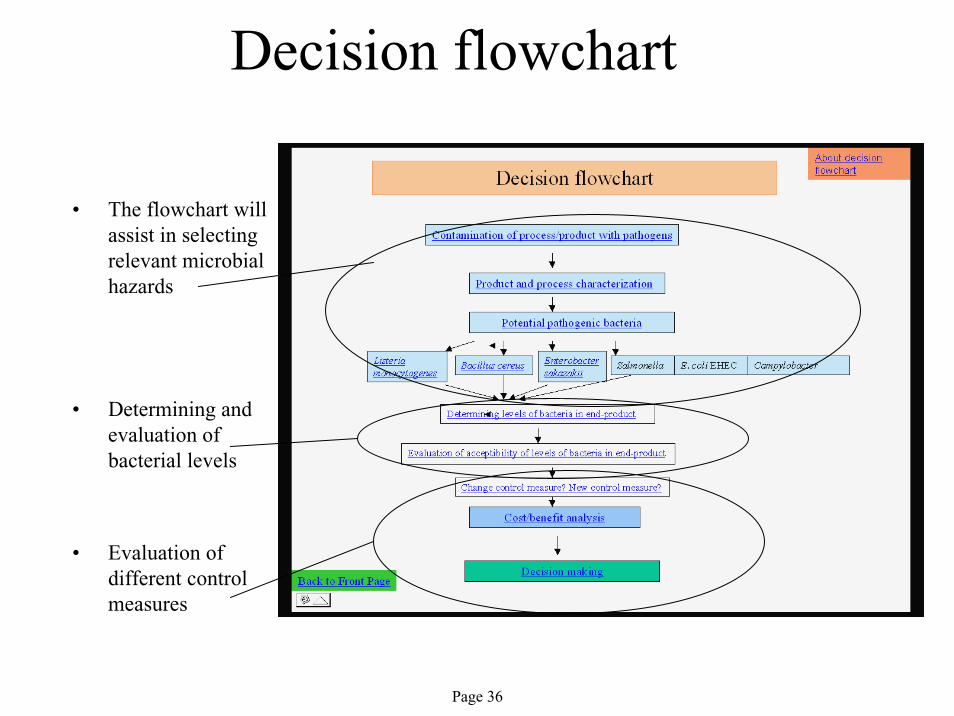
Decision flowchart
• The flowchart will assist in selectingrelevant microbial hazards
• Determining and evaluation of bacterial levels
• Evaluation of different control measures
Page 36
• For more information contact representants from the CRAN project:
• …
• …• Trond Møretrø, Matforsk
– tel: +47 64970216 email: [email protected]
Page 37
For more information contact:Pernilla Arinder, SIK, [email protected] Møretrø, Matforsk, [email protected] Heggum, Danish Dairy Board, [email protected] Aarnisalo, VTT, [email protected] Tuominen, EVIRA, [email protected]ó Þ. Marteinsson, MATIS, [email protected] Christiansson, Swedish Dairy Association, [email protected] Alnås, Arla, [email protected] Ljones, Q-mejerier, [email protected] Oppegaard; Tine, [email protected] Halldórsdóttir; Nordurmjolk, [email protected]
Page 38
Demo – calculation toolCalculates along the production chain
–the number of bacteria –the effect of the process
Page 39
Calculation of numbers of bacteria along the process chain
The tool demonstrates how quantitative microbial assessment may be performed along the production chain.
The purpose is to illustrate how calculation and simulation may be used by the food industry, and not to provide a
ready-to-use software.
Page 40
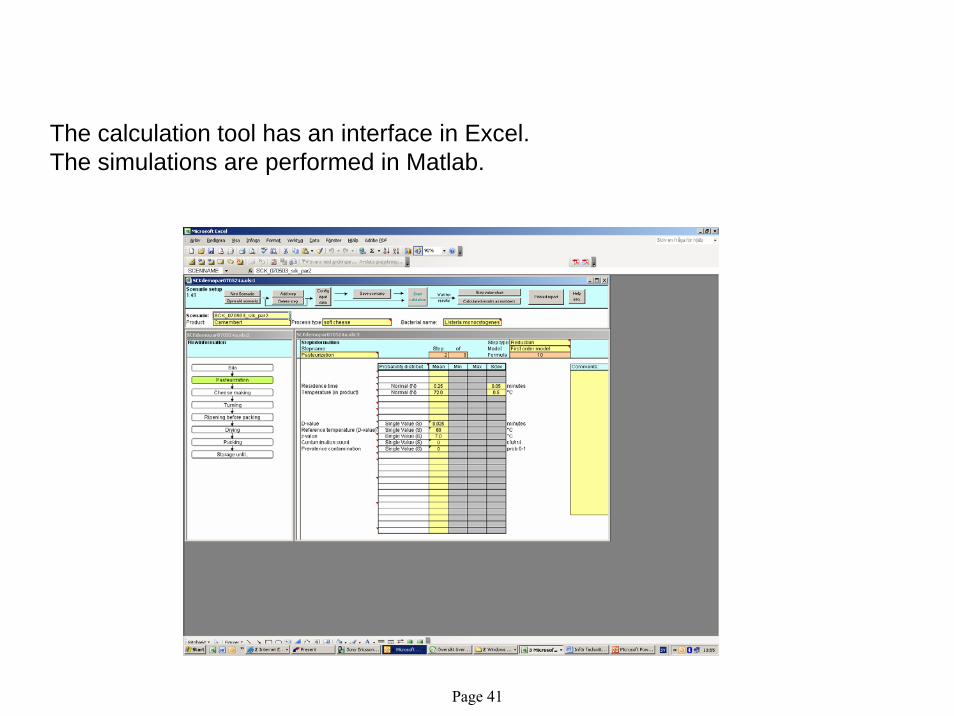
The calculation tool has an interface in Excel. The simulations are performed in Matlab.
Page 41
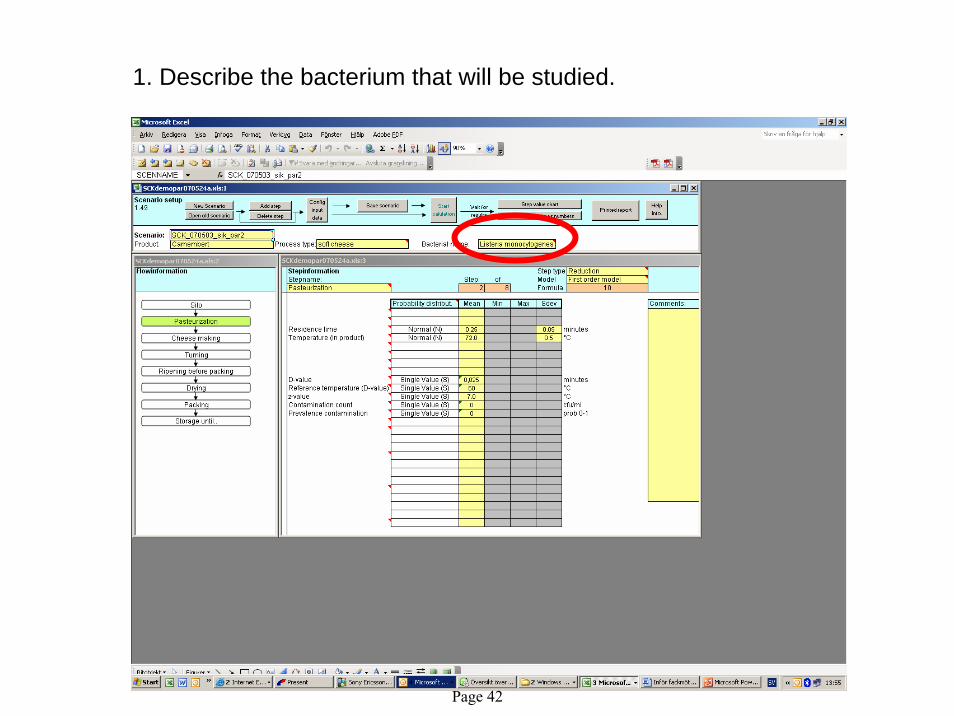
1. Describe the bacterium that will be studied.
Page 42
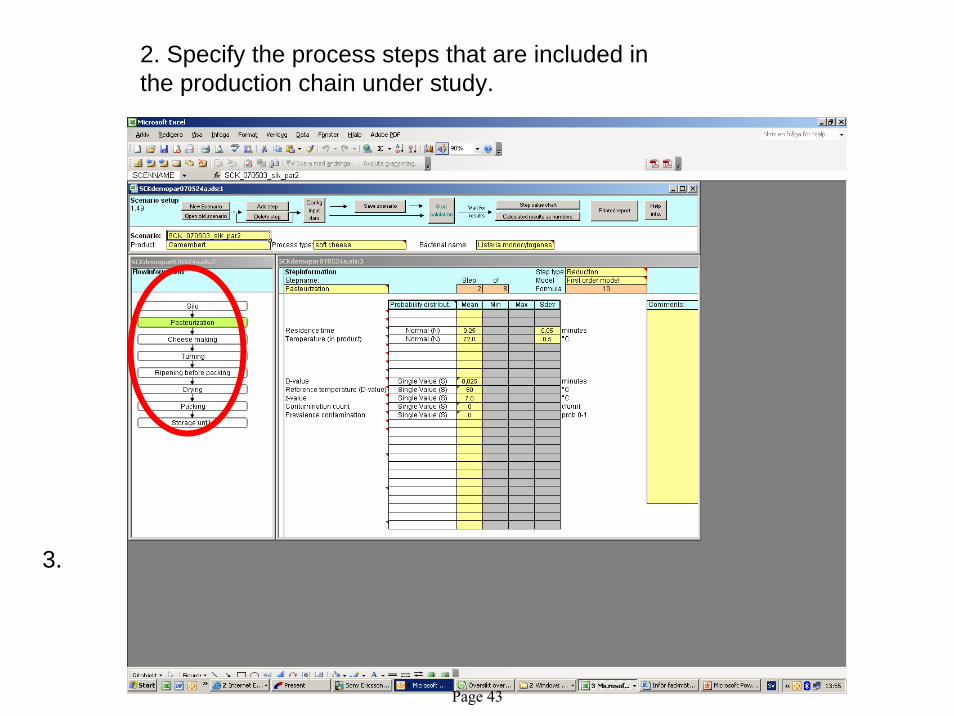
2. Specify the process steps that are included in the production chain under study.
3.
Page 43
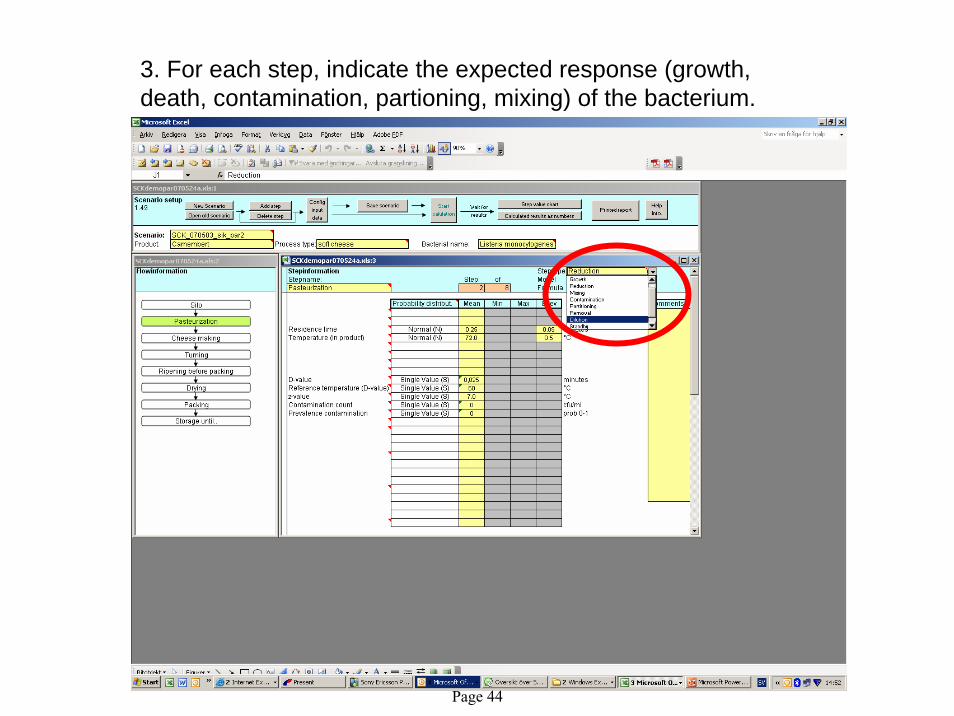
3. For each step, indicate the expected response (growth, death, contamination, partioning, mixing) of the bacterium.
Page 44
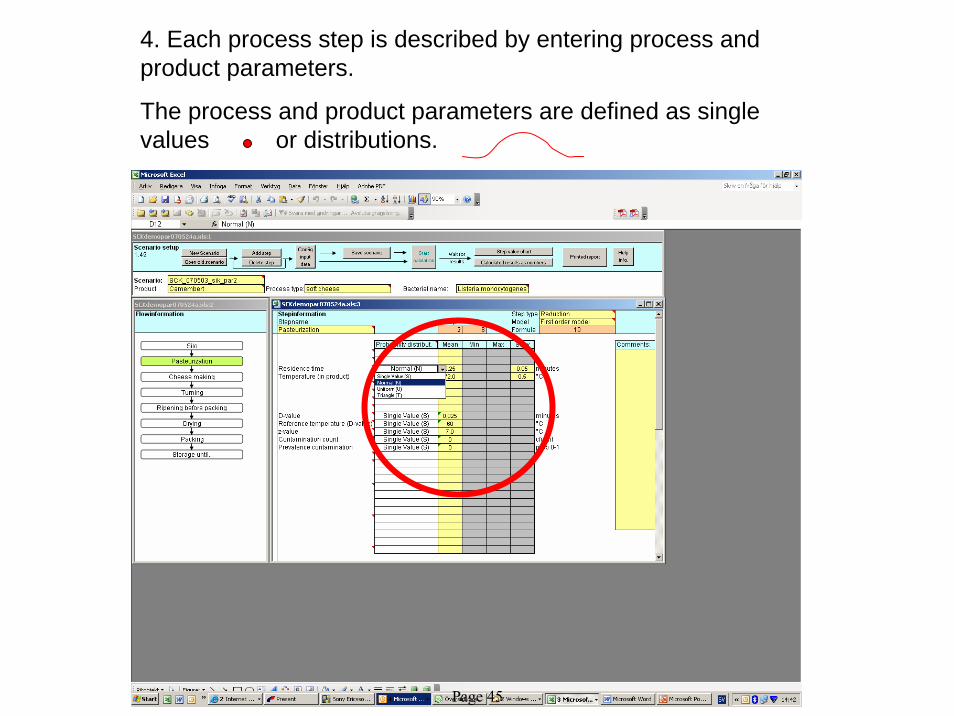
4. Each process step is described by entering process and product parameters.
The process and product parameters are defined as single values or distributions.
Page 45
The simulated bacterial numbers along the process chain is a result of the calculated bacterial change caused by variations in process parameters.
Monte Carlo simulation is used.
Page 46
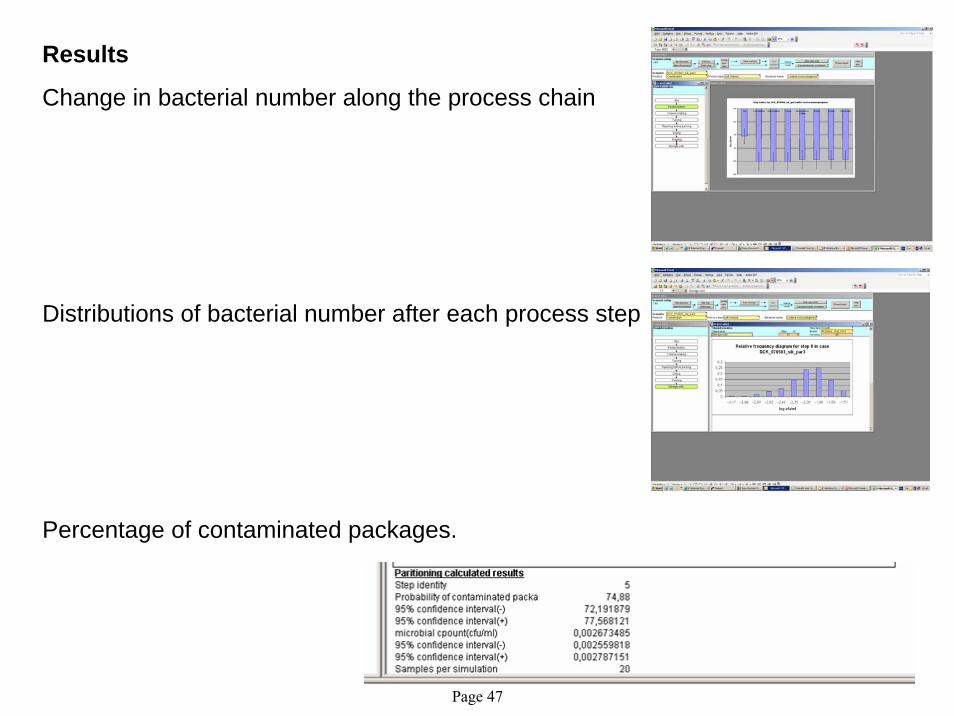
Results
Change in bacterial number along the process chain
Distributions of bacterial number after each process step
Percentage of contaminated packages.
Page 47
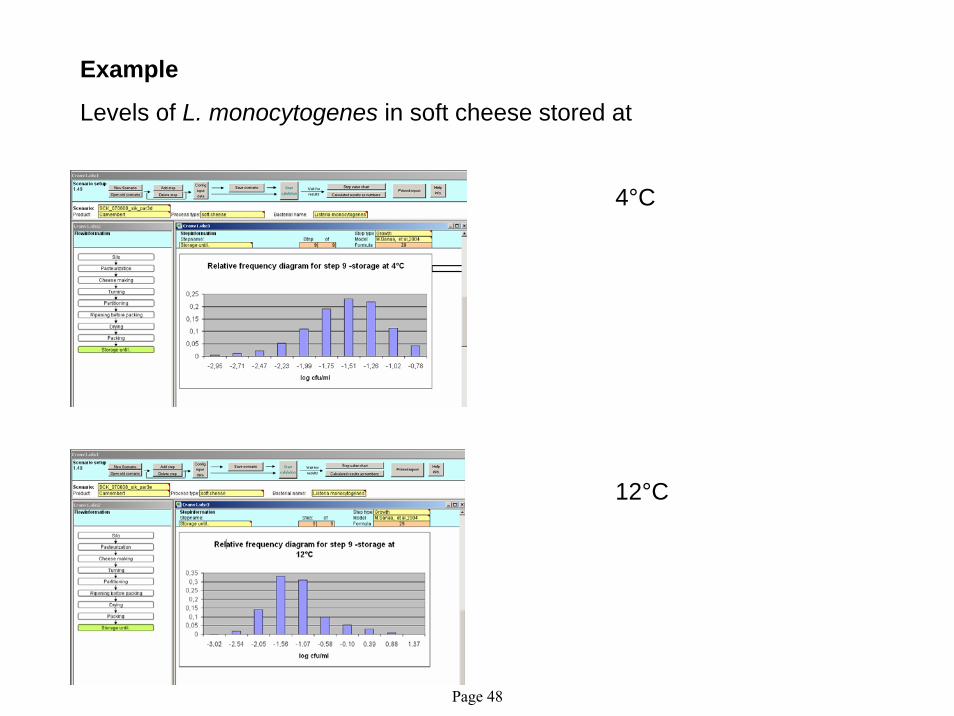
Example
Levels of L. monocytogenes in soft cheese stored at
4°C
12°C
Page 48
How can the results be used?
•Compare process scenarios
•Evaluate process variations
•Evaluate process failure
•Determine critical control points
•Specify criteria to ensure safety
Page 49
For more information contact:Pernilla Arinder, SIK, [email protected] Møretrø, Matforsk, [email protected] Heggum, Danish Dairy Board, [email protected] Aarnisalo, VTT, [email protected] Tuominen, EVIRA, [email protected]ó Þ. Marteinsson, MATIS, [email protected] Christiansson, Swedish Dairy Association, [email protected] Alnås, Arla, [email protected] Ljones, Q-mejerier, [email protected] Oppegaard; Tine, [email protected] Halldórsdóttir; Nordurmjolk, [email protected]
Page 50
Demo – CRAN Data base
•For the collection of data on –Processing–Products–Bacteria
•To be used in –Product exposure assessment
Page 51

The databases are developed in MS Access.
Page 52
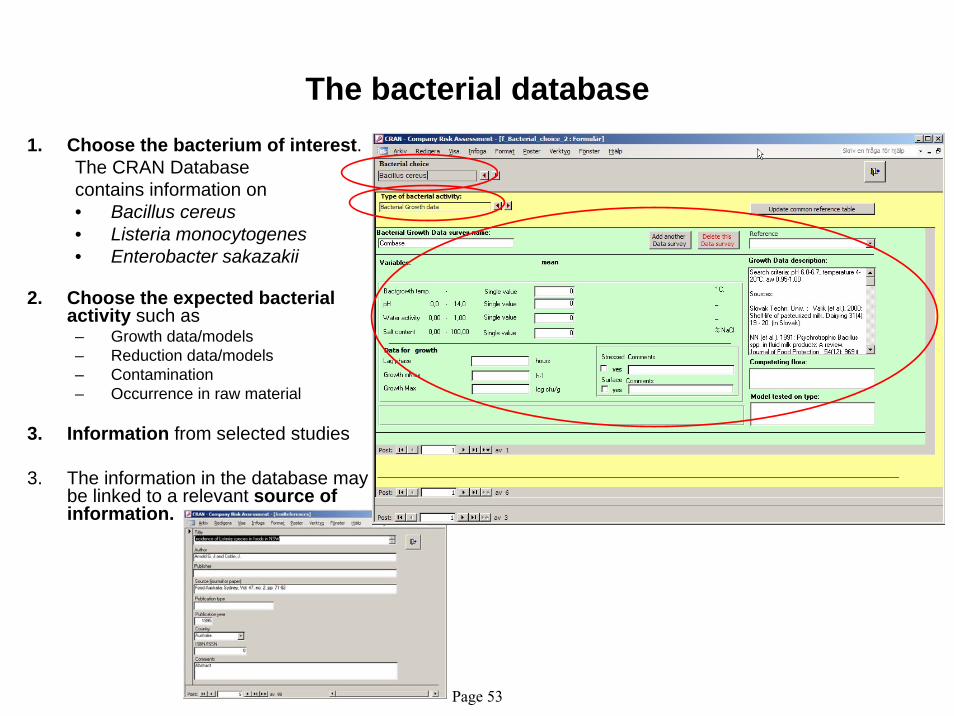
The bacterial database1. Choose the bacterium of interest.
The CRAN Databasecontains information on • Bacillus cereus• Listeria monocytogenes• Enterobacter sakazakii
2. Choose the expected bacterial activity such as– Growth data/models– Reduction data/models– Contamination– Occurrence in raw material
3. Information from selected studies
3. The information in the database may be linked to a relevant source of information.
Page 53

The process and product database
1. Choose the process and product.
2. Name the flowchart.
3. Describe the process parameters and product characteristics.The parameters may bedescribed as single values or by distributions, normal, uniform or triangular.
Page 54
For more information contact:Pernilla Arinder, SIK, [email protected] Møretrø, Matforsk, [email protected] Heggum, Danish Dairy Board, [email protected] Aarnisalo, VTT, [email protected] Tuominen, EVIRA, [email protected]ó Þ. Marteinsson, MATIS, [email protected] Christiansson, Swedish Dairy Association, [email protected] Alnås, Arla, [email protected] Ljones, Q-mejerier, [email protected] Oppegaard; Tine, [email protected] Halldórsdóttir; Nordurmjolk, [email protected]
Page 55
Nordic Innovation Centre
The Nordic Innovation Centre initiates and finances activities that enhance innovation collaboration and develop and maintain a smoothly functioning market in the Nordic region.
The Centre works primarily with small and medium-sized companies (SMEs) in the Nordic countries. Other important partners are those most closely involved with innovation and market surveillance, such as industrial organisations and interest groups, research institutions and public authorities.
The Nordic Innovation Centre is an institution under the Nordic Council of Ministers. Its secretariat is in Oslo.
For more information: www.nordicinnovation.net
Nordic Innovation CentreStensberggata 25NO-0170 OsloNorway
Phone: +47-47 61 44 00Fax: +47-22 56 55 65