crash reduction - national highway traffic safety administration
TRANSCRIPT

U.S. Department of Transportation http://www.nhtsa.dot.gov
DOT HS 809 719 February 2004 NHTSA Technical Report
Evaluation of FMVSS 214 Side Impact Protection for Light Trucks: Crush Resistance Requirements for Side Doors
This document is available to the public from the National Technical Information Service, Springfield, Virginia 22161.
National Highway Traffic Safety Administration

The United States Government does not endorse products or manufacturers. Trade or manufacturers’ names appear only because they are considered essential to the object of this report.

Technical Report Documentation Page 1. Report No.
DOT HS 809 719 2. Government Accession No. 3. Recipient’s Catalog No.
5. Report Date
February 2004 4. Title and Subtitle
Evaluation of FMVSS 214 Side Impact Protection for Light Trucks: Crush Resistance Requirements for Side Doors
6. Performing Organization Code
7. Author(s)
Marie C. Walz
8. Performing Organization Report No.
10. Work Unit No. (TRAIS)
9. Performing Organization Name and Address
Evaluation Division; Planning, Evaluation and Budget National Highway Traffic Safety Administration Washington, DC 20590
11. Contract or Grant No.
13. Type of Report and Period Covered
NHTSA Technical Report
12. Sponsoring Agency Name and Address
Department of Transportation National Highway Traffic Safety Administration Washington, DC 20590
14. Sponsoring Agency Code
15. Supplementary Notes 16. Abstract
Beginning September 1, 1993, all light trucks (pickup trucks, vans, and sport utility vehicles) were required to meet a crush resistance standard for side doors. Data from calendar years 1989 through 2001 of the Fatality Analysis Reporting System (FARS) were used to determine the effectiveness of changes made by vehicle manufacturers to meet this standard. Effectiveness was determined by comparing changes in the number of fatalities in side impacts relative to those in frontal impacts. Three analysis techniques were applied to the data. First, simple ratios of side-impact to frontal crash fatalities were computed, with comparisons made between vehicles with and without side door beams. Second, side impact fatality rates per one thousand vehicle registration years were determined, with vehicles separated according to whether they were manufactured before or after side door beam installation. Finally, a regression analysis of the ratio of side-impacts to frontal fatalities as a function of the presence of side door beams was done. The effectiveness of side door beams for front outboard occupants was estimated to be 19 percent in all single vehicle side impacts, which would result in the saving of 151 lives in those type crashes if all light trucks were equipped with the side beams. Looking at single vehicle nearside impacts only, the effectiveness of the beams was estimated to be 25 percent. If all light trucks were equipped with side door beams, an estimated 124 lives would be saved annually in single vehicle nearside impacts. Little or no effectiveness was found in multi-vehicle crashes. 17. Key Words
FMVSS 214; side impact; side door beam; light trucks; crush resistance
18. Distribution Statement
Document is available to the public through the National Technical Information Service, Springfield, Virginia 22161
19. Security Classif. (Of this report)
Unclassified 20. Security Classif. (Of this page)
Unclassified 21. No. of Pages
45 22. Price
Form DOT F 1700.7 (8-72) Reproduction of completed page authorized


TABLE OF CONTENTS
Executive Summary........................................................................................................................ 1
Introduction and Background.................................................................................................... 3
Analysis Approaches ...................................................................................................................... 4
Data Preparation ............................................................................................................................. 4
Effectiveness of Side Door Beams in Preventing Fatalities .............................................. 9
Exposure Data ................................................................................................................................ 18
Regression Analysis ...................................................................................................................... 29
Best Estimates of Effectiveness................................................................................................. 41
Lives Saved by Side Door Beams............................................................................................. 42
References ........................................................................................................................................ 45

Executive Summary From January 1, 1973 until August 31, 1993, Federal Motor Vehicle Safety Standard (FMVSS) 214 had been applicable to passenger cars only. Beginning September 1, 1993, all light trucks (pickup trucks, vans, and sport utility vehicles) were also required to meet the crush resistance standard, which specified minimum crush resistance when a load is applied to the outer surface of a vehicle door. Manufacturers were permitted to meet the standard earlier, and in a few cases this was done, but the majority of light trucks were installed with side door beams beginning in model year 1994. Manufacturers met the static crush requirement of FMVSS 214 by installing longitudinal side door beams. Data from calendar years 1989 through 2001 of the Fatality Analysis Reporting System (FARS) were used. Vehicle model years used in the analysis ranged from 1989 through 1997. These data included 1,376 cases of single vehicle side impact fatalities. This is the type of crash most likely to benefit from the presence of the side door beams. An earlier evaluation on the effectiveness of side door beams in passenger cars had found the greatest benefit to be in single vehicle side impacts, and little or no effect on fatalities in multi-vehicle crashes. In the current evaluation, side impact data were first compared to frontal impacts, which served as a control group. Effectiveness of installing side door beams was determined by comparing changes in the number of fatalities in side impacts relative to those in frontal impacts. Data were examined for all front outboard occupants, as well as for drivers and right front passengers individually. Vehicles were limited to those without changes in the presence of air bags, or analytic techniques were used to control for air bags, since this would clearly have an impact on the number of fatalities in frontal impacts. Three analysis techniques were applied to the data. First, simple ratios of side-impact to frontal crash fatalities were computed, with comparisons made between vehicles with and without side door beams. Second, side impact fatality rates per one thousand vehicle registration years were determined, with vehicles separated according to whether they were manufactured before or after side door beam installation. Finally, a regression analysis of the ratio of side-impacts to frontal fatalities as a function of the presence of side door beams was done. The regression analysis allowed control of additional influencing variables, such as the presence of air bags and vehicle age. The regression analysis was considered the best technique, because it allowed several factors to be investigated at the same time, such as seat position, presence of air bag, and vehicle age, which could have affected the previous two analyses, as well as allowing a larger sample size, since data before and after beam installation did not have to be matched for such situations as presence of air bags or years of production. Regression models were run for various combinations for side impacts. All side impacts were combined; single and multi-vehicle crashes were also examined separately, as were near and far side crashes. Presence of the side door beam was found to statistically significantly reduce fatalities in single vehicle side and single vehicle nearside impacts, relative to frontal crashes, for drivers alone as well as in combination with right front passengers. The regression analysis showed that side door beams are effective in preventing front outboard fatalities in single vehicle side impacts. There was a

19 percent reduction in fatalities attributed to the beams for both drivers alone as well as for all front outboard occupants. In single vehicle nearside impacts, drivers alone saw a 26 percent reduction, while the reduction for all front outboard occupants was 25 percent. All four of these reductions were statistically significant. Right front passengers also saw sizable 18 and 17 percent reductions, in single vehicle and single vehicle nearside impacts, respectively, although these were not statistically significant. Little or no effectiveness was found in multi-vehicle crashes. The effectiveness of side door beams for front outboard occupants was estimated to be 19 percent in all single vehicle side impacts, and 25 percent in single vehicle nearside crashes. Based on these two different effectiveness estimates, the number of lives saved annually was estimated. Using the 19 percent fatality reduction for front outboard occupants in single vehicle side impacts, it is estimated that, if all light trucks were equipped with side door beams, 151 lives would be saved each year in single vehicle side impacts (both nearside and far side). The 95 percent confidence band for effectiveness for all front outboard occupant single vehicle side impact fatalities ranged from 4 to 32 percent. The 95 percent confidence bounds range from 29 to 285 lives saved if all light trucks were equipped with side door beams. These calculations are based on the average effect of side door beams over all single vehicle side impact fatalities, and applying the effectiveness estimate to the total of nearside and far side fatalities combined. A slightly more conservative estimate can be obtained by assuming the beams are effective only in nearside single-vehicle crashes, and have little effect in the far side crashes. Using the 25 percent effectiveness estimate for all front outboard occupants in single vehicle nearside fatalities, the 95 percent confidence band for all front outboard occupant nearside fatalities ranged from 8 to 39 percent. If all light trucks were equipped with side door beams, an estimated 124 lives would be saved annually in single vehicle nearside impacts. The 95 percent confidence band is 35 to 222 lives saved.
2

Introduction and Background The National Highway Traffic Safety Administration (NHTSA) issues Federal Motor Vehicle Safety Standards (FMVSS) that must be met by vehicles manufactured for sale in the United States. FMVSS 214 (“Side Impact Protection”) specifies performance requirements for the protection of occupants in side impact crashes, in order to reduce the risk of serious and fatal injury to occupants. A primary objective of FMVSS 214 is to minimize danger caused by intrusion into the passenger compartment. FMVSS 214 has both a crush resistance requirement for side doors as well as a side impact requirement based on dynamic testing. This report covers only the extension of the crush resistance requirement to light trucks. The initial version of FMVSS 214 was limited to a crush resistance requirement for passenger cars, effective January 1, 1973. On December 22, 1989, NHTSA published a Notice of Proposed Rulemaking (NPRM) to extend FMVSS 214’s existing passenger cars quasi-static test requirement to light trucks. This would, in effect, require light trucks to be equipped with side door beams. From January 1, 1973 until August 31, 1993, FMVSS 214 had been applicable only to passenger cars. In most cases, manufacturers met FMVSS 214 by equipping cars with a longitudinal beam in vehicle doors. NHTSA evaluated the benefits of the crush resistance regulation in passenger cars, and found single vehicle side impact occupant fatalities were reduced by 14 percent, saving 480 lives annually (Kahane, 1982). FMVSS 214 was extended to light trucks in 1991 (for the final rule extending static test to light trucks, see Federal Register 56 (June 14, 1991): 27427), with an effective date of September 1, 1993. Beginning with model year 1994, all light trucks met the standard. Some vehicles were already being manufactured with side door beams prior to the effective date of the standard. The 1982 evaluation of the crush resistance requirement found the greatest benefit was for passenger cars in single vehicle side impacts. The crush resistance requirement was found to have little or no effect on reducing fatalities in multi-vehicle side impacts. Thus, the focus of this report is on single vehicle crashes, although data from multi-vehicle crashes are presented for comparison. In addition, occupant seating position is noted, to distinguish between nearside and far side impacts. The crush resistance test consists of gradually forcing a steel cylinder of 12 inch diameter into the door. With seats removed, the cylinder must encounter a resistance averaging at least 2,250 pounds during the first 6 inches of crush, averaging at least 3,500 pounds during the first 12 inches, and reaching a peak of at least 7,000 pounds or twice the vehicle’s curb weight (whichever is less) at some point during the first 18 inches of crush. With seats installed in the vehicle, the cylinder must encounter a resistance averaging at least 2,250 pounds during the first 6 inches of crush, averaging at least 4,375 pounds during the first 12 inches, and reaching a peak of at least 12,000 pounds or three and one half times the vehicle’s curb weight (whichever is less) at some point during the first 18 inches of crush.
3

Analysis Approaches The Fatality Analysis Reporting System (FARS) is a census of fatal traffic crashes since 1975. Information on the crash as well as the vehicles and people involved is recorded in the data file. For these analyses, front outboard (drivers and right front passenger) fatalities were selected from the FARS file. This report focuses on the effectiveness of the amended standard in preventing fatalities only. This analysis examines fatality data in a number of ways. Initially, side impacts are grouped according to the number of vehicles in the collision (single or multi-vehicle) as well as whether the impact occurred on the side where the occupant was seated (“nearside”) or on the opposite side of the vehicle (“far side”). The numbers of fatalities in the specific type of crashes are compared before and after the trucks were equipped with side door beams. Frontal impacts are used as a comparison group, to determine whether any changes observed in side impact fatalities were due to the addition of side door beams or to other, unrelated causes. Pure frontal impacts only were used, to eliminate contamination with frontal impacts also containing a substantial side impact component. Although this reduces the size of the comparison group, it allows for a cleaner comparison. Registration data were also used to determine fatality rates before and after the installation of side door beams in light trucks. This allowed the evaluation of the beams’ effectiveness without having to rely on a comparison group, which might also have been changing in unknown but systematic ways, either similar or dissimilar to the beams’ effect. Finally, a regression analysis was performed, which permitted the control of several possible factors. Data from both side and frontal impacts were included, and the impact of other variables on the type of crash was measured. This method allowed factors previously controlled for in other ways in the two earlier analyses to be a more integrated part of the analysis. For example, rather than having to eliminate vehicles with alternate air bag status, the presence or absence of such could simply be noted in the data and would be incorporated into the analysis. This resulted in a larger sample size as well as a more statistically sophisticated method. The results of the regression analysis may not be as easily comprehended as, for example, the difference in fatality rates for side impacts as compared to frontals. However, the results of all three analyses were consistent, showing a reduction in single vehicle side impact fatalities after side door beams were installed in light trucks. Data Preparation Examination of the number of fatalities and crashes before and after vehicles met the new standard provided valuable information. Specifically, “Before” and “After” groups of certain vehicles having no substantive structural or safety related changes other than the addition of side door beams (or other changes in the side structure) were compared to quantify changes in crash rates, as well as the types of crashes occurring. If manufacturers had phased in the necessary changes, they would have been required to report specific information to NHTSA, including when each make-model was first equipped with side door beams or other modifications to meet FMVSS 214. However, the requirement was not phased in, and
4

5
therefore, the information was not reported to NHTSA. The manufacturers then had to be contacted for information on when specific vehicles met the standard for light trucks. Representatives from Daimler-Chrysler, Ford, General Motors, Nissan, and Toyota provided information on when their light trucks first began meeting the new standard. Exhibit 1 presents the vehicle data used for this report. Vehicle clones, essentially twins built on the same platform, are considered the same vehicle model throughout this report. Vehicles are combined into groups for simplicity where there is no difference in the model years used for the current analysis. In cases where alterations in the vehicle resulted in differences in the usable model years for the analysis, the vehicles are listed separately. If too long a span of years were to be used for the before/after comparisons, observed differences could potentially be due to a comparison of older to newer vehicles. Therefore, vehicles no more than four years before and after the installation of side door beams were used. If four model years of data were valid in both the “Before” and “After” group for the vehicle in question, all those data would be used. If either the “Before” or “After” group was limited to a shorter time span, due to air bag installation, model redesign, or non-production, then both groups would use the shorter time span. The same number of years was used for each of the two groups, with and without side door beams, for each make-model. The columns labeled “1st Year Produced” and “Last Year Produced” refer to the model years of production for that specific vehicle during which no major redesign took place. The column “First Year with Beams” notes the model year that the vehicle implemented changes in the side structure to meet the extension of FMVSS 214. The majority of light trucks made these changes in model year 1994. The exceptions are:
• Ford Econolines were redesigned in 1992 and had beams beginning then • Ford Explorers began production in 1991 and have always had beams • Chevy Lumina, Pontiac Transport, and Oldsmobile Silhouette began production in 1991 and
have always had beams • Nissan Pathfinder and Nissan Frontier first had beams in MY 1993 • Nissan Quest began production in 1993 and have always had beams • Toyota Previa began production in 1991 and have always had beams • Toyota LandCruiser had beams beginning 1993 • Mazda Navajo began production in 1991 and have always had beams
Only the Nissan trucks and Toyota LandCrusiers listed above could be used for this report, as the other vehicles met the standard either when first produced or when redesigned, preventing any “Before” data. Air bags are effective at preventing fatalities in frontal impacts. Because frontal impacts are used as the control group, it was also important to note the presence of air bags, in order to maintain consistency in the “Before” and “After” groups. The columns labeled “First Year Driver AB” and “First Year RFP AB” provide information on the model year air bags were first installed in the vehicle at the driver and right front passenger position, respectively. Entries of ‘1’ in these columns signify vehicles that did not get air bags within four years of either meeting FMVSS 214 and/or a
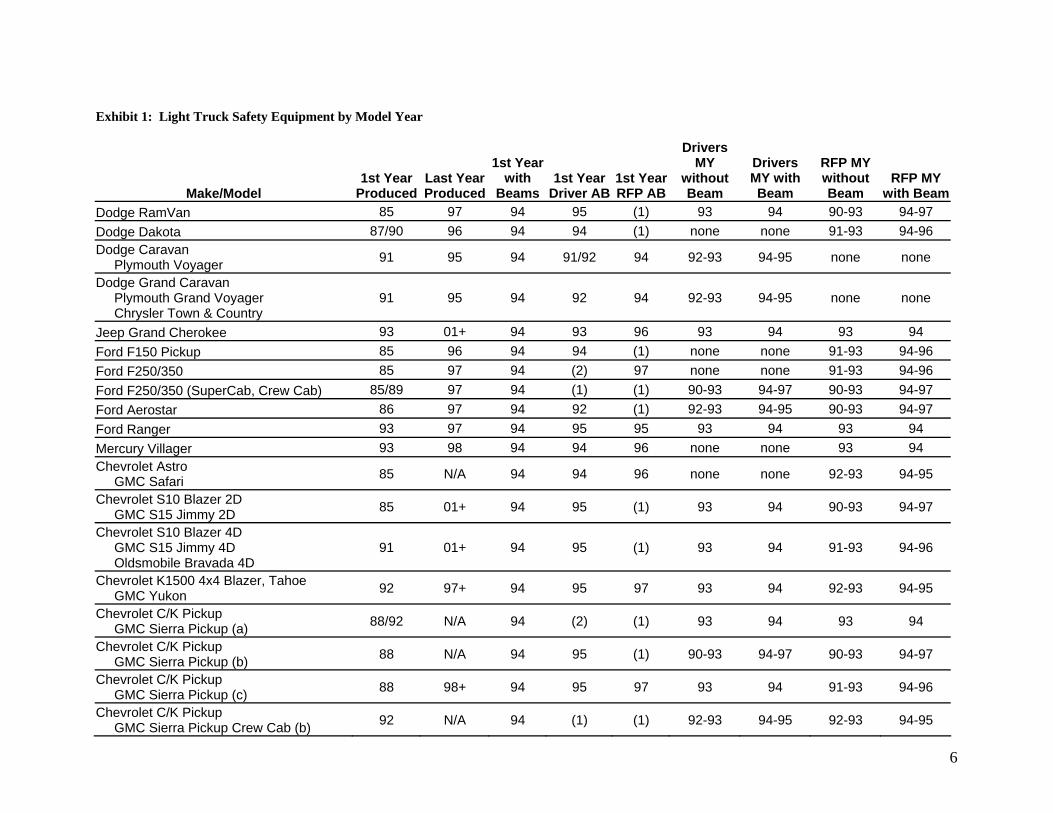
Exhibit 1: Light Truck Safety Equipment by Model Year
Make/Model 1st Year
ProducedLast Year Produced
1st Year with
Beams1st Year
Driver AB
1st Year RFP AB
Drivers MY
without Beam
Drivers MY with Beam
RFP MY without Beam
RFP MY with Beam
Dodge RamVan 85 97 94 95 (1) 93 94 90-93 94-97Dodge Dakota 87/90 96 94 94 (1) none none 91-93 94-96Dodge Caravan Plymouth Voyager 91 95 94 91/92 94 92-93 94-95 none none
Dodge Grand Caravan Plymouth Grand Voyager Chrysler Town & Country
91 95 94 92 94 92-93 94-95 none none
Jeep Grand Cherokee 93 01+ 94 93 96 93 94 93 94Ford F150 Pickup 85 96 94 94 (1) none none 91-93 94-96Ford F250/350 85 97 94 (2) 97 none none 91-93 94-96Ford F250/350 (SuperCab, Crew Cab) 85/89 97 94 (1) (1) 90-93 94-97 90-93 94-97Ford Aerostar 86 97 94 92 (1) 92-93 94-95 90-93 94-97Ford Ranger 93 97 94 95 95 93 94 93 94Mercury Villager 93 98 94 94 96 none none 93 94Chevrolet Astro GMC Safari 85 N/A 94 94 96 none none 92-93 94-95
Chevrolet S10 Blazer 2D GMC S15 Jimmy 2D 85 01+ 94 95 (1) 93 94 90-93 94-97
Chevrolet S10 Blazer 4D GMC S15 Jimmy 4D Oldsmobile Bravada 4D
91 01+ 94 95 (1) 93 94 91-93 94-96
Chevrolet K1500 4x4 Blazer, Tahoe GMC Yukon 92 97+ 94 95 97 93 94 92-93 94-95
Chevrolet C/K Pickup GMC Sierra Pickup (a) 88/92 N/A 94 (2) (1) 93 94 93 94
Chevrolet C/K Pickup GMC Sierra Pickup (b) 88 N/A 94 95 (1) 90-93 94-97 90-93 94-97
Chevrolet C/K Pickup GMC Sierra Pickup (c) 88 98+ 94 95 97 93 94 91-93 94-96
Chevrolet C/K Pickup GMC Sierra Pickup Crew Cab (b) 92 N/A 94 (1) (1) 92-93 94-95 92-93 94-95
6

7
Make/Model 1st Year
ProducedLast Year Produced
1st Year with
Beams1st Year
Driver AB 1st Year RFP AB
Drivers MY
without Beam
Drivers MY with Beam
RFP MY without Beam
RFP MY with Beam
Chevrolet C/K Pickup GMC Sierra Pickup Crew Cab (c) 92 N/A 94 95 97 93 94 92-93 94-95
Chevrolet S/T Pickup GMC S/T Sonoma 88 N/A 94 95 (1) 93 94 90-93 94-97
Chevrolet G10 & G20 ChevyVan, G10 SportVan, GMC G15 Rally, G15 & G25 Vandura
85 95 94 94 (1) none none 92-93 94-95
Chevrolet G30 ChevyVan, G20 & G30 SportVan, GMC G25 & G35 Rally, G35 Vandura (a)
85 95 94 (1) (1) 92-93 94-95 92-93 94-95
Chevrolet G30 ChevyVan, G20 & G30 SportVan, GMC G25 & G35 Rally, G35 Vandura (c)
85 95 94 94 (1) none none 92-93 94-95
Chevrolet G30 ChevyVan, G30 SportVan G35 Rally, G35 Vandura - extended 90 95 94 (2) (1) none none 92-93 94-95
Chevrolet Suburban GMC Suburban 92 99 94 95 97 93 94 92-93 94-95
Nissan Pathfinder 90 95 93 96 (1) 90-92 93-95 90-92 93-95Nissan Pickup 85/86 97 93 96 (1) 90-92 93-95 89-92 93-96Toyota 4Runner 85 95 94 (1) (1) 92-93 94-95 92-93 94-95Toyota LandCruiser 91 N/A 93 95 96 91-92 93-94 91-92 93-94Toyota Pickup 85 95 94 (1) (1) 92-93 94-95 92-93 94-95Toyota T100 Pickup 93 95/96/98 94 94 (1) none none 93 94(a) VIN4=G (b) VIN4=H,J,K (c) Remaining VIN 1 = Did not get air bags within 4 years of beam installation and/or before major redesign 2=Undetermined

major redesign. Thus, during the model years used for this analysis, these vehicles did not get air bags in the noted seat position. Entries of ‘2’ in these columns indicate that the initial year of an air bag in that seat position could not be determined. Typically, this meant that air bags were optional, and thus the presence or absence in a specific vehicle was unknown. These vehicles were eliminated beginning with the model year in which the presence of an air bag in a specific vehicle could not definitively be established. The last four columns of Exhibit 1 present the actual model years of each vehicle used in the analysis, for drivers and for right front passengers, each with and without the side door beams. The remaining columns (initial model years of beam installation, driver and right front passenger air bags, and production), determine which model years could be used for analysis. For example, for the Dodge Grand Caravan and similar vehicles (Plymouth Grand Voyager, Chrysler Town & Country), beams were introduced in model year 1994. Driver air bags were first installed in 1992, and dual air bags became standard in 1994. These vehicles were produced without a redesign from 1991 through 1995, three years before the beams were installed and two years after. Thus, two years of “With Beam” and “Without Beam” data could be used, in order to keep the number of years before and after the same. However, since passenger air bags were first installed in the same model years as beams, no passenger data were usable. Thus, for drivers, the “Without Beam” or “Before” group is comprised of model years 1992 and 1993, and the “After” years 1994 and 1995. For right front passengers, no data can be used for these vehicles, so “none” appears in the appropriate columns. For this report, if a vehicle underwent a major redesign, it was considered a different vehicle. This prevented differences due to structural changes from being attributed to the installation of side door beams. In some cases, more than one model year is listed as the first and/or last year produced. In such cases, some of the vehicles in question were manufactured over a slightly different span of model years. For example, Chevrolet C/K and GMC Sierra pickup trucks are similar enough to be considered the same vehicle. Because of differences within the model, however, they are listed in five groups in Exhibit 1. In model years 1995 and 1996, vehicles with a Gross Vehicle Weight Rating (GVWR) over 8,500 pounds in this group did not have air bags, while the lighter vehicles had driver air bags. In 1997, the lighter vehicles had dual air bags installed. The GVWR can be determined by the VIN in many cases, but not all. Thus, one group is known to have either driver or dual air bags in these model years (noted as (c) in the Exhibit), another is known to not have any (noted as (b)), and for the third group the presence of air bags is unknown (group (a)). For this third group, only model years 1993 (as “Before”) and 1994 (as “After”) can be used for both drivers and right front passengers, since beginning in 1995, air bag status is unknown. The same model years are usable for drivers in the group getting air bags in 1995 (c), since that is the model year the change is known. For right front passengers in this group, model years 1994 through 1996 can serve as the “After” years, since no change took place until 1997 for that seating position. For the group that did not have air bags installed until after 1997 (b), the full range of model years can be used (1990-1993 as “Before” and 1994-1997 as “After”) since air bags are absent in all these years. Production of C/K and Sierra regular cabs began production in 1988, and the crew cab in 1992. Note that for one of the groups (a), in the “1st Year Produced” column, the entry for two of the groups reads “88/92”. For this group, the difference in
8

production start does not affect the model years that can be used in this analysis, so they are combined for simplicity. This is not true for the other groups of C/K and Sierra pickups. Since the Crew Cabs were not produced until 1992, there are only two years of “Before” data available, at most, which would then allow “After” data only through 1995 at the latest. Some light trucks manufactured prior to model year 1993, such as the Ford Explorer and Pontiac TranSport, had side beams installed since they were first manufactured. Since there was no “Before” group available for comparison, these vehicles could not be included in the analysis. Other vehicles that did not begin production until model year 1994 or later, of course, had also always met the side impact standard, and were also excluded from the analysis. Effectiveness of Side Door Beams in Preventing Fatalities Since FARS contains only fatal crashes, it is not possible to determine fatality rates per 100 crash involved occupants. However, the data can be used to indirectly determine the relative fatality risk of pre- and post-standard light trucks. This was done by comparing occupant fatalities in side impacts to a control group not affected by FMVSS 214. These groups should be as similar as possible except for whatever effect FMVSS 214 would have. Since door beams were expected to improve vehicle safety in side impacts, and have no effect on purely frontal impacts, any improvements seen in side impacts relative to the frontal impacts would be attributable to the presence of side door beams. Frontal impacts are used as the control group in this analysis. Air bags were the only substantial safety change affecting frontal crashes that was implemented simultaneous with, or close to the installation of beams. As discussed in the preceding section, data were limited to model year ranges in which make-models either (1) were never equipped with air bags or (2) were always equipped with air bags. Note that, to keep up to four model years before and after the side door beams were installed, model years 1989 through 1997 would be used. Model year 1989 would apply only to those vehicles first getting side door beams in 1993 (e.g., Nissan pickup trucks). FARS data from calendar years 1989 through 2001 were used. In the analyses below, frontal impacts are used as the control group. Specifically, pure frontal impacts were used, meaning only those impacts at the direct 12 o’clock position. Impacts at the 11 and 1 o’clock position, while typically considered frontal impacts, would have a side impact component to them as well, which could be affected by the installation of side door beams. Therefore, such crashes were not included in the frontal/control group. Side impacts were those in the 2, 3, 4, 8, 9 and 10 o’clock positions. Generally, separate analyses were performed for single vehicle and multi-vehicle crashes. Single vehicle frontal impacts serve as the control for single vehicle side impacts, and multi-vehicle frontals for multi-vehicle side. Crashes were determined to be either single or multi-vehicle crashes based on the number of vehicle forms recorded in FARS. In addition, data were looked at by the location of the occupant in relation to which side of the truck was struck. Thus, analyses are performed separately for nearside and far side occupants, as well as for all occupants combined. In addition, tables show drivers and right front passengers separately, as well as all front outboard occupants combined.
9

10
Data are presented in four sets, from one to four years before and after beam installation. It would be preferable to limit the number of years examined, so that all vehicles in the analysis are as similar as possible, including age of vehicle. However, the additional usable data obtained by including vehicles up to four years before and after beam installation is worth examining. Using the Dodge Ram Van, the first row in Exhibit 1, as an example, the same vehicle was produced from 1985 through 1997. Thus, 1997 would be the last model year usable for this vehicle. Side door beams were first installed in 1994, which would then be the first “After” year. Any model years previous to this would be “Before.” Driver air bags were first installed in 1995, while front passenger air bags were not installed during the production of this vehicle (that is, at least before a major redesign). Since the first year of the “After” group was 1994, and air bags were installed for drivers in 1995, only one year of data for the “After” group was usable for drivers. For the first two analyses that follow (effectiveness based on Before vs After counts and changes in fatality rates), the same number of model years must be used for both the before and after groups. Therefore, for drivers for the Dodge Ram Van, 1993 serves as the only “Before” year, while 1994 serves as “After.” For right front passengers, the addition of air bags does not effect the usable model years. Therefore, data as late as the last year of production, 1997, were usable. The “After” years for right front passengers were then 1994 through 1997. The associated “Before” years were 1990 through 1993. Four years before and after side beam installation were the maximum span used, in an effort to control vehicle age from influencing the outcome. When data appear in later tables as “One year before and after,” all data within one year of side beam installation are included. Since all vehicles would require at least one “Before” and one “After” model year, this would necessarily include all models in the analysis. Columns labeled “Two/Three/Four years before and after” include data within the stated time span. For example, “Two years before and after” includes anything within two years of side beam installation. This includes all counts in the “One year before and after” group as well as data one model year beyond that in each direction (both “Before” and “After). Each successive number of years includes the previous smaller group(s). Data are separated into mutually exclusive crash types for side and frontal crashes. In some cases, occupants are separated into nearside or farside, in relation to the side of the vehicle on which the impact took place. Thus, a driver is a farside occupant when the impact is at the 2, 3, or 4 o’clock position (the passenger side), and a nearside occupant when the impact is at the 8, 9, or 10 o’clock position.
The previously described data were used to compare numbers of fatalities before side door beams were installed in light trucks to those vehicles with beams. Exhibit 2 presents data from FARS comparing single vehicle side and frontal crashes, and multi-vehicle side and frontal crashes. Each data point represents a front outboard fatality – data are presented first for all frontboard occupants combined (Exhibit 2a), and then separately for drivers (Exhibit 2b) and right front passengers (Exhibit 2c). The four pairs of columns contain data on vehicles one through four years before and after the introduction of side door beams. Each pair of columns (“No Beam” and “Beam”) shows the number of front outboard occupants with and without the
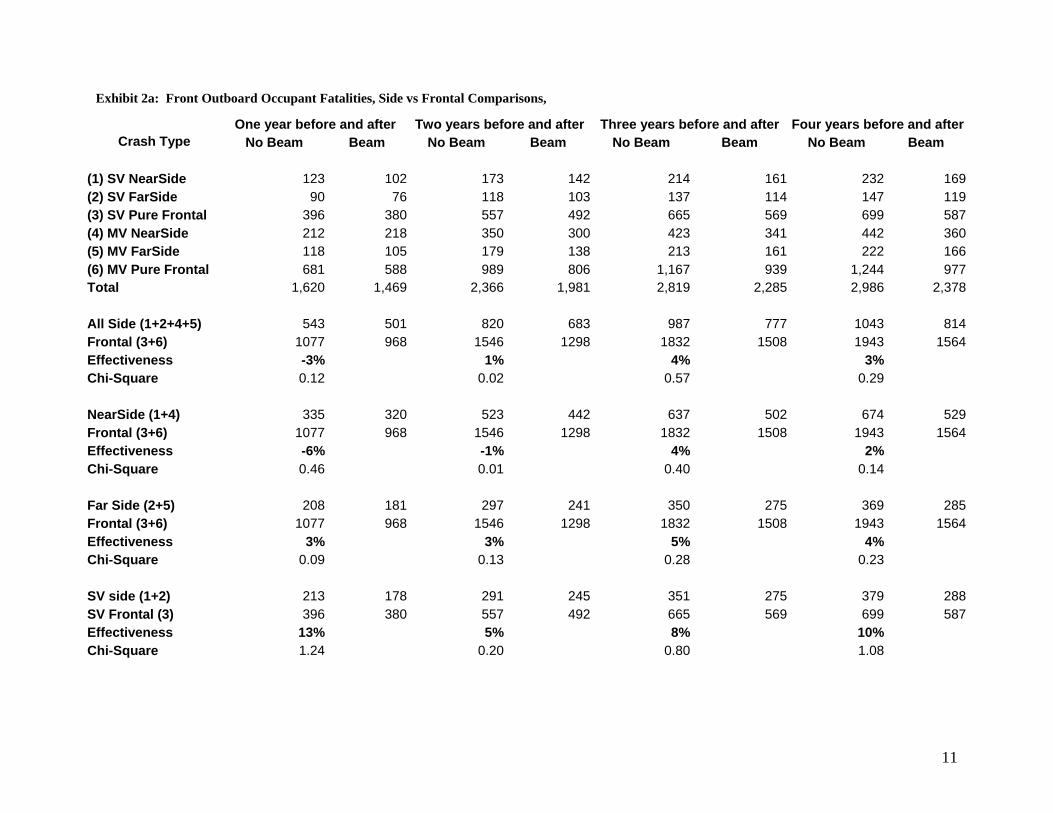
Exhibit 2a: Front Outboard Occupant Fatalities, Side vs Frontal Comparisons,
One year before and after Two years before and after Three years before and after Four years before and afterCrash Type No Beam Beam No Beam Beam No Beam Beam No Beam Beam
(1) SV NearSide 123
102 173 142 214 161 232 169(2) SV FarSide 90 76 118 103 137 114 147 119(3) SV Pure Frontal 396 380 557 492 665 569 699 587(4) MV NearSide 212 218 350 300 423 341 442 360(5) MV FarSide 118 105 179 138 213 161 222 166(6) MV Pure Frontal 681 588 989 806 1,167 939 1,244 977Total 1,620 1,469
2,366 1,981 2,819 2,285 2,986 2,378
All Side (1+2+4+5) 543 501 820 683 987 777 1043 814Frontal (3+6) 1077 968
1546 1298
1832 1508 1943 1564
Effectiveness -3% 1% 4% 3%Chi-Square
0.12 0.02 0.57 0.29
NearSide (1+4) 335 320 523 442 637 502 674 529Frontal (3+6) 1077 968
1546 1298
1832 1508 1943 1564
Effectiveness -6% -1% 4% 2%Chi-Square 0.46 0.01 0.40 0.14 Far Side (2+5) 208 181 297 241 350 275 369 285Frontal (3+6) 1077 968
1546 1298
1832 1508
1943 1564
Effectiveness 3% 3% 5% 4%Chi-Square 0.09 0.13 0.28 0.23 SV side (1+2) 213 178 291 245 351 275 379 288SV Frontal (3) 396 380
557 492
665 569 699 587
Effectiveness 13% 5% 8% 10%Chi-Square 1.24 0.20 0.80 1.08
11

12
Exhibit 2a continued: Front Outboard Occupant Fatalities, Side vs Frontal Comparisons,
One year before and after Two years before and after Three years before and after Four years before and afterCrash Type No Beam Beam No Beam Beam No Beam Beam No Beam Beam
SV NearSide (1) 123 102 173 142 214 161 232 169SV Frontal (3) 396 380
557 492
665 569
699 587
Effectiveness 14% 7% 12% 13%Chi-Square
0.92 0.32 1.17 1.51
SV Far Side (2) 90 76 118 103 137 114 147 119SV Frontal (3) 396 380
557 492 665 569 699 587
Effectiveness 12% 1% 3% 4%Chi-Square
0.56 0.01 0.04 0.07
MV Side (4+5) 330 323 529 438 636 502 664 526MV Frontal (6) 681 588
989 806 1167 939 1244 977
Effectiveness -13% -2% 2% -1%Chi-Square
1.69 0.04 0.07 0.01
MV Nearside (4) 212 218 350 300 423 341 442 360MV Frontal (6) 681 588
989 806 1167 939 1244 977
Effectiveness -19% -5% 0% -4%Chi-Square
2.45 0.30 0.00 0.19
MV Far Side (5) 118 105 179 138 213 161 222 166MV Frontal (6) 681 588
989 806 1167 939 1244 977
Effectiveness -3% 5% 6% 5%Chi-Square 0.04 0.20 0.30 0.20

Exhibit 2b: Driver Fatalities Only, Side vs Frontal Comparisons, One to Four Years Before and After Beams Installed
One year before and after Two years before and after Three years before and after Four years before and after Crash Type No Beam Beam No Beam Beam No Beam Beam No Beam Beam
(1) SV NearSide 87
65 112 82 124 89 128 90(2) SV FarSide 76 67 97 82 104 88 110 92(3) SV Pure Frontal 319 301 418 359 462 414 474 422(4) MV NearSide 165 161 246 203 265 222 271 228(5) MV FarSide 84 81 117 102 127 111 128 114(6) MV Pure Frontal 538 460 722 569 782 640 811 661Total 1,269 1,135
1,712 1,397 1,864 1,564 1,922 1,607
All Side (1+2+4+5) 412 374 572 469 620 510 637 524Frontal (3+6) 857 761
1140 928 1244 1054 1285 1083
Effectiveness -2% -1% 3% 2%Chi-Square
0.06 0.01
0.16
0.11
Nearside (1+4) 252 226 358 285 389 311 399 318Frontal (3+6) 857 761
1140 928 1244 1054 1285 1083
Effectiveness -1% 2% 6% 5%Chi-Square 0.01 0.06 0.45 0.42 Far Side (2+5) 160 148 214 184 231 199 238 206Frontal (3+6) 857 761
1140 928 1244 1054 1285 1083
Effectiveness -4% -6% -2% -3%Chi-Square 0.11 0.25 0.02 0.07 SV side (1+2) 163 132 209 164 228 177 238 182SV Frontal (3) 319 301
418 359 462 414 474 422
Effectiveness 14% 9% 13% 14%Chi-Square 1.16 0.51 1.41 1.63
13

14
Exhibit 2b continued: Driver Fatalities, Side vs Frontal Comparisons,
One year before and after Two years before and after Three years before and after Four years before and after Crash Type No Beam Beam No Beam Beam No Beam Beam No Beam Beam
SV Nearside (1) 87 65 112 82 124 89 128 90SV Frontal (3) 319 301
418 359 462 414 474 422
Effectiveness 21% 15% 20% 21%Chi-Square 1.64 0.97 2.07 2.39
SV Far Side (2) 76 67 97 82 104 88 110 92SV Frontal (3) 319 301
418 359 462 414 474 422
Effectiveness 7% 2% 6% 6%Chi-Square 0.13 0.01 0.13 0.16
MV Side (4+5) 249 242 363 305 392 333 399 342MV Frontal (6) 538 460 722 569 782 640 811 661Effectiveness -14% -7% -4% -5%Chi-Square 1.35 0.45 0.17 0.31
MV Nearside (4) 165 161 246 203 265 222 271 228MV Frontal (6) 538 460 722 569 782 640 811 661Effectiveness -14% -5% -2% -3%Chi-Square 1.07 0.17 0.05 0.09
MV Far Side (5) 84 81 117 102 127 111 128 114MV Frontal (6) 538 460 722 569 782 640 811 661Effectiveness -13% -11% -7% -9%Chi-Square 0.51 0.47 0.22 0.41

Exhibit 2c: RF Passenger Fatalities Only, Side vs Frontal Comparisons, One to Four Years Before and After Beams Installed
One year before and after Two years before and after Three years before and after Four years before and after Crash Type No Beam Beam No Beam Beam No Beam Beam No Beam Beam
(1) SV NearSide 36 37 61 60 90 72 104 79(2) SV FarSide 14 9 21 21 33 26 37 27(3) SV Pure Frontal 77 79 139 133 203 155 225 165(4) MV NearSide 47 57 104 97 158 119 171 132(5) MV FarSide 34 24 62 36 86 50 94 52(6) MV Pure Frontal 143 128 267 237 385 299 433 316Total 351 334 654 584 955 721 1,064 771 All Side (1+2+4+5) 131 127 248 214 367 267 406 290Frontal (3+6) 220 207 406 370 588 454 658 481Effectiveness -3% 5% 6% 2%Chi-Square 0.04 0.21 0.34 0.06 Nearside (1+4) 83 94 165 157 248 191 275 211Frontal (3+6) 220 207 406 370 588 454 658 481Effectiveness -20% -4% 0% -5%Chi-Square 1.07 0.11 0.00 0.20 Far Side (2+5) 48 33 83 57 119 76 131 79Frontal (3+6) 220 207 406 370 588 454 658 481Effectiveness 27% 25% 17% 18%Chi-Square 1.64 2.31 1.42 1.55 SV side (1+2) 50 46 82 81 123 98 141 106SV Frontal (3) 77 79 139 133 203 155 225 165Effectiveness 10% -3% -4% -3%Chi-Square 0.18 0.03 0.06 0.02
15

16
One year before and after Two years before and after Three years before and after Four years before and afterCrash Type No Beam Beam No Beam Beam No Beam Beam No Beam Beam
SV Nearside (1) 36 37 61 60 90 72 104 79SV Frontal (3) 77 79 139 133 203 155 225 165Effectiveness 0% -3% -5% -4%Chi-Square 0.00 0.02 0.06 0.04 SV Far Side (2) 14 9 21 21 33 26 37 27SV Frontal (3) 77 79 139 133 203 155 225 165Effectiveness 37% -5% -3% 0%Chi-Square 1.06 0.02 0.01 0.00 MV Side (4+5) 81 81 166 133 244 169 265 184MV Frontal (6) 143 128 267 237 385 299 433 316Effectiveness -12% 10% 11% 5%Chi-Square 0.31 0.49 0.82 0.17 MV Nearside (4) 47 57 104 97 158 119 171 132MV Frontal (6) 143 128 267 237 385 299 433 316Effectiveness -35% -5% 3% -6%Chi-Square 1.73 0.09 0.05 0.17 MV Far Side (5) 34 24 62 36 86 50 94 52MV Frontal (6) 143 128 267 237 385 299 433 316Effectiveness 21% 35% 25% 24%Chi-Square 0.66 3.50 2.24 2.18
Exhibit 2c: RF Passenger Fatalities Only, Side vs Frontal Comparisons, One to Four Years Before and After Beams Installed continued

beams by the crash type. In each section, side data are presented with the corresponding counts of pure frontal crashes (single or multi-vehicle). The section labeled “All Side” includes both single and multi-vehicle side impacts. For this portion of the analysis, FARS calendar year data from 1989 through 2001 was used. The data in Exhibit 2 are presented as:
Fatalities No Beam Beam Side N11 N12Frontal (Control Group) N21 N22
The ratio N22/N21 is an indirect measure of the likelihood of post-standard light truck crashes relative to pre-standard vehicles. It takes the differences of exposure and the effects of any other safety-related improvements into account. The actual number of post-standard side impact fatalities is N12. If the amended FMVSS 214 had no effect on side impacts, the expected number of fatalities in post-standard crashes would be N11 x (N22/N21).
The change in side crashes relative to the frontals would be:
21
22N
N11
12
1N
N
−
The equation above is a measure the amended standard in side impacts, and is
mathematically equivalent to the more easily computed: of the effectiveness of
Effectiveness = 1122
1NN
−
Note in Exhibits 2a and 2b that single vehicle side impacts consistently show the highest effectiveness levels. Specifically, single vehicle nearside impacts for drivers as well as all froutboard occupants combined show th
2112 NN
ont e highest effectiveness in each group of data (one to four
ears before and after), with point estimates (although not statistically significant) ranging from est at
ata for right front passengers are inconsistent, most likely due the small sample sizes involved. Far side impacts, particularly multi-vehicle far side, show the
re
y7 to 21 percent. This makes intuitive sense, in that one would expect the beam to be bprotecting the occupant closest to it. Fatalities in multi-vehicle crashes, as well as single vehicle far side impacts, show an inconsistent pattern across the number of years of included data. Driver fatalities actually increase in multi-vehicle side impacts, with point estimates ranging from a 2 to 14 percent increases, both near and far side. Dtogreatest improvements, ranging from 21 to 35 percent. None of these effectiveness estimates astatistically significant, however.
17

Results of chi-square tests are also shown for each comparison in Exhibit 2. With 1 degree of freedom (df) for each test, the chi-square value would need to be at least 3.841 to be statistically
gnificant at the 0.05 level. While none of these comparisons is statistically significant, there is
s s.
any make-models could not be used at all (see Exhibit 1). Another limitation of this analysis is to frontal impacts (and, thus, fatalities) may vary with vehicle age. If this is
e case, the differences in the side vs. frontal ratios presented may in part be due to a vehicle
ontrol group of frontal impacts. Performing an
dditional analysis, without relying on comparisons to frontal impacts, would provide additional
analysis does not compare side impact fatalities to frontals, it seems at first glance that ir bags are no longer a confounding factor and that it would be possible to use more data than
t is
m” . As in the previous section, model years 1990
rough 1997 were used in this portion of the analysis. Also note that, because of varying times
sia consistent effect of improved performance for single vehicle side impacts for drivers and combined front outboard passengers, both nearside and far side and for each on the ± 1, ± 2, ±3,
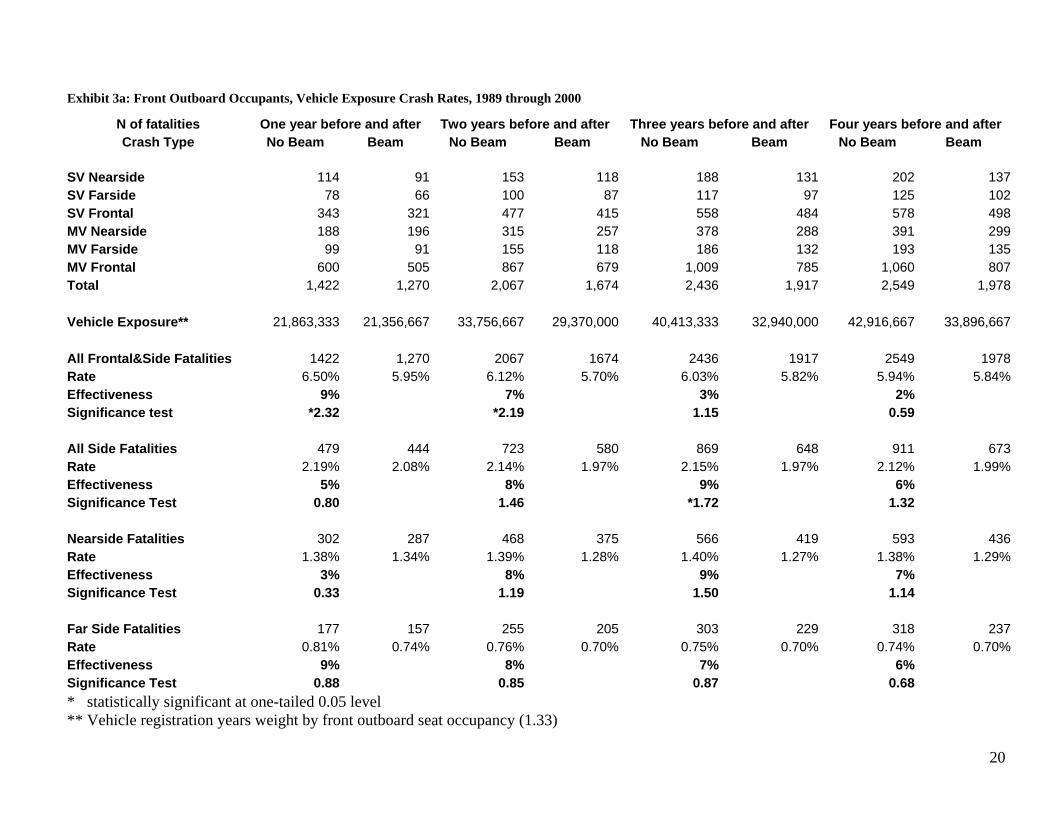
and ± 4 comparisons. This is consistent with the results for passenger cars (Kahane, 1982). The principal limitation of this analysis is that it had to be restricted to make-model year rangewhen make-models were (1) never equipped with air bags or (2) always equipped with air bagMthat the ratio of sidethage bias. In the section on regression analysis, vehicle age is one of the controlled variables. Exposure Data Although frontal fatalities appear to be a reasonable control group, it is possible that there couldactually be some unexpected change in the cainformation. One method is to calculate the side impact fatality rate per one thousand (1,000) registered vehicle years, for a given set of vehicles in a given calendar year. Registration data through calendar year 2000 were available. Since thisathe model year ranges shown in Exhibit 1. However, air bags can be effective in side impacts that have a frontal force component, and that especially includes many single-vehicle side impacts. The average side impact fatality rate per 1,000 vehicle years then can be determined using FARS calendar years 1989 through 2000. Rates for each crash type were determined by dividing the appropriate number of fatalities by the vehicle exposure (number of registered vehicle years) divided by 1,000. The registration years from the Polk data are adjusted, for this analysis, by front-seat occupancy rates. Since the driver’s seat is always occupied, and the right-front seaoccupied about one-third of the time, each vehicle registration year corresponds to one driver year, 0.33 right front passenger years, and 1.33 front-seat occupant years. Effectiveness was then determined by subtracting the rate for the “Beam” data from the rate for the “Before Beadata, and dividing by the “Before Beam” ratethduring the calendar year that a vehicle would be manufactured, counts were not used in whichthe model year was equal to the calendar year. This results in more standardized data across various manufacturers and different models. The exposure data and fatality rates are presented in Exhibit 3a-c. FARS counts differ fromthose in Exhibit 2 in a number of ways. Since registration data were only available through model year 2000, vehicle data had to be limited through model year 2000 rather than 2001 as
18

19
y as
eights of Chevrolet C/K and GMC Sierra pickups) that had different usable model years of data
-third, ht front passengers typically found in relation to drivers. Data
”).
3 for the change in fatality rate after side door beams ere installed. Since the fatality rate per one thousand registered vehicles is a Poisson
distribution divided by a constant, the standard deviation is the square root of the number of fatalities divided by the constant. Significance i hus determined first by calculating the
could be used in Exhibit 2. In addition, registration data cannot be separated as specificallvehicle data that contains the VIN. Therefore, where similar vehicles (such as the variouswcould not be distinguished, the smallest set of usable model years had to be utilized to avoid including vehicles with modifications such as air bag installations. Finally, as mentioned previously, data in which the model year was equal to the calendar year were eliminated. All front outboard occupants are shown in Exhibit 3a, drivers in 3b, and right front passengers in 3c. Recall that, because of differing years in which driver and right front passenger air bags were initially installed, the models years useable for drivers were not always the same as those for right front passengers. Because of this, vehicle exposure counts are not identical for drivers and right front passengers. In addition, since a driver is always present in a vehicle, but a passenger is not, the exposure counts must be adjusted in order for the rates for drivers and passengers to be comparable. Therefore, the counts for exposure were multiplied by oneto approximate the number of rigat the top of the exhibit are the numbers of occupant fatalities by type of crash; the vehicle exposure numbers are separated by pre- and post-standard vehicles (“No Beam” and “BeamAs before, data are presented in four sets, from within one to four years before and after installation of side door beams. Significance tests are provided in Exhibit w
s tstandard deviation of each population as:
RNsi =
here sw
beami is the standard deviation of the distribution either before (i=b) or after (i=a) side door
s were installed, N is the number of fatalities in the crash type of interest (either before or after side beams), and R is the associated number Since the rates presented in Exhibit 3 are per one housand vehicle miles, the constant is 1,000.
( ) ( )22ab sss =
b is the standard deviation (as calculated above) for the fatalities “Before” and sa the
standard deviation for fatalities “After.” Significance is then tested as
srr
z ab −=
of registered vehicles divided by a constant. t
The use of a constant does not influence the results of significance testing. The standard deviation of the difference between the two rates is then:
where s
+
20
Exhibit 3a: Front Outboard Occupants, Vehicle Exposure Crash Rates, 1989 through 2000
N of fatalities One year before and after Two years before and after Three years before and after Four years before and after Crash Type No Beam Beam No Beam Beam No Beam Beam No Beam Beam
SV Nearside 114 91 153 118 188 131 202 137SV Farside 78 66 100 87 117 97 125 102SV Frontal 343 321 477 415 558 484 578 498MV Nearside 188 196 315 257 378 288 391 299MV Farside 99 91 155 118 186 132 193 135MV Frontal 600 505 867 679 1,009 785 1,060 807Total 1,422 1,270 2,067 1,674 2,436 1,917
2,549 1,978
Vehicle Exposure** 21,863,333 21,356,667 33,756,667 29,370,000 40,413,333 32,940,000
42,916,667 33,896,667
All Frontal&Side Fatalities 1422 1,270 2067 1674 2436 1917 2549 1978Rate 6.50% 5.95% 6.12% 5.70% 6.03% 5.82% 5.94% 5.84% Effectiveness 9% 7% 3% 2% Significance test *2.32 *2.19 1.15 0.59 All Side Fatalities 479 444 723 580 869 648 911 673Rate 2.19% 2.08% 2.14% 1.97% 2.15% 1.97% 2.12% 1.99% Effectiveness 5% 8% 9% 6% Significance Test 0.80 1.46 *1.72 1.32 Nearside Fatalities 302 287 468 375 566 419 593 436Rate 1.38% 1.34% 1.39% 1.28% 1.40% 1.27% 1.38% 1.29% Effectiveness 3% 8% 9% 7% Significance Test 0.33 1.19 1.50 1.14 Far Side Fatalities 177 157 255 205 303 229 318 237Rate 0.81% 0.74% 0.76% 0.70% 0.75% 0.70% 0.74% 0.70% Effectiveness 9% 8% 7% 6% Significance Test 0.88 0.85 0.87 0.68 * statistically significant at one-tailed 0.05 level ** Vehicle registration years weight by front outboard seat occupancy (1.33)

21
Exhibit 3a continued: Front Outboard Occupants, Vehicle Exposure Crash Rates, 1989 through 2000
One year before and after Two years before and after Three years before and after Four years before and after SV side Fatalities 192 157 253 205 305 228 327 239Rate 0.88% 0.74%
0.75% 0.70% 0.75% 0.69% 0.76% 0.71%
Effectiveness 16% 7% 8% 7% Significance Test *1.66 0.76 0.99 0.92
SV Nearside Fatalities 114 91 153 118 188 131 202 137Rate 0.52% 0.43%
0.45% 0.40% 0.47% 0.40% 0.47% 0.40%
Effectiveness 18% 11% 15% 14% Significance Test 1.44 0.99 1.39 1.39
SV Far Side Fatalities 78 66 100 87 117 97 125 102Rate 0.36% 0.31%
0.30% 0.30% 0.29% 0.29% 0.29% 0.30%
Effectiveness 13% 0% -2% -3% Significance Test 0.86 0.00 -0.12 -0.24
MV Side Fatalities 287 287 470 375 564 420 584 434Rate 1.31% 1.34%
1.39% 1.28% 1.40% 1.28% 1.36% 1.28%
Effectiveness -2% 8% 9% 6% Significance Test -0.28 1.25 1.41 0.96
MV Nearside Fatalities 188 196 315 257 378 288 391 299Rate 0.86% 0.92%
0.93% 0.88% 0.94% 0.87% 0.91% 0.88%
Effectiveness -7% 6% 7% 3% Significance Test -0.64 0.77 0.87 0.42
MV Far Side Fatalities 99 91 155 118 186 132 193 135Rate 0.45% 0.43%
0.46% 0.40% 0.46% 0.40% 0.45% 0.40%
Effectiveness 6% 13% 13% 11% Significance Test 0.42 1.10 1.23 1.09 * statistically significant at one-tailed 0.05 level

22
Exhibit 3a continued: Front Outboard Occupants, Vehicle Exposure Crash Rates, 1989 through 2000
One year before and after Two years before and after Three years before and after Four years before and after All Frontal Crash Fatalities 943 826 1,344 1,094 1,567 1,269 1,638 1,305Rate 4.31% 3.87% 3.98% 3.72% 3.88% 3.85% 3.82% 3.85%Effectiveness 10% 6% 1% -1%Significance Test *2.29 1.64 0.17 -0.23 SV Frontal Fatalities 343 321 477 415 558 484 578 498
Rate 1.57% 1.50% 1.41% 1.41% 1.38% 1.47% 1.35% 1.47%Effectiveness 4% 0% -6% -9%Significance Test 0.55 0.00 -1.00 -1.42 MV Frontal Fatalities 600 505 867 679 1,009 785 1,060 807Rate 2.74% 2.36% 2.57% 2.31% 2.50% 2.38% 2.47% 2.38%Effectiveness 14% 10% 5% 4%Significance Test *2.47 *2.06 0.98 0.79* statistically significant at one-tailed 0.05 level

23
Exhibit 3b: Drivers, Vehicle Exposure Crash Rates, 1989 through 2000
N of fatalities One year before and after Two years before and after Three years before and after Four years before and after Crash Type No Beam
Beam
No Beam
Beam
No Beam
Beam
No Beam
Beam
SV Nearside 81 56 104 69 116 76 119 76SV Farside 64 57 80 69 87 75 91 79SV Frontal 277 253 364 304 404 354 405 359MV Nearside 149 143 228 172 246 184 247 187MV Farside 68 69 99 86 108 92 109 93MV Frontal 469 394 635 488 691 548 698 557Total 1,108 972 1,510 1,188 1,652 1,329
1,669 1,351
Vehicle Exposure** 15,690,000 15,500,000 23,000,000 19,860,000 25,510,000 21,470,000
26,060,000 21,890,000
All Frontal&Side Fatalities 1108 972 1510 1188 1652 1329 1669 1351Rate 7.06% 6.27% 6.57% 5.98% 6.48% 6.19% 6.40% 6.17% Effectiveness 11% 9% 4% 4% Significance Test *2.71 *2.41 1.23 1.01 All Side Fatalities 362 325 511 396 557 427 566 435Rate 2.31% 2.10% 2.22% 1.99% 2.18% 1.99% 2.17% 1.99% Effectiveness 9% 10% 9% 9% Significance Test 1.25 1.62 1.46 1.40 Nearside Fatalities 230 199 332 241 362 260 366 263Rate 1.47% 1.28% 1.44% 1.21% 1.42% 1.21% 1.40% 1.20% Effectiveness 12% 16% 15% 14% Significance Test 1.37 *2.07 *1.97 *1.95 Far Side Fatalities 132 126 179 155 195 167 200 172Rate 0.84% 0.81% 0.78% 0.78% 0.76% 0.78% 0.77% 0.79% Effectiveness 3% 0% -2% -2% Significance Test 0.28 -0.03 -0.16 -0.23 * statistically significant at one-tailed 0.05 level ** Vehicle registration years

24
Exhibit 3b continued: Drivers, Vehicle Exposure Crash Rates, 1989 through 2000
One year before and after
Two years before and after
Three years before and after
Four years before and after
SV side Fatalities 145 113 184 138 203 151 210 155 Rate 0.92% 0.73% 0.80% 0.69% 0.80% 0.70% 0.81% 0.71% Effectiveness 21% 13% 12% 12% Significance Test *1.90 1.26 1.16 1.23 SV Nearside Fatalities 81 56 104 69 116 76 119 76 Rate 0.52% 0.36% 0.45% 0.35% 0.45% 0.35% 0.46% 0.35% Effectiveness 30% 23% 22% 24% Significance Test *2.07 *1.72 *1.72 *1.89 SV Far Side Fatalities 64 57 80 69 87 75 91 79 Rate 0.41% 0.37% 0.35% 0.35% 0.34% 0.35% 0.35% 0.36% Effectiveness 10% 0% -2% -3% Significance Test 0.57 0.01 -0.15 -0.21 MV Side Fatalities 217 212 327 258 354 276 356 280 Rate 1.38% 1.37% 1.42% 1.30% 1.39% 1.29% 1.37% 1.28% Effectiveness 1% 9% 7% 6% Significance Test 0.12 1.09 0.96 0.83 MV Nearside Fatalities 149 143 228 172 246 184 247 187 Rate 0.95% 0.92% 0.99% 0.87% 0.96% 0.86% 0.95% 0.85% Effectiveness 3% 13% 11% 10% Significance Test 0.25 1.34 1.22 1.08 MV Far Side Fatalities 68 69 99 86 108 92 109 93 Rate 0.43% 0.45% 0.43% 0.43% 0.42% 0.43% 0.42% 0.42% Effectiveness -3% -1% -1% -2% Significance Test -0.16 -0.04 -0.09 -0.11 * statistically significant at one-tailed 0.05 level

25
Exhibit 3b continued: Drivers, Vehicle Exposure Crash Rates, 1989 through 2000
One year before and after Two years before and after Three years before and after Four years before and after All Frontal Crash Fatalities 746 647 999 792 1,095 902 1,103 916 Rate 4.75% 4.17% 4.34% 3.99% 4.29% 4.20% 4.23% 4.18% Effectiveness 12% 8% 2% 1% Significance Test *2.43 *1.80 0.48 0.26 SV Frontal Fatalities 277 253 364 304 404 354 405 359 Rate 1.77% 1.63% 1.58% 1.53% 1.58% 1.65% 1.55% 1.64% Effectiveness 8% 3% -4% -6% Significance Test 0.90 0.43 -0.55 -0.74 MV Frontal Fatalities 469 394 635 488 691 548 698 557 Rate 2.99% 2.54% 2.76% 2.46% 2.71% 2.55% 2.68% 2.54% Effectiveness 15% 11% 6% 5% Significance Test *2.38 *1.94 1.04 0.90 * statistically significant at one-tailed 0.05 level

26
Exhibit 3c: RF Passenger Fatalities, Vehicle Exposure Crash Rates, 1989 through 2000
N of fatalities One year before and after Two years before and after Three years before and after Four years before and after Crash Type No Beam Beam No Beam
Beam No Beam Beam No Beam Beam
SV Nearside 33 35 49 49 72 55 83 61SV Farside 14 9 20 18 30 22 34 23SV Frontal 66 68 113 111 154 130 173 139MV Nearside 39 53 87 85 132 104 144 112MV Farside 31 22 56 32 78 40 84 42MV Frontal 131 111 232 191 318 237 362 250Total 314 298 557 486 784 588 880 627 Vehicle Exposure** 6,173,333 5,856,667 10,756,667 9,510,000 14,903,333 11,470,000 16,856,667 12,006,667 All Frontal&Side Fatalities 314 298 557 486 784 588 880 627Rate 5.09% 5.09%
5.18% 5.11% 5.26% 5.13% 5.22% 5.22%
Effectiveness 0% 1% 3% 0% Significance Test 0.00 0.21 0.47 -0.01
All Side Fatalities 117 119 212 184 312 221 345 238Rate 1.90% 2.03%
1.97% 1.93% 2.09% 1.93% 2.05% 1.98%
Effectiveness -7% 2% 8% 3% Significance Test -0.53 0.18 0.95 0.38
Nearside Fatalities 72 88 136 134 204 159 227 173Rate 1.17% 1.50%
1.26% 1.41% 1.37% 1.39% 1.35% 1.44%
Effectiveness -29% -11% -1% -7% Significance Test -1.59 -0.89 -0.12 -0.67 Far Side Fatalities 45 31 76 50 108 62 118 65Rate 0.73% 0.53%
0.71% 0.53% 0.72% 0.54% 0.70% 0.54%
Effectiveness 27% 26% 25% 23% Significance Test 1.38 1.64 *1.88 *1.70 * statistically significant at one-tailed 0.05 level ** Vehicle registration years weighted by right-front seat occupancy (0.33)

27
Exhibit 3c continued: RF Passenger Fatalities, Vehicle Exposure Crash Rates, 1989 through 2000
One year before and after Two years before and after Three years before and after Four years before and after SV side Fatalities 47 44 69 67 102 77 117 84 Rate 0.76% 0.75% 0.64% 0.70% 0.68% 0.67% 0.69% 0.70% Effectiveness 1% -10% 2% -1% Significance Test
0.06 -0.55
0.13 -0.06
SV Nearside Fatalities 33 35 49 49 72 55 83 61 Rate 0.53% 0.60% 0.46% 0.52% 0.48% 0.48% 0.49% 0.51% Effectiveness -12% -13% 1% -3% Significance Test
-0.46 -0.61
0.04 -0.19
SV Far Side Fatalities 14 9 20 18 30 22 34 23 Rate 0.23% 0.15% 0.19% 0.19% 0.20% 0.19% 0.20% 0.19% Effectiveness 32% -2% 5% 5% Significance Test
0.92 -0.05
0.17 0.19
MV Side Fatalities 70 75 143 117 210 144 228 154 Rate 1.13% 1.28% 1.33% 1.23% 1.41% 1.26% 1.35% 1.28% Effectiveness -13% 7% 11% 5% Significance Test
-0.73 0.62 1.08 0.51
MV Nearside Fatalities 39 53 87 85 132 104 144 112 Rate 0.63% 0.90% 0.81% 0.89% 0.89% 0.91% 0.85% 0.93% Effectiveness -43% -11% -2% -9% Significance Test
-1.70 -0.65
-0.18 -0.69
MV Far Side Fatalities 31 22 56 32 78 40 84 42 Rate 0.50% 0.38% 0.52% 0.34% 0.52% 0.35% 0.50% 0.35% Effectiveness 25% 35% 33% 30% Significance Test 1.05 *2.01 *2.16 *1.94 * statistically significant at one-tailed 0.05 level

28
Exhibit 3c continued: RF Passenger Fatalities, Vehicle Exposure Crash Rates, 1989 through 2000
One year before and after Two years before and after Three years before and after Four years before and after All Frontal Crash Fatalities 197 179 345 302 472 367 535 389Rate 3.19% 3.06%
3.21% 3.18% 3.17% 3.20% 3.17% 3.24%
Effectiveness 4% 1% -1% -2% Significance Test 0.42 0.13 -0.15 -0.31
SV Frontal Fatalities 66 68 113 111 154 130 173 139Rate 1.07% 1.16%
1.05% 1.17% 1.03% 1.13% 1.03% 1.16%
Effectiveness -9% -11% -10% -13% Significance Test -0.48 -0.79 -0.77 -1.05
MV Frontal Fatalities 131 111 232 191 318 237 362 250Rate 2.12% 1.90%
2.16% 2.01% 2.13% 2.07% 2.15% 2.08%
Effectiveness 11% 7% 3% 3% Significance Test 0.88 0.73 0.38 0.38 * statistically significant at one-tailed 0.05 level

where rb is the fatality rate before side beams, and ra the rate after. Values above 1.65 are considered statistically significant at the 0.05 level in these one-tailed tests. The majority of front outboard occupants in Exhibit 3a are drivers, and thus the data are similar to Exhibit 3b, which includes drivers only. Results in both of these exhibits show statistically significant decreases in fatality rates for “All crashes” after side door beams are installed, within one to two years of beam installation, ranging from 7 to 11 percent. Single vehicle side impact fatalities were reduced a statistically significant 16 percent for front outboard occupants within one year of beam installation. Single vehicle nearside impact fatalities were reduced 11 to 18 percent and, while not statistically significant, were generally the largest reductions for each group of front outboard occupants. In addition, the “all” frontal as well as multi-vehicle frontal fatality rates had a statistically significantly decrease within one to two years of adding the side beams, for front outboard occupants as well as drivers alone. The results in frontal impacts likely have more to do with the installation of anti-lock braking systems than to side door beams. For drivers only, all four years of single vehicle nearside fatality rates had statistically significant decreases after beams were installed, with reductions ranging from 22 to 30 percent. These are generally higher than any other effects shown in Exhibit 3b. Reductions for all nearside fatalities (which includes both multi- and single vehicle) ranged from 12 to 16 percent. Comparisons using data two or more years beyond the installation of the beams were statistically significant. In contrast, changes in single vehicle frontal fatality rates never exceeded ± 8 percent. Right front passengers seem to demonstrate a different pattern, as shown in Exhibit 3c. Multi-vehicle far side fatality rates showed statistically significant decreases when more than one year of data for each group was used, ranging from 30 to 35 percent. Within one year of beam installation, multi-vehicle far side fatalities decreased a non-statistically significant 25 percent. In addition, the “all” far side fatality rates decreased from 23 to 27 percent for right front passengers, statistically significant when three or four years of data were used. Significance tests are dependent on sample size, which clearly is influencing the results for these small samples of right front passengers. The vehicles without side beams are, in general, older vehicles, and tend to be overrepresented in crashes. “All” and single vehicle frontal crashes also show improvement for front outboard occupants, particularly for drivers. Although not statistically significant, multi-vehicle frontal fatalities were reduced for right front passengers after beam installation. This is important as fatalities in frontal impact were used as the control in the previous analysis. Any rate comparisons would need to take these tendencies into account. The following regression analysis enables this to be accomplished.
Regression Analysis A logistic regression analysis would enable the full range of model years to be used in analyzing the ratio of side to frontal crash fatalities. In the previous analyses, if the number of model years of usable data was restricted for either the “Before” or “After” group because of air bag or production limitations, the other group was likewise restricted, in order to keep the counts and rates consistent. Using regression, vehicles can simply be coded as “Before” or “After” without
29

restricting the dataset. Vehicle age can be entered as an additional variable in order to control for possible bias. Thus, regression allows the data to be analyzed without the age bias as well as increase the number of vehicles in the dataset. Most important, “Air bag” can be included as a control variable. This permits adding make-models that were equipped with side beams and air bags simultaneously, and using the full range of model years even if air bags were first installed during those years. The preceding analyses of the effectiveness of side door beams may have contained a bias against the amended standard, since the post-standard vehicles are newer than those manufactured before the standard took effect. Newer vehicles have a higher ratio of side to frontal impacts than do older vehicles (Kahane, 1982, p 253). Thus, a higher ratio of side to frontal crashes would be expected in the post-standard trucks without any changes in the vehicles themselves. This could possibly mask the effect of the side door beams, working against their possible reduction in side impact fatalities. Therefore, it is important to control for the vehicle age effect. Because of year-to-year changes in roads and demographics, calendar year is also another potential variable that could influence analysis results. However, these two variables (vehicle age and calendar year) are clearly related to one another, which could cause a problem if both are used in a regression analysis. As calendar year increases, obviously vehicle age also increases for the same model year. Since they vary together, what is actually related to one of the variables could possibly be attributed to the other one. This co-linearity is a potential problem for the analysis. Looking at the effect each of these two variables actually has on fatality crash data will help determine each one’s relative importance in the analysis. Because it is an attribute of crashes that is being determined, and not anything specifically related to the installation of side door beams, it is unnecessary to limit the data to specific makes or model years. In fact, for a larger and more descriptive sample, passenger cars can be included. Exhibit 4 presents passenger vehicle fatalities in single vehicle crashes (nearside and pure frontal impacts) by calendar year. Passenger vehicles include passenger cars as well as light trucks, vans, and SUVs. An effect value is calculated for each calendar year relative to the year 1997, which serves as the comparison year in the regression analyses to follow. The effect value is determined as:
⎟⎟⎟⎟
⎠
⎞
⎜⎜⎜⎜
⎝
⎛
=
cFNN
NN
lnEffectc
i
i
S
F
S
where NSi is the number of fatalities in nearside impacts in year i NFi is the number of fatalities in frontal impacts in year i NSc is the number of fatalities in nearside impacts in 1997 NFc is the number of fatalities in frontal impacts in 1997 Although the present study concerns only light trucks, passenger cars are included in the data for this exhibit to increase the sample size, in order to get a more representative view of any possible
30

calendar year effect. In addition, a wider span of model years is also included to increase the sample size. Exhibit 4: Model Year 1985 through 2001 Passenger Vehicle Fatalities
SV Nearside
SV Pure Frontal Effect
1989 664 1,515 0.1221990 757 1,734 0.1181991 861 1,837 0.1891992 828 1,999 0.0651993 912 2,171 0.0791994 995 2,293 0.1121995 1,164 2,706 0.1031996 1,291 2,874 0.1461997 1,200 3,092 0.0001998 1,270 3,134 0.0431999 1,395 3,106 0.1462000 1,402 3,391 0.0632001 1,409 3,489 0.040
Note that the effect column shows neither a strong effect nor a trend. The ratio of single vehicle nearside impacts relative to frontals does not consistently increase, nor is there a particularly strong effect in any given year or set of years. Exhibit 5 presents the effect information as calculated above for additional vehicle and model year combinations. Data from Exhibit 4 are repeated for ease of comparison, in the final column. Exhibit 5 presents columns for light trucks alone as well as for all passenger vehicles. In addition, data for the limited set of model years that will be usable for the regression analysis (1989 through 1997) are presented in addition to the wider span of model years used above. For all data sets, 1997 serves as the comparison year. Note that, regardless of the set of vehicles or model years included, there is no trend to the data, nor is there any particular calendar year or years that stands out as being particularly strong. The possible exceptions might be the earlier few calendar years where light trucks only are included. The data for these cells, however, is rather sparse. For example, for calendar year 1989, there is a total of 121 fatalities when model year 1989 through 2000 are included, 37 in single vehicle nearside crashes and 84 in frontal. In comparison, there are over 1,300 fatalities for calendar year 2001 in the same dataset. Although there are higher effects noted for some of these earlier years, it is likely this is a spurious result of the small amount of data available. Similar calculations can be performed for the vehicle age factor. Exhibit 6 presents, for the same data used above, effect values by vehicle age. Four-year-old vehicles were arbitrarily chosen as the reference set, to be somewhat consistent with the tables above. Note, however, that for either set of model years used and either set of vehicles, there is a strong, persistent vehicle age effect. Exhibit 6 clearly shows that, as vehicles age, there is a much higher proportion of fatalities in frontal impacts relative to side impacts, shown by the higher, negative entries in the effect
31
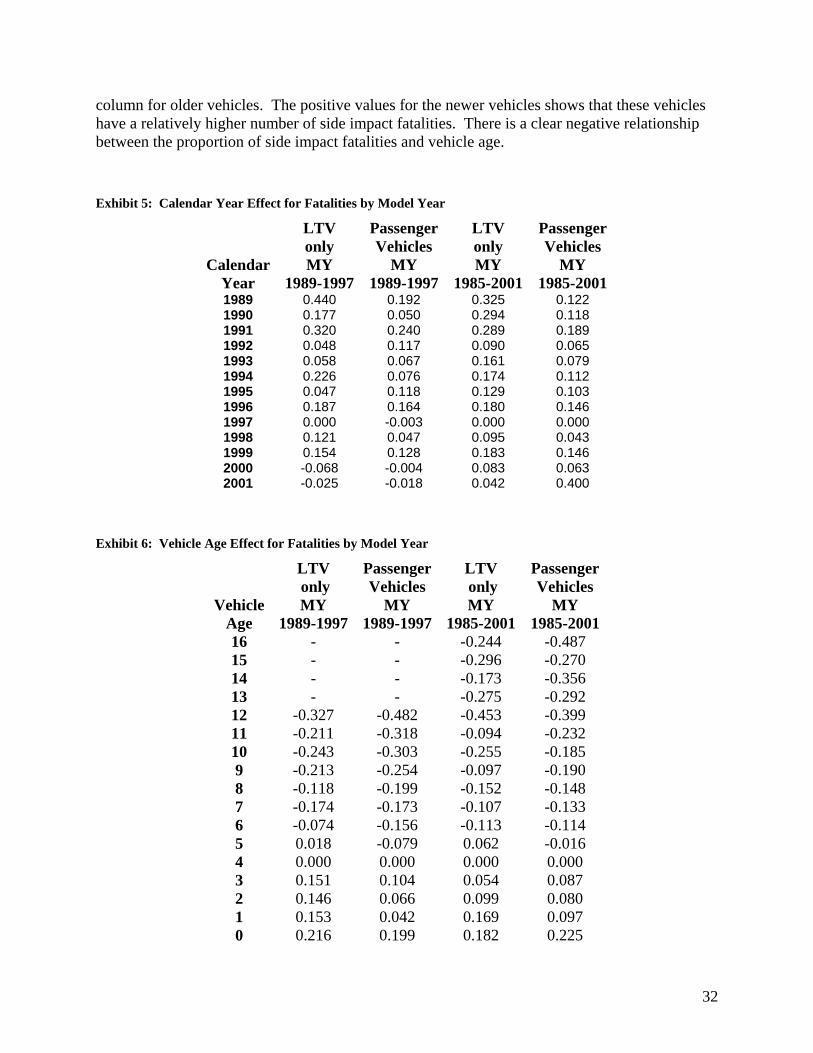
column for older vehicles. The positive values for the newer vehicles shows that these vehicles have a relatively higher number of side impact fatalities. There is a clear negative relationship between the proportion of side impact fatalities and vehicle age. Exhibit 5: Calendar Year Effect for Fatalities by Model Year
LTV only
Passenger Vehicles
LTV only
Passenger Vehicles
Calendar Year
MY 1989-1997
MY 1989-1997
MY 1985-2001
MY 1985-2001
1989 0.440 0.192 0.325 0.122 1990 0.177 0.050 0.294 0.118 1991 0.320 0.240 0.289 0.189 1992 0.048 0.117 0.090 0.065 1993 0.058 0.067 0.161 0.079 1994 0.226 0.076 0.174 0.112 1995 0.047 0.118 0.129 0.103 1996 0.187 0.164 0.180 0.146 1997 0.000 -0.003 0.000 0.000 1998 0.121 0.047 0.095 0.043 1999 0.154 0.128 0.183 0.146 2000 -0.068 -0.004 0.083 0.063 2001 -0.025 -0.018 0.042 0.400
Exhibit 6: Vehicle Age Effect for Fatalities by Model Year
LTV only
Passenger Vehicles
LTV only
Passenger Vehicles
Vehicle Age
MY 1989-1997
MY 1989-1997
MY 1985-2001
MY 1985-2001
16 - - -0.244 -0.487 15 - - -0.296 -0.270 14 - - -0.173 -0.356 13 - - -0.275 -0.292 12 -0.327 -0.482 -0.453 -0.399 11 -0.211 -0.318 -0.094 -0.232 10 -0.243 -0.303 -0.255 -0.185 9 -0.213 -0.254 -0.097 -0.190 8 -0.118 -0.199 -0.152 -0.148 7 -0.174 -0.173 -0.107 -0.133 6 -0.074 -0.156 -0.113 -0.114 5 0.018 -0.079 0.062 -0.016 4 0.000 0.000 0.000 0.000 3 0.151 0.104 0.054 0.087 2 0.146 0.066 0.099 0.080 1 0.153 0.042 0.169 0.097 0 0.216 0.199 0.182 0.225
32

The effect columns in Exhibits 5 and 6 show what one would expect as the maximum likelihood estimate in a logistic regression. Given that there may be colinearity issues between the calendar year and vehicle age variables, and knowing that there is a true and strong effect of vehicle age on the data, a logistic regression is first presented without including calendar year in the model. While it would be advantageous to be able to control for this as well, the potential problems that might arise could outweigh the benefits of its inclusion. The dependent variable in this regression analysis is the damage location, coded to represent either side damage or frontal damage. If side beams were effective in preventing side impact fatalities, then one would expect relatively fewer side impact fatalities in relation to frontal impact fatalities. The probability modeled is that the damage location is side and not frontal. In addition, the variable in the model representing the presence of the beams should be statistically significant, indicating that the beams play a definitive role in the reduction of fatalities in side impacts relative to those in frontals. The independent variables used were: BEAM = 1 if vehicle was equipped with side door beam, 0 otherwise AB = 1 if air bag equipped in that vehicle at that seating position, 0 otherwise ABS = 1 if vehicle was equipped with four-wheel antilock brake system, 0 otherwise RWAL = 1 if vehicle was equipped with rear-wheel antilock brake system, 0 otherwise RFPASS = 1 if the seating position was right front passenger, 0 if driver FEMALE = 1 if the occupant was female, 0 if male AGE = age of the occupant AGE_SQD to account for possible nonlinearity of the age effect VEHAGE = age of the vehicle BRANDNEW = 1 if vehicle was less than a year old at the time of the crash, 0 otherwise BELT = 1 if occupant was restrained with a safety belt, 0 otherwise CURBWT = curb weight of truck SUV = 1 if the vehicle was a sport utility vehicle, 0 otherwise VAN=1 if the vehicle was a van, 0 otherwise FOURWD = 1 if vehicle has four-wheel (or all-wheel) drive, 0 otherwise
33

Note that there is no separate variable for pickup trucks. Vans and utility vehicles are coded as above, while pickups would have a value of ‘0’ on both variables. Thus, all vehicle types are defined. Exhibit 7 presents parameter estimates for the logistic regression for single vehicle nearside impact fatalities relative to single vehicle frontal fatalities, using the set of independent variables above. This is the type of crash most likely to benefit from the presence of the side door beams. Data from calendar years 1989 through 2001 were included. Again, the regression procedure allows a larger sample size than the previous methodologies, since data before and after beam installation do not have to be matched for such situations as presence of air bags or years of production. The number of observations in the single vehicle nearside regression, 3,559 (2,760 frontal and 799 side impacts), is much larger than the 1687 observations (1,286 frontal and 401 side) for four years before and after in Exhibit 2a, or the 339 nearside fatalities used to compute the four-year exposure rates in exhibit 3a. The overall chi-square for the model for all crashes was 151.5173, with a probability below 0.0001. Results of chi-square tests are also shown for each comparison in Exhibit 7. With 1 degree of freedom (df) for each test, the chi-square value would need to be at least 3.841 to be statistically significant at the 0.05 level. Parameter estimates with a chi-square probability less than 0.05 are set in bold in Exhibit 7. This shows that the presence of side door beams is associated with statistically significantly decreases in the proportion of single-vehicle nearside fatalities. In addition, note that the vehicle age is statistically significant, which would be expected given the data previously presented. Exhibit 7: Maximum Likelihood Estimates, Logistic Regression without Calendar Year Variables
Parameter SV Nearside
Chi-Square
Intercept -1.4273 17.57BEAM -0.2901 7.27AB 0.3440 6.83ABS 0.1150 0.35RWAL -0.2237 2.02RFPASS 0.6453 34.61FEMALE 0.1388 1.56AGE 0.0167 1.99AGE_SQD -0.0004 8.39VEHAGE -0.0500 7.59BRANDNEW 0.0142 0.01BELT 0.4152 18.97CURBWT 0.0001 1.82SUV -0.2348 2.15VAN -0.3852 6.58FOURWD -0.0675 0.37
Bold entries are statistically significant at 2-tailed chi-square, α=0.05 level.
The reduction in fatalities due to effectiveness, or beam installation, can be calculated as
34

35
E
ffectiveness = be−1 where b is the estimate for beam in the regression equation. These values are also reported as the odds ratio estimate in the regression model. For single vehicle nearside impacts, this would be
Effectiveness = = 0.2518 2901.01 −− e Thus, the effectiveness of beams in single vehicle nearside impacts is estimated to be 25 percent. That is, with side door beams you have a 25 percent lower chance of fatality as compared to a pre-standard light truck, in a single vehicle nearside impact, using frontal crashes as controls for both groups. The vehicle age effect of –0.05 is statistically significant, consistent with the data shown in Exhibit 6. There is a definite trend for the proportion of side impacts to decrease (relative to frontal impacts) as vehicle age increases. The fact that both the vehicle age and beam estimates in Exhibit 7 are negative reflects the fact that, for both factors, side impacts decrease relative to frontal impacts due to the effect of each factor. Exhibit 8 presents the data for various crash types (all crashes combined, as well as separated by single or multi-vehicle, near or far-side crash) including single vehicle nearside crashes as has been shown above in Exhibit 7, for drivers and right front passengers combined. In addition, the estimated effectiveness of the beam (as calculated above) and the Chi-square value (Beam X2) for the beam estimate are reported. In the final rows of each table, standard error (Beam s) and the sample size for side impact fatalities (N side imp fatalities) are presented. Since earlier analyses showed differences between drivers and right front passengers, analyses will also be presented separately by seat position. Exhibit 9 shows the same model and crash types for drivers only, and Exhibit 10 for right front passengers only. Exhibits 9 and 10 have no RFPASS variable, since within those analyses observations do not vary by seat position. The statistically significant value of 0.6453 for RFPASS in Exhibit 8 reflects the fact that crash type prevalence varies by seating position. Recall that the dependent variable for the regression model is the proportion of side to frontal fatalities. Since the estimate is coded as being a passenger, and has a positive value, the interpretation is that the proportion of single vehicle nearside impact fatalities to frontal fatalities for right front passengers is greater than it is for drivers. Note that this has no bearing on the effect of the beam by seat position. The regression analysis shows that beams are effective for drivers alone and in combination with right front passengers in single vehicle side impacts, particularly those on the nearside. The fatality reduction in single vehicle crashes attributed to the beams was 19 percent for both drivers alone and for all front outboard occupants. The reduction in fatalities credited to beams in single vehicle nearside impacts was 26 percent for drivers alone (Exhibit 9) and 25 percent for all front outboard passengers, as compared to single vehicle frontal impacts. All four of these effectiveness estimates are statistically significant. Although not statistically significant, the reduction for right front passengers alone was 18 percent for all single vehicle crashes, and 17 percent for single vehicle nearside crashes, certainly consistent with the other regression findings. These data show that equipping light trucks with side door beams has been effective in preventing fatalities in single vehicle nearside crashes, but has had little effect in multi-vehicle

Exhibit 9: Maximum Likelihood Estimates by Crash Type, Drivers Only
Parameter All
Side SV
Side MV Side
SV Nearside
MV Nearside
SV Farside
MV Farside
Intercept -0.0839 -0.8425 -0.0128 -1.6272 -0.8006 -1.5071 -0.4241BEAM -0.0765 -0.2070 0.0484 -0.3056 0.0251 -0.0901 0.0895AB 0.3141 0.1392 0.3987 0.3357 0.4043 -0.1255 0.4060ABS -0.0513 0.2569 -0.2455 0.0478 -0.4785 0.5360 0.1742RWAL -0.1549 -0.2187 -0.0898 -0.2812 -0.2369 -0.1415 0.1971FEMALE 0.4030 0.2129 0.5020 0.1531 0.5370 0.2361 0.4260AGE -0.0276 0.0132 -0.0312 0.0200 -0.0297 0.0085 -0.0333AGE_SQD 0.0003 -0.0003 0.0004 -0.0004 0.0004 -0.0002 0.0004VEHAGE -0.0287 -0.0328 -0.0261 -0.0581 -0.0266 -0.0042 -0.0253BRANDNEW -0.0641 -0.0762 -0.0433 -0.0842 0.0135 -0.0949 -0.1616BELT 0.0004 0.0407 -0.0417 0.4504 0.1128 -0.5888 -0.3620CURBWT 0.0001 0.0001 -0.0001 0.0002 0.0000 0.0001 -0.0003SUV 0.0759 -0.2950 0.3794 -0.1362 0.5244 -0.5027 0.0950VAN -0.2779 -0.3525 -0.2331 -0.2699 -0.3397 -0.4859 -0.0494FOURWD -0.0293 -0.0337 -0.0502 -0.1067 -0.0902 0.0493 0.0056Effectiveness 0.07 0.19 -0.05 0.26 -0.03 0.09 -0.09Beam X2 1.57 4.21 0.38 5.65 0.08 0.46 0.57Beam s 0.0611 0.1009 0.0780 0.1285 0.0903 0.1334 0.1183N side imp fatalities 2,789 1,096 1,693 590 1,107 506 586
Exhibit 8: Maximum Likelihood Estimates by Crash Type, Drivers and Right Front Passengers
Parameter All
Side SV
Side MV Side
SV Nearside
MV Nearside
SV Farside
MV Farside
Intercept 0.0308 -0.7368 0.2196 -1.4273 -0.4224 -1.5276 -0.4500BEAM -0.0915 -0.2150 0.0163 -0.2901 0.0210 -0.1163 -0.0073AB 0.3027 0.1643 0.3455 0.3440 0.2865 -0.0820 0.4808ABS -0.0090 0.2609 -0.1477 0.1150 -0.2504 0.4929 0.0712RWAL -0.1080 -0.1694 -0.0457 -0.2237 -0.1542 -0.0867 0.1933RFPASS 0.1929 0.2590 0.1360 0.6453 0.1680 -0.3794 0.0637FEMALE 0.3562 0.2072 0.4337 0.1388 0.4212 0.2836 0.4596AGE -0.0223 0.0107 -0.0273 0.0167 -0.0265 0.0069 -0.0273AGE_SQD 0.0002 -0.0003 0.0004 -0.0004 0.0004 -0.0002 0.0004VEHAGE -0.0314 -0.0356 -0.0290 -0.0500 -0.0250 -0.0186 -0.0358BRANDNEW -0.0052 -0.0216 0.0134 0.0142 0.0974 -0.1150 -0.1526BELT 0.0118 0.0601 -0.0221 0.4152 0.1175 -0.5311 -0.3234CURBWT -0.0001 0.0001 -0.0002 0.0001 -0.0001 0.0001 -0.0003SUV 0.0636 -0.3378 0.3709 -0.2348 0.4239 -0.5144 0.2503VAN -0.2126 -0.4194 -0.0912 -0.3852 -0.0900 -0.5097 -0.1134FOURWD 0.0188 -0.0143 0.0168 -0.0675 -0.0013 0.0477 0.0415Effectiveness 0.09 0.19 -0.02 0.25 -0.02 0.11 0.01Beam X2 3.03 6.01 0.06 7.27 0.08 0.92 0.01Beam s 0.0526 0.0877 0.0667 0.1076 0.0765 0.1215 0.1015N side imp fatalities 3,633 1,376 2,257 799 1,495 577 762
Bold entries are statistically significant at 2-tailed chi-square, α=0.05 level
36

crashes. There may possibly be an effect in single vehicle far side crashes – none of the results were statistically significant, but they consistently show positive results, particularly for right front passengers (for whom the impact would be on the driver’s side). The significance of the Van and SUV variables is of some interest. Remember that, for each of these variables, the type of vehicle is compared to pickup trucks. The statistically significant value of –0.3852 for VAN in Exhibit 8 denotes that Vans experience a smaller proportion (since the coefficient is negative) of single vehicle nearside impact fatalities relative to frontal fatalities than do pickup trucks. Looking at all side impacts, both vans and SUV’s have a statistically significant negative coefficient, showing they have relatively fewer side impacts than frontals, when compared to pickup trucks. Again, this has no reflection on the effectiveness of the beam in different vehicle types, only the pattern of crashes resulting in fatalities. In order to shed some light on whether the beams vary in effectiveness by type of vehicle, separate regression analyses were run for vans, pickup trucks, and SUVs, for single vehicle side impacts as well as single vehicle nearside impacts. The beam variable was statistically significant only for the group of pickup trucks, most likely a function of sample size, since there were far more pickup trucks in the sample than vans or SUVs. The number of single vehicle side impact fatalities in pickups was 1059, while there were only 177 in SUVs and 140 in vans.
Exhibit 10: Maximum Likelihood Estimates by Crash Type, Right Front Passengers Only
Parameter All Side
SV Side
MV Side
SV Nearside
MV Nearside
SV Farside
MV Farside
Intercept 0.6979 -0.1114 0.9949 -0.2403 0.7278 -2.1715 -0.3849BEAM -0.1065 -0.1969 -0.0330 -0.1871 0.0776 -0.2799 -0.2319AB -0.0254 -0.0963 -0.1243 -0.1202 -0.3953 0.1933 0.4378ABS 0.0455 0.3405 -0.0350 0.3639 0.0807 0.3969 -0.3781RWAL -0.0041 0.0589 0.0254 -0.0306 0.0049 0.4034 0.0827FEMALE 0.3441 0.1969 0.4406 0.1384 0.3833 0.3745 0.5809AGE -0.0078 -0.0003 -0.0105 0.0022 -0.0077 0.0015 -0.0160AGE_SQD 0.0000 -0.0002 0.0001 -0.0003 0.0000 -0.0001 0.0002VEHAGE -0.0435 -0.0495 -0.0401 -0.0235 -0.0219 -0.1315 -0.0742BRANDNEW 0.1572 0.2243 0.1573 0.3777 0.2977 -0.2843 -0.1700BELT 0.0800 0.2290 0.0493 0.3780 0.1311 -0.1453 -0.1756CURBWT -0.0003 0.0000 -0.0004 0.0000 -0.0005 0.0002 -0.0003SUV 0.0432 -0.5687 0.4230 -0.5785 0.2960 -0.6602 0.7171VAN 0.0253 -0.8001 0.3074 -0.8571 0.4904 -0.6942 -0.1106FOURWD 0.1981 0.0979 0.2521 0.0807 0.3132 0.1685 0.1644Effectiveness 0.10 0.18 0.03 0.17 -0.08 0.24 0.21Beam X2 0.99 1.10 0.06 0.81 0.26 0.84 1.32Beam s 0.1070 0.1879 0.1334 0.2086 0.1516 0.3049 0.2015N side imp fatalities 844 280 564 209 388 71 176 Bold entries are statistically significant at 2-tailed chi-square, α=0.05 level.
37

Also of interest to note in the regression analysis is that, for drivers alone or in combination with right front passengers, the air bag variable (AB) was statistically significant in most of the crash types, particularly multi-vehicle crashes, while the variables representing antilock brake system (ABS and RWAL) were statistically significant in only a small number of crash configurations and less consistently. This increases confidence in previous analyses, in which changes in air bag configurations were accounted for but antilock brakes were not. Seating position, gender, restraint use and occupant age appear to be important factors to take into account. Exhibit 11 presents an alternative model on the same set of data, but includes a set of dummy variables to control for calendar year. As in Exhibit 4, 1997 is used as the comparison year. Thus, the variable named CY1989 represents the effect of calendar year 1989, relative to 1997. The same is true for the remaining calendar year variables. Since each year is compared to 1997, no variable is needed for the Exhibit 11: Maximum Likelihood Estimates, Logistic Regression with Calendar Year Variables
Parameter SV Nearside
Intercept -2.1040BEAM -0.0869AB 0.4042ABS 0.2143RWAL -0.2175RFPASS 0.6559FEMALE 0.1341AGE 0.0162AGE_SQD -0.0004VEHAGE 0.0242BRANDNEW -0.0071BELT 0.4339CURBWT 0.0001SUV -0.2894VAN -0.4207FOURWD -0.0720CY1989 0.4423CY1990 0.6609CY1991 0.7896CY1992 0.4754CY1993 0.5622CY1994 0.4935CY1995 0.3491CY1996 0.3362CY1998 -0.0360CY1999 0.1595CY2000 -0.0225CY2001 -0.1303
Bold entries have chi-square probability less than 0.05
38

year 1997. First note that the effect of the beam is no longer statistically significant. Because side door beams were not present for a number of years, and were then installed in either 1993 or 1994, calendar year would strongly relate to the presence of beam. Clearly, as years passed, a larger proportion of the light truck fleet would be equipped with the beams, potentially crediting calendar year (or ‘time’) with some portion of the changes due to the presence of beams. Note the entry for vehicle age, which is not statistically significant in this model, contrary to the evident trends shown in Exhibits 6 and 8. In addition, several of the individual calendar years are statistically significant, notably the two years in which side door beams were introduced. This differs sharply from the data presented in Exhibit 4, which showed the actual calendar year effects observed in the data. The effects for calendar year in this model are much stronger than those exhibited in the data. For example, the estimate of the effect for calendar year 1993 is a statistically significant 0.5622. This is much larger than the effect of 0.079 shown for 1993 in Exhibit 4. This model gives results contradictory to that which has been seen in earlier analyses. This is clearly not the best fitting model for the data. An alternative method would be to represent calendar year as a linear variable, rather than as dummy variables. Exhibit 12 presents the results of that regression, using the earliest calendar year (1989) as the year zero. Exhibit 12: Maximum Likelihood Estimates, Logistic Regression with Linear Calendar Year
Parameter SV Nearside
Intercept -1.3085BEAM -0.0952AB 0.3912ABS 0.2217RWAL -0.2033RFPASS 0.6521FEMALE 0.1411AGE 0.0168AGE_SQD -0.0004VEHAGE 0.0212BRANDNEW -0.0017BELT 0.4251CURBWT 0.0001SUV -0.2827VAN -0.4103FOURWD -0.0761CALYR -0.0759
Bold entries have chi-square probability less than 0.05 Note that, although the calendar year variable is not statistically significant, it continues to interact with other variables, resulting in output that is counterintuitive. Again, beam as well as vehicle age are not statistically significant. If the inclusion of calendar year is overpowering the
39

beam variable, additional knowledge could be gained by restricting the data to only those calendar years after the beams were installed. Exhibit 13 presents data for three additional regression models – without calendar year, with calendar year dummy variables, and with calendar year as a linear variable – using only data from calendar year 1994 and later, but still including the full range of model years from 1989 through 1997. Again, only when the calendar year variables are removed is the vehicle age factor statistically significant. As was previously demonstrated, the vehicle age factor is both a stronger factor and more meaningful to this analysis than calendar year. Exhibit 13: Maximum Likelihood Estimates Using Calendar Year 1994-2001 Data,
Single Vehicle Nearside Fatalities
Parameter No CY
Variable
Linear CY
Variable
Dummy CY
Variable Intercept -1.3076 -1.1874 -1.7299 BEAM -0.2984 -0.2024 -0.2066 AB 0.3582 0.3835 0.3944 ABS 0.0640 0.1194 0.1233 RWAL -0.3553 -0.3481 -0.3469 RFPASS 0.6235 0.6280 0.6319 FEMALE 0.1322 0.1332 0.1289 AGE 0.0129 0.0128 0.0130 AGE_SQD -0.0004 -0.0004 -0.0004 VEHAGE -0.0427 -0.0051 -0.0062 BRANDNEW 0.1758 0.1646 0.1471 BELT 0.4573 0.4624 0.4695 CURBWT 0.0001 0.0001 0.0001 SUV -0.2820 -0.3133 -0.3182 VAN -0.4940 -0.5119 -0.5202 FOURWD -0.0517 -0.0554 -0.0515 CALYR - -0.0447 -1.7299 CY1989 - - -0.2066 CY1990 - - 0.3944 CY1991 - - 0.1233 CY1992 - - -0.3469 CY1993 - - 0.6319 CY1994 - - 0.1289 CY1995 - - 0.0130 CY1996 - - -0.0004 CY1998 - - -0.0062 CY1999 - - 0.1471 CY2000 - - 0.4695 CY2001 - - 0.0001
Bold entries have chi-square probability less than 0.05
40
When calendar year is included in the model, the obtained estimates for the calendar year variable are stronger than is warranted by the actual data. This inflated importance is due to its colinearity with other, more important, variables in the model, particularly vehicle age and presence of the side door beam. Because of this, the regression model without a calendar year factor provides more meaningful results, and therefore would be considered the best model. Best Estimates of Effectiveness Overall, when changes in the fatality rate in side impacts were compared to those in frontal impacts (Exhibits 2a-c), drivers alone or in combination with right front passengers saw the greatest improvement in single vehicle nearside crashes. Improvements in effectiveness for drivers alone ranged from 15 to 21 percent, while in combination with right front passengers the effectiveness ranged from 7 to 14 percent. Effectiveness estimates for drivers in single vehicle far side crashes ranged from 2 to 7 percent. Single vehicle side impacts in general saw improvements, ranging from 9 to 14 percent for drivers alone, and 5 to 13 percent in combination with right front passengers. Right front passengers alone generally experienced the greatest effectiveness in multi-vehicle far side crashes, ranging from 21 to 35 percent. For one year before and after beam installation, the effectiveness was 37 percent, but improvements were not seen with the increased data. Far side crashes in general experienced high effectiveness for right front passengers, ranging from 17 to 27 percent. While several of these effectiveness rates are quite high, none of them were found to be statistically significant. Several statistical tests on the exposure data (Exhibits 3a-c) did, however, show statistically significant results. For drivers alone, nearside fatalities showed effectiveness rates ranging from 12 to 15 percent, three of the four sets of data (using one to four years of data before and after initial beam installation) being statistically significant. Effectiveness in preventing single vehicle nearside driver fatalities was statistically significant in all sets of data, ranging from 22 to 30 percent. Far side fatalities improved for right front passengers, with effectiveness estimates ranging from 23 to 27 percent and showing significance when three or four years of pre/post beam installation data were used. Multi-vehicle far side fatalities also improved for right front passengers, with effectiveness rates ranging from 25 to 35 percent, statistically significant when more than one year of before and after data was used. The regression analyses (Exhibits 8 through 10) produce similar but more precise effectiveness estimates. As can be seen by comparing the estimates for “BEAM” in Exhibit 8, as well as Exhibits 9 and 10, the strength of the beam variable is similar to what was seen in the previous analyses of effectiveness and exposure. The addition of side door beams is associated with a statistically significant lowering of side impact fatalities relative to frontal impacts for drivers alone as well as combined with right front passengers in all single vehicle side as well as single vehicle nearside impacts. Right front passengers alone saw no statistically significant effect due to the beam for any type of crash, but the point-estimates for single-vehicle nearside impacts were similar to those for drivers. There were no statistically significant effects for the addition of the beam in any of the multi-vehicle crashes. The regression analysis allowed several factors to be investigated at the same time, such as seat position, presence of air bag, and vehicle age, which could have affected the previous two
41

42
analyses. While the first two analyses are more easily understood in terms of changing numbers of fatalities or fatality rates, the regression analysis is the most important, since it combines more information. In addition, the regression procedure allows a larger sample size, since data before and after beam installation do not have to be matched for such situations as presence of air bags or years of production. The regression analysis compares how each factor influences the change in side impacts relative to frontal impacts. Because the regression model is able to control for important factors influencing crash rates, as well as permitting a larger sample size than the other analyses, the resulting effectiveness estimate would be considered the best, in terms of representing fatalities prevented due to the installation of side door beams. Two “best” effectiveness estimates will be considered. First, an overall reduction of 19 percent for all single-vehicle side impacts, including near- and far side. In addition, a more conservative estimate of 25 percent reduction of nearside single-vehicle fatalities only, with no effect assumed in the far side crashes. Confidence bounds can be calculated for these estimates using the formula
where b is the estimate for beam in the regression equation and s is the standard error of the estimate. For single vehicle nearside impacts, the value is calculated using –0.2901 as the estimate for beam and 0.1076 as the standard error, as shown in Exhibit 8. Thus, the beams are 25 percent effective in preventing front outboard fatalities, with a confidence band of 8 to 39 percent. Little effect was found in multi-vehicle crashes. It is possible that the beam is also effective in single vehicle far side crashes. While data here showed no statistical significance, typically they showed positive results. The best effectiveness estimate of reducing fatalities in these crashes would be 11 percent, with a lower confidence bound of –13 percent and an upper limit of 30 percent. This band contains zero effect, and even includes a negative effect, reflected in the fact that this value was not statistically significant. Overall, fatalities to front outboard occupants were reduced about 19 percent in all single vehicle side impacts, with a confidence band of 4 to 32 percent (using –0.2150 as the beam estimate and a standard error of 0.0877). Lives Saved by Side Door Beams Using 19 percent as the estimate of the effectiveness of preventing side impact front outboard occupant fatalities in single vehicle crashes, the annual number of lives saved by side door beams can be determined. During calendar years 1999 through 2002, there were 1,210 front outboard fatalities in single vehicle side impacts in vehicles without a side door beam, and 1,594 fatalities in those with the beams. This is an annual average of 303 fatalities without the beams and 399 with them. Since some fatalities were prevented by vehicles having the beams, this number needs to first be adjusted to determine the potential number of fatalities had none of the vehicles been equipped with beams. Using the formula
sbe *96.11 ±−
)1(1
0 eN
N bb −+

where is the number of fatalities in vehicles without side door beams, is the number of fatalities in vehicles with side door beams and e is the effectiveness estimate (0.19 in this case), the number of fatalities had no vehicles been equipped with beams is determined to be 796. This was calculated as
0bN1bN
79619.01
399303 =−
+
Given the current mix of vehicles with and without beams, an average of 94 lives were saved annually over the years 1999 through 2002, calculated from the 796 potential fatalities minus the 702 (303 without beams and 399 with them) actual fatalities. This is based on the average effectiveness of beams in both far and nearside impacts, which is then applied on the total of both far and nearside fatalities. Nineteen percent of the 796 potential fatalities could have been prevented if all light trucks on the road had been equipped with side door beams. Thus, 151 lives would be saved annually because of the beams. Using the confidence bands determined in the previous section, a 95 percent confidence interval can be determined for this estimate of lives saved. Using the formula above, but substituting the lower bound of 4 percent (in place of the 19 percent estimate) results in a lower limit of 29 lives saved, calculated as
2904.01
39930304.0 =⎟⎠⎞
⎜⎝⎛
−+×
Using the upper bound of 32 percent provides an upper limit of 285 lives saved, calculated as
28532.01
39930332.0 =⎟⎠⎞
⎜⎝⎛
−+×
Looking only at single vehicle nearside impacts, the above formula can be used with the effectiveness estimate of 25 percent. Since there was an annual average of 242 front outboard nearside fatalities with beams and 172 without, this is calculated as:
49525.01
242172 =−
+
Of these 495 potential fatalities, 25 percent could have been saved if all vehicles had side door beams, resulting in 124 lives saved. Again, 95 percent confidence bands can be determined for this estimate also, calculated as above using a lower bound of 8 percent and an upper bound of 39 percent. These are calculated as
3549508.01
24217208.0 =⎟⎠⎞
⎜⎝⎛ =
−+×
and
43

22239.01
24217239.0 =⎟⎠⎞
⎜⎝⎛
−+×
This results in a confidence band around the estimate of 124 ranging from 35 to 222 lives saved in single vehicle nearside impacts.
44

References Final Regulatory Impact Analysis: New Requirements for Passenger Cars to Meet a Dynamic Side Impact Test FMVSS 214. U.S. Department of Transportation, National Highway Traffic Safety Administration, Office of Regulatory Analysis, Washington, D.C., August, 1990. Final Regulatory Impact Analysis Extension of FMVSS 214 Quasi-static Test Requirements to Truck, Buses, and Multi-purpose Passenger Vehicles with a Gross Vehicle Weight Rating of 10,000 Pounds or Less. U.S. Department of Transportation, National Highway Traffic Safety Administration, Office of Regulatory Analysis, Washington, D.C., May, 1991. Kahane, C.J. An Evaluation of Side Structure Improvements in Response to Federal Motor Vehicle Safety Standard 214. NHTSA Technical Report Number HS 806 314. U.S. Department of Transportation, National Highway Traffic Safety Administration, Washington, D.C., November, 1982. Kahane, C.J. An Evaluation of Standard 214. NHTSA Technical Report Number HS 804 858. National Technical Information Service, Springfield, Virginia, 1979. Kahane, C.J. Evaluation of FMVSS 214 Side Impact Protection Dynamic Performance Requirement. NHTSA Technical Report Number HS 809 004. U.S. Department of Transportation, National Highway Traffic Safety Administration, Washington, D.C., October, 1999.
45