create wollondilly
TRANSCRIPT
RESOURCING STRATEGY
Suite of Documents Include - Delivery Program 2017/18 - 2020/21 | Operational Plan 2017/18 | Community Strategic Plan 2033
Long Term Financial Plan 2017/18 -2026/27 | Asset Management Strategy 2017/18 -2026/27 | Workforce Planning Strategy 2017/18 -2020/21
Create WOLLONDILLY

CreateWOLLONDILLY“Growth, development and change is inevitable and much of the time, out of control. What we can control is how we respond to it and the direction that it takes. The challenge for Wollondilly's future will be ‘balance’ between the past, the present and the future. Wollondilly is unique. It is Sydney's water bowl and a large part of its food bowl. It's a beautiful rural setting and rural lifestyle with towns and villages, a strong sense of community, a rich and diverse environment including green space, rolling hills, rivers, lakes, mountains, heritage and agriculture. The challenge for Wollondilly will be the preservation of these treasured aspects of living in our Shire. I want our future generations to still have these views, to enjoy what we have now and what we possibly take for granted. Once it's gone, it's gone. You can't get it back.”Karen Burgess, Winner Create Wollondilly Art Competition (16 years and older category)
CONTENTS
Introduction .............................................................................................................. 07Integrated Planning and Reporting Framework ......................................... 08Create Wollondilly - Community Strategic Plan 2033: 5 Themes ....... 10Strategic Projects Summary ............................................................................. 12 Your Councillors ..................................................................................................... 14Your Wards ............................................................................................................... 16Executive and General Manager Message ................................................. 18
SECTION 1 - LONG TERM FINANCIAL PLANIntroduction .............................................................................................................. 22Planning Assumptions ......................................................................................... 24Sensitivity Analysis ................................................................................................ 28Scenarios .................................................................................................................. 31
Performance Monitoring ..................................................................................... 51
SECTION 2 - ASSET MANAGEMENT STRATEGY
Executive Summary ........................................................................... 59Introduction ....................................................................................... 60Asset Management ........................................................................... 62Critical Council Assets ...................................................................... 64Transport - Roads .............................................................................. 66Active Transport ................................................................................ 70Buildings ............................................................................................ 72Parks and Open Space ..................................................................... 74Stormwater Drainage ........................................................................ 76Assessment and Prioritisation Criteria ............................................... 78Service Level Agreements ................................................................ 79Risk Management .............................................................................. 80Information Systems .......................................................................... 81Asset Management Review ............................................................... 82Asset Management Improvement Planning ...................................... 82Asset Management Resources ......................................................... 83
Asset Management Summary ........................................................... 83
SECTION 3 - WORKFORCE PLANNING STRATEGY
Introduction ....................................................................................... 87
Snap Shot of Our Workforce ............................................................. 88
What Are The Challenges Facing our Workforce? ............................. 97
Where Do We Want to Be? ................................................................ 100
Workforce SWOT Analysis ................................................................. 102
What is Important to Our Employees? ............................................... 104
How Do We Get There? ..................................................................... 107
How Do We Know We Have Arrived? ................................................ 118

The Wollondilly Resourcing Strategy consists of three components:
Long Term Financial Plan shows the way Council proposes to manage its financial commitments and maintain financial sustainability. This plan focuses on Council's long term financial goal of financial sustainability and delivering quality services to the Community. This plan addresses areas that impact the Council's ability to fund its services and capital works, whilst living within its means and ensuring financial sustainability.
Asset Management Strategy provides the information needed to plan for future management of assets and identifies ways to fund the repair and upkeep of current assets. This strategy is a reflection of Council's intention that our Community's infrastructure network and services are maintained in partnership with other levels of Government and stakeholders to meet the needs of local residents.
INTRODUCTIONThe Resourcing Strategy focuses in detail on matters that are the responsibility of Council in relation to implementing the Community Strategic Plan Create Wollondilly 2033.
The Strategy is informed by Council’s business planning documents – the four-year Delivery Program and one-year Operational Plan and has been prepared in accordance with the requirements of the State Government’s Integrated Planning and Reporting Framework.
Workforce Management Strategy outlines how our staff will achieve the community’s long term goals and objectives under the Wollondilly Community Strategic Plan and Delivery Program. This Strategy ensures that we have the right resources, programs and strategies to overcome the identified workforce challenges now and into the future. This includes managing growth and resourcing provision, local government reform and continuous improvement, ageing workforce and investment in skills, attraction and retention and opportunities for leadership capability.
Together, these strategies will support the achievement of the strategic projects identified in Council’s Delivery Program. A summary of these projects are detailed on pages 12-13.
“A PLACE TO LIVE and work that values the inherent beauty of the Shire, is proud of its community and supports innovation and inclusiveness.” Residents vision for Wollondilly in 2033
Create W
ollondilly - Resourcing S
trategy
76
Cre
ate
Wol
lond
illy
- R
esou
rcin
g S
trate
gy

• Long Term Financial Plan
• Workforce Management Strategy
• Asset Management Strategy
•
• Tourism Strategy• Local Environmental Plan• Growth Management Strategy• Economic Development Strategy • Disability Inclusion Action Plan• Social Planning Strategy• Smart City Plan• Information and Communications
Technology Strategy
DELIVERY PROGRAM
4 YEARS
OPERATIONAL PLAN 1 YEAR
Perpetual Monitoring and Review
OTHER STATES PLANS AND STRATEGIES
PREMIER'S PRIORITIES
DRAFT DISTRICT PLAN
Wollondilly COMMUNITY
STRATEGIC PLAN 10+ YEARS
RESOURCING STRATEGY
OTHER STRATEGIC PLANS
COMMUNITYENGAGEMENT
ANNUAL REPORT
INTEGRATED PLANNING AND REPORTING FRAMEWORK
The Integrated Planning and Reporting (IP&R) Framework for NSW Councils is another name for what most of us would call “corporate planning”. Under the IP&R framework, Councils need to prepare a CSP as their highest level long term plan. The CSP expresses the aspirations held by the community of Wollondilly and sets strategies for achieving those aspirations.
Supporting the CSP is a Resourcing Strategy which is made up of:• A 10 year Long Term Financial Plan;• A 4 year Workforce Management Strategy; and • A 10 year Asset Management Strategy.
Council then prepares a 4 year Delivery Program (which outlines Council’s commitment to the implementation of the CSP and which is aligned with the 4 year term of Council). Council’s annual Operational Plan is included as part of the 4-year Delivery Program.
Although the CSP is a long term strategic document it is reviewed on a 4-yearly rolling cycle to align with the incoming Council. It is therefore an important document to set and guide the direction of an elected Council during its electoral term.
Create W
ollondilly - Resourcing S
trategy
9
Cre
ate
Wol
lond
illy
- R
esou
rcin
g S
trate
gy
8
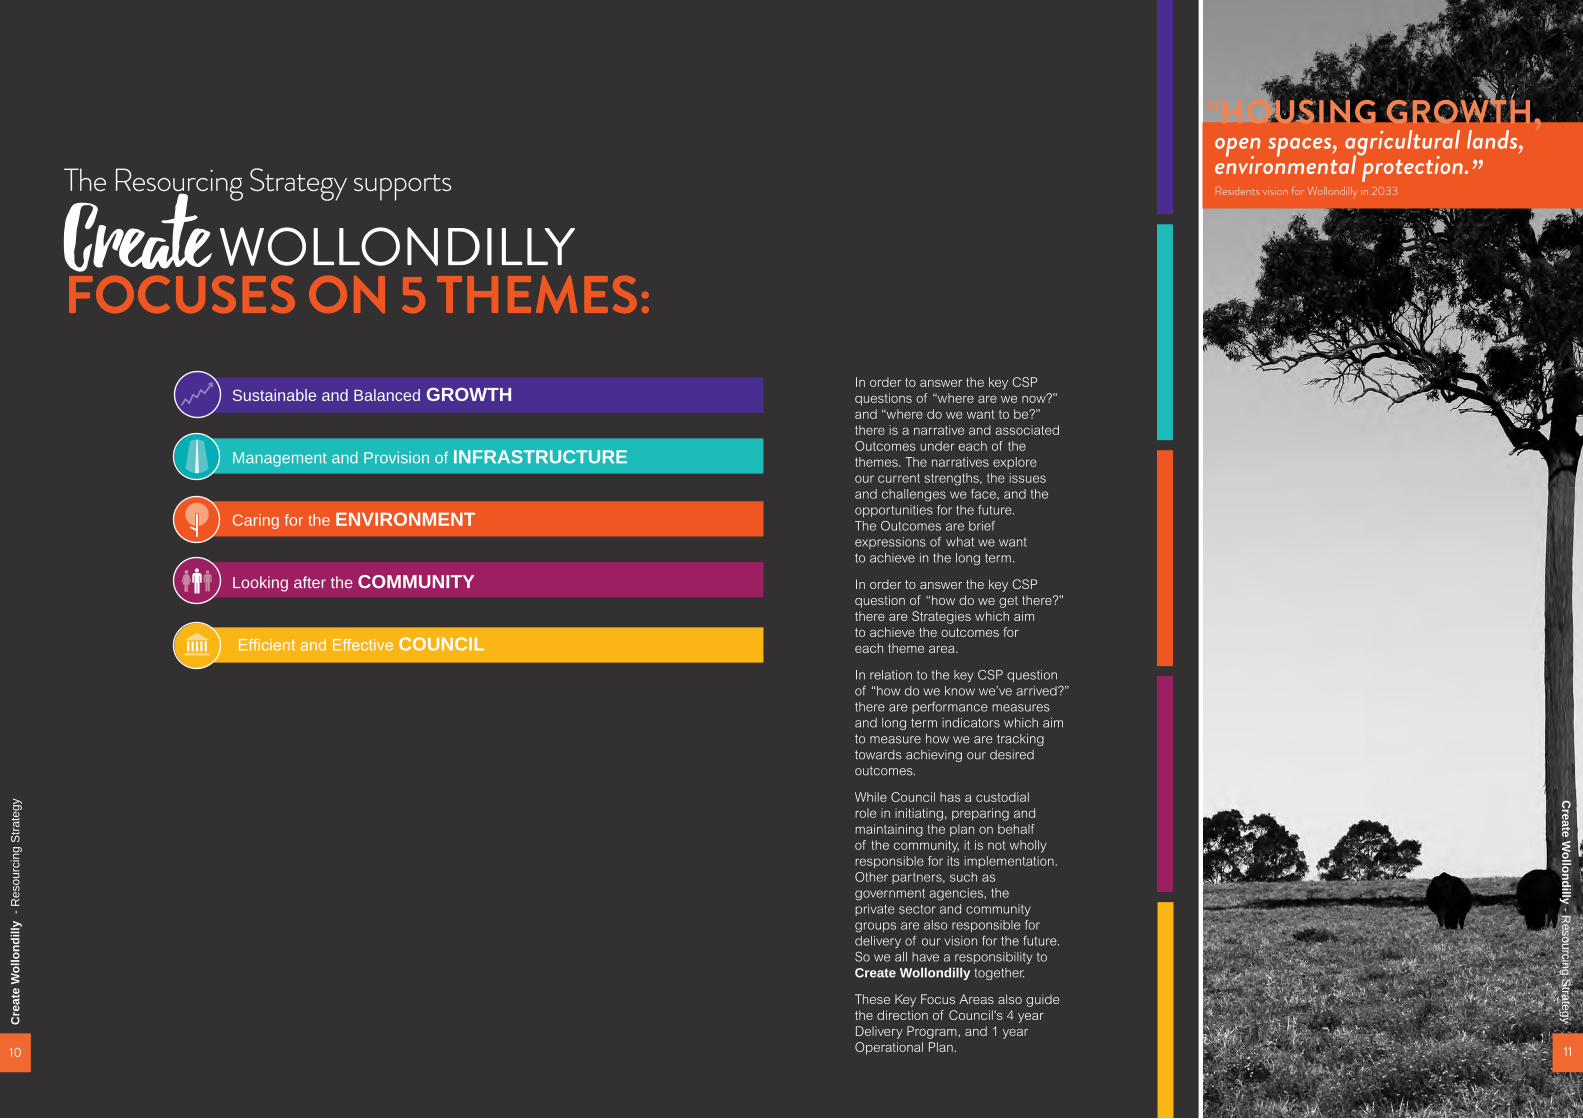
The Resourcing Strategy supports
Create WOLLONDILLY FOCUSES ON 5 THEMES:
Sustainable and Balanced GROWTH
Management and Provision of INFRASTRUCTURE
Caring for the ENVIRONMENT
Looking after the COMMUNITY
Efficient and Effective COUNCIL
In order to answer the key CSP questions of “where are we now?” and “where do we want to be?” there is a narrative and associated Outcomes under each of the themes. The narratives explore our current strengths, the issues and challenges we face, and the opportunities for the future. The Outcomes are brief expressions of what we want to achieve in the long term.
In order to answer the key CSP question of “how do we get there?” there are Strategies which aim to achieve the outcomes for each theme area.
In relation to the key CSP question of “how do we know we’ve arrived?” there are performance measures and long term indicators which aim to measure how we are tracking towards achieving our desired outcomes.
While Council has a custodial role in initiating, preparing and maintaining the plan on behalf of the community, it is not wholly responsible for its implementation. Other partners, such as government agencies, the private sector and community groups are also responsible for delivery of our vision for the future. So we all have a responsibility to Create Wollondilly together.
These Key Focus Areas also guide the direction of Council’s 4 year Delivery Program, and 1 year Operational Plan.
“HOUSING GROWTH, open spaces, agricultural lands, environmental protection.” Residents vision for Wollondilly in 2033
Cre
ate
Wol
lond
illy
- R
esou
rcin
g S
trate
gy C
reate Wollondilly - R
esourcing Strategy
10 11
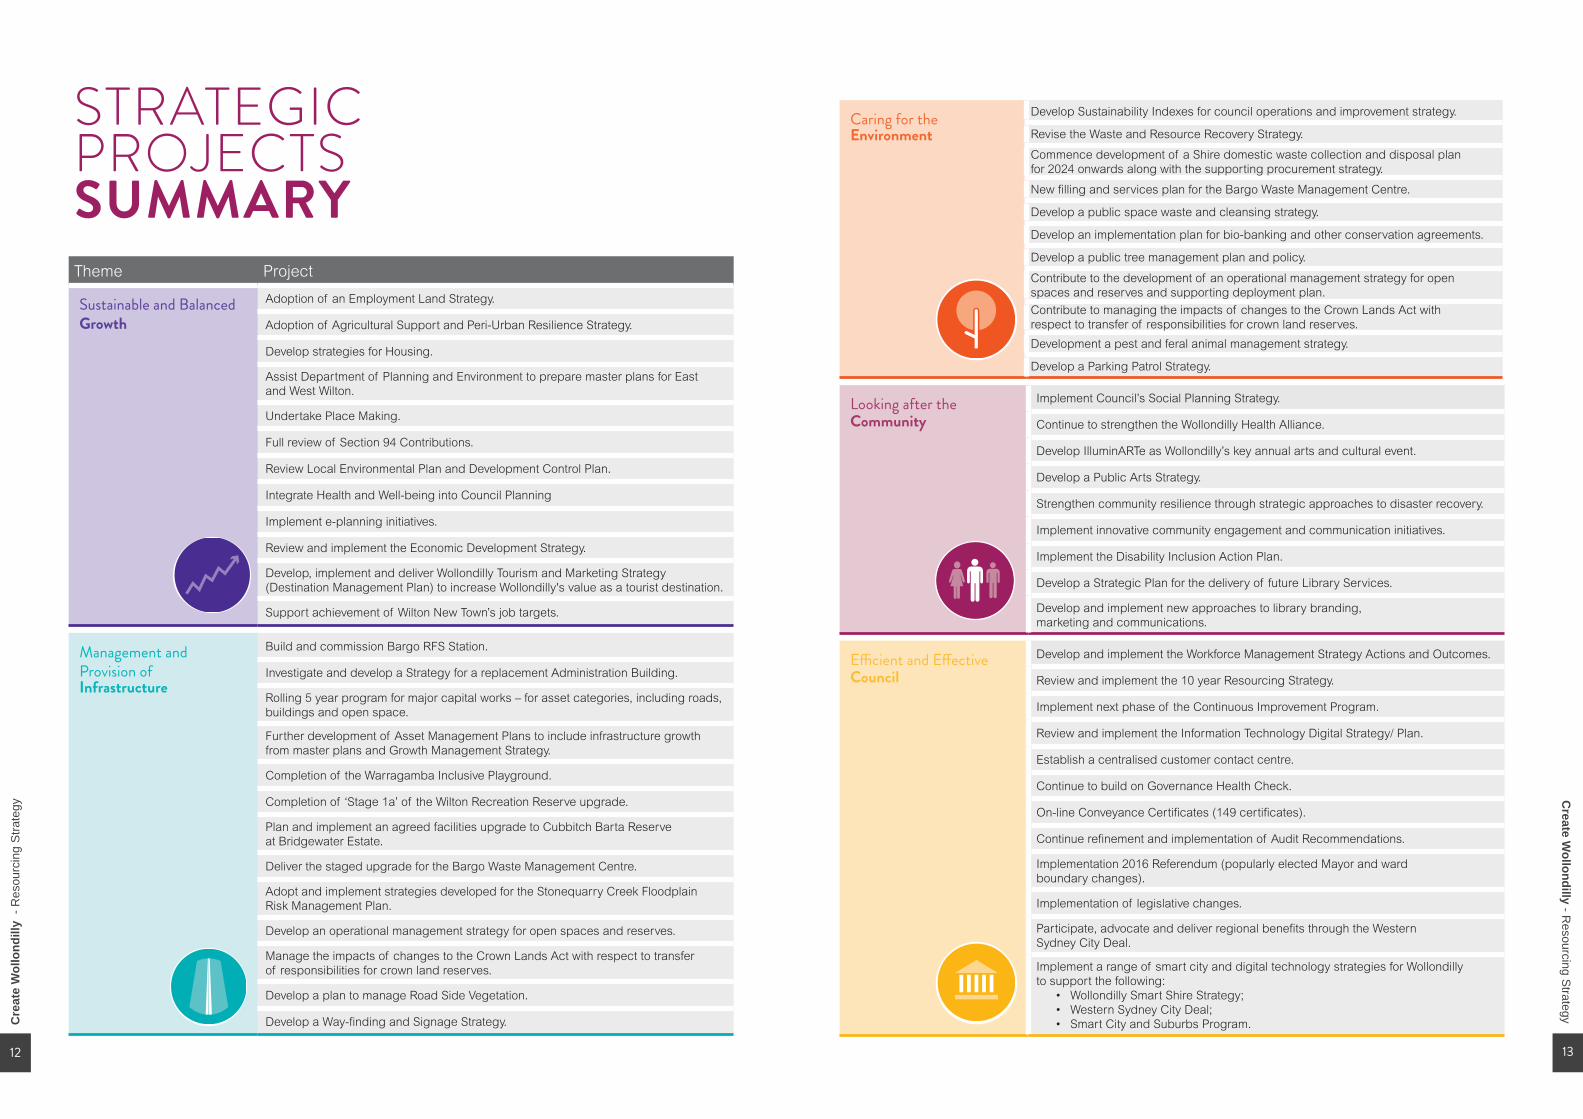
STRATEGIC PROJECTSSUMMARYTheme Project
Sustainable and Balanced Growth
Adoption of an Employment Land Strategy.
Adoption of Agricultural Support and Peri-Urban Resilience Strategy.
Develop strategies for Housing.
Assist Department of Planning and Environment to prepare master plans for East and West Wilton.
Undertake Place Making.
Full review of Section 94 Contributions.
Review Local Environmental Plan and Development Control Plan.
Integrate Health and Well-being into Council Planning
Implement e-planning initiatives.
Review and implement the Economic Development Strategy.
Develop, implement and deliver Wollondilly Tourism and Marketing Strategy (Destination Management Plan) to increase Wollondilly's value as a tourist destination.
Support achievement of Wilton New Town’s job targets.
Management and Provision of Infrastructure
Build and commission Bargo RFS Station.
Investigate and develop a Strategy for a replacement Administration Building.
Rolling 5 year program for major capital works – for asset categories, including roads, buildings and open space.
Further development of Asset Management Plans to include infrastructure growth from master plans and Growth Management Strategy.
Completion of the Warragamba Inclusive Playground.
Completion of ‘Stage 1a’ of the Wilton Recreation Reserve upgrade.
Plan and implement an agreed facilities upgrade to Cubbitch Barta Reserve at Bridgewater Estate.
Deliver the staged upgrade for the Bargo Waste Management Centre.
Adopt and implement strategies developed for the Stonequarry Creek Floodplain Risk Management Plan.
Develop an operational management strategy for open spaces and reserves.
Manage the impacts of changes to the Crown Lands Act with respect to transfer of responsibilities for crown land reserves.
Develop a plan to manage Road Side Vegetation.
Develop a Way-finding and Signage Strategy.
Caring for the Environment
Develop Sustainability Indexes for council operations and improvement strategy.
Revise the Waste and Resource Recovery Strategy.
Commence development of a Shire domestic waste collection and disposal plan for 2024 onwards along with the supporting procurement strategy.
New filling and services plan for the Bargo Waste Management Centre.
Develop a public space waste and cleansing strategy.
Develop an implementation plan for bio-banking and other conservation agreements.
Develop a public tree management plan and policy.
Contribute to the development of an operational management strategy for open spaces and reserves and supporting deployment plan.Contribute to managing the impacts of changes to the Crown Lands Act with respect to transfer of responsibilities for crown land reserves.
Development a pest and feral animal management strategy.
Develop a Parking Patrol Strategy.
Looking after the Community
Implement Council’s Social Planning Strategy.
Continue to strengthen the Wollondilly Health Alliance.
Develop IlluminARTe as Wollondilly’s key annual arts and cultural event.
Develop a Public Arts Strategy.
Strengthen community resilience through strategic approaches to disaster recovery.
Implement innovative community engagement and communication initiatives.
Implement the Disability Inclusion Action Plan.
Develop a Strategic Plan for the delivery of future Library Services.
Develop and implement new approaches to library branding, marketing and communications.
Efficient and Effective Council
Develop and implement the Workforce Management Strategy Actions and Outcomes.
Review and implement the 10 year Resourcing Strategy.
Implement next phase of the Continuous Improvement Program.
Review and implement the Information Technology Digital Strategy/ Plan.
Establish a centralised customer contact centre.
Continue to build on Governance Health Check.
On-line Conveyance Certificates (149 certificates).
Continue refinement and implementation of Audit Recommendations.
Implementation 2016 Referendum (popularly elected Mayor and ward boundary changes).
Implementation of legislative changes.
Participate, advocate and deliver regional benefits through the Western Sydney City Deal.
Implement a range of smart city and digital technology strategies for Wollondilly to support the following:
• Wollondilly Smart Shire Strategy;• Western Sydney City Deal;• Smart City and Suburbs Program.C
reat
e W
ollo
ndill
y -
Res
ourc
ing
Stra
tegy
Create W
ollondilly - Resourcing S
trategy
12 13

YOUR COUNCILLORS
NORTH
CENTRAL
EAST
JUDITH HANNAN - MayorP 0414 557 799E [email protected]
SIMON LANDOWP 0415 406 719E [email protected]
MATT GOULDP 0427 936 471 E [email protected]
ROBERT KHAN - Deputy MayorP 0407 705 100 E [email protected]
MICHAEL BANASIKP 0425 798 068 E [email protected]
BLAIR BRIGGS P 0418 269 913 E [email protected]
MATTHEW DEETH P 0428 335 743 E [email protected]
RAY LAWP 0427 901 275 E [email protected]
NOEL LOWRY P 0406 047 086 E [email protected]
Cre
ate
Wol
lond
illy
- R
esou
rcin
g S
trate
gyC
reate Wollondilly - R
esourcing Strategy
14 15

N
C
E
Wallacia | Warragamba | Silverdale | Werombi | Theresa Park
Orangeville | Brownlow Hill | Glenmore | Mount Hunter
The Oaks | Belimbla Park | Oakdale | Nattai | Mowbray Park
Lakesland | Yerranderie
NORTH
CENTRAL
EAST
Picton | Thirlmere | Tahmoor | Couridjah | Buxton
Cawdor | Camden Park | Menangle | Razorback
Douglas Park | Maldon | Wilton | Pheasants Nest
Bargo | Yanderra | Cataract | Appin | Darkes Forest
N
C
E
YOURWARD
Cre
ate
Wol
lond
illy
- R
esou
rcin
g S
trate
gyC
reate Wollondilly - R
esourcing Strategy
16 17

EXECUTIVE AND GENERAL MANAGER'S MESSGAE
ALLY DENCH Executive Director Community Services and Corporate Support P 4677 9673E [email protected]
MATTHEW TORO Manager Executive Services
P 4677 9597E [email protected]
LUKE JOHNSON General Manager
P 4677 1100E [email protected]
CHRIS STEWART Director Planning
P 4677 9524 E [email protected]
MICHAEL MALONE Director Infrastructure and EnvironmentP 4677 9683 E [email protected]
Having a realistic and effective Resourcing Strategy is an essential element in securing the best possible future for our community. As General
Manager, I am confident that we will continue to build on past achievements and that we are very well placed to address the opportunities and challenges ahead.Luke Johnson
Cre
ate
Wol
lond
illy
- R
esou
rcin
g S
trate
gyC
reate Wollondilly - R
esourcing Strategy
18 19

LONG TERM FINANCIAL PLAN2017/18 - 2026/27 1
SECTIO
N
Create W
ollondilly - Resourcing S
trategy | Long Term Financial P
lan
INTRODUCTIONFor many years, Councils have operated in an environment with significant funding limitations, seeking to provide the necessary funds to renew their infrastructure and provide new services and infrastructure for our communities.
Like other Councils across NSW, Wollondilly Shire Council faces many challenges funding ongoing operations and adequately maintaining our community assets. The growth in the cost of labour and materials, increasing demand for services and cost shifting from other levels of government combined with a legislated cap in revenue generated from rates, have created a challenging financial environment.
The Long Term Financial Plan is integrated with Council’s Asset Management Plan and Workforce Management Plan, forming Council’s Resourcing Strategy.
The Long Term Financial Plan is a 10 year plan that will underpin the strategies and actions of Council’s 4 year Delivery Program and annual Operational Plan, which in turn supports the outcomes and strategies outlined in the Wollondilly Community Strategic Plan “Growing yOur Future Together 2033”.
The plan demonstrates Council’s long term financial sustainability and allows early identification of financial issues and their longer term impacts. The plan outlines the steps Council will take to realistically address the major financial challenges and opportunities which will impact on the way we do business over the next ten years.
We will update the Plan on an annual basis as part of the development of Council’s Operational Plan and a detailed review will occur as part of the four yearly review of the Community Strategic Plan.
The Long Term Financial Plan includes: • Projected income and expenditure, balance
sheet and cash flow statement. • Planning assumptions used to develop the Plan. • Sensitivity analysis - highlighting factors and
assumptions most likely to affect the Plan. • Financial modelling for different scenarios
including planned, optimistic and conservative views.
• Methods of monitoring financial performance.
The Long Term Financial Plan will seek to answer the questions:
• Can we afford what the community wants?• How can we go about achieving these outcomes?• Can we survive the pressures of the future?• What are the opportunities for future income
and economic growth?
Accordingly, the Long Term Financial Plan will be used as a decision-making and problem-solving tool. It is not intended that the Plan is set in concrete – it is a guide for future action and the modelling that occurs as part of the plan will help Council to decide how it can meet the community’s aspirations. It will also provide an opportunity for Council to identify financial issues at an earlier stage and gauge the effect of these issues in the longer term.
“SUSTAINED GROWTH, appreciable amenities that exist for the citizens and others outside Wollondilly - that attract visitors and business into the area.”Resident's vision for Wollondilly in 2033
23
Cre
ate
Wol
lond
illy
- R
esou
rcin
g S
trate
gy |
Lon
g Te
rm F
inan
cial
Pla
n
22
Create W
ollondilly - Resourcing S
trategy | Long Term Financial P
lan
1. Demographics / Population:According to the ABS 2011 Census, Wollondilly Shire has a larger proportion of families with children but a smaller proportion of group households and single person households in comparison to the Sydney Statistical Division. Family households accounted for 79.8% of total households in Wollondilly Shire while one-person households comprised 15.7%.
Wollondilly’s current population features a larger than average number of adults and dependent children compared to the Sydney average. By the same comparative measure, Wollondilly has a lower proportion of people aged 18 to 34 and over 70 years. However, over the longer term it is expected that the Shire will carry a higher proportion of population that is ageing, similar to the state average.
Similarly, it is likely to register decreasing sized households. It can be safely assumed that the current trend of outmigration of persons aged 18 to 34 years will continue. A key implication of the assumed population growth trajectory and the ageing of the population is that this is likely to partially offset growth in rate revenue or user charges and hence the modelling allows for only a portion of revenue increase driven by additional properties.
It is predicted that Wollondilly will experience significant growth over the next 10 – 20 years. The LTFP includes detailed predictions of growth based on development approvals and expected rates of land release.
The rate of growth of the Shire has a number of financial impacts, including:• Developer contributions recorded as revenue in the income statement in accordance
with accounting standards whilst the funds are being used to fund the construction of capital infrastructure.
• Additional rate revenue resulting from new residents and businesses and additional expenditures to provide services.
• The value of assets increasing significantly over time, with infrastructure such as roads, footpaths and parks being donated to Council from developers once construction is complete.
• Maintenance costs to service and replace these large amounts of infrastructure placing an increasing financial burden on Council’s budget.
The LTFP ensures the Council is not reliant on growth to maintain a strong sustainable financial position. The following table provides a summary of residential growth rate income included in the LTFP.
2. EconomyWhilst Council has based its forecasts on reasonable assumptions about the future, it realises there are significant uncertainties that lie ahead which are likely to cause the forecasts to diverge, especially in the later years of the forecasting horizon.
Employment sectors within Wollondilly include mining, agriculture, sport/recreation, tourism, education and some home-based business. Mining and retail have been the major impetus for recent growth with further support coming from manufacturing, agriculture and tourism. However, almost 60% of the labour force travels outside the Shire for their work.
Interest Rates - The Reserve Bank left the cash rate unchanged at 1.5% at its March 2017 meeting given that conditions in the global economy have continued to improve over recent months. The Australian economy is continuing its transition following the end of the mining investment boom, expanding by around 2½ per cent in 2016. Exports have risen strongly and non-mining business investment has risen over the past year. Most measures of business and consumer confidence are at, or above, average. Consumption growth was stronger towards the end of the year, although growth in household income remains low. The outlook continues to be supported by the low level of interest rates.
Council’s Long Term Financial Plan anticipates that this cash rate will gradually increase over coming years. Any variation in the cash rate predictions will have implications for this plan requiring adjustment to either revenues or expenditure in order to offset the effect of any interest rate movements.
3. Service LevelsCouncil’s Community Strategic Plan (CSP) identifies key community outcomes which were developed through an extensive consultation program on the CSP and further research conducted by way of a formal community survey. Based on this analysis and having regard to Council’s Asset Management Strategy, Council intends to generally maintain its existing level of services while adjusting infrastructure maintenance levels to match the level of available funding.
PLANNING ASSUMPTIONSThis Long Term Financial Plan (LTFP) has been developed in conjunction with the development of the 2017/18 Operational Plan. The Operational Plan includes Council’s 2017/18 budget which forms year one of the ten year financials contained within the LTFP. A range of assumptions and forecasts have been applied against the year one recurrent figures to help determine the future year estimates.
25
Cre
ate
Wol
lond
illy
- R
esou
rcin
g S
trate
gy |
Lon
g Te
rm F
inan
cial
Pla
n
24
Cre
ate
Wol
lond
illy
- R
esou
rcin
g S
trate
gy |
Lon
g Te
rm F
inan
cial
Pla
n
4. Revenue AssumptionsRates and Annual Charges -IPART approved a 4 year Special Rate Variation of 10.8%pa rate revenue increases from 2015/16 to 2018/19 inclusive. From 2019/20 onwards, the LTFP has assumed rate peg increases of 3% pa for the Planned Scenario, 2.5% pa for the Conservative Scenario and 3.5% pa for the Optimistic Scenario .
Fees and Charges:Statutory Fees - Council has no discretion to determine the amount of the fee for a service when the amount is fixed by regulation or by another authority. Examples of statutory fees include development assessment fees, inspection fees and planning certificates. The Long Term Financial Plan makes the assumption that income from these fees will increase in line with CPI.
User Fees and Charges - The Long Term Financial Plan assumes that the majority of user fees and charges will generally rise in accordance with CPI increases. Given the non-recurring nature of Council’s contract works, ongoing income is not factored into the plan and any work undertaken will have a positive impact on Council’s revenues.
Grants and Contributions- The long term financial projections contained within this plan have only allowed for recurring grants and contributions and do not include any non-recurring grants.
Borrowings - Debt is raised to fund capital expenditure that will benefit current and future residents and taxpayers. All borrowings must be approved by Council resolution and all decisions will be made in accordance with Council’s Borrowing Policy. It is considered appropriate that borrowing be considered for the delivery of major new infrastructure projects such as community facilities, as future debt servicing commitments can be considered appropriate for future generations to fund in return for the use of the capital item created.
The long term financial projections include all existing loan arrangements plus a proposed $1 million loan borrowing in 2017/18.
5. Expenditure AssumptionsEmployee Costs - At the time of preparing this document, future Local Government Award pay increases were still being negotiated, therefore for each year within the LTFP, annual pay increases are assumed to be around 2.5%pa. A small allowance has also been made to account for grade increases where staff raise their skill levels and take on additional responsibilities. Accordingly, assumed net increases of 3% pa have been used to index Council’s projected level of employee costs.
In addition to this, the LTFP has factored in an increase in staffing numbers to allow for increased planning and development in connection with the anticipated increase in subdivision of lands within the Shire.
Materials, Contracts and Other Operating CostsExpenditure on materials, contracts and other operating costs have generally been increased in line with CPI increases (assumed at 3% pa).
Capital Expenditure - Capital expenditure represents expenditure towards both the creation of new infrastructure assets and the renewal of existing assets (particularly roads, drainage and footpaths). This expenditure category also includes capital purchases such as vehicles, plant items and information technology. The expenditure is based on the 10 year capital works programs detailed in the Asset Management Plan.
Create W
ollondilly - Resourcing S
trategy | Long Term Financial P
lan
2726
Cre
ate
Wol
lond
illy
- R
esou
rcin
g S
trate
gy |
Lon
g Te
rm F
inan
cial
Pla
n Create W
ollondilly - Resourcing S
trategy | Long Term Financial P
lan
Potential variables that could have an impact on Council’s Long Term Financial Plan are outlined below.
Rates and Annual ChargesRates and annual charges (domestic waste) make up approximately two thirds of Council’s total revenue stream. Whilst Council’s rate revenue increases for 2017/18 and 2018/19 are known to be 10.8%, the remaining eight years of the LTFP are subject to rate peg increases as determined each year by IPART. The rate peg increases from 2019/20 onwards are assumed to be 3%pa in the planned scenario model, however annual rate income of Council is highly sensitive to rate peg increases of differing percentages. Accordingly, the conservative scenario is based on rate peg increases of 2.5%pa and the optimistic scenario predicts 3.5%pa rate increases.
Grants and ContributionsOur Long Term Financial Plan includes recurring grants but does not include non-recurring grants. Although historically Council has received a number of non-recurring grants each year, it would not be financially prudent to ‘assume’ that will always be the case. Accordingly, the Plan will be enhanced to the extent that we receive non-recurrent grants.
The most significant recurring grant Council receives each year is the Financial Assistance Grant (currently $3.5 million). The NSW Local Government Grants Commission is responsible for the distribution of Commonwealth Financial Assistance Grants to councils in accordance with State and Federal legislative requirements. Council has a significant reliance on Financial Assistance Grants (FAGS) with approximately 6.4% of total operating revenue coming from this source. Allocation of the grants is based on a complex formula involving analysing Council’s income and expenses with State averages and other factors such as our demographic profile, the movement in our population relative to the movement in both NSW and Australia’s population, and our community’s ability to pay relative to other council communities. Given expenditure increases annually with inflation and growth, Council’s budget is gradually being impacted by the grant distribution methodology. The 2014/15 budget announcements by the Federal Government resulted in the grant not being increased by inflation for the three years, which has eroded the FAGS base by around 13%. Inflation increases have been included in the LTFP from 2017/18. The LTFP also assumes that Council will continue to receive Roads to Recovery funding during the life of the plan.
SENSITIVITY ANALYSIS
Employee CostsEmployee costs are a significant component of Council’s expenditure budget and are highly sensitive to changes in rates of pay determined through Award negotiations and other market forces. Council’s ability to develop an appropriate workforce to achieve the Community’s ideas and aspirations over the term of the Resourcing Strategy is affected by a range of external forces, including:
• Staff turnover levels;• Skills shortages;• Changes to superannuation contribution rates;• Award increases greater than rate peg and CPI;• Changes in the communities priorities and expectations with regards to service levels.
Interest on InvestmentsCouncil maintains a substantial portfolio of investments which is managed in accordance with Council’s investment policy. Our financial projections are based on reasonable assumptions regarding income from investments over the life of this plan and are incorporated into our overall financial plans. To that extent, the plan is sensitive to unexpected changes in the return on Council’s investments.
InflationThe Consumer Price Index (CPI) is regarded as Australia’s key measure of household inflation. It is designed to provide a general measure of price inflation for the Australian household sector as a whole. Assumptions about future CPI rates are only best estimates. Movement in CPI impacts on rate increases, expenditure on services and asset replacement costs. The LTFP includes has assumed annual CPI increases of 3% pa for each year beyond the initial 2017/18 adopted budget estimates.
28 29

Create W
ollondilly - Resourcing S
trategy | Long Term Financial P
lan
The LTFP modeling has been devised with three scenarios Modelling has been used to create the scenarios outlined below. Each scenario provides an alternative financial result subject to assumed capital funding, varying levels of asset condition and their impact on key financial indicators.
Scenario 1 – PlannedThe planned scenario is aimed at delivering the strategic goals and outcomes set out in Council’s Community Strategic Plan. It is based on thorough estimates of future income and expenditure under normal operating conditions and predicted population growth (based on development approvals and expected rates of land release).
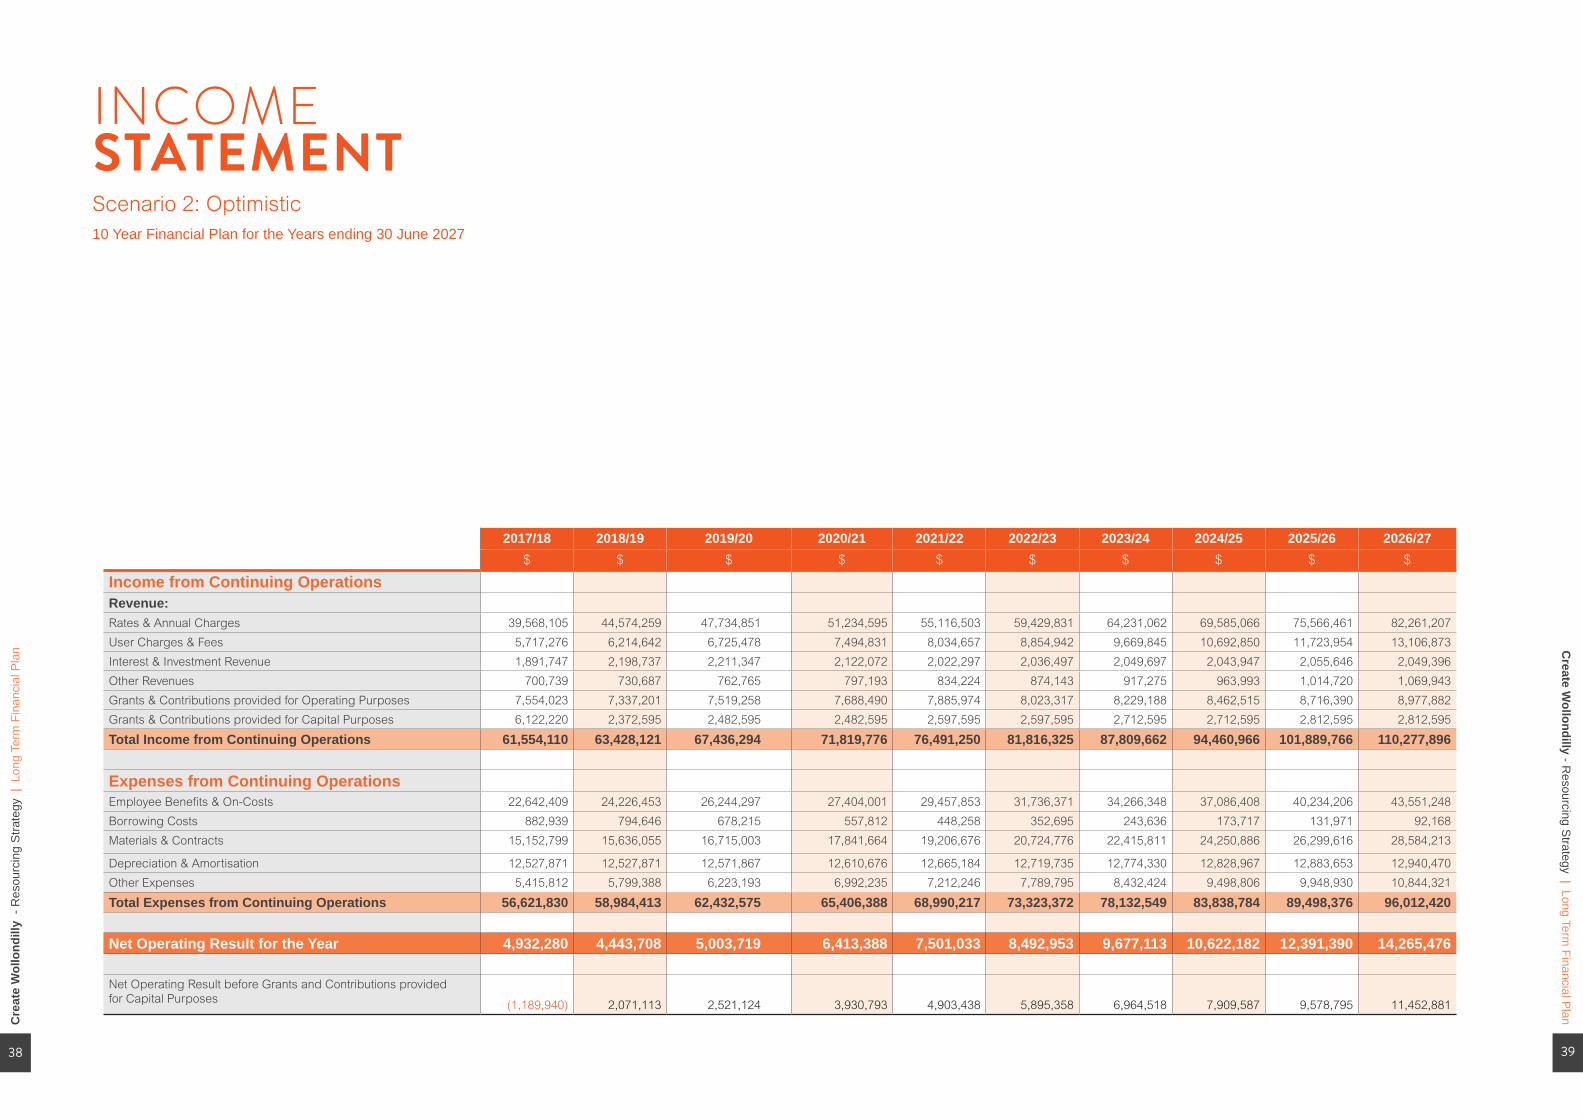
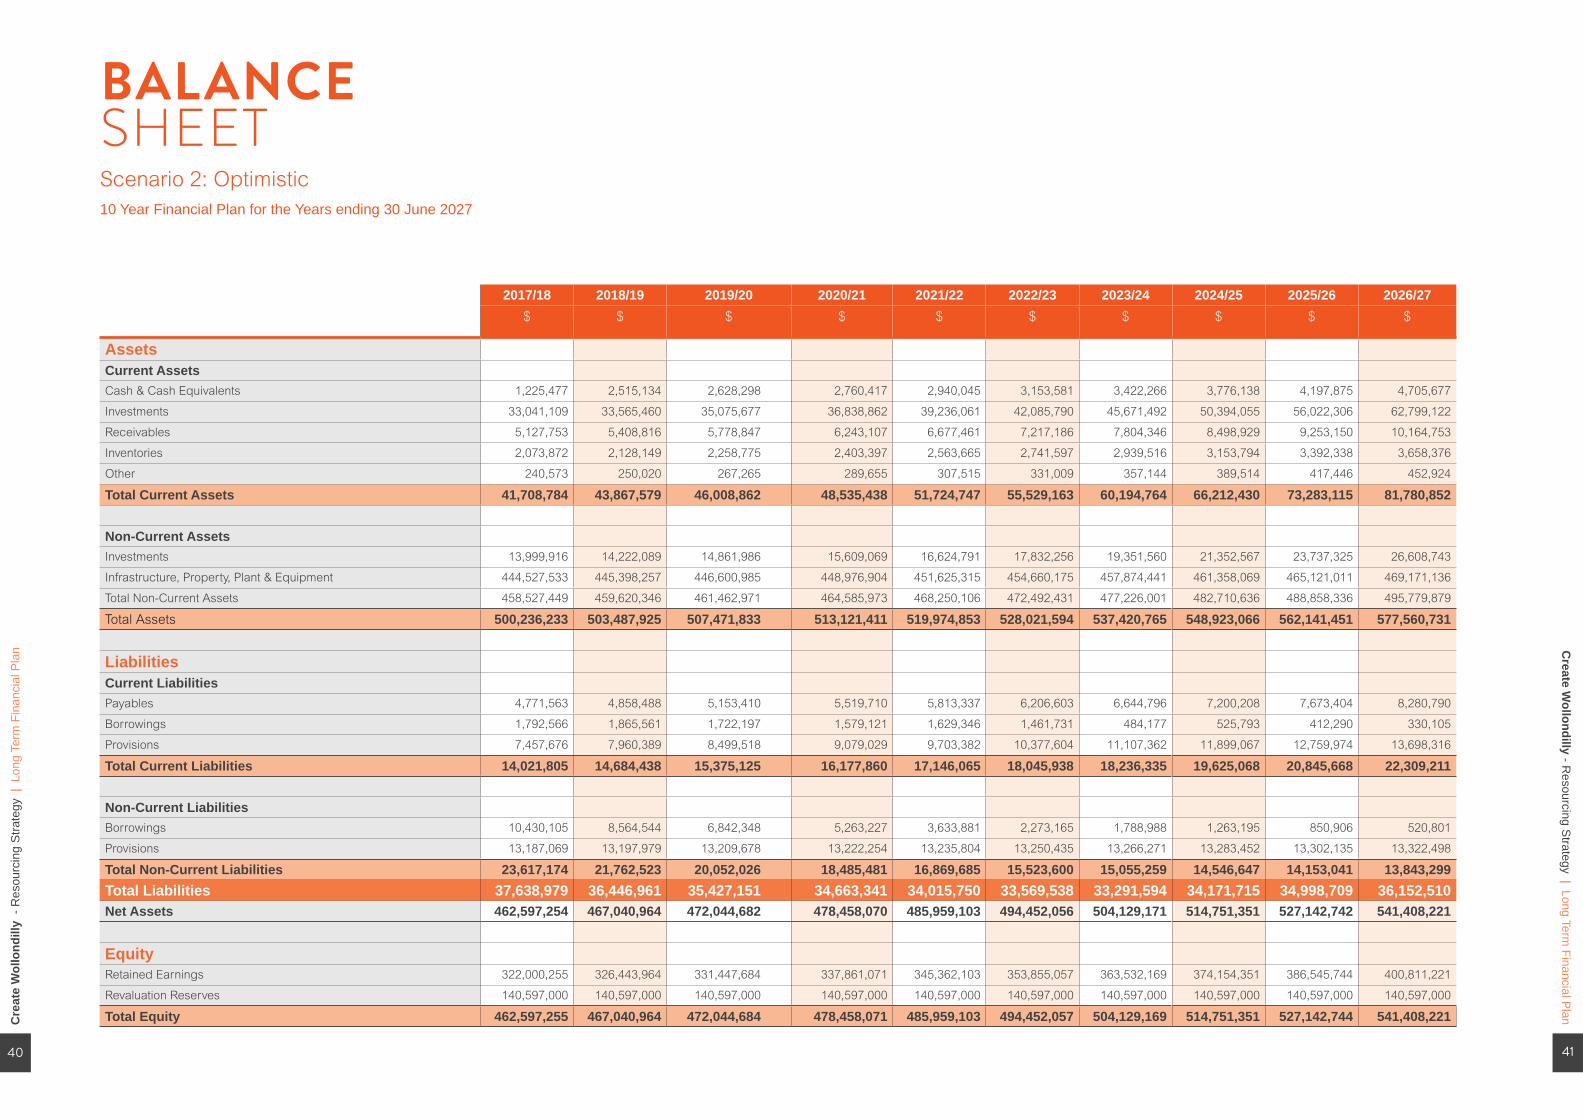
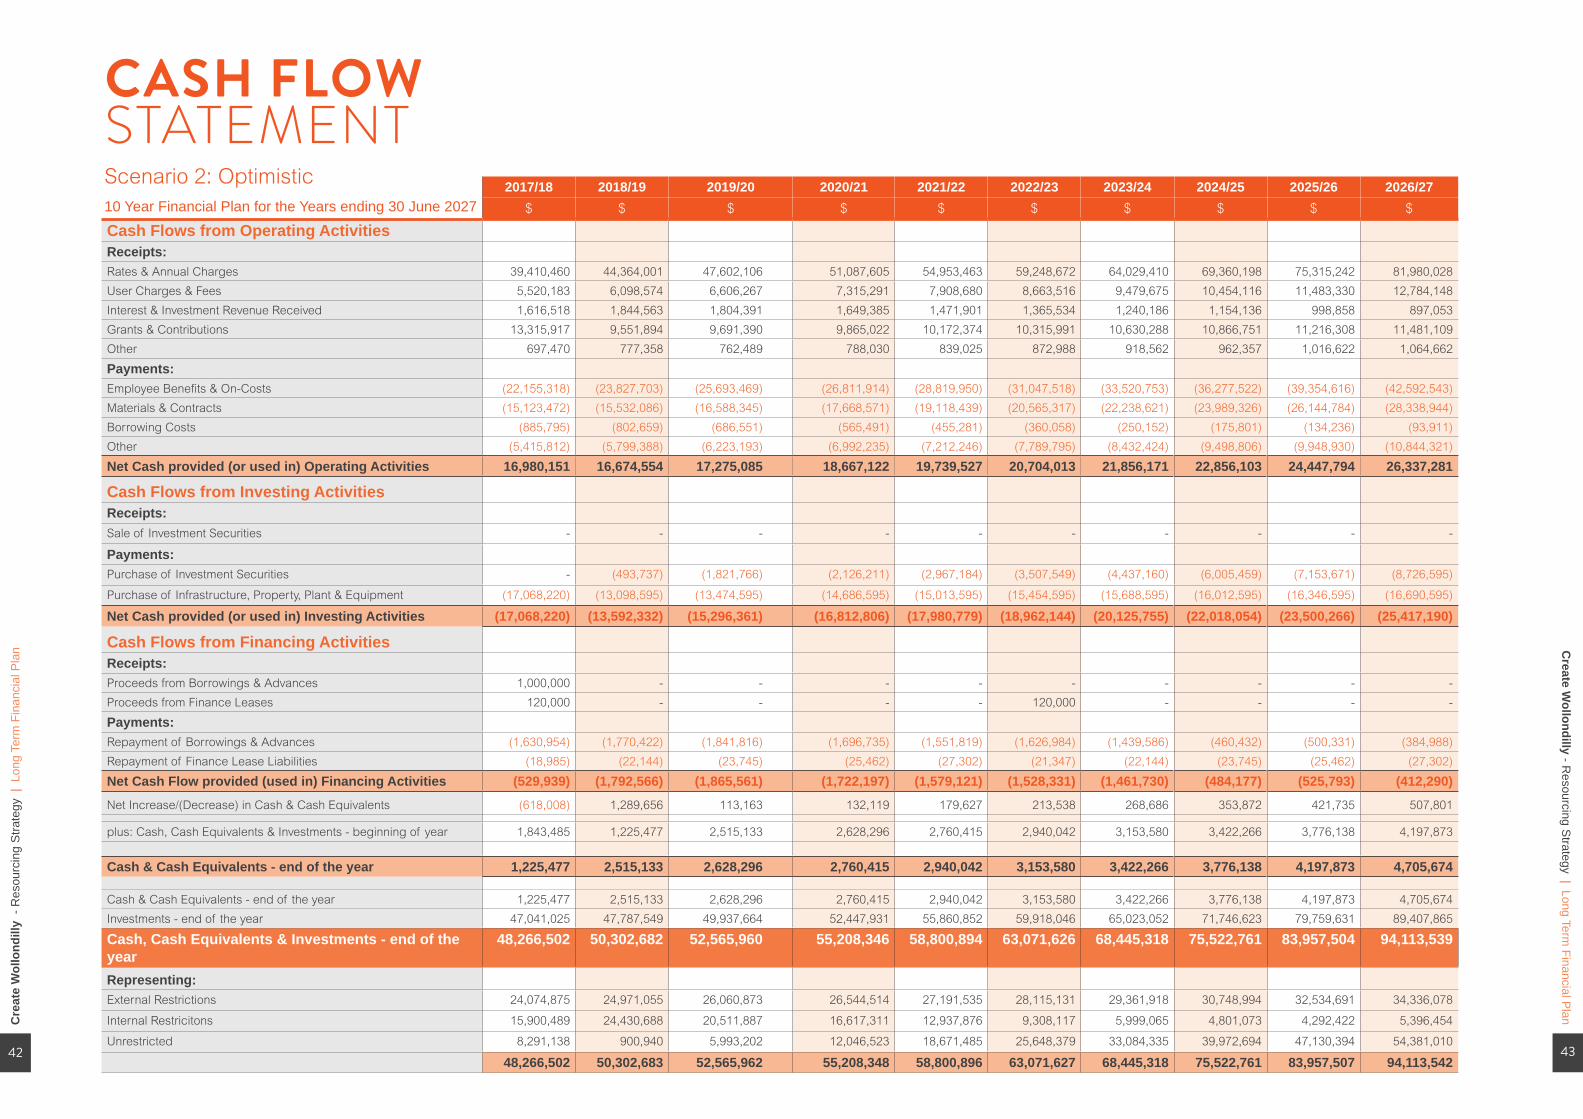
Scenario 2 – OptimisticThe optimistic scenario provides a financial model operating in ideal economic conditions and allows for accelerated population growth compared to the predictions identified in the planned scenario.
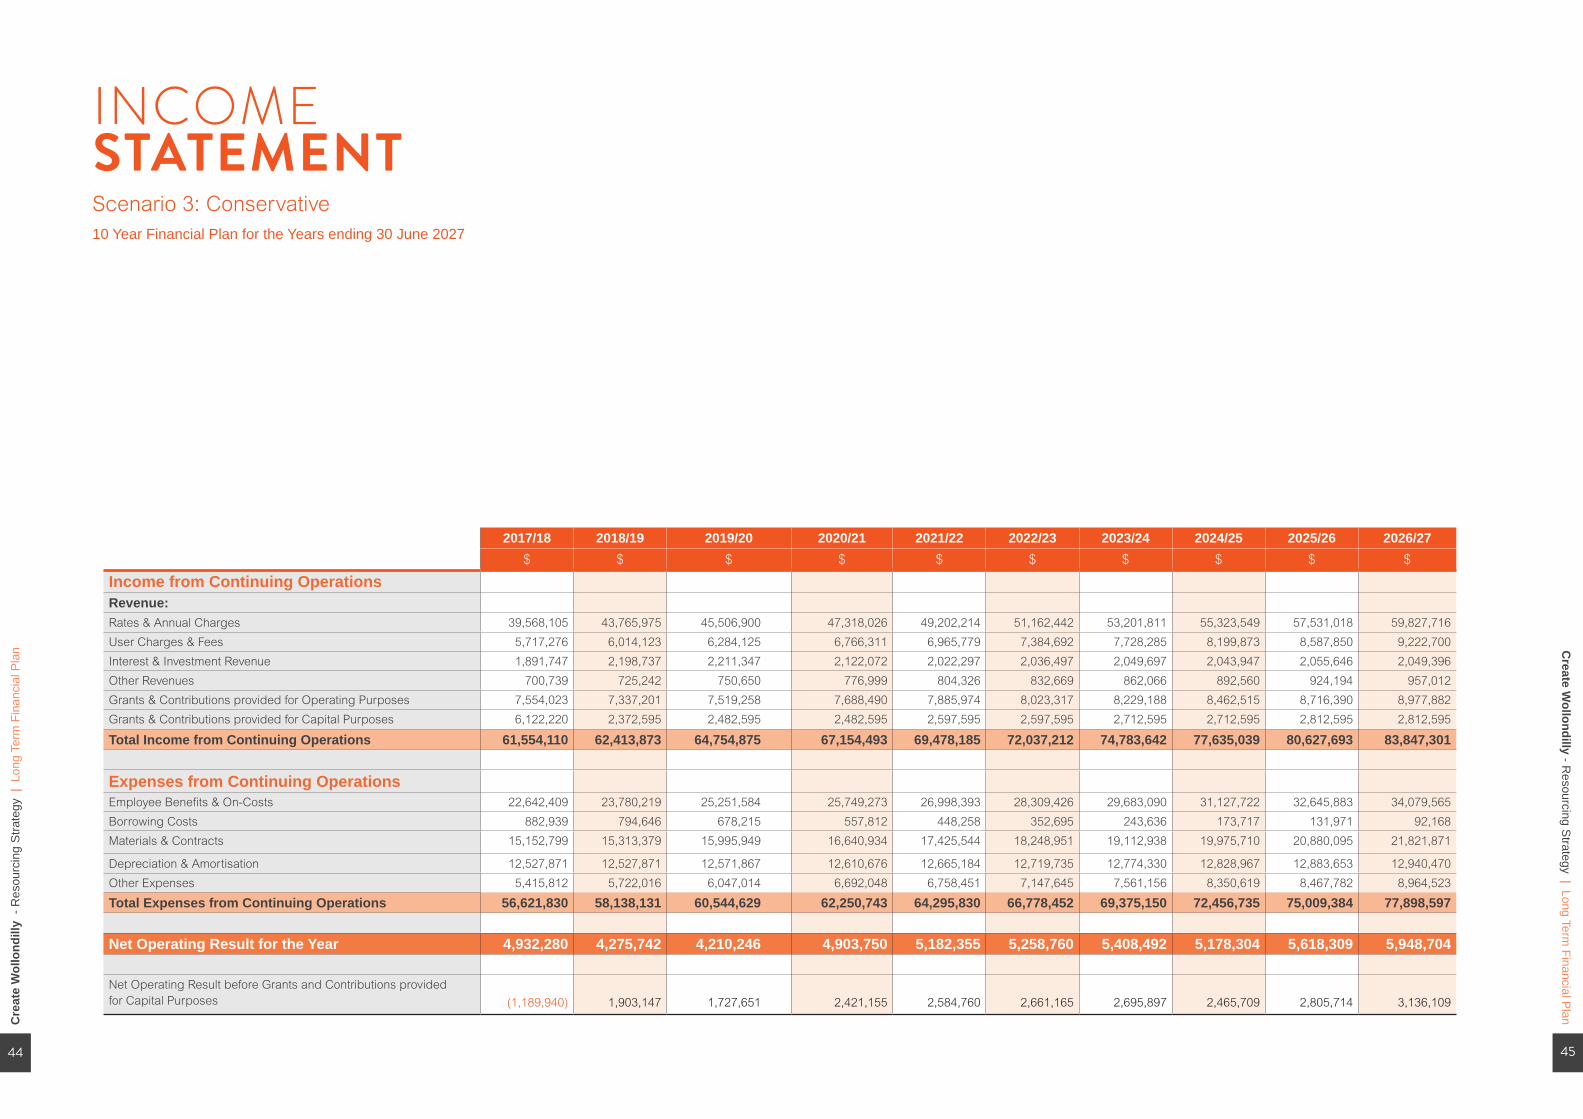
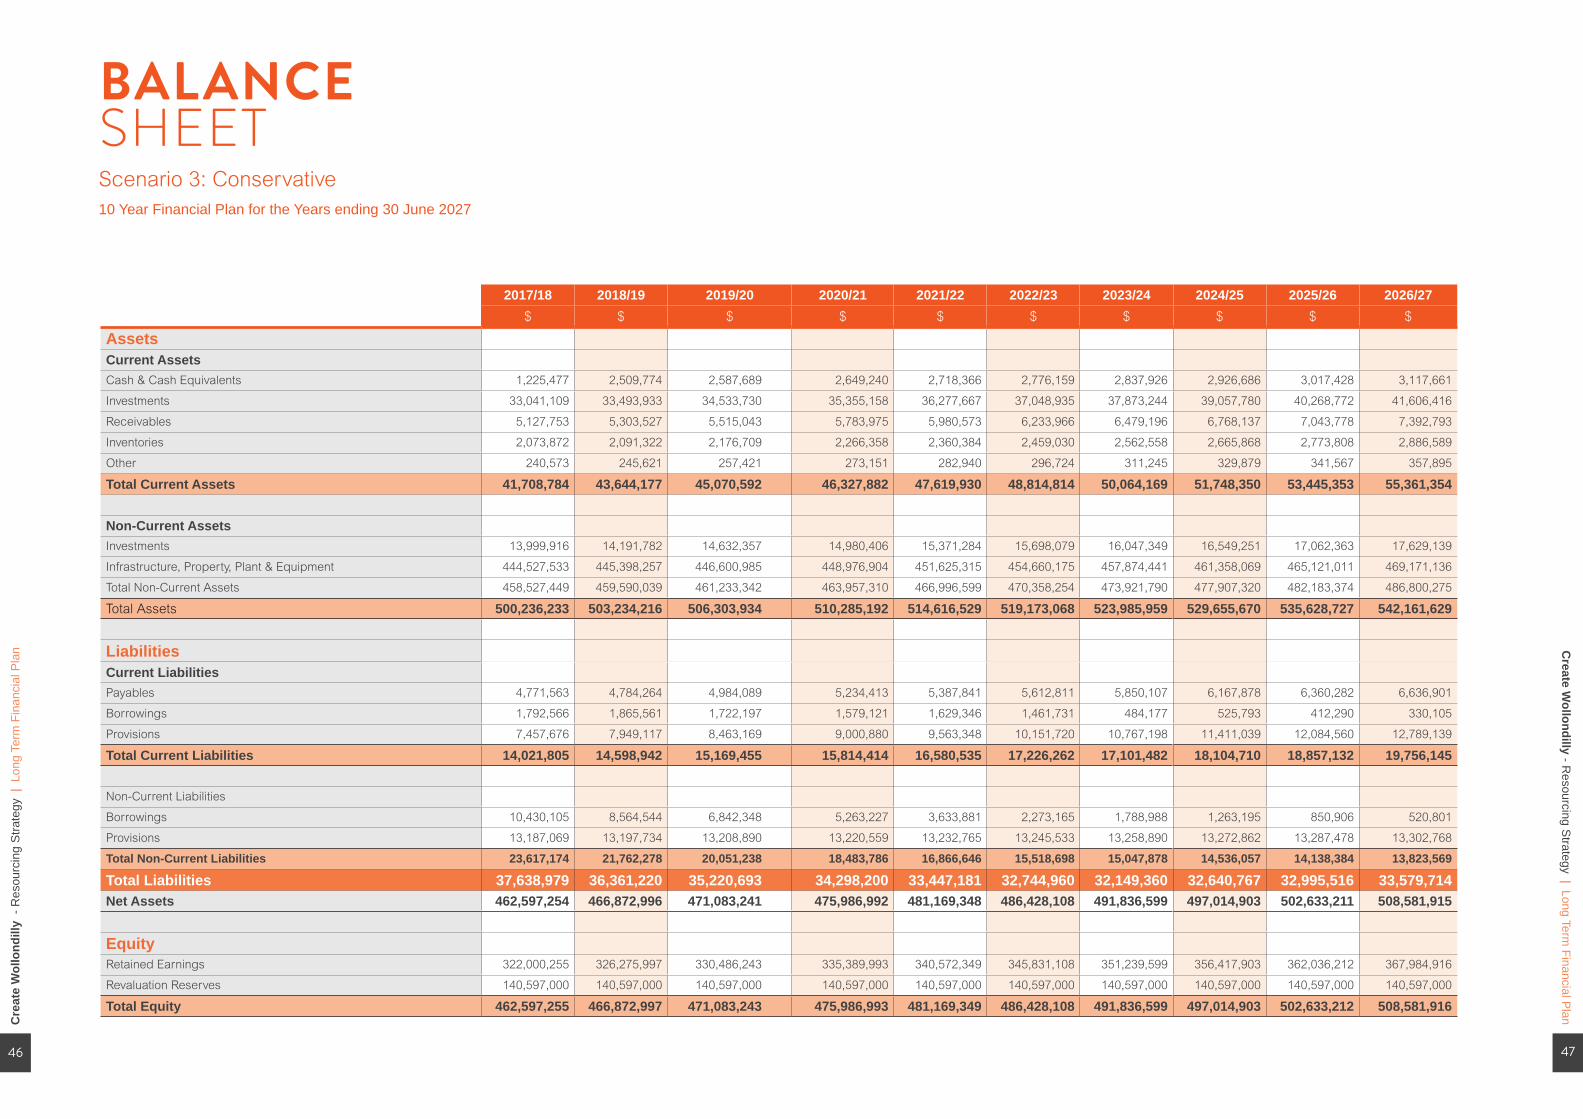
Scenario 3 – ConservativeThe conservative scenario provides a financial model operating in less than normal economic conditions. As such, the model takes a more conservative approach to budget forecast than the planned model. The goals, objectives and outcomes may not be able to be achieved within this scenario.
The following pages provide an Income Statement, Balance Sheet and Cash-flow Statement for each of the scenarios described above.
SCENARIOS
31
Cre
ate
Wol
lond
illy
- R
esou
rcin
g S
trate
gy |
Lon
g Te
rm F
inan
cial
Pla
n
30

Cre
ate
Wol
lond
illy
- R
esou
rcin
g S
trate
gy |
Lon
g Te
rm F
inan
cial
Pla
n Create W
ollondilly - Resourcing S
trategy | Long Term Financial P
lan
2017/18 2018/19 2019/20 2020/21 2021/22 2022/23 2023/24 2024/25 2025/26 2026/27
$ $ $ $ $ $ $ $ $ $
Income from Continuing OperationsRevenue:Rates & Annual Charges 39,568,105 44,304,831 46,864,724 49,580,181 52,460,911 55,517,236 58,760,130 62,201,263 65,853,044 69,728,665
User Charges & Fees 5,717,276 6,147,803 6,572,128 7,231,790 7,634,671 8,286,034 8,894,560 9,667,390 10,397,171 11,419,109
Interest & Investment Revenue 1,891,747 2,198,737 2,211,347 2,122,072 2,022,297 2,036,497 2,049,697 2,043,947 2,055,646 2,049,396
Other Revenues 700,739 728,872 758,314 789,133 821,403 855,202 890,608 927,711 966,602 1,007,376
Grants & Contributions provided for Operating Purposes 7,554,023 7,337,201 7,519,258 7,688,490 7,885,974 8,023,317 8,229,188 8,462,515 8,716,390 8,977,882
Grants & Contributions provided for Capital Purposes 6,122,220 2,372,595 2,482,595 2,482,595 2,597,595 2,597,595 2,712,595 2,712,595 2,812,595 2,812,595
Total Income from Continuing Operations 61,554,110 63,090,039 66,408,366 69,894,261 73,422,851 77,315,881 81,536,778 86,015,421 90,801,448 95,995,023
Expenses from Continuing OperationsEmployee Benefits & On-Costs 22,642,409 24,077,708 25,879,584 26,743,575 28,403,514 30,171,913 32,053,628 34,061,493 36,202,902 38,305,650
Borrowing Costs 882,939 794,646 678,215 557,812 448,258 352,695 243,636 173,717 131,971 92,168
Materials & Contracts 15,152,799 15,528,496 16,450,833 17,362,448 18,442,956 19,594,137 20,820,616 22,079,497 23,418,823 24,837,489
Depreciation & Amortisation 12,527,871 12,527,871 12,571,867 12,610,676 12,665,184 12,719,735 12,774,330 12,828,967 12,883,653 12,940,470
Other Expenses 5,415,812 5,793,736 6,199,960 6,936,732 7,106,490 7,611,875 8,155,752 9,091,228 9,371,676 10,050,752
Total Expenses from Continuing Operations 56,621,830 58,722,457 61,780,459 64,211,243 67,066,402 70,450,355 74,047,962 78,234,902 82,009,025 86,226,529
Net Operating Result for the Year 4,932,280 4,367,582 4,627,907 5,683,018 6,356,449 6,865,526 7,488,816 7,780,519 8,792,423 9,768,494
Net Operating Result before Grants and Contributions provided for Capital Purposes (1,189,940) 1,994,987 2,145,312 3,200,423 3,758,854 4,267,931 4,776,221 5,067,924 5,979,828 6,955,899
INCOME STATEMENT Scenario 1: Planned 10 Year Financial Plan for the Years ending 30 June 2027
32 33

Cre
ate
Wol
lond
illy
- R
esou
rcin
g S
trate
gy |
Lon
g Te
rm F
inan
cial
Pla
n Create W
ollondilly - Resourcing S
trategy | Long Term Financial P
lan
2017/18 2018/19 2019/20 2020/21 2021/22 2022/23 2023/24 2024/25 2025/26 2026/27$ $ $ $ $ $ $ $ $ $
AssetsCurrent AssetsCash & Cash Equivalents 1,225,477 2,512,537 2,608,914 2,706,884 2,832,029 2,967,318 3,130,090 3,345,756 3,591,785 3,879,338
Investments 33,041,109 33,530,797 34,816,987 36,124,440 37,794,541 39,600,037 41,772,288 44,650,431 47,933,789 51,771,295
Receivables 5,127,753 5,373,522 5,680,247 6,059,989 6,384,702 6,785,254 7,198,595 7,678,730 8,170,955 8,764,703
Inventories 2,073,872 2,115,873 2,228,625 2,348,704 2,476,501 2,612,557 2,757,456 2,905,973 3,063,553 3,230,762
Other 240,573 248,775 264,105 283,775 297,955 316,620 336,561 361,156 379,422 402,999
Total Current Assets 41,708,784 43,781,504 45,598,878 47,523,792 49,785,728 52,281,786 55,194,990 58,942,046 63,139,504 68,049,097
Non-Current AssetsInvestments 13,999,916 14,207,402 14,752,376 15,306,360 16,014,002 16,779,012 17,699,421 18,918,924 20,310,123 21,936,120
Infrastructure, Property, Plant & Equipment 444,527,533 445,398,257 446,600,985 448,976,904 451,625,315 454,660,175 457,874,441 461,358,069 465,121,011 469,171,136
Total Non-Current Assets 458,527,449 459,605,659 461,353,361 464,283,264 467,639,317 471,439,187 475,573,862 480,276,993 485,431,134 491,107,256
Total Assets 500,236,233 503,387,163 506,952,239 511,807,056 517,425,045 523,720,973 530,768,852 539,219,039 548,570,638 559,156,353
LiabilitiesCurrent LiabilitiesPayables 4,771,563 4,837,693 5,099,008 5,417,962 5,647,828 5,957,769 6,289,362 6,711,055 7,018,197 7,421,325
Borrowings 1,792,566 1,865,561 1,722,197 1,579,121 1,629,346 1,461,731 484,177 525,793 412,290 330,105
Provisions 7,457,676 7,956,631 8,486,547 9,049,375 9,647,192 10,282,206 10,956,766 11,673,369 12,434,674 13,243,505
Total Current Liabilities 14,021,805 14,659,885 15,307,752 16,046,458 16,924,366 17,701,706 17,730,305 18,910,217 19,865,161 20,994,935
Non-Current LiabilitiesBorrowings 10,430,105 8,564,544 6,842,348 5,263,227 3,633,881 2,273,165 1,788,988 1,263,195 850,906 520,801
Provisions 13,187,069 13,197,897 13,209,397 13,221,611 13,234,584 13,248,365 13,263,003 13,278,554 13,295,076 13,312,628
Total Non-Current Liabilities 23,617,174 21,762,441 20,051,745 18,484,838 16,868,465 15,521,530 15,051,991 14,541,749 14,145,982 13,833,429 Total Liabilities 37,638,979 36,422,326 35,359,497 34,531,296 33,792,831 33,223,236 32,782,296 33,451,966 34,011,143 34,828,364 Net Assets 462,597,254 466,964,837 471,592,742 477,275,760 483,632,214 490,497,737 497,986,556 505,767,073 514,559,495 524,327,989
EquityRetained Earnings 322,000,255 326,367,836 330,995,743 336,678,761 343,035,212 349,900,738 357,389,554 365,170,073 373,962,496 383,730,990
Revaluation Reserves 140,597,000 140,597,000 140,597,000 140,597,000 140,597,000 140,597,000 140,597,000 140,597,000 140,597,000 140,597,000
Total Equity 462,597,255 466,964,836 471,592,743 477,275,761 483,632,212 490,497,738 497,986,554 505,767,073 514,559,496 524,327,990
BALANCE SHEET Scenario 1: Planned 10 Year Financial Plan for the Years ending 30 June 2027
34 35

Cre
ate
Wol
lond
illy
- R
esou
rcin
g S
trate
gy |
Lon
g Te
rm F
inan
cial
Pla
n Create W
ollondilly - Resourcing S
trategy | Long Term Financial P
lan
2017/18 2018/19 2019/20 2020/21 2021/22 2022/23 2023/24 2024/25 2025/26 2026/27$ $ $ $ $ $ $ $ $ $
Cash Flows from Operating ActivitiesReceipts:Rates & Annual Charges 39,410,460 44,105,889 46,757,208 49,466,132 52,339,920 55,388,870 58,623,928 62,056,736 65,699,669 69,565,889
User Charges & Fees 5,520,183 6,047,333 6,473,105 7,077,848 7,540,653 8,134,029 8,752,552 9,487,039 10,226,866 11,180,624
Interest & Investment Revenue Received 1,616,518 1,849,899 1,818,327 1,670,342 1,501,253 1,404,732 1,290,904 1,218,344 1,078,811 995,622
Grants & Contributions 13,315,917 9,551,894 9,691,390 9,865,022 10,172,374 10,315,991 10,630,288 10,866,751 11,216,308 11,481,109
Other 697,470 776,010 756,732 778,151 823,775 850,891 887,876 921,031 962,242 994,387
Payments:Employee Benefits & On-Costs (22,155,318) (23,682,798) (25,338,168) (26,168,532) (27,792,723) (29,523,119) (31,364,430) (33,329,339) (35,425,077) (37,479,267)
Materials & Contracts (15,123,472) (15,429,225) (16,332,734) (17,202,596) (18,373,616) (19,460,384) (20,677,302) (21,861,559) (23,319,271) (24,661,398)
Borrowing Costs (885,795) (802,659) (686,551) (565,491) (455,281) (360,058) (250,152) (175,801) (134,236) (93,911)
Other (5,415,812) (5,793,736) (6,199,960) (6,936,732) (7,106,490) (7,611,875) (8,155,752) (9,091,228) (9,371,676) (10,050,752)
Net Cash provided (or used in) Operating Activities 16,980,151 16,622,607 16,939,349 17,984,144 18,649,865 19,139,077 19,737,912 20,091,974 20,933,636 21,932,303
Cash Flows from Investing ActivitiesReceipts:Sale of Investment Securities - - - - - - - - - -
Payments:Purchase of Investment Securities - (444,386) (1,502,816) (1,477,381) (1,932,005) (2,020,862) (2,424,813) (3,379,535) (3,815,218) (4,541,866)
Purchase of Infrastructure, Property, Plant & Equipment (17,068,220) (13,098,595) (13,474,595) (14,686,595) (15,013,595) (15,454,595) (15,688,595) (16,012,595) (16,346,595) (16,690,595)
Net Cash provided (or used in) Investing Activities (17,068,220) (13,542,981) (14,977,411) (16,163,976) (16,945,600) (17,475,457) (18,113,408) (19,392,130) (20,161,813) (21,232,461)
Cash Flows from Financing ActivitiesReceipts:Proceeds from Borrowings & Advances 1,000,000 - - - - - - - - -
Proceeds from Finance Leases 120,000 - - - - 120,000 - - - -
Payments:Repayment of Borrowings & Advances (1,630,954) (1,770,422) (1,841,816) (1,696,735) (1,551,819) (1,626,984) (1,439,586) (460,432) (500,331) (384,988)
Repayment of Finance Lease Liabilities (18,985) (22,144) (23,745) (25,462) (27,302) (21,347) (22,144) (23,745) (25,462) (27,302)
Net Cash Flow provided (used in) Financing Activities (529,939) (1,792,566) (1,865,561) (1,722,197) (1,579,121) (1,528,331) (1,461,730) (484,177) (525,793) (412,290)
Net Increase/(Decrease) in Cash & Cash Equivalents (618,008) 1,287,060 96,377 97,971 125,144 135,289 162,774 215,667 246,030 287,552
plus: Cash, Cash Equivalents & Investments - beginning of year 1,843,485 1,225,477 2,512,537 2,608,914 2,706,885 2,832,029 2,967,318 3,130,092 3,345,759 3,591,789
Cash & Cash Equivalents - end of the year 1,225,477 2,512,537 2,608,914 2,706,885 2,832,029 2,967,318 3,130,092 3,345,759 3,591,789 3,879,341
Cash & Cash Equivalents - end of the year 1,225,477 2,512,537 2,608,914 2,706,885 2,832,029 2,967,318 3,130,092 3,345,759 3,591,789 3,879,341
Investments - end of the year 47,041,025 47,738,198 49,569,364 51,430,800 53,808,542 56,379,049 59,471,708 63,569,355 68,243,911 73,707,415
Cash, Cash Equivalents & Investments - end of the year
48,266,502 50,250,735 52,178,278 54,137,685 56,640,571 59,346,367 62,601,800 66,915,114 71,835,700 77,586,756
Representing:External Restrictions 24,074,875 24,971,055 26,060,873 26,544,514 27,191,535 28,115,131 29,361,918 30,748,994 32,534,691 34,336,078
Internal Restricitons 15,994,881 24,629,666 20,818,589 17,034,969 13,469,819 9,957,773 6,769,965 5,696,855 5,316,832 6,553,351
Unrestricted 8,196,746 650,014 5,298,816 10,558,201 15,979,217 21,273,463 26,469,915 30,469,262 33,984,174 36,697,324
48,266,502 50,250,735 52,178,278 54,137,684 56,640,571 59,346,367 62,601,798 66,915,111 71,835,697 77,586,753
CASH FLOW STATEMENT Scenario 1: Planned 10 Year Financial Plan for the Years ending 30 June 2027
36 37
Cre
ate
Wol
lond
illy
- R
esou
rcin
g S
trate
gy |
Lon
g Te
rm F
inan
cial
Pla
n Create W
ollondilly - Resourcing S
trategy | Long Term Financial P
lan
2017/18 2018/19 2019/20 2020/21 2021/22 2022/23 2023/24 2024/25 2025/26 2026/27$ $ $ $ $ $ $ $ $ $
Income from Continuing OperationsRevenue:Rates & Annual Charges 39,568,105 44,574,259 47,734,851 51,234,595 55,116,503 59,429,831 64,231,062 69,585,066 75,566,461 82,261,207
User Charges & Fees 5,717,276 6,214,642 6,725,478 7,494,831 8,034,657 8,854,942 9,669,845 10,692,850 11,723,954 13,106,873
Interest & Investment Revenue 1,891,747 2,198,737 2,211,347 2,122,072 2,022,297 2,036,497 2,049,697 2,043,947 2,055,646 2,049,396
Other Revenues 700,739 730,687 762,765 797,193 834,224 874,143 917,275 963,993 1,014,720 1,069,943
Grants & Contributions provided for Operating Purposes 7,554,023 7,337,201 7,519,258 7,688,490 7,885,974 8,023,317 8,229,188 8,462,515 8,716,390 8,977,882
Grants & Contributions provided for Capital Purposes 6,122,220 2,372,595 2,482,595 2,482,595 2,597,595 2,597,595 2,712,595 2,712,595 2,812,595 2,812,595
Total Income from Continuing Operations 61,554,110 63,428,121 67,436,294 71,819,776 76,491,250 81,816,325 87,809,662 94,460,966 101,889,766 110,277,896
Expenses from Continuing OperationsEmployee Benefits & On-Costs 22,642,409 24,226,453 26,244,297 27,404,001 29,457,853 31,736,371 34,266,348 37,086,408 40,234,206 43,551,248
Borrowing Costs 882,939 794,646 678,215 557,812 448,258 352,695 243,636 173,717 131,971 92,168
Materials & Contracts 15,152,799 15,636,055 16,715,003 17,841,664 19,206,676 20,724,776 22,415,811 24,250,886 26,299,616 28,584,213
Depreciation & Amortisation 12,527,871 12,527,871 12,571,867 12,610,676 12,665,184 12,719,735 12,774,330 12,828,967 12,883,653 12,940,470
Other Expenses 5,415,812 5,799,388 6,223,193 6,992,235 7,212,246 7,789,795 8,432,424 9,498,806 9,948,930 10,844,321
Total Expenses from Continuing Operations 56,621,830 58,984,413 62,432,575 65,406,388 68,990,217 73,323,372 78,132,549 83,838,784 89,498,376 96,012,420
Net Operating Result for the Year 4,932,280 4,443,708 5,003,719 6,413,388 7,501,033 8,492,953 9,677,113 10,622,182 12,391,390 14,265,476
Net Operating Result before Grants and Contributions provided for Capital Purposes (1,189,940) 2,071,113 2,521,124 3,930,793 4,903,438 5,895,358 6,964,518 7,909,587 9,578,795 11,452,881
INCOME STATEMENT Scenario 2: Optimistic10 Year Financial Plan for the Years ending 30 June 2027
38 39
Cre
ate
Wol
lond
illy
- R
esou
rcin
g S
trate
gy |
Lon
g Te
rm F
inan
cial
Pla
n Create W
ollondilly - Resourcing S
trategy | Long Term Financial P
lan
2017/18 2018/19 2019/20 2020/21 2021/22 2022/23 2023/24 2024/25 2025/26 2026/27$ $ $ $ $ $ $ $ $ $
AssetsCurrent AssetsCash & Cash Equivalents 1,225,477 2,515,134 2,628,298 2,760,417 2,940,045 3,153,581 3,422,266 3,776,138 4,197,875 4,705,677
Investments 33,041,109 33,565,460 35,075,677 36,838,862 39,236,061 42,085,790 45,671,492 50,394,055 56,022,306 62,799,122
Receivables 5,127,753 5,408,816 5,778,847 6,243,107 6,677,461 7,217,186 7,804,346 8,498,929 9,253,150 10,164,753
Inventories 2,073,872 2,128,149 2,258,775 2,403,397 2,563,665 2,741,597 2,939,516 3,153,794 3,392,338 3,658,376
Other 240,573 250,020 267,265 289,655 307,515 331,009 357,144 389,514 417,446 452,924
Total Current Assets 41,708,784 43,867,579 46,008,862 48,535,438 51,724,747 55,529,163 60,194,764 66,212,430 73,283,115 81,780,852
Non-Current AssetsInvestments 13,999,916 14,222,089 14,861,986 15,609,069 16,624,791 17,832,256 19,351,560 21,352,567 23,737,325 26,608,743
Infrastructure, Property, Plant & Equipment 444,527,533 445,398,257 446,600,985 448,976,904 451,625,315 454,660,175 457,874,441 461,358,069 465,121,011 469,171,136
Total Non-Current Assets 458,527,449 459,620,346 461,462,971 464,585,973 468,250,106 472,492,431 477,226,001 482,710,636 488,858,336 495,779,879
Total Assets 500,236,233 503,487,925 507,471,833 513,121,411 519,974,853 528,021,594 537,420,765 548,923,066 562,141,451 577,560,731
LiabilitiesCurrent LiabilitiesPayables 4,771,563 4,858,488 5,153,410 5,519,710 5,813,337 6,206,603 6,644,796 7,200,208 7,673,404 8,280,790
Borrowings 1,792,566 1,865,561 1,722,197 1,579,121 1,629,346 1,461,731 484,177 525,793 412,290 330,105
Provisions 7,457,676 7,960,389 8,499,518 9,079,029 9,703,382 10,377,604 11,107,362 11,899,067 12,759,974 13,698,316
Total Current Liabilities 14,021,805 14,684,438 15,375,125 16,177,860 17,146,065 18,045,938 18,236,335 19,625,068 20,845,668 22,309,211
Non-Current LiabilitiesBorrowings 10,430,105 8,564,544 6,842,348 5,263,227 3,633,881 2,273,165 1,788,988 1,263,195 850,906 520,801
Provisions 13,187,069 13,197,979 13,209,678 13,222,254 13,235,804 13,250,435 13,266,271 13,283,452 13,302,135 13,322,498
Total Non-Current Liabilities 23,617,174 21,762,523 20,052,026 18,485,481 16,869,685 15,523,600 15,055,259 14,546,647 14,153,041 13,843,299 Total Liabilities 37,638,979 36,446,961 35,427,151 34,663,341 34,015,750 33,569,538 33,291,594 34,171,715 34,998,709 36,152,510 Net Assets 462,597,254 467,040,964 472,044,682 478,458,070 485,959,103 494,452,056 504,129,171 514,751,351 527,142,742 541,408,221
EquityRetained Earnings 322,000,255 326,443,964 331,447,684 337,861,071 345,362,103 353,855,057 363,532,169 374,154,351 386,545,744 400,811,221
Revaluation Reserves 140,597,000 140,597,000 140,597,000 140,597,000 140,597,000 140,597,000 140,597,000 140,597,000 140,597,000 140,597,000
Total Equity 462,597,255 467,040,964 472,044,684 478,458,071 485,959,103 494,452,057 504,129,169 514,751,351 527,142,744 541,408,221
BALANCE SHEET Scenario 2: Optimistic10 Year Financial Plan for the Years ending 30 June 2027
40 41
Cre
ate
Wol
lond
illy
- R
esou
rcin
g S
trate
gy |
Lon
g Te
rm F
inan
cial
Pla
n Create W
ollondilly - Resourcing S
trategy | Long Term Financial P
lan
CASH FLOW STATEMENT Scenario 2: Optimistic10 Year Financial Plan for the Years ending 30 June 2027
2017/18 2018/19 2019/20 2020/21 2021/22 2022/23 2023/24 2024/25 2025/26 2026/27$ $ $ $ $ $ $ $ $ $
Cash Flows from Operating ActivitiesReceipts:Rates & Annual Charges 39,410,460 44,364,001 47,602,106 51,087,605 54,953,463 59,248,672 64,029,410 69,360,198 75,315,242 81,980,028
User Charges & Fees 5,520,183 6,098,574 6,606,267 7,315,291 7,908,680 8,663,516 9,479,675 10,454,116 11,483,330 12,784,148
Interest & Investment Revenue Received 1,616,518 1,844,563 1,804,391 1,649,385 1,471,901 1,365,534 1,240,186 1,154,136 998,858 897,053
Grants & Contributions 13,315,917 9,551,894 9,691,390 9,865,022 10,172,374 10,315,991 10,630,288 10,866,751 11,216,308 11,481,109
Other 697,470 777,358 762,489 788,030 839,025 872,988 918,562 962,357 1,016,622 1,064,662
Payments:Employee Benefits & On-Costs (22,155,318) (23,827,703) (25,693,469) (26,811,914) (28,819,950) (31,047,518) (33,520,753) (36,277,522) (39,354,616) (42,592,543)
Materials & Contracts (15,123,472) (15,532,086) (16,588,345) (17,668,571) (19,118,439) (20,565,317) (22,238,621) (23,989,326) (26,144,784) (28,338,944)
Borrowing Costs (885,795) (802,659) (686,551) (565,491) (455,281) (360,058) (250,152) (175,801) (134,236) (93,911)
Other (5,415,812) (5,799,388) (6,223,193) (6,992,235) (7,212,246) (7,789,795) (8,432,424) (9,498,806) (9,948,930) (10,844,321)
Net Cash provided (or used in) Operating Activities 16,980,151 16,674,554 17,275,085 18,667,122 19,739,527 20,704,013 21,856,171 22,856,103 24,447,794 26,337,281
Cash Flows from Investing ActivitiesReceipts:Sale of Investment Securities - - - - - - - - - -
Payments:Purchase of Investment Securities - (493,737) (1,821,766) (2,126,211) (2,967,184) (3,507,549) (4,437,160) (6,005,459) (7,153,671) (8,726,595)
Purchase of Infrastructure, Property, Plant & Equipment (17,068,220) (13,098,595) (13,474,595) (14,686,595) (15,013,595) (15,454,595) (15,688,595) (16,012,595) (16,346,595) (16,690,595)
Net Cash provided (or used in) Investing Activities (17,068,220) (13,592,332) (15,296,361) (16,812,806) (17,980,779) (18,962,144) (20,125,755) (22,018,054) (23,500,266) (25,417,190)
Cash Flows from Financing ActivitiesReceipts:Proceeds from Borrowings & Advances 1,000,000 - - - - - - - - -
Proceeds from Finance Leases 120,000 - - - - 120,000 - - - -
Payments:Repayment of Borrowings & Advances (1,630,954) (1,770,422) (1,841,816) (1,696,735) (1,551,819) (1,626,984) (1,439,586) (460,432) (500,331) (384,988)
Repayment of Finance Lease Liabilities (18,985) (22,144) (23,745) (25,462) (27,302) (21,347) (22,144) (23,745) (25,462) (27,302)
Net Cash Flow provided (used in) Financing Activities (529,939) (1,792,566) (1,865,561) (1,722,197) (1,579,121) (1,528,331) (1,461,730) (484,177) (525,793) (412,290)
Net Increase/(Decrease) in Cash & Cash Equivalents (618,008) 1,289,656 113,163 132,119 179,627 213,538 268,686 353,872 421,735 507,801
plus: Cash, Cash Equivalents & Investments - beginning of year 1,843,485 1,225,477 2,515,133 2,628,296 2,760,415 2,940,042 3,153,580 3,422,266 3,776,138 4,197,873
Cash & Cash Equivalents - end of the year 1,225,477 2,515,133 2,628,296 2,760,415 2,940,042 3,153,580 3,422,266 3,776,138 4,197,873 4,705,674
Cash & Cash Equivalents - end of the year 1,225,477 2,515,133 2,628,296 2,760,415 2,940,042 3,153,580 3,422,266 3,776,138 4,197,873 4,705,674
Investments - end of the year 47,041,025 47,787,549 49,937,664 52,447,931 55,860,852 59,918,046 65,023,052 71,746,623 79,759,631 89,407,865
Cash, Cash Equivalents & Investments - end of the year
48,266,502 50,302,682 52,565,960 55,208,346 58,800,894 63,071,626 68,445,318 75,522,761 83,957,504 94,113,539
Representing:External Restrictions 24,074,875 24,971,055 26,060,873 26,544,514 27,191,535 28,115,131 29,361,918 30,748,994 32,534,691 34,336,078
Internal Restricitons 15,900,489 24,430,688 20,511,887 16,617,311 12,937,876 9,308,117 5,999,065 4,801,073 4,292,422 5,396,454
Unrestricted 8,291,138 900,940 5,993,202 12,046,523 18,671,485 25,648,379 33,084,335 39,972,694 47,130,394 54,381,010
48,266,502 50,302,683 52,565,962 55,208,348 58,800,896 63,071,627 68,445,318 75,522,761 83,957,507 94,113,542 42 43
Cre
ate
Wol
lond
illy
- R
esou
rcin
g S
trate
gy |
Lon
g Te
rm F
inan
cial
Pla
n Create W
ollondilly - Resourcing S
trategy | Long Term Financial P
lan
2017/18 2018/19 2019/20 2020/21 2021/22 2022/23 2023/24 2024/25 2025/26 2026/27$ $ $ $ $ $ $ $ $ $
Income from Continuing OperationsRevenue:Rates & Annual Charges 39,568,105 43,765,975 45,506,900 47,318,026 49,202,214 51,162,442 53,201,811 55,323,549 57,531,018 59,827,716
User Charges & Fees 5,717,276 6,014,123 6,284,125 6,766,311 6,965,779 7,384,692 7,728,285 8,199,873 8,587,850 9,222,700
Interest & Investment Revenue 1,891,747 2,198,737 2,211,347 2,122,072 2,022,297 2,036,497 2,049,697 2,043,947 2,055,646 2,049,396
Other Revenues 700,739 725,242 750,650 776,999 804,326 832,669 862,066 892,560 924,194 957,012
Grants & Contributions provided for Operating Purposes 7,554,023 7,337,201 7,519,258 7,688,490 7,885,974 8,023,317 8,229,188 8,462,515 8,716,390 8,977,882
Grants & Contributions provided for Capital Purposes 6,122,220 2,372,595 2,482,595 2,482,595 2,597,595 2,597,595 2,712,595 2,712,595 2,812,595 2,812,595
Total Income from Continuing Operations 61,554,110 62,413,873 64,754,875 67,154,493 69,478,185 72,037,212 74,783,642 77,635,039 80,627,693 83,847,301
Expenses from Continuing OperationsEmployee Benefits & On-Costs 22,642,409 23,780,219 25,251,584 25,749,273 26,998,393 28,309,426 29,683,090 31,127,722 32,645,883 34,079,565
Borrowing Costs 882,939 794,646 678,215 557,812 448,258 352,695 243,636 173,717 131,971 92,168
Materials & Contracts 15,152,799 15,313,379 15,995,949 16,640,934 17,425,544 18,248,951 19,112,938 19,975,710 20,880,095 21,821,871
Depreciation & Amortisation 12,527,871 12,527,871 12,571,867 12,610,676 12,665,184 12,719,735 12,774,330 12,828,967 12,883,653 12,940,470
Other Expenses 5,415,812 5,722,016 6,047,014 6,692,048 6,758,451 7,147,645 7,561,156 8,350,619 8,467,782 8,964,523
Total Expenses from Continuing Operations 56,621,830 58,138,131 60,544,629 62,250,743 64,295,830 66,778,452 69,375,150 72,456,735 75,009,384 77,898,597
Net Operating Result for the Year 4,932,280 4,275,742 4,210,246 4,903,750 5,182,355 5,258,760 5,408,492 5,178,304 5,618,309 5,948,704
Net Operating Result before Grants and Contributions provided for Capital Purposes (1,189,940) 1,903,147 1,727,651 2,421,155 2,584,760 2,661,165 2,695,897 2,465,709 2,805,714 3,136,109
INCOME STATEMENT Scenario 3: Conservative10 Year Financial Plan for the Years ending 30 June 2027
44 45
Cre
ate
Wol
lond
illy
- R
esou
rcin
g S
trate
gy |
Lon
g Te
rm F
inan
cial
Pla
n Create W
ollondilly - Resourcing S
trategy | Long Term Financial P
lan
2017/18 2018/19 2019/20 2020/21 2021/22 2022/23 2023/24 2024/25 2025/26 2026/27$ $ $ $ $ $ $ $ $ $
AssetsCurrent AssetsCash & Cash Equivalents 1,225,477 2,509,774 2,587,689 2,649,240 2,718,366 2,776,159 2,837,926 2,926,686 3,017,428 3,117,661
Investments 33,041,109 33,493,933 34,533,730 35,355,158 36,277,667 37,048,935 37,873,244 39,057,780 40,268,772 41,606,416
Receivables 5,127,753 5,303,527 5,515,043 5,783,975 5,980,573 6,233,966 6,479,196 6,768,137 7,043,778 7,392,793
Inventories 2,073,872 2,091,322 2,176,709 2,266,358 2,360,384 2,459,030 2,562,558 2,665,868 2,773,808 2,886,589
Other 240,573 245,621 257,421 273,151 282,940 296,724 311,245 329,879 341,567 357,895
Total Current Assets 41,708,784 43,644,177 45,070,592 46,327,882 47,619,930 48,814,814 50,064,169 51,748,350 53,445,353 55,361,354
Non-Current AssetsInvestments 13,999,916 14,191,782 14,632,357 14,980,406 15,371,284 15,698,079 16,047,349 16,549,251 17,062,363 17,629,139
Infrastructure, Property, Plant & Equipment 444,527,533 445,398,257 446,600,985 448,976,904 451,625,315 454,660,175 457,874,441 461,358,069 465,121,011 469,171,136
Total Non-Current Assets 458,527,449 459,590,039 461,233,342 463,957,310 466,996,599 470,358,254 473,921,790 477,907,320 482,183,374 486,800,275
Total Assets 500,236,233 503,234,216 506,303,934 510,285,192 514,616,529 519,173,068 523,985,959 529,655,670 535,628,727 542,161,629
LiabilitiesCurrent LiabilitiesPayables 4,771,563 4,784,264 4,984,089 5,234,413 5,387,841 5,612,811 5,850,107 6,167,878 6,360,282 6,636,901
Borrowings 1,792,566 1,865,561 1,722,197 1,579,121 1,629,346 1,461,731 484,177 525,793 412,290 330,105
Provisions 7,457,676 7,949,117 8,463,169 9,000,880 9,563,348 10,151,720 10,767,198 11,411,039 12,084,560 12,789,139
Total Current Liabilities 14,021,805 14,598,942 15,169,455 15,814,414 16,580,535 17,226,262 17,101,482 18,104,710 18,857,132 19,756,145
Non-Current Liabilities
Borrowings 10,430,105 8,564,544 6,842,348 5,263,227 3,633,881 2,273,165 1,788,988 1,263,195 850,906 520,801
Provisions 13,187,069 13,197,734 13,208,890 13,220,559 13,232,765 13,245,533 13,258,890 13,272,862 13,287,478 13,302,768
Total Non-Current Liabilities 23,617,174 21,762,278 20,051,238 18,483,786 16,866,646 15,518,698 15,047,878 14,536,057 14,138,384 13,823,569
Total Liabilities 37,638,979 36,361,220 35,220,693 34,298,200 33,447,181 32,744,960 32,149,360 32,640,767 32,995,516 33,579,714 Net Assets 462,597,254 466,872,996 471,083,241 475,986,992 481,169,348 486,428,108 491,836,599 497,014,903 502,633,211 508,581,915
EquityRetained Earnings 322,000,255 326,275,997 330,486,243 335,389,993 340,572,349 345,831,108 351,239,599 356,417,903 362,036,212 367,984,916
Revaluation Reserves 140,597,000 140,597,000 140,597,000 140,597,000 140,597,000 140,597,000 140,597,000 140,597,000 140,597,000 140,597,000
Total Equity 462,597,255 466,872,997 471,083,243 475,986,993 481,169,349 486,428,108 491,836,599 497,014,903 502,633,212 508,581,916
BALANCE SHEET Scenario 3: Conservative10 Year Financial Plan for the Years ending 30 June 2027
46 47

Cre
ate
Wol
lond
illy
- R
esou
rcin
g S
trate
gy |
Lon
g Te
rm F
inan
cial
Pla
n Create W
ollondilly - Resourcing S
trategy | Long Term Financial P
lan
CASH FLOW STATEMENT Scenario 3: Conservative10 Year Financial Plan for the Years ending 30 June 2027
2017/18 2018/19 2019/20 2020/21 2021/22 2022/23 2023/24 2024/25 2025/26 2026/27$ $ $ $ $ $ $ $ $ $
Cash Flows from Operating ActivitiesReceipts:Rates & Annual Charges 39,410,460 43,589,664 45,433,781 47,241,958 49,123,078 51,080,112 53,116,157 55,234,436 57,438,304 59,731,255
User Charges & Fees 5,520,183 5,944,850 6,221,116 6,653,786 6,919,230 7,286,932 7,648,102 8,089,821 8,497,310 9,074,548
Interest & Investment Revenue Received 1,616,518 1,859,980 1,836,106 1,693,688 1,530,808 1,441,064 1,334,629 1,270,177 1,139,495 1,066,196
Grants & Contributions 13,315,917 9,551,894 9,691,390 9,865,022 10,172,374 10,315,991 10,630,288 10,866,751 11,216,308 11,481,109
Other 697,470 773,312 748,638 765,803 806,750 828,736 860,105 887,123 921,637 946,488
Payments:Employee Benefits & On-Costs (22,155,318) (23,392,986) (24,726,377) (25,199,892) (26,423,719) (27,708,286) (29,054,256) (30,469,908) (31,957,746) (33,359,696)
Materials & Contracts (15,123,472) (15,234,678) (15,900,997) (16,507,062) (17,385,297) (18,147,710) (19,005,892) (19,798,121) (20,825,395) (21,695,568)
Borrowing Costs (885,795) (802,659) (686,551) (565,491) (455,281) (360,058) (250,152) (175,801) (134,236) (93,911)
Other (5,415,812) (5,722,016) (6,047,014) (6,692,048) (6,758,451) (7,147,645) (7,561,156) (8,350,619) (8,467,782) (8,964,523)
Net Cash provided (or used in) Operating Activities 16,980,151 16,567,361 16,570,092 17,255,764 17,529,492 17,589,136 17,717,825 17,553,859 17,827,895 18,185,898
Cash Flows from Investing ActivitiesReceipts:Sale of Investment Securities - - - - - - - - - -
Payments:Purchase of Investment Securities - (391,903) (1,152,023) (785,420) (867,650) (548,418) (505,732) (968,327) (864,766) (982,782)
Purchase of Infrastructure, Property, Plant & Equipment (17,068,220) (13,098,595) (13,474,595) (14,686,595) (15,013,595) (15,454,595) (15,688,595) (16,012,595) (16,346,595) (16,690,595)
Net Cash provided (or used in) Investing Activities (17,068,220) (13,490,498) (14,626,618) (15,472,015) (15,881,245) (16,003,013) (16,194,327) (16,980,922) (17,211,361) (17,673,377)
Cash Flows from Financing ActivitiesReceipts:Proceeds from Borrowings & Advances 1,000,000 - - - - - - - - -
Proceeds from Finance Leases 120,000 - - - - 120,000 - - - -
Payments:Repayment of Borrowings & Advances (1,630,954) (1,770,422) (1,841,816) (1,696,735) (1,551,819) (1,626,984) (1,439,586) (460,432) (500,331) (384,988)
Repayment of Finance Lease Liabilities (18,985) (22,144) (23,745) (25,462) (27,302) (21,347) (22,144) (23,745) (25,462) (27,302)
Net Cash Flow provided (used in) Financing Activities (529,939) (1,792,566) (1,865,561) (1,722,197) (1,579,121) (1,528,331) (1,461,730) (484,177) (525,793) (412,290)
Net Increase/(Decrease) in Cash & Cash Equivalents (618,008) 1,284,297 77,913 61,552 69,126 57,792 61,768 88,760 90,741 100,231
plus: Cash, Cash Equivalents & Investments - beginning of year 1,843,485 1,225,477 2,509,774 2,587,687 2,649,239 2,718,365 2,776,157 2,837,925 2,926,685 3,017,426
Cash & Cash Equivalents - end of the year 1,225,477 2,509,774 2,587,687 2,649,239 2,718,365 2,776,157 2,837,925 2,926,685 3,017,426 3,117,657
Cash & Cash Equivalents - end of the year 1,225,477 2,509,774 2,587,687 2,649,239 2,718,365 2,776,157 2,837,925 2,926,685 3,017,426 3,117,657
Investments - end of the year 47,041,025 47,685,715 49,166,087 50,335,564 51,648,951 52,747,014 53,920,593 55,607,032 57,331,135 59,235,555
Cash, Cash Equivalents & Investments - end of the year
48,266,502 50,195,489 51,753,774 52,984,803 54,367,316 55,523,171 56,758,518 58,533,717 60,348,561 62,353,212
Representing:External Restrictions 24,074,875 24,971,055 26,060,873 26,544,514 27,191,535 28,115,131 29,361,918 30,748,994 32,534,691 34,336,078
Internal Restricitons 15,900,489 24,430,688 20,511,887 16,617,311 12,937,876 9,308,117 5,999,065 4,801,073 4,292,422 5,396,454
Unrestricted 8,291,138 793,747 5,181,016 9,822,979 14,237,906 18,099,925 21,397,535 22,983,651 23,521,451 22,620,684
48,266,502 50,195,490 51,753,776 52,984,804 54,367,317 55,523,173 56,758,518 58,533,718 60,348,564 62,353,216 48 49
Create W
ollondilly - Resourcing S
trategy | Long Term Financial P
lan
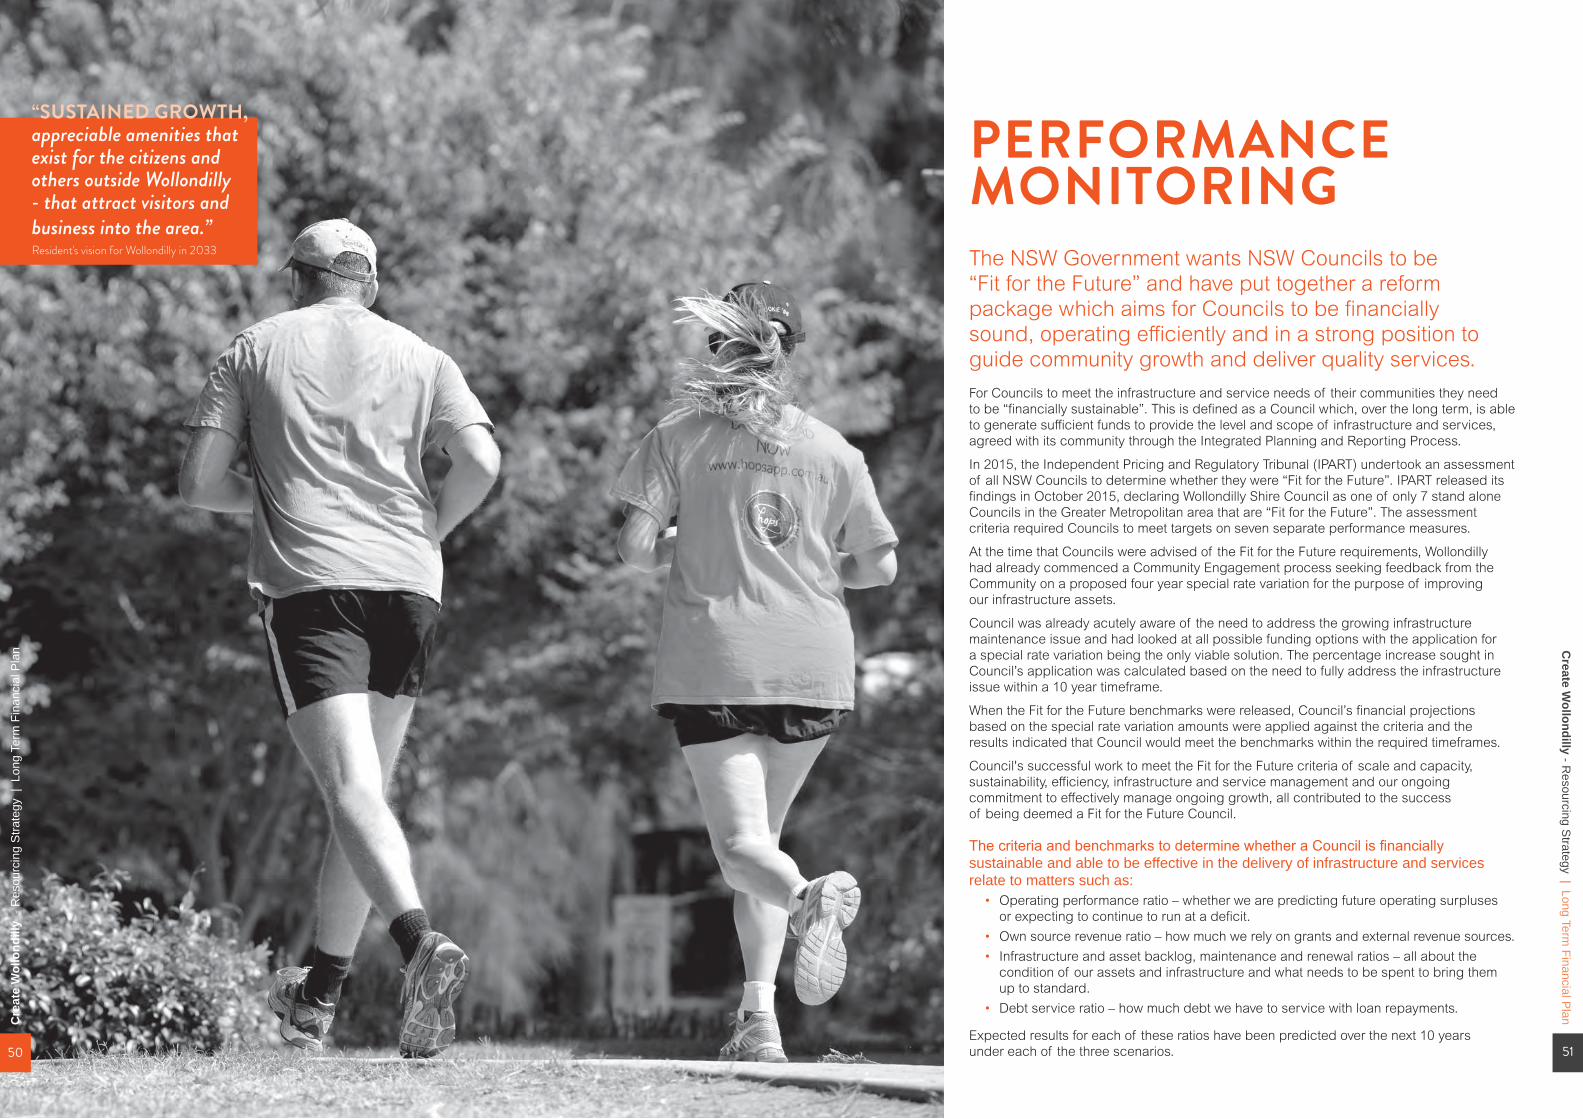
“SUSTAINED GROWTH, appreciable amenities that exist for the citizens and others outside Wollondilly - that attract visitors and business into the area.”Resident's vision for Wollondilly in 2033
PERFORMANCE MONITORINGThe NSW Government wants NSW Councils to be “Fit for the Future” and have put together a reform package which aims for Councils to be financially sound, operating efficiently and in a strong position to guide community growth and deliver quality services. For Councils to meet the infrastructure and service needs of their communities they need to be “financially sustainable”. This is defined as a Council which, over the long term, is able to generate sufficient funds to provide the level and scope of infrastructure and services, agreed with its community through the Integrated Planning and Reporting Process.
In 2015, the Independent Pricing and Regulatory Tribunal (IPART) undertook an assessment of all NSW Councils to determine whether they were “Fit for the Future”. IPART released its findings in October 2015, declaring Wollondilly Shire Council as one of only 7 stand alone Councils in the Greater Metropolitan area that are “Fit for the Future”. The assessment criteria required Councils to meet targets on seven separate performance measures.
At the time that Councils were advised of the Fit for the Future requirements, Wollondilly had already commenced a Community Engagement process seeking feedback from the Community on a proposed four year special rate variation for the purpose of improving our infrastructure assets.
Council was already acutely aware of the need to address the growing infrastructure maintenance issue and had looked at all possible funding options with the application for a special rate variation being the only viable solution. The percentage increase sought in Council’s application was calculated based on the need to fully address the infrastructure issue within a 10 year timeframe.
When the Fit for the Future benchmarks were released, Council’s financial projections based on the special rate variation amounts were applied against the criteria and the results indicated that Council would meet the benchmarks within the required timeframes.
Council's successful work to meet the Fit for the Future criteria of scale and capacity, sustainability, efficiency, infrastructure and service management and our ongoing commitment to effectively manage ongoing growth, all contributed to the success of being deemed a Fit for the Future Council.
The criteria and benchmarks to determine whether a Council is financially sustainable and able to be effective in the delivery of infrastructure and services relate to matters such as:
• Operating performance ratio – whether we are predicting future operating surpluses or expecting to continue to run at a deficit.
• Own source revenue ratio – how much we rely on grants and external revenue sources.• Infrastructure and asset backlog, maintenance and renewal ratios – all about the
condition of our assets and infrastructure and what needs to be spent to bring them up to standard.
• Debt service ratio – how much debt we have to service with loan repayments.
Expected results for each of these ratios have been predicted over the next 10 years under each of the three scenarios. 51
Cre
ate
Wol
lond
illy
- R
esou
rcin
g S
trate
gy |
Lon
g Te
rm F
inan
cial
Pla
n
50
Create W
ollondilly - Resourcing S
trategy | Long Term Financial P
lan
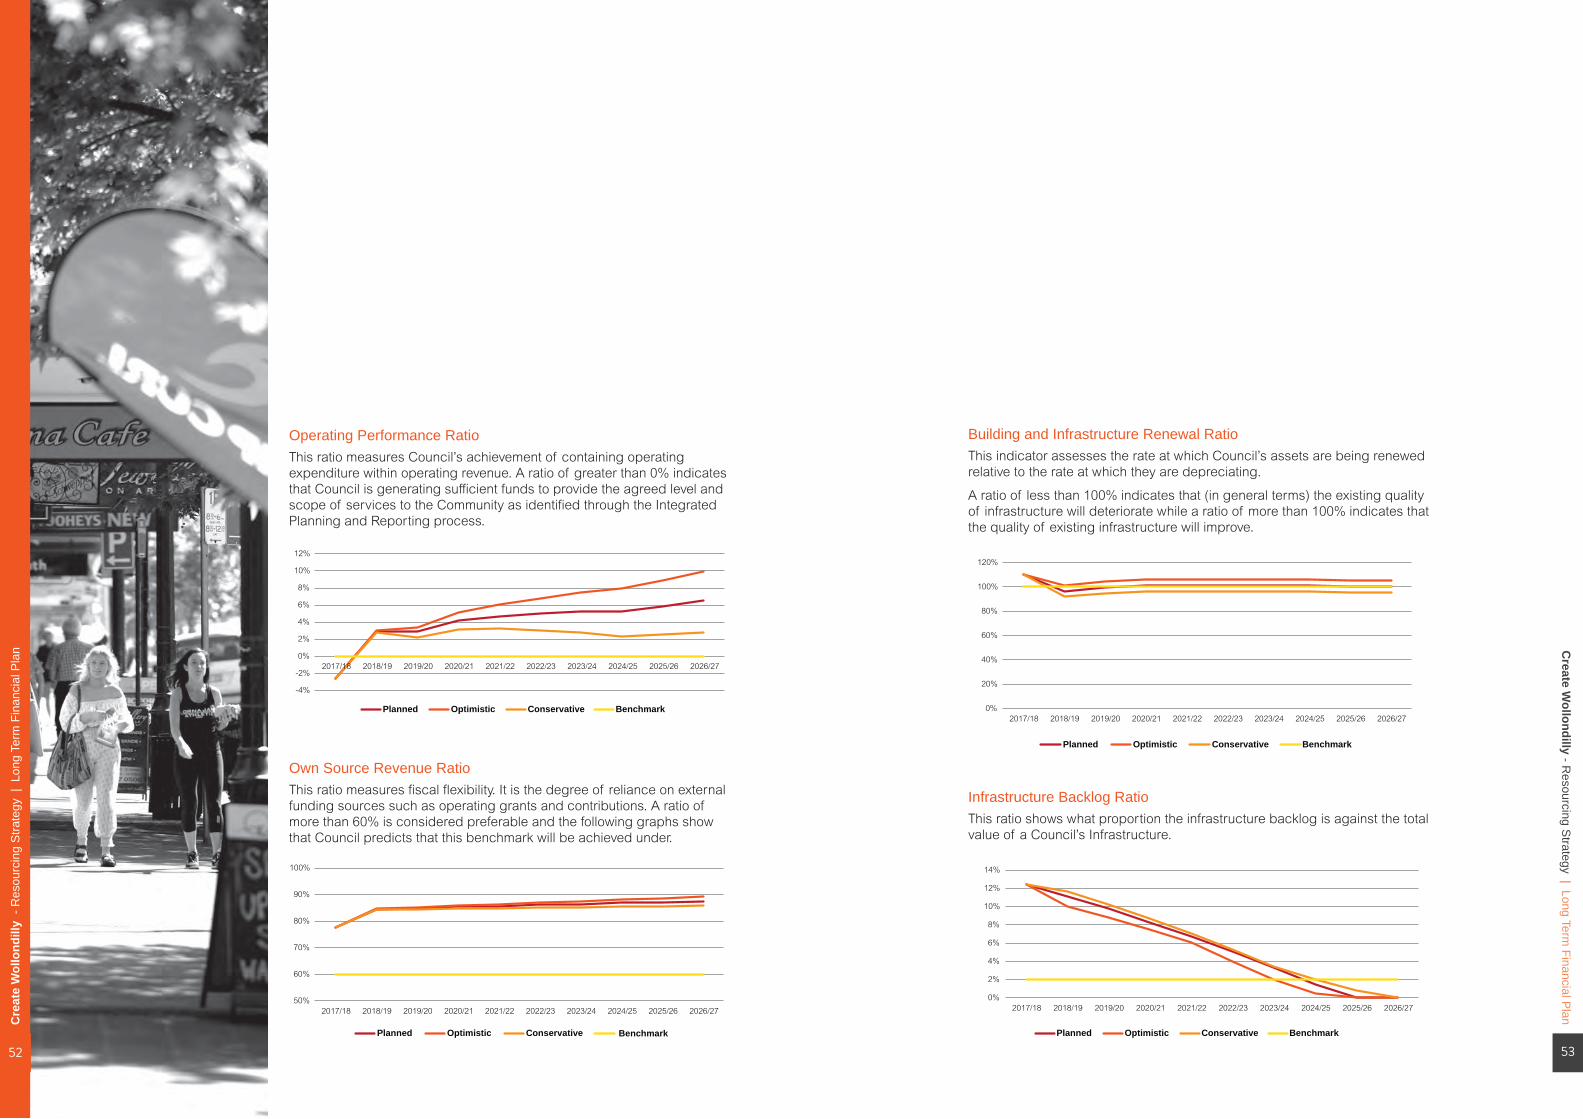
Operating Performance RatioThis ratio measures Council’s achievement of containing operating expenditure within operating revenue. A ratio of greater than 0% indicates that Council is generating sufficient funds to provide the agreed level and scope of services to the Community as identified through the Integrated Planning and Reporting process.
Own Source Revenue RatioThis ratio measures fiscal flexibility. It is the degree of reliance on external funding sources such as operating grants and contributions. A ratio of more than 60% is considered preferable and the following graphs show that Council predicts that this benchmark will be achieved under.
Building and Infrastructure Renewal RatioThis indicator assesses the rate at which Council’s assets are being renewed relative to the rate at which they are depreciating.
A ratio of less than 100% indicates that (in general terms) the existing quality of infrastructure will deteriorate while a ratio of more than 100% indicates that the quality of existing infrastructure will improve.
Infrastructure Backlog RatioThis ratio shows what proportion the infrastructure backlog is against the total value of a Council’s Infrastructure.
-4%
-2%
0%
2%
4%
6%
8%
10%
12%
2017/18 2018/19 2019/20 2020/21 2021/22 2022/23 2023/24 2024/25 2025/26 2026/27
Planned Optimistic Conservative Benchmark
Operating Performance Ratio
50%
60%
70%
80%
90%
100%
2017/18 2018/19 2019/20 2020/21 2021/22 2022/23 2023/24 2024/25 2025/26 2026/27
Own Source Revenue Ratio
Planned Optimistic Conservative Benchmark
0%
20%
40%
60%
80%
100%
120%
2017/18 2018/19 2019/20 2020/21 2021/22 2022/23 2023/24 2024/25 2025/26 2026/27
Building and Infrastructure Asset Renewal Ratio
Planned Optimistic Conservative Benchmark
Planned Optimistic Conservative Benchmark
Planned Optimistic Conservative Benchmark
Planned Optimistic Conservative Benchmark
Infrastructure Backlog Ratio
Asset Maintenance Ratio
Debt Service Ratio
0%
2%
4%
6%
8%
10%
12%
14%
2017/18 2018/19 2019/20 2020/21 2021/22 2022/23 2023/24 2024/25 2025/26 2026/27
0%
20%
40%
60%
80%
100%
120%
140%
160%
2017/18 2018/19 2019/20 2020/21 2021/22 2022/23 2023/24 2024/25 2025/26 2026/27
0%
2%
4%
6%
8%
10%
12%
2017/18 2018/19 2019/20 2020/21 2021/22 2022/23 2023/24 2024/25 2025/26 2026/27
53
Cre
ate
Wol
lond
illy
- R
esou
rcin
g S
trate
gy |
Lon
g Te
rm F
inan
cial
Pla
n
52
Cre
ate
Wol
lond
illy
- R
esou
rcin
g S
trate
gy |
Lon
g Te
rm F
inan
cial
Pla
n
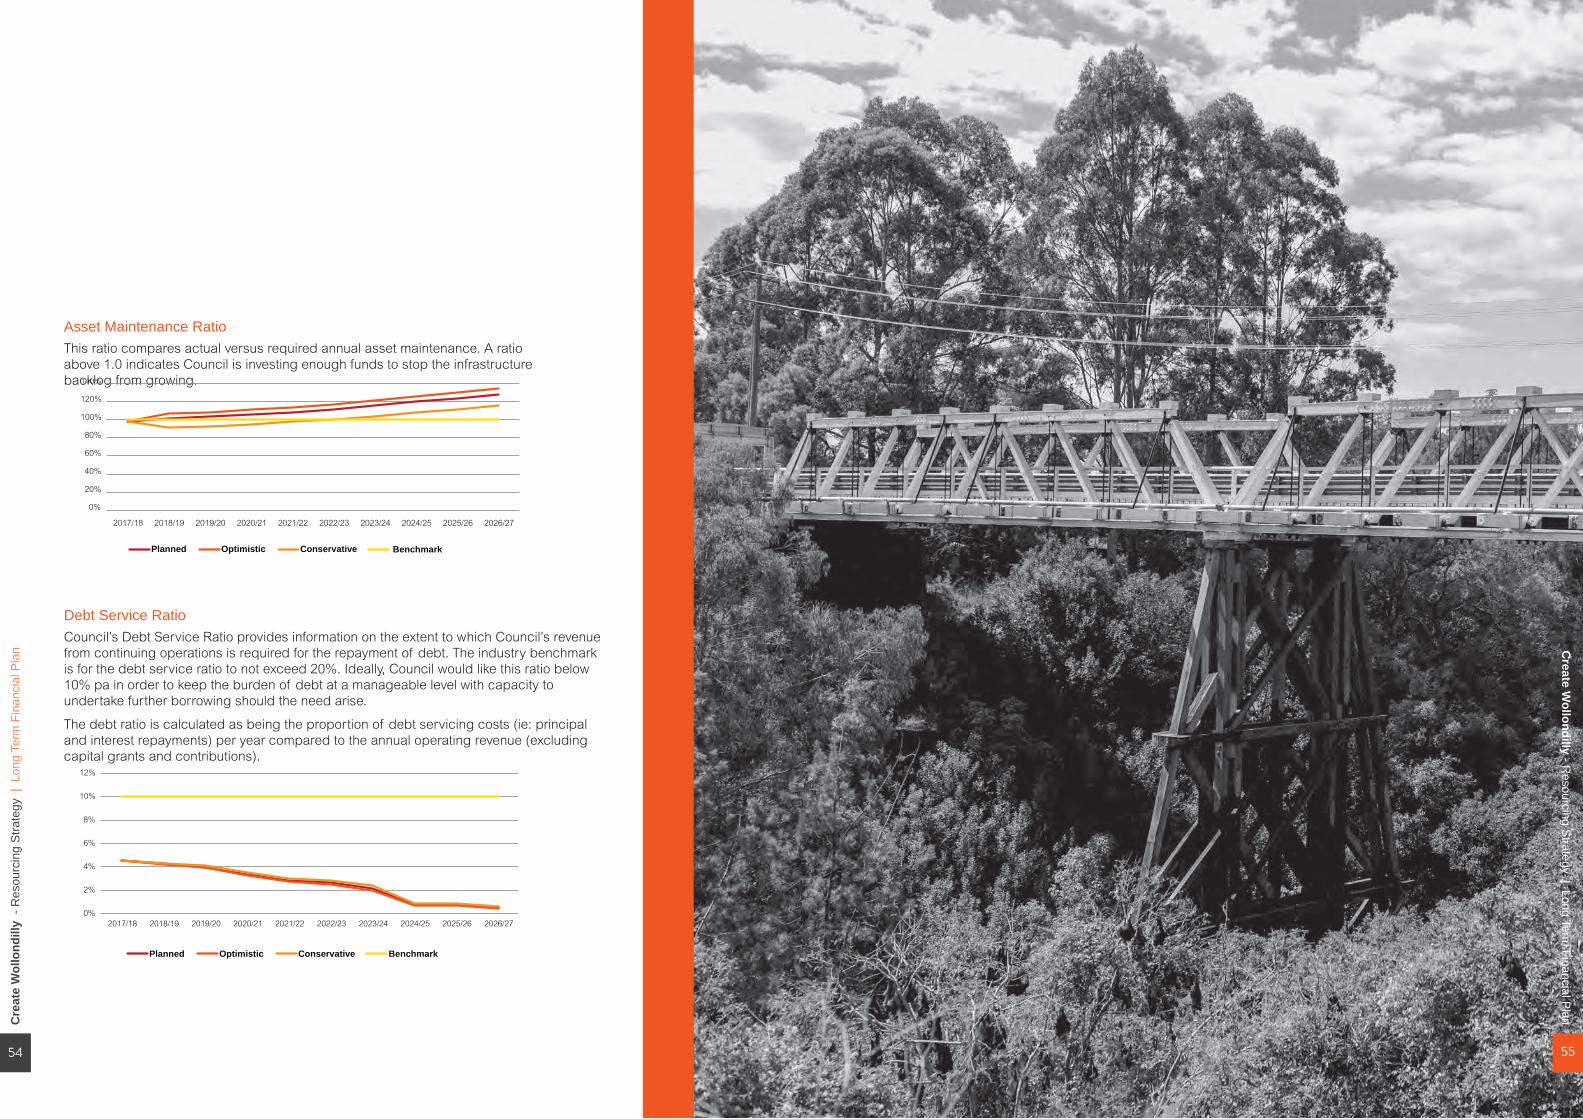
Asset Maintenance RatioThis ratio compares actual versus required annual asset maintenance. A ratio above 1.0 indicates Council is investing enough funds to stop the infrastructure backlog from growing.
Debt Service RatioCouncil’s Debt Service Ratio provides information on the extent to which Council’s revenue from continuing operations is required for the repayment of debt. The industry benchmark is for the debt service ratio to not exceed 20%. Ideally, Council would like this ratio below 10% pa in order to keep the burden of debt at a manageable level with capacity to undertake further borrowing should the need arise.
The debt ratio is calculated as being the proportion of debt servicing costs (ie: principal and interest repayments) per year compared to the annual operating revenue (excluding capital grants and contributions).
Planned Optimistic Conservative Benchmark
Planned Optimistic Conservative Benchmark
Planned Optimistic Conservative Benchmark
Infrastructure Backlog Ratio
Asset Maintenance Ratio
Debt Service Ratio
0%
2%
4%
6%
8%
10%
12%
14%
2017/18 2018/19 2019/20 2020/21 2021/22 2022/23 2023/24 2024/25 2025/26 2026/27
0%
20%
40%
60%
80%
100%
120%
140%
160%
2017/18 2018/19 2019/20 2020/21 2021/22 2022/23 2023/24 2024/25 2025/26 2026/27
0%
2%
4%
6%
8%
10%
12%
2017/18 2018/19 2019/20 2020/21 2021/22 2022/23 2023/24 2024/25 2025/26 2026/27
Planned Optimistic Conservative Benchmark
Planned Optimistic Conservative Benchmark
Planned Optimistic Conservative Benchmark
Infrastructure Backlog Ratio
Asset Maintenance Ratio
Debt Service Ratio
0%
2%
4%
6%
8%
10%
12%
14%
2017/18 2018/19 2019/20 2020/21 2021/22 2022/23 2023/24 2024/25 2025/26 2026/27
0%
20%
40%
60%
80%
100%
120%
140%
160%
2017/18 2018/19 2019/20 2020/21 2021/22 2022/23 2023/24 2024/25 2025/26 2026/27
0%
2%
4%
6%
8%
10%
12%
2017/18 2018/19 2019/20 2020/21 2021/22 2022/23 2023/24 2024/25 2025/26 2026/27
Create W
ollondilly - Resourcing S
trategy | Long Term Financial P
lan
5554

2ASSET MANAGEMENT STRATEGY2017/18 - 2026/27
SECTIO
N
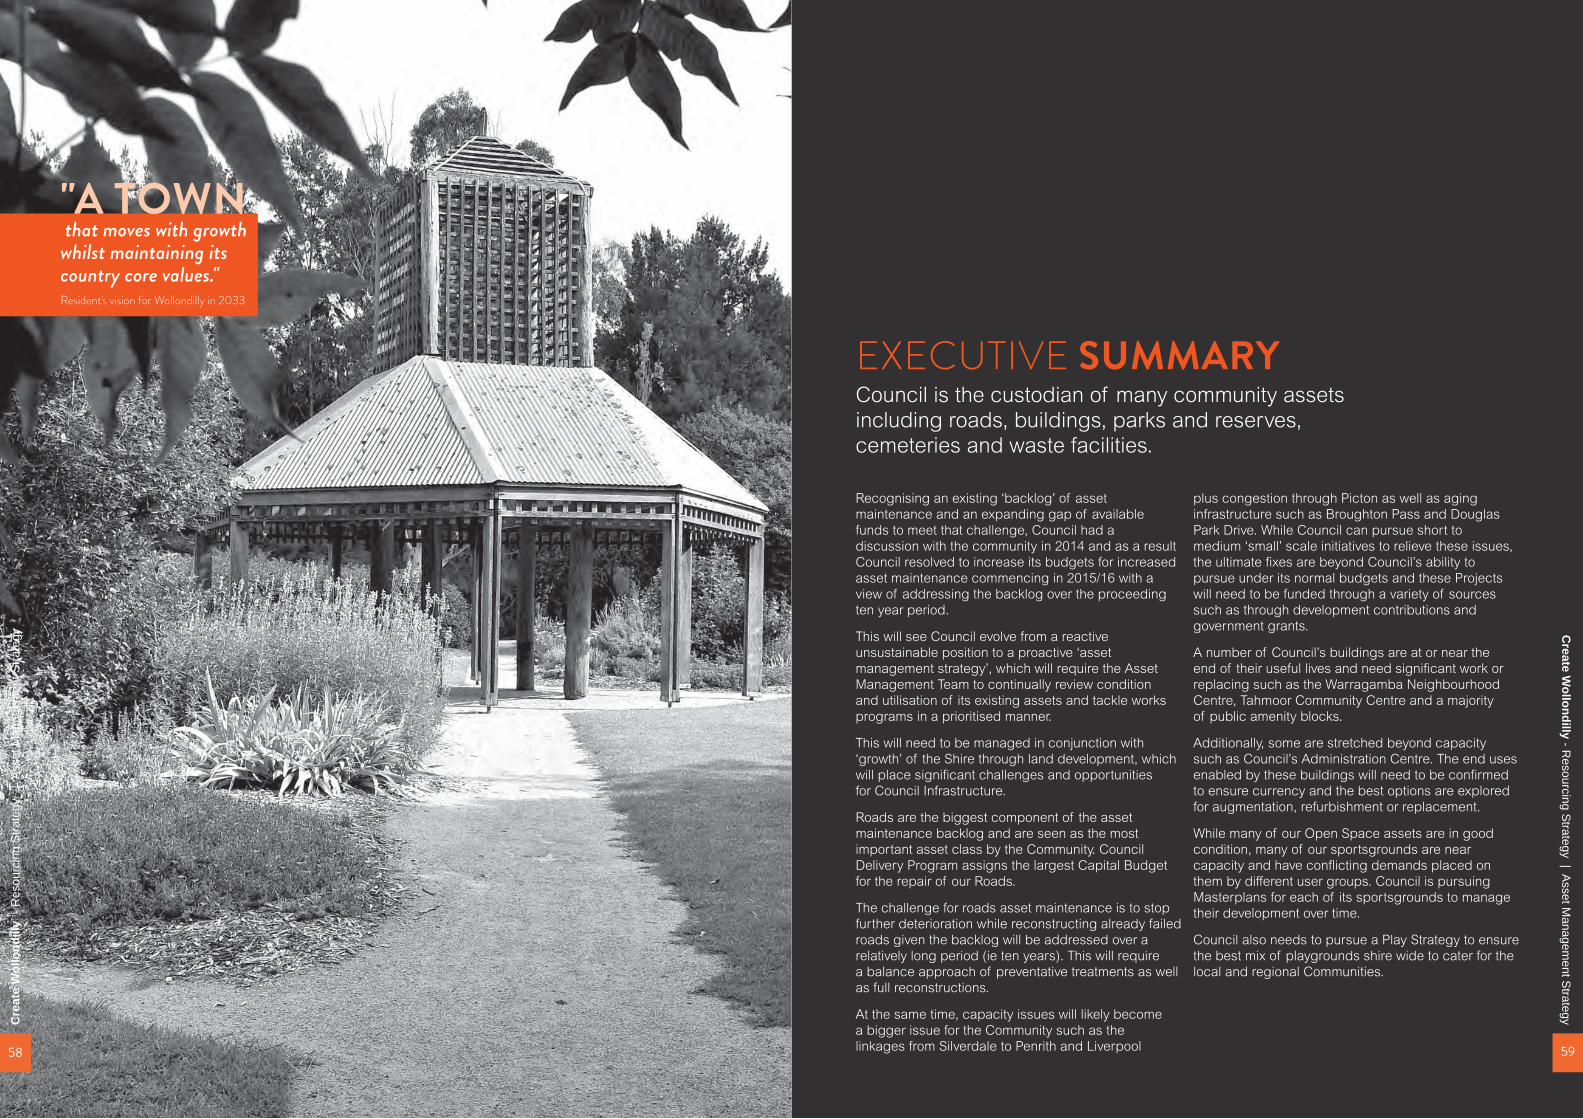
EXECUTIVE SUMMARYCouncil is the custodian of many community assets including roads, buildings, parks and reserves, cemeteries and waste facilities.
Recognising an existing ‘backlog’ of asset maintenance and an expanding gap of available funds to meet that challenge, Council had a discussion with the community in 2014 and as a result Council resolved to increase its budgets for increased asset maintenance commencing in 2015/16 with a view of addressing the backlog over the proceeding ten year period.
This will see Council evolve from a reactive unsustainable position to a proactive ‘asset management strategy’, which will require the Asset Management Team to continually review condition and utilisation of its existing assets and tackle works programs in a prioritised manner.
This will need to be managed in conjunction with ‘growth’ of the Shire through land development, which will place significant challenges and opportunities for Council Infrastructure.
Roads are the biggest component of the asset maintenance backlog and are seen as the most important asset class by the Community. Council Delivery Program assigns the largest Capital Budget for the repair of our Roads.
The challenge for roads asset maintenance is to stop further deterioration while reconstructing already failed roads given the backlog will be addressed over a relatively long period (ie ten years). This will require a balance approach of preventative treatments as well as full reconstructions.
At the same time, capacity issues will likely become a bigger issue for the Community such as the linkages from Silverdale to Penrith and Liverpool
plus congestion through Picton as well as aging infrastructure such as Broughton Pass and Douglas Park Drive. While Council can pursue short to medium ‘small’ scale initiatives to relieve these issues, the ultimate fixes are beyond Council’s ability to pursue under its normal budgets and these Projects will need to be funded through a variety of sources such as through development contributions and government grants.
A number of Council’s buildings are at or near the end of their useful lives and need significant work or replacing such as the Warragamba Neighbourhood Centre, Tahmoor Community Centre and a majority of public amenity blocks.
Additionally, some are stretched beyond capacity such as Council’s Administration Centre. The end uses enabled by these buildings will need to be confirmed to ensure currency and the best options are explored for augmentation, refurbishment or replacement.
While many of our Open Space assets are in good condition, many of our sportsgrounds are near capacity and have conflicting demands placed on them by different user groups. Council is pursuing Masterplans for each of its sportsgrounds to manage their development over time.
Council also needs to pursue a Play Strategy to ensure the best mix of playgrounds shire wide to cater for the local and regional Communities.
"A TOWN that moves with growth whilst maintaining its country core values."Resident's vision for Wollondilly in 2033
Cre
ate
Wol
lond
illy
- R
esou
rcin
g S
trate
gy
| A
sset
Man
agem
ent S
trate
gy Create W
ollondilly - Resourcing S
trategy | Asset M
anagement S
trategy
58 59
Following an extensive community engagement program during the second half of 2014, Wollondilly Shire Council submitted an application for a Special Rate Variation (SRV) of 10.8% pa over four years for the purpose of funding its increasing asset maintenance. The Independent Pricing and Regulatory Tribunal (IPART) approved this application in full, allowing Council to increase its general rate revenue by 10.8% each year from 2015/16 to 2018/19. With the input of these additional funds, the projected asset backlog is estimated to be addressed over a ten year program, assuming no external factors affect Council’s ability to do so (such as natural disasters impacting on community Infrastructure and Council’s resources).
The challenge arising from the implementation program for the additional funding is that the funds are not available immediately for works. It will take time to receive the additional income and apply it to delivering the asset renewal program such that our assets meet the needs and expectations of the community. Additionally, many projects require substantial pre-planning and preparatory work such as geotechnical investigations and detailed engineering designs.
The need for asset maintenance and renewal will grow as residential and employment lands are developed with the accompanying provision of new or improved infrastructure. As an example, our future growth will require the capacity of the road network to improve to cater for increasing vehicle volumes. Some of the recognised areas for future road improvements (such as road linkages between Silverdale and Wallacia, linkages through or around Picton, linkages around and into Wilton New Town and around Appin) require significant resources beyond Council’s capacity in the short term. As such, these will only be achieved through multi-agency commitment and funding.
INTRODUCTIONCouncil is the custodian of many community assets including roads, buildings, parks and reserves, cemeteries and waste facilities. A major asset review in 2010 found a substantial and ongoing shortfall in the funding required to maintain our assets in a satisfactory condition. If not addressed, the overall condition of Council’s assets would have continued to deteriorate, posing a risk that key assets will no longer be able to provide safe and appropriate services to the community.
It is important to understand that infrastructure provision within Wollondilly needs to be appropriate to our rural setting and character. This means that infrastructure provision and service levels will at times be significantly different to those experienced in more urban settings. Given the size of our Shire, this is not only a financial practicality, but also appropriate for the retention of our rural setting and character.
The scale and geographic spread of our Shire is such that we will always have a high reliance on private vehicles. The challenge will be to achieve greater provision of public transport and active transport options (cycling and walking) to encourage people to reduce private vehicle usage where possible. Public and alternate transport arrangements are, however, relatively poor compared to more urbanised areas, with limited bus services and infrequent diesel train services that terminate at Campbelltown. Also, there are issues with the unreliability of passenger train services on the Southern Highlands line given that freight trains using this line are prioritised over passenger trains. Many in our community are reliant on this poor public transport network to access work, education or other needs such as health and social services. This is a particular issue for the sections of our community who have high levels of need but limited access to private transport (e.g. the aged, youth, people with disabilities). Council will continue to advocate to the State Government for improvements to public transport in the Shire.
Road safety is a major community issue, with higher than average crash rates across the Shire, particularly for our younger drivers. Growth in population will see more users on the roads and a greater need to provide a safe transport network.
Wollondilly Shire has significant bushland areas and remote towns and villages, which means we face a significant bushfire threat not only in our rural areas, but also in many of our residential areas. This is in addition to the risks of storms, flooding, and significant transport incidents, with both the Hume Motorway and Sydney/Melbourne Rail Corridor crossing almost the entire length of our Shire.
In addition to maintaining our existing infrastructure, we will continue to plan for new or improved infrastructure for the existing and new members of our community as well as lobbying for additional resources from other levels of government.
Areas that we will be looking into include:• Infrastructure and facilities for the planned
development of Wilton New Town.• Connectivity improvements in Warragamba and
Silverdale that relate to opportunities that may arise from the planned Western Sydney Airport and associated economic growth.
• Road safety as well as vehicle and pedestrian connectivity improvements across the Shire.
• A Picton by-pass.• The Picton to Tahmoor cycleway.• Flood plain management in Picton.• Improvements to sporting and
recreational facilities. • Revising the Section 94 Developer Contribution
Plan as a source of funds to deliver new community infrastructure.
• Planning for new or improved tourism facilities to support tourism related economic activity.
Other infrastructure elements such as sewer, water and telecommunications are managed by other tiers of government or private companies. Ongoing lobbying over a number of years has resulted in significant improvements to sewer coverage, while the current rollout of the NBN will improve access to high quality communications.
Wollondilly’s setting includes farmland and natural areas located between separate towns and villages and residents experience and value this setting irrespective of where and how they live. Infrastructure provision and service levels will at times be significantly different to those experienced in more urban settings. Given the size of our Shire, this is not only a financial practicality, but also appropriate for the retention of our rural setting and character.
OUTCOMES – what do we want?1. Infrastructure that is safe, accessible
and fit for purpose.
2. Infrastructure that is sustainably maintained.
3. Infrastructure that delivers upon the expectations and needs of our growing community.
Create W
ollondilly - Resourcing S
trategy | Asset M
anagement S
trategy
61
Cre
ate
Wol
lond
illy
- R
esou
rcin
g S
trate
gy
| A
sset
Man
agem
ent S
trate
gy
60
Strategy IN1 – Improve the Condition of our Road Network
• Manage, maintain and improve our road network to meet the needs of the community, now and into the future.
Strategy IN2 – Provision of Infrastructure and Facilities
• Provide a range of infrastructure and community facilities to meet the needs of the community, now and into the future.
Strategy IN3 – Manage Infrastructure and Facilities
• Manage infrastructure and community facilities to provide for and respond to community needs, improve safety and improve choices.
Strategy IN4 – Emergency Management• Assist in the planning of the
community’s response to emergencies such as bushfires and flooding.
Strategy IN5 – Advocacy • Advocate strongly for the interests
of Wollondilly and its community in relation to infrastructure outcomes.
ASSET MANAGEMENT The term ‘asset management’ describes the process for ‘whole of life’ asset management from planning, purchase, operation, and maintenance to decommissioning or disposal of assets. It also encompasses integration of asset and service outcomes.Council’s Asset Management supports our communities by delivering safe, maintained and effective infrastructure and needs to address the Community Strategic Plan; namely:
Council’s asset management is supported by three key documents:1. Strategic Asset Management Policy The Strategic Asset Management Policy sets out to ensure adequate provision is made for the long-term replacement of Council’s major assets by:
• Ensuring that Council’s services and infrastructure are provided in a sustainable manner, with the appropriate levels of service to residents, visitors and the environment.
• Safeguarding Council assets by implementing appropriate asset management strategies and appropriate financial resources for those assets.
• Creating an environment where all Council employees take an integral part in overall management of Council assets by creating and sustaining a proactive asset management culture throughout the Council.
• Meeting legislative requirements for asset management.• Ensuring resources and operational capabilities are identified and responsibility for
asset management is allocated.• Demonstrating transparent and responsible asset management processes that align
with demonstrated best practice.2. Asset Management Strategy The Asset Management Strategy covers the following essential elements:
• The Asset Management Strategy and Plan/s for a minimum timeframe of 10 years; • Identifies assets that are critical to the Council’s operations and outlines the risk
management strategies for these assets; and • Includes specific actions required to improve the Council’s asset management capability
and projected resource requirements and timeframes.3. Asset Management Plans Plans for all assets under a Council’s control, which identify asset service standards and contain long-term (at least 10 years) projections of asset maintenance, rehabilitation and replacement costs. These costs are then reflected in the Long-Term Financial Plan.
When undertaking its asset management planning, Council reviews its assets to determine that they are fit for purpose; that is, that they support the council’s achievement of the Delivery Program and community goals and outcomes identified in the Community Strategic Plan.
Cre
ate
Wol
lond
illy
- R
esou
rcin
g S
trate
gy |
Ass
et M
anag
emen
t Stra
tegy
Create W
ollondilly - Resourcing S
trategy | Asset M
anagement S
trategy
62 63
CRITICAL COUNCIL ASSETS
Council’s main classes of infrastructure asset, namely Transport, Buildings, Open Space and Stormwater Drainage facilities, exist primarily to provide services to the community. Most of these services are affected by Council’s ability to provide and maintain these assets.
In line with its review of critical assets and the asset maintenance backlog, Council has reviewed its Asset Management Plans (AMP) for its critical asset classes Transport, Buildings and Open Space.
Each AMP includes provision for capital, renewal, operational and maintenance works which will provide infrastructure with the necessary resources in an endeavour to meet community expectations for agreed service standards and capacity. The AMPs outline processes and principles used to plan capital, renewal and maintenance works for key assets and prioritise capital works in the asset class throughout the local government area. The AMPs will help to guide the Council in making
decisions within its 10 year CSP objectives. The result is a long-term planning framework, including expenditure forecasts which will assist in making informed decisions on future maintenance programs and renewal and capital projects.
AMPs include information on:• Asset data summaries – what Council owns, what the network is valued at and its most
recent assessed condition;• Levels of service – defining the quality of the service to be delivered by the asset;• Future demand – how this will impact on future service delivery and how this
is to be met; • Life cycle management – how Council will optimise the management of its existing
and future assets to provide the required services;• Prioritised capital, renewal and maintenance works;• How risk is managed; and• Financial summary – what funds are required to provide the agreed service levels.
The information flowing into AMPs include:• The asset register data on location, size, age, value, condition and remaining
life of the asset network;• The unit rates for classes of work/resources and materials;• Performance relative to service levels;• Projections of factors affecting future demand for services;• Correlations between maintenance and renewal, including decay models;• Data on new assets developed or acquired by Council;• Data on works programs and trends;• The resulting budget, valuation and depreciation projections; and• Lifecycle analysis data.
This information impacts the Council’s long term financial plan, strategic business plan, annual budget and departmental business plans and budgets.
Using established criteria, assets in each category are listed in order of priority for capital improvement. The following section below details an overview on infrastructure assets classes extracted from their respective AMPs.
Cre
ate
Wol
lond
illy
- R
esou
rcin
g S
trate
gy |
Ass
et M
anag
emen
t Stra
tegy
Create W
ollondilly - Resourcing S
trategy | Asset M
anagement S
trategy
64 65
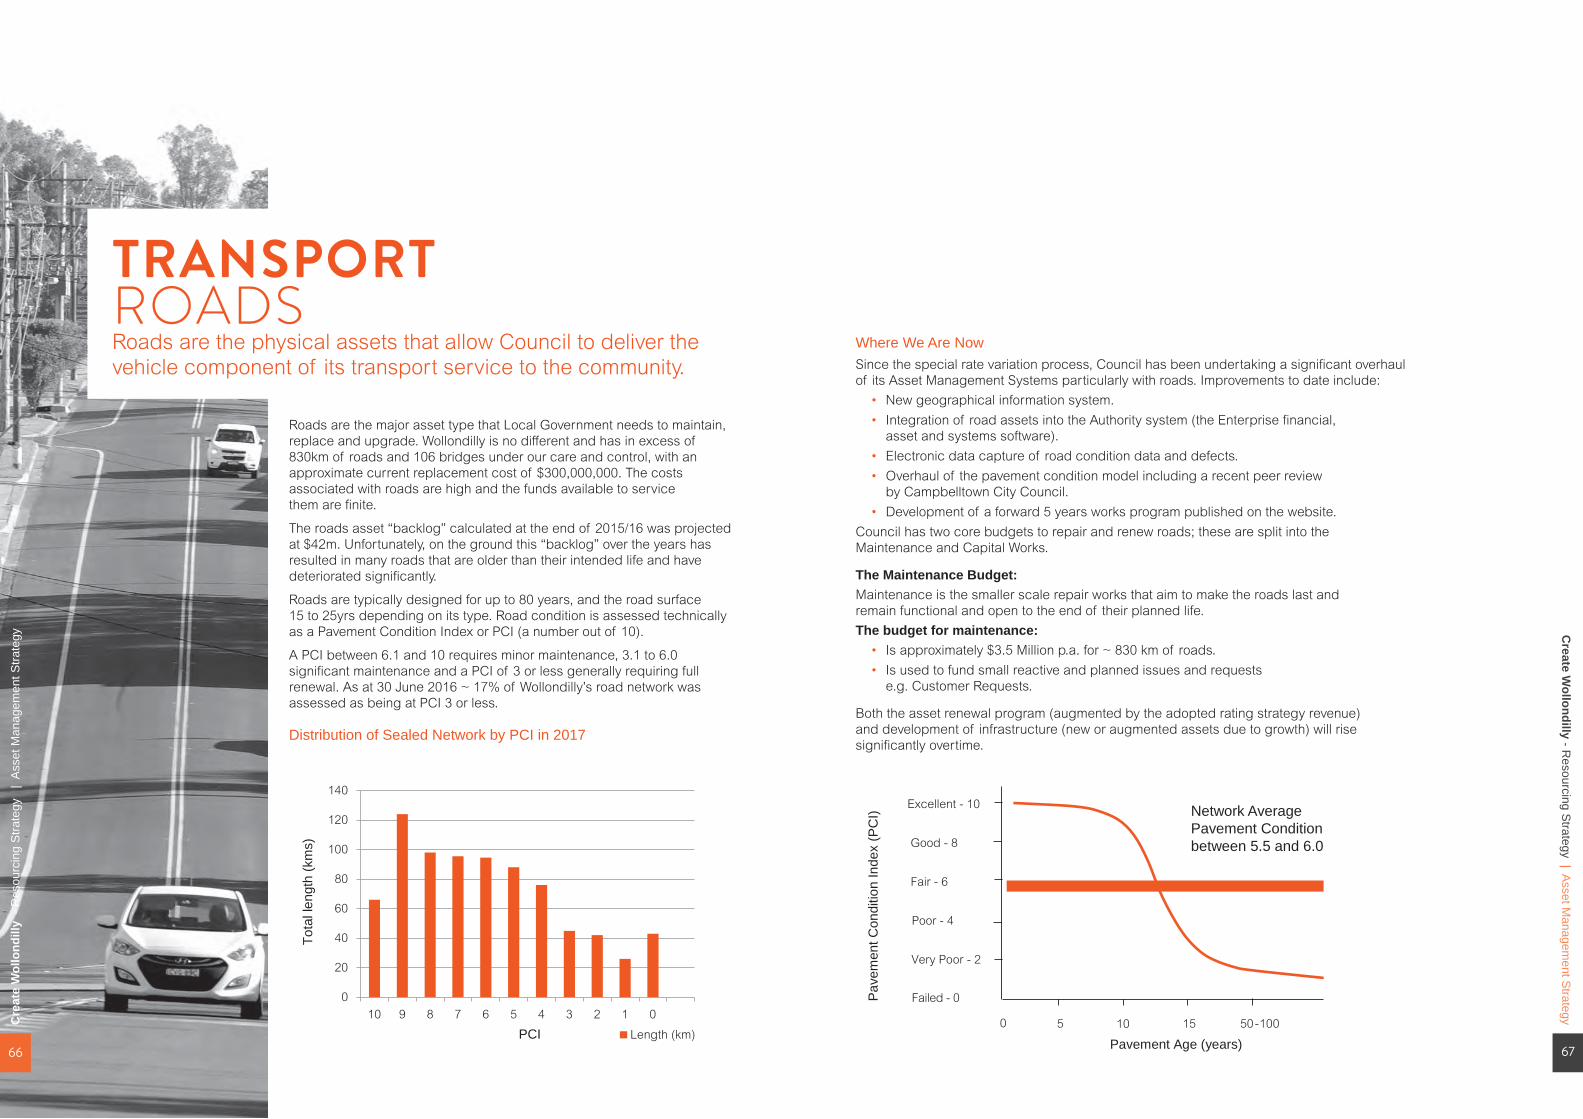
Roads are the major asset type that Local Government needs to maintain, replace and upgrade. Wollondilly is no different and has in excess of 830km of roads and 106 bridges under our care and control, with an approximate current replacement cost of $300,000,000. The costs associated with roads are high and the funds available to service them are finite.
The roads asset “backlog” calculated at the end of 2015/16 was projected at $42m. Unfortunately, on the ground this “backlog” over the years has resulted in many roads that are older than their intended life and have deteriorated significantly.
Roads are typically designed for up to 80 years, and the road surface 15 to 25yrs depending on its type. Road condition is assessed technically as a Pavement Condition Index or PCI (a number out of 10).
A PCI between 6.1 and 10 requires minor maintenance, 3.1 to 6.0 significant maintenance and a PCI of 3 or less generally requiring full renewal. As at 30 June 2016 ~ 17% of Wollondilly’s road network was assessed as being at PCI 3 or less.
Distribution of Sealed Network by PCI in 2017
TRANSPORTROADSRoads are the physical assets that allow Council to deliver the vehicle component of its transport service to the community.
Where We Are NowSince the special rate variation process, Council has been undertaking a significant overhaul of its Asset Management Systems particularly with roads. Improvements to date include:
• New geographical information system.• Integration of road assets into the Authority system (the Enterprise financial,
asset and systems software).• Electronic data capture of road condition data and defects.• Overhaul of the pavement condition model including a recent peer review
by Campbelltown City Council.• Development of a forward 5 years works program published on the website.
Council has two core budgets to repair and renew roads; these are split into the Maintenance and Capital Works.
The Maintenance Budget:Maintenance is the smaller scale repair works that aim to make the roads last and remain functional and open to the end of their planned life. The budget for maintenance:
• Is approximately $3.5 Million p.a. for ~ 830 km of roads.• Is used to fund small reactive and planned issues and requests
e.g. Customer Requests.
Both the asset renewal program (augmented by the adopted rating strategy revenue) and development of infrastructure (new or augmented assets due to growth) will rise significantly overtime.
0
20
40
60
80
100
120
140
10 9 8 7 6 5 4 3 2 1 0
Tota
l len
gth
(km
s)
PCI Length (km)
Excellent - 10
Fair - 6
Poor - 4
Very Poor - 2
Failed - 0
Good - 8
Pave
men
t Con
ditio
n In
dex
(PC
I)
0 15 50-1005 10
Pavement Age (years)
Network AveragePavement Conditionbetween 5.5 and 6.0
Create W
ollondilly - Resourcing S
trategy | Asset M
anagement S
trategy
67
Cre
ate
Wol
lond
illy
- R
esou
rcin
g S
trate
gy
| A
sset
Man
agem
ent S
trate
gy
66
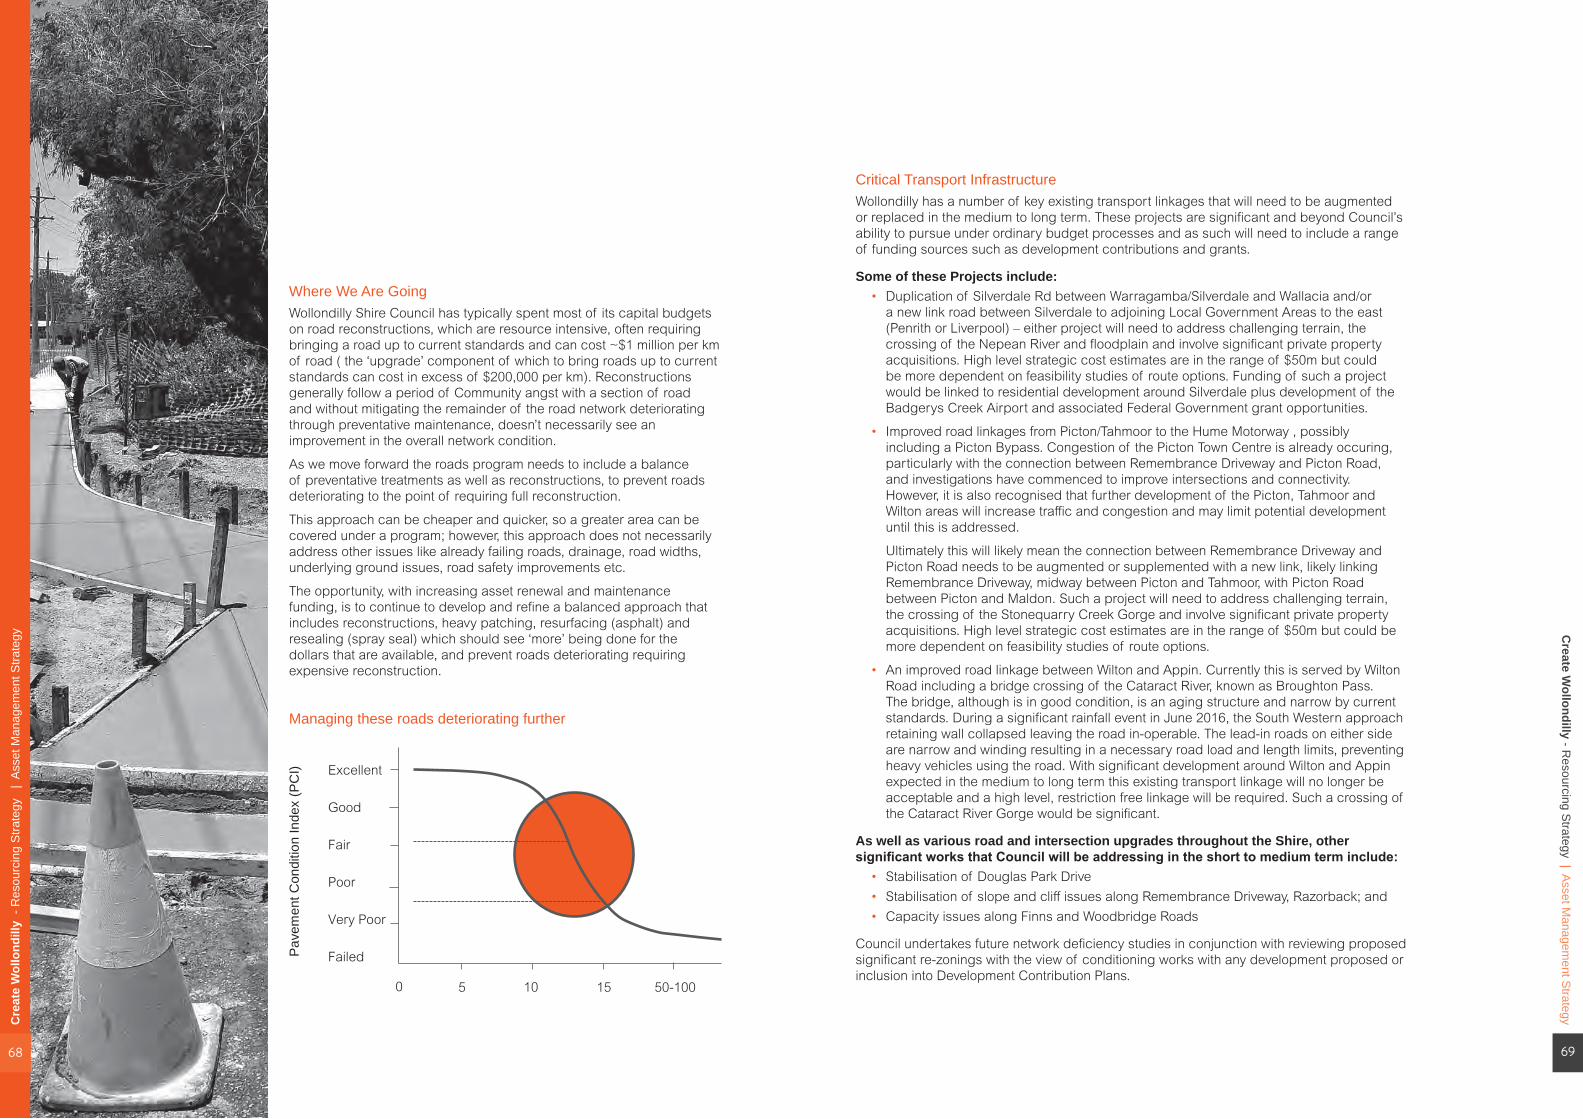
Where We Are GoingWollondilly Shire Council has typically spent most of its capital budgets on road reconstructions, which are resource intensive, often requiring bringing a road up to current standards and can cost ~$1 million per km of road ( the ‘upgrade’ component of which to bring roads up to current standards can cost in excess of $200,000 per km). Reconstructions generally follow a period of Community angst with a section of road and without mitigating the remainder of the road network deteriorating through preventative maintenance, doesn’t necessarily see an improvement in the overall network condition.
As we move forward the roads program needs to include a balance of preventative treatments as well as reconstructions, to prevent roads deteriorating to the point of requiring full reconstruction.
This approach can be cheaper and quicker, so a greater area can be covered under a program; however, this approach does not necessarily address other issues like already failing roads, drainage, road widths, underlying ground issues, road safety improvements etc.
The opportunity, with increasing asset renewal and maintenance funding, is to continue to develop and refine a balanced approach that includes reconstructions, heavy patching, resurfacing (asphalt) and resealing (spray seal) which should see ‘more’ being done for the dollars that are available, and prevent roads deteriorating requiring expensive reconstruction.
Managing these roads deteriorating further
Critical Transport InfrastructureWollondilly has a number of key existing transport linkages that will need to be augmented or replaced in the medium to long term. These projects are significant and beyond Council’s ability to pursue under ordinary budget processes and as such will need to include a range of funding sources such as development contributions and grants.
Some of these Projects include:• Duplication of Silverdale Rd between Warragamba/Silverdale and Wallacia and/or
a new link road between Silverdale to adjoining Local Government Areas to the east (Penrith or Liverpool) – either project will need to address challenging terrain, the crossing of the Nepean River and floodplain and involve significant private property acquisitions. High level strategic cost estimates are in the range of $50m but could be more dependent on feasibility studies of route options. Funding of such a project would be linked to residential development around Silverdale plus development of the Badgerys Creek Airport and associated Federal Government grant opportunities.
• Improved road linkages from Picton/Tahmoor to the Hume Motorway , possibly including a Picton Bypass. Congestion of the Picton Town Centre is already occuring, particularly with the connection between Remembrance Driveway and Picton Road, and investigations have commenced to improve intersections and connectivity. However, it is also recognised that further development of the Picton, Tahmoor and Wilton areas will increase traffic and congestion and may limit potential development until this is addressed.
Ultimately this will likely mean the connection between Remembrance Driveway and Picton Road needs to be augmented or supplemented with a new link, likely linking Remembrance Driveway, midway between Picton and Tahmoor, with Picton Road between Picton and Maldon. Such a project will need to address challenging terrain, the crossing of the Stonequarry Creek Gorge and involve significant private property acquisitions. High level strategic cost estimates are in the range of $50m but could be more dependent on feasibility studies of route options.
• An improved road linkage between Wilton and Appin. Currently this is served by Wilton Road including a bridge crossing of the Cataract River, known as Broughton Pass. The bridge, although is in good condition, is an aging structure and narrow by current standards. During a significant rainfall event in June 2016, the South Western approach retaining wall collapsed leaving the road in-operable. The lead-in roads on either side are narrow and winding resulting in a necessary road load and length limits, preventing heavy vehicles using the road. With significant development around Wilton and Appin expected in the medium to long term this existing transport linkage will no longer be acceptable and a high level, restriction free linkage will be required. Such a crossing of the Cataract River Gorge would be significant.
As well as various road and intersection upgrades throughout the Shire, other significant works that Council will be addressing in the short to medium term include:
• Stabilisation of Douglas Park Drive• Stabilisation of slope and cliff issues along Remembrance Driveway, Razorback; and• Capacity issues along Finns and Woodbridge Roads
Council undertakes future network deficiency studies in conjunction with reviewing proposed significant re-zonings with the view of conditioning works with any development proposed or inclusion into Development Contribution Plans.
Excellent
Fair
Poor
Very Poor
Failed
Good
Pave
men
t Con
ditio
n In
dex
(PC
I)
0 15 50-1005 10
Create W
ollondilly - Resourcing S
trategy | Asset M
anagement S
trategy
69
Cre
ate
Wol
lond
illy
- R
esou
rcin
g S
trate
gy
| A
sset
Man
agem
ent S
trate
gy
68
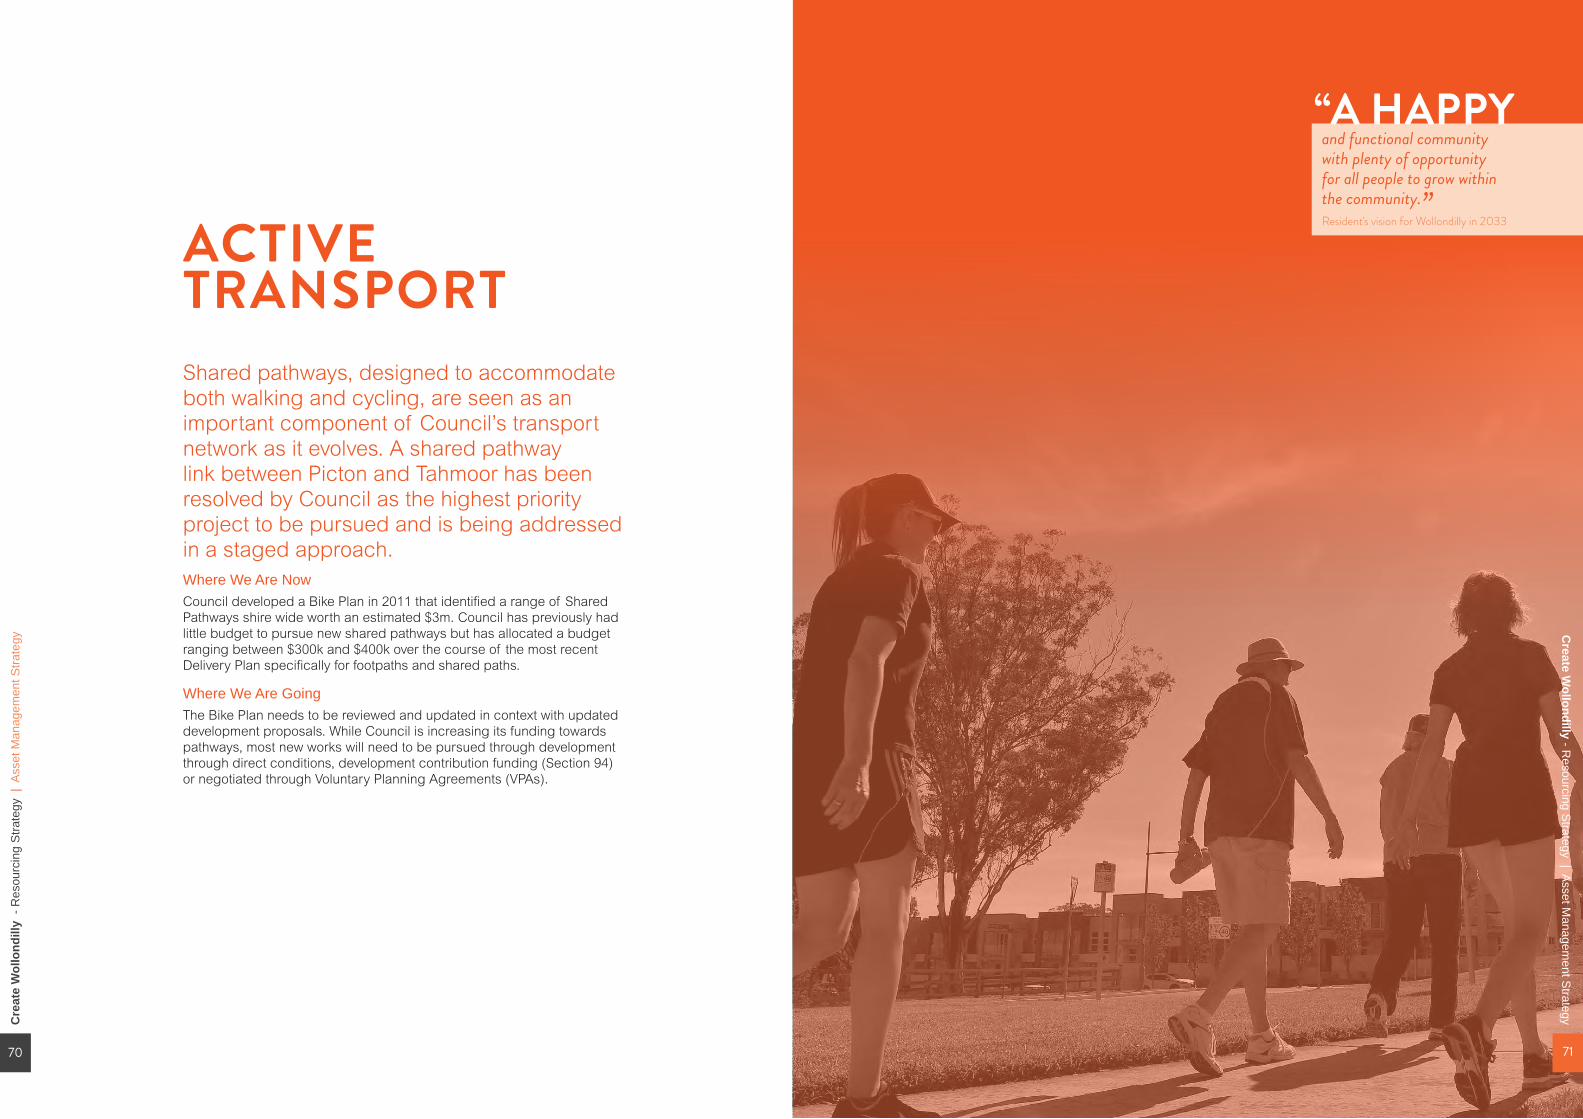
ACTIVE TRANSPORTShared pathways, designed to accommodate both walking and cycling, are seen as an important component of Council’s transport network as it evolves. A shared pathway link between Picton and Tahmoor has been resolved by Council as the highest priority project to be pursued and is being addressed in a staged approach.Where We Are NowCouncil developed a Bike Plan in 2011 that identified a range of Shared Pathways shire wide worth an estimated $3m. Council has previously had little budget to pursue new shared pathways but has allocated a budget ranging between $300k and $400k over the course of the most recent Delivery Plan specifically for footpaths and shared paths.
Where We Are GoingThe Bike Plan needs to be reviewed and updated in context with updated development proposals. While Council is increasing its funding towards pathways, most new works will need to be pursued through development through direct conditions, development contribution funding (Section 94) or negotiated through Voluntary Planning Agreements (VPAs).
“A HAPPY and functional community with plenty of opportunity for all people to grow within the community.” Resident's vision for Wollondilly in 2033
Create W
ollondilly - Resourcing S
trategy | Asset M
anagement S
trategy
71
Cre
ate
Wol
lond
illy
- R
esou
rcin
g S
trate
gy |
Ass
et M
anag
emen
t Stra
tegy
70

BUILDINGS
Council owns and/or manages 175 buildings/facilities. These assets are operated and maintained in partnership with user groups to ensure customer and community service levels are met.The Wollondilly Council buildings portfolio comprises:
• Council Office and Administration Centre;• Council Works Depot;• Public Halls;• Library;• Childcare Centres and Youth Centre;• Amenities/Toilets;• Sheds; • Sports/aquatic Facilities; and• Other (i.e. rotunda and picnic shelters in parks, radio transmission
stations, and animal management buildings).
The current provision of community buildings in the Shire reflects the relatively small and dispersed pattern of population. Facilities which meet local needs (and some district needs), are scattered among the townships and villages however the Shire lacks major regional facilities and contemporary facilities that are built for purpose.
The major land release scheduled for Wilton Junction has the potential for an additional 50,000 population over the next 30 years, along with 10,000 new jobs. Additionally, there are a large number of other development proposals across the Shire that will sharply accelerate the population of the Shire.
Where We Are NowA comprehensive assessment of building condition was performed in 2015 identifying and prioritising over 1200 items/components across Council’s 175 buildings for maintenance or replacement based on condition (not necessarily utilisation of the building).
Many of these items are relatively minor and are currently being pursued. However; some of the buildings as a whole are at or near the end of their lives and require replacing or consolidation, at today’s standards, such as Thirlmere Community Hall (currently closed) and many of our Public Toilets.
As at 30 June 2016 ~ 10.5% of Council’s buildings were assessed to be below satisfactory in condition.
Council’s aging Building portfolio has the expected presence of asbestos which needs to be managed in accordance with legislation and community expectations. This will require the labelling of asbestos components which will be rolled out in 2017.
Where We Are GoingThe condition assessments need to be kept current and up to date but need to be married with an assessment of utilisation to ensure that Council’s stock of buildings evolves with the Community’s needs and wants.
For example: • The Thirlmere Community Hall could be replaced by a multi-use facility located at the
Thirlmere Sports Ground. • A multi-use/consolidated amenities block has been identified for Dudley Chesham Oval. • The neighbourhood centre in Warragamba is nearing the end of its life and a review needs
to be carried out to the intended use and best site for its replacement. • A Public Amenity replacement program needs to be developed incorporating standard
designs that can be readily implemented in a prioritised staged manner over time. • Asbestos components need to be replaced in a staged approach over time.
As the Shire grows and the requirement for operational resources grows with it, the infrastructure to support those resources will need to be provided as well as the discussion of how this infrastructure is distributed throughout the shire e.g. a centralised administration building and depot.
Cre
ate
Wol
lond
illy
- R
esou
rcin
g S
trate
gy |
Ass
et M
anag
emen
t Stra
tegy
Create W
ollondilly - Resourcing S
trategy | Asset M
anagement S
trategy
72 73
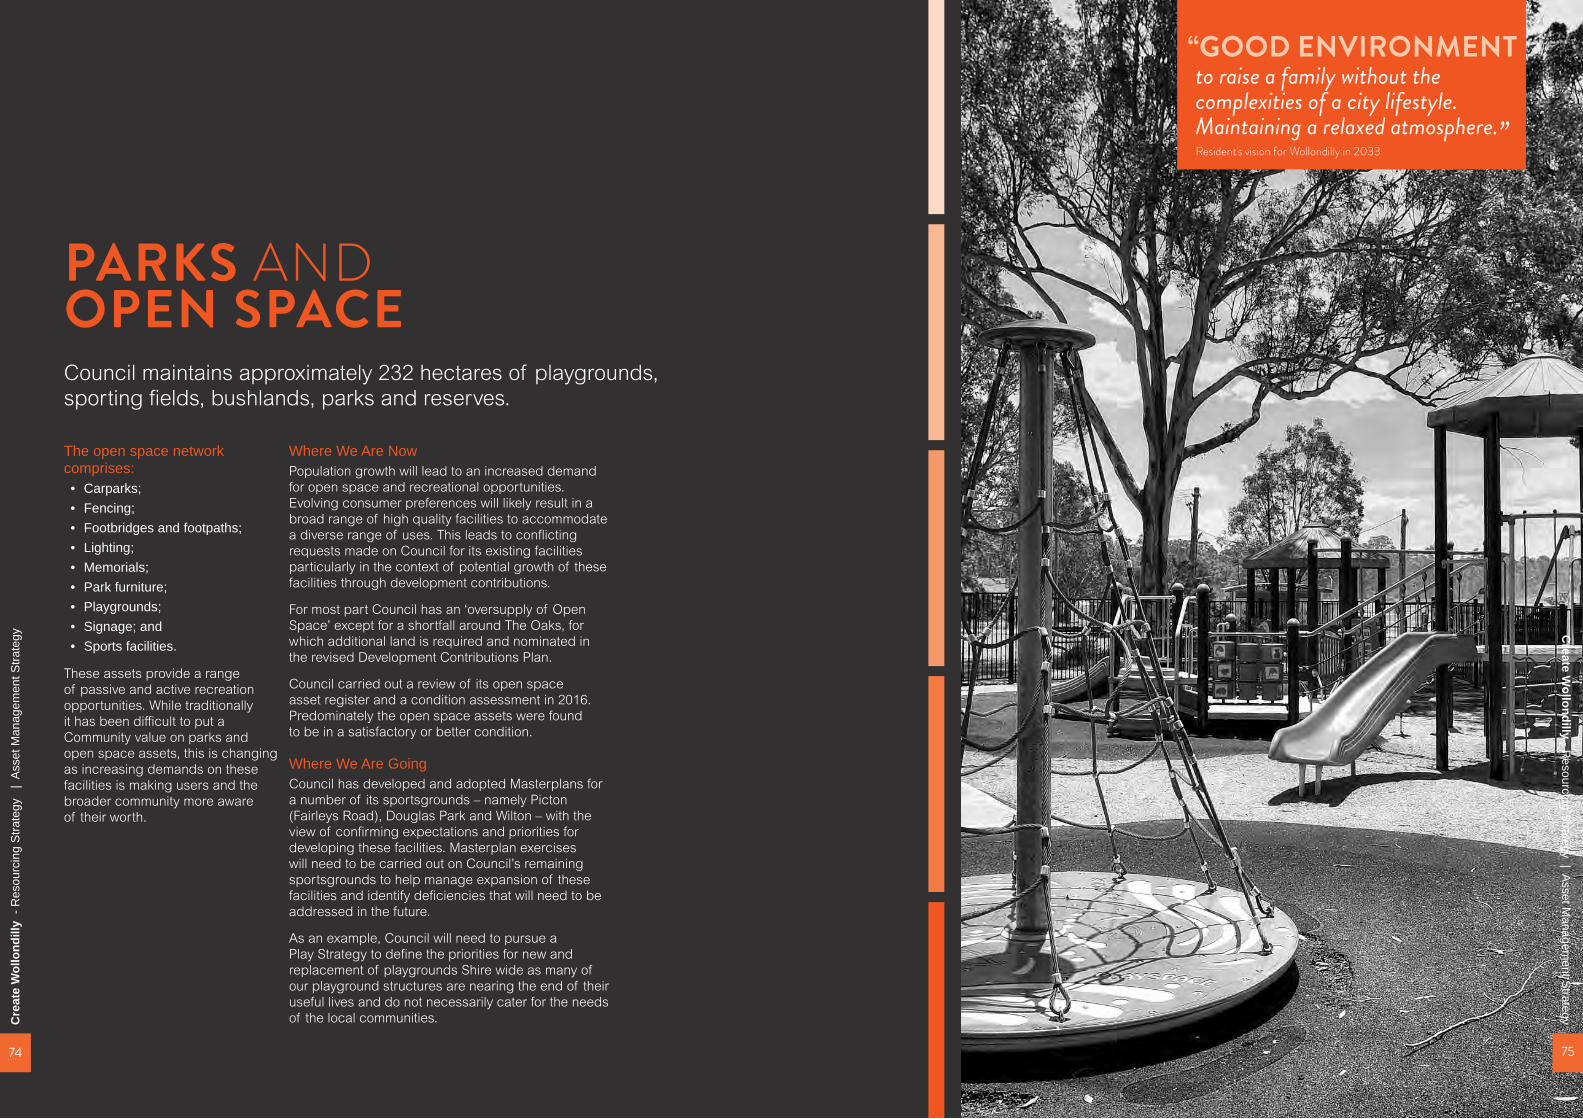
PARKS AND OPEN SPACE Council maintains approximately 232 hectares of playgrounds, sporting fields, bushlands, parks and reserves.
The open space network comprises:• Carparks;• Fencing;• Footbridges and footpaths; • Lighting;• Memorials;• Park furniture;• Playgrounds;• Signage; and• Sports facilities.
These assets provide a range of passive and active recreation opportunities. While traditionally it has been difficult to put a Community value on parks and open space assets, this is changing as increasing demands on these facilities is making users and the broader community more aware of their worth.
Where We Are NowPopulation growth will lead to an increased demand for open space and recreational opportunities. Evolving consumer preferences will likely result in a broad range of high quality facilities to accommodate a diverse range of uses. This leads to conflicting requests made on Council for its existing facilities particularly in the context of potential growth of these facilities through development contributions.
For most part Council has an ‘oversupply of Open Space’ except for a shortfall around The Oaks, for which additional land is required and nominated in the revised Development Contributions Plan.
Council carried out a review of its open space asset register and a condition assessment in 2016. Predominately the open space assets were found to be in a satisfactory or better condition.
Where We Are GoingCouncil has developed and adopted Masterplans for a number of its sportsgrounds – namely Picton (Fairleys Road), Douglas Park and Wilton – with the view of confirming expectations and priorities for developing these facilities. Masterplan exercises will need to be carried out on Council’s remaining sportsgrounds to help manage expansion of these facilities and identify deficiencies that will need to be addressed in the future.
As an example, Council will need to pursue a Play Strategy to define the priorities for new and replacement of playgrounds Shire wide as many of our playground structures are nearing the end of their useful lives and do not necessarily cater for the needs of the local communities.
“GOOD ENVIRONMENT to raise a family without the complexities of a city lifestyle. Maintaining a relaxed atmosphere.” Resident's vision for Wollondilly in 2033
Cre
ate
Wol
lond
illy
- R
esou
rcin
g S
trate
gy
| A
sset
Man
agem
ent S
trate
gy Create W
ollondilly - Resourcing S
trategy | Asset M
anagement S
trategy
74 75

STORMWATER DRAINAGE
Council manages an extensive network of pipes, pits, open drains and natural water courses throughout the Shire which is becoming increasing significant with increasing population densities in formerly rural areas. Current subdivisions standards also sees the introduction of a diverse new range of water quality and quantity devices with Council inheriting many of these including on site detention basins, gross pollutant traps, rain gardens etc.
Where We Are NowCouncil’s stormwater register was last updated in 2009 and the condition assessment at the time was ‘good’. However; due to the underground nature of many of the assets it is likely that Council’s stormwater register is not complete and a thorough review of the register is required. This exercise would be significant requiring substantial field work.
The villages of Yanderra and Buxton as well as parts of Tahmoor have ill-defined drainage systems that need to be assessed and upgraded overtime, and likely include a mix of kerb and gutter as well as a underground stormwater system.
Council’s existing stormwater improvement program currently has 105 projects competing for resource and budget. Funding is primarily by the Stormwater Management Fee which typically can fund 2 to 3 projects per year, depending on complexity. Community requests can create additional projects exceeding this quantity.
Where We Are GoingCouncil will undertake a significant review of its stormwater network, updating the asset register and carrying out condition assessments.
Stormwater strategy plans need to be pursued for large scale areas such as Yanderra and Buxton with assessment of priorities and staging.
The stormwater improvement program ‘backlog’ will only be addressed through a mixture of funding sources including the Stormwater Management Fee and additionally through including conditions of consent on private development, grant funding and additional Council funds as they become available.
Current land development specifications require significant stormwater infrastructure to mitigate adverse impacts of development on stormwater quality and quantity and, as such, land development will create infrastructure such as detention basins, water sensitive urban design features, gross pollutant traps etc, all requiring regular inspections, operations and maintenance.
This could create a significant asset maintenance burden on Council if not controlled through the development process. Council recently adopted a Dedication of Land Policy that defines the terms for Council to accept any such asset including an up-front contribution to resource the ongoing maintenance. Council will also need to keep current with new innovative solutions that are arriving on the market, but at the same time ensure that maintenance requirements can achieve economies of scale with ‘like’ infrastructure being introduced requiring the resources to carry out the routine operations and maintenance.
Create W
ollondilly - Resourcing S
trategy | Asset M
anagement S
trategy
77
Cre
ate
Wol
lond
illy
- R
esou
rcin
g S
trate
gy
| A
sset
Man
agem
ent S
trate
gy
76
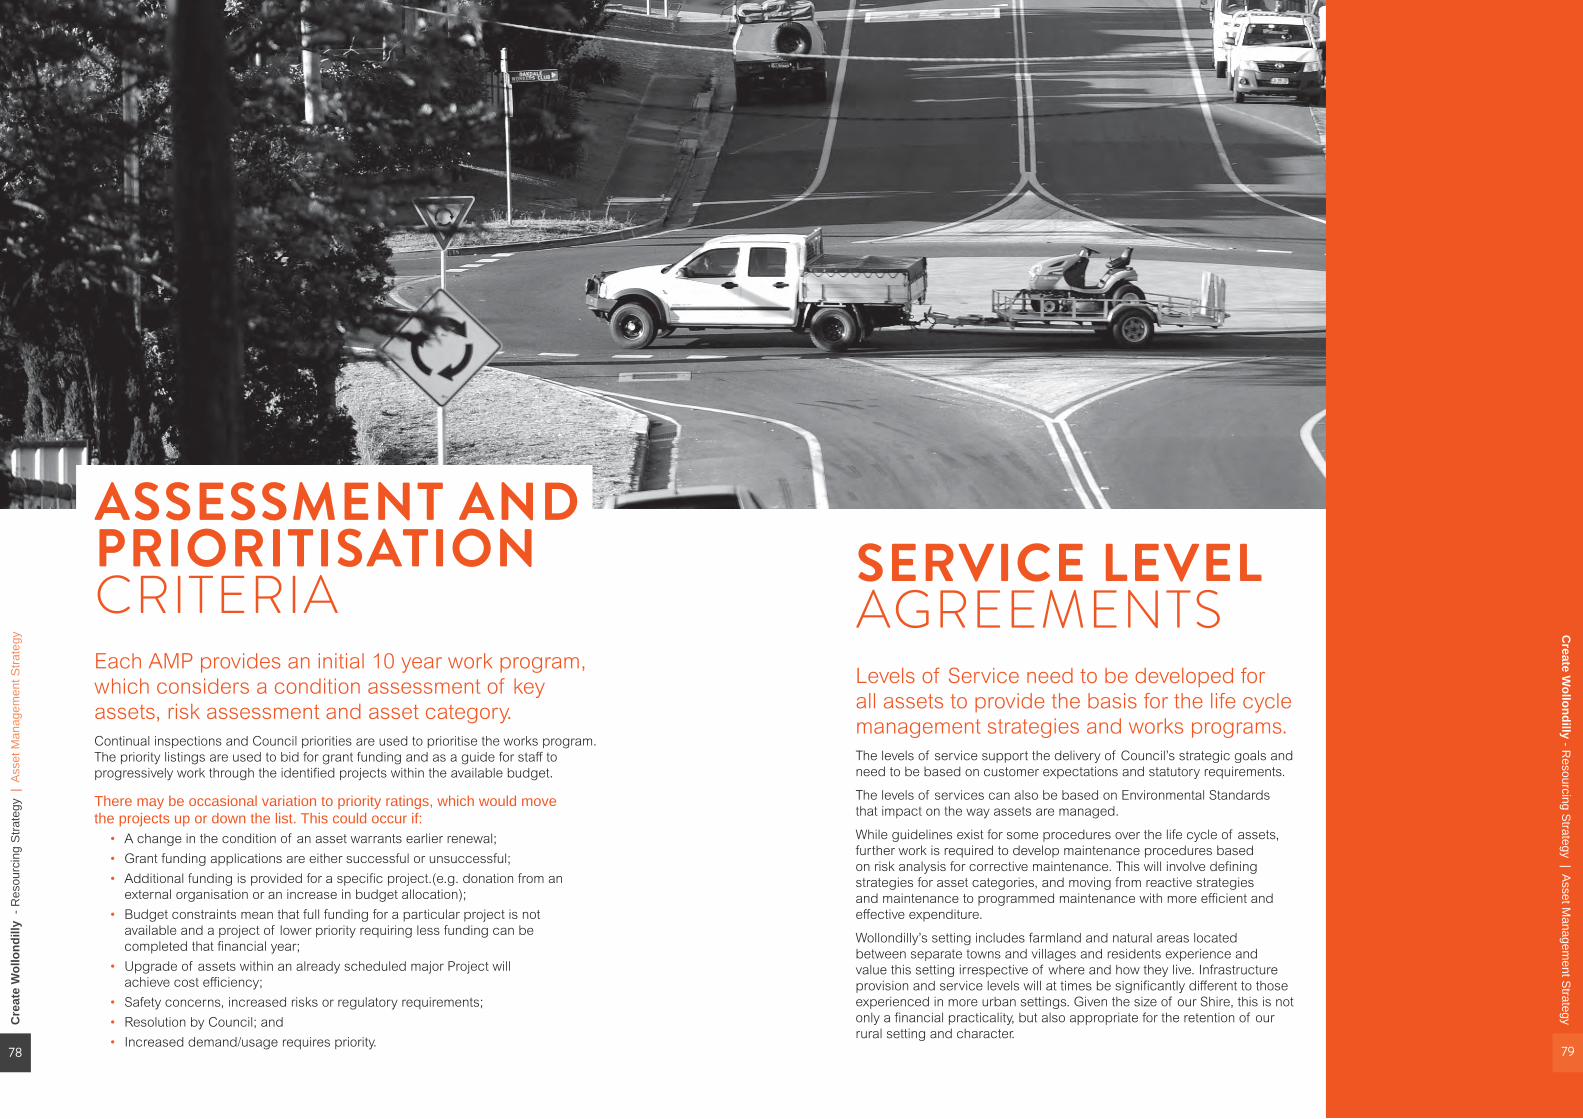
ASSESSMENT AND PRIORITISATION CRITERIA Each AMP provides an initial 10 year work program, which considers a condition assessment of key assets, risk assessment and asset category. Continual inspections and Council priorities are used to prioritise the works program. The priority listings are used to bid for grant funding and as a guide for staff to progressively work through the identified projects within the available budget.
There may be occasional variation to priority ratings, which would move the projects up or down the list. This could occur if:
• A change in the condition of an asset warrants earlier renewal;• Grant funding applications are either successful or unsuccessful;• Additional funding is provided for a specific project.(e.g. donation from an
external organisation or an increase in budget allocation);• Budget constraints mean that full funding for a particular project is not
available and a project of lower priority requiring less funding can be completed that financial year;
• Upgrade of assets within an already scheduled major Project will achieve cost efficiency;
• Safety concerns, increased risks or regulatory requirements; • Resolution by Council; and• Increased demand/usage requires priority.
SERVICE LEVEL AGREEMENTSLevels of Service need to be developed for all assets to provide the basis for the life cycle management strategies and works programs. The levels of service support the delivery of Council’s strategic goals and need to be based on customer expectations and statutory requirements.
The levels of services can also be based on Environmental Standards that impact on the way assets are managed.
While guidelines exist for some procedures over the life cycle of assets, further work is required to develop maintenance procedures based on risk analysis for corrective maintenance. This will involve defining strategies for asset categories, and moving from reactive strategies and maintenance to programmed maintenance with more efficient and effective expenditure.
Wollondilly’s setting includes farmland and natural areas located between separate towns and villages and residents experience and value this setting irrespective of where and how they live. Infrastructure provision and service levels will at times be significantly different to those experienced in more urban settings. Given the size of our Shire, this is not only a financial practicality, but also appropriate for the retention of our rural setting and character.
Create W
ollondilly - Resourcing S
trategy | Asset M
anagement S
trategy
79
Cre
ate
Wol
lond
illy
- R
esou
rcin
g S
trate
gy |
Ass
et M
anag
emen
t Stra
tegy
78
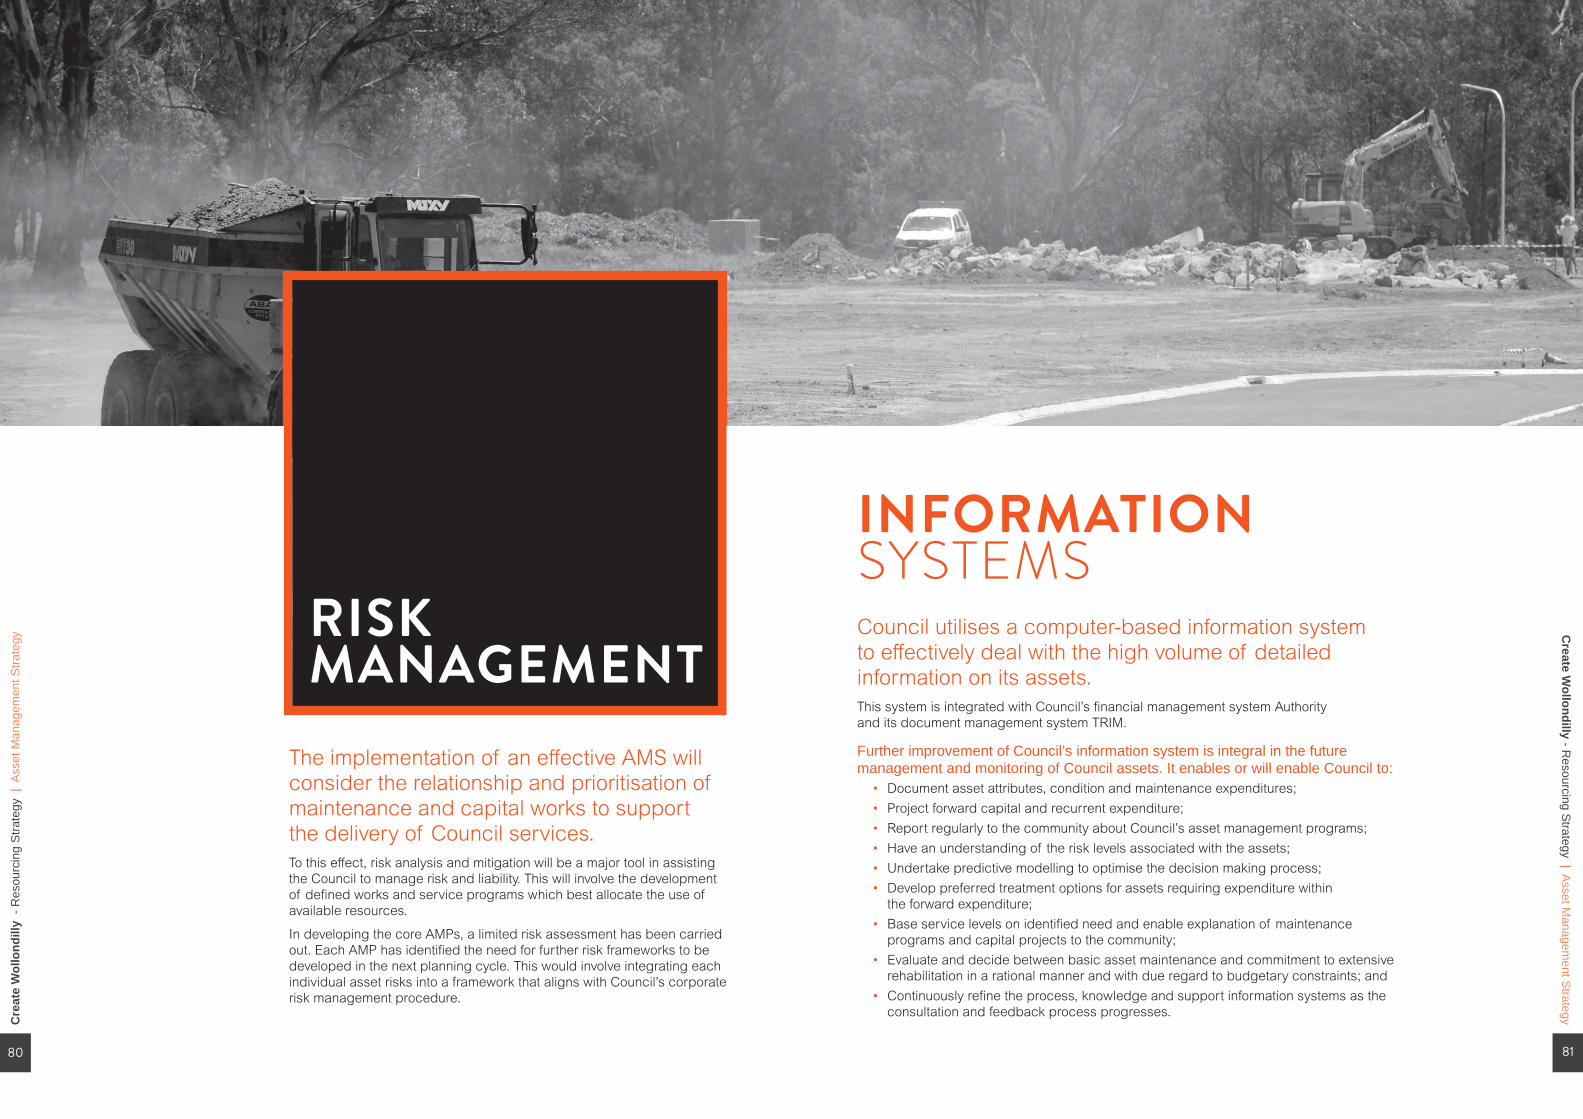
The implementation of an effective AMS will consider the relationship and prioritisation of maintenance and capital works to support the delivery of Council services. To this effect, risk analysis and mitigation will be a major tool in assisting the Council to manage risk and liability. This will involve the development of defined works and service programs which best allocate the use of available resources.
In developing the core AMPs, a limited risk assessment has been carried out. Each AMP has identified the need for further risk frameworks to be developed in the next planning cycle. This would involve integrating each individual asset risks into a framework that aligns with Council’s corporate risk management procedure.
RISK MANAGEMENT
INFORMATION SYSTEMSCouncil utilises a computer-based information system to effectively deal with the high volume of detailed information on its assets. This system is integrated with Council’s financial management system Authority and its document management system TRIM.
Further improvement of Council’s information system is integral in the future management and monitoring of Council assets. It enables or will enable Council to:
• Document asset attributes, condition and maintenance expenditures;• Project forward capital and recurrent expenditure;• Report regularly to the community about Council’s asset management programs;• Have an understanding of the risk levels associated with the assets;• Undertake predictive modelling to optimise the decision making process;• Develop preferred treatment options for assets requiring expenditure within
the forward expenditure;• Base service levels on identified need and enable explanation of maintenance
programs and capital projects to the community;• Evaluate and decide between basic asset maintenance and commitment to extensive
rehabilitation in a rational manner and with due regard to budgetary constraints; and• Continuously refine the process, knowledge and support information systems as the
consultation and feedback process progresses.
Cre
ate
Wol
lond
illy
- R
esou
rcin
g S
trate
gy |
Ass
et M
anag
emen
t Stra
tegy
Create W
ollondilly - Resourcing S
trategy | Asset M
anagement S
trategy
80 81

ASSET MANAGEMENT REVIEW
Asset Management Improvement PlanningAn Asset Management Improvement Program will enhance the processes, systems and data that support the AMS and AMPs.
An improvement planning process will help to:• Identify corporate business need for asset management planning;• Assess the current status of asset management practices;• Identify gaps between current practices and business needs;• Develop an optimised program for asset management improvements, considering
risks and cost of options to for improvement, and also availability of resources; and• Continuously monitor and review the effectiveness of AM planning activities.
Additionally, in line with legislated annual reporting, Council must carry out ‘Fair Value’ assessments of its asset classes in accordance with the following timetable;
Year Key Task
2017
2018 Fair Value for buildings, plant and equipment
2019
2020 Fair Value for roads infrastructure and drainage
2021 Fair Value for parks and reserves land improvements, other structures and other assets
2022
2023 Fair Value for buildings, plant and equipment
2024
Asset Management ResourcesThe significant portfolio of assets and the specialist skills required to sustain these assets requires appropriate funding and resources. As Council transitions from an unsustainable reactive budget position to a proactive sustainable budget, its systems need to evolve to adequately keep registers, condition data, systems and known utilisation of assets up to date.This will require the development of the asset management team and systems (in-house or access to external providers) to develop a Wollondilly Council specific system tailored to the wants and needs of the Community.
This will be formalised through Council’s Workforce Management Strategy Wollondilly's Asset Management System
Asset Management SummaryCouncil has a significant and varied asset portfolio which requires strategic direction to assist in its management. These assets are a necessary part of providing services to residents and stakeholders. As custodian of these assets on behalf of the Wollondilly community, it is necessary to provide transparency and good governance in their management.This AMS acts as the essential link between Council’s policy direction and more detailed asset management planning and delivery. It highlights major issues which need to be addressed for each of the asset classes over the next few years along with the actions necessary in order for Council to help close the gap between current asset management practice and move towards a “best appropriate practice” position in the future. Council will provide the necessary resources and undertake the programs recommended in this AMS and will continue to monitor and update it regularly to ensure its currency and consistency with Council’s policy directions.
Asset Management Steering Committee
Development Engineering
Handoverto Works
Asset & Program Custodians
System Administrator
Project Officers
Asset Officers
Asset Officers
STRATEGIC PLANS
CONTRIBUTED ASSETS
ASSET REGISTERS
PROJECT DEVELOPMENT
CONDITION DATA
CRITERIA
SYSTEMS PRIORITY LISTS
IMPLEMENTATION
CONSULTATION/REPORTING
• Confirmation of Projects• Defininf Scopes• Confirming Inputs
Works
ULTILISATION
Asset Management Sterring Committee
Create W
ollondilly - Resourcing S
trategy | Asset M
anagement S
trategy
83
Cre
ate
Wol
lond
illy
- R
esou
rcin
g S
trate
gy
| A
sset
Man
agem
ent S
trate
gy
82
WORK FORCE PLANNING STRATEGY2017/18 - 2020/21 3
SECTIO
N

Create W
ollondilly - Resourcing S
trategy | Work Force P
lanning Strategy
87
Vision to values, adopting to growth and change...
INTRODUCTIONWollondilly Council’s Workforce Management Strategy outlines how our staff will achieve the community’s long term goals and objectives under the Wollondilly Community Strategic Plan and Delivery Program.
This strategy aligns with the National and New South Wales Local Government Workforce Strategy in that it adopts a broad vision to ensure Wollondilly’s workforce has:
• The workforce capability it requires for a productive, sustainable and inclusive workforce.
• The capacity to develop and use the skills of its workforce to meet the needs and aspirations of our community.
The strategies and actions within the Wollondilly Workforce Management Strategy address the eight key strategic themes in the National and NSW Strategy which are:
1. Improving our workforce planning and development.
2. Promoting local government as a place-based employer.
3. Retaining and attracting a diverse workforce.4. Creating a contemporary workplace.5. Investing in skills.6. Improving productivity and
leveraging technology.7. Maximising management and leadership.8. Implementation and collaboration.
Continuous improvement is a fundamental component to this strategy. This ensures we are meeting and reflecting changing community needs, legislative reform, technology advances and evolving workforce demographics.
This plan is structured to answer the following five (5) simple questions:
• Where have we come from as a workforce?• Where are we now as a workforce? • Where are we going as a workforce? • How does our workforce get there?• How do we know we have arrived?
Cre
ate
Wol
lond
illy
- R
esou
rcin
g S
trate
gy
| A
sset
Man
agem
ent S
trate
gy
86
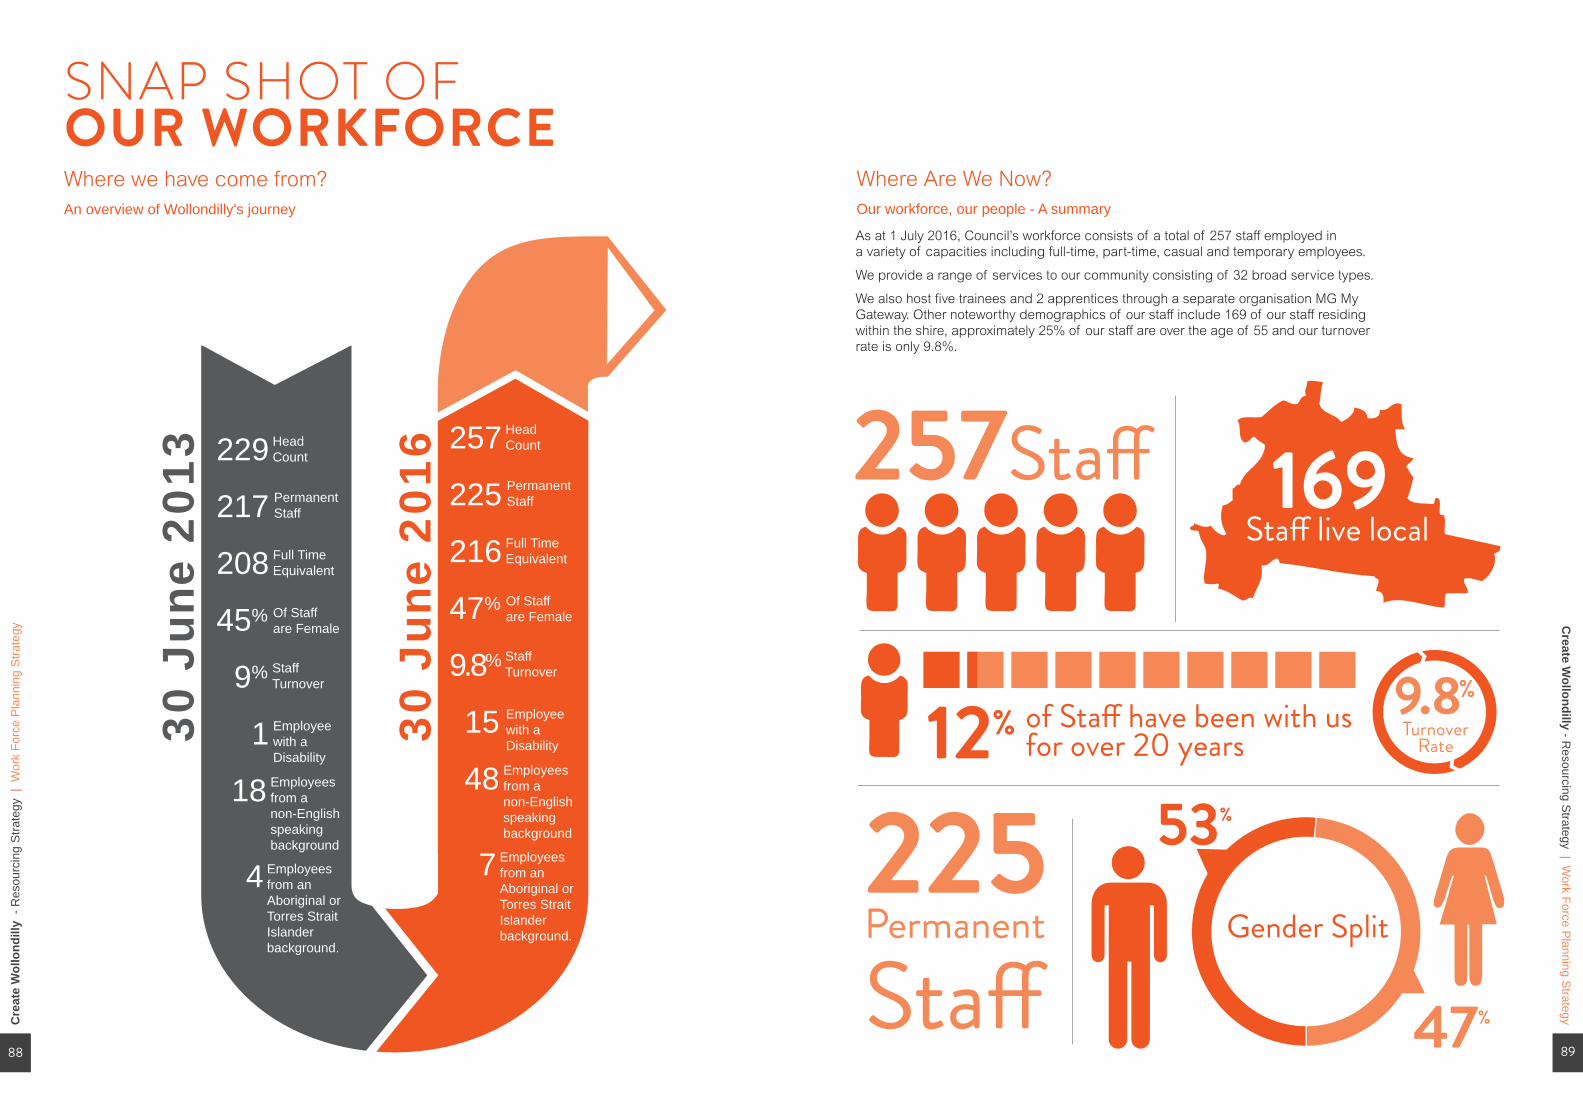
Cre
ate
Wol
lond
illy
- R
esou
rcin
g S
trate
gy |
Wor
k Fo
rce
Pla
nnin
g S
trate
gyC
reate Wollondilly - R
esourcing Strategy | W
ork Force Planning S
trategy
88 89
229
217
208
45%
9%
1
18
4
Head Count
Permanent Staff
Full Time Equivalent
30 J
une
2013
30 J
une
2016
Of Staff are Female
Staff Turnover
Employeewith a Disability
Employees from a non-English speaking background
Employees from an Aboriginal or Torres Strait Islander background.
257
225
216
47%
9.8%
15
48
7
Head Count
Permanent Staff
Full Time Equivalent
Of Staff are Female
Staff Turnover
Employeewith a Disability
Employees from a non-English speaking background
Employees from an Aboriginal or Torres Strait Islander background.
SNAP SHOT OF OUR WORKFORCEWhere we have come from?An overview of Wollondilly's journey
257Sta�
225Permanent
Sta�
169Sta� live local
12%
53%
47%
9.8%of Sta� have been with us for over 20 years
Gender Split
Turnover Rate
Where Are We Now?Our workforce, our people - A summary
As at 1 July 2016, Council’s workforce consists of a total of 257 staff employed in a variety of capacities including full-time, part-time, casual and temporary employees.
We provide a range of services to our community consisting of 32 broad service types.
We also host five trainees and 2 apprentices through a separate organisation MG My Gateway. Other noteworthy demographics of our staff include 169 of our staff residing within the shire, approximately 25% of our staff are over the age of 55 and our turnover rate is only 9.8%.
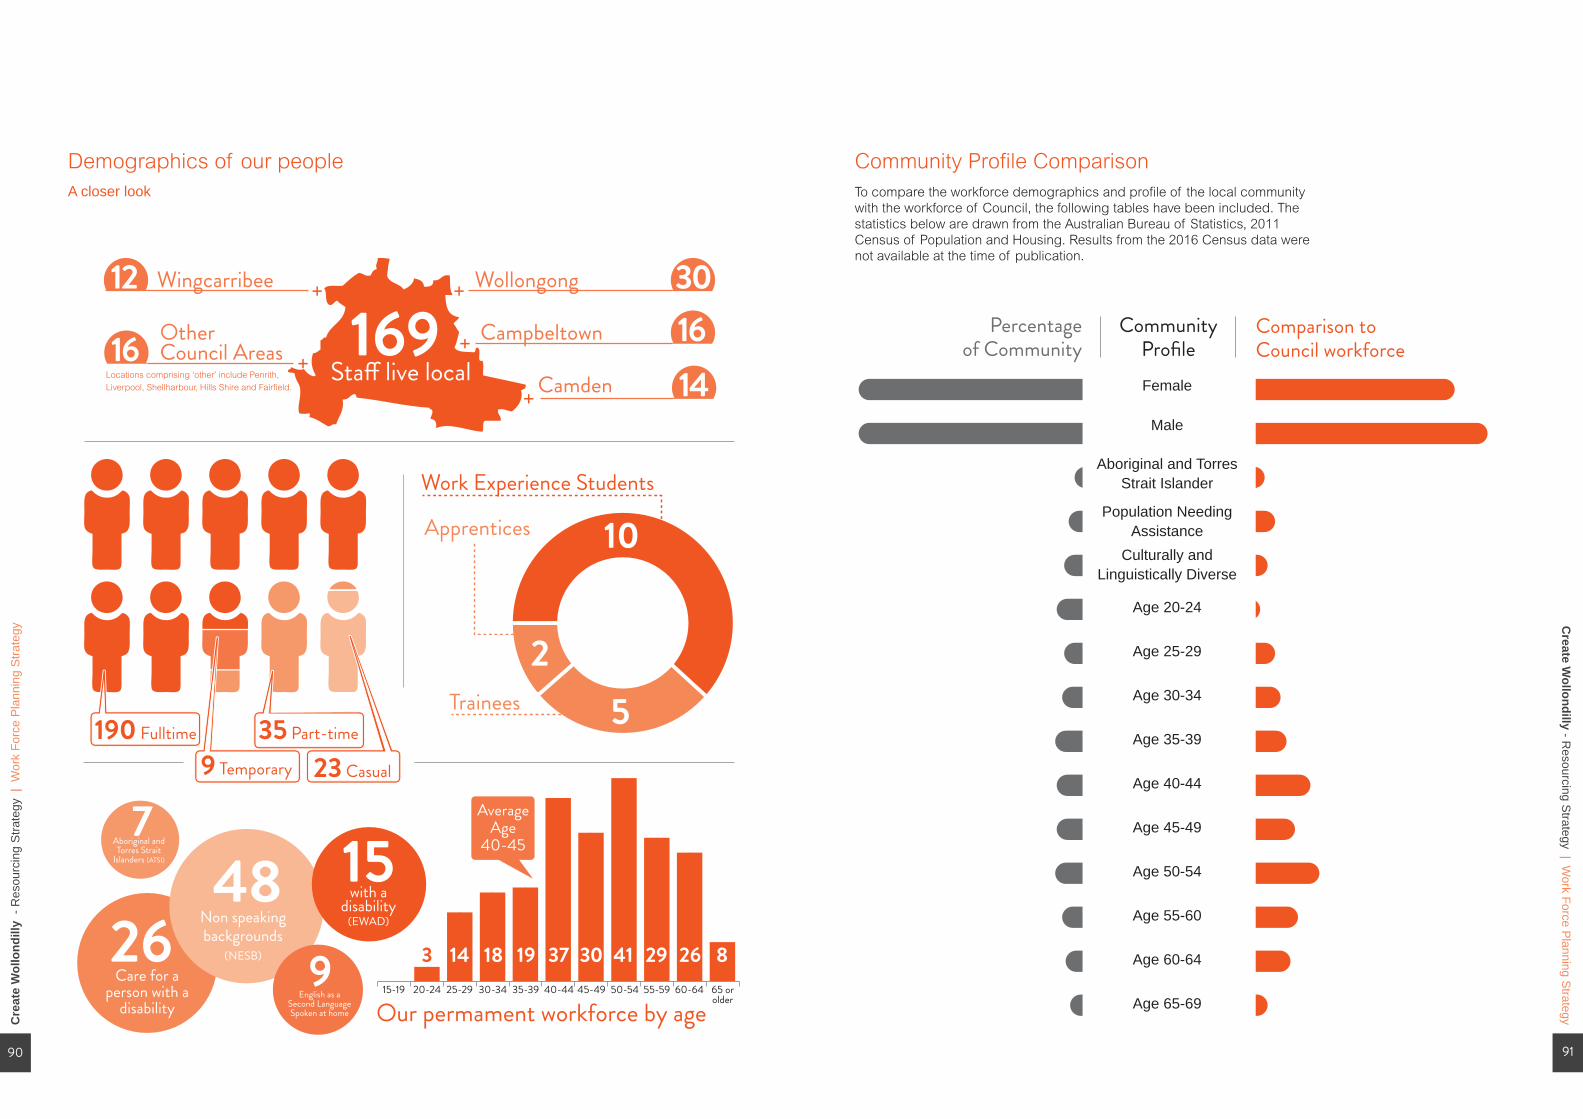
Cre
ate
Wol
lond
illy
- R
esou
rcin
g S
trate
gy |
Wor
k Fo
rce
Pla
nnin
g S
trate
gyC
reate Wollondilly - R
esourcing Strategy | W
ork Force Planning S
trategy
90 91
Demographics of our peopleA closer look
169Sta� live local
Our permament workforce by age
Wollongong+
190 Fulltime 5
10
2
Apprentices
Trainees35 Part-time
9 Temporary 23 Casual
48Non speaking backgrounds
(NESB)
7Aboriginal and Torres Strait
Islanders (ATSI)
9English as a
Second Language Spoken at home
15with a
disability (EWAD)
15-19 20-24 25-29 30-34 35-39 40-44 45-49 50-54 55-59 60-64 65 or older
26Care for a
person with a disability
371918143 30 41 29 26 8
AverageAge
40-45
Campbeltown+
30 16
Wingcarribee +
Other Council Areas +
12
16 Camden+ 14 Locations comprising ‘other’ include Penrith,
Liverpool, Shellharbour, Hills Shire and Fairfield.
Work Experience Students
Percentage of Community
CommunityProfile
Comparison to Council workforce
Female
Male
Aboriginal and Torres Strait Islander
Population Needing Assistance
Culturally and Linguistically Diverse
Age 20-24
Age 25-29
Age 30-34
Age 35-39
Age 40-44
Age 45-49
Age 50-54
Age 55-60
Age 60-64
Age 65-69
To compare the workforce demographics and profile of the local community with the workforce of Council, the following tables have been included. The statistics below are drawn from the Australian Bureau of Statistics, 2011 Census of Population and Housing. Results from the 2016 Census data were not available at the time of publication.
Community Profile Comparison
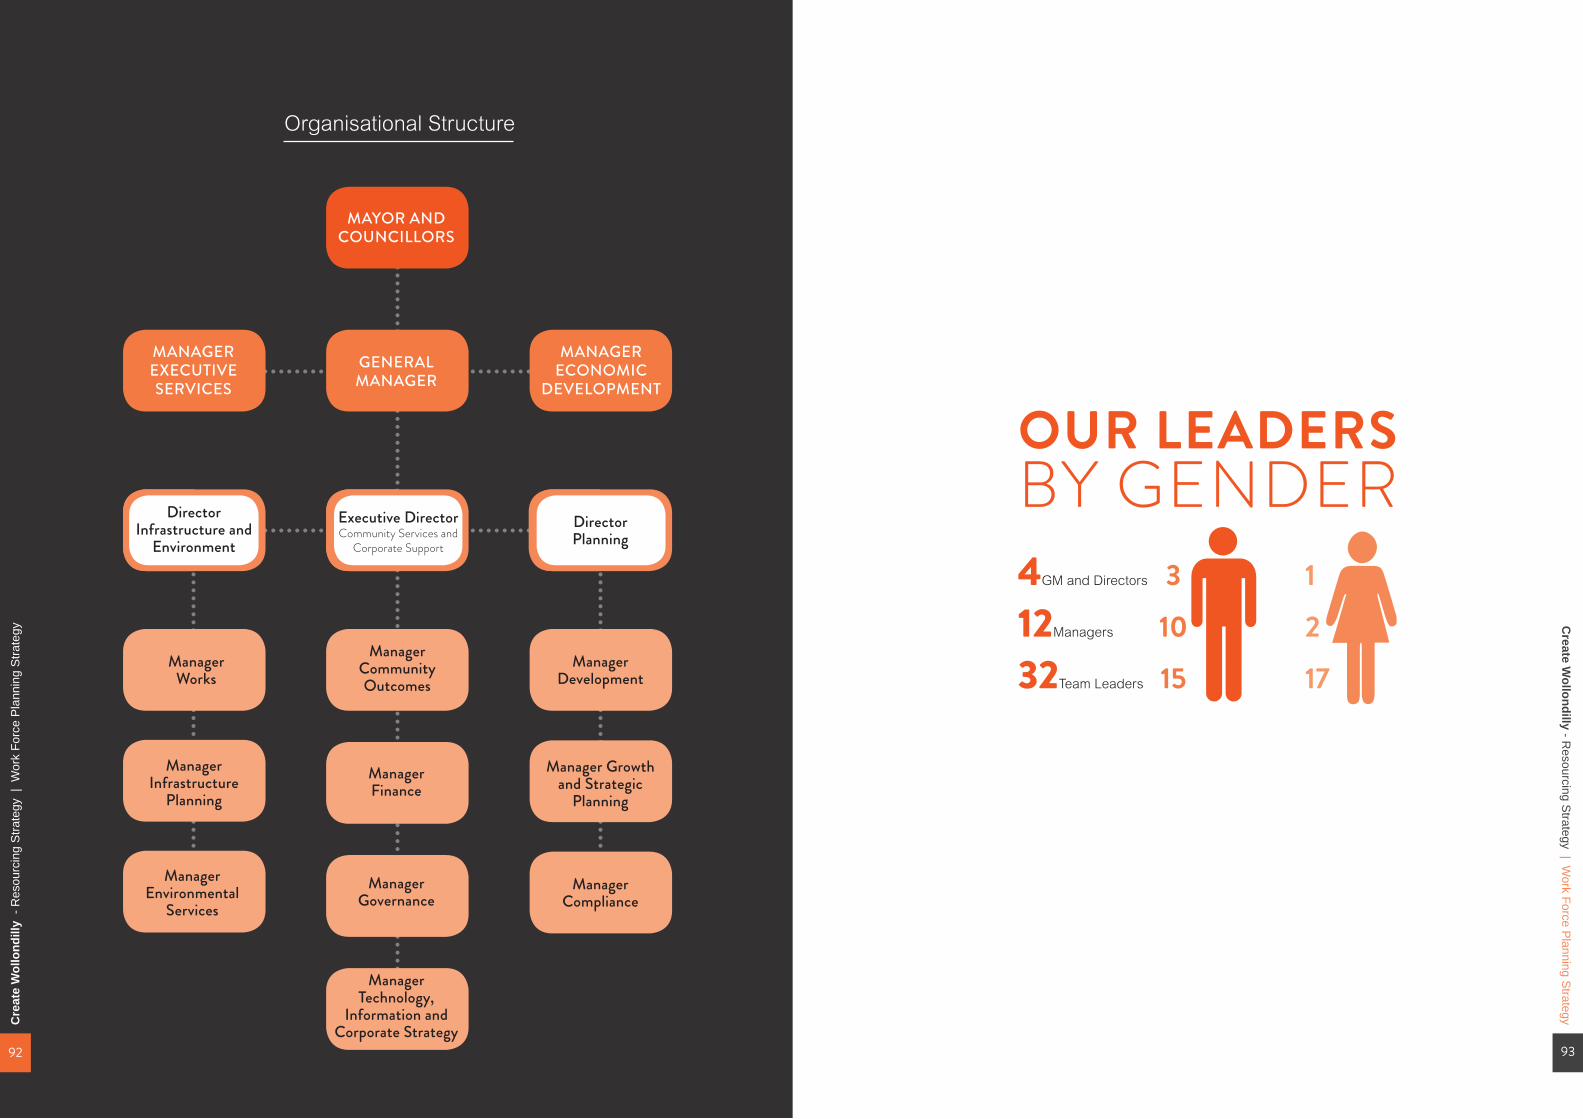
Create W
ollondilly - Resourcing S
trategy | Work Force P
lanning Strategy
93
MAYOR AND COUNCILLORS
GENERAL MANAGER
ManagerCommunity Outcomes
ManagerWorks
ManagerDevelopment
Manager Growth and Strategic
Planning
ManagerInfrastructure
Planning
ManagerCompliance
ManagerEnvironmental
Services
ManagerFinance
ManagerGovernance
ManagerTechnology,
Information and Corporate Strategy
MANAGER EXECUTIVE SERVICES
MANAGER ECONOMIC
DEVELOPMENT
Executive DirectorCommunity Services and
Corporate Support
DirectorInfrastructure and
EnvironmentDirectorPlanning
OUR LEADERS BY GENDER4GM and Directors 3 1
12Managers 10 2
32Team Leaders 15 17
Organisational Structure
Cre
ate
Wol
lond
illy
- R
esou
rcin
g S
trate
gy |
Wor
k Fo
rce
Pla
nnin
g S
trate
gy
92
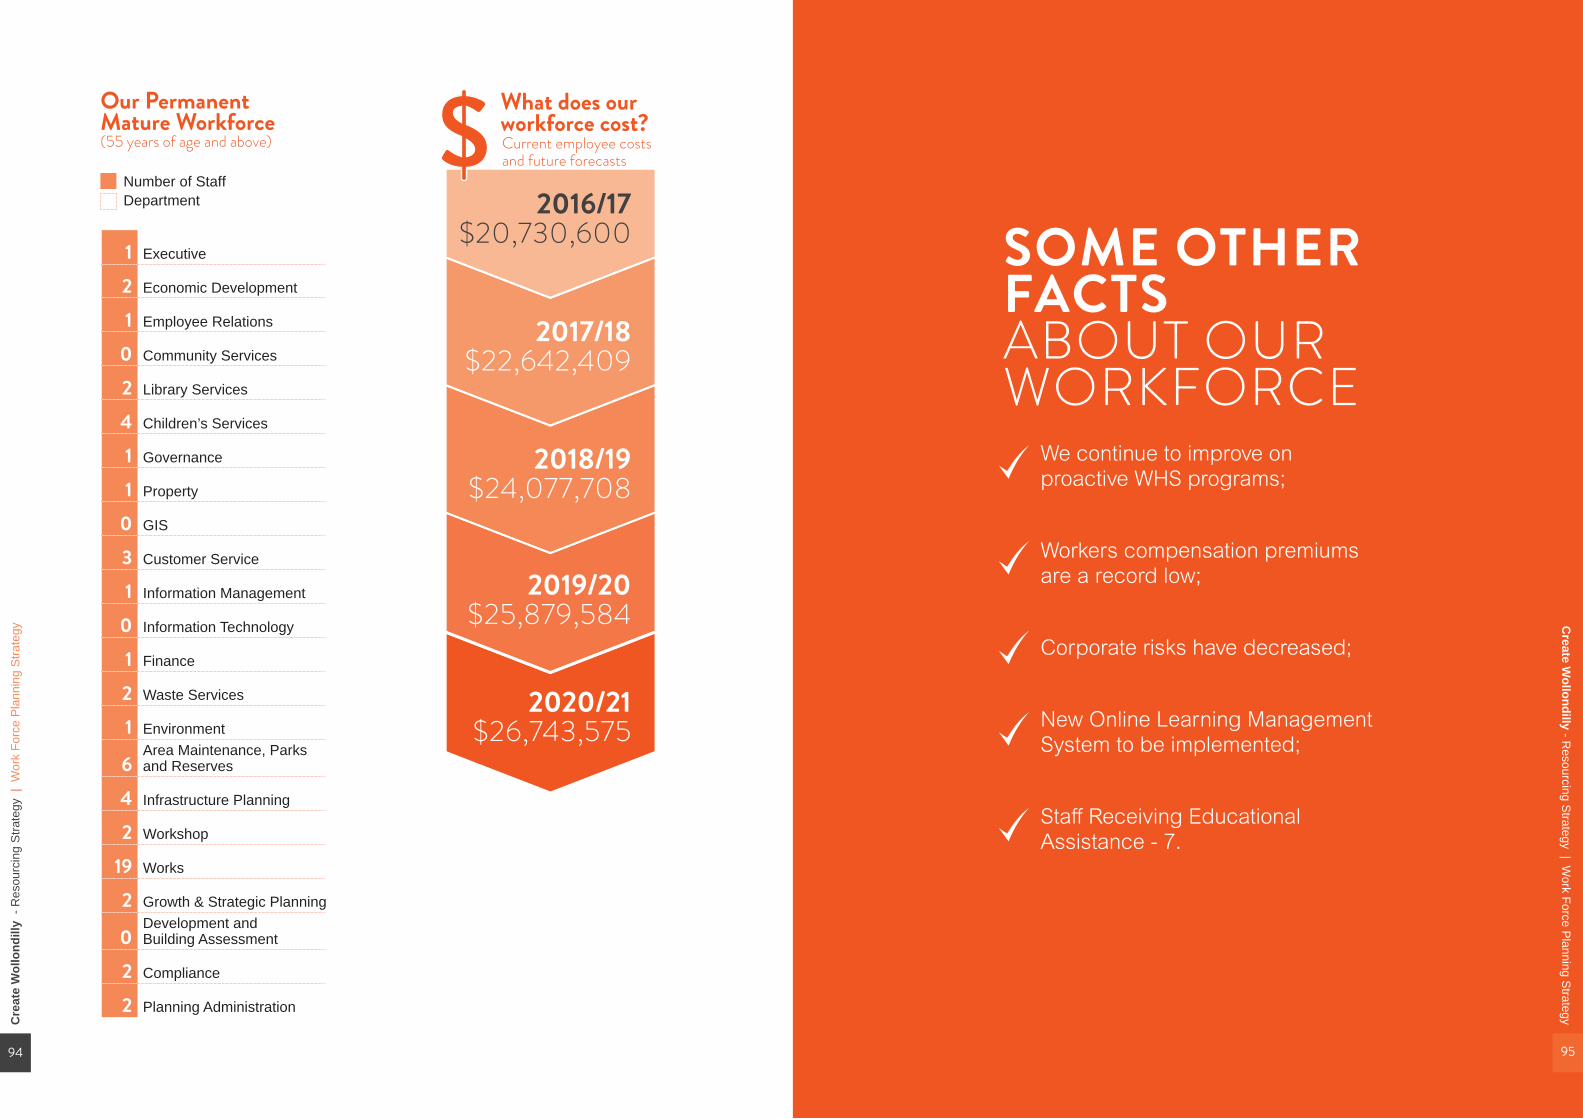
Cre
ate
Wol
lond
illy
- R
esou
rcin
g S
trate
gy |
Wor
k Fo
rce
Pla
nnin
g S
trate
gy
94
(55 years of age and above) Current employee costs and future forecasts
Our Permanent Mature Workforce
What does our workforce cost?
1 Executive
Number of StaffDepartment
2 Economic Development
1 Employee Relations
0 Community Services
2 Library Services
4 Children’s Services
1 Governance
1 Property
0 GIS
3 Customer Service
1 Information Management
0 Information Technology
1 Finance
2 Waste Services
1 Environment
6Area Maintenance, Parks and Reserves
4 Infrastructure Planning
2 Workshop
19 Works
2 Growth & Strategic Planning
0Development and Building Assessment
2 Compliance
2 Planning Administration
2016/17$20,730,600
2017/18$22,642,409
2018/19$24,077,708
2019/20$25,879,584
2020/21$26,743,575
$SOME OTHER FACTS ABOUT OUR WORKFORCE
We continue to improve on proactive WHS programs;
Workers compensation premiums are a record low;
Corporate risks have decreased;
New Online Learning Management System to be implemented;
Staff Receiving Educational Assistance - 7.
Create W
ollondilly - Resourcing S
trategy | Work Force P
lanning Strategy
95
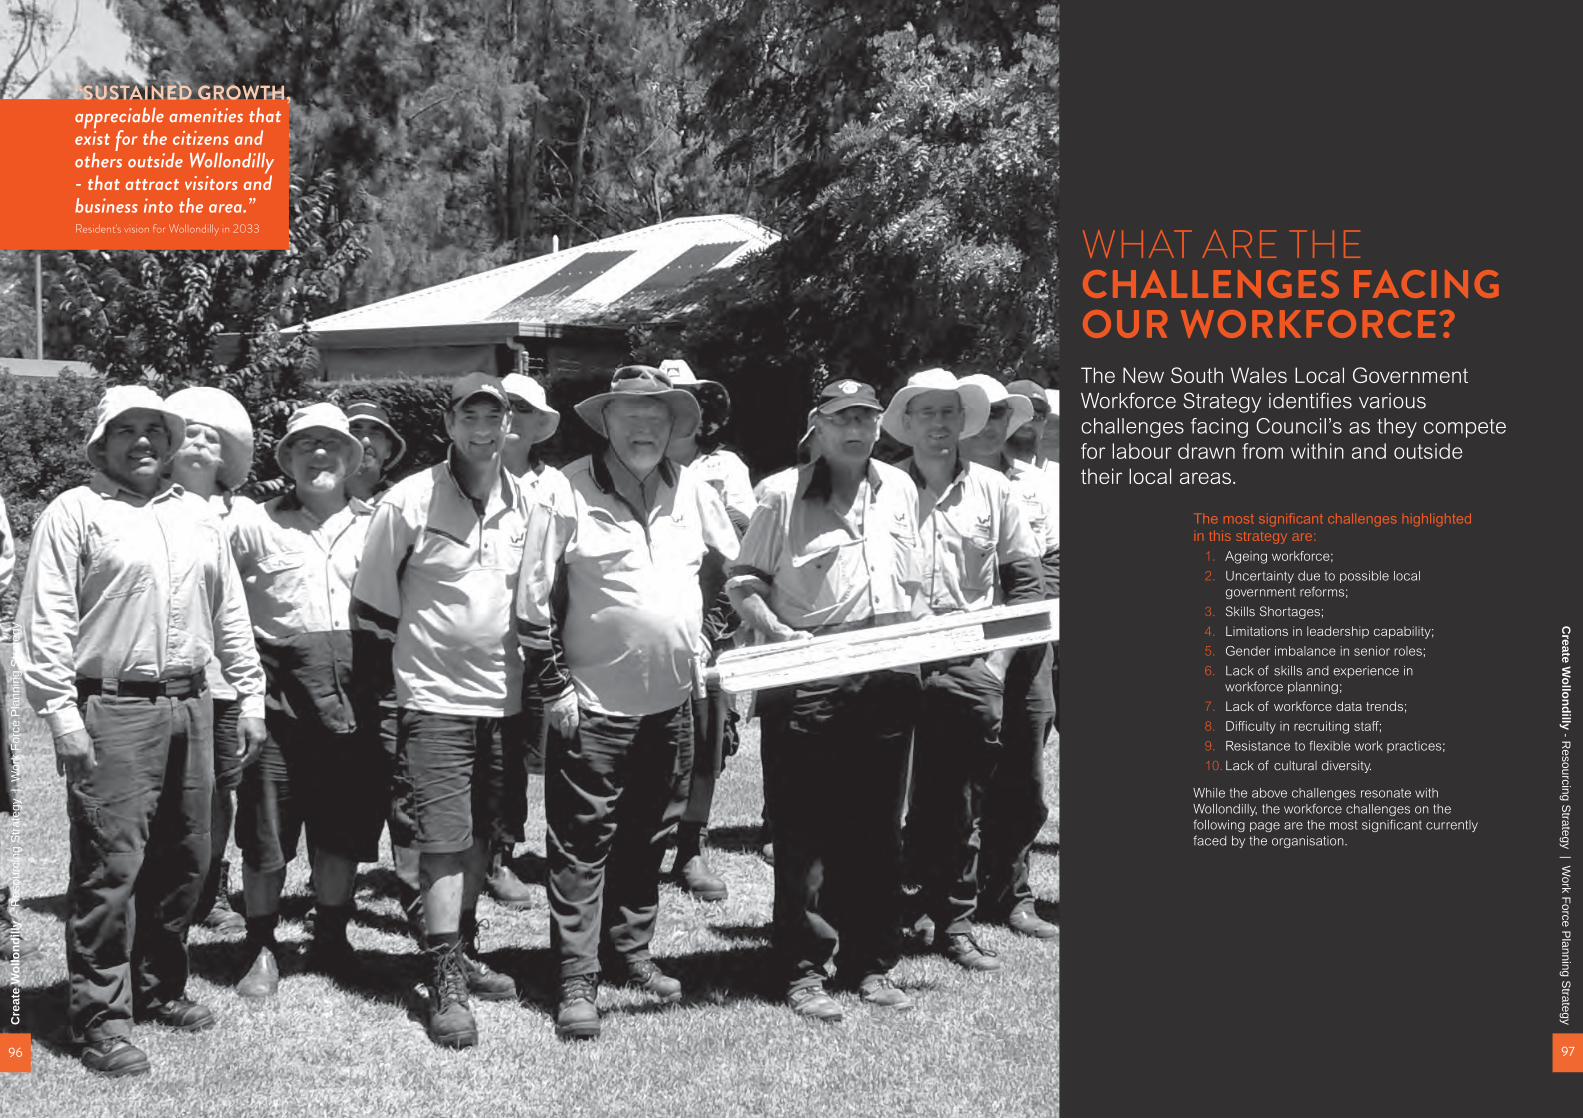
WHAT ARE THE CHALLENGES FACING OUR WORKFORCE?The New South Wales Local Government Workforce Strategy identifies various challenges facing Council’s as they compete for labour drawn from within and outside their local areas.
The most significant challenges highlighted in this strategy are:
1. Ageing workforce;2. Uncertainty due to possible local
government reforms; 3. Skills Shortages;4. Limitations in leadership capability;5. Gender imbalance in senior roles;6. Lack of skills and experience in
workforce planning;7. Lack of workforce data trends;8. Difficulty in recruiting staff;9. Resistance to flexible work practices;10. Lack of cultural diversity.
While the above challenges resonate with Wollondilly, the workforce challenges on the following page are the most significant currently faced by the organisation.
“SUSTAINED GROWTH, appreciable amenities that exist for the citizens and others outside Wollondilly - that attract visitors and business into the area.”Resident's vision for Wollondilly in 2033
Cre
ate
Wol
lond
illy
- R
esou
rcin
g S
trate
gy |
Wor
k Fo
rce
Pla
nnin
g S
trate
gyC
reate Wollondilly - R
esourcing Strategy | W
ork Force Planning S
trategy
96 97

Create W
ollondilly - Resourcing S
trategy | Work Force P
lanning Strategy
99
1. Managing Growth and Resourcing Service ProvisionA key challenge for Wollondilly is the management of pressures associated with increased workload. This increased workload can be attributed to a variety of different factors, particularly the increased growth within our community and changing service expectations from our customers. Our focus on delivering asset renewal programs following the special rate variation in 2015-2016 have also seen increased pressure on our existing resources.
Currently our Planning section is experiencing the largest increase in workload with increases in the number of development applications, compliance requests and planning proposals. Skill shortages in key positions such as Development Assessment Planners, and Building Surveyors, coupled with the substantial growth in the housing and construction sector have led to difficulty in recruiting these positions.
Service demand has also increased in Council’s engineering and asset project delivery streams. Engineering Development is a key area which supports the efficient processing and delivery of development proposals. Asset project delivery is fundamental to Council’s Asset Management Strategy and the delivery of infrastructure renewal and maintenance under the special rate variation.
Support services of Council including Employee Relations, Finance and Technology Information have not kept pace with the above services to ensure they are supported and enabled to effectively deliver services.
The organisation does not currently have sufficient resourcing to fund additional positions to respond to these pressures. Financially, we need to consider new and innovative ways to meet these challenges and invest in key positions to plan, deliver and grow our services.
2. Local Government Reform and Continuous ImprovementAs our community continues to grow, there will be increased pressure on our workforce to deliver more services without a compromise to existing service levels. We are operating in a climate of local government reform in New South Wales with increased expectations for Council’s operations to be leaner, more productive, innovative and collaborative with the community. The New South Wales State Government will continue to reform local government in future years and Wollondilly must adapt to these changes.
Striving to continuously improve efficiency and accountability are particularly strong themes in the reforms facing local government. Local government in New South Wales is going through significant changes and, even though Wollondilly is not identified for Amalgamation, the days of "business as usual" are long past.
This presents challenges but also positive opportunities for our workforce to look at better, more innovative and efficient ways to deliver our services through a renewed and ongoing continuous improvement program. In addition, cultural realignment and encouraging change and growth mindsets with our workforce to ensure we have the right people with the right behaviours that align with our organisational vision and corporate values.
3. Ageing workforce and investment in skillsOur workforce, like many in Local Government, is ageing. It is anticipated that we will have a significant staff turnover within the next 5 to 10 years with currently 57 staff over the age of 55. The majority of these staff are within Outdoor operations with 27 staff in total over the age of 55.
Transferring these skills and knowledge through formal succession planning opportunities is critical in ensuring we have a highly skilled workforce with local knowledge and capabilities to deliver services to our community. Greater investment in our traineeship and apprenticeship training program as well as our young employees is required to achieve this.
To continue its excellent work for the Wollondilly community, Council must remain an attractive employment option for all existing and potential employees. Council needs to position itself to encourage workers to remain in the workforce beyond the average early retirement age of 59 years while also effectively creating opportunities for younger less experienced employees and emerging leaders. This will allow Managers to assess their current situation, identify areas for improvement and ensure that knowledge is transferred and skill loss is managed.
4. Attraction and Retention of Staff Wollondilly is a peri-urban Council which has attracted and retained staff historically based on its rural characteristics and work lifestyle balance. In recent years, we have also introduced a number of generous workplace incentives and programs which has assisted us to attract and retain staff.
Competitively, we neighbour various metropolitan Council’s which have greater financial capacity to provide more generous salary arrangements for key staff positions. There is increasing difficulty in attracting and recruiting high quality staff to the organisation in particular skill shortage areas of planning and engineering. As an employer must strive to go beyond this and consider a number of other innovative options if we are to attract and retain the best quality of staff (with a strong focus on ideas to retain staff).
Wollondilly must also continue to better market and position itself as an employer of choice.
5. Opportunities in leadership capability, capacity and alignmentOur leaders are critical in ensuring our staff achieve the organisational vision and outcomes from the delivery program. We need the right leaders who are innovative, accountable and effective to navigate through the current and future challenges growth presents us. Managers and Supervisors have the most significant impact on both individual and organisational performance.
Strategies will be implemented to better align Council’s vision, corporate values and delivery program outcomes with our leaders individual performance objectives.
Further developing our existing leaders and also new upcoming leaders in people management continues to be a high priority. Leadership capabilities in people management will contribute to a high performing organisation focussed on continuous improvement, innovation and increased productivity.
Cre
ate
Wol
lond
illy
- R
esou
rcin
g S
trate
gy |
Wor
k Fo
rce
Pla
nnin
g S
trate
gy
98
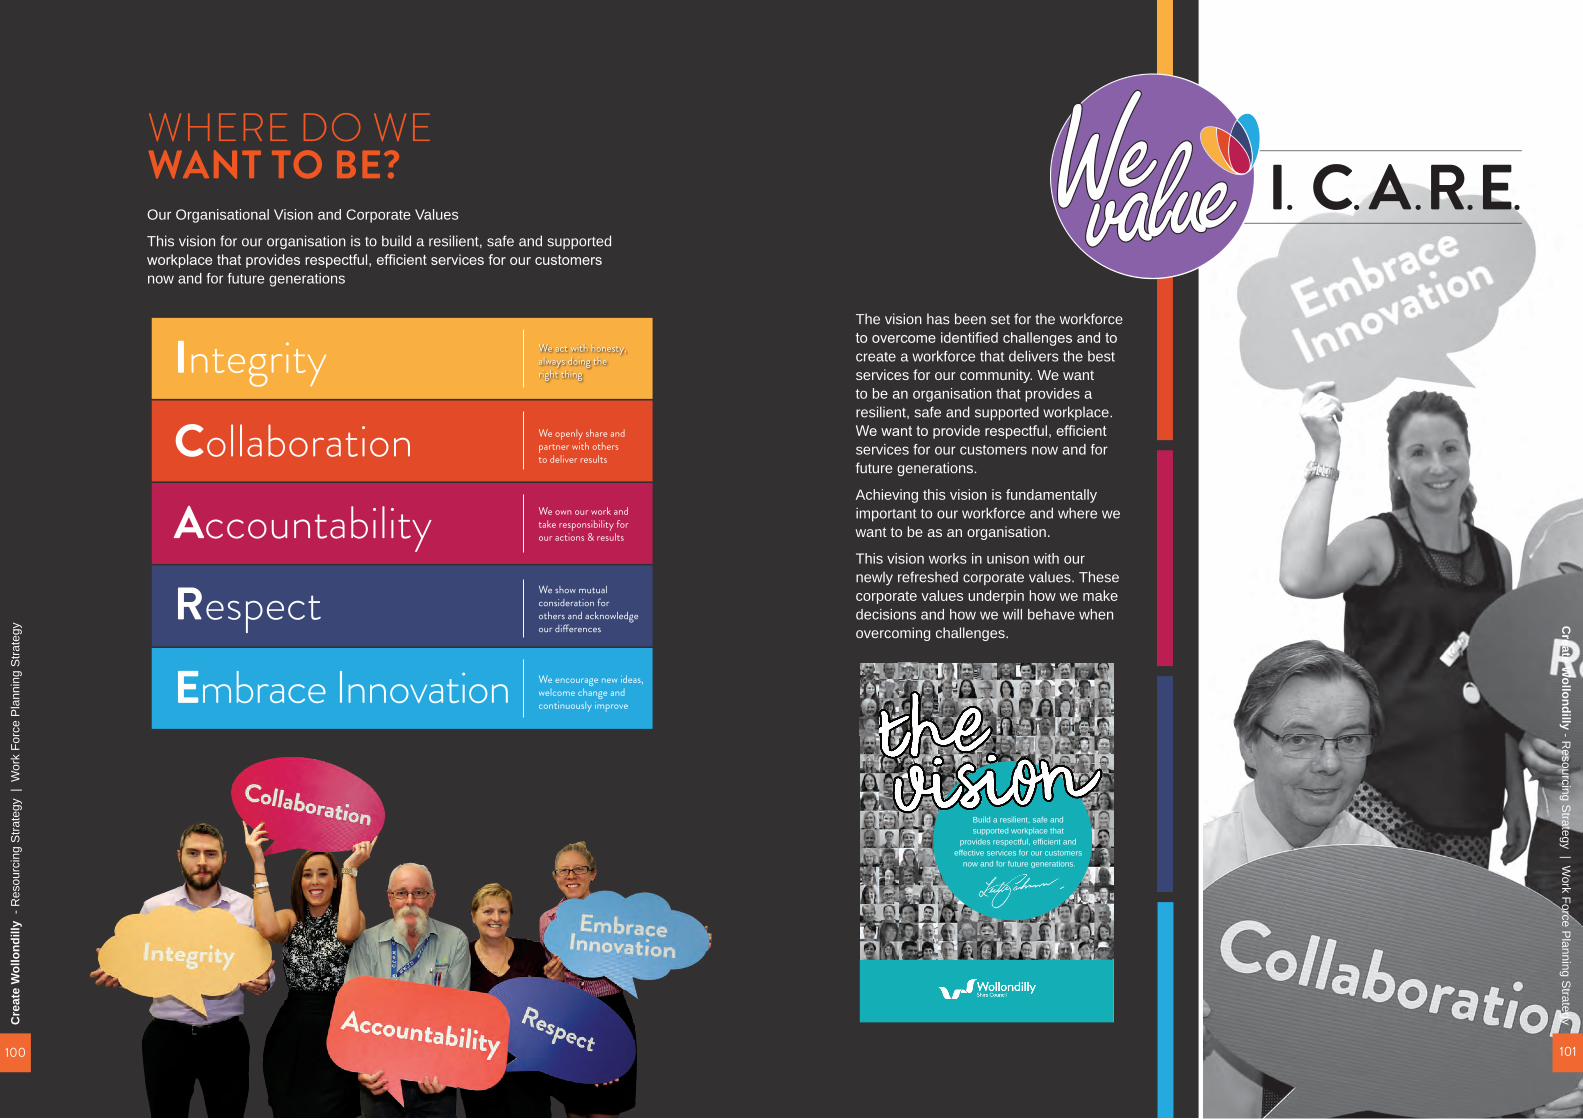
WHERE DO WE WANT TO BE? Our Organisational Vision and Corporate Values
This vision for our organisation is to build a resilient, safe and supported workplace that provides respectful, efficient services for our customers now and for future generations
The vision has been set for the workforce to overcome identified challenges and to create a workforce that delivers the best services for our community. We want to be an organisation that provides a resilient, safe and supported workplace. We want to provide respectful, efficient services for our customers now and for future generations.
Achieving this vision is fundamentally important to our workforce and where we want to be as an organisation.
This vision works in unison with our newly refreshed corporate values. These corporate values underpin how we make decisions and how we will behave when overcoming challenges.
I. C.A.R.E.
Build a resilient, safe and supported workplace that
provides respectful, efficient and effective services for our customers
now and for future generations.
Accountability
Collaboration
Integrity
Embrace Innovation We encourage new ideas, welcome change and continuously improve
We own our work and take responsibility for our actions & results
We show mutual consideration for others and acknowledge our di�erences
Respect
We act with honesty, always doing the right thing
We openly share and partner with others to deliver results
Cre
ate
Wol
lond
illy
- R
esou
rcin
g S
trate
gy |
Wor
k Fo
rce
Pla
nnin
g S
trate
gyC
reate Wollondilly - R
esourcing Strategy | W
ork Force Planning S
trategy
100 101
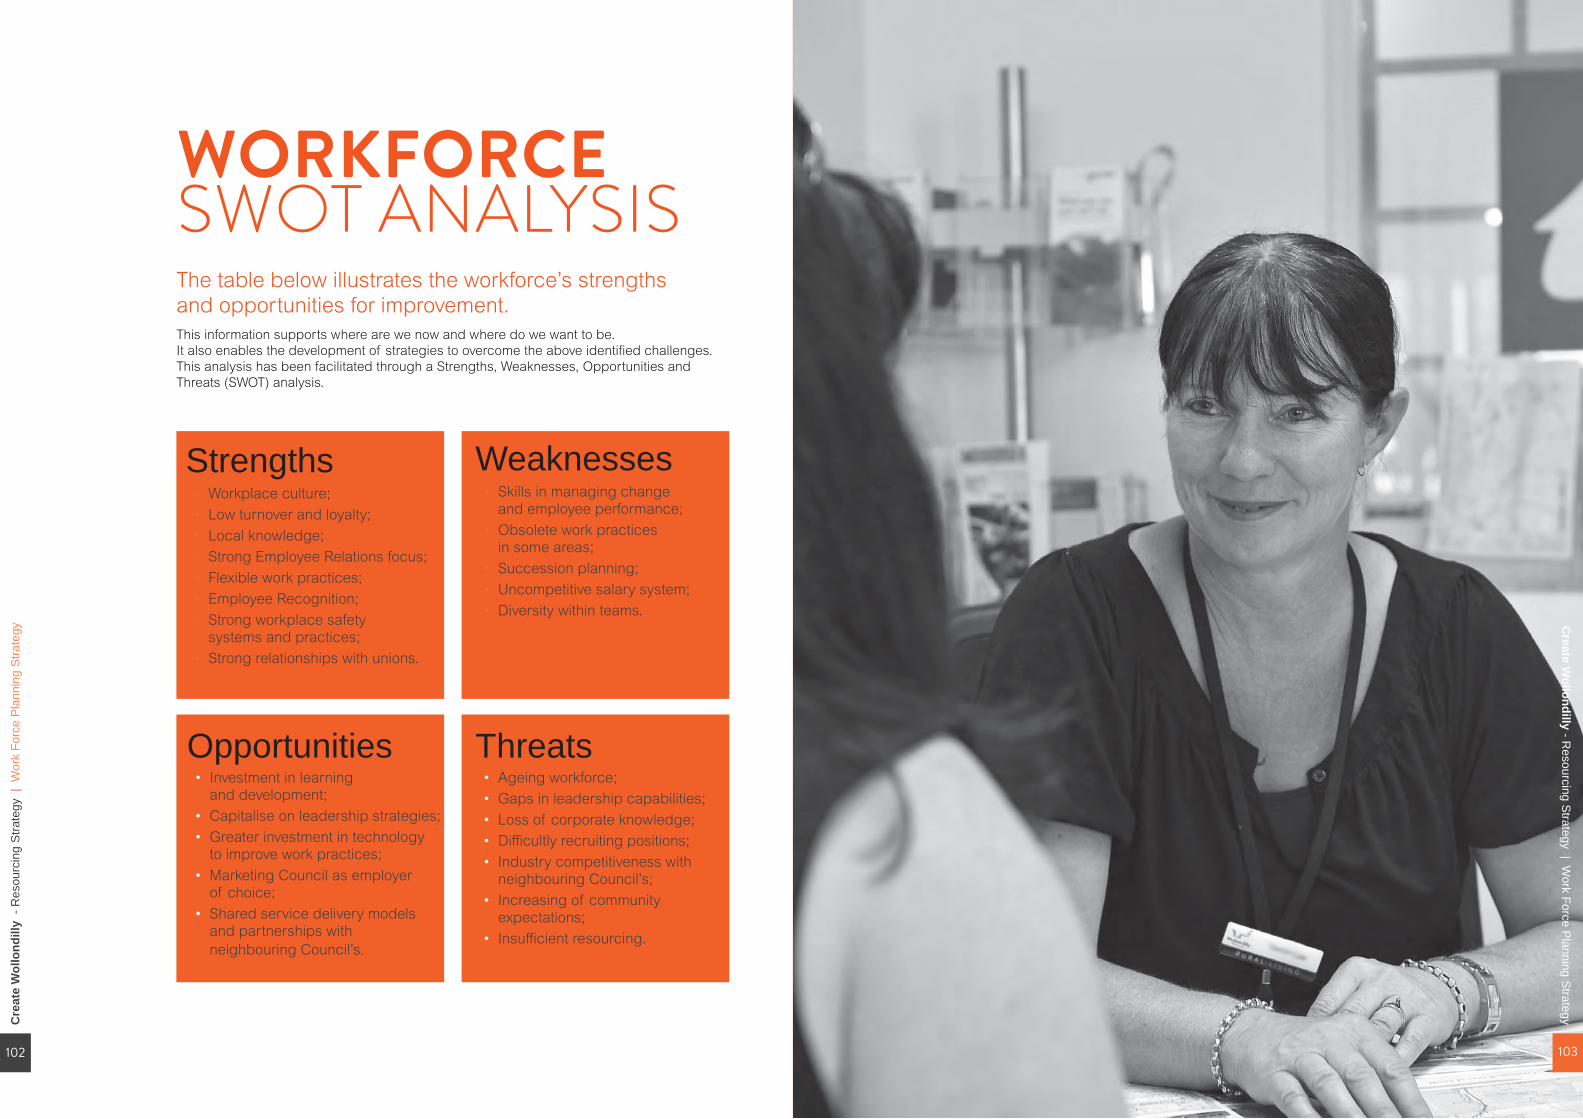
Cre
ate
Wol
lond
illy
- R
esou
rcin
g S
trate
gy |
Wor
k Fo
rce
Pla
nnin
g S
trate
gy
102
WORKFORCE SWOT ANALYSISThe table below illustrates the workforce’s strengths and opportunities for improvement. This information supports where are we now and where do we want to be. It also enables the development of strategies to overcome the above identified challenges. This analysis has been facilitated through a Strengths, Weaknesses, Opportunities and Threats (SWOT) analysis.
Strengths • Workplace culture;• Low turnover and loyalty; • Local knowledge;• Strong Employee Relations focus;• Flexible work practices;• Employee Recognition;• Strong workplace safety
systems and practices;• Strong relationships with unions.
Weaknesses• Skills in managing change
and employee performance;• Obsolete work practices
in some areas;• Succession planning;• Uncompetitive salary system;• Diversity within teams.
Threats• Ageing workforce;• Gaps in leadership capabilities;• Loss of corporate knowledge;• Difficultly recruiting positions;• Industry competitiveness with
neighbouring Council’s;• Increasing of community
expectations;• Insufficient resourcing.
Opportunities• Investment in learning
and development;• Capitalise on leadership strategies;• Greater investment in technology
to improve work practices;• Marketing Council as employer
of choice;• Shared service delivery models
and partnerships with neighbouring Council’s.
“A HAPPY and functional community with plenty of opportunity for all people to grow within the community.” Resident's vision for Wollondilly in 2033
Create W
ollondilly - Resourcing S
trategy | Work Force P
lanning Strategy
103

Cre
ate
Wol
lond
illy
- R
esou
rcin
g S
trate
gy |
Wor
k Fo
rce
Pla
nnin
g S
trate
gyC
reate Wollondilly - R
esourcing Strategy | W
ork Force Planning S
trategy
104 105
WHAT IS IMPORTANT TO OUR EMPLOYEES?Our employees have a direct impact on the provision of services to the community. Without them, Council would not be able to fulfil its civic or statutory obligations.As part of the Workforce Planning Process, consultation was undertaken with staff at a number of levels. At a managerial level this included the survey of the Manex Group, the identification of collective strengths and weaknesses of each workgroup and the forecasting of future resourcing needs. In addition to this, two (2) structured focus groups and an optional online survey of 65 council staff took place over a period of two weeks in April 2017. We sincerely thank all employees who took part in this process.
Staff Satisfaction at a Glance...The staff survey and focus groups centred on:
• ATTRACTION: What attracted you to Wollondilly Shire Council?• RETENTION: What keeps you working at Wollondilly Shire Council?• OPPORTUNITIES for improvement in the way we work at Wollondilly Shire Council.
In summary, the results were:
ATTRACTION• The location and more specifically, ability to work close to home (40.15%)• Work/life balance and conditions of employment (30.29%)• Opportunities for career development and training (14.23%)• A sense of connection to the community and making a difference (8.76%)• Council’s people and culture (6.57%)
RETENTION• Council’s people and culture (29.90%)• Work life balance and conditions of employment (19.07%)• Ability to work close to home (18.56)%• Job satisfaction and interaction with the community (18.56%)• Opportunities for career development and training (11.86%)• Other reasons (including family and financial) (2.05%)
OPPORTUNITIES FOR THE FUTURE• Ongoing professional development including the creation of additional opportunities
for growth via staff transfers and secondments, on the job training, coaching and mentoring and extension of leadership training opportunities.
• The need to innovate and implement process improvements including the adoption of new technology and digital tools to allow more efficient communications and remote processing.
• Improvements in the way we interact internally and work as a whole including: the need for more seamless interactions and customer service between departments, a renewed focus on meetings, outcomes and the number of them and a call for more strategic, planned responses in accordance with Council plans and community priorities.
• Cultural change emanating from the implementation and consistent application of Council’s renewed values, creation of shared accountability and management of poor performers, embracing of change and an ability to learn and grow.
• Social media management, additional social and staff well-being considerations, community engagement initiatives and process improvements.
I am proud to work at Wollondilly Shire Council
23.44% 23.44% 23.44% 23.44%23.44%
I would recommend Wollondilly Shire Council as a good place to work
I have thought about moving on from Wollondilly Shire Council in the last 12 months
I am likely to be working for Wollondilly Shire Council in 4 years time
Overall I am satisfied with my employment at Wollondilly Shire Council
Strongly Agree Agree Neutral/Undecided Disagree Strongly Disagree
21.54%
27.69%
20.00%
23.44%
22.00%
25.00%
54.00%
20.00%
31.00%
15.00%
21.54%
27.69%
15.00%
15.00%
1.54%
11.00%
17.00%
3.00%

“REMAIN a quiet rural environment with more modern infrastructure.” Resident's vision for Wollondilly in 2033
HOW DO WE GET THERE?Five broad workforce strategiesThere are five (5) key broad overall strategies which will enable us to achieve the organisation vision and achieve the Delivery Program outcomes.
Each strategy contains specific programs and actions that will be delivered over the next four years of the delivery program.
92% of a recent staff survey on the Workforce Management Plan agree to the 5 Strategies listed below.
The five strategies are:1. Creating a learning organisation that inspires and supports growth, innovation and personal development. Alignment with NSW Council Workforce Strategy
• Strategy 5 – Investing in Skills;• Strategy 6 – Improving
productivity and leveraging technology;
• Strategy 8 – Implementation and Collaboration.
2. Supporting our leaders to be innovative, accountable and effective with responding to growth.Alignment with NSW Council Workforce Strategy
• Strategy 1 – Improving workforce planning and development;
• Strategy 4 – Creating a contemporary workplace;
• Strategy 5 – Investing in our skills;
• Strategy 7 – Maximising Management and Leadership.
3. Facilitating a workforce that accepts growth, high performance and continuous improvement.
Alignment with NSW Council Workforce Strategy
• Strategy 4 – Creating a contemporary workplace;
• Strategy 5 – Investing in Skills;• Strategy 6 – Improving
productivity and leveraging technology.
4. Partnering within our business to deliver safe, efficient and effective people services.Alignment with NSW Council Workforce Strategy
• Strategy 4 – Creating a contemporary workplace;
• Strategy 6 – Improving productivity and leveraging technology;
• Strategy 8 – Implementation and Collaboration.
5. Attracting and retaining the people with capabilities to deliver now and into the future.Alignment with NSW Council Workforce Strategy
• Strategy 4 – Promoting Local Government as a place-based employer of choice;
• Strategy 3 – Retaining and Attracting a diverse workforce.
Cre
ate
Wol
lond
illy
- R
esou
rcin
g S
trate
gy |
Wor
k Fo
rce
Pla
nnin
g S
trate
gyC
reate Wollondilly - R
esourcing Strategy | W
ork Force Planning S
trategy
106 107
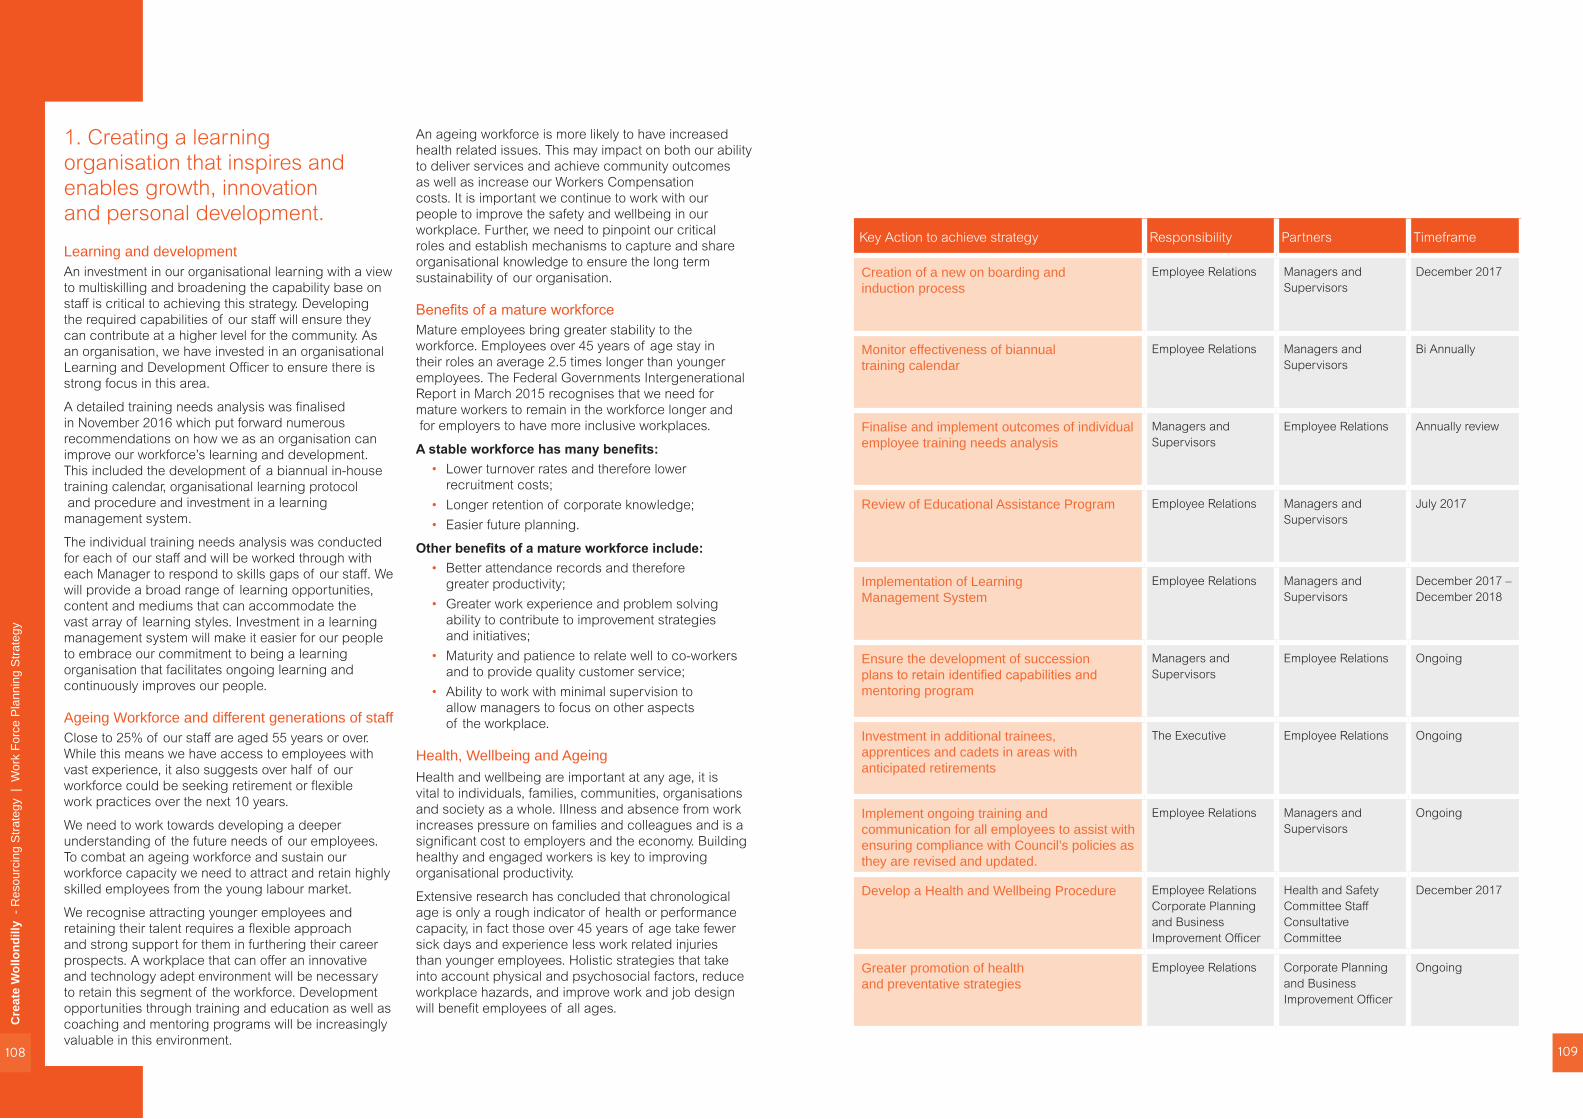
1. Creating a learning organisation that inspires and enables growth, innovation and personal development.
Learning and development An investment in our organisational learning with a view to multiskilling and broadening the capability base on staff is critical to achieving this strategy. Developing the required capabilities of our staff will ensure they can contribute at a higher level for the community. As an organisation, we have invested in an organisational Learning and Development Officer to ensure there is strong focus in this area.
A detailed training needs analysis was finalised in November 2016 which put forward numerous recommendations on how we as an organisation can improve our workforce’s learning and development. This included the development of a biannual in-house training calendar, organisational learning protocol and procedure and investment in a learning management system.
The individual training needs analysis was conducted for each of our staff and will be worked through with each Manager to respond to skills gaps of our staff. We will provide a broad range of learning opportunities, content and mediums that can accommodate the vast array of learning styles. Investment in a learning management system will make it easier for our people to embrace our commitment to being a learning organisation that facilitates ongoing learning and continuously improves our people.
Ageing Workforce and different generations of staffClose to 25% of our staff are aged 55 years or over. While this means we have access to employees with vast experience, it also suggests over half of our workforce could be seeking retirement or flexible work practices over the next 10 years.
We need to work towards developing a deeper understanding of the future needs of our employees. To combat an ageing workforce and sustain our workforce capacity we need to attract and retain highly skilled employees from the young labour market.
We recognise attracting younger employees and retaining their talent requires a flexible approach and strong support for them in furthering their career prospects. A workplace that can offer an innovative and technology adept environment will be necessary to retain this segment of the workforce. Development opportunities through training and education as well as coaching and mentoring programs will be increasingly valuable in this environment.
An ageing workforce is more likely to have increased health related issues. This may impact on both our ability to deliver services and achieve community outcomes as well as increase our Workers Compensation costs. It is important we continue to work with our people to improve the safety and wellbeing in our workplace. Further, we need to pinpoint our critical roles and establish mechanisms to capture and share organisational knowledge to ensure the long term sustainability of our organisation.
Benefits of a mature workforce Mature employees bring greater stability to the workforce. Employees over 45 years of age stay in their roles an average 2.5 times longer than younger employees. The Federal Governments Intergenerational Report in March 2015 recognises that we need for mature workers to remain in the workforce longer and for employers to have more inclusive workplaces.
A stable workforce has many benefits: • Lower turnover rates and therefore lower
recruitment costs; • Longer retention of corporate knowledge;• Easier future planning.
Other benefits of a mature workforce include: • Better attendance records and therefore
greater productivity; • Greater work experience and problem solving
ability to contribute to improvement strategies and initiatives;
• Maturity and patience to relate well to co-workers and to provide quality customer service;
• Ability to work with minimal supervision to allow managers to focus on other aspects of the workplace.
Health, Wellbeing and AgeingHealth and wellbeing are important at any age, it is vital to individuals, families, communities, organisations and society as a whole. Illness and absence from work increases pressure on families and colleagues and is a significant cost to employers and the economy. Building healthy and engaged workers is key to improving organisational productivity.
Extensive research has concluded that chronological age is only a rough indicator of health or performance capacity, in fact those over 45 years of age take fewer sick days and experience less work related injuries than younger employees. Holistic strategies that take into account physical and psychosocial factors, reduce workplace hazards, and improve work and job design will benefit employees of all ages.
Key Action to achieve strategy Responsibility Partners Timeframe
Creation of a new on boarding and induction process
Employee Relations Managers and Supervisors
December 2017
Monitor effectiveness of biannual training calendar
Employee Relations Managers and Supervisors
Bi Annually
Finalise and implement outcomes of individual employee training needs analysis
Managers and Supervisors
Employee Relations Annually review
Review of Educational Assistance Program Employee Relations Managers and Supervisors
July 2017
Implementation of Learning Management System
Employee Relations Managers and Supervisors
December 2017 – December 2018
Ensure the development of succession plans to retain identified capabilities and mentoring program
Managers and Supervisors
Employee Relations Ongoing
Investment in additional trainees, apprentices and cadets in areas with anticipated retirements
The Executive Employee Relations Ongoing
Implement ongoing training and communication for all employees to assist with ensuring compliance with Council’s policies as they are revised and updated.
Employee Relations Managers and Supervisors
Ongoing
Develop a Health and Wellbeing Procedure Employee Relations Corporate Planning and Business Improvement Officer
Health and Safety Committee Staff Consultative Committee
December 2017
Greater promotion of health and preventative strategies
Employee Relations Corporate Planning and Business Improvement Officer
Ongoing
Cre
ate
Wol
lond
illy
- R
esou
rcin
g S
trate
gy |
Wor
k Fo
rce
Pla
nnin
g S
trate
gyC
reate Wollondilly - R
esourcing Strategy | W
ork Force Planning S
trategy
108 109
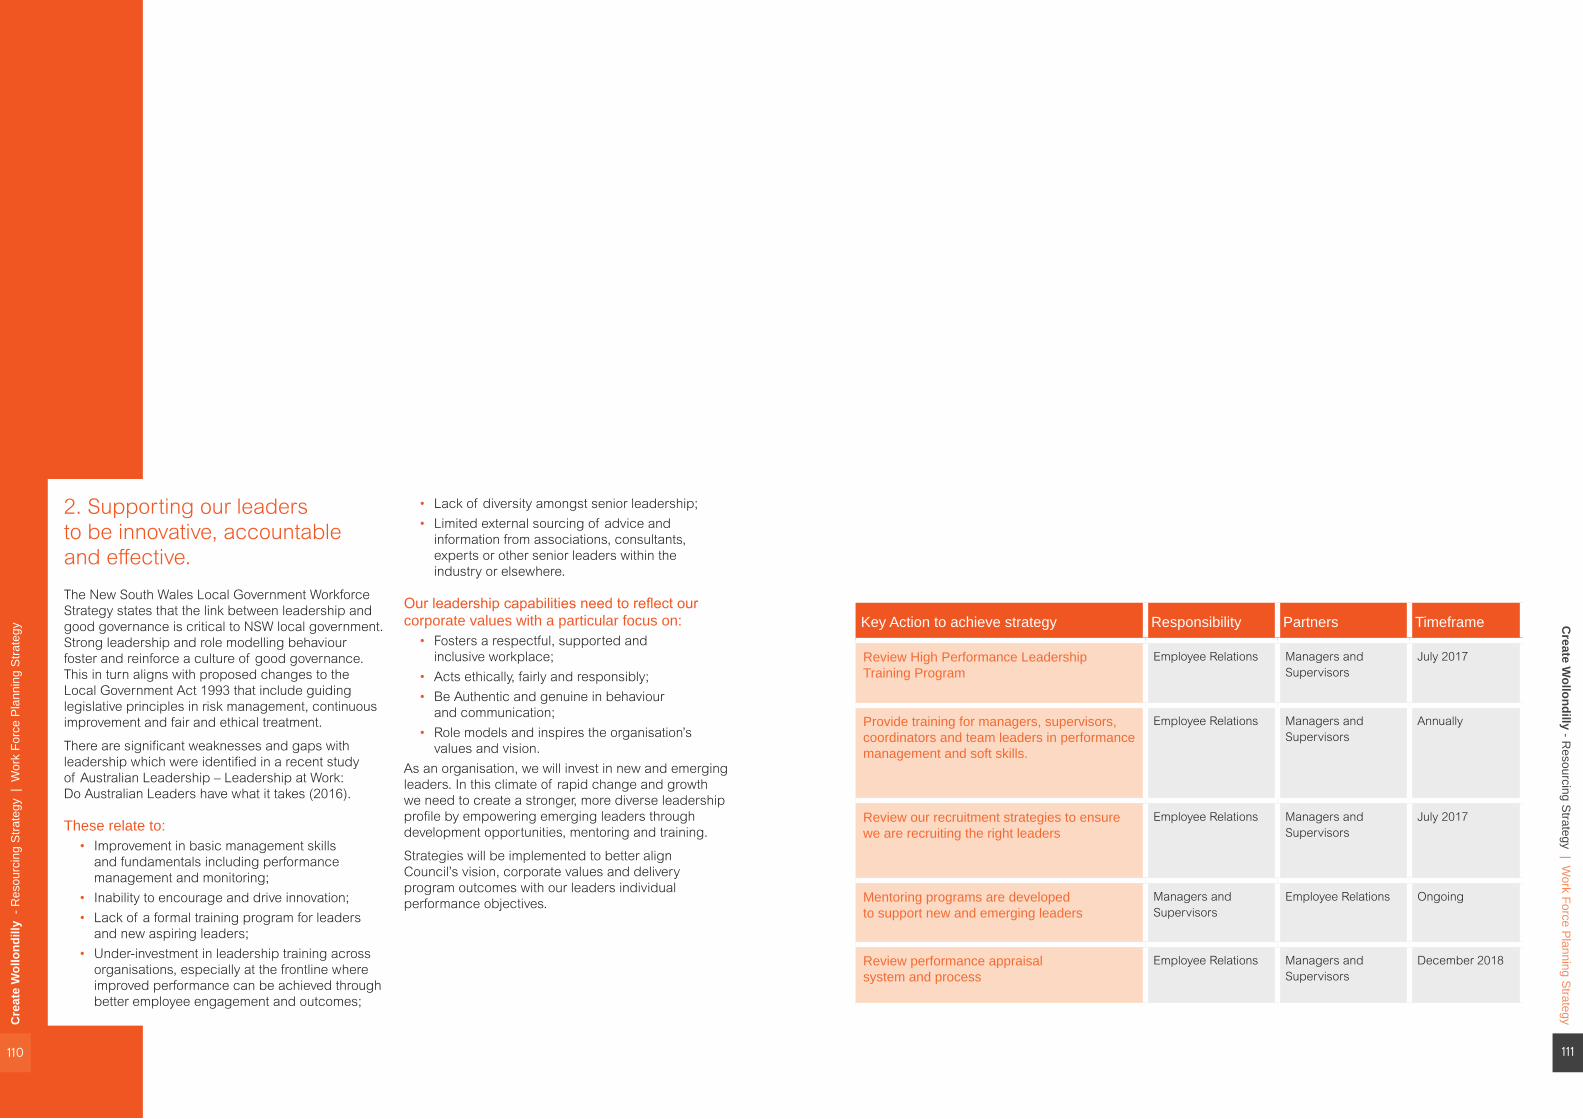
Create W
ollondilly - Resourcing S
trategy | Work Force P
lanning Strategy
111
2. Supporting our leaders to be innovative, accountable and effective.
The New South Wales Local Government Workforce Strategy states that the link between leadership and good governance is critical to NSW local government. Strong leadership and role modelling behaviour foster and reinforce a culture of good governance. This in turn aligns with proposed changes to the Local Government Act 1993 that include guiding legislative principles in risk management, continuous improvement and fair and ethical treatment.
There are significant weaknesses and gaps with leadership which were identified in a recent study of Australian Leadership – Leadership at Work: Do Australian Leaders have what it takes (2016).
These relate to:• Improvement in basic management skills
and fundamentals including performance management and monitoring;
• Inability to encourage and drive innovation;• Lack of a formal training program for leaders
and new aspiring leaders;• Under-investment in leadership training across
organisations, especially at the frontline where improved performance can be achieved through better employee engagement and outcomes;
• Lack of diversity amongst senior leadership;• Limited external sourcing of advice and
information from associations, consultants, experts or other senior leaders within the industry or elsewhere.
Our leadership capabilities need to reflect our corporate values with a particular focus on:
• Fosters a respectful, supported and inclusive workplace;
• Acts ethically, fairly and responsibly;• Be Authentic and genuine in behaviour
and communication;• Role models and inspires the organisation’s
values and vision.As an organisation, we will invest in new and emerging leaders. In this climate of rapid change and growth we need to create a stronger, more diverse leadership profile by empowering emerging leaders through development opportunities, mentoring and training.
Strategies will be implemented to better align Council’s vision, corporate values and delivery program outcomes with our leaders individual performance objectives.
Key Action to achieve strategy Responsibility Partners Timeframe
Review High Performance Leadership Training Program
Employee Relations Managers and Supervisors
July 2017
Provide training for managers, supervisors, coordinators and team leaders in performance management and soft skills.
Employee Relations Managers and Supervisors
Annually
Review our recruitment strategies to ensure we are recruiting the right leaders
Employee Relations Managers and Supervisors
July 2017
Mentoring programs are developed to support new and emerging leaders
Managers and Supervisors
Employee Relations Ongoing
Review performance appraisal system and process
Employee Relations Managers and Supervisors
December 2018
Cre
ate
Wol
lond
illy
- R
esou
rcin
g S
trate
gy |
Wor
k Fo
rce
Pla
nnin
g S
trate
gy
110

Create W
ollondilly - Resourcing S
trategy | Work Force P
lanning Strategy
113
3. Facilitating a workforce that embraces change, high performance and continuous improvement.
Values and behaviours TransformationBuilding a workplace culture that is agile, flexible and resilient to change is critical meeting the growth facing our organisation. We will continue to roll out our corporate values program and training to create a positive work environment where staff are supported and change is embraced as an opportunity to improve.
Building a workforce that is high performing and with the right behaviours will be a key focus when a review is conducted on our performance assessment process.
Continuous ImprovementWe will continue to implement continuous improvement reviews across the organisation to improve our work practices, systems and processes to ensure they are meeting needs of customer, best practice and reflect value for money. Continuous improvement
reviews focus on ways we can deliver services to the community in a more efficient and effective way. As Council continues to review and improve its services to the community, we recognise the skills profile of our workforce may change as well.
Embracing innovations from our people through collaborative leadership and staff engagement programs will also allow us to improve the way we do business.
Embracing new innovative technologyGreater opportunities to explore new ways to automate our systems, processes and practices will ensure that our services are best placed to deliver for our community. Embracing new technology will lead to a number of positive benefits including greater customer satisfaction and responsiveness, operational efficiency, greater capacity for staff. Recently an Information Technology Committee was formed to prioritise new technology systems to support our organisation and people. The committee will also focus on developing a Smart Technology Strategy.
Key Action to achieve strategy Responsibility Partners Timeframe
Streamline services using innovations in technology
Managers and Supervisors
Employee Relations Ongoing
Continue to rollout Council’s Continuous Improvement Program
Managers and Supervisors
Employee Relations Ongoing
Promoting and celebrating our innovations Managers and Supervisors
Employee Relations Ongoing
Undertake change management, technology and resilience building training
Employee Relations Managers and Supervisors
Ongoing
Develop and implement a cultural change to align with our corporate values.
Employee Relations Managers and Supervisors
Ongoing
Cre
ate
Wol
lond
illy
- R
esou
rcin
g S
trate
gy |
Wor
k Fo
rce
Pla
nnin
g S
trate
gy
112
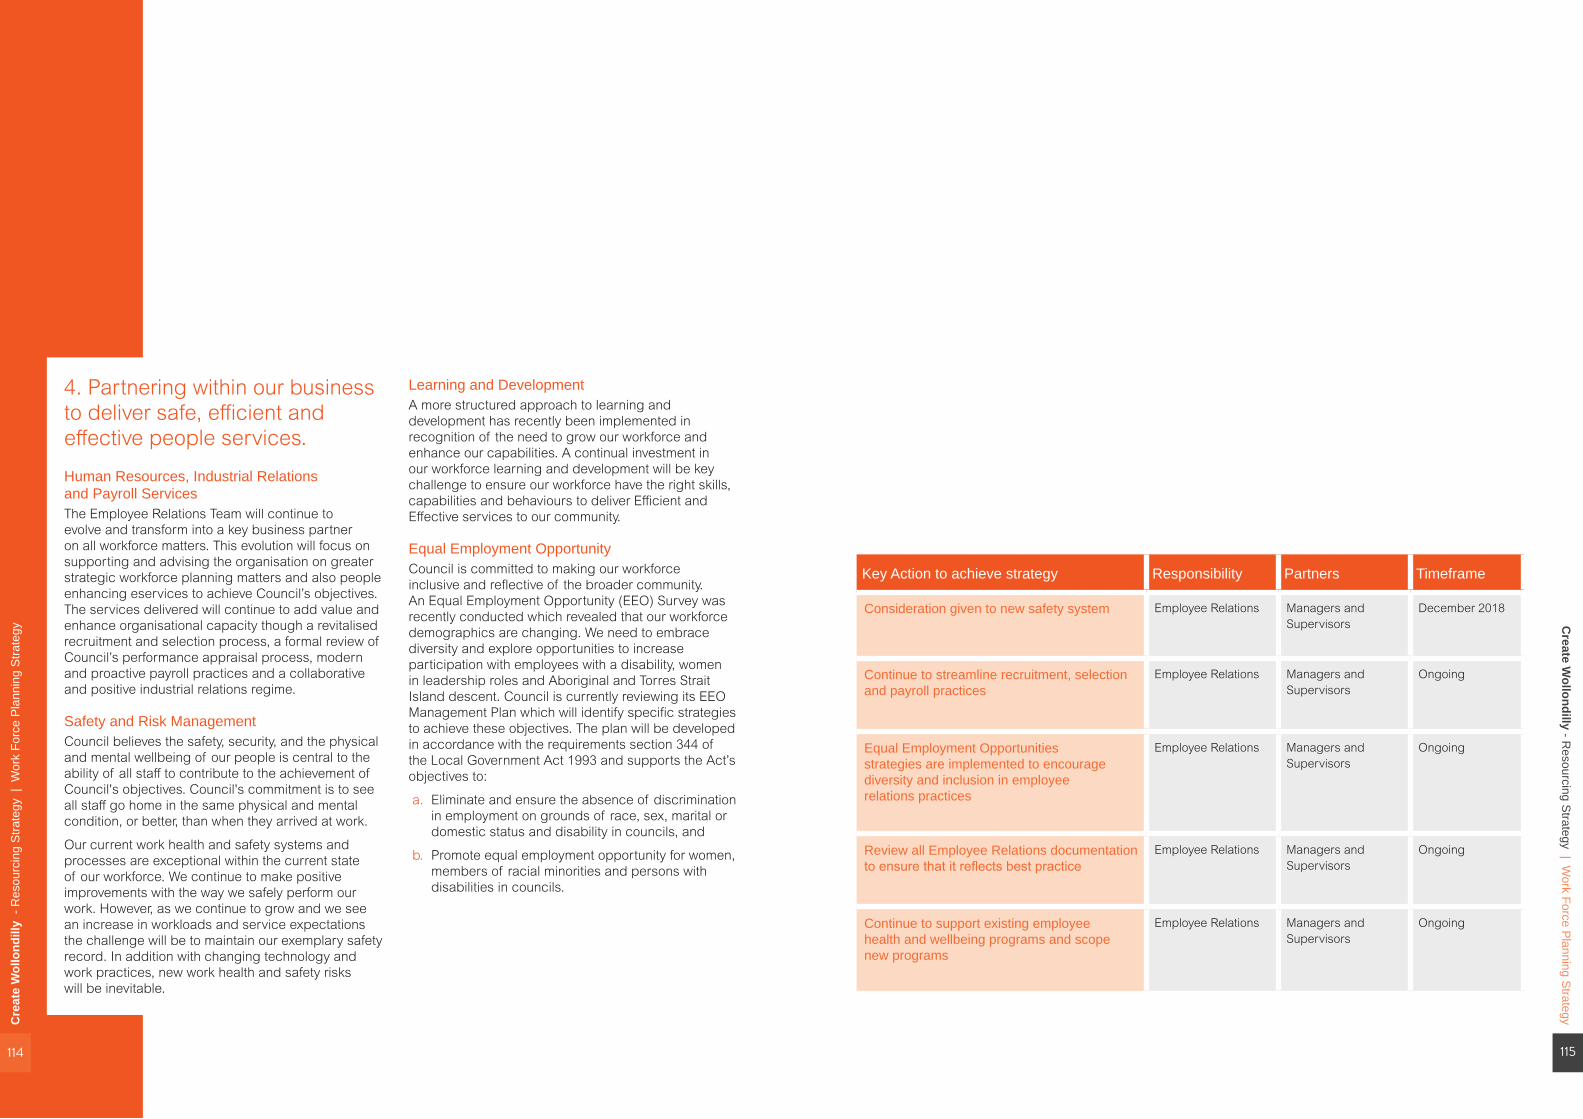
Create W
ollondilly - Resourcing S
trategy | Work Force P
lanning Strategy
115
4. Partnering within our business to deliver safe, efficient and effective people services.
Human Resources, Industrial Relations and Payroll ServicesThe Employee Relations Team will continue to evolve and transform into a key business partner on all workforce matters. This evolution will focus on supporting and advising the organisation on greater strategic workforce planning matters and also people enhancing eservices to achieve Council’s objectives. The services delivered will continue to add value and enhance organisational capacity though a revitalised recruitment and selection process, a formal review of Council’s performance appraisal process, modern and proactive payroll practices and a collaborative and positive industrial relations regime.
Safety and Risk ManagementCouncil believes the safety, security, and the physical and mental wellbeing of our people is central to the ability of all staff to contribute to the achievement of Council's objectives. Council's commitment is to see all staff go home in the same physical and mental condition, or better, than when they arrived at work.
Our current work health and safety systems and processes are exceptional within the current state of our workforce. We continue to make positive improvements with the way we safely perform our work. However, as we continue to grow and we see an increase in workloads and service expectations the challenge will be to maintain our exemplary safety record. In addition with changing technology and work practices, new work health and safety risks will be inevitable.
Learning and Development A more structured approach to learning and development has recently been implemented in recognition of the need to grow our workforce and enhance our capabilities. A continual investment in our workforce learning and development will be key challenge to ensure our workforce have the right skills, capabilities and behaviours to deliver Efficient and Effective services to our community.
Equal Employment OpportunityCouncil is committed to making our workforce inclusive and reflective of the broader community. An Equal Employment Opportunity (EEO) Survey was recently conducted which revealed that our workforce demographics are changing. We need to embrace diversity and explore opportunities to increase participation with employees with a disability, women in leadership roles and Aboriginal and Torres Strait Island descent. Council is currently reviewing its EEO Management Plan which will identify specific strategies to achieve these objectives. The plan will be developed in accordance with the requirements section 344 of the Local Government Act 1993 and supports the Act’s objectives to:
a. Eliminate and ensure the absence of discrimination in employment on grounds of race, sex, marital or domestic status and disability in councils, and
b. Promote equal employment opportunity for women, members of racial minorities and persons with disabilities in councils.
Key Action to achieve strategy Responsibility Partners Timeframe
Consideration given to new safety system Employee Relations Managers and Supervisors
December 2018
Continue to streamline recruitment, selection and payroll practices
Employee Relations Managers and Supervisors
Ongoing
Equal Employment Opportunities strategies are implemented to encourage diversity and inclusion in employee relations practices
Employee Relations Managers and Supervisors
Ongoing
Review all Employee Relations documentation to ensure that it reflects best practice
Employee Relations Managers and Supervisors
Ongoing
Continue to support existing employee health and wellbeing programs and scope new programs
Employee Relations Managers and Supervisors
Ongoing
Cre
ate
Wol
lond
illy
- R
esou
rcin
g S
trate
gy |
Wor
k Fo
rce
Pla
nnin
g S
trate
gy
114
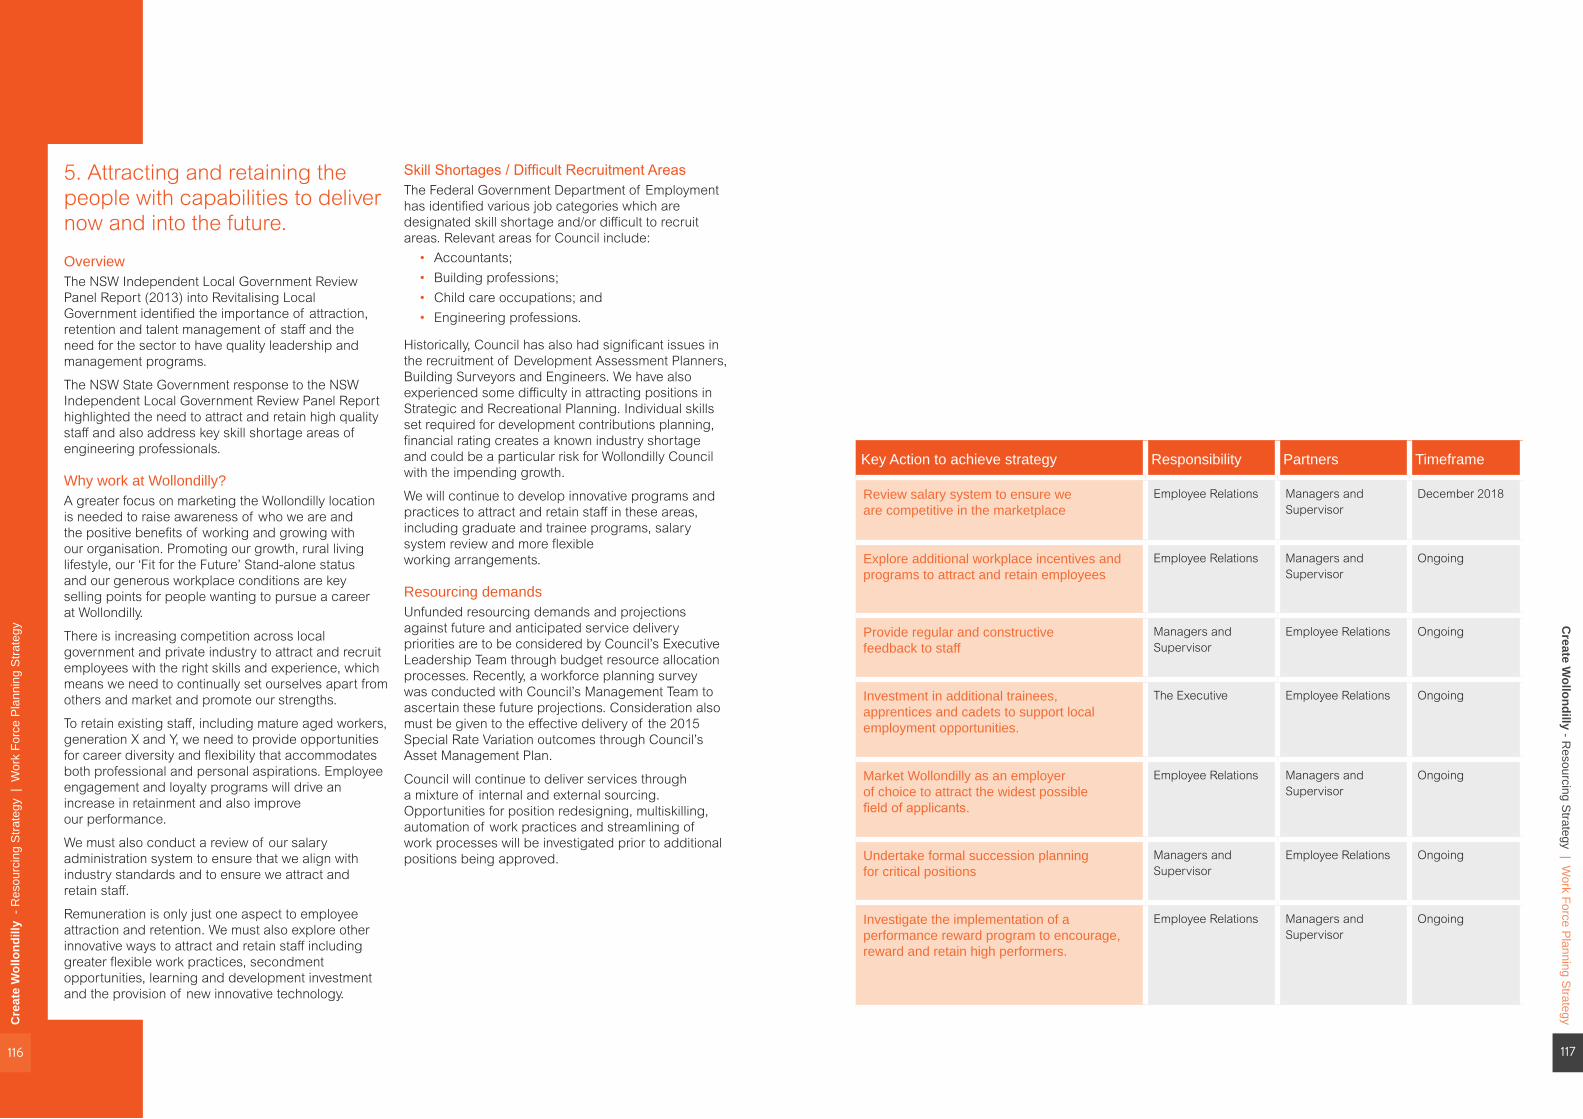
Create W
ollondilly - Resourcing S
trategy | Work Force P
lanning Strategy
117
5. Attracting and retaining the people with capabilities to deliver now and into the future.
OverviewThe NSW Independent Local Government Review Panel Report (2013) into Revitalising Local Government identified the importance of attraction, retention and talent management of staff and the need for the sector to have quality leadership and management programs.
The NSW State Government response to the NSW Independent Local Government Review Panel Report highlighted the need to attract and retain high quality staff and also address key skill shortage areas of engineering professionals.
Why work at Wollondilly? A greater focus on marketing the Wollondilly location is needed to raise awareness of who we are and the positive benefits of working and growing with our organisation. Promoting our growth, rural living lifestyle, our ‘Fit for the Future’ Stand-alone status and our generous workplace conditions are key selling points for people wanting to pursue a career at Wollondilly.
There is increasing competition across local government and private industry to attract and recruit employees with the right skills and experience, which means we need to continually set ourselves apart from others and market and promote our strengths.
To retain existing staff, including mature aged workers, generation X and Y, we need to provide opportunities for career diversity and flexibility that accommodates both professional and personal aspirations. Employee engagement and loyalty programs will drive an increase in retainment and also improve our performance.
We must also conduct a review of our salary administration system to ensure that we align with industry standards and to ensure we attract and retain staff.
Remuneration is only just one aspect to employee attraction and retention. We must also explore other innovative ways to attract and retain staff including greater flexible work practices, secondment opportunities, learning and development investment and the provision of new innovative technology.
Skill Shortages / Difficult Recruitment AreasThe Federal Government Department of Employment has identified various job categories which are designated skill shortage and/or difficult to recruit areas. Relevant areas for Council include:
• Accountants; • Building professions;• Child care occupations; and • Engineering professions.
Historically, Council has also had significant issues in the recruitment of Development Assessment Planners, Building Surveyors and Engineers. We have also experienced some difficulty in attracting positions in Strategic and Recreational Planning. Individual skills set required for development contributions planning, financial rating creates a known industry shortage and could be a particular risk for Wollondilly Council with the impending growth.
We will continue to develop innovative programs and practices to attract and retain staff in these areas, including graduate and trainee programs, salary system review and more flexible working arrangements.
Resourcing demandsUnfunded resourcing demands and projections against future and anticipated service delivery priorities are to be considered by Council’s Executive Leadership Team through budget resource allocation processes. Recently, a workforce planning survey was conducted with Council’s Management Team to ascertain these future projections. Consideration also must be given to the effective delivery of the 2015 Special Rate Variation outcomes through Council’s Asset Management Plan.
Council will continue to deliver services through a mixture of internal and external sourcing. Opportunities for position redesigning, multiskilling, automation of work practices and streamlining of work processes will be investigated prior to additional positions being approved.
Key Action to achieve strategy Responsibility Partners Timeframe
Review salary system to ensure we are competitive in the marketplace
Employee Relations Managers and Supervisor
December 2018
Explore additional workplace incentives and programs to attract and retain employees
Employee Relations Managers and Supervisor
Ongoing
Provide regular and constructive feedback to staff
Managers and Supervisor
Employee Relations Ongoing
Investment in additional trainees, apprentices and cadets to support local employment opportunities.
The Executive Employee Relations Ongoing
Market Wollondilly as an employer of choice to attract the widest possible field of applicants.
Employee Relations Managers and Supervisor
Ongoing
Undertake formal succession planning for critical positions
Managers and Supervisor
Employee Relations Ongoing
Investigate the implementation of a performance reward program to encourage, reward and retain high performers.
Employee Relations Managers and Supervisor
Ongoing
Cre
ate
Wol
lond
illy
- R
esou
rcin
g S
trate
gy |
Wor
k Fo
rce
Pla
nnin
g S
trate
gy
116
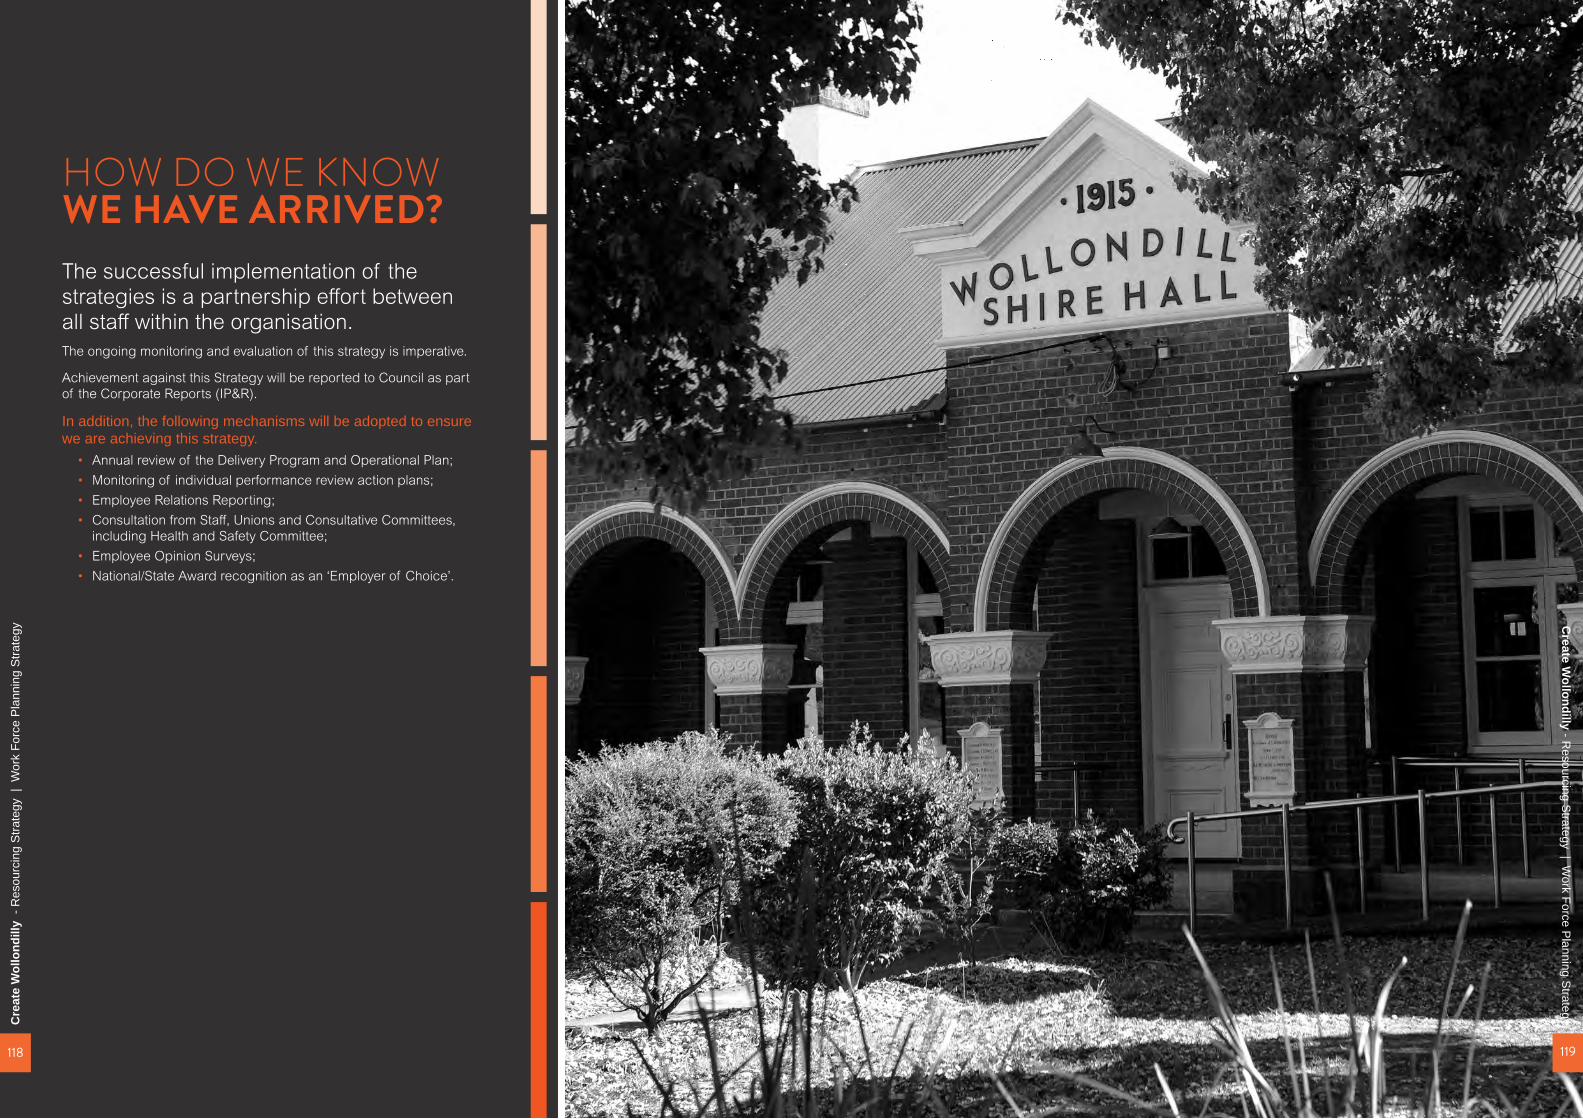
HOW DO WE KNOW WE HAVE ARRIVED?The successful implementation of the strategies is a partnership effort between all staff within the organisation. The ongoing monitoring and evaluation of this strategy is imperative.
Achievement against this Strategy will be reported to Council as part of the Corporate Reports (IP&R).
In addition, the following mechanisms will be adopted to ensure we are achieving this strategy.
• Annual review of the Delivery Program and Operational Plan; • Monitoring of individual performance review action plans; • Employee Relations Reporting;• Consultation from Staff, Unions and Consultative Committees,
including Health and Safety Committee;• Employee Opinion Surveys;• National/State Award recognition as an ‘Employer of Choice’.
Cre
ate
Wol
lond
illy
- R
esou
rcin
g S
trate
gy |
Wor
k Fo
rce
Pla
nnin
g S
trate
gyC
reate Wollondilly - R
esourcing Strategy | W
ork Force Planning S
trategy
118 119

PO Box 21, Picton NSW 2571 Australia | E [email protected] | P 02 4677 1100
www.wollondilly.nsw.gov.au