create your own simple graphics for mobile - john duchneskie - murfreesboro, tn - sept. 30-oct. 1,...
TRANSCRIPT

APME NewsTrain Murfreesboro • Sept. 30-Oct. 1, 2016
Headline goes right about hereYellow type adfaa dfasa dfadf asdfasdfafsd
Blue type adfaa dfa s dfadf a asdf asdfa
APME NewsTrain Murfreesboro • Sept. 30-Oct. 1, 2016
Create Your Own Simple Graphics
For MobileJohn Duchneskie
The Philadelphia Inquirer

APME NewsTrain Murfreesboro • Sept. 30-Oct. 1, 2016
To paraphrase James Carville …

APME NewsTrain Murfreesboro • Sept. 30-Oct. 1, 2016
It’s the content,stupid [I don’t mean you]
To paraphrase James Carville …

APME NewsTrain Murfreesboro • Sept. 30-Oct. 1, 2016
It’s the content,stupid [I don’t mean you]
yEven the simplest of graphics can convey powerful information
To paraphrase James Carville …

APME NewsTrain Murfreesboro • Sept. 30-Oct. 1, 2016
It’s the content,stupid [I don’t mean you]
yEven the simplest of graphics can convey powerful information
yYour graphic is only as good as your content
To paraphrase James Carville …

APME NewsTrain Murfreesboro • Sept. 30-Oct. 1, 2016
Testscores
SOURCE: School District of Philadelphia JOHN DUCHNESKIE / Staff Artist
Lamberton ElementaryHuey Elementary Tilden MiddleResults are for 5th grade. Results are for 5th grade. Results are for 7th grade.
Reading Reading Reading
Math Math Math
District avg.
0
10
20
30
40
50
60
70
80
’11-’12
’10-’11
’09-’10
’08-’09
’07-’08
’06-’07
’05-’06
0
10
20
30
40
50
60
70
80
’11-’12
’10-’11
’09-’10
’08-’09
’07-’08
’06-’07
’05-’06
0
10
20
30
40
50
60
70
80
’11-’12
’10-’11
’09-’10
’08-’09
’07-’08
’06-’07
’05-’06
0
10
20
30
40
50
60
70
80
’11-’12
’10-’11
’09-’10
’08-’09
’07-’08
’06-’07
’05-’06
0
10
20
30
40
50
60
70
80
’11-’12
’10-’11
’09-’10
’08-’09
’07-’08
’06-’07
’05-’06
0
10
20
30
40
50
60
70
80
’11-’12
’10-’11
’09-’10
’08-’09
’07-’08
’06-’07
’05-’06
% % %
% % %
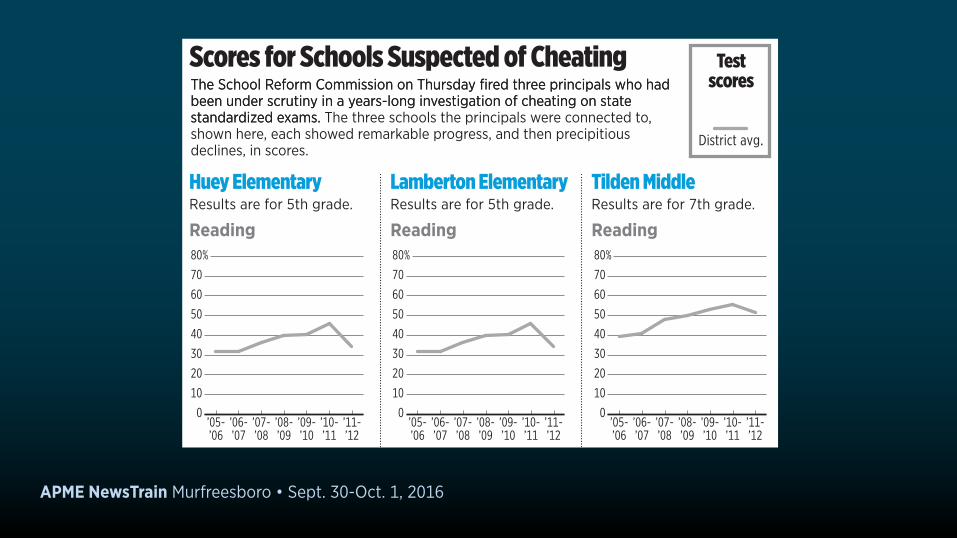
The School Reform Commission on Thursday fired three principals who had been under scrutiny in a years-long investigation of cheating on state standardized exams. The three schools the principals were connected to, shown here, each showed remarkable progress, and then precipitious declines, in scores.
Scores for Schools Suspected of CheatingThe School Reform Commission on Thursday fired three principals who had been under scrutiny in a years-long investigation of cheating on state standardized exams.
APME NewsTrain Murfreesboro • Sept. 30-Oct. 1, 2016
Testscores
SOURCE: School District of Philadelphia JOHN DUCHNESKIE / Staff Artist
Lamberton ElementaryHuey Elementary Tilden MiddleResults are for 5th grade. Results are for 5th grade. Results are for 7th grade.
Reading Reading Reading
Math Math Math
District avg.
0
10
20
30
40
50
60
70
80
’11-’12
’10-’11
’09-’10
’08-’09
’07-’08
’06-’07
’05-’06
0
10
20
30
40
50
60
70
80
’11-’12
’10-’11
’09-’10
’08-’09
’07-’08
’06-’07
’05-’06
0
10
20
30
40
50
60
70
80
’11-’12
’10-’11
’09-’10
’08-’09
’07-’08
’06-’07
’05-’06
0
10
20
30
40
50
60
70
80
’11-’12
’10-’11
’09-’10
’08-’09
’07-’08
’06-’07
’05-’06
0
10
20
30
40
50
60
70
80
’11-’12
’10-’11
’09-’10
’08-’09
’07-’08
’06-’07
’05-’06
0
10
20
30
40
50
60
70
80
’11-’12
’10-’11
’09-’10
’08-’09
’07-’08
’06-’07
’05-’06
% % %
% % %
The School Reform Commission on Thursday fired three principals who had been under scrutiny in a years-long investigation of cheating on state standardized exams. The three schools the principals were connected to, shown here, each showed remarkable progress, and then precipitious declines, in scores.
Scores for Schools Suspected of CheatingThe School Reform Commission on Thursday fired three principals who had been under scrutiny in a years-long investigation of cheating on state standardized exams.

APME NewsTrain Murfreesboro • Sept. 30-Oct. 1, 2016
Testscores
SOURCE: School District of Philadelphia JOHN DUCHNESKIE / Staff Artist
Lamberton ElementaryHuey Elementary Tilden MiddleResults are for 5th grade. Results are for 5th grade. Results are for 7th grade.
Reading Reading Reading
Math Math Math
District avg.
0
10
20
30
40
50
60
70
80
’11-’12
’10-’11
’09-’10
’08-’09
’07-’08
’06-’07
’05-’06
0
10
20
30
40
50
60
70
80
’11-’12
’10-’11
’09-’10
’08-’09
’07-’08
’06-’07
’05-’06
0
10
20
30
40
50
60
70
80
’11-’12
’10-’11
’09-’10
’08-’09
’07-’08
’06-’07
’05-’06
0
10
20
30
40
50
60
70
80
’11-’12
’10-’11
’09-’10
’08-’09
’07-’08
’06-’07
’05-’06
0
10
20
30
40
50
60
70
80
’11-’12
’10-’11
’09-’10
’08-’09
’07-’08
’06-’07
’05-’06
0
10
20
30
40
50
60
70
80
’11-’12
’10-’11
’09-’10
’08-’09
’07-’08
’06-’07
’05-’06
% % %
% % %
10.7%10.7%
17.1%17.1% 19.7%19.7%
77.2%77.2%
38.0%38.0%
11.2%11.2%
76.2%76.2%
35.3%35.3%
15.3%15.3%
64.0%64.0%
18.2%18.2%12.4%12.4%
59.9%59.9%
25.5%25.5%
78.6%78.6%
26.0%26.0%18.3%18.3%
57.0%57.0%
School
The School Reform Commission on Thursday fired three principals who had been under scrutiny in a years-long investigation of cheating on state standardized exams. The three schools the principals were connected to, shown here, each showed remarkable progress, and then precipitious declines, in scores.
Scores for Schools Suspected of Cheating

APME NewsTrain Murfreesboro • Sept. 30-Oct. 1, 2016
A Fast and Deep Decline
Percentage decline and duration of selected bear markets:
The Dow Jones industrial average has now lost half of its value since its peak in October 2007. The depth and pace of the current decline are worse than any since the Great Depression.

APME NewsTrain Murfreesboro • Sept. 30-Oct. 1, 2016
7006005004003002001000Trading days from previous peak to market bottom
Dotcom bustJan. 14, 2000–
March 22, 2001422 trading days
–29.7%
A Fast and Deep Decline
Percentage decline and duration of selected bear markets:
The Dow Jones industrial average has now lost half of its value since its peak in October 2007. The depth and pace of the current decline are worse than any since the Great Depression.

APME NewsTrain Murfreesboro • Sept. 30-Oct. 1, 2016
7006005004003002001000Trading days from previous peak to market bottom
Arab oil embargoJan. 11, 1973–
Dec. 6, 1974484 trading days
–45.1%
Dotcom bustJan. 14, 2000–
March 22, 2001422 trading days
–29.7%
Current crisisOct. 9, 2007 – ???351 trading daysthrough yesterday–52.3%
A Fast and Deep Decline
Percentage decline and duration of selected bear markets:
The Dow Jones industrial average has now lost half of its value since its peak in October 2007. The depth and pace of the current decline are worse than any since the Great Depression.

APME NewsTrain Murfreesboro • Sept. 30-Oct. 1, 2016
7006005004003002001000Trading days from previous peak to market bottom
Arab oil embargoJan. 11, 1973–
Dec. 6, 1974484 trading days
–45.1%
Dotcom bustJan. 14, 2000–
March 22, 2001422 trading days
–29.7%
Great DepressionSept. 3, 1929–
July 8, 1932718 trading days
–89.2%
SOURCE: Bloomberg News JOHN DUCHNESKIE / Staff Artist
Current crisisOct. 9, 2007 – ???351 trading daysthrough yesterday–52.3%
A Fast and Deep Decline
Percentage decline and duration of selected bear markets:
The Dow Jones industrial average has now lost half of its value since its peak in October 2007. The depth and pace of the current decline are worse than any since the Great Depression.

APME NewsTrain Murfreesboro • Sept. 30-Oct. 1, 2016
Using maps to tell a story

APME NewsTrain Murfreesboro • Sept. 30-Oct. 1, 2016

APME NewsTrain Murfreesboro • Sept. 30-Oct. 1, 2016

APME NewsTrain Murfreesboro • Sept. 30-Oct. 1, 2016

APME NewsTrain Murfreesboro • Sept. 30-Oct. 1, 2016 Interactive map is here

APME NewsTrain Murfreesboro • Sept. 30-Oct. 1, 2016
Your options for getting work done in your home

APME NewsTrain Murfreesboro • Sept. 30-Oct. 1, 2016
Your options for getting work done in your home yFast

APME NewsTrain Murfreesboro • Sept. 30-Oct. 1, 2016
Your options for getting work done in your home yFast
yGood

APME NewsTrain Murfreesboro • Sept. 30-Oct. 1, 2016
Your options for getting work done in your home yFast
yGood
yCheap

APME NewsTrain Murfreesboro • Sept. 30-Oct. 1, 2016
Your options for getting work done in your home yFast
yGood
yCheap
Pick any two.

The data-visualization challenge
APME NewsTrain Murfreesboro • Sept. 30-Oct. 1, 2016

Easyto use
The data-visualization challenge
APME NewsTrain Murfreesboro • Sept. 30-Oct. 1, 2016

Easyto use
Powerful
The data-visualization challenge
APME NewsTrain Murfreesboro • Sept. 30-Oct. 1, 2016

Easyto use
Powerful Free?
The data-visualization challenge
APME NewsTrain Murfreesboro • Sept. 30-Oct. 1, 2016

APME NewsTrain Murfreesboro • Sept. 30-Oct. 1, 2016
What we’ll do today

APME NewsTrain Murfreesboro • Sept. 30-Oct. 1, 2016
What we’ll do todayyDemonstration of creating charts with Datawrapper

APME NewsTrain Murfreesboro • Sept. 30-Oct. 1, 2016
What we’ll do todayyDemonstration of creating charts with Datawrapper
yHands-on practice with Datawrapper

APME NewsTrain Murfreesboro • Sept. 30-Oct. 1, 2016
What we’ll do todayyDemonstration of creating charts with Datawrapper
yHands-on practice with Datawrapper
yDemonstration of creating a map

APME NewsTrain Murfreesboro • Sept. 30-Oct. 1, 2016
What we’ll do todayyDemonstration of creating charts with Datawrapper
yHands-on practice with Datawrapper
yDemonstration of creating a map
yHands-on practice creating a map

APME NewsTrain Murfreesboro • Sept. 30-Oct. 1, 2016
What we’ll do todayyDemonstration of creating charts with Datawrapper
yHands-on practice with Datawrapper
yDemonstration of creating a map
yHands-on practice creating a map
yQuestions and answers

APME NewsTrain Murfreesboro • Sept. 30-Oct. 1, 2016
Demonstration: Creating this in DatawrapperTest
scores
SOURCE: School District of Philadelphia JOHN DUCHNESKIE / Staff Artist
Lamberton ElementaryHuey Elementary Tilden MiddleResults are for 5th grade. Results are for 5th grade. Results are for 7th grade.
Reading Reading Reading
Math Math Math
District avg.
0
10
20
30
40
50
60
70
80
’11-’12
’10-’11
’09-’10
’08-’09
’07-’08
’06-’07
’05-’06
0
10
20
30
40
50
60
70
80
’11-’12
’10-’11
’09-’10
’08-’09
’07-’08
’06-’07
’05-’06
0
10
20
30
40
50
60
70
80
’11-’12
’10-’11
’09-’10
’08-’09
’07-’08
’06-’07
’05-’06
0
10
20
30
40
50
60
70
80
’11-’12
’10-’11
’09-’10
’08-’09
’07-’08
’06-’07
’05-’06
0
10
20
30
40
50
60
70
80
’11-’12
’10-’11
’09-’10
’08-’09
’07-’08
’06-’07
’05-’06
0
10
20
30
40
50
60
70
80
’11-’12
’10-’11
’09-’10
’08-’09
’07-’08
’06-’07
’05-’06
% % %
% % %
10.7%10.7%
17.1%17.1% 19.7%19.7%
77.2%77.2%
38.0%38.0%
11.2%11.2%
76.2%76.2%
35.3%35.3%
15.3%15.3%
64.0%64.0%
18.2%18.2%12.4%12.4%
59.9%59.9%
25.5%25.5%
78.6%78.6%
26.0%26.0%18.3%18.3%
57.0%57.0%
School
The School Reform Commission on Thursday fired three principals who had been under scrutiny in a years-long investigation of cheating on state standardized exams. The three schools the principals were connected to, shown here, each showed remarkable progress, and then precipitious declines, in scores.
Scores for Schools Suspected of Cheating

APME NewsTrain Murfreesboro • Sept. 30-Oct. 1, 2016
Your TurnOpen the file called Murfreesboro pop growth.xlsx

APME NewsTrain Murfreesboro • Sept. 30-Oct. 1, 2016
On your ownCreate a column chart with the data in Nashville_homicides.xlsx

APME NewsTrain Murfreesboro • Sept. 30-Oct. 1, 2016
Creating MapsThe two most common maps you’ll create:

APME NewsTrain Murfreesboro • Sept. 30-Oct. 1, 2016
Creating MapsPoint mapyEach icon represents a discrete locationyIn this example, icons just represent location

APME NewsTrain Murfreesboro • Sept. 30-Oct. 1, 2016
Point mapyIn this map, icons have different colors and sizes to represent data as well as location
APME NewsTrain Murfreesboro • Sept. 30-Oct. 1, 2016
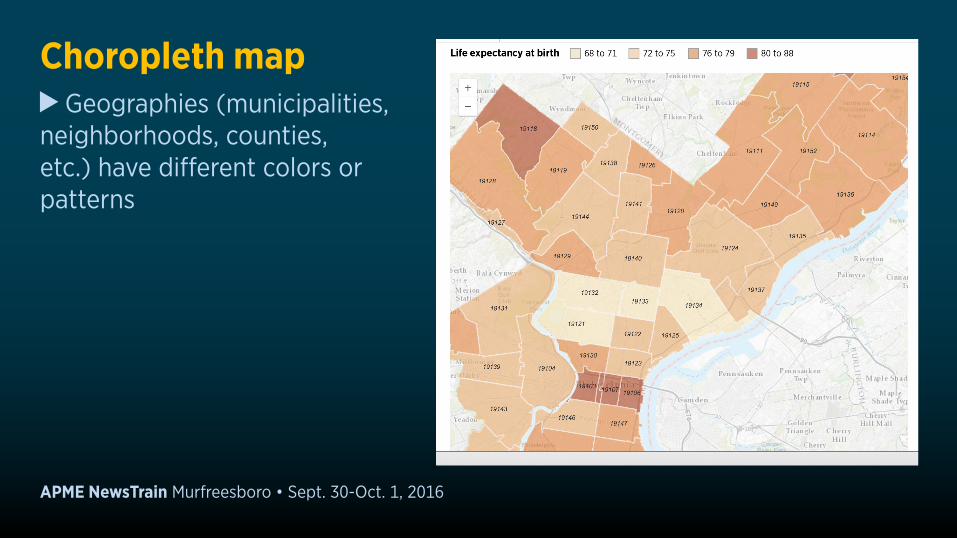
Choropleth mapyGeographies (municipalities, neighborhoods, counties, etc.) have different colors or patterns

APME NewsTrain Murfreesboro • Sept. 30-Oct. 1, 2016
Choropleth mapyGeographies (municipalities, neighborhoods, counties, etc.) have different colors or patterns
yCan show differences in quantitative values (as in ranges of life expectency shown in this map)

APME NewsTrain Murfreesboro • Sept. 30-Oct. 1, 2016
Choropleth mapyGeographies (municipalities, neighborhoods, counties, etc.) have different colors or patterns
yCan show differences in quantitative values (as in ranges of life expectency shown in this map)

APME NewsTrain Murfreesboro • Sept. 30-Oct. 1, 2016
Choropleth mapyGeographies (municipalities, neighborhoods, counties, etc.) have different colors or patterns
yCan show differences in quantitative values (as in ranges of life expectency shown in this map)

APME NewsTrain Murfreesboro • Sept. 30-Oct. 1, 2016
Choropleth mapyGeographies (municipalities, neighborhoods, counties, etc.) have different colors or patterns
yCan show differences in quantitative values (as in ranges of life expectency shown in this map)
yCan also show categorical values (which candidate won which county)

APME NewsTrain Murfreesboro • Sept. 30-Oct. 1, 2016
Demonstration: Creating this in ArcGIS Online

APME NewsTrain Murfreesboro • Sept. 30-Oct. 1, 2016
Your TurnOpen the file called Metro_Public_WiFi_Locations.csv
APME NewsTrain Murfreesboro • Sept. 30-Oct. 1, 2016
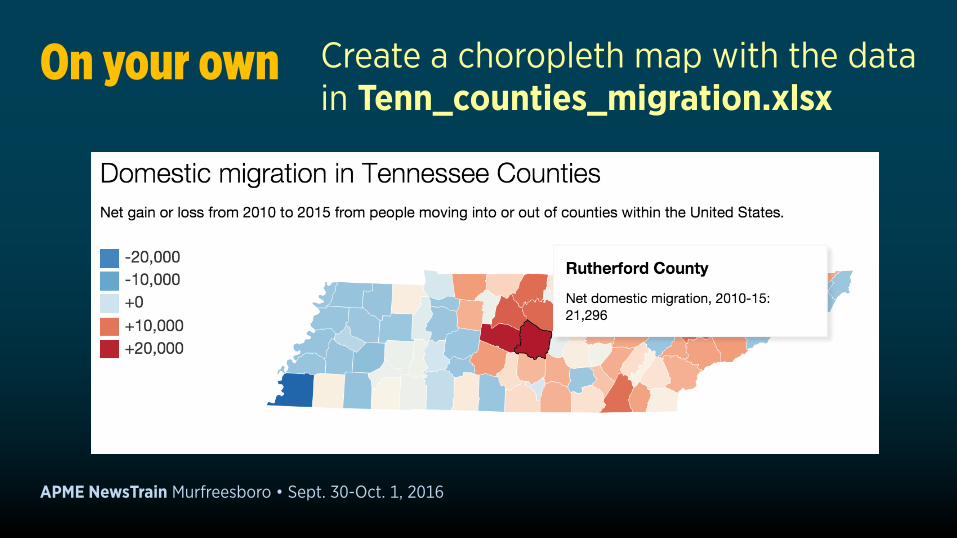
On your own Create a choropleth map with the data in Tenn_counties_migration.xlsx

APME NewsTrain Murfreesboro • Sept. 30-Oct. 1, 2016
Overview of charting toolsDatawrapperyEasy to use
yMultiple chart styles
yFree to APME attendees until Nov. 30
y12 euros a month/ 100 euros per year

APME NewsTrain Murfreesboro • Sept. 30-Oct. 1, 2016
Overview of charting toolsDatawrapperyEasy to use
yMultiple chart styles
yFree to APME attendees until Nov. 30
y12 euros a month/ 100 euros per year
Tableau PublicyFree
yMore chart types than Datawrapper
yStrong outreach to journalists
yMuch longer learning curve than Datawrapper

APME NewsTrain Murfreesboro • Sept. 30-Oct. 1, 2016
Overview of charting toolsGoogle Fusion TablesyFree
yFewer chart options than Datawrapper and Tableau
yHarder to use than Datawrapper; some HTML knowledge helpful

APME NewsTrain Murfreesboro • Sept. 30-Oct. 1, 2016
Overview of mapping toolsDatawrapperyEasy to use
yMap choices limited to choropleth (thematic) or symbol (bubble) maps
yLimited geographies (countries, states, counties)
yFree until Nov. 30

APME NewsTrain Murfreesboro • Sept. 30-Oct. 1, 2016
Overview of mapping toolsDatawrapperyEasy to use
yMap choices limited to choropleth (thematic) or symbol (bubble) maps
yLimited geographies (countries, states, counties)
yFree until Nov. 30
ArcGIS OnlineyFree for one year to APME attendees
yAPME attendees also get a free copy of ArcGIS Desktop, the industry-standard GIS mapping program (typically called ArcView in newsrooms), with free support for one year

APME NewsTrain Murfreesboro • Sept. 30-Oct. 1, 2016
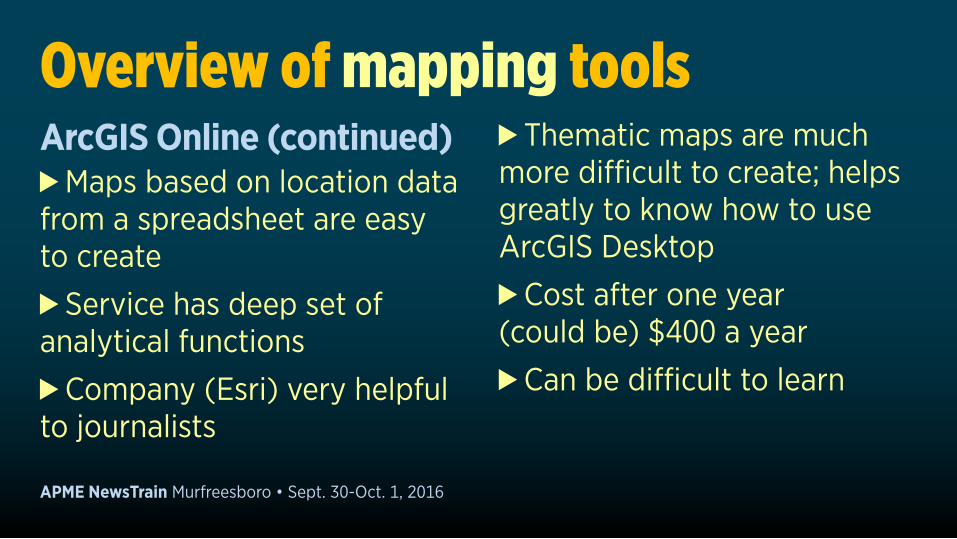
Overview of mapping toolsArcGIS Online (continued)yMaps based on location data from a spreadsheet are easy to create
yService has deep set of analytical functions
yCompany (Esri) very helpful to journalists
APME NewsTrain Murfreesboro • Sept. 30-Oct. 1, 2016
Overview of mapping toolsArcGIS Online (continued)yMaps based on location data from a spreadsheet are easy to create
yService has deep set of analytical functions
yCompany (Esri) very helpful to journalists
yThematic maps are much more difficult to create; helps greatly to know how to use ArcGIS Desktop
yCost after one year (could be) $400 a year
yCan be difficult to learn

APME NewsTrain Murfreesboro • Sept. 30-Oct. 1, 2016
Other mapping toolsGoogle Fusion TablesyFree
yAlmost unlimited geographies available
yUsed widely by journalists
yLearning curve

APME NewsTrain Murfreesboro • Sept. 30-Oct. 1, 2016
Other mapping toolsGoogle Fusion TablesyFree
yAlmost unlimited geographies available
yUsed widely by journalists
yLearning curve
Tableau PublicyFree, but takes time to learn
yCan join maps with Tableau’s charting functions

APME NewsTrain Murfreesboro • Sept. 30-Oct. 1, 2016
Other mapping toolsGoogle Fusion TablesyFree
yAlmost unlimited geographies available
yUsed widely by journalists
yLearning curve
Tableau PublicyFree, but takes time to learn
yCan join maps with Tableau’s charting functions
Batchgeo.comyVery easy
yFree
yLimited to just point maps

APME NewsTrain Murfreesboro • Sept. 30-Oct. 1, 2016
Questions? Need help?Let’s talk.John Duchneskie
The Philadelphia [email protected]
Twitter: @jduchneskie