created by: krames health & safety education staywell health management managing wellness...
TRANSCRIPT
Created by:Created by:Krames Health & Safety EducationKrames Health & Safety Education
StayWell Health ManagementStayWell Health Management
Managing WellnessManaging WellnessManaging Your BusinessManaging Your Business

• Rationale for Worksite Health Promotion Programs
– Why Wellness?– Why the Worksite?– What’s the Goal?
• Published Research on WHP Programs
– High Risk Employees Cost More– WHP Programs Have an Impact– Comprehensive Programs Have Positive ROI
• Bottom Line
AgendaAgenda

Rationale for Worksite Health Rationale for Worksite Health Promotion ProgramsPromotion Programs
Rationale For WHP ProgramsRationale For WHP ProgramsWhy Wellness?Why Wellness?
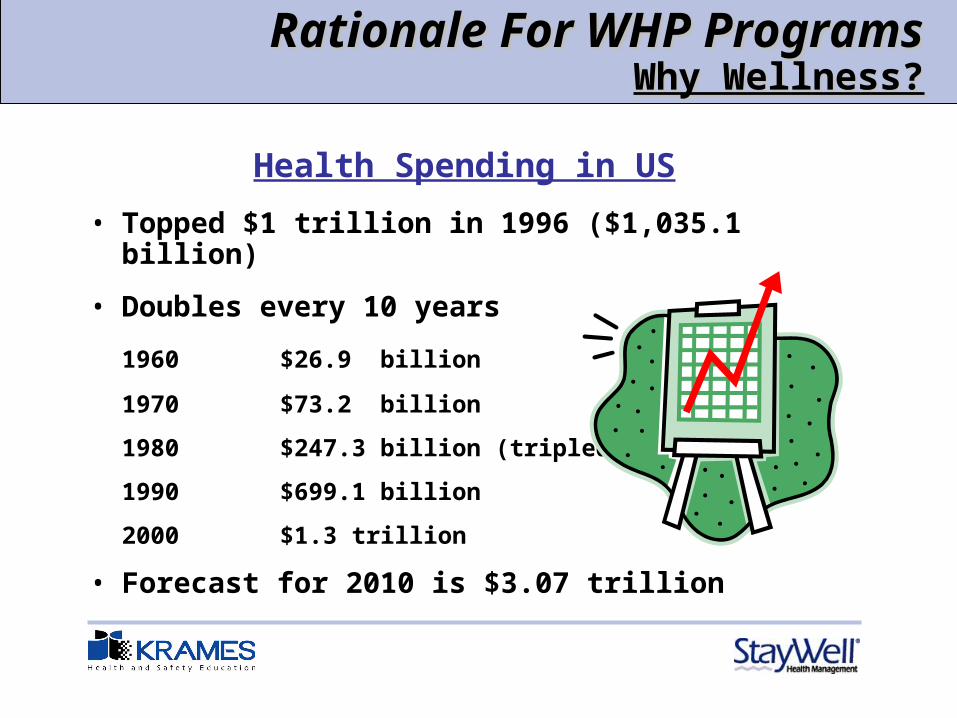
Health Spending in US
• Topped $1 trillion in 1996 ($1,035.1 billion)
• Doubles every 10 years
1960 $26.9 billion
1970 $73.2 billion
1980 $247.3 billion (tripled)
1990 $699.1 billion
2000 $1.3 trillion
• Forecast for 2010 is $3.07 trillion
Rationale For WHP ProgramsRationale For WHP ProgramsWhy Wellness?Why Wellness?
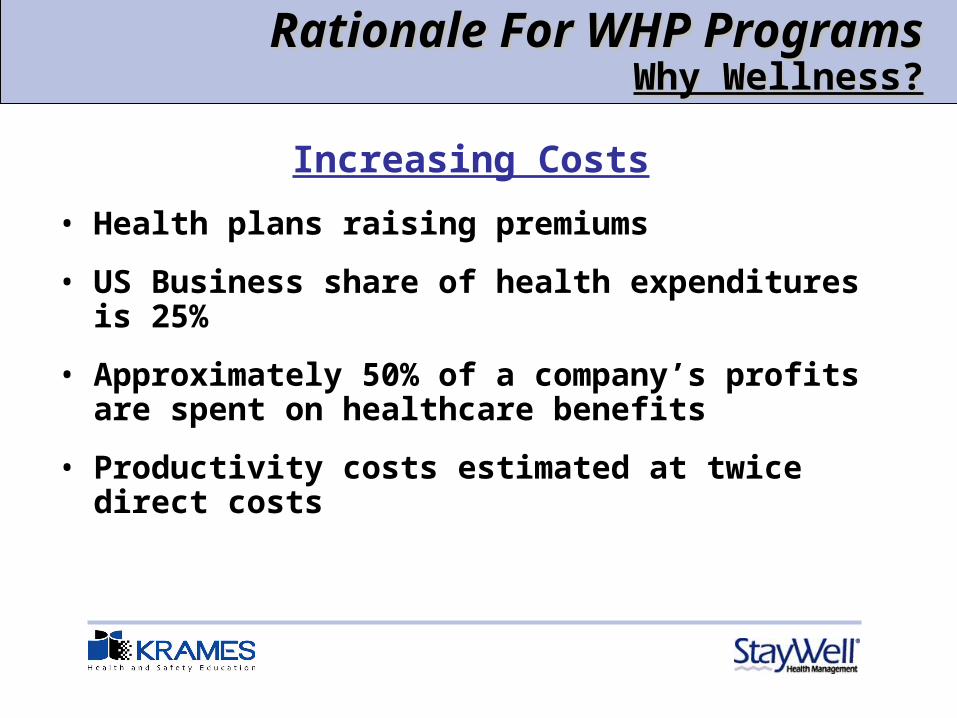
Increasing Costs
• Health plans raising premiums
• US Business share of health expenditures is 25%
• Approximately 50% of a company’s profits are spent on healthcare benefits
• Productivity costs estimated at twice direct costs

50%
20%
20%
10%
LifestyleEnvironmentBiologyHealth Services
Lifestyle Accounts for 50% of Deaths
Source: CDC (1980)
Rationale For WHP ProgramsRationale For WHP ProgramsWhy Wellness?Why Wellness?
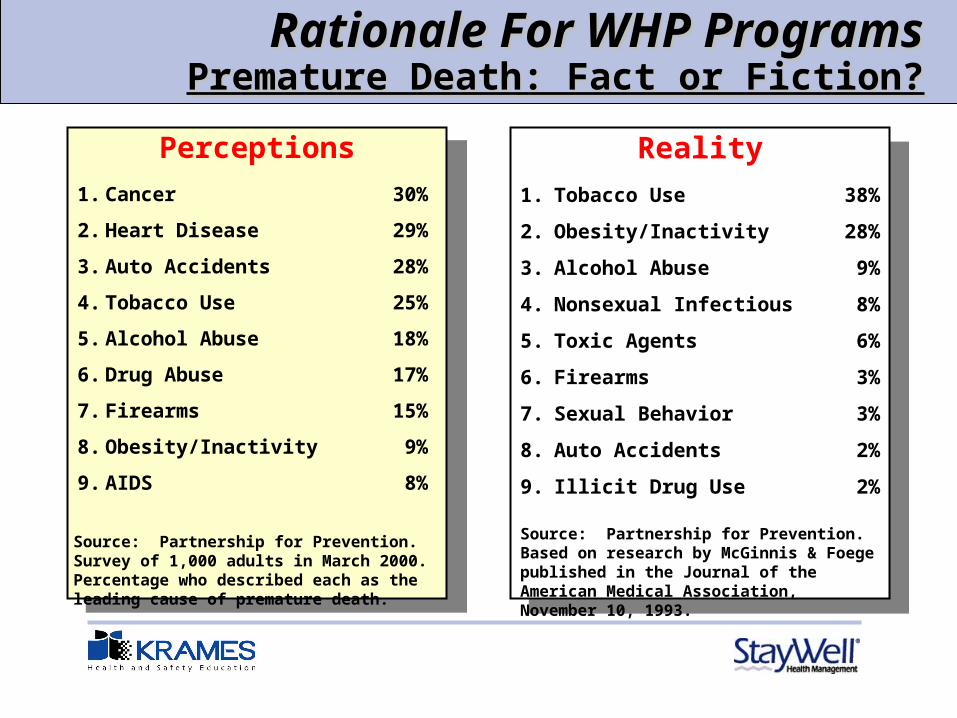
Perceptions
1. Cancer 30%
2. Heart Disease 29%
3. Auto Accidents 28%
4. Tobacco Use 25%
5. Alcohol Abuse 18%
6. Drug Abuse 17%
7. Firearms 15%
8. Obesity/Inactivity 9%
9. AIDS 8%
Perceptions
1. Cancer 30%
2. Heart Disease 29%
3. Auto Accidents 28%
4. Tobacco Use 25%
5. Alcohol Abuse 18%
6. Drug Abuse 17%
7. Firearms 15%
8. Obesity/Inactivity 9%
9. AIDS 8%
Reality
1. Tobacco Use 38%
2. Obesity/Inactivity 28%
3. Alcohol Abuse 9%
4. Nonsexual Infectious 8%
5. Toxic Agents 6%
6. Firearms 3%
7. Sexual Behavior 3%
8. Auto Accidents 2%
9. Illicit Drug Use 2%
Reality
1. Tobacco Use 38%
2. Obesity/Inactivity 28%
3. Alcohol Abuse 9%
4. Nonsexual Infectious 8%
5. Toxic Agents 6%
6. Firearms 3%
7. Sexual Behavior 3%
8. Auto Accidents 2%
9. Illicit Drug Use 2%
Rationale For WHP ProgramsRationale For WHP ProgramsPremature Death: Fact or Fiction?Premature Death: Fact or Fiction?
Source: Partnership for Prevention. Survey of 1,000 adults in March 2000. Percentage who described each as the leading cause of premature death.
Source: Partnership for Prevention. Based on research by McGinnis & Foege published in the Journal of the American Medical Association, November 10, 1993.
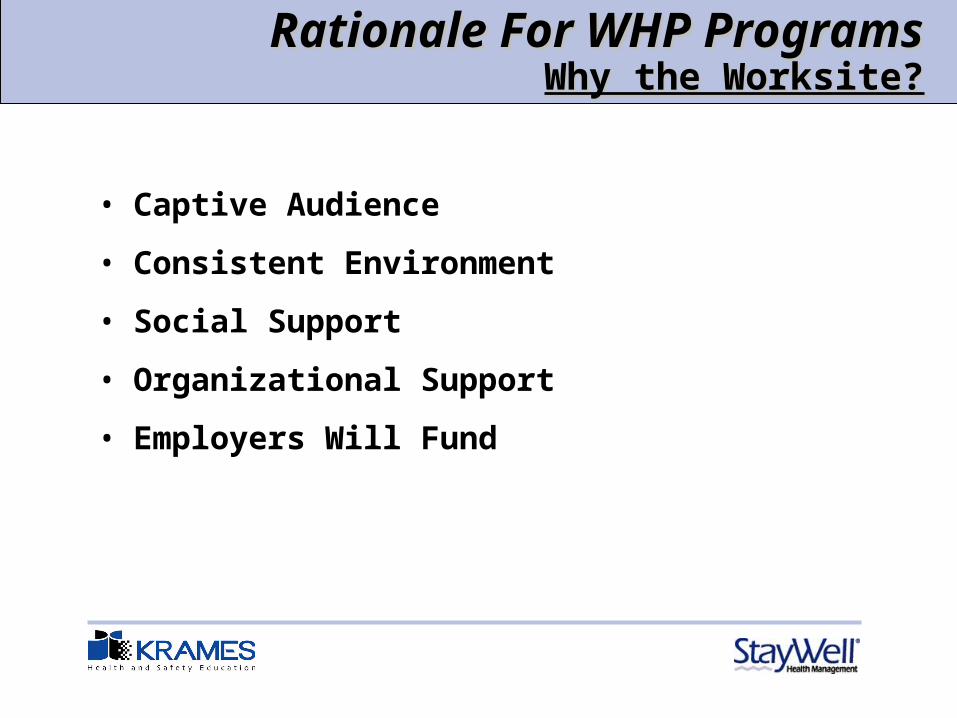
Rationale For WHP ProgramsRationale For WHP ProgramsWhy the Worksite?Why the Worksite?
• Captive Audience
• Consistent Environment
• Social Support
• Organizational Support
• Employers Will Fund

Rationale For WHP ProgramsRationale For WHP ProgramsWhat’s the Goal?What’s the Goal?
• It’s Good for Business
• Employee Job Satisfaction
• Recruitment & Retention
• Enhance Competitiveness
• Decrease Absenteeism
• Decrease Workers Comp & Disability
• Manage Healthcare Costs

Published Research on Published Research on Worksite Health PromotionWorksite Health Promotion

Published Research on WHPPublished Research on WHPWhat the Research SaysWhat the Research Says
1. High Risk Employees Cost More– Higher Costs– Less Productive
2. WHP Programs Have an Impact
– Health Risks– Medical Claims– Absenteeism– Disability
3. Comprehensive Programs Have Positive ROI

Published Research: Published Research: High Risk Employees Cost MoreHigh Risk Employees Cost More
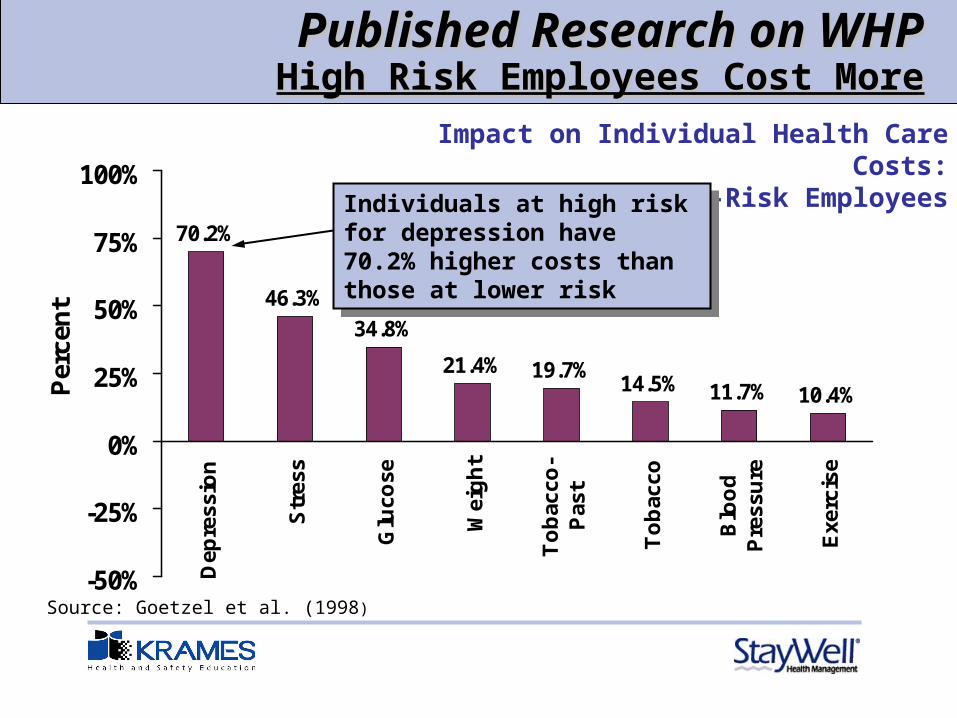
Published Research on WHPPublished Research on WHPHigh Risk Employees Cost MoreHigh Risk Employees Cost More
Impact on Individual Health Care Costs:High versus Lower-Risk Employees
70.2%
46.3%
34.8%
21.4% 19.7%14.5% 11.7% 10.4%
-50%
-25%
0%
25%
50%
75%
100%D
epre
ssio
n
Str
ess
Glu
cose
Wei
gh
t
To
bac
co-
Pas
t
To
bac
co
Blo
od
Pre
ssu
re
Exe
rcis
e
Per
cen
t
Individuals at high risk for depression have 70.2% higher costs than those at lower risk
Individuals at high risk for depression have 70.2% higher costs than those at lower risk
Source: Goetzel et al. (1998)

Published Research on WHPPublished Research on WHPHigh Risks Impact Organizational Health Care Costs High Risks Impact Organizational Health Care Costs
7.9%
5.6%
4.1%3.3%
2.5%1.7% 1.5%
0.5%
0%
2%
4%
6%
8%
10%S
tres
s
To
bac
co-
Pas
t
Wei
gh
t
Exe
rcis
e
To
bac
co
Glu
cose
Dep
ress
ion
Blo
od
Pre
ssu
rePerc
en
t o
f E
xp
en
dit
ure
s
• High stress generates 7.9% of annual medical expenditures
• $428 per employee annually (1996 dollars)
• 24.9% of health care costs
• High stress generates 7.9% of annual medical expenditures
• $428 per employee annually (1996 dollars)
• 24.9% of health care costs
Annual Impact of High Risks on Organizational Health Care Costs
Source: Anderson et al. (2000)
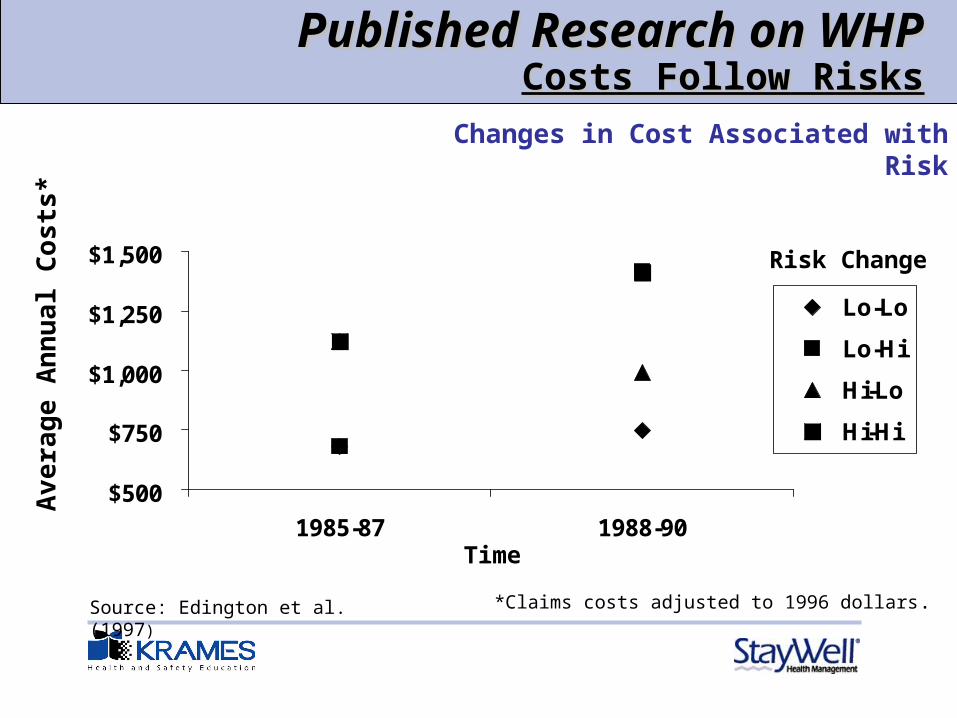
Published Research on WHPPublished Research on WHPCosts Follow RisksCosts Follow Risks
$500
$750
$1,000
$1,250
$1,500
1985-87 1988-90
Lo-Lo
Lo-Hi
Hi-Lo
Hi-Hi
*Claims costs adjusted to 1996 dollars.
Risk Change
Changes in Cost Associated with Risk
Source: Edington et al. (1997)
Av
era
ge
An
nu
al C
ost
s*
Time

Published Research on WHPPublished Research on WHPHigh Risk Employees are Less ProductiveHigh Risk Employees are Less Productive
89%
60%67%
79%
0%
20%
40%
60%
80%
100%
Overall Digestive Mental Hlth Musc/skel
% NotProductive% Productive
Worker Productivity Index
Source: Burton et al. (1999)
Pro
du
cti
vit
y L
eve
lP
rod
uc
tiv
ity
Lev
el
Published Research: Published Research: WHP Programs Have an ImpactWHP Programs Have an Impact
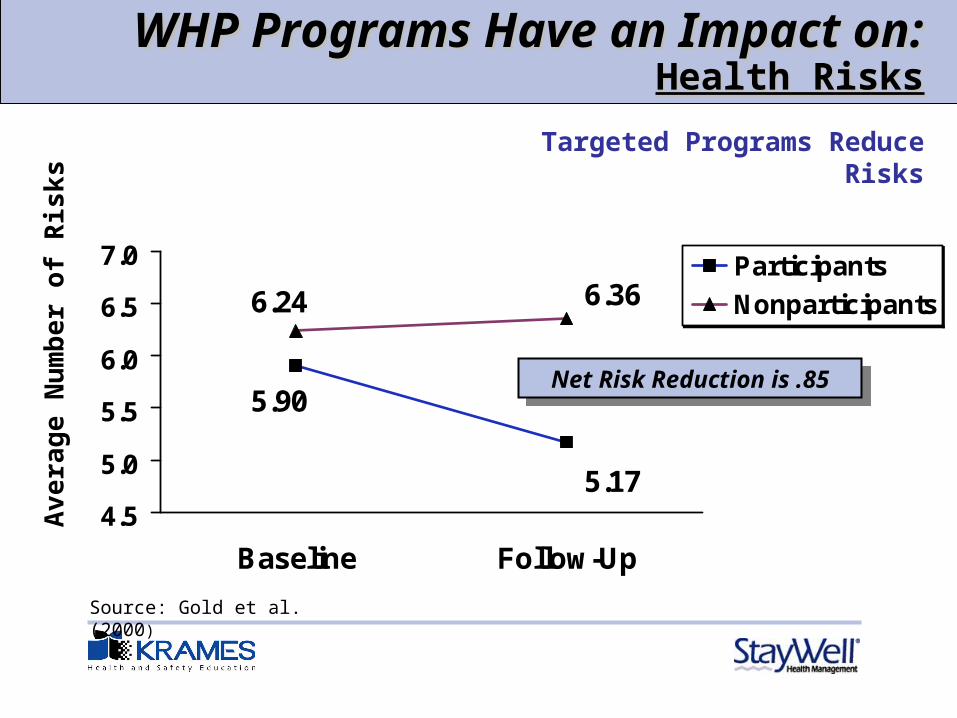
WHP Programs Have an Impact on:WHP Programs Have an Impact on:Health RisksHealth Risks
5.17
5.90
6.366.24
4.5
5.0
5.5
6.0
6.5
7.0
Baseline Follow-Up
Participants
Nonparticipants
Targeted Programs Reduce Risks
Net Risk Reduction is .85Net Risk Reduction is .85
Source: Gold et al. (2000)
Av
era
ge
Nu
mb
er
of
Ris
ks
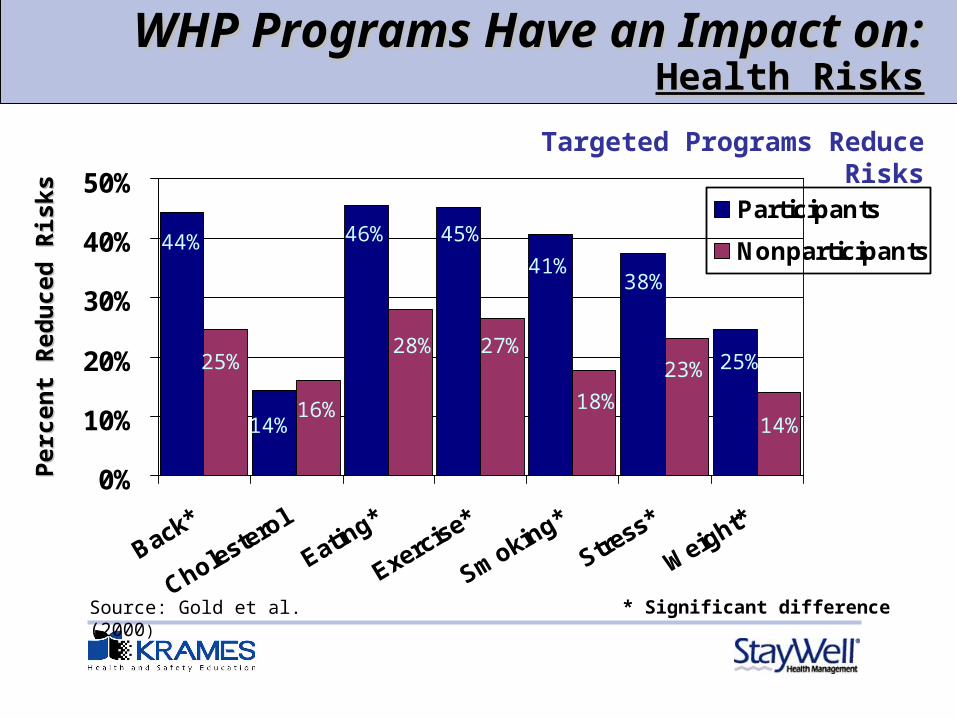
WHP Programs Have an Impact on:WHP Programs Have an Impact on:Health RisksHealth Risks
0%
10%
20%
30%
40%
50%
Back*
Cholesterol
Eating*
Exercise*
Smoking*
Stress*
Weight*
Participants
Nonparticipants
* Significant difference
Targeted Programs Reduce Risks
Per
cen
t R
edu
ced
Ris
ksP
erce
nt
Red
uce
d R
isks 44%
25%
14%16%
46%
28%
45%
27%
41%
18%
38%
23% 25%
14%
Source: Gold et al. (2000)

WHP Programs Have an Impact onWHP Programs Have an Impact on::Medical ClaimsMedical Claims
$0
$500
$1,000
$1,500
$2,000
$2,500
$3,000Nonparticipants
Participants
Av
era
ge
Cla
ims
Pa
id
pe
r E
mp
loy
ee
an
d R
eti
ree
Baseline Study Year
Source: Fries et al. (1994)
Nonparticipants’ expenses increased 27.7% more than participants.
Possible Savings = $437/person
Nonparticipants’ expenses increased 27.7% more than participants.
Possible Savings = $437/person

WHP Programs Have an Impact on:WHP Programs Have an Impact on:AbsenteeismAbsenteeism
2.582.502.06
2.87
4.324.05
0.00
1.00
2.00
3.00
4.00
5.00
1984 1985* 1986*
Participants
Nonparticipants
* Significant difference
Intervention
Source: Wood et al. (1989)
Me
an
Day
s A
bs
en
tM
ea
n D
ays
Ab
se
nt

WHP Programs Have an Impact on:WHP Programs Have an Impact on:Short-Term DisabilityShort-Term Disability
33.2
36.738.1
24.7
29.427.8
20.0
25.0
30.0
35.0
40.0
45.0 Nonparticipants
HRA/Reimbursement
Short-Term Disability Savings versus Non-Participants
Av
era
ge
ST
D D
ays
Lo
st
* Significant difference
1996 Baseline1996 Baseline 1997*1997* 1998*1998*
Estimated Difference = $1350 per participant
Estimated Difference = $1350 per participant
Source: Serxner et al. (2001)
Intervention
Published Research: Published Research: Comprehensive Programs Have Comprehensive Programs Have
Positive ROIPositive ROI

Comprehensive Programs Have Comprehensive Programs Have Positive ROIPositive ROI
HealthPromotion
Short-Term Long-Term
$3-$83-5 Years
$2-$51st Year
DemandManagement

Comprehensive Programs Have Comprehensive Programs Have Positive ROIPositive ROI
$0
$2
$4
$6
$8
$10
Health CareCosts
Absenteeism Combined
$3.35$3.35
$4.87$4.87
$8.22$8.22
Source: Aldana (1998)
Savings per Dollar Invested

Bottom Line: Bottom Line: “What the Research Tells Us”“What the Research Tells Us”

• Behaviorally staged
• Focus on maintenance and reinforcement
• Program beyond risk or disease specific
• Tailored to health and safety risk
• Incentives for participation
Bottom LineBottom LinePrinciples of Effective Program DesignPrinciples of Effective Program Design
Source: Serxner (in press)

• Repeated contacts
• Varied formats
• Personalization
• Low cost & portable
• Easy to administer
• Emphasis on health and productivity
Bottom LineBottom LinePrinciples of Effective Program DesignPrinciples of Effective Program Design
Source: Serxner (in press)

• Multiple distribution channels
• Built in program evaluation
• Long-term orientation
• Integrated with Safety, Occupational Health, EAP, and Training
• Visible management support
Bottom LineBottom LinePrinciples of Effective Program DesignPrinciples of Effective Program Design
Source: Serxner (in press)
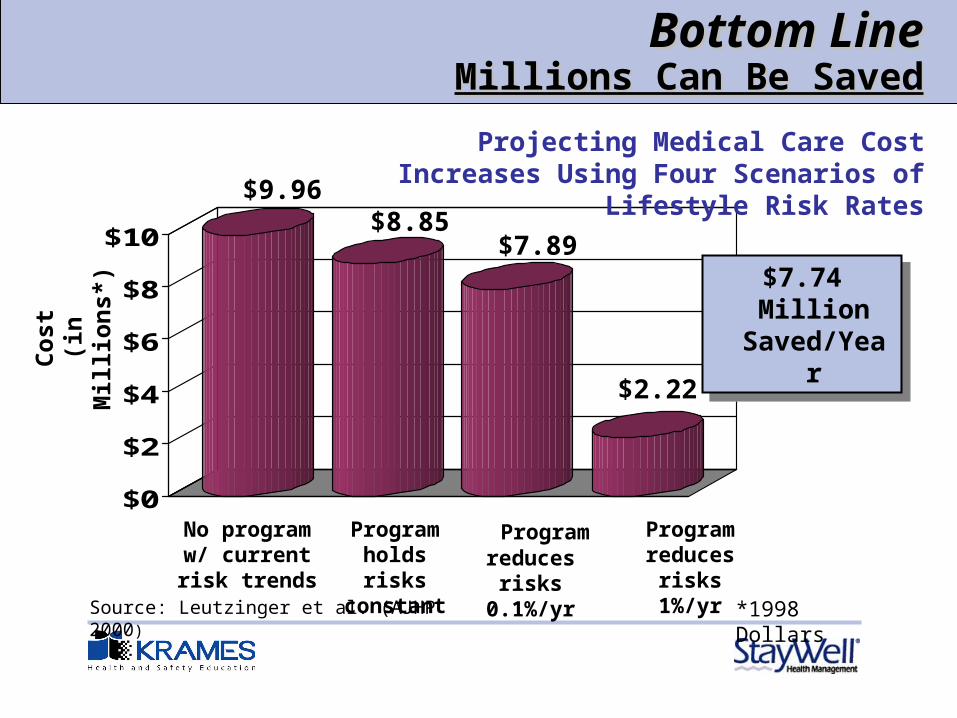
Bottom LineBottom LineMillions Can Be SavedMillions Can Be Saved
$0
$2
$4
$6
$8
$10
Projecting Medical Care Cost Increases Using Four Scenarios of Lifestyle Risk Rates
Source: Leutzinger et al. (AJHP 2000) *1998 Dollars
Program holds risks
constant
Program reduces
risks 0.1%/yr
Program reduces
risks 1%/yr
No program w/ current risk
trends
Co
st(i
n M
illi
on
s*)
$9.96$8.85
$7.89
$2.22
$7.74 Million Saved/Year
$7.74 Million Saved/Year
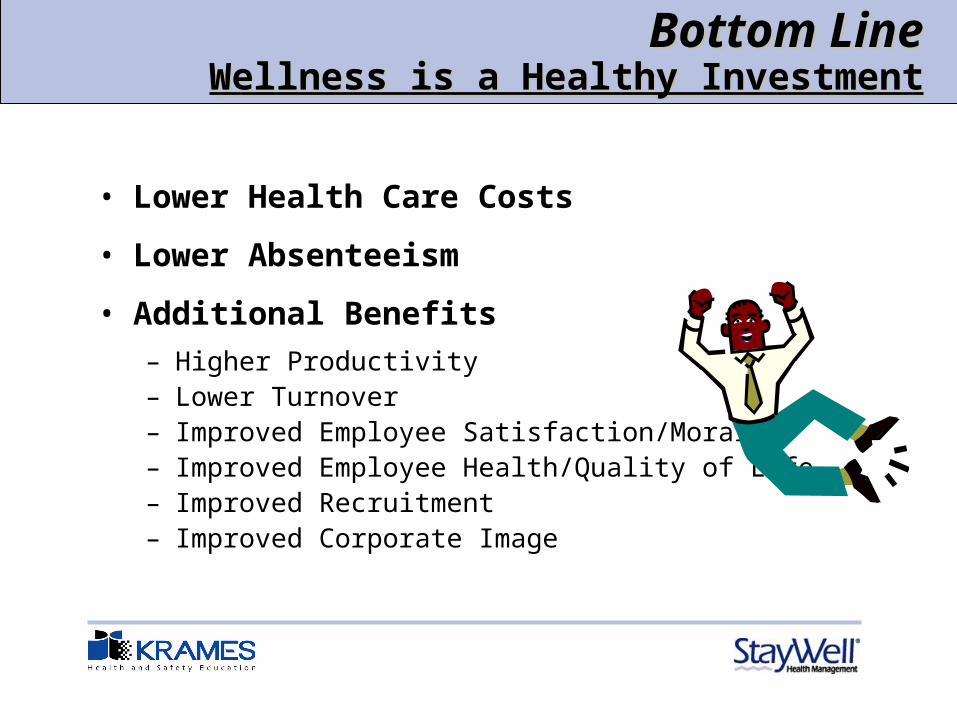
• Lower Health Care Costs
• Lower Absenteeism
• Additional Benefits
– Higher Productivity– Lower Turnover– Improved Employee Satisfaction/Morale– Improved Employee Health/Quality of Life– Improved Recruitment– Improved Corporate Image
Bottom LineBottom LineWellness is a Healthy InvestmentWellness is a Healthy Investment
Aldana SG. Financial impact of worksite health promotion and methodological quality of the evidence. Art of Health Promotion 1998; 2(1):1-8.
Anderson DR, Whitmer RW, Goetzel RZ, Ozminkowski RJ, Wasserman J, Serxner SA. The relationship between modifiable health risks and group-level health care expenditures. American Journal of Health Promotion 2000; September/October: 45-52.
Burton WN, Conti DJ, Chen CY, Schultz AB, Edington DW. The role of health risk factors and disease on worker productivity. Journal of Occupational and Environmental Medicine 1999; 41(10): 863-877.
Edington DW, Yen LT, Witting P. The financial impact of changes in personal health practices. Journal of Occupational and Environmental Medicine 1997; 39(11): 1037-1047.
Fries JF, Harrington H, Edwards R, Kent LA, Richardson N. Randomized Controlled Trial of Cost Reductions from a Health Education Program: The California Public Employees’ Retirement System (PERS) Study. American Journal of Health Promotion 1994; 8(3): 216-223.
Goetzel RZ, Juday TR, Ozminkowski RJ. A systematic review of return-on-investment studies of corporate health and productivity management initiatives. AWHP’s Worksite Health 1999 (Summer); 12-21.
Gold DB, Anderson DA, Serxner, S. Impact of a telephone-based intervention on the reduction of health risks. American Journal of Health Promotion 2000; Nov/Dec: 97-106.
ReferencesReferences

Leutzinger JA, Ozminkowski RJ, Dunn RL, Goetzel RZ, Richling DE, Stewart M, Whitmer RW. Projecting future medical care cots using four scenarios of lifestyle risk rates. American Journal of Health Promotion 2000; 15(1): 35-44.
Ozminkowski RJ, Dunn RL, Goetzel RZ, Canior RI, Murnane J, Harrison M. A return on investment evaluation of the Citibank, N.A., health management program. American Journal of Health Promotion 1999; 14: 31-43.
Pelletier KR. A review and analysis of the clinical and cost-effectiveness studies of comprehensive health promotion and disease management programs at the worksite: 1995-1998 update (IV). American Journal of Health Promotion 1999; 13:333-345.
Serxner SA. Practical Considerations for Design and Evaluation of Health Promotion Programs in the Workplace. Disease Management and Health Outcomes (in press).
Serxner SA, Gold DB, Anderson DR, & Williams, D. The impact of a worksite health promotion program on short-term disability usage. Journal of Occupational and Environmental Medicine 2001; 43(1): 25-29.
US Department of Health and Human Services (1980) Ten leading causes of death in the United States. Atlanta: Center for Disease Control, July.
Wood EA, Olmstead GW, Craig JL. An evaluation of lifestyle risk factors and absenteeism after two years in a worksite health promotion programs. American Journal of Health Promotion 1989; 4(2): 128-113.
ReferencesReferences