creating value in mining - itmg.co.id · (usd/ton) 3q12 576 31% 133 120 $87.5 fy11 2,382 37% 707...
TRANSCRIPT
Analyst Briefing
FY12 performance results
4 March 2013

2
The views expressed here contain information derived from publicly available sources that have not been independently verified. No representation or warranty is made as to the accuracy, completeness or reliability of the information. Any forward looking information in this presentation has been prepared on the basis of a number of assumptions which may prove to be incorrect. This presentation should not be relied upon as a recommendation or forecast by PT. Indo Tambangraya Megah Tbk. Nothing in this release should be construed as either an offer to buy or sell or a solicitation of an offer to buy or sell shares in any jurisdiction
3
Appendices
Financial review
Commercial review
Operational review
Introduction
3
4
2
1

4
Highlights of 4Q12 and FY12 results
4Q12
658
24%
105
65
$80.6
Q-Q
+14%
-7%
-21%
-45%
-8%
Unit: US$ Mn
Coal sales 8.2 Mt
Up 1.6 Mt
+24% Q-Q
FY12
2,439
30%
558
432
$90.0
y-y
+2%
-7%
-21%
-21%
-7%
Coal sales 27.2 Mt
Up 2.5 Mt
+10% y-y
Total Revenue
Gross Profit Margin
EBIT
Net income
ASP* (USD/ton)
3Q12
576
31%
133
120
$87.5
FY11
2,382
37%
707
546
$97.1
* Includes bonus /penalty
5
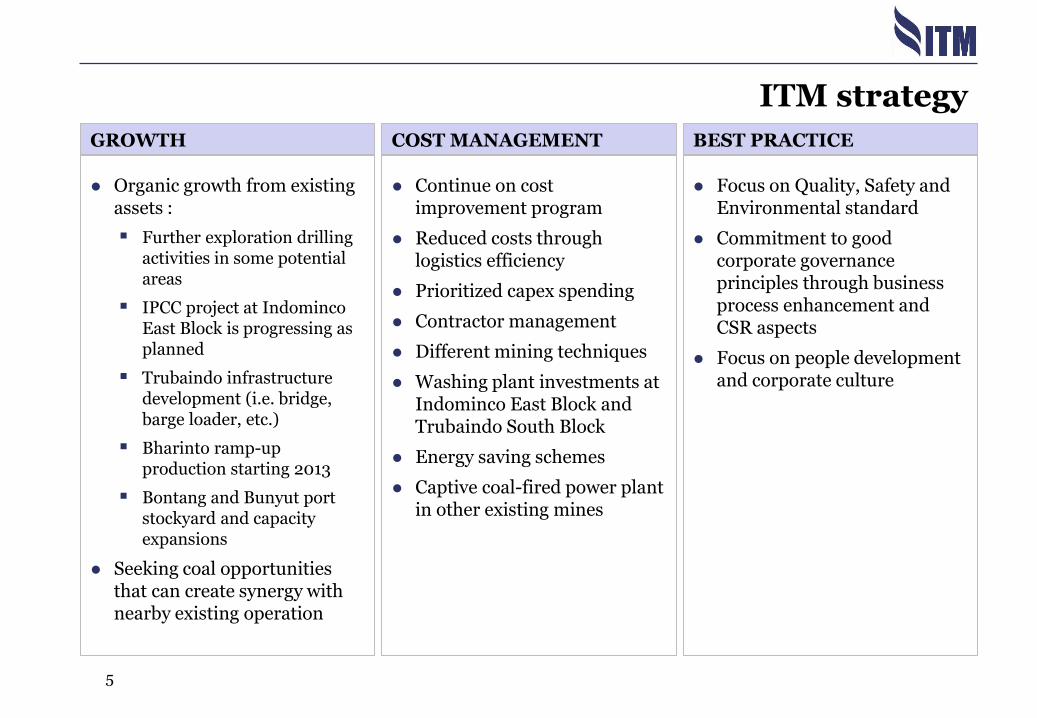
BEST PRACTICE GROWTH COST MANAGEMENT
Organic growth from existing assets :
Further exploration drilling activities in some potential areas
IPCC project at Indominco East Block is progressing as planned
Trubaindo infrastructure development (i.e. bridge, barge loader, etc.)
Bharinto ramp-up production starting 2013
Bontang and Bunyut port stockyard and capacity expansions
Seeking coal opportunities that can create synergy with nearby existing operation
Focus on Quality, Safety and Environmental standard
Commitment to good corporate governance principles through business process enhancement and CSR aspects
Focus on people development and corporate culture
Continue on cost improvement program
Reduced costs through logistics efficiency
Prioritized capex spending
Contractor management
Different mining techniques
Washing plant investments at Indominco East Block and Trubaindo South Block
Energy saving schemes
Captive coal-fired power plant in other existing mines
ITM strategy

2012 review : strengthening the core
• Indominco: Lowered SR to 12.0x from 12.6x in FY11
• Continued process on port loading capacity expansion
• Completed IPCC feasibility study as part of cost reduction program
• Capex postponement and rationalization
• Obtained gold medal award at Indonesia Fire Rescue Challenge (IFRC)
• Td. Mayang: passed TPM3 Excellence Award level 4
INDOMINCO – TD. MAYANG
• Trubaindo: ramped up production from 7.1 mt to 7.7 mt
• Shortened distance to dump area
• Capex postponement and rationalization
• Bharinto: first coal sales in 3Q12
• Completed Bharinto hauling road
TRUBAINDO - BHARINTO
• Embalut: optimized mining reserves
• Jorong: finalized mine closure master plan
EMBALUT - JORONG
• Overhead cost reduction
• Maintain dividend payout ratio
JAKARTA OFFICE
6
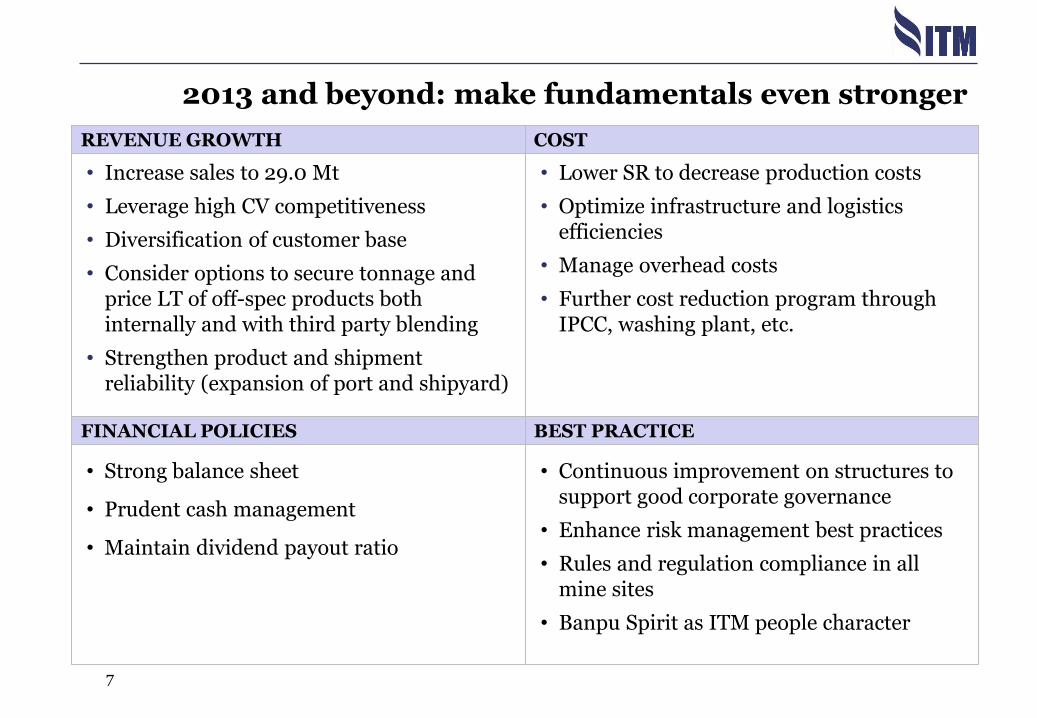
2013 and beyond: make fundamentals even stronger
• Lower SR to decrease production costs
• Optimize infrastructure and logistics efficiencies
• Manage overhead costs
• Further cost reduction program through IPCC, washing plant, etc.
• Increase sales to 29.0 Mt
• Leverage high CV competitiveness
• Diversification of customer base
• Consider options to secure tonnage and price LT of off-spec products both internally and with third party blending
• Strengthen product and shipment reliability (expansion of port and shipyard)
• Continuous improvement on structures to support good corporate governance
• Enhance risk management best practices
• Rules and regulation compliance in all mine sites
• Banpu Spirit as ITM people character
• Strong balance sheet
• Prudent cash management
• Maintain dividend payout ratio
7
COST REVENUE GROWTH
BEST PRACTICE FINANCIAL POLICIES

2012 vs 2013 operation summary
4Q11 1Q12 2Q12 3Q12 4Q12 1Q13
Units: Mt
7.2
5.7
Indominco
Trubaindo
Bharinto
Kitadin
Jorong
INDICATIVE OUTPUT TARGETS*
4Q11 1Q12 2Q12 3Q12 4Q12
0
5
10
15
20
25
30
35
2012 2013e 2014e 2015e 2016e
Units: Mt
Indominco
Trubaindo
Bharinto
Kitadin Jorong
* Not including inorganic growth. Note: These output targets are indicative only and are subject to change
6.8 7.0 8.0
East Kalimantan
Balikpapan
Palangkaraya
Banjarmasin
Central Kalimantan
South Kalimantan
Samarinda
Trubaindo
Bharinto
Jorong
Embalut
Indominco
Td.Mayang
1Q13e
6.7
QUARTERLY OUTPUT FY12 OUTPUT: 27.5Mt FY13 TARGET: 29.0Mt
2012 2013e
14.8 14.8
2012 2013e
7.7 7.7
2012 2013e
0.3 1.9
2012 2013e
1.2 1.2 1.2
2012 2013e
1.3 1.0
2012 2013e
2.2 2.4
8

9
Appendices
Financial review
Commercial review
Operational review
Introduction
3
4
2
1
10
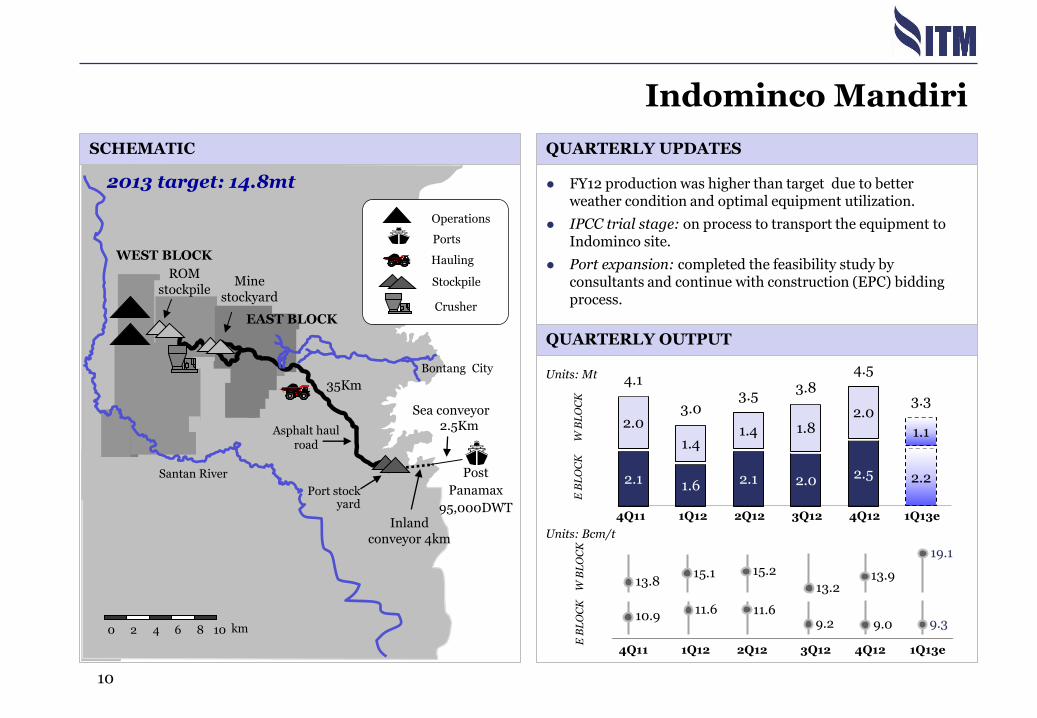
FY12 production was higher than target due to better weather condition and optimal equipment utilization.
IPCC trial stage: on process to transport the equipment to Indominco site.
Port expansion: completed the feasibility study by consultants and continue with construction (EPC) bidding process.
QUARTERLY UPDATES
Indominco Mandiri
SCHEMATIC
EAST BLOCK
Santan River Port stock
yard
Bontang City
Asphalt haul road
2.5Km
35Km
Sea conveyor
Mine stockyard
Inland conveyor 4km
0 10 6 8 2 km 4
WEST BLOCK
Operations
Stockpile
Ports
Hauling
Crusher
ROM stockpile
Post
Panamax
95,000DWT
2013 target: 14.8mt
E B
LO
CK
W
BL
OC
K
E B
LO
CK
W
BL
OC
K
2.1 1.6 2.1 2.0 2.5 2.2
2.0
1.4 1.4 1.8
2.0
1.1
4.1
3.0 3.5
3.8
4.5
3.3
Units: Mt
Units: Bcm/t
4Q11 1Q12 2Q12 3Q12 4Q12 1Q13e
10.9
13.8
11.6
15.1 15.2
11.6
13.2
9.2
4Q11 1Q12 2Q12 3Q12 4Q12 1Q13e
13.9
9.0
19.1
9.3
QUARTERLY OUTPUT
11
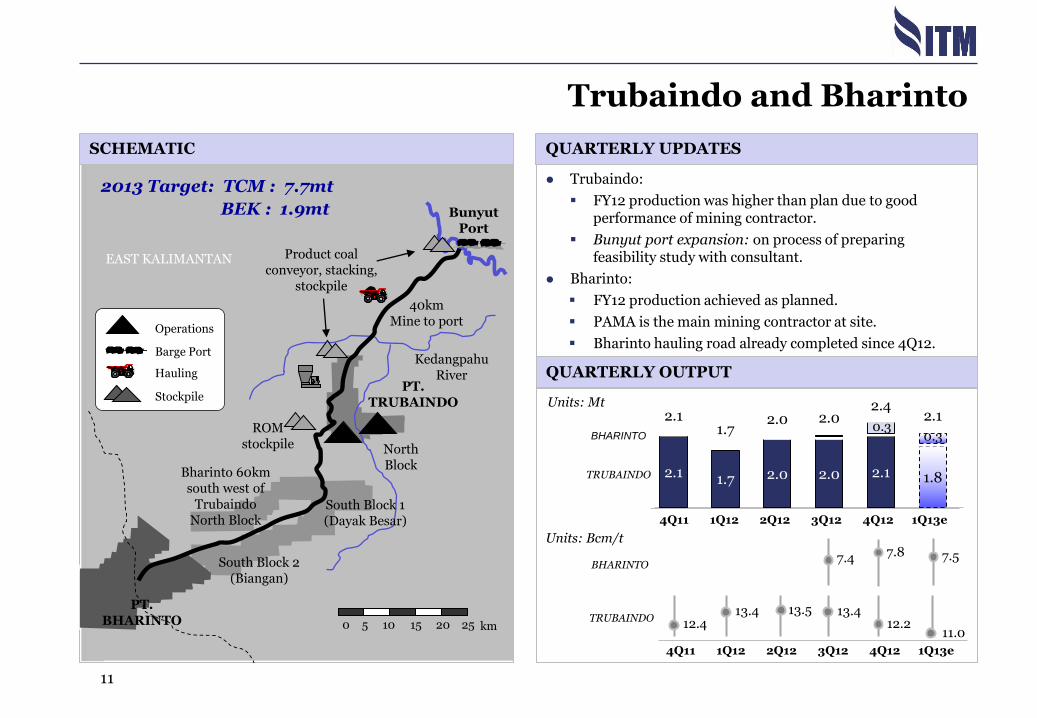
Trubaindo:
FY12 production was higher than plan due to good performance of mining contractor.
Bunyut port expansion: on process of preparing feasibility study with consultant.
Bharinto:
FY12 production achieved as planned.
PAMA is the main mining contractor at site.
Bharinto hauling road already completed since 4Q12.
QUARTERLY UPDATES
Trubaindo and Bharinto
SCHEMATIC
QUARTERLY OUTPUT
Mahakam River
South Block 1 (Dayak Besar)
North Block
40km Mine to port
Kedangpahu River
ROM stockpile
Bunyut Port
0 10 25 15 20 5 km
Product coal conveyor, stacking,
stockpile
EAST KALIMANTAN
Bharinto 60km south west of
Trubaindo North Block
South Block 2 (Biangan)
PT. BHARINTO
PT. TRUBAINDO
Operations
Stockpile
Hauling
Barge Port
2013 Target: TCM : 7.7mt
BEK : 1.9mt
2.1 1.7 2.0 2.0 2.1 1.8
2.1 1.7
2.0 2.0 2.4
2.1
TRUBAINDO 12.4 13.4 13.5
TRUBAINDO
BHARINTO
13.4
Units: Mt
Units: Bcm/t
12.2
BHARINTO 7.4 7.8
4Q11 1Q12 2Q12 3Q12 4Q12 1Q13e
0.3
4Q11 1Q12 2Q12 3Q12 4Q12 1Q13e
11.0
7.5
0.3
12
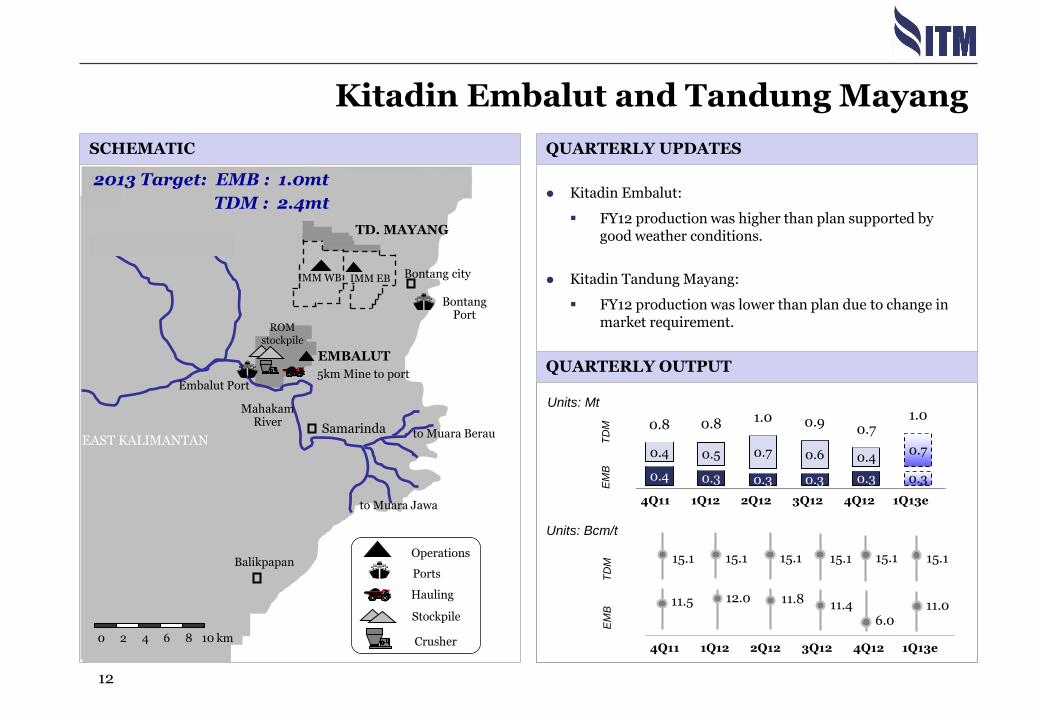
Kitadin Embalut:
FY12 production was higher than plan supported by good weather conditions.
Kitadin Tandung Mayang:
FY12 production was lower than plan due to change in market requirement.
QUARTERLY UPDATES
Kitadin Embalut and Tandung Mayang
SCHEMATIC
QUARTERLY OUTPUT
0.4 0.3 0.3 0.3 0.3 0.3
0.4 0.5 0.7 0.6 0.4 0.7
0.8 0.8 1.0 0.9 0.7
1.0
Balikpapan
Mahakam River
Samarinda to Muara Berau
Bontang city
EMBALUT
Embalut Port
to Muara Jawa
ROM stockpile
Operations
Stockpile
Ports
Hauling
Crusher 0 10 6 8 2 km 4
5km Mine to port
TD. MAYANG
EAST KALIMANTAN
IMM EB IMM WB
Bontang Port
TDM : 2.4mt
11.5 12.0 11.8 T
DM
E
MB
E
MB
T
DM
15.1 15.1 15.1
11.4
15.1
Units: Mt
Units: Bcm/t
6.0
15.1
4Q11 1Q12 2Q12 3Q12 4Q12 1Q13e
4Q11 1Q12 2Q12 3Q12 4Q12 1Q13e
11.0
15.1
2013 Target: EMB : 1.0mt
Coal terminal
Jorong
Pelaihari
Pacific Ocean
Haul road
0 10 25 15 20 5 km
20km
Operations
Stockpile
Hauling
Barge Port
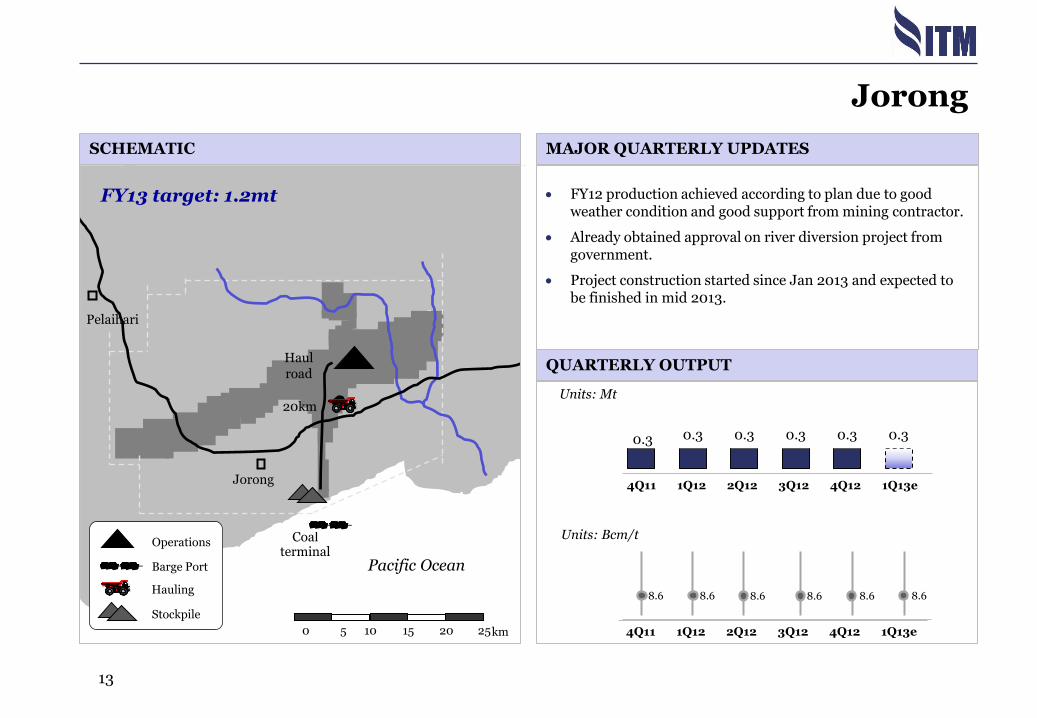
FY13 target: 1.2mt
MAJOR QUARTERLY UPDATES
13
Jorong
FY12 production achieved according to plan due to good weather condition and good support from mining contractor.
Already obtained approval on river diversion project from government.
Project construction started since Jan 2013 and expected to be finished in mid 2013.
SCHEMATIC
QUARTERLY OUTPUT
8.6 8.6 8.6 8.6 8.6 8.6
Units: Mt
Units: Bcm/t
4Q11 1Q12 2Q12 3Q12 4Q12 1Q13e
4Q11 1Q12 2Q12 3Q12 4Q12 1Q13e
0.3 0.3 0.3 0.3 0.3 0.3
14
Appendices
Financial review
Commercial review
Operational review
Introduction
3
4
2
1
15
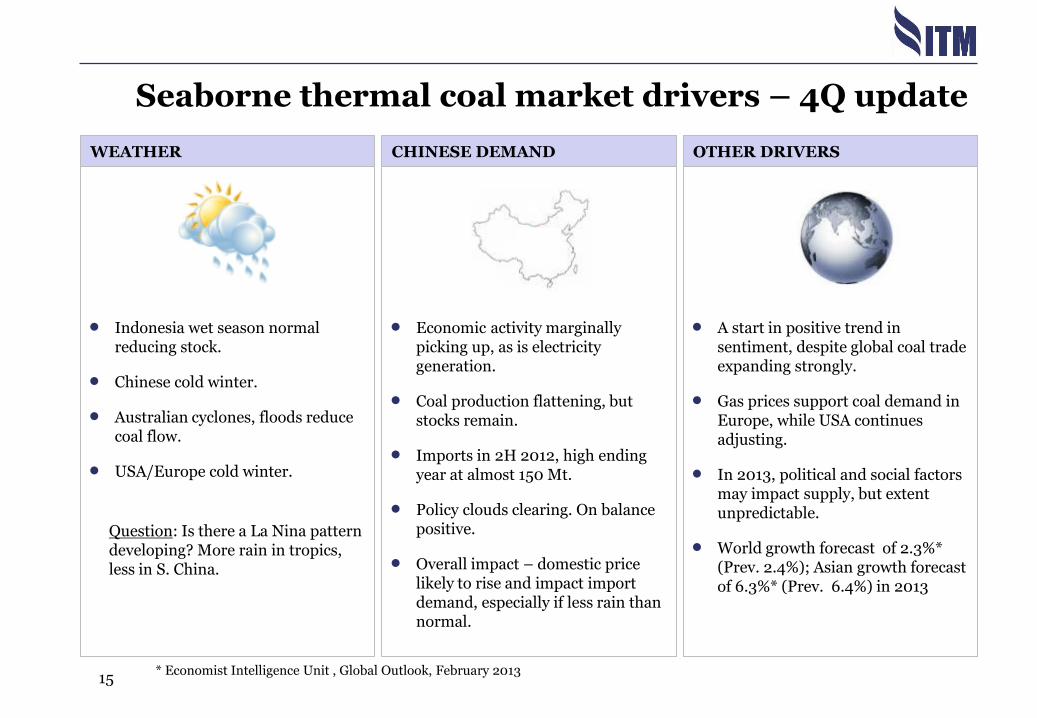
OTHER DRIVERS WEATHER CHINESE DEMAND
Indonesia wet season normal reducing stock.
Chinese cold winter.
Australian cyclones, floods reduce coal flow.
USA/Europe cold winter.
Question: Is there a La Nina pattern developing? More rain in tropics, less in S. China.
A start in positive trend in sentiment, despite global coal trade expanding strongly.
Gas prices support coal demand in Europe, while USA continues adjusting.
In 2013, political and social factors may impact supply, but extent unpredictable.
World growth forecast of 2.3%* (Prev. 2.4%); Asian growth forecast of 6.3%* (Prev. 6.4%) in 2013
Economic activity marginally picking up, as is electricity generation.
Coal production flattening, but stocks remain.
Imports in 2H 2012, high ending year at almost 150 Mt.
Policy clouds clearing. On balance positive.
Overall impact – domestic price likely to rise and impact import demand, especially if less rain than normal.
Seaborne thermal coal market drivers – 4Q update
* Economist Intelligence Unit , Global Outlook, February 2013
16
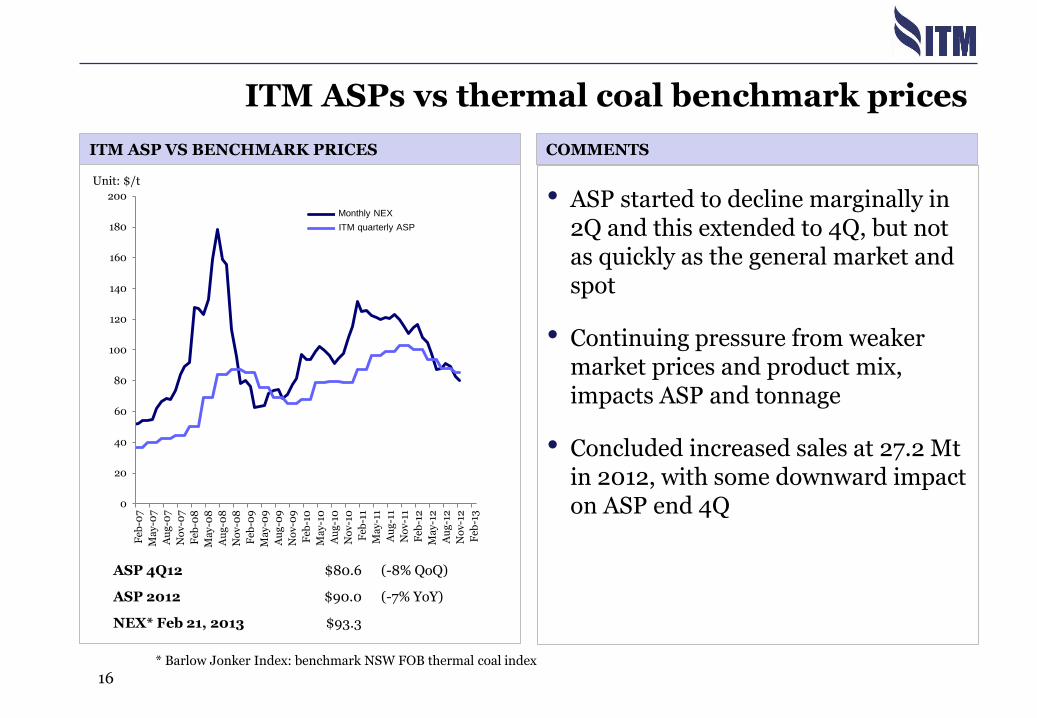
ITM ASPs vs thermal coal benchmark prices
ITM ASP VS BENCHMARK PRICES
* Barlow Jonker Index: benchmark NSW FOB thermal coal index
ASP 4Q12 $80.6 (-8% QoQ)
ASP 2012 $90.0 (-7% YoY)
NEX* Feb 21, 2013 $93.3
Unit: $/t
COMMENTS
0
20
40
60
80
100
120
140
160
180
200
Feb
-07
Ma
y-0
7
Au
g-0
7
No
v-0
7
Feb
-08
Ma
y-0
8
Au
g-0
8
No
v-0
8
Feb
-09
Ma
y-0
9
Au
g-0
9
No
v-0
9
Feb
-10
Ma
y-1
0
Au
g-1
0
No
v-1
0
Feb
-11
Ma
y-1
1
Au
g-1
1
No
v-1
1
Feb
-12
Ma
y-1
2
Au
g-1
2
No
v-1
2
Feb
-13
Monthly BJI
Quarterly Banpu Indonesia ASP
• ASP started to decline marginally in 2Q and this extended to 4Q, but not as quickly as the general market and spot
• Continuing pressure from weaker market prices and product mix, impacts ASP and tonnage
• Concluded increased sales at 27.2 Mt in 2012, with some downward impact on ASP end 4Q
Monthly NEX
ITM quarterly ASP
17
655
620
530
400
500
600
700
800
900
1,000
Feb
-11
Ma
y-1
1
Au
g-1
1
No
v-1
1
Feb
-12
Ma
y-1
2
Au
g-1
2
No
v-1
2
Feb
-13
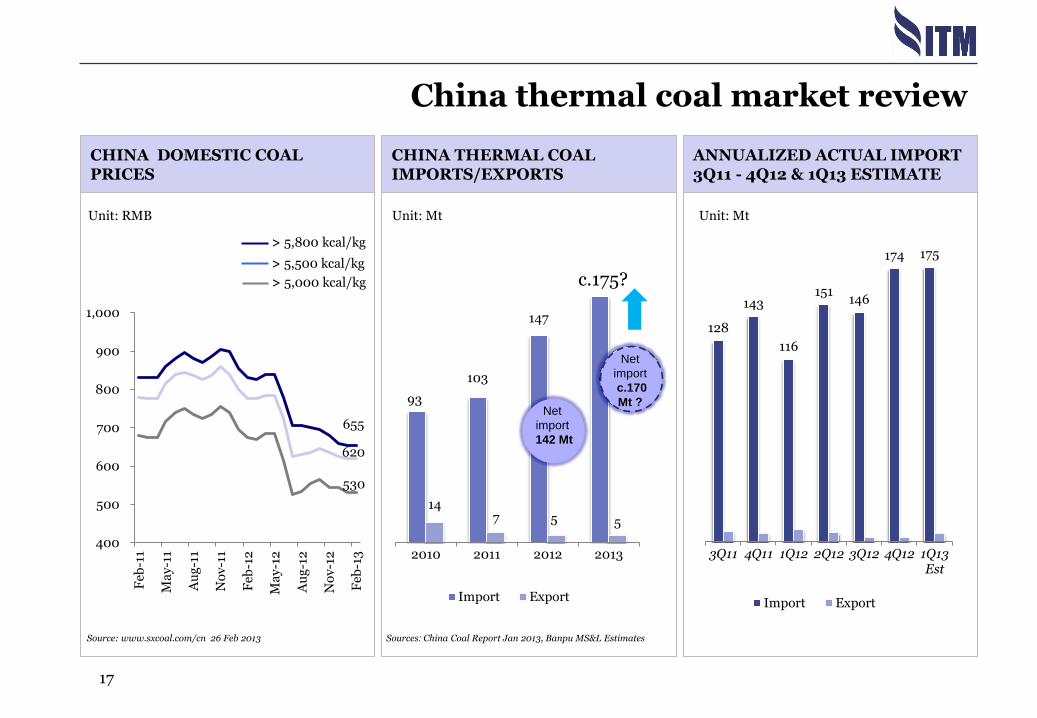
ANNUALIZED ACTUAL IMPORT 3Q11 - 4Q12 & 1Q13 ESTIMATE
CHINA DOMESTIC COAL PRICES
CHINA THERMAL COAL IMPORTS/EXPORTS
China thermal coal market review
Source: www.sxcoal.com/cn 26 Feb 2013
Unit: RMB
> 5,800 kcal/kg
> 5,500 kcal/kg
> 5,000 kcal/kg
Sources: China Coal Report Jan 2013, Banpu MS&L Estimates
Unit: Mt Unit: Mt
93
103
147
14 7 5 5
2010 2011 2012 2013
Import Export
Net
import
142 Mt
Net
import
c.170
Mt ?
c.175?
128
143
116
151 146
174 175
3Q11 4Q11 1Q12 2Q12 3Q12 4Q12 1Q13Est
Import Export

COAL SALES 2012
18
ITM coal sales 2012
COAL SALES BREAKDOWN BY DESTINATION
JAPAN 4.5 Mt
PHILIPPINES 1.6 Mt
THAILAND 1.8 Mt
INDIA 3.3 Mt
HK 0.6 Mt
S KOREA 1.5 Mt CHINA
7.1 Mt
TAIWAN 2.3 Mt
ITALY 1.4 Mt
1.5
INDONESIA 2.5 Mt
MALAYSIA 0.4 Mt
OTHERS 0.1 Mt
26%
16%
12%
9%
8%
7%
6%
6%
5% 2% 2%
Total Coal Sales: 27.2 Mt
Japan
China
Taiwan
S Korea
Italy
Thailand
Philippines
Hong Kong
India
Indonesia
Malaysia Others 1%

44%
24%
9%
23%
19
Indicative coal sales 2013
COAL SALES CONTRACT AND PRICING STAUTS
Contract Status Price Status
Fixed
Index
Unpriced
Unsold
TARGET SALES 2013: 29.0 Mt
77%
23%
Contracted
Uncontracted

20
Appendices
Financial review
Commercial review
Operational review
Introduction
3
4
2
1
21
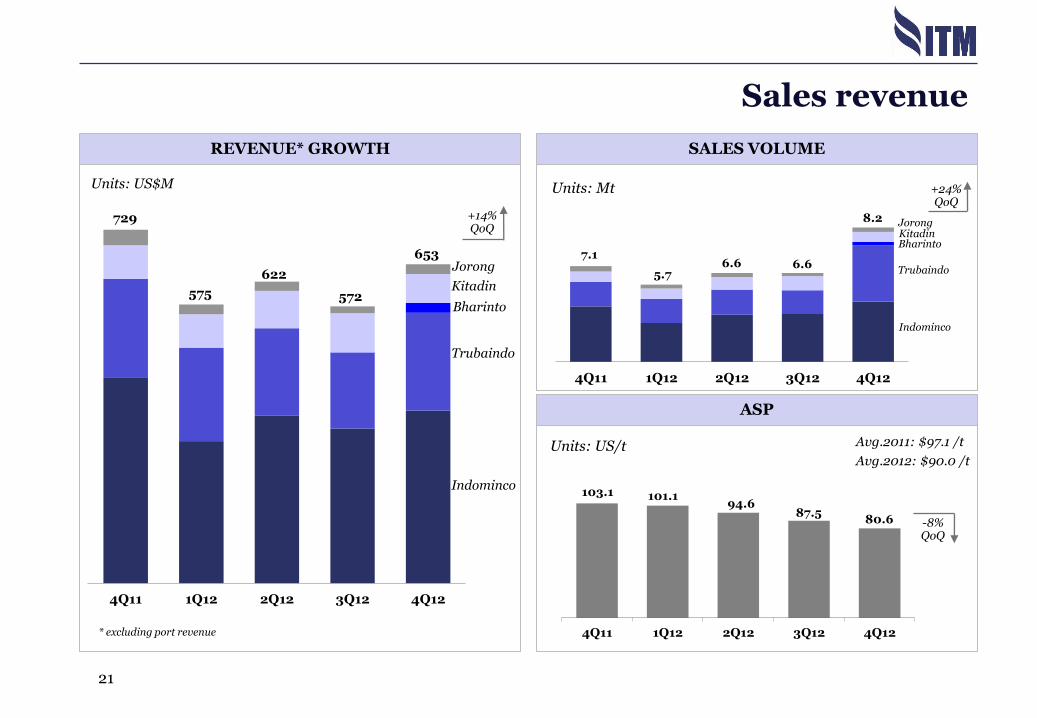
SALES VOLUME
Sales revenue
REVENUE* GROWTH
ASP
4Q11 1Q12 2Q12 3Q12 4Q12
Units: US$M
+14% QoQ
Indominco
Trubaindo
Jorong
Kitadin
Bharinto
4Q11 1Q12 2Q12 3Q12 4Q12
Units: Mt
Indominco
Trubaindo
Jorong Kitadin Bharinto
+24% QoQ
Units: US/t
4Q11 1Q12 2Q12 3Q12 4Q12
-8% QoQ
* excluding port revenue
729
575
622
572
653
103.1 101.1 94.6
87.5 80.6
7.1
5.7 6.6 6.6
8.2
Avg.2011: $97.1 /t
Avg.2012: $90.0 /t

22
Average gross margin
Revenue
GPM* (%)
Units: US$M
Indominco Trubaindo Kitadin Jorong
28% 19%
4Q11
512
28%
242
39%
93
46%
38
390
22%
3Q12
188
28%
103
35% 17
16%
Bharinto
19%
427
19%
4Q12
242
19%
72
31%
24
19%
24
0 2
ITM Consolidated
4Q11 3Q12
733
39%
4Q12
576
31%
658
24%
4Q11 3Q12 4Q12 4Q11 3Q12 4Q12 4Q11 3Q12 4Q12 4Q11 3Q12 4Q12
17% 23%
23
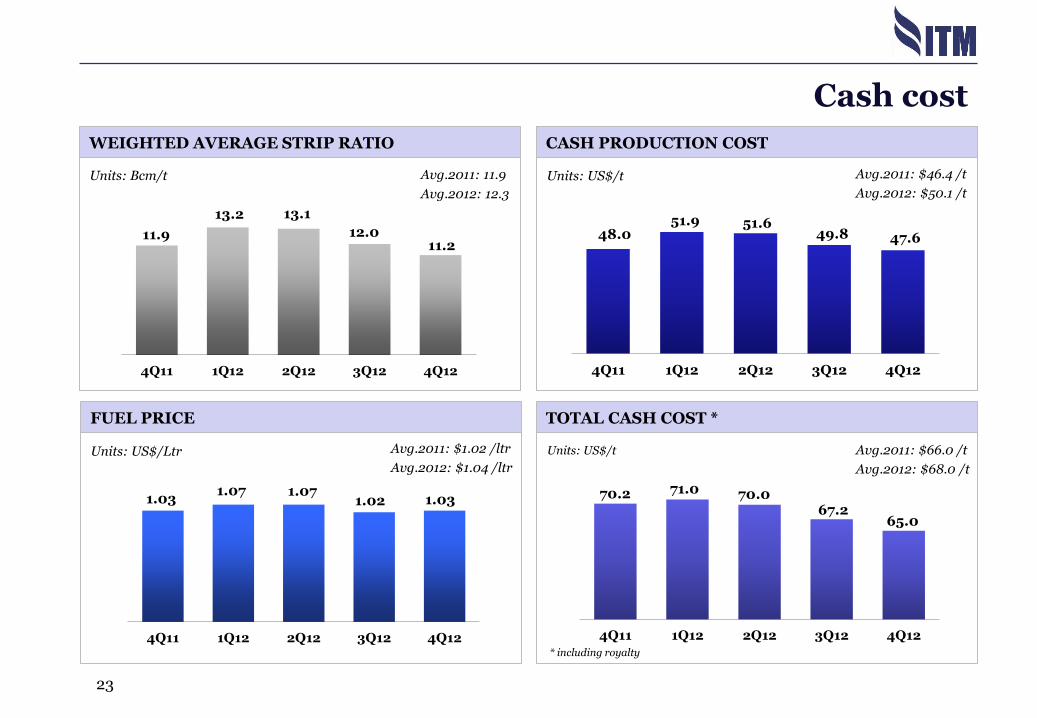
Cash cost
4Q11 1Q12 2Q12 3Q12 4Q12
Units: US$/t
* including royalty
4Q11 1Q12 2Q12 3Q12 4Q12
Units: US$/Ltr
4Q11 1Q12 2Q12 3Q12 4Q12
Units: Bcm/t
4Q11 1Q12 2Q12 3Q12 4Q12
Units: US$/t
WEIGHTED AVERAGE STRIP RATIO CASH PRODUCTION COST
TOTAL CASH COST *
FUEL PRICE
48.0 51.9
11.9
13.2
1.03 1.07 70.2 71.0
13.1
1.07
51.6
70.0 1.02
12.0 49.8
67.2
11.2
1.03
47.6
65.0
Avg.2011: 11.9
Avg.2012: 12.3
Avg.2011: $1.02 /ltr
Avg.2012: $1.04 /ltr
Avg.2011: $46.4 /t
Avg.2012: $50.1 /t
Avg.2011: $66.0 /t
Avg.2012: $68.0 /t

24
EBITDA CONSOLIDATED
*COGS = Prod cost + Transport cost + Inv. movement
Units: US$M
Revenue 3Q12 4Q11 4Q12
148.5
COGS Selling Royalty Admin
120.6 (16.3)
+82.1
-19% QoQ
(10.5)
Higher Volume by 24% Lower ASP by 8%
(83.6)
234.6
+0.4
MINE BY MINE
Units: US$M
125.6
65.5
44.3
75.8
36.6 37.3
71.6
23.1 27.9
0.8 (0.2) 0.5
Indominco Trubaindo 4Q11
Kitadin Jorong 3Q12 4Q12
Bharinto
3.7 2.0 3.5
4Q11 3Q12 4Q12 4Q11 3Q12 4Q12 4Q11 3Q12 4Q12 4Q11 3Q12 4Q12
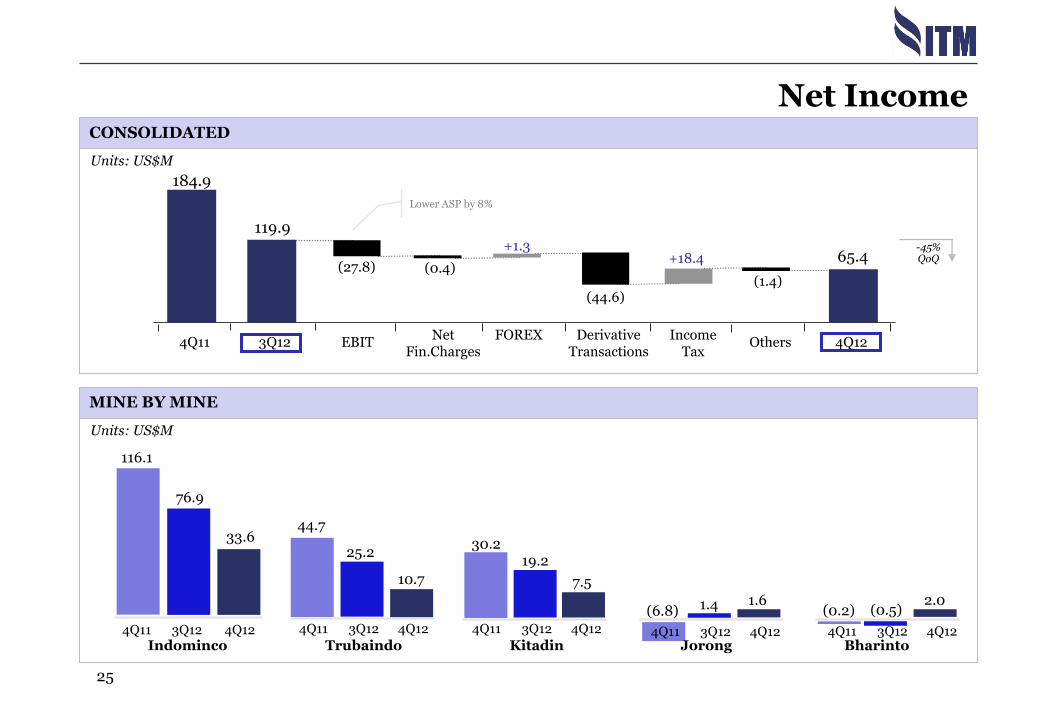
116.1
30.2
44.7
25.2 19.2
1.4
33.6
10.7 7.5
1.6
76.9
(6.8) (0.5) 2.0
(0.2)
25
Net Income CONSOLIDATED
184.9
65.4 -45% QoQ
119.9
(27.8) (1.4)
Lower ASP by 8%
Units: US$M
MINE BY MINE
Units: US$M
3Q12 4Q12 Others EBIT Income
Tax Derivative
Transactions FOREX Net
Fin.Charges 4Q11
Indominco Trubaindo Kitadin Jorong Bharinto
(0.4)
+1.3
(44.6)
+18.4
4Q11 3Q12 4Q12 4Q11 3Q12 4Q12 4Q11 3Q12 4Q12 4Q11 3Q12 4Q12 4Q11 3Q12 4Q12

26
CASH POSITION
Net Market Gearing (%)
Net D/E (times)
(0.34)
(34%)
(0.47)
(44%)
(0.57)
(57%)
(0.41)
(41%)
2008 2009 2011 2010 2012
(0.46)
(46%)
Balance sheet
KEY RATIOS
DEBT POSITION
Units: US$M
2008
222
2009
429
2011
612
295
2010 2012
461
Units: US$M
2008
11 55
2009
0
2011
0
2010
0
2012
27
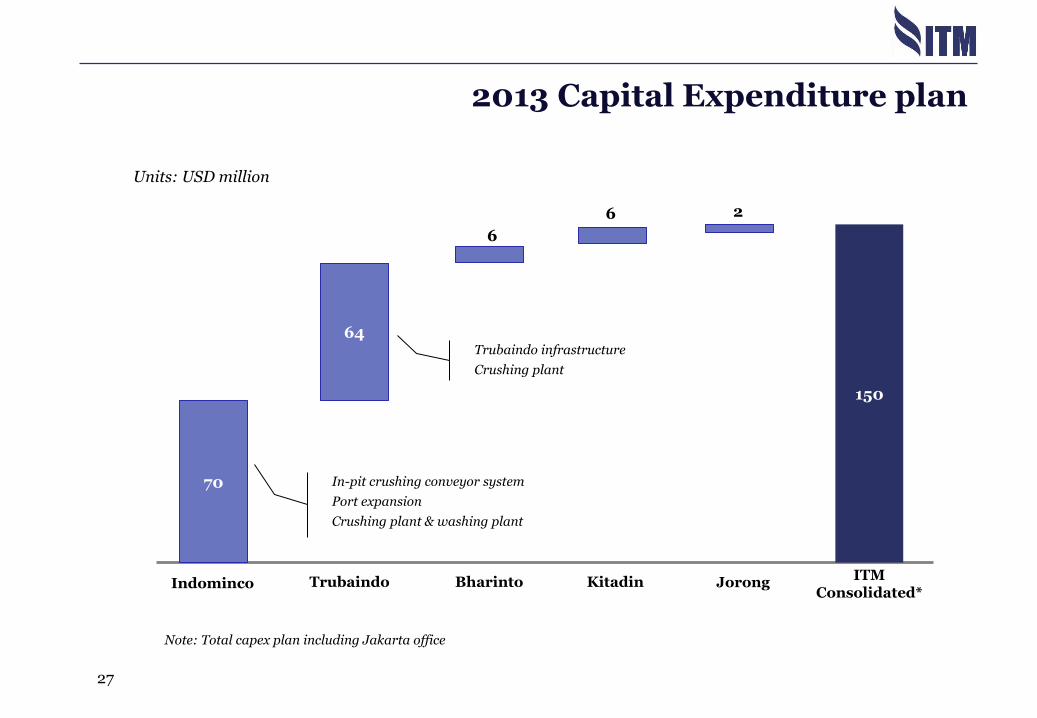
2013 Capital Expenditure plan
Note: Total capex plan including Jakarta office
Units: USD million
Indominco Trubaindo Bharinto Kitadin Jorong ITM
Consolidated*
150
64
70
2
In-pit crushing conveyor system
Port expansion
Crushing plant & washing plant
Trubaindo infrastructure
Crushing plant
6
6

28
Appendices
29
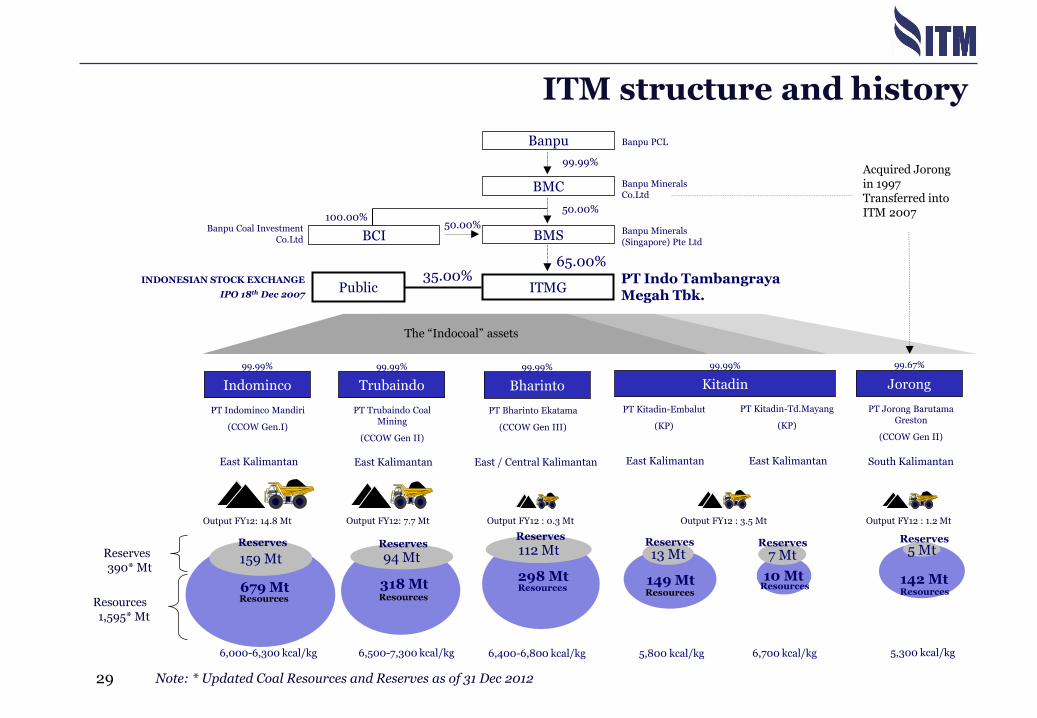
ITM structure and history
Note: * Updated Coal Resources and Reserves as of 31 Dec 2012
ITMG
65.00%
Indominco Trubaindo Jorong
PT Indominco Mandiri
(CCOW Gen.I)
PT Trubaindo Coal Mining
(CCOW Gen II)
PT Kitadin-Embalut
(KP)
PT Jorong Barutama Greston
(CCOW Gen II)
50.00%
PT Indo Tambangraya Megah Tbk.
Banpu Minerals (Singapore) Pte Ltd
99.99% 99.99% 99.99% 99.67%
Banpu Minerals Co.Ltd
Reserves 390* Mt
Resources 1,595* Mt
BMS
99.99%
BMC
Banpu PCL Banpu
Public 35.00%
Kitadin
PT Kitadin-Td.Mayang
(KP)
BCI 50.00%
100.00% Banpu Coal Investment
Co.Ltd
East Kalimantan East Kalimantan South Kalimantan East Kalimantan
INDONESIAN STOCK EXCHANGE
IPO 18th Dec 2007
6,500-7,300 kcal/kg 6,000-6,300 kcal/kg 5,800 kcal/kg 6,700 kcal/kg 5,300 kcal/kg
Acquired Jorong in 1997 Transferred into ITM 2007
Output FY12: 14.8 Mt Output FY12: 7.7 Mt Output FY12 : 3.5 Mt Output FY12 : 1.2 Mt
Bharinto
PT Bharinto Ekatama
(CCOW Gen III)
99.99%
East / Central Kalimantan
6,400-6,800 kcal/kg
Output FY12 : 0.3 Mt
The “Indocoal” assets
East Kalimantan
159 Mt
679 Mt Resources
Reserves
94 Mt
318 Mt Resources
Reserves 13 Mt
149 Mt Resources
Reserves 112 Mt
298 Mt Resources
Reserves
5 Mt
142 Mt Resources
Reserves
7 Mt
10 Mt Resources
Reserves
30
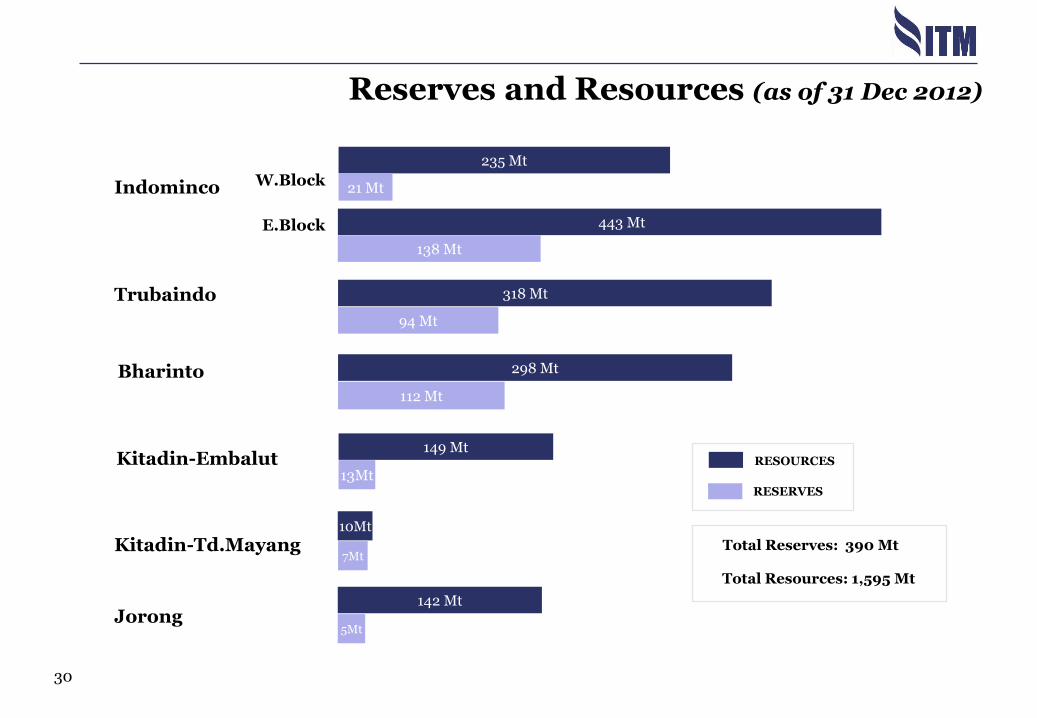
Reserves and Resources (as of 31 Dec 2012)
Indominco
Trubaindo
Kitadin-Td.Mayang
Jorong
W.Block
E.Block
235 Mt
21 Mt
443 Mt
149 Mt
13Mt
142 Mt
5Mt
318 Mt
94 Mt
298 Mt
112 Mt
10Mt
RESOURCES
RESERVES
Kitadin-Embalut
Total Reserves: 390 Mt
Total Resources: 1,595 Mt
138 Mt
7Mt
Bharinto
31
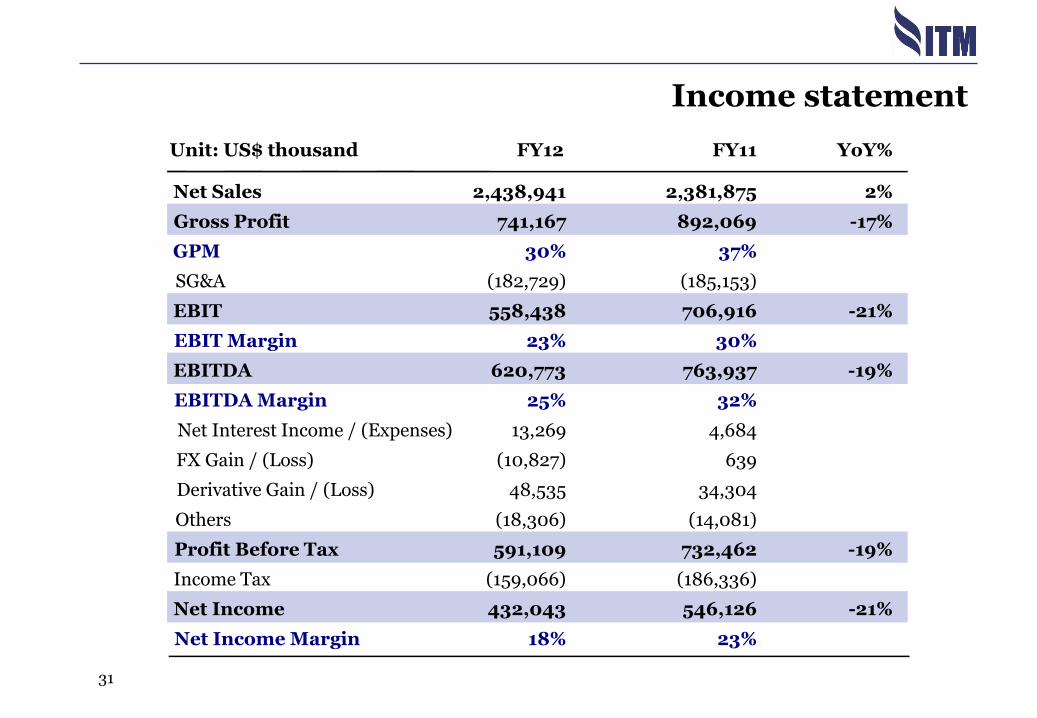
Income statement
Unit: US$ thousand FY12 FY11 YoY%
Net Sales 2,438,941 2,381,875 2%
Gross Profit 741,167 892,069 -17%
GPM 30% 37%
SG&A (182,729) (185,153)
EBIT 558,438 706,916 -21%
EBIT Margin 23% 30%
EBITDA 620,773 763,937 -19%
EBITDA Margin 25% 32%
Net Interest Income / (Expenses) 13,269 4,684
FX Gain / (Loss) (10,827) 639
Derivative Gain / (Loss) 48,535 34,304
Others (18,306) (14,081)
Profit Before Tax 591,109 732,462 -19%
Income Tax (159,066) (186,336)
Net Income 432,043 546,126 -21%
Net Income Margin 18% 23%
32
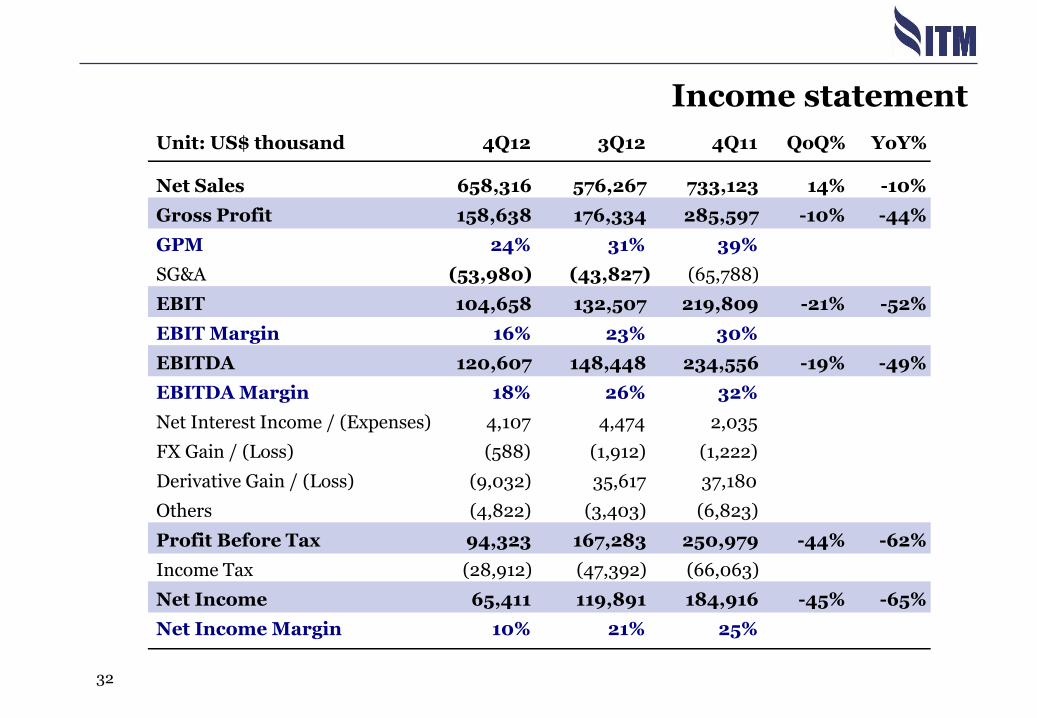
Unit: US$ thousand 4Q12 3Q12 4Q11 QoQ% YoY%
Net Sales 658,316 576,267 733,123 14% -10%
Gross Profit 158,638 176,334 285,597 -10% -44%
GPM 24% 31% 39%
SG&A (53,980) (43,827) (65,788)
EBIT 104,658 132,507 219,809 -21% -52%
EBIT Margin 16% 23% 30%
EBITDA 120,607 148,448 234,556 -19% -49%
EBITDA Margin 18% 26% 32%
Net Interest Income / (Expenses) 4,107 4,474 2,035
FX Gain / (Loss) (588) (1,912) (1,222)
Derivative Gain / (Loss) (9,032) 35,617 37,180
Others (4,822) (3,403) (6,823)
Profit Before Tax 94,323 167,283 250,979 -44% -62%
Income Tax (28,912) (47,392) (66,063)
Net Income 65,411 119,891 184,916 -45% -65%
Net Income Margin 10% 21% 25%
Income statement

33
2012 operating cost
2012 AVERAGE OPERATING COSTS
0
10
20
30
40
50
60
70
80
1Q12 2Q12 3Q12 4Q12 FULL YEAR
Mining and contractor cost
* Coal transportations, repair and maintenance, salaries and allowance, etc.
$74 $72
$69 $70
$/t
$67
Other production costs*
Depreciation & Amortization
SG&A expenses
Royalty

34
SALES VOLUME
Sales revenue
REVENUE* GROWTH
ASP
2008 2009 2010 2011 20122008 2009 2010
Units: US$M
2011
* excluding port revenue
2012
1,291
1,494
1,635
+2% YoY
2,370 2,422
Indominco
Trubaindo
Jorong
Kitadin
Bharinto
2008 2009 2010 2011 2012
Units: Mt
Indominco
Trubaindo
Jorong
Kitadin Bharinto
17.7
21.0 22.2
24.7
27.2 +10% YoY
2008 2009 2010 2011 2012
Units: US/t
2008 2009 2010 2011 2012
73.9
-7% YoY
71.5 74.9
97.1 90.0
2008 2009 2010 2011 2012