credit suisse financial services...
TRANSCRIPT

Credit Suisse Financial Services Forum Aleem Gillani, Chief Financial Officer, SunTrust Banks, Inc. February 11, 2015
2
The following should be read in conjunction with the financial statements, notes and other information contained in the Company’s 2013 Annual Report on Form 10-K, Quarterly Reports on Form 10-Q, and Current Reports on Form 8-K. This presentation includes non-GAAP financial measures to describe SunTrust’s performance. The reconciliations of those measures to GAAP measures are provided within or in the appendix of this presentation. In this presentation, the Company presents net interest income and net interest margin on a fully taxable-equivalent (“FTE”) basis, and ratios on an annualized basis. The FTE basis adjusts for the tax-favored status of income from certain loans and investments. The Company believes this measure to be the preferred industry measurement of net interest income and provides relevant comparison between taxable and non-taxable amounts. This presentation contains forward-looking statements. Statements regarding future efficiency improvement are forward-looking statements. Also, any statement that does not describe historical or current facts is a forward-looking statement. These statements often include the words “believes,” “expects,” “anticipates,” “estimates,” “intends,” “plans,” “targets,” “initiatives,” “potentially,” “probably,” “projects,” “outlook,” “opportunity,” or similar expressions or future conditional verbs such as “may,” “will,” “should,” “would,” and “could"; such statements are based upon the current beliefs and expectations of management and on information currently available to management. Such statements speak as of the date hereof, and we do not assume any obligation to update the statements made herein or to update the reasons why actual results could differ from those contained in such statements in light of new information or future events. Forward-looking statements are subject to significant risks and uncertainties. Investors are cautioned against placing undue reliance on such statements. Actual results may differ materially from those set forth in the forward-looking statements. Factors that could cause actual results to differ materially from those described in the forward-looking statements can be found in Part I, “Item 1A. Risk Factors” in our Annual Report on Form 10-K for the year ended December 31, 2013 and in other periodic reports that we file with the SEC. Those factors include: as one of the largest lenders in the Southeast and Mid-Atlantic U.S. and a provider of financial products and services to consumers and businesses across the U.S., our financial results have been, and may continue to be, materially affected by general economic conditions, particularly unemployment levels and home prices in the U.S., and a deterioration of economic conditions or of the financial markets may materially adversely affect our lending and other businesses and our financial results and condition; legislation and regulation, including the Dodd-Frank Act, as well as future legislation and/or regulation, could require us to change certain of our business practices, reduce our revenue, impose additional costs on us, or otherwise adversely affect our business operations and/or competitive position; we are subject to capital adequacy and liquidity guidelines and, if we fail to meet these guidelines, our financial condition would be adversely affected; loss of customer deposits and market illiquidity could increase our funding costs; we rely on the mortgage secondary market and GSEs for some of our liquidity; our framework for managing risks may not be effective in mitigating risk and loss to us; we are subject to credit risk; our ALLL may not be adequate to cover our eventual losses; we may have more credit risk and higher credit losses to the extent that our loans are concentrated by loan type, industry segment, borrower type, or location of the borrower or collateral; we will realize future losses if the proceeds we receive upon liquidation of NPAs are less than the carrying value of such assets; a downgrade in the U.S. government's sovereign credit rating, or in the credit ratings of instruments issued, insured or guaranteed by related institutions, agencies or instrumentalities, could result in risks to us and general economic conditions that we are not able to predict; weakness in the real estate market, including the secondary residential mortgage loan markets, has adversely affected us and may continue to adversely affect us; we are subject to certain risks related to originating and selling mortgages, and may be required to repurchase mortgage loans or indemnify mortgage loan purchasers as a result of breaches of representations and warranties, borrower fraud, or certain breaches of our servicing agreements, and this could harm our liquidity, results of operations, and financial condition; we face certain risks as a servicer of loans, and may be terminated as a servicer or master servicer, be required to repurchase a mortgage loan or reimburse investors for credit losses on a mortgage loan, or incur costs, liabilities, fines and other sanctions if we fail to satisfy our servicing obligations, including our obligations with respect to mortgage loan foreclosure actions; financial difficulties or credit downgrades of mortgage and bond insurers may adversely affect our servicing and investment portfolios; we are subject to risks related to delays in the foreclosure process; we face risks related to recent mortgage settlements; we may continue to suffer increased losses in our loan portfolio despite enhancement of our underwriting policies and practices; our mortgage production and servicing revenue can be volatile; changes in market interest rates or capital markets could adversely affect our revenue and expense, the value of assets and obligations, and the availability and cost of capital and liquidity; changes in interest rates could also reduce the value of our MSRs and mortgages held for sale, reducing our earnings; the fiscal and monetary policies of the federal government and its agencies could have a material adverse effect on our earnings; clients could pursue alternatives to bank deposits, causing us to lose a relatively inexpensive source of funding; consumers may decide not to use banks to complete their financial transactions, which could affect net income; we have businesses other than banking which subject us to a variety of risks; hurricanes and other disasters may adversely affect loan portfolios and operations and increase the cost of doing business; negative public opinion could damage our reputation and adversely impact business and revenues; we rely on other companies to provide key components of our business infrastructure; a failure in or breach of our operational or security systems or infrastructure, or those of our third party vendors and other service providers, including as a result of cyber attacks, could disrupt our businesses, result in the disclosure or misuse of confidential or proprietary information, damage our reputation, increase our costs and cause losses; the soundness of other financial institutions could adversely affect us; we depend on the accuracy and completeness of information about clients and counterparties; competition in the financial services industry is intense and could result in losing business or margin declines; maintaining or increasing market share depends on market acceptance and regulatory approval of new products and services; we might not pay dividends on our common stock; our ability to receive dividends from our subsidiaries could affect our liquidity and ability to pay dividends; disruptions in our ability to access global capital markets may adversely affect our capital resources and liquidity; any reduction in our credit rating could increase the cost of our funding from the capital markets; we have in the past and may in the future pursue acquisitions, which could affect costs and from which we may not be able to realize anticipated benefits; we are subject to certain litigation, and our expenses related to this litigation may adversely affect our results; we may incur fines, penalties and other negative consequences from regulatory violations, possibly even inadvertent or unintentional violations; we depend on the expertise of key personnel, and if these individuals leave or change their roles without effective replacements, operations may suffer; we may not be able to hire or retain additional qualified personnel and recruiting and compensation costs may increase as a result of turnover, both of which may increase costs and reduce profitability and may adversely impact our ability to implement our business strategies; our accounting policies and processes are critical to how we report our financial condition and results of operations, and require management to make estimates about matters that are uncertain; changes in our accounting policies or in accounting standards could materially affect how we report our financial results and condition; our stock price can be volatile; our disclosure controls and procedures may not prevent or detect all errors or acts of fraud; our financial instruments carried at fair value expose us to certain market risks; our revenues derived from our investment securities may be volatile and subject to a variety of risks; and we may enter into transactions with off-balance sheet affiliates or our subsidiaries.
Important Cautionary Statement

3
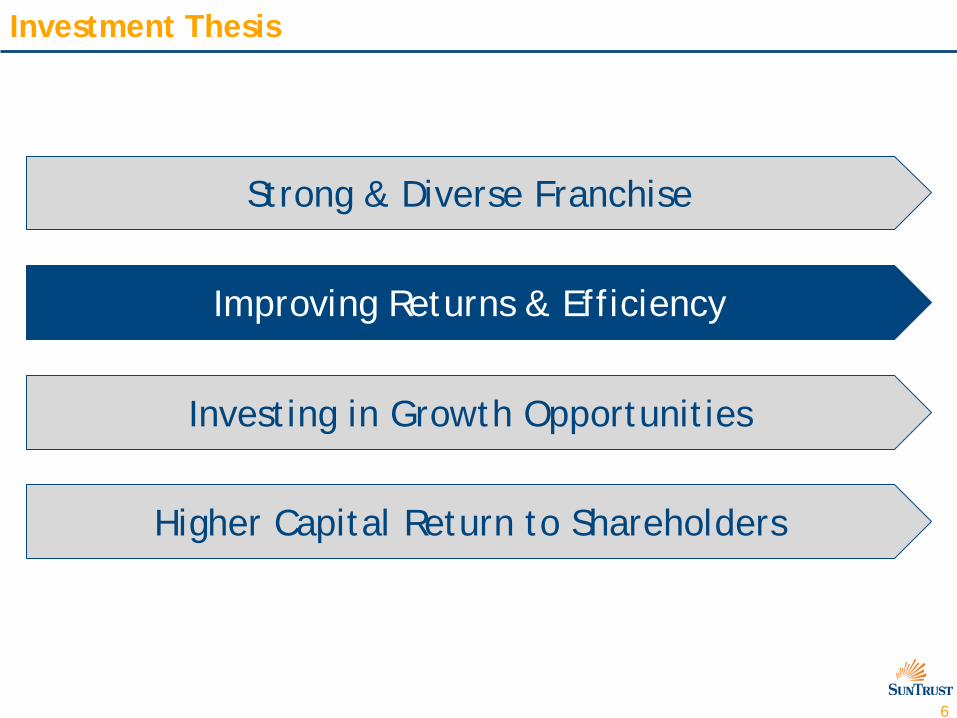
Investment Thesis
Improving Returns & Efficiency
Investing in Growth Opportunities
Strong & Diverse Franchise
Higher Capital Return to Shareholders

4
5.7%
3.1%
STI Peer Median
Franchise Overview
Who is SunTrust? Key Dimensions1 (Rank2)
A leading financial institution focused on meeting clients’ needs and improving their financial well-being
Our organization is differentiated by:
• A “Client First” culture that has generated high loyalty
• Being the right size—large enough to compete with the largest banks while still being nimble
• Leading deposit market shares in high growth and densely populated markets in the Southeast and Mid-Atlantic
• Business diversity—a strong regional bank with key national businesses and full product capabilities
1. As of December 31, 2014 2. Rank amongst U.S. commercial banks, excluding non-traditional commercial banks, as of September 30, 2014 3. Represents full-time equivalent employees 4. Source: SNL Financial, as of June 30, 2014, based on top 10 MSAs (by deposits) for each institution. Numerator is company’s total deposits in its top 10 MSAs and denominator is total deposits in
those 10 MSAs 5. Source: SNL Financial, as of January 31, 2015, based on five-year projected change (2014-2019). Weighted average by deposits in MSAs and counties not in any MSA Note: Peer group includes BBT, CMA, COF, FITB, KEY, MTB, PNC, RF, USB, and WFC
Assets $190 B (10th) Loans $133 B (8th) Deposits $141 B (9th) Branches 1,445 (8th) ATMs 2,187 (10th) Market Capitalization $22.0 B
Clients ~4.6 MM Teammates3 24,638
Attractive Footprint
Deposit Market Share in Respective Top 10 MSAs4
Projected Population Growth of Deposit Footprint5
#1 of 11
13.0%
7.7%
STI Peer Median
#3 of 11
5
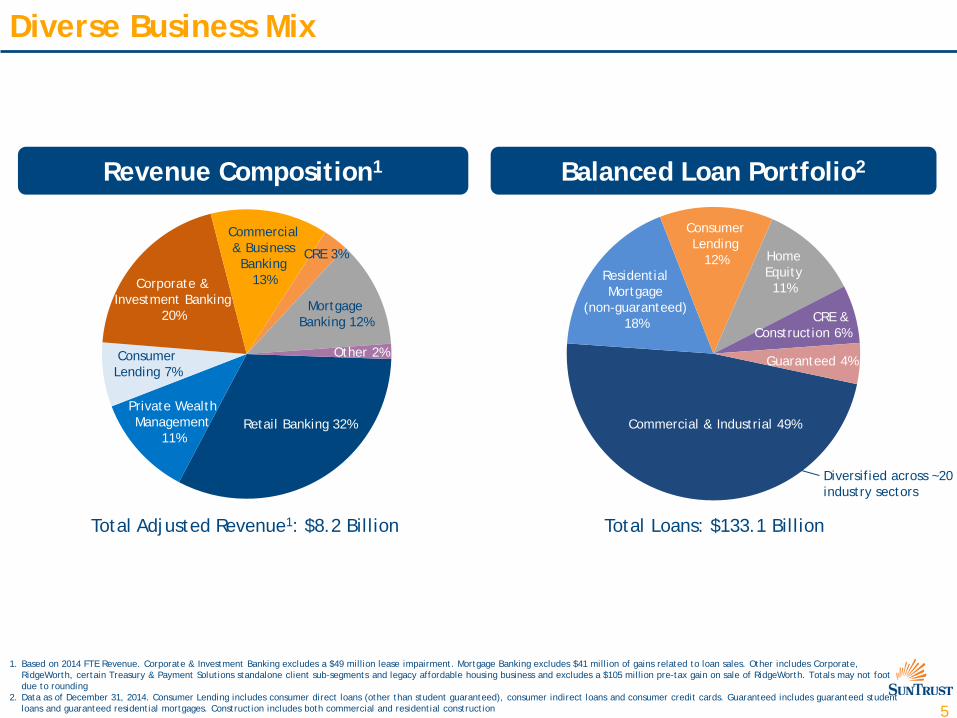
Diverse Business Mix
1. Based on 2014 FTE Revenue. Corporate & Investment Banking excludes a $49 million lease impairment. Mortgage Banking excludes $41 million of gains related to loan sales. Other includes Corporate, RidgeWorth, certain Treasury & Payment Solutions standalone client sub-segments and legacy affordable housing business and excludes a $105 million pre-tax gain on sale of RidgeWorth. Totals may not foot due to rounding
2. Data as of December 31, 2014. Consumer Lending includes consumer direct loans (other than student guaranteed), consumer indirect loans and consumer credit cards. Guaranteed includes guaranteed student loans and guaranteed residential mortgages. Construction includes both commercial and residential construction
Commercial & Industrial 49%
Residential Mortgage
(non-guaranteed) 18%
Consumer Lending
12% Home Equity 11%
Guaranteed 4%
Revenue Composition1 Balanced Loan Portfolio2
CRE & Construction 6%
Total Loans: $133.1 Billion Total Adjusted Revenue1: $8.2 Billion
Commercial & Business
Banking 13%
Private Wealth Management
11%
Consumer Lending 7%
Corporate & Investment Banking
20% Mortgage
Banking 12%
CRE 3%
Other 2%
Diversified across ~20 industry sectors
Retail Banking 32%
6
Investment Thesis
Improving Returns & Efficiency
Investing in Growth Opportunities
Strong & Diverse Franchise
Higher Capital Return to Shareholders
7
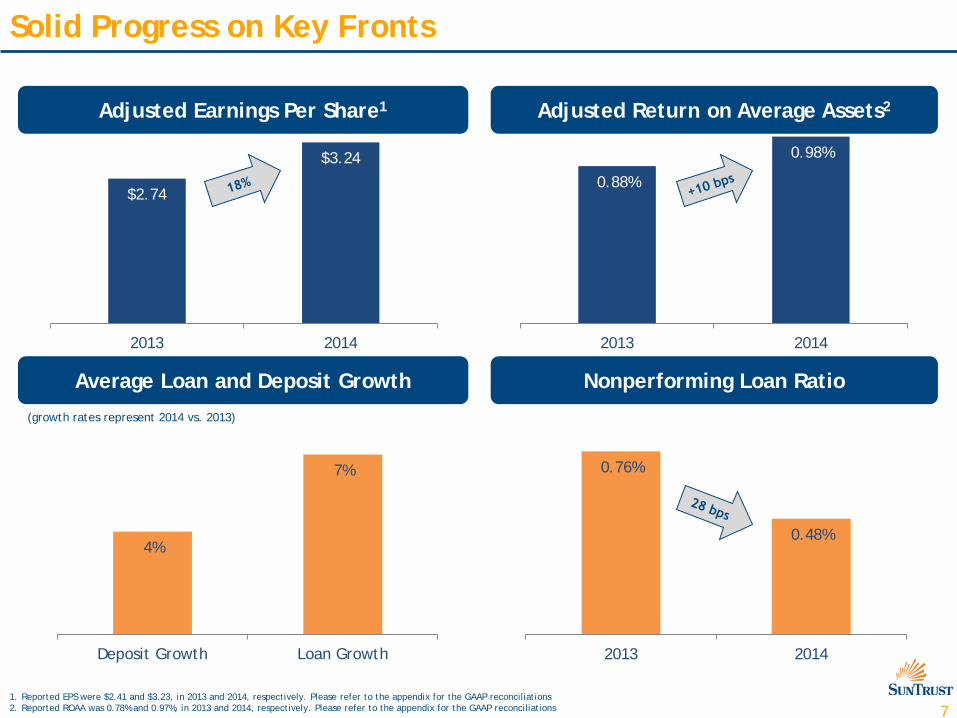
$2.74
$3.24
2013 2014
0.88%
0.98%
2013 2014
Solid Progress on Key Fronts
Adjusted Earnings Per Share1
Nonperforming Loan Ratio
Adjusted Return on Average Assets2
Average Loan and Deposit Growth
(growth rates represent 2014 vs. 2013)
1. Reported EPS were $2.41 and $3.23, in 2013 and 2014, respectively. Please refer to the appendix for the GAAP reconciliations 2. Reported ROAA was 0.78% and 0.97%, in 2013 and 2014, respectively. Please refer to the appendix for the GAAP reconciliations
0.76%
0.48%
2013 2014
4%
7%
Deposit Growth Loan Growth
8
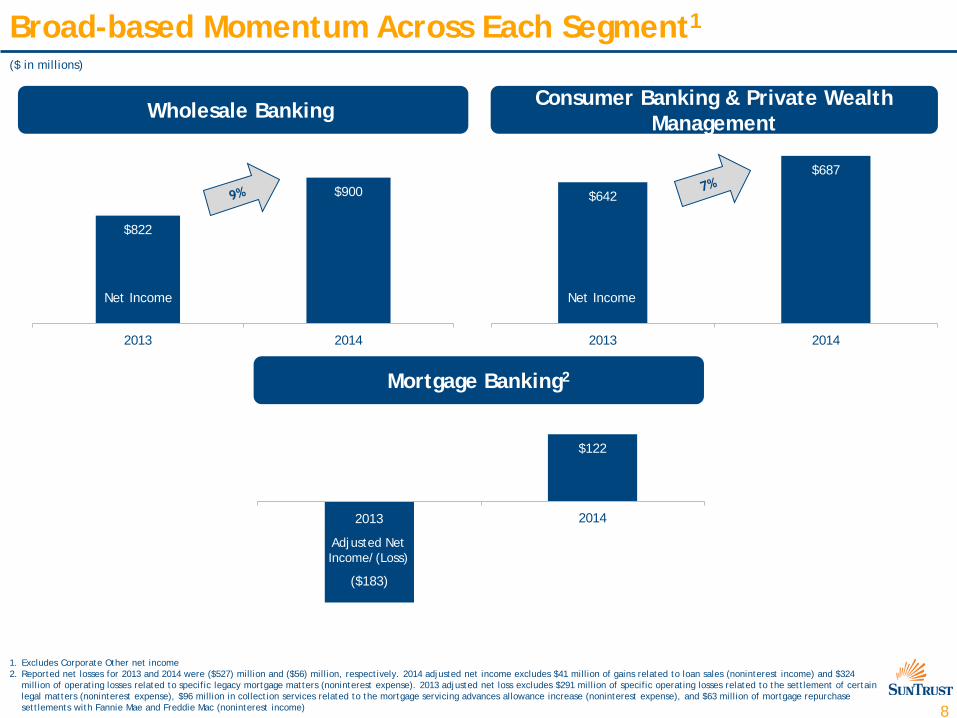
$822
$900
2013 2014
Broad-based Momentum Across Each Segment1
Wholesale Banking Consumer Banking & Private Wealth Management
Mortgage Banking2
$642
$687
2013 2014
($183)
$122
2013 20142013
($ in millions)
Net Income Net Income
Adjusted Net Income/(Loss)
1. Excludes Corporate Other net income 2. Reported net losses for 2013 and 2014 were ($527) million and ($56) million, respectively. 2014 adjusted net income excludes $41 million of gains related to loan sales (noninterest income) and $324
million of operating losses related to specific legacy mortgage matters (noninterest expense). 2013 adjusted net loss excludes $291 million of specific operating losses related to the settlement of certain legal matters (noninterest expense), $96 million in collection services related to the mortgage servicing advances allowance increase (noninterest expense), and $63 million of mortgage repurchase settlements with Fannie Mae and Freddie Mac (noninterest income)
9
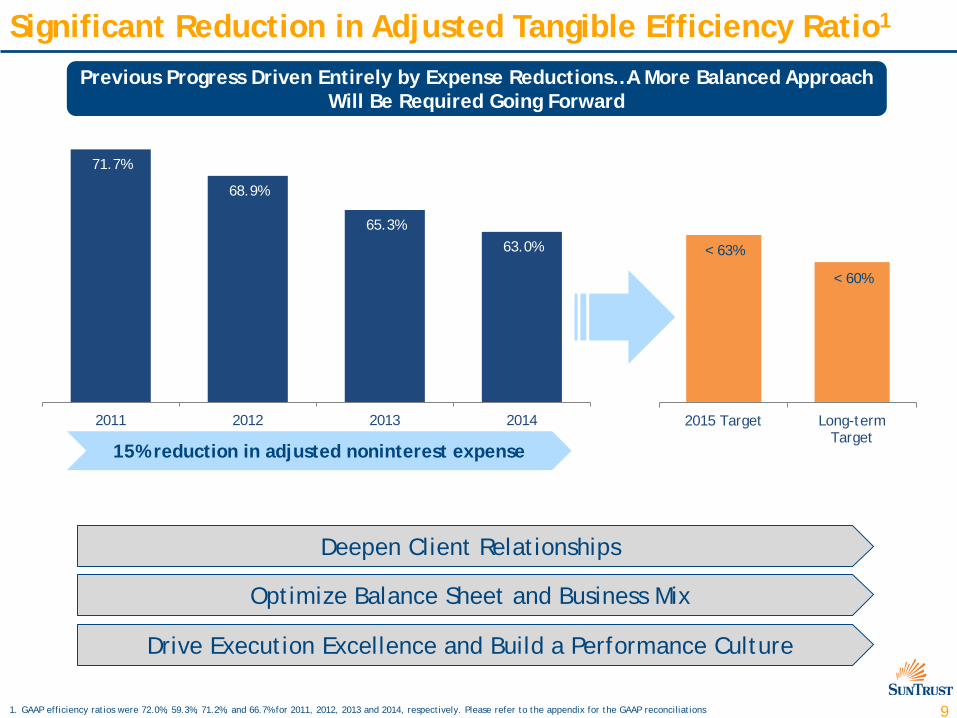
2015 Target Long-termTarget
15% reduction in adjusted noninterest expense
Significant Reduction in Adjusted Tangible Efficiency Ratio1
1. GAAP efficiency ratios were 72.0%, 59.3%, 71.2%, and 66.7% for 2011, 2012, 2013 and 2014, respectively. Please refer to the appendix for the GAAP reconciliations
Deepen Client Relationships
Optimize Balance Sheet and Business Mix
Drive Execution Excellence and Build a Performance Culture
Previous Progress Driven Entirely by Expense Reductions…A More Balanced Approach Will Be Required Going Forward
< 60%
71.7%
68.9%
65.3%63.0%
2011 2012 2013 2014
< 63%
10
Investment Thesis
Improving Returns & Efficiency
Investing in Growth Opportunities
Strong & Diverse Franchise
Higher Capital Return to Shareholders
11
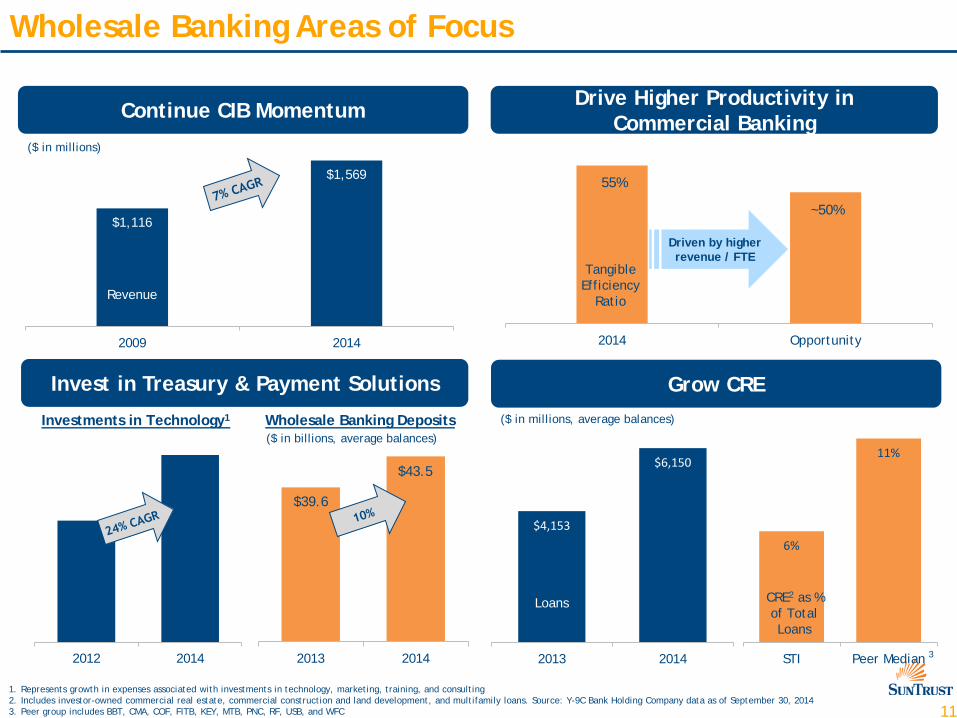
2013 20142012 2014
2014 Opportunity
Wholesale Banking Areas of Focus
1. Represents growth in expenses associated with investments in technology, marketing, training, and consulting 2. Includes investor-owned commercial real estate, commercial construction and land development, and multifamily loans. Source: Y-9C Bank Holding Company data as of September 30, 2014 3. Peer group includes BBT, CMA, COF, FITB, KEY, MTB, PNC, RF, USB, and WFC
6%
11%
STI Peer Median
$4,153
$6,150
2013 2014
Grow CRE
($ in millions, average balances)
Continue CIB Momentum Drive Higher Productivity in Commercial Banking
Invest in Treasury & Payment Solutions
($ in millions)
$1,502
Tangible Efficiency
Ratio
55%
~50%
CRE2 as % of Total Loans
($ in billions, average balances)
3
Investments in Technology1 Wholesale Banking Deposits
Driven by higher revenue / FTE
Loans
$1,116
$1,569
2009 2014
Revenue
$39.6
$43.5
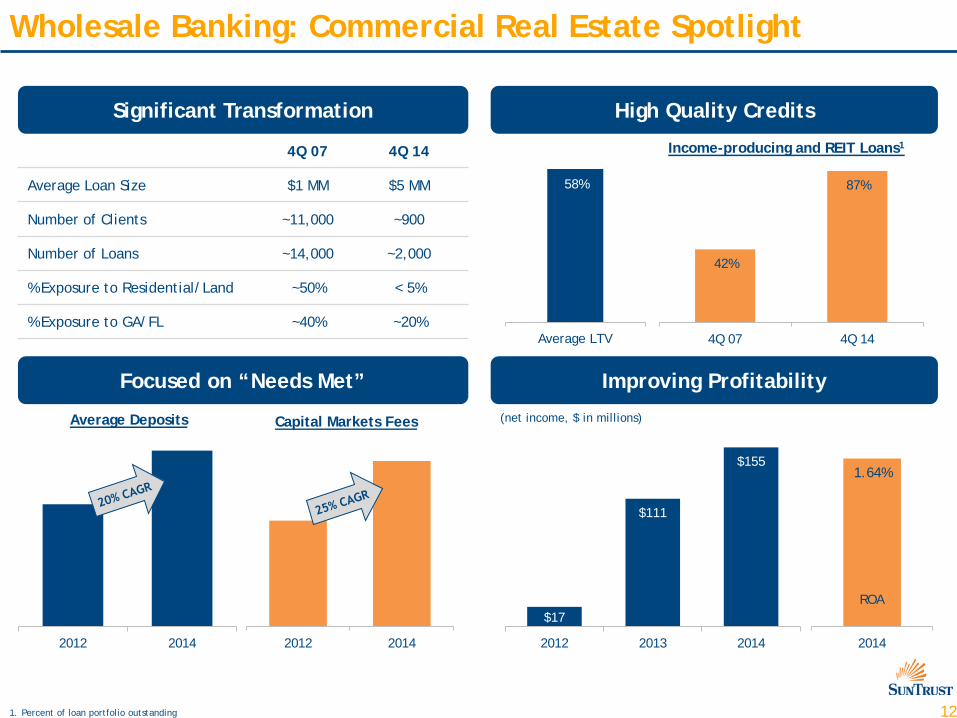
12
42%
87%
4Q 07 4Q 14
2012 2014
$17
$111
$155
2012 2013 20142012 2014
Wholesale Banking: Commercial Real Estate Spotlight
(net income, $ in millions) Average Deposits Capital Markets Fees
58%
Significant Transformation High Quality Credits
Focused on “Needs Met” Improving Profitability
Average LTV
4Q 07 4Q 14
Average Loan Size $1 MM $5 MM
Number of Clients ~11,000 ~900
Number of Loans ~14,000 ~2,000
% Exposure to Residential/Land ~50% < 5%
% Exposure to GA/FL ~40% ~20%
1. Percent of loan portfolio outstanding
Income-producing and REIT Loans1
2014
1.64%
ROA
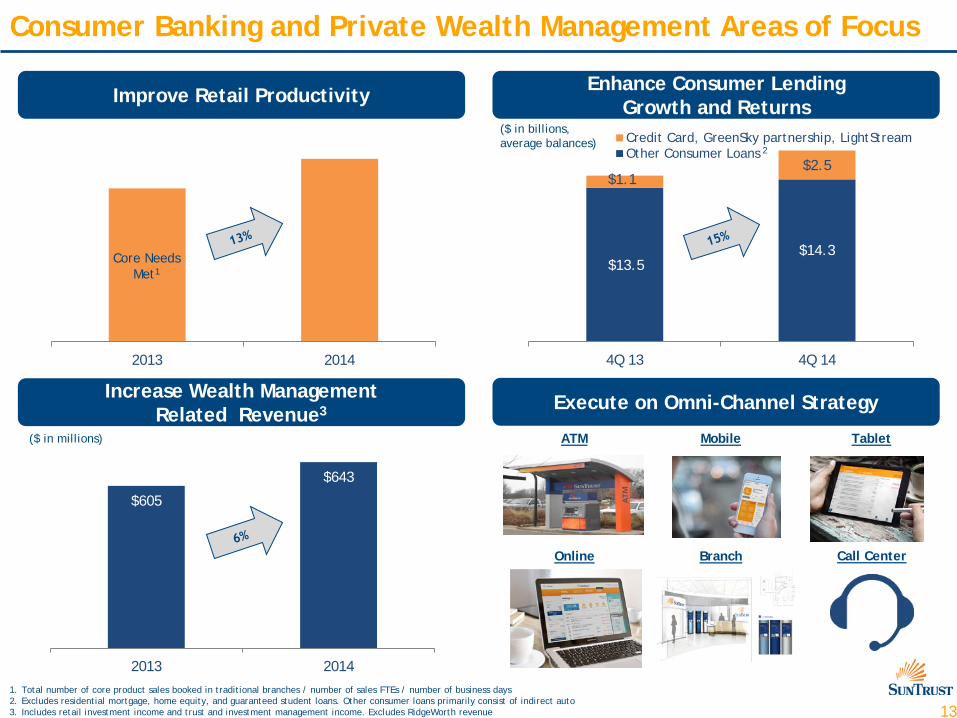
13
$13.5$14.3
$1.1$2.5
4Q 13 4Q 14
Credit Card, GreenSky partnership, LightStreamOther Consumer Loans
$605
$643
2013 2014
2013 2014
Consumer Banking and Private Wealth Management Areas of Focus
Execute on Omni-Channel Strategy
Improve Retail Productivity Enhance Consumer Lending Growth and Returns
ATM
Branch Call Center
Mobile Tablet
Online
1. Total number of core product sales booked in traditional branches / number of sales FTEs / number of business days 2. Excludes residential mortgage, home equity, and guaranteed student loans. Other consumer loans primarily consist of indirect auto 3. Includes retail investment income and trust and investment management income. Excludes RidgeWorth revenue
($ in billions, average balances)
2
Core Needs Met1
Increase Wealth Management Related Revenue3
($ in millions)
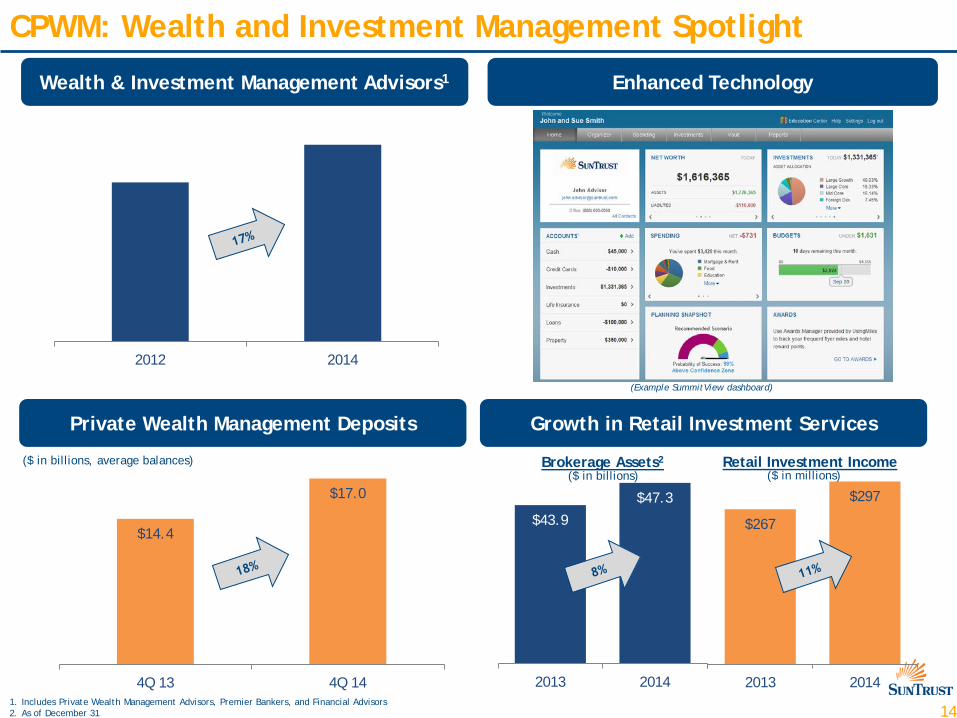
14
2012 2014
$43.9
$47.3
2013 2014
CPWM: Wealth and Investment Management Spotlight
1. Includes Private Wealth Management Advisors, Premier Bankers, and Financial Advisors 2. As of December 31
Retail Investment Income Brokerage Assets2 ($ in billions, average balances)
Wealth & Investment Management Advisors1 Enhanced Technology
Growth in Retail Investment Services Private Wealth Management Deposits
$267
$297
2013 2014
($ in billions) ($ in millions)
(Example SummitView dashboard)
$14.4
$17.0
4Q 13 4Q 14
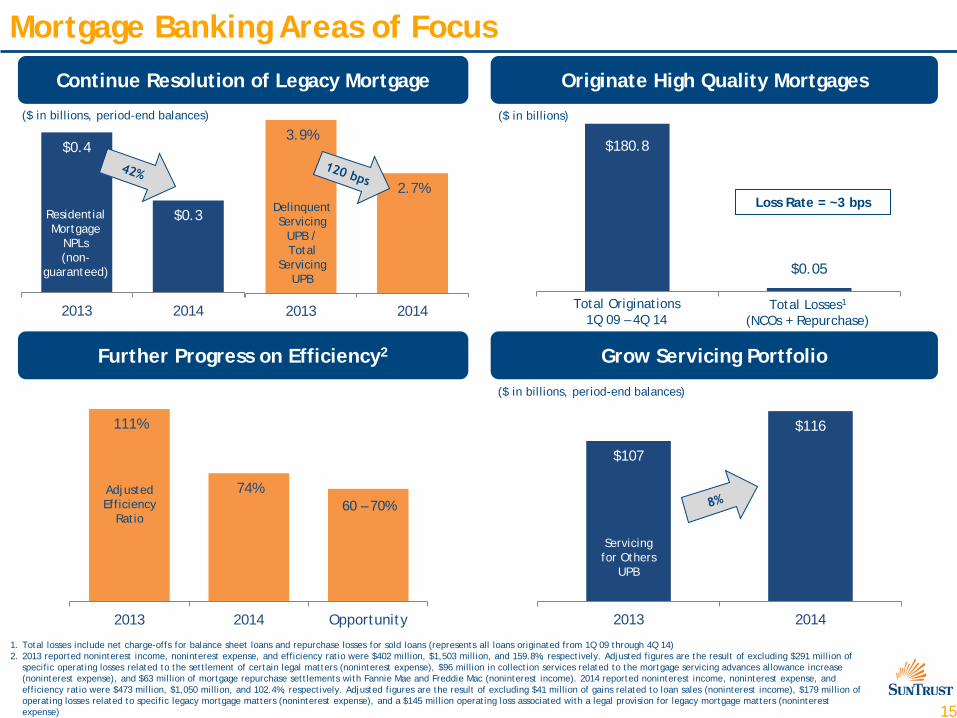
15
$107
$116
2013 2014
$0.4
$0.3
2013 2014
3.9%
2.7%
2013 2014
111%
74%
2013 2014 Opportunity
Mortgage Banking Areas of Focus
($ in billions)
Residential Mortgage
NPLs (non-
guaranteed)
1. Total losses include net charge-offs for balance sheet loans and repurchase losses for sold loans (represents all loans originated from 1Q 09 through 4Q 14) 2. 2013 reported noninterest income, noninterest expense, and efficiency ratio were $402 million, $1,503 million, and 159.8%, respectively. Adjusted figures are the result of excluding $291 million of
specific operating losses related to the settlement of certain legal matters (noninterest expense), $96 million in collection services related to the mortgage servicing advances allowance increase (noninterest expense), and $63 million of mortgage repurchase settlements with Fannie Mae and Freddie Mac (noninterest income). 2014 reported noninterest income, noninterest expense, and efficiency ratio were $473 million, $1,050 million, and 102.4%, respectively. Adjusted figures are the result of excluding $41 million of gains related to loan sales (noninterest income), $179 million of operating losses related to specific legacy mortgage matters (noninterest expense), and a $145 million operating loss associated with a legal provision for legacy mortgage matters (noninterest expense)
Delinquent Servicing
UPB / Total
Servicing UPB
($ in billions, period-end balances)
Servicing for Others
UPB
($ in billions, period-end balances)
Continue Resolution of Legacy Mortgage Originate High Quality Mortgages
Further Progress on Efficiency2 Grow Servicing Portfolio
Total Originations 1Q 09 – 4Q 14
60 – 70% Adjusted Efficiency
Ratio
$180.8
Total Losses1 (NCOs + Repurchase)
$0.05
Loss Rate = ~3 bps

16
Investment Thesis
Improving Returns & Efficiency
Investing in Growth Opportunities
Strong & Diverse Franchise
Higher Capital Return to Shareholders
17
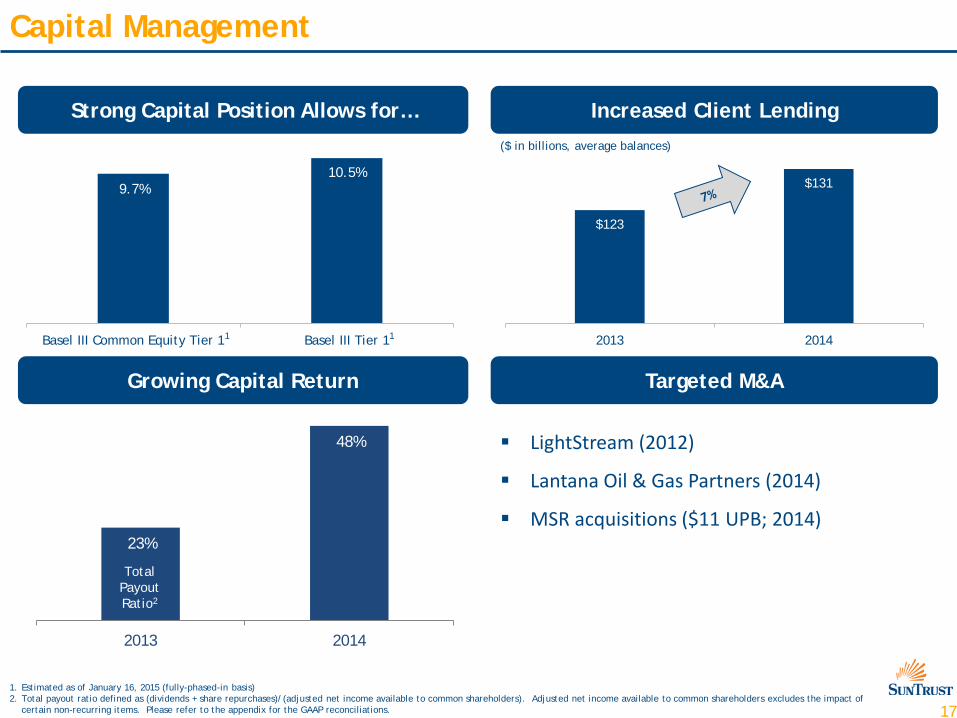
Capital Management
Growing Capital Return
Strong Capital Position Allows for… Increased Client Lending
Targeted M&A
LightStream (2012)
Lantana Oil & Gas Partners (2014)
MSR acquisitions ($11 UPB; 2014)
Basel III Common Equity Tier 1 Basel III Tier 1
10.5% 9.7%
1
1. Estimated as of January 16, 2015 (fully-phased-in basis) 2. Total payout ratio defined as (dividends + share repurchases)/(adjusted net income available to common shareholders). Adjusted net income available to common shareholders excludes the impact of
certain non-recurring items. Please refer to the appendix for the GAAP reconciliations.
$123
$131
2013 2014
($ in billions, average balances)
23%
48%
2013 2014
Total Payout Ratio2
1

18
Investment Thesis
Improving Returns & Efficiency
Investing in Growth Opportunities
Strong & Diverse Franchise
Higher Capital Return to Shareholders

Appendix
20
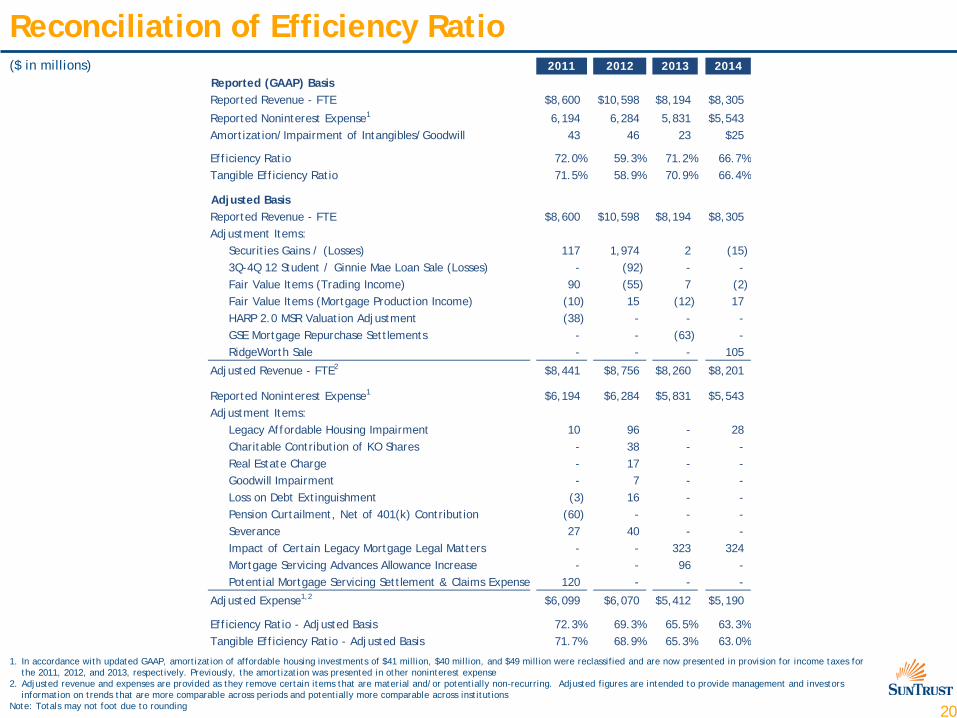
Reconciliation of Efficiency Ratio ($ in millions)
1. In accordance with updated GAAP, amortization of affordable housing investments of $41 million, $40 million, and $49 million were reclassified and are now presented in provision for income taxes for the 2011, 2012, and 2013, respectively. Previously, the amortization was presented in other noninterest expense
2. Adjusted revenue and expenses are provided as they remove certain items that are material and/or potentially non-recurring. Adjusted figures are intended to provide management and investors information on trends that are more comparable across periods and potentially more comparable across institutions
Note: Totals may not foot due to rounding
2011 2012 2013 2014Reported (GAAP) BasisReported Revenue - FTE $8,600 $10,598 $8,194 $8,305
Reported Noninterest Expense1 6,194 6,284 5,831 $5,543Amortization/Impairment of Intangibles/Goodwill 43 46 23 $25
Efficiency Ratio 72.0% 59.3% 71.2% 66.7%Tangible Efficiency Ratio 71.5% 58.9% 70.9% 66.4%
Adjusted BasisReported Revenue - FTE $8,600 $10,598 $8,194 $8,305Adjustment Items:
Securities Gains / (Losses) 117 1,974 2 (15) 3Q-4Q 12 Student / Ginnie Mae Loan Sale (Losses) - (92) - - Fair Value Items (Trading Income) 90 (55) 7 (2) Fair Value Items (Mortgage Production Income) (10) 15 (12) 17 HARP 2.0 MSR Valuation Adjustment (38) - - - GSE Mortgage Repurchase Settlements - - (63) - RidgeWorth Sale - - - 105
Adjusted Revenue - FTE2 $8,441 $8,756 $8,260 $8,201
Reported Noninterest Expense1 $6,194 $6,284 $5,831 $5,543Adjustment Items:
Legacy Affordable Housing Impairment 10 96 - 28 Charitable Contribution of KO Shares - 38 - - Real Estate Charge - 17 - - Goodwill Impairment - 7 - - Loss on Debt Extinguishment (3) 16 - - Pension Curtailment, Net of 401(k) Contribution (60) - - - Severance 27 40 - - Impact of Certain Legacy Mortgage Legal Matters - - 323 324 Mortgage Servicing Advances Allowance Increase - - 96 - Potential Mortgage Servicing Settlement & Claims Expense 120 - - -
Adjusted Expense1,2 $6,099 $6,070 $5,412 $5,190
Efficiency Ratio - Adjusted Basis 72.3% 69.3% 65.5% 63.3%Tangible Efficiency Ratio - Adjusted Basis 71.7% 68.9% 65.3% 63.0%
21
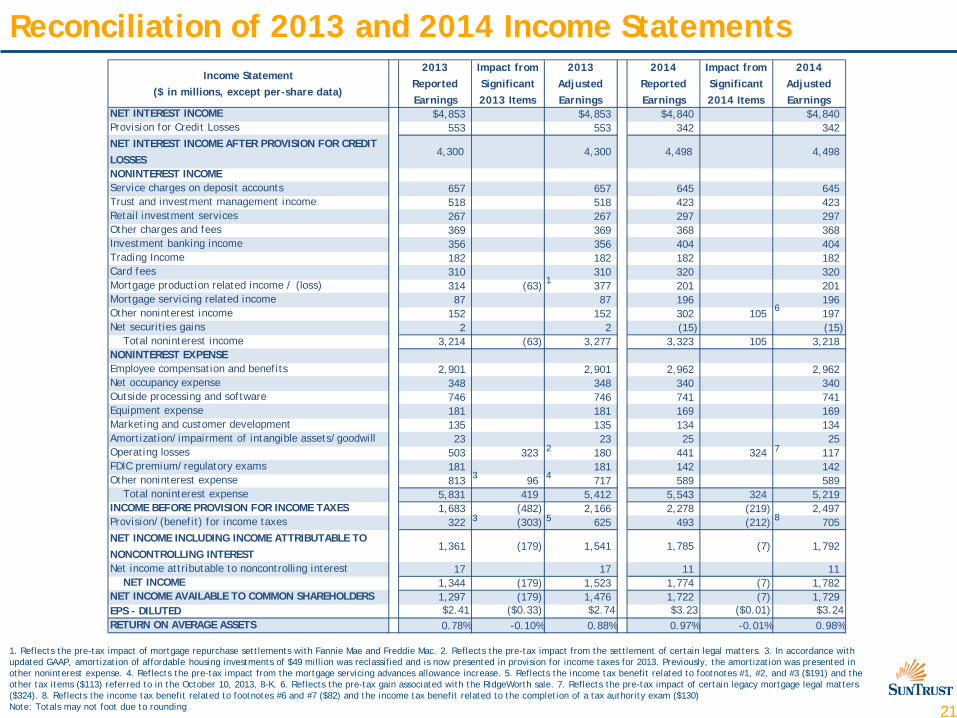
Income Statement ($ in millions, except per-share data)
2013 Reported Earnings
Impact from Significant 2013 Items
2013 Adjusted Earnings
2014 Reported Earnings
Impact from Significant 2014 Items
2014 Adjusted Earnings
NET INTEREST INCOME $4,853 $4,853 $4,840 $4,840Provision for Credit Losses 553 553 342 342 NET INTEREST INCOME AFTER PROVISION FOR CREDIT LOSSES
4,300 4,300 4,498 4,498
NONINTEREST INCOMEService charges on deposit accounts 657 657 645 645 Trust and investment management income 518 518 423 423 Retail investment services 267 267 297 297 Other charges and fees 369 369 368 368 Investment banking income 356 356 404 404 Trading Income 182 182 182 182 Card fees 310 310 320 320 Mortgage production related income / (loss) 314 (63) 377 201 201 Mortgage servicing related income 87 87 196 196 Other noninterest income 152 152 302 105 197 Net securities gains 2 2 (15) (15) Total noninterest income 3,214 (63) 3,277 3,323 105 3,218 NONINTEREST EXPENSEEmployee compensation and benefits 2,901 2,901 2,962 2,962 Net occupancy expense 348 348 340 340 Outside processing and software 746 746 741 741 Equipment expense 181 181 169 169 Marketing and customer development 135 135 134 134 Amortization/impairment of intangible assets/goodwill 23 23 25 25 Operating losses 503 323 180 441 324 117 FDIC premium/regulatory exams 181 181 142 142 Other noninterest expense 813 96 717 589 589 Total noninterest expense 5,831 419 5,412 5,543 324 5,219 INCOME BEFORE PROVISION FOR INCOME TAXES 1,683 (482) 2,166 2,278 (219) 2,497 Provision/(benefit) for income taxes 322 (303) 625 493 (212) 705 NET INCOME INCLUDING INCOME ATTRIBUTABLE TO NONCONTROLLING INTEREST
1,361 (179) 1,541 1,785 (7) 1,792
Net income attributable to noncontrolling interest 17 17 11 11 NET INCOME 1,344 (179) 1,523 1,774 (7) 1,782 NET INCOME AVAILABLE TO COMMON SHAREHOLDERS 1,297 (179) 1,476 1,722 (7) 1,729 EPS - DILUTED $2.41 ($0.33) $2.74 $3.23 ($0.01) $3.24RETURN ON AVERAGE ASSETS 0.78% -0.10% 0.88% 0.97% -0.01% 0.98%
Reconciliation of 2013 and 2014 Income Statements
1. Reflects the pre-tax impact of mortgage repurchase settlements with Fannie Mae and Freddie Mac. 2. Reflects the pre-tax impact from the settlement of certain legal matters. 3. In accordance with updated GAAP, amortization of affordable housing investments of $49 million was reclassified and is now presented in provision for income taxes for 2013. Previously, the amortization was presented in other noninterest expense. 4. Reflects the pre-tax impact from the mortgage servicing advances allowance increase. 5. Reflects the income tax benefit related to footnotes #1, #2, and #3 ($191) and the other tax items ($113) referred to in the October 10, 2013, 8-K. 6. Reflects the pre-tax gain associated with the RidgeWorth sale. 7. Reflects the pre-tax impact of certain legacy mortgage legal matters ($324). 8. Reflects the income tax benefit related to footnotes #6 and #7 ($82) and the income tax benefit related to the completion of a tax authority exam ($130) Note: Totals may not foot due to rounding
1
2
3
3
4
5
6
7
8