crime report 2006 - georgetown...
TRANSCRIPT

Crime Report 2006
COLOMBIAN NATIONAL POLICE ▲ DIJIN
COLOMBIAN NATIONAL POLICE
CRIME REPORT
2006
Avenida El Dorado No. 75 – 25 (Bogotá - Colombia) / Tel. (57) (1) 4266333 www.policia.gov.co / [email protected] / [email protected]
1

Crime Report 2006
COLOMBIAN NATIONAL POLICE ▲ DIJIN
INDEX
Page
Presentation 3
Social Impact Offenses 4
I. Murders 5
II. Traffic fatalities 9
III. Personal injuries 12
IV. Traffic injuries 15
V. Thefts 17
VI. Motor-vehicle thefts 20
VII. Highway Banditry 22
VIII. Kidnappings 24
IX. Mass kidnappings 25
X. Extortion 27
XI. Terrorist actions 28
XII. Subversive actions 31
Colombian National Police Operational Achievements 33
I. Arrests related to all crimes 34
II. Recovered and seized merchandise 35
III. Recovered Motor-vehicles 35
IV. Illicit drugs seizures 37
V. Expropriation 37
Changes in the criminality composition 38
Conclusions 40
Tables 42
Avenida El Dorado No. 75 – 25 (Bogotá - Colombia) / Tel. (57) (1) 4266333 www.policia.gov.co / [email protected] / [email protected]
2

Crime Report 2006
COLOMBIAN NATIONAL POLICE ▲ DIJIN
PRESENTATION
This annual comparative report brings criminal statistics recorded by the Colombian National
Police (CNP), to provide a comprehensive account of the different achievements that have been
reached in rural and urban scenarios, leading to the reduction of the main high impact crimes
that affect the Colombian society.
Although the present report reflects the latest patterns and trends of crime during 2006
compared to 2005 figures, it is important to emphasize that the decrease in violence and
delinquency indicators have been reached not just as a consequence of the current situation but
due to the coherent and systematic work of the National Government, through the
implementation of the Defense and Security Policy, oriented to recover the country’s credibility
and to generate a peaceful coexistence among citizens.
The first part of the study is related to offenses which affect the democratic security of the
Nation and the colombian citizen’s safety which includes the analysis of thirteen different types
of offenses and their variables. The second part is focused in the operative achievements
reached by CNP, including items such as arrests for all crimes, recovered and seized
merchandise, drugs and cars, as well as information about expropriation, as a result of the
government’s struggle against illicit drugs.
This Crime Report is an important source of information for those interested in the dynamics of
delinquency in Colombia, since it enables them to corroborate for example, the reductions
recorded during 2006 compared with 2005 figures, in the total number of homicides, extortion
and kidnapping, of 3%, 5% and 14%, respectively; offenses of high importance for the
international community as they generate expectations of certainty for making better decisions.
In a joint effort, the Colombian National Police and the Military Forces have fought against all
modalities of crime, sending a message that it is possible to invest in this Nation and contribute
to its sustainable development.
Brigadier General OSCAR ADOLFO NARANJO TRUJILLO
Criminal Investigation Director CNP
Avenida El Dorado No. 75 – 25 (Bogotá - Colombia) / Tel. (57) (1) 4266333 www.policia.gov.co / [email protected] / [email protected]
3

Crime Report 2006
COLOMBIAN NATIONAL POLICE ▲ DIJIN
SOCIAL IMPACT OFFENSES
2005 2006 ABSOLUTE % 2005 2006 2005 2006
16.407 15.430 -977 -6% 45 42 35 33ON DUTY 189 149 -40 -21% 1 0 0 0OUT OF SERVICE 57 43 -14 -25% 0 0 0 0
432 462 30 7% 1 1 1 1
1.026 1.395 369 36% 3 42 3
TOTAL 18.111 17.479 -632 -3% 50 48 39 3748 37 -11 -23% 0 0 0 0252 193 -59 -23% 1 1 1 0
3.889 4.057 168 4% 11 11 8 9373 688 315 84% 1 2 1 1
4.262 4.745 483 11% 12 13 9 10377 282 -95 -25% 1 1 1 1423 405 -18 -4% 1 1 1 1800 687 -113 -14% 2 2 2 11.739 1.652 -87 -5% 5 5 4 4486 527 41 8% 1 1 1 1126 119 -7 -6% 0 0 0 0612 646 34 6% 2 2 1 14 2 -2 -50% 0 0 0 08 7 -1 -13% 0 0 0 013 7 -6 -46% 0 0 0 0100 65 -35 -35% 0 0 0 031 16 -15 -48% 0 0 0 01 0 -1 -100% 0 0 0 038 21 -17 -45% 0 0 0 073 49 -24 -33% 0 0 0 0
268 167 -101 -38% 1 0 1 0
25.419 24.688 -731 -3% 70 68 54 53
2005 2006 ABSOLUTE % 2005 2006 2005 2006
30.403 46.496 16.093 53% 85 127 65 9910.059 13.134 3.075 31% 28 36 22 2841.271 54.829 13.558 33% 116 150 88 11714.797 20.245 5.448 37% 41 55 32 4313.572 16.258 2.686 20% 38 45 29 3569.640 91.332 21.692 31% 195 250 149 1959.961 9.246 -715 -7% 28 25 21 209.016 10.531 1.515 17% 25 29 19 23
18.977 19.777 800 4% 53 54 41 421.708 2.040 332 19% 5 6 4 491 92 1 1% 0 0 0 0713 671 -42 -6% 2 2 2 1
131.591 173.542 41.951 32% 369 475 281 371157.010 198.230 41.220 26% 440 543 336 424
IMPACT OFFENSES THAT AFFECT DEMOCRATIC SECURITY
PERIOD FRON JANUARY 1st TO DECEMBER 31st VARIATION DAILY AVERAGE
MURDER
CIVILIANS
NATIONAL POLICE PERSONNEL
PERSONNEL FROM MILITARY FORCES AND SECURITY ORGANIZATIONS
KNOCKED DOWN ANTISOCIALS BY PUBLIC FORCE AND SECURITY ORGANIZATIONS
MASS MURDERS
CASES
VICTIMS
TRAFFIC FATALITIES
HOMICIDES
DEATHS
TOTAL
KIDNAPPINGEXTORSIVE
SIMPLE
TOTALEXTORTION
TERRORISMACTIVATED DEVICES
DEACTIVATED DEVICES
TOTAL
SUBVERSIVE ACTIONS
GUERRILLA ASSAULT ON TOWNS
ATTACKS AGAINTS POLICE AIRCRAFTS
ATTACKS AGAINTS POLICE INSTALLATIONS
GUERRILLA HARASSMENT
AMBUSH
GUERRILLA INCURSION INTO TOWNS
ARMED COMBAT
ILLEGAL CHECKPOINTS
TOTALSUBTOTAL IMPACT OFFENSES THAT AFFECT
DEMOCRATIC SECURITYOFFENSES THAT AFFECT CITIZEN`S
SAFETY
PERIOD FRON JANUARY 1st TO DECEMBER 31st VARIATION
MOTORCYCLESTOTAL
PERSONAL INJURIESTRAFFIC INJURIES
THEFT
STREET ROBBERYBURGLARYCOMMERCIAL THEFTSTOTAL
RATE PER 100.000 INHABITANTS
RATE PER 100.000 INHABITANTS
DAILY AVERAGE
TOTAL OFFENSES
LIVESTOCK THEFTBANK ROBBERYHIGHWAY BANDITRYSUBTOTAL OFFENCES THAT AFFECT CITIZEN`S
SAFETY
MOTOR-VEHICLE THEFT
AUTO THEFT
Avenida El Dorado No. 75 – 25 (Bogotá - Colombia) / Tel. (57) (1) 4266333 www.policia.gov.co / [email protected] / [email protected]
4
Crime Report 2006
COLOMBIAN NATIONAL POLICE ▲ DIJIN
I. MURDER
Murders (1986-2006)
17.4
79
18.1
11
20.2
10
17.4
50 21.1
29
23.3
84
24.3
08 28.2
84
28.2
24
28.1
73
26.8
28
25.3
98
26.6
42
25.3
79
23.0
96
24.3
58
26.5
40
27.8
40
28.8
37
23.5
23
15.7
43
0
20.000
40.000
1986
1987
1988
1989
1990
1991
1992
1993
1994
1995
1996
1997
1998
1999
2000
2001
2002
2003
2004
2005
2006
National volume, trends and rates.
Total homicides
1.4421.5431.569
1.4601.581
1.4761.4571.424
1.579 1.537
1.439
1.604
1.3991.4821.529
1.4041.335
1.4501.4251.310
1.493 1.498
1.5141.640
1.000
1.500
2.000
Jan Feb Mar Apr May Jun Jul Aug Sep Oct Nov Dec
2005= 18,111 2006= 17,479
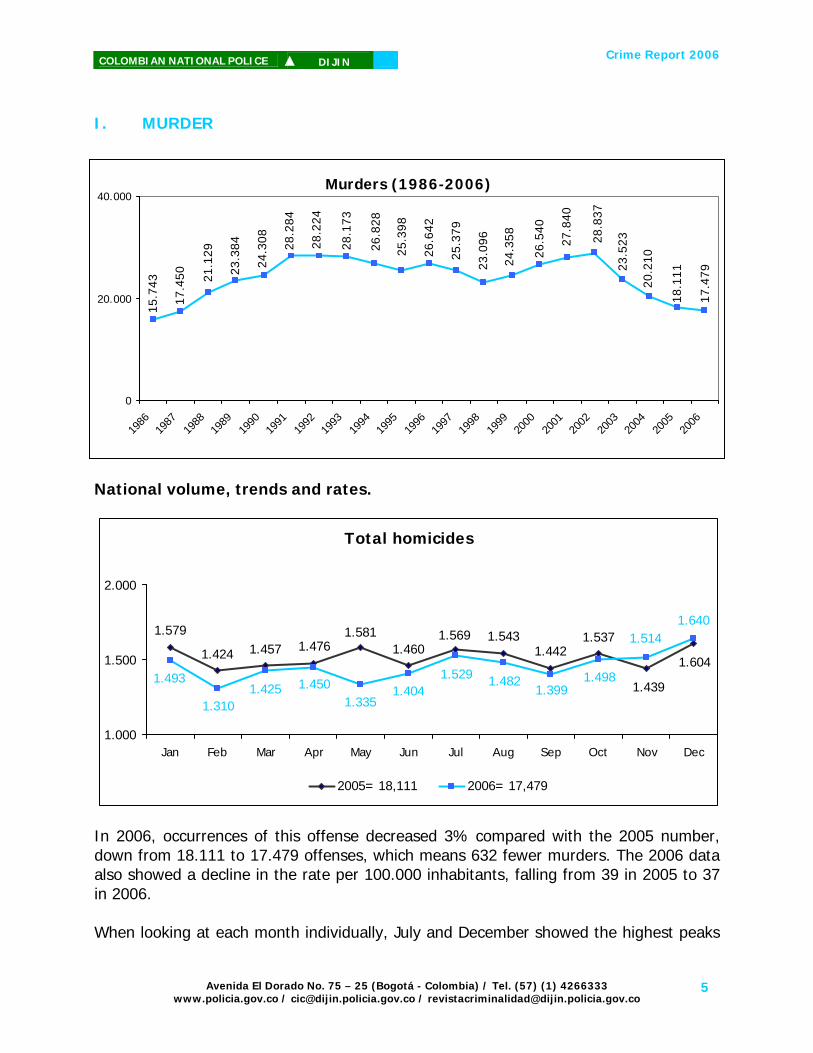
In 2006, occurrences of this offense decreased 3% compared with the 2005 number, down from 18.111 to 17.479 offenses, which means 632 fewer murders. The 2006 data also showed a decline in the rate per 100.000 inhabitants, falling from 39 in 2005 to 37 in 2006. When looking at each month individually, July and December showed the highest peaks
Avenida El Dorado No. 75 – 25 (Bogotá - Colombia) / Tel. (57) (1) 4266333 www.policia.gov.co / [email protected] / [email protected]
5

Crime Report 2006
COLOMBIAN NATIONAL POLICE ▲ DIJIN
with 1.529 and 1.640 cases respectively; while February showed the lowest one. Besides, 149 police officers were killed while on duty during 2006, which means 40 fewer than in 2005.
23.52320.210 18.111 17.479
0
10000
20000
30000
40000
2003 2004 2005 2006
Total murders
The 2006 data showed a significant 26% decrease while comparing to the 2003 data, falling from 23.523 murders in 2003, to 17.479 cases in 2006.
1786 1739 1774 1726 1669
1372
0
500
1000
1500
2000
Hom
icid
es
Valle M. Cali M. Bogotá
Most affected zones per frequency
2005
2006
Although the Valle province and metropolitan areas of Cali and Bogotá were the most affected zones during 2006, with 1.739, 1.726 and 1.372 murders respectively, the 2006 data showed a reduction in the total number of murders over those areas, when comparing them with 2005. The most significant drop was reported in the Metropolitan area of Bogotá (18%), falling from 1.669 cases to 1.372, which means 297 fewer murders.
Avenida El Dorado No. 75 – 25 (Bogotá - Colombia) / Tel. (57) (1) 4266333 www.policia.gov.co / [email protected] / [email protected]
6

Crime Report 2006
COLOMBIAN NATIONAL POLICE ▲ DIJIN
67
107
80
101
142
96
0
40
80
120
160
Hom
icid
es
Putumayo Guaviare Arauca
Most affected zones (Rate per 100,000 inhabitants )
2005
2006
During 2006 Putumayo province was the most affected zone according to the rate per 100.000 inhabitants with 107 victims, 40 more than those in the previous year, followed by Guaviare province with 101 victims and Arauca province which showed a decrease of 32% while comparing with the 2005 figures, falling from 142 to 96 cases.
Types of weapons used
15%5%
80%
Firearms
Knives or cutting instruments
Others
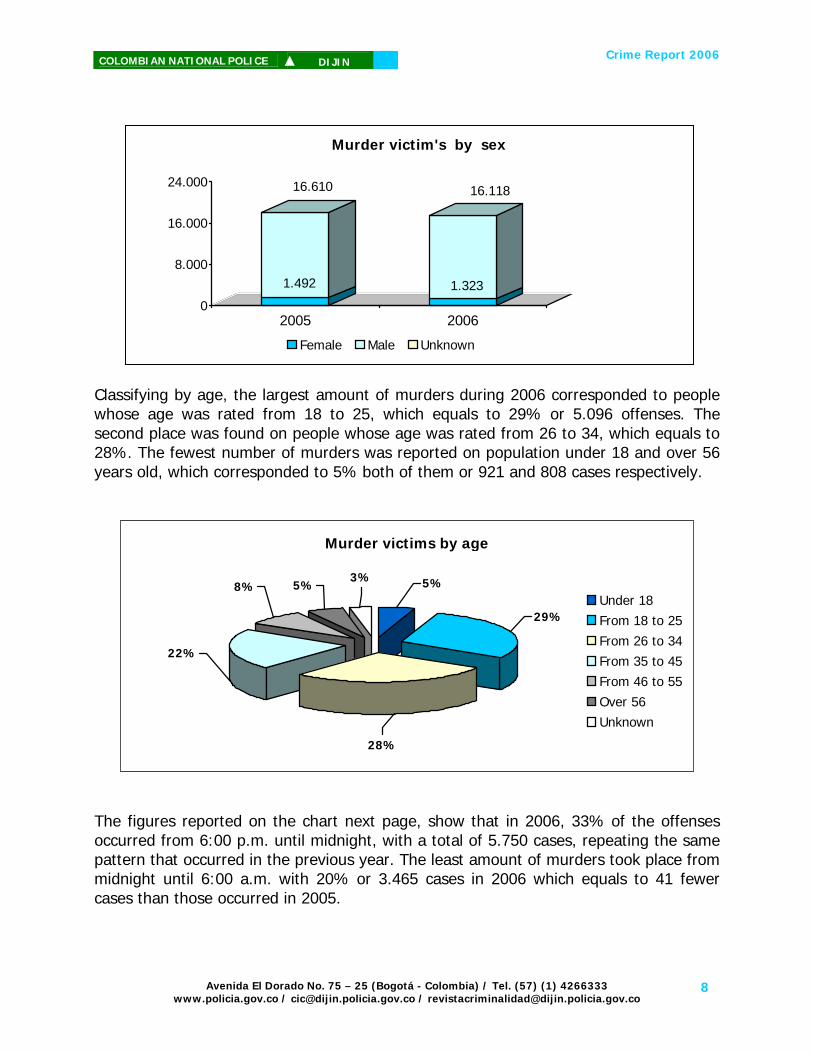
During the year 2006, 80% of the murders were committed with firearms and 15% with knives or cutting instruments; the remaining 5% of the offenses were committed with other weapons such as clubs and blunt objects, among others. A breakdown of the data by gender showed that 92% of the total homicide victims were male, and 8% were female during 2006, the same proportion that was reported during 2005. In absolute terms, this equals to 1.323 female victims and 16.118 male victims in 2006. While comparing 2006 data to 2005, there was a reduction of 492 male victims and there were 169 fewer female victims during the 2006 year.
Avenida El Dorado No. 75 – 25 (Bogotá - Colombia) / Tel. (57) (1) 4266333 www.policia.gov.co / [email protected] / [email protected]
7
Crime Report 2006
COLOMBIAN NATIONAL POLICE ▲ DIJIN
1.492
16.610
1.323
16.118
0
8.000
16.000
24.000
2005 2006
Murder victim's by sex
Female Male Unknown
Classifying by age, the largest amount of murders during 2006 corresponded to people whose age was rated from 18 to 25, which equals to 29% or 5.096 offenses. The second place was found on people whose age was rated from 26 to 34, which equals to 28%. The fewest number of murders was reported on population under 18 and over 56 years old, which corresponded to 5% both of them or 921 and 808 cases respectively.
Murder victims by age
5%
29%
28%
22%
8% 5%3%
Under 18From 18 to 25From 26 to 34From 35 to 45From 46 to 55Over 56Unknown
The figures reported on the chart next page, show that in 2006, 33% of the offenses occurred from 6:00 p.m. until midnight, with a total of 5.750 cases, repeating the same pattern that occurred in the previous year. The least amount of murders took place from midnight until 6:00 a.m. with 20% or 3.465 cases in 2006 which equals to 41 fewer cases than those occurred in 2005.
Avenida El Dorado No. 75 – 25 (Bogotá - Colombia) / Tel. (57) (1) 4266333 www.policia.gov.co / [email protected] / [email protected]
8

Crime Report 2006
COLOMBIAN NATIONAL POLICE ▲ DIJIN
Murders classiffied by hour of occurence
33%24%
23%20%
00 - 06
06 - 12.
12 - 18.
18 - 00
II. TRAFFIC FATALITIES National volume, trends and rates
Total traffic fatalities
393
315277
322
353382
291
289
325341
250
351386
353399385
329370
278
317
320273
296351
100
200
300
400
500
Jan Feb Mar Apr May Jun Jul Aug Sep Oct Nov Dec
2005 = 3.889 2006 = 4.057
According to reports, this crime recorded an increase of 4% rising from 3.889 cases during 2005 to 4.057 cases during the same period in 2006. That is to say, the daily national average of occurrences amounts to 11 cases during 2006, the same amount registered in 2005. March recorded the lowest figures of this crime with 273 cases, while October was the most affected month during 2006, with 399 cases.
Avenida El Dorado No. 75 – 25 (Bogotá - Colombia) / Tel. (57) (1) 4266333 www.policia.gov.co / [email protected] / [email protected]
9

Crime Report 2006
Avenida El Dorado No. 75 – 25 (Bogotá - Colombia) / Tel. (57) (1) 4266333 www.policia.gov.co / [email protected] / [email protected]
COLOMBIAN NATIONAL POLICE ▲ DIJIN
10
473
396308 244
0
200
400
600
M. Bogotá M. Cali M. Medellín Cundinamarca
Traffic fatalities - most affected zones
2006
During 2006, the metropolitan area of Bogotá reported the largest amount of fatalities as a consequence of traffic accidents, with 473 cases, followed by the metropolitan areas of Cali and Medellín and the Cundinamarca province with 396, 308 and 244 deaths, respectively. Though, Bogotá reported the largest amount of traffic fatalities in 2006, while comparing this number with the occurrences of this offense in 2005, there was a favorable decrease of 4%, which equals to 20 fewer cases.
Traffic fatalities by type of motor-vehicle
61%
18%
21%
Vehicle
Motorcycle
Unknown
According to reports, 61% of the Traffic Fatalities were caused by vehicles, which equals to 2.459 cases, while 18% corresponded to accidents involving motorcycles. 21% of the cases did not specify the type of accident that caused the death.

Crime Report 2006
COLOMBIAN NATIONAL POLICE ▲ DIJIN
832
3.054
866
3.185
0
2.000
4.000
2005 2006
Traffic fatality victims' sex
Female Male
Analyzing the 2006 information by gender, the statistics reported that 79% of these deaths corresponded to male victims, which equals to 3.185 cases and 21% (866) corresponded to female victims. Comparing 2006 with 2005, there was an increase of 4% in the number of male victims which equals to 131 more victims and a 4% increase in the number of female victims which equals to 34 more cases.
Traffic fatalities by day
22%14%
11%18%
13%
11%
11%
Monday
Tuesday
Wednesday
Thursday
Friday
Saturday
Sunday
During 2006, Saturday and Sunday recorded the highest percentage of occurrence, with a participation of 17% and 22%, which equals to 673 and 904 deaths, respectively.
Avenida El Dorado No. 75 – 25 (Bogotá - Colombia) / Tel. (57) (1) 4266333 www.policia.gov.co / [email protected] / [email protected]
11
Crime Report 2006
COLOMBIAN NATIONAL POLICE ▲ DIJIN
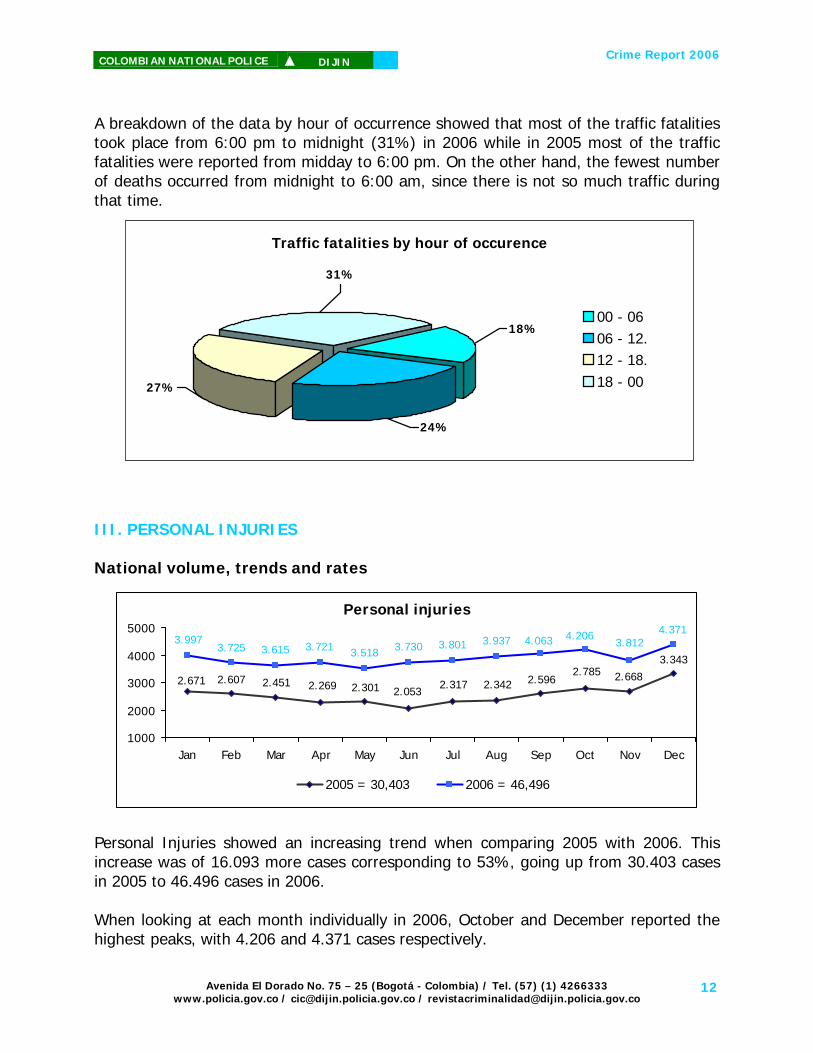
A breakdown of the data by hour of occurrence showed that most of the traffic fatalities took place from 6:00 pm to midnight (31%) in 2006 while in 2005 most of the traffic fatalities were reported from midday to 6:00 pm. On the other hand, the fewest number of deaths occurred from midnight to 6:00 am, since there is not so much traffic during that time.
Traffic fatalities by hour of occurence
27%
31%
24%
18%00 - 0606 - 12.12 - 18.18 - 00
III. PERSONAL INJURIES National volume, trends and rates
Personal injuries
3.3432.6682.785
2.5962.3422.3172.0532.3012.2692.671 2.607 2.451
4.3713.812
4.2064.0633.9373.8013.7303.5183.7213.997
3.725 3.615
1000
2000
3000
4000
5000
Jan Feb Mar Apr May Jun Jul Aug Sep Oct Nov Dec
2005 = 30,403 2006 = 46,496
Personal Injuries showed an increasing trend when comparing 2005 with 2006. This increase was of 16.093 more cases corresponding to 53%, going up from 30.403 cases in 2005 to 46.496 cases in 2006. When looking at each month individually in 2006, October and December reported the highest peaks, with 4.206 and 4.371 cases respectively.
Avenida El Dorado No. 75 – 25 (Bogotá - Colombia) / Tel. (57) (1) 4266333 www.policia.gov.co / [email protected] / [email protected]
12
7%

Crime Report 2006
COLOMBIAN NATIONAL POLICE ▲ DIJIN
The daily average on 2006 was 127 which equal to 45 more wounds than the previous year, and 99 cases per 100.000 inhabitants.
7.370
4.312 4.234
0
2000
4000
6000
8000
M. Bogotá M. Cali Valle
Most affected zones
2006
The most affected zones by this offense during 2006 were the metropolitan areas of Bogotá and Cali with 7.370 cases that represent 16% of participation, and 4.312 cases that represent 9% of participation respectively. In third place Valle province was rated with 4.234 cases and 9% of participation, which represents an increase of 2.885 cases compared with the previous year.
Motives and causes of personal injuries
1%
39%
5%
43%
2%10%
Murder for hireAssaultPersonal vengeanceQuarrelsFamily problemsOthers
During 2006 the main motives that prompted these crimes were quarrels and personal vengeances, with a participation of 43% or 19.799 cases and 39% or 17.915 cases, respectively. While comparing the 2006 data to 2005, there was a significant increase of 91% in the personal injuries that occurred as a result of personal vengeances, increasing from 9.373 cases in 2005 to 17.915 cases in 2006.
Avenida El Dorado No. 75 – 25 (Bogotá - Colombia) / Tel. (57) (1) 4266333 www.policia.gov.co / [email protected] / [email protected]
13

Crime Report 2006
COLOMBIAN NATIONAL POLICE ▲ DIJIN
Types of weapons used
12%53%
22%
13%
Fire arms
Knives or cutting instruments
Clubs, blunt objects
Others
In contrast to murders, in which most of the offenses were committed with firearms, in this offense, the most common weapons used to commit the crime during 2006 were clubs and blunt objects, with a participation of 53% and 24.769 cases, repeating the same pattern of 2005. In second place, the statistics reported the use of knives or cutting instruments with a participation of 22%. The use of firearms in this crime reported an increase of 9% when comparing 2006 with 2005 data, going up from 5.548 cases in 2005 to 6.042 cases during 2006.
Personal injuries by hour of occurence
32%
25%
23%
20%
00 - 06
06 - 12.
12 - 06.
06 - 00
During 2006 the highest percentage of personal injuries occurred from 6:00 p.m. till midnight, with a participation of 32% and 14.980 cases, the same situation that took place in 2005, when 32% of the personal injuries occurred in that interval of time. When comparing the 2006 data to 2005, the occurrences of this offense from midnight to 6:00 a.m. increased 38% which means 2.515 more cases.
Avenida El Dorado No. 75 – 25 (Bogotá - Colombia) / Tel. (57) (1) 4266333 www.policia.gov.co / [email protected] / [email protected]
14

Crime Report 2006
COLOMBIAN NATIONAL POLICE ▲ DIJIN
Personal injuries by day24%
17% 12%
14%
11%11%
11%
MondayTuesdayWednesdayThursdayFridaySaturdaySunday
During 2006, Saturday and Sunday recorded the highest percentage of occurrence, with a participation of 17% and 24%, which equals to 7.828 and 11.232 cases, respectively. IV. TRAFFIC INJURIES National volume, trends and rates
Total traffic injuries
960817
741801763
606 852776
953978928884
1.1691.1131.1191.0091.041988947954
1.2351.155
1.020
1.384
500
750
1000
1250
1500
Jan Feb Mar Apr May Jun Jul Aug Sep Oct Nov Dec
2005 = 10.059 2006 = 13.134
In 2006, occurrences of this offense increased 31% compared with the 2005 figure, going up from 10.059 to 13.134 cases, which means also an upward trend in the frequency of traffic injuries per 100.000 inhabitants, going up from 22 to 28. The daily average during 2006 was 36, which means 9 more injuries per day than those recorded in the previous year. January, with 1.384 cases, recorded the highest peak while June recorded the lowest peak, with 947 cases. 21%
Avenida El Dorado No. 75 – 25 (Bogotá - Colombia) / Tel. (57) (1) 4266333 www.policia.gov.co / [email protected] / [email protected]
15
-18%

Crime Report 2006
COLOMBIAN NATIONAL POLICE ▲ DIJIN
3.697
2.946
495954
310
890483
875
0
2000
4000
M. Bogotá Santander Valle Caldas
Most affected zones
2005
2006
Police departments that recorded the highest amount of cases during 2006 were the Bogotá metropolitan area, with 2.946 cases, and a 20% decrease when comparing with the same period in the previous year, Santander province, 954 cases and a 93% increase, Valle province, 890 cases and a 187% increase, and Caldas province, 875 cases and 81% increase.
Traffic injuries by type of motor - vehicle
4082; 31%
6257; 48%
2795; 21%
Automobiles
Motorcycles
Unknown
Analyzing the amount of injuries according with the type of vehicle which caused them, the 2006 data showed that 48% of those injuries were caused by automobiles, which correspond to 6.257 cases, 21% were caused by motorcycles, which correspond to 2.795 cases and 31% of the cases did not report information about the type of vehicle.
Avenida El Dorado No. 75 – 25 (Bogotá - Colombia) / Tel. (57) (1) 4266333 www.policia.gov.co / [email protected] / [email protected]
16

Crime Report 2006
COLOMBIAN NATIONAL POLICE ▲ DIJIN
V. THEFTS National volume, trends and rates
Total thefts
6.4336.3355.783
5.0605.0935.1615.5935.7675.709
6.179 6.060 6.471
8.3787.824
7.1937.5877.394 7.6847.540
7.0077.155
8.2867.908
7.376
4000
5000
6000
7000
8000
9000
Jan Feb Mar Apr May Jun Jul Aug Sep Oct Nov Dec
2005= 69.640 2006= 91.332
During 2006, a total of 91.332 thefts were committed, reporting an increase of 31% when we compare whit the 69.640 thefts committed the previous year or 21.692 more cases. The increase in this offense was caused especially by the greater impact of thefts to persons which increased 33%, reporting 13.558 more cases when comparing with 2005 data. From Februrary to September 2006, there was an upward trend reaching the highest amount of thefts in that month (8.378). From September onwards the number of thefts started falling until December. As we can see in the chart the lowest numbers of cases were reached in January and February with 7.155 and 7.007 cases respectively.
Theft - rate per 100.000 inhabitants
91.332
69.640
51.94261.508 61.961
55.086
195
149121
140 139122
20.000
40.000
60.000
80.000
100.000
2001 2002 2003 2004 2005 20060
50
100
150
200
CasesRate per 100.000 inhabitants
Theft - rate per 100.000 inhabitants
91.332
69.640
51.94261.508 61.961
55.086
195
149121
140 139122
20.000
40.000
60.000
80.000
100.000
2001 2002 2003 2004 2005 20060
50
100
150
200
CasesRate per 100.000 inhabitants
Avenida El Dorado No. 75 – 25 (Bogotá - Colombia) / Tel. (57) (1) 4266333 www.policia.gov.co / [email protected] / [email protected]
17

Crime Report 2006
COLOMBIAN NATIONAL POLICE ▲ DIJIN
The theft-rate per 100.000 inhabitants reported an upward trend from the year 2000 until 2002 when it was 140, and remained in that level until the year 2003, starting from that time to diminish, reaching a rate of 122 in 2004. However, from 2004 onwards, there has been a continuous rise in the rate per 100.000 inhabitants which was 149 by December 31st, 2005 and went up to 195 in 2006. The daily theft average during 2006 was 256, which means, 61 more daily cases than those reported during the previous year. When comparing the 2006 data to 2002, there was an increase of 48% with 91.332 cases. During 2004 there were 55.086 thefts, 6.875 fewer cases than those recorded in
2003.
22.970 22.430
2.524
10.710
3.3916.078
0
5000
10000
15000
20000
25000
30000
Thef
ts
M. Bogotá M. Cali Cundinamarca
Most affected zones
2005
2006
Police departments that recorded the largest amount of thefts were the Metropolitan Area of Bogotá with 22.430 cases and a decrease of 2% or 540 fewer cases, when comparing them with the same period in the previous year, the Metropolitan Area of Cali with 10.710 cases and a meaningful increase of 324% and Cundinamarca province who reported 6.078 cases and an increase of 79%.
14.79720.245
13.572 16.258
41.271
54.829
0
30.000
60.000
Burglary Commercial Theft to persons
Thefts by category
2005 = 69.640
2006 = 91.332
Avenida El Dorado No. 75 – 25 (Bogotá - Colombia) / Tel. (57) (1) 4266333 www.policia.gov.co / [email protected] / [email protected]
18

Crime Report 2006
COLOMBIAN NATIONAL POLICE ▲ DIJIN
Analyzing the number of thefts by categories during 2006, the high participation of 60% corresponding to thefts to persons is indeed evident, which equals to 54.829 cases during 2006, reporting a remarkable increase of 33% comparing it with 2005 data, in which 41.271 thefts to persons were reported. Home theft increased 37% going up from 14.797 to 20.245 cases, theft to commerce increased 20% which equals to 2.686 more cases.
Total thefts and methods17%
36%3%
14%
Assault Carelessness Breaking and Entering Others
When analyzing the methods employed by the thieves in order to steal people’s property in 2006, we can notice the same pattern recorded during the previous year in which assault on persons was rated in first place, with a participation of 36% of the total thefts; the carelessness of the people was the second cause that made easier for the robbers to assault their victims (17%). The category of forcing locks was ranked in third place, with 14% participation.
Types of weapons
22%12%
1%
10%
19%
24%
Firearms
Without weapons
Knives and cutting objects
Clubs, blunt objects
Others
Unknown
Most of the thefts were committed without weapons (24%) or 21.859 cases; 19% was the percentage of participation of firearms used to carry out crimes, which equals to 17.654 thefts; 10% corresponded to knives and cutting objects, 12% corresponded to
Avenida El Dorado No. 75 – 25 (Bogotá - Colombia) / Tel. (57) (1) 4266333 www.policia.gov.co / [email protected] / [email protected]
19

Crime Report 2006
COLOMBIAN NATIONAL POLICE ▲ DIJIN
weapons such as clubs and blunt objects among others and the remaining 23% did not specify information about the type of arms used.
Burglaries by range of hour
27%
30%22%
21%
From 00 to 06
From 06 to 12.
From 12 to 18.
From 18 to 24.
ccording to the hour of occurrence of these offenses, 30% of the burglaries occurred
I. MOTOR-VEHICLE THEFTS
ational volume, trends and rates
rom 2002 to 2005 there were continuous reductions in the number of motor-vehicle
Aduring daytime, from midday until 6:00 pm. The least amount of burglaries was committed from midnight to 6:00 a.m. (21%). V N
30.22727.554
22.64018.977 19.777
0
10000
20000
30000
40000
2002 2003 2004 2005 2006
Total motor-vehicle thefts
Fthefts, falling from 30.227 cases in 2002 to 18.977 in 2005, which equals to a 37% decrease. However, the 2006 data showed a 4% increase when comparing with the 2005 figure, reaching 19.777 cases.
Avenida El Dorado No. 75 – 25 (Bogotá - Colombia) / Tel. (57) (1) 4266333 www.policia.gov.co / [email protected] / [email protected]
20

Crime Report 2006
COLOMBIAN NATIONAL POLICE ▲ DIJIN
Total motor-vehicle thefts
1.3941.5731.5131.499
1.411
1.5961.5591.6281.693
1.6811.708
1.722
1.359
1.6001.5641.6051.686
1.7891.7481.662
1.703
1.649
1.711
1.701
1.200
1.600
2.000
Jan Feb Mar Apr May Jun Jul Aug Sep Oct Nov Dec
2005= 18977 2006= 19777
When comparing statistical records we can notice that the frequency of this crime increased of 800 more cases, which indicates a variation of 4%. According to the 2006 data, from January to May, there was a slight downward trend in the number of motor-vehicle thefts, followed by increases during the next two months reaching the highest pick of the year in July with 1.789 cases. Despite this increase in July, there was a notorious downward trend in the second semester of 2006, falling to 1.359 cases by December 31st, which means 35 fewer cases compared with the figure of the previous year. The daily average during 2006 was 55, or 2 more cases per day than those reported in 2005.
5.869
4.829
2.1383.125 3.435 3.028
0
2500
5000
7500
Mot
or-v
ehic
le t
heft
s
M.Bogotá M. Cali M. Medellin
Most affected zones
2005 2006
During 2006, the metropolitan areas of Bogotá, Cali and Medellín, recorded the largest amount of motor-vehicle thefts with 4.829, 3.125 and 3.028 cases respectively.
Avenida El Dorado No. 75 – 25 (Bogotá - Colombia) / Tel. (57) (1) 4266333 www.policia.gov.co / [email protected] / [email protected]
21

Crime Report 2006
COLOMBIAN NATIONAL POLICE ▲ DIJIN
When comparing 2006 with 2005, the figures reported decreases of 18% and 12% in the metropolitan areas of Bogotá and Medellín, while there was an increase of 46% thefts in the metropolitan area of Cali of 46%. Analyzing the information by categories, there was a decrease related to auto-thefts (7%) falling from 9.961 stolen cars during 2005 to 9.246 in 2006 while the motorcycles showed a 17% increase going up from 9.016 stolen motorcycles in 2005 to 10.531 in 2006.
9.961 9.246 9.01610.531
0
4000
8000
12000
16000
Vehicles Motorcycles
Motor-vehicles theft
2005
2006
VII. HIGHWAY BANDITRY National volume, trends and rates
1.436 1.578
928713
671
0
500
1000
1500
2000
2500
2002 2003 2004 2005 2006
Highway banditry
Avenida El Dorado No. 75 – 25 (Bogotá - Colombia) / Tel. (57) (1) 4266333 www.policia.gov.co / [email protected] / [email protected]
22

Crime Report 2006
COLOMBIAN NATIONAL POLICE ▲ DIJIN
here was a decrease of 6% regarding this offense, when comparing the years 2005 nd 2006, falling from 713 cases during the first year to 671 during the second year, hich means 42 fewer cases.
ebruary reported the highest peak, 73 cases, followed by November with 72 cases. The ccurrence of highway banditry throughout the Nation in 2006 was estimated at a rate f 2 cases per day, the same figure recorded in 2005.
lthough Bogotá reported the highest number pertaining to this offense during 2006, it lso showed a significant decline of 23% while comparing with de 2005 data, which
Total highway banditry
55
74
53
54
4145
69
52
4964
88
6956
72
62
47
5649
54
63
3952
73
48
10
60
110
Jan Feb Mar Apr May Jun Jul Aug Sep Oct Nov Dec
2005= 713 2006= 671
171131
49
96
149
79
0
50
100
150
200
250
300
M. Bogotá M. Cali M. Medellín
Most affected zones highway banditry
2005
2006
Taw Foo
The roads of metropolitan areas of Bogotá, Cali and Medellín, with 131, 96 and 79 cases respectively, were the most affected zones during 2006.
Aameans 40 fewer cases. Medellín also reported a decline of 47% or 70 fewer cases while Cali reported a remarkable increase of 96% or 47 more cases.
Avenida El Dorado No. 75 – 25 (Bogotá - Colombia) / Tel. (57) (1) 4266333 www.policia.gov.co / [email protected] / [email protected]
23

Crime Report 2006
COLOMBIAN NATIONAL POLICE ▲ DIJIN
VIII. KIDNAPPINGS National volume, trends and rates
2.9862.200
1.440800
687
0
1000
2000
3000
4000
2002 2003 2004 2005 2006
Total kidnappings
The 2006 data showed a significant reduction of 77% in this crime, falling from 2.986 cases in 2002 to 687 cases in 2006.
Total kidnappings
180
3453
547567
85
5755
737894
75
3047
567576
47
5863
605655
120
Jun Jul Aug Sep Oct Nov Dec
6460
0Jan Feb Mar Apr May
This crime showed a significant decrease of 14%, which is equivalent to 113 fewer cases, with a daily average of 2 cases per day in 2006 (the same figure recorded in 2005).
During the first semester of 2006, there was an average of 59 kidnappings per montfollowed by July with the lowest number of cases (47). August and September recorded the highest number of kidnappings with 76 and 75 cases respectively. However, since September there was a favorable downward trend, falling to the lowest amount of kidnappings in December 2006, 30 cases. The rate per 100.000 inhabitants alsodecreased from 2 cases in 2005, to 1 case in 2006.
h,
Avenida El Dorado No. 75 – 25 (Bogotá - Colombia) / Tel. (57) (1) 4266333 www.policia.gov.co / [email protected] / [email protected]
24
2005= 800 2006= 687
44%
Crime Report 2006
COLOMBIAN NATIONAL POLICE ▲ DIJIN
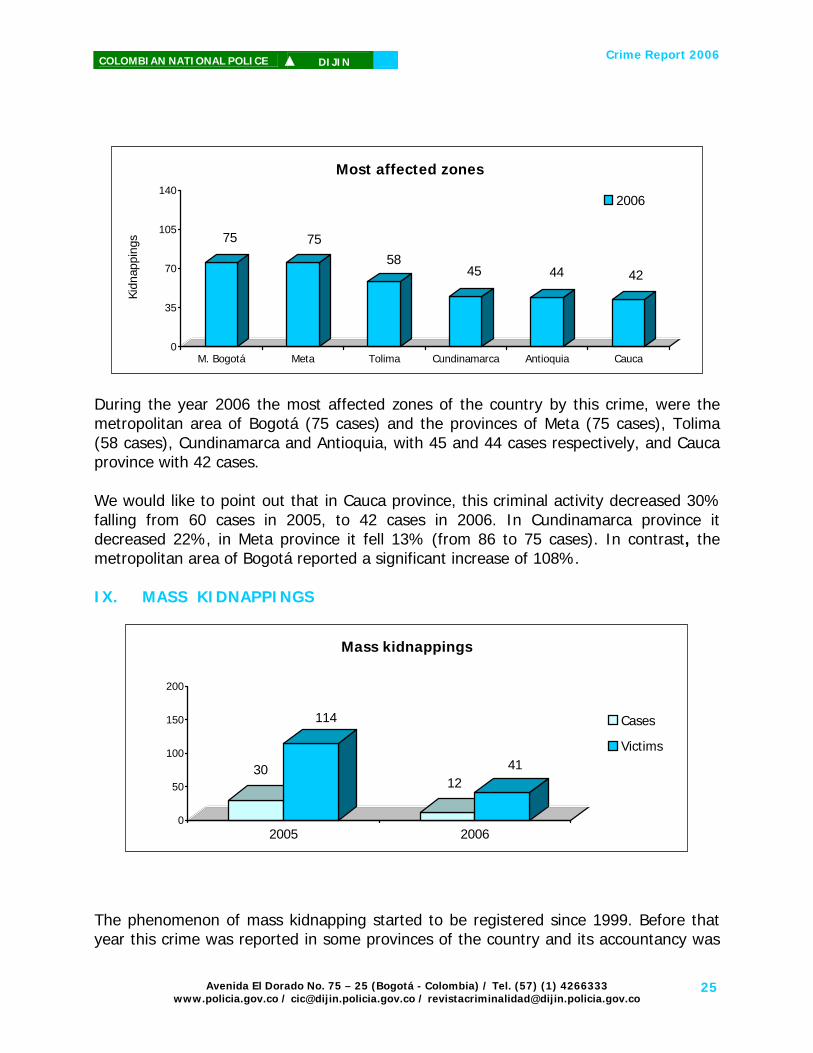
During the year 2006 the most affected zones of the country by this crime, were the metropolitan area of Bogotá (75 cases) an the provinces of Meta (75 cases), Tolima
ld like to point out that in Cauca province, this criminal activity decreased 30%
75 7558
45 44 42
0
35
70
105
140
Kidn
appi
ngs
M. Bogotá Meta Tolima Cundinamarca Antioquia Cauca
st affected zones Mo
d (58 cases), Cundinamarca and Antioquia, with 45 and 44 cases respectively, and Cauca province with 42 cases.
e wouWfalling from 60 cases in 2005, to 42 cases in 2006. In Cundinamarca province it decreased 22%, in Meta province it fell 13% (from 86 to 75 cases). In contrast, the metropolitan area of Bogotá reported a significant increase of 108%. IX. MASS KIDNAPPINGS
2006
30
114
1241
0
50
100
150
200
2005 2006
Mass kidnappings
Cases
Victims
The phenomenon of mass kidnapping started to be registered since 1999. Before that year this crime was reported in some provinces of the country and its accountancy was
Avenida El Dorado No. 75 – 25 (Bogotá - Colombia) / Tel. (57) (1) 4266333 www.policia.gov.co / [email protected] / [email protected]
25

Crime Report 2006
COLOMBIAN NATIONAL POLICE ▲ DIJIN
taken within the total kidnappings. From 1999 onwards, due to the intensity and magnitude of its occurrences, this offense started to be registered in a separate way,
aching its highest peak in 2001 and keeping a downward trend until 2006.
with t According to the figures shown in the graph, 33% of the kidnappings were committed y the FARC, (the Revolutionary Armed Forces of Colombia) 25% were attributable to ommon delinquency, 33% were committed by the subversive group ELN, (The National
re
Massive kidnappings - Offenders33%
25%33%
9%
ELN
FARC
Common Delinquency
Unknown
During 2006 there were 12 cases and 41 victims, which represents a 60% decrease inthe total number of cases and a 64% decrease in the total number of victims, compared
he previous year data.
bcLiberation Army). In 9% of the cases, there was no information about the offenders.
Avenida El Dorado No. 75 – 25 (Bogotá - Colombia) / Tel. (57) (1) 4266333 www.policia.gov.co / [email protected] / [email protected]
26

Crime Report 2006
Avenida El Dorado No. 75 – 25 (Bogotá - Colombia) / Tel. (57) (1) 4266333 www.policia.gov.co / [email protected] / [email protected]
COLOMBIAN NATIONAL POLICE ▲ DIJIN
27
Total extortion
70111
118
140
139
139149167204
174144
184
69104
134
109
150
117135156145
192160
181
80
160
240
320
Jan Feb Mar Apr May Jun Jul Aug Sep Oct Nov Dic0
2005= 1739 2006= 1652
. EXTORTION
data.
X National volume, trends and rates
This crime, which affects directly the coexistence and citizen’s safety, has recorded a decline of 5% with a difference of 87 fewer cases during 2006 compared with the 2005
A breakdown of the data by months showed that January and March reported thehighest peaks with 181 and 192 cases while November and December reported thelowest figures, with 104 and 69 cases, respectively.
In 2006 the daily average was 5 cases per day and the rate per 100.000 inhabitants was4 cases, figures that remained equal to those recorded during 2005.
2.512 2.274 2.351
1.739 1.652
0
700
1400
2100
2800
3500
2002 2003 2004 2005 2006
Extortion

Crime Report 2006
COLOMBIAN NATIONAL POLICE ▲ DIJIN
rded drops
This criminal activity recorded a 6% increase. It is a very serious phenomenon affecting gravely the State, due to the devastating effects caused to the citizen’s life and property.
During 2006, Meta provice and the metropolitan area of Bogotá, recorded the highestfrequencies of this offense, with 145 and 130 cases respectively, followed byCundinamarca and Huila provinces, with 124 cases of extortion each one. When comparing the 2006 data with 2005, Meta and Cundinamarca provinces showed increases of 8%, 114%, while the metropolitan area of Bogotá and Huila recoof 16% and 2% respectively.
XI. TERRORIST ACTIONS
National volume, trends and rates
Total terrorist actions
3230 2510
Jan Feb Mar Apr May Jun Jul Aug Sep Oct Nov Dec
54
45
67
43
46
56
4259
4760
4746
45
49
5972 73
40
8884
49
50
90
2005= 612 2006= 646
0
Exto
rti
134 145155
130
58
124 127 124
Meta M. Bogotá Cundinamarca Huila
Most affected zones
100
150
200
ons
50
2005=1.7392006=1 652
Avenida El Dorado No. 75 – 25 (Bogotá - Colombia) / Tel. (57) (1) 4266333 www.policia.gov.co / [email protected] / [email protected]
28

Crime Report 2006
COLOMBIAN NATIONAL POLICE ▲ DIJIN
The 2006 data showed an increasing trend during the first three months reaching a peak of 88 cases in March. From March onwards the figures showed irregular ups and downs, where August recorded the highest peak, 73 cases and September the lowest figure, 25 cases.
inces, with 87 and 63 cases respectively, followed by Valle province with 46 ases.
ince 2002, there has been a continuous reduction in the terrorist-actions rate per
During 2006, the largest amount of terrorist actions occurred in Norte de Santander and Meta provc Norte de Santander was the most affected province by this scourge during 2006 reporting an increment of 64% compared with the 2005 data, which means 34 more cases; in the same way Meta and Valle showed increases of 17% and 109% respectively.
Total terrorist actions and rate per 100,000 inhabitants
646612724
1.257
1.645
1.172
1.549
23
4
3
4
11
900
1.800
2
4
6
02000 2001 2002 2003 2004 2005 2006
0
CasesRate per 100.000 inhabitants
Total terrorist actions and rate per 100,000 inhabitants
646612724
1.257
1.645
1.172
1.549
11
23
4
3
4900
1.800
2
4
6
02000 2001 2002 2003 2004 2005 2006
0
CasesRate per 100.000 inhabitants
53
87
5463
22
46
0
25
50
75
100
Case
s
Nte. Santander Meta Valle
Most affected zones
20052006
S100.000 inhabitants which has dropped from 4 cases in 2002 to 1 case in 2006. When comparing the 2002 with 2006 data, there has been a significant reduction of 61% in this crime, falling from 1.645 cases in the first year to 646 cases in 2006.
Avenida El Dorado No. 75 – 25 (Bogotá - Colombia) / Tel. (57) (1) 4266333 www.policia.gov.co / [email protected] / [email protected]
29

Crime Report 2006
COLOMBIAN NATIONAL POLICE ▲ DIJIN
35
126
273
12
0
100
200
300
Oil Pipelines Energy Towers Vehicles Bridges
Destroyed infraestructure by terrorism
2006
The most affected assets by terrorist actions were vehicles and energy towers, followed by oil pipelines and bridges, since the armed groups have recorded a historic trend to attack international and local petroleum companies. These terrorist actions caused reparable losses of human lives and a significant monetary cost for the economy of the
countr
e terrorist actions are attributable to the armed group FARC, which accounts r 466 terrorist actions. The common delinquency, the ELN guerrilla group and the self-
defense groups committed 6%, 2% and 1% of the terrorist actions throughout the nation, respectively.
iry.
Terrorist actions -offenders
1%
2%
6%
72%
19%
Analyzing the information related to the offenders of this crime, the figures showed that 72% of th
FARC
Common Delinquency
ELN
Self-Defenses
Unknown
fo
Avenida El Dorado No. 75 – 25 (Bogotá - Colombia) / Tel. (57) (1) 4266333 www.policia.gov.co / [email protected] / [email protected]
30

Crime Report 2006
COLOMBIAN NATIONAL POLICE ▲ DIJIN
XII. SUBVERSIVE ACTIONS National volume, trends and rates
. From August onwards, there was a downward trend reaching the west number of subversive actions during November and December with 4 cases each
Total subversive actions
812
2222
22
212016
34
15
28 31
4
64
10
30
11918
129
28 26
0
20
40
Jan Feb Mar Apr May Jun Jul Aug Sep Oct Nov Dec
2005= 268 2006= 167
This criminal activity reported a 38% decrease or 101 fewer cases, when comparing the two years object of this study. However, when evaluating the monthly variations during 2006, the highest peaks were recorded in February, March and August, with 28, 26 and 30 cases, respectivelylomonth.
When comparing the 2002 data with 2003, the statistics showed an increase of 23% or 82 more cases. However, this trend changed from that year falling from 439 subversive actions to 218 in 2004, 195 in 2005 and 118 subversive actions in 2006.
357
439
218 195
118
0
100
200
300
400
500
2002 2003 2004 2005 2006
Total subversive actions
Avenida El Dorado No. 75 – 25 (Bogotá - Colombia) / Tel. (57) (1) 4266333 www.policia.gov.co / [email protected] / [email protected]
31

Crime Report 2006
COLOMBIAN NATIONAL POLICE ▲ DIJIN
In 2006, Nariño province recorded the largest number of subversive actions, with 28 cases, followed by Meta, Caquetá and Cauca provinces with 25, 18 and 10 cases
decrease in the frequency of this offense
27 28
8
25
4
18
25
10
0
20
40
Nariño Meta Caqueta Cauca
Most affected zones by subversive actions
2005
2006
respectively. Cauca province reported a 60% falling from 25 subversive actions to 10.
Subversive actions - Offenders
1%
99%
FARC
ELN
The 2006 data showed that 99% of the subversive actions were committed by the armed group FARC (the Revolutionary Armed Forces of Colombia) and 1% of the actions were committed by the ELN (the National Liberation Army).
Avenida El Dorado No. 75 – 25 (Bogotá - Colombia) / Tel. (57) (1) 4266333 www.policia.gov.co / [email protected] / [email protected]
32

Crime Report 2006
COLOMBIAN NATIONAL POLICE ▲ DIJIN
COLOMBIAN NATIONAL POLICE OPERATIONAL ACHIEVEMENTS
2005 2006 ABSOLUTE PERCENTAGE
342.031 270.025 -72.006 -21%
CAPTURED 2.509 2.306 -203 -8%
KILLED IN ACTION 63 48 -15 -24% SUBMITTED 224 202 -22 -10%
CAPTURED 1.903 747 -1.156 -61%
KILLED IN ACTION 26 7SELF-DEFENSE
-19 -73%
SUBMITTED 940 50 -890 -95%
143 111 -32 -22%
CARS 15.666 10.637 -5.029 -32%
VALUE IN MILLION PESOS 447.000 359.781 -87.219 -20%
MOTORCYCLES 13.603 10.215 -3.388 -25%
RECOVERED 627.013 526.858 -100.155 -16%
SEIZED 1.261.568 2.062.328 800.760 63%
74.581 70.047 -4.534 -6%
COCAINE 74.417 51.567 -22.850 -31%
MARIHUANA 92.423 89.040 -3.383 -4%
COCA BASE 19.803 33.026 13.223 67%
HEROIN 722 424 -298 -41%
POPPY 2.129 1.972 -157 -7%
COCA 172.943 213.480 40.537 23%
OPERATIVE ACHIEVEMENTSYEAR VARIATION
ARRESTS (FOR ALL CRIMES)
GUERRILLA
MEMBERS
ILLICIT DRUG SEIZURES
(KILOGRAMS)
HECTARES SPRAYED OR MANUALLY
ERADICATED
KIDNAPPED PEOPLE RESCUED
RECOVERED MOTOR-VEHICLES
MERCHANDISE (VALUE IN MILLION
PESOS)
FIREARMS SEIZED
VALUE IN MILLION PESOS 40.634 32.604 -8.030 -20%
Avenida El Dorado No. 75 – 25 (Bogotá - Colombia) / Tel. (57) (1) 4266333 www.policia.gov.co / [email protected] / [email protected]
33
Crime Report 2006
COLOMBIAN NATIONAL POLICE ▲ DIJIN
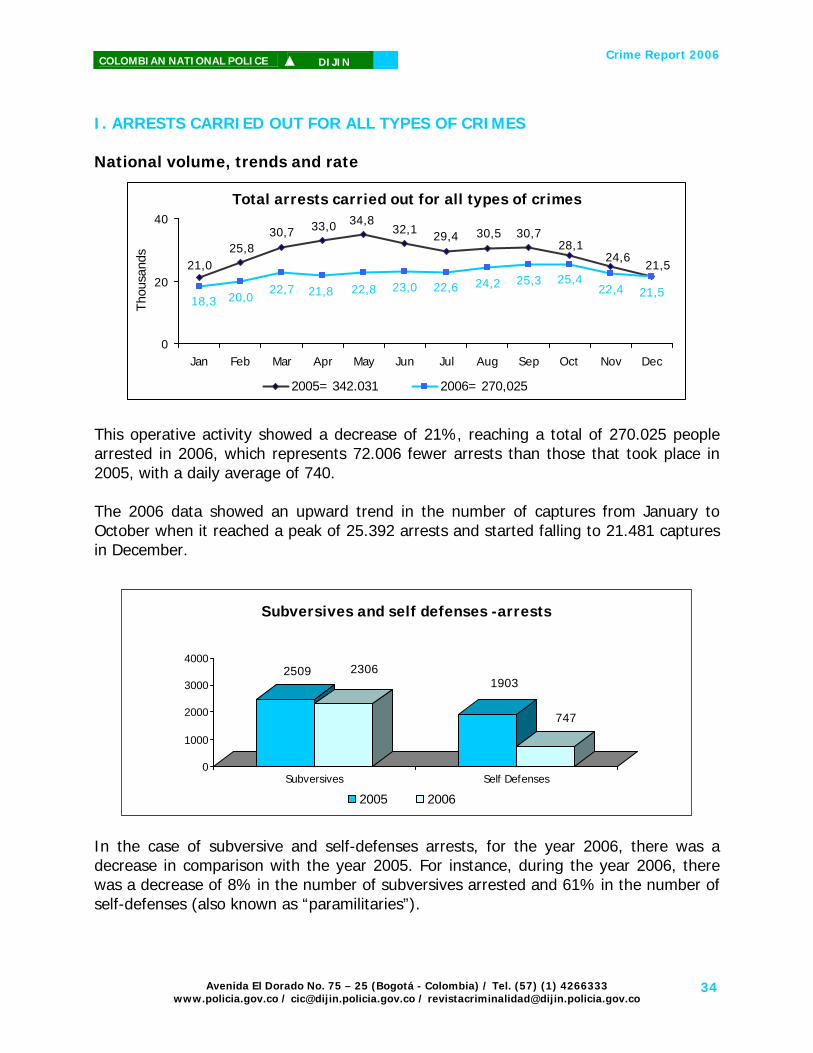
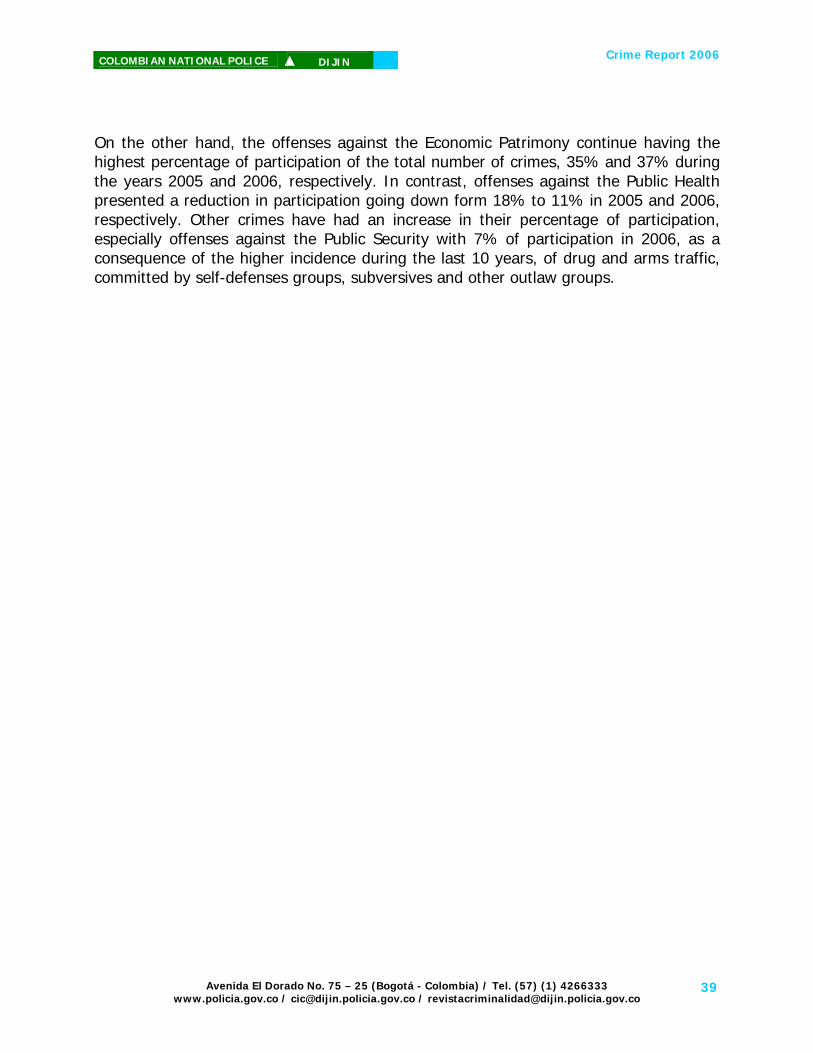
I. ARRESTS CARRIED OUT FOR ALL TYPES OF CRIMES
ational volume, trends and rate
his operative activity showed a decrease of 21%, reaching a total of 270.025 people rrested in 2006, which represents 72.006 fewer arrests than those that took place in 005, with a daily average of 740.
he 2006 data showed an upward trend in the number of captures from January to ctober when it reached a peak of 25.392 arrests and started falling to 21.481 captures December.
the case of subversive and self-defenses arrests, for the year 2006, there was a
ecrease in comparison with the year 2005. For instance, during the year 2006, there nd 61% in the number of
N
2509 23061903
747
0
1000
2000
3000
4000
Subversives Self Defenses
Subversives and self defenses -arrests
2005 2006
Total arrests carried out for all types of crimes
21,524,6
28,130,730,529,432,1
34,833,0
21,025,8
30,7
21,522,425,425,324,222,623,022,821,8
18,3 20,022,7
0
20
40
Jan Feb Mar Apr May Jun Jul Aug Sep Oct Nov Dec
Thou
sand
s
2005= 342.031 2006= 270,025
Ta2 TOin
Indwas a decrease of 8% in the number of subversives arrested aelf-defenses (also known as “paramilitaries”). s
Avenida El Dorado No. 75 – 25 (Bogotá - Colombia) / Tel. (57) (1) 4266333 www.policia.gov.co / [email protected] / [email protected]
34

Crime Report 2006
COLOMBIAN NATIONAL POLICE ▲ DIJIN
II. RECOVERED AND SEIZED MERCHANDISE
field of seized merchandise show a positive trend ith a significant increase of 63% when comparing the years 2005 and 2006. Regarding
RED MOTOR-VEHICLES
s a monthly average of 920 recovered ehicles. From September onwards there was a downward trend, falling from 933
recovered vehicles to 700 in November and 802 in December.
627.013 526.858
1.261.568
2.062.328
0
1.200.000
2.400.000
Recovered Seized
The operative achievements in the
Merchandise (million Pesos)
2005
2006
wrecovered merchandise, there was a drop of 16% in the value of recovered goods. III. RECOVE
957818
1.189
1.4501.3731.295
1.5011.5641.614
997
1.3251.583
802700852933932925978852904836 943 980
0
300
600
900
1200
1500
1800
Jan Feb Mar Apr May Jun Jul Aug Sep Oct Nov Dec
Hun
dred
s
2005= 15.666 2006= 10.637 -
The 2006 data showed a 32% decrease in this operative activity, which means 5.029 fewer recovered vehicles than those recovered in 2005. During the first nine months of 2006, there wav
Avenida El Dorado No. 75 – 25 (Bogotá - Colombia) / Tel. (57) (1) 4266333 www.policia.gov.co / [email protected] / [email protected]
35

Crime Report 2006
COLOMBIAN NATIONAL POLICE ▲ DIJIN
4.333
2.9322.404
1.5852.251
1.424995 738 788 593
0
2.000
4.000
6.000
Chevrolet Mazda Renault Toyota Ford
Recovered cars classified by manufacturers
2005
2006
than d place, Mazda and Renault recorded a total of 1.585
followed by Toyota and Ford, with a articipation of 7% and 6%, also 738 and 593 recovered cars, respectively.
dels from 1990 to 1999, followed by models from 2000 to 2007. There was a fewer participation of older recovered cars whose models were rated from 1950 and 1979.
Analyzing the statistics by car manufacturers, 28% of the recovered cars during the last two years have been Chevrolet, with a total of 2.932 cars during 2006, 1.401 less those recovered in 2005; in seconand 1.424 recovered cars, respectively,p
Recovered cars classified by model
15%33%
4%
1950 to 1979
1980 to 1989
1990 to 1999
2000 to 2007
17%
11%
2
Most of the recovered cars during 2006 corresponded to mo
Unkwnown
Avenida El Dorado No. 75 – 25 (Bogotá - Colombia) / Tel. (57) (1) 4266333 www.policia.gov.co / [email protected] / [email protected]
36

Crime Report 2006
COLOMBIAN NATIONAL POLICE ▲ DIJIN
IV. ILLICIT DRUG SEIZURES
Colombian olice. This represents an increase of 67% in contrast with the 2005 data.
. EXPROPRIATION
milar in the case of the oods under investigation by the judiciary, which experienced an increase of 4%.
19.803
30.026
0
20000
40000
KILO
GRAM
S
Coca base
Seized cocaine
2005
2006
Since drug trafficking is the most important source of funding for the guerrillas, the Antinarcotics Police has done a significant work in this field to tackle the organized crime based on this illegal activity. During the year 2006, 30.026 kilograms of coca base were seized by theP V
4.387 4.560
1.657
2.721
0
2.000
4.000
6.000
Implicated Goods Seized Goods
Expropriation
2005
2006
The Colombian National Police is also developing intensive operations in the field of expropriations. For instance, comparing the years 2005 and 2006, the sharp increase of 64% in the number of seized goods is obvious. This trend is sig
Avenida El Dorado No. 75 – 25 (Bogotá - Colombia) / Tel. (57) (1) 4266333 www.policia.gov.co / [email protected] / [email protected]
37

Crime Report 2006
COLOMBIAN NATIONAL POLICE ▲ DIJIN
CHANGES IN THE CRIMINALITY COMPOSITION
Criminality composition in the 90´s
47%
11%
42%
Property Crimes
Violent Crimes
Other Crimes
Criminality composition 2006
37%
19%11%
21%
7%5%
Property Crime
Violent Crime
Public Health (Drug Trade)
Public Security
Copyright's Owner
Others
OFFENSES 2004 % 2005 % 2006 % Violent crime 69.209 23% 62.621 19% 81.359 21% Property crime 116.173 38% 117.241 35% 142.549 37% Against The Public Security* (includes Firearms Traffic) 19.703 6% 19.874 6% 25.060 7%
Against Copyright’s owner 10.498 3% 19.227 6% 18.633 5% Against The Public Health (Especially drug trade) 48.423 16% 61.269 18% 44.006 11%
Others 43.761 14% 53.834 16% 72.268 19% TOTAL 307.767 100% 334.066 100% 383.875 100%
The figures in the previous charts, showed a significant change in the criminality composition, with a reduction in the percentage of violent crimes, falling from 42% in the 90´s, to 23%, 19% and 21% in 2004, 2005 and 2006 respectively.
Avenida El Dorado No. 75 – 25 (Bogotá - Colombia) / Tel. (57) (1) 4266333 www.policia.gov.co / [email protected] / [email protected]
38
Crime Report 2006
COLOMBIAN NATIONAL POLICE ▲ DIJIN
n the other hand, the offenses against the Economic Patrimony continue having the
highest percentage of participation of the total number of crimes, 35% and 37% during the years 2005 and 2006, respectively. In contrast, offenses against the Public Health presented a reduction in participation going down form 18% to 11% in 2005 and 2006, respectively. Other crimes have had an increase in their percentage of participation, especially offenses against the Public Security with 7% of participation in 2006, as a consequence of the higher incidence during the last 10 years, of drug and arms traffic, committed by self-defenses groups, subversives and other outlaw groups.
O
Avenida El Dorado No. 75 – 25 (Bogotá - Colombia) / Tel. (57) (1) 4266333 www.policia.gov.co / [email protected] / [email protected]
39

Crime Report 2006
COLOMBIAN NATIONAL POLICE ▲ DIJIN
CONCLUSIONS
per 100.000 inhabitants, which had never been achieved before during the last 25 years, which equals to 17.479 cases. In 1981, the same rate of 2005 was recorded. However, the total number of cases reached 10.805 and the population at that time was of 29’080.0000 inhabitants. While the colombian population grew 58%, the homicides rate remained constant.
The favorable 3% reduction in the total homicides when comparing the 2006
data to 2005 equals to 632 less. However, this figure is more relevant when comparing the 2006 data with 2002, corresponding to a 39% decrease or 11.358 fewer homicides, falling from 28.837 in 2002, to 17.479 occurrences in 2006.
The amount of 28.837 homicides could be compared with the population of
municipalities such as Abejorral (Antioquia), San Jacinto (Bolívar), Paipa (Boyacá), Salamina (Caldas) or La Calera (Cundinamarca), which would represent the extinction of those regions of the country.
Auto-thefts recorded a 7% decrease, falling from 9.961 cases in 2005 to 9.246
reported in 2006, but we must point out the 47% reduction in this offense, when comparing the 17.303 motor-vehicle thefts occurred in 2002 with the cases recorded in 2006. This achievement has been possible as a consequence of the increment in the number of municipalities protected by the National Police throughout the country, as well as the preventive and control actions taken against this crime.
During 2006, there were 42 fewer cases of highway banditry, which equals to a
6% reduction when comparing it with the 2005 data. The importance of this figure is noticeable when comparing the 1.436 cases reported in 2002 (765 more cases than those in 2006), this represents a remarkable decline of 53% regarding this offense.
It is important to stress the fact that during the last five years the total cases of
kidnappings decreased 77%, while comparing the 2002 data with 2.986 cases to 687 cases in 2006.
SOCIAL IMPACT OFFENSES COMPARISON
This report shows an important success on violence reduction achieved by Colombian National Police, as follows:
In 2006 Colombia reached the lowest homicide rate of 37 cases
Avenida El Dorado No. 75 – 25 (Bogotá - Colombia) / Tel. (57) (1) 4266333 www.policia.gov.co / [email protected] / [email protected]
40

Crime Report 2006
COLOMBIAN NATIONAL POLICE ▲ DIJIN
These achievements have nks to the current Democratic Defense and Security Police, and have created a favorable climate for foreign investment in Colombia.
In regard to extortion, this crime also recorded a 5% reduction or 87 fewer cases w n
Although the terrorist actions recorded a 6% increase or 34 more cases than those
odataa 61
COLO Illicit Drug Seizures: It is important to emphasize about the Police efforts oriented
theinc
There were a total of 270.025 arrests carried out by the Police for all crimes.
Sei
An e National Police, after having 168
unicipalities without police presence in 2002, the goal of covering the total area of
The
hecyeaequ
Colombian National Police (CNP) is also developing intensive operations in the field
64%treexp
been reached tha
he comparing to the 2005 data.
ccurred in 2005, the statistics become really significant when comparing the 2002 with 1.645 cases of terrorism, to the 2006 data, with 646 cases, corresponding to % decrease.
MBIAN NATIONAL POLICE OPERATIONAL ACHIEVEMENTS
towards the fight against drug trafficking, which have led to significant increments in amount of illicit drugs seized, when comparing the years 2005 and 2006, rements as 67% for coca base.
zed merchandise reported a significant 63% rise.
increment in the national zones protected by thmthe nation was reached.
reduction of 23% in illegal coca crops during 2006, which equals to 40.537 tares. This an important accomplishment if we take into account the fact that six rs ago, in 2000, there were 160.000 hectares used for illegal crops, amount that als to the area of Bogotá, D.C; this means, 1.600 square kilometers.
of expropriations. For instance, comparing the years 2005 and 2006, the increase of in the number of seized goods is obviously a demonstration of its effort. This
nd is similar in the case of the goods under investigation by the judiciary which erienced an increase of 4%.
Avenida El Dorado No. 75 – 25 (Bogotá - Colombia) / Tel. (57) (1) 4266333 www.policia.gov.co / [email protected] / [email protected]
41
Crime Report 2006
Avenida El Dorado No. 75 – 25 (Bogotá - Colombia) / Tel. (57) (1) 4266333 www.policia.gov.co / [email protected] / [email protected]
COLOMBIAN NATIONAL POLICE ▲ DIJIN
1
TABLE 1. SOCIAL IMPACT OFFENCES COMPARISON 2005 - 2006
2005
18.111
48
252
3.889
30.403
10.059
14.797
13.572
41.271
69.640
9.961
9.016
18.977
713
91
800
30
114
612
1.739
268
155.302
YEA
2 OL % W LY 00 2006
1 632 % 37 9%
11 3% 0 0%
59 3% 0 0%
4 168 % 9 2%
.09 % 99 24%
13.13 .075 % 28 7%
20.24 .448 % 43 10%
CO 16.25 .686 % 29 35 8%
PER 54.82 .55 % 90 117 28%
TO 91.332 .69 % 151 195 47%
AU 9.246 715 % 22 20 5%
MO 10.53 .515 % 20 23 5%
TO 19.777 00 % 41 42 10%
671 42 % 2 1 0%
92 1 % 0 0 0%
687 113 4% 2 1 0%
CAS 12 18 0% 0 0 0%
VIC 41 73 4% 0 0 0%
646 34 % 12 1 1 0%
1.652 87 % 32 4 4 1%
167 101 -38% 3 1 0 0%
TOTAL SOCIAL IMPACT OFFEN 196.19 .888 26% 3.773 337 419 100%
ER 0 N
PERCENTAGE OF IPATION
THEFT
TERRORIST ACTIONS
OFR AT
MURDER
HIGHWAY BADITRY
BANK ROBBERY
EXTORTION
SUBVERSIVE ACTIONS
20 ER
HURTO DE VEHÍCULOS
KIDNAPPING
MASSIVE KIDNAPPING
MASSIVE MURDERS
TRAFFIC FATALITIES
PERSONAL INJURIES
TRAFFIC INJURIES
6 2005
12%
0%
0%
3%
20%
6%
10%
9%
27%
45%
6%
6%
12%
0%
0%
1%
0%
0%
0%
1%
0%
100%
TSPARTIC
2005 2
39
0
1
8
66
22
32
RATE P100.00
INHABITA
EEK
336
1
4
78
894
253
389
313
1.054
1.756
178
203
380
13
2
13
0
1
06 AV
DAILY HOUR
48 2
0 0
1 0
11 0
127 5
36 1
55 2
45 2
150 6
250 10
25 1
29 1
54 2
2 0
0 0
2 0
0 0
0 0
2 0
5 0
0 0
538 22
AGES
MONTHLY
1.457
3
16
338
3.875
1.095
1.687
1.355
4.569
7.611
771
878
1.648
56
8
57
1
3
54
138
14
16.349
-3
-2
-2
4
53
31
37
20
33
31
-7
17
4
-6
1
-1
-6
-6
6
-5
ION
UTE
3
8
2
VARI
006 ABS
7.479 -
37 -
193 -
.057
46.496 16
4 3
5 5
8 2
9 13
21
-
1 1
8
-
-
-
-
-
-
0 40
CASES
VICTIMS
BURGLARY
MMERCIAL
SONAL
TAL
TOMOBILES
TORCYCLES
TAL
ES
TIMS
CES
FENCE

Crime Report 2006
COLOMBIAN NATIONAL POLICE ▲ DIJIN
TABLE 2. MURDERS
AMAZONAS 3 0 1 0 0 1 0 0 2 3 0 1 11 13 -15% 13 0,06% 81.758ANTIOQUIA 94 77 64 73 64 52 69 76 59 66 78 73 845 948 -11% 44 4,83% 1.931.837ARAUCA 9 16 15 15 14 4 14 33 13 23 12 18 186 277 -33% 64 1,06% 292.540ATLÁNTICO 50 46 36 53 41 46 70 66 56 53 49 43 609 637 -4% 25 3,48% 2.408.194BOLÍVAR 29 42 39 32 26 40 44 43 37 35 41 40 448 392 14% 21 2,56% 2.116.932BOYACÁ 14 14 12 14 10 12 13 5 17 10 14 16 151 171 -12% 11 0,86% 1.390.276CALDAS 51 53 50 49 36 41 57 52 52 58 55 57 611 696 -12% 51 3,50% 1.191.027CAQUETÁ 34 27 51 52 32 34 24 39 38 48 48 38 465 405 15% 98 2,66% 472.423CAUCA 55 35 41 43 36 44 59 38 46 39 31 72 539 526 2% 42 3,08% 1.289.040CASANARE 12 11 13 18 10 10 16 25 13 21 13 23 185 190 -3% 56 1,06% 330.528CESAR 27 10 21 24 13 21 23 20 19 19 26 26 249 374 -33% 23 1,42% 1.069.755CÓRDOBA 19 12 19 13 15 32 15 18 25 17 47 32 264 176 50% 18 1,51% 1.464.772CUNDINAMARCA 48 26 25 33 22 25 33 35 54 42 42 48 433 427 1% 18 2,48% 2.402.356CHOCÓ 8 7 19 9 6 6 5 11 4 4 7 5 91 115 -21% 24 0,52% 386.705GUAJIRA 44 24 24 37 19 28 20 28 18 21 31 13 307 315 -3% 57 1,76% 534.457GUAINÍA 1 0 0 0 1 2 0 1 0 0 2 0 7 11 -36% 16 0,04% 43.876GUAVIARE 12 13 6 9 29 14 6 10 5 9 10 4 127 174 -27% 61 0,73% 208.832MAGDALENA 39 27 22 27 26 36 32 23 35 37 38 55 397 427 -7% 28 2,27% 1.428.333MAGDALENA MEDIO 15 14 17 23 13 30 19 24 21 15 21 18 230 261 -12% 44 1,32% 527.465META 84 64 58 52 57 62 56 40 48 64 58 80 723 508 42% 97 4,14% 745.410NARIÑO 72 63 57 53 81 73 84 63 58 75 45 73 797 738 8% 44 4,56% 1.804.020NORTE DE SANTANDER 48 47 44 77 59 70 86 79 83 74 87 69 823 786 5% 54 4,71% 1.517.817PUTUMAYO 39 26 36 29 29 30 34 34 31 32 33 31 384 404 -5% 100 2,20% 384.772QUINDÍO 19 24 19 32 20 21 24 28 17 22 24 22 272 302 -10% 44 1,56% 622.395RISARALDA 69 65 78 71 60 62 61 67 51 84 61 69 798 915 -13% 77 4,57% 1.041.735SANTANDER 29 41 41 32 40 29 50 26 29 36 43 45 441 365 21% 24 2,52% 1.847.582SAN ANDRÉS 0 0 0 1 1 1 1 2 0 1 0 1 8 7 14% 9 0,05% 84.720SUCRE 11 11 10 16 10 9 14 11 12 16 14 6 140 151 -7% 16 0,80% 883.962TOLIMA 25 30 29 40 48 38 26 15 21 32 25 29 358 370 -3% 27 2,05% 1.312.344HUILA 26 38 32 32 23 34 30 26 32 42 45 38 398 404 -1% 39 2,28% 1.012.356URABÁ 18 22 16 7 7 9 25 22 16 28 16 20 206 234 -12% 40 1,18% 517.686VALLE 158 142 177 125 130 160 135 144 156 118 143 151 1.739 1.786 -3% 86 9,95% 2.013.860VICHADA 1 6 10 8 14 3 2 2 1 2 0 2 51 2 2450% 52 0,29% 97.656METROPOLITAN BOGOTÁ 108 97 116 123 107 110 127 114 107 116 109 138 1.372 1.669 -18% 19 7,85% 7.299.374METROPOLITAN CALI 132 100 136 133 164 132 155 155 130 150 164 175 1.726 1.774 -3% 64 9,87% 2.697.267METROPOLITAN MEDELLÍN 89 80 91 95 72 83 100 107 93 86 82 110 1.088 1.161 -6% 33 6,22% 3.318.225
TOTAL 1.492 1.310 1.425 1.450 1.335 1.404 1.529 1.482 1.399 1.498 1.514 1.641 17.479 18.111 -3% 37 100,00% 46.772.286* THE INFORMATION RELATED TO VAUPÉS POLICE DEPARTMENT OFFENCES AND POPULATION IS INCLUDED IN THE GUAVIARE POLICE DEPARTMENT DATA BASE
DEC
EMB
ER
PO
PU
LATI
ON
2
00
6
TOTA
L 2
00
6
RA
TE P
ER
10
0.0
00
IN
HA
BIT
AN
TS
20
06
PA
RTI
CIP
ATI
ON
2
00
6
AU
GU
ST
SEP
TEM
BER
OC
TOB
ER
NO
VEN
BER
POLICE DEPARTMENT
TOTA
L 2
00
5
PER
CEN
TAG
E V
AR
IATI
ON
2
00
6-2
00
5
JAN
UA
RY
FEB
RU
AR
Y
MA
RC
H
AP
RIL
MA
Y
JULY
JUN
E
Avenida El Dorado No. 75 – 25 (Bogotá - Colombia) / Tel. (57) (1) 4266333 www.policia.gov.co / [email protected] / [email protected]
1

Crime Report 2006
Avenida El Dorado No. 75 – 25 (Bogotá - Colombia) / Tel. (57) (1) 4266333 www.policia.gov.co / [email protected] / [email protected]
COLOMBIAN NATIONAL POLICE ▲ DIJIN
TABLE 3. MASSIVE MURDERS
POLICE DEPARTMENT DATA
JAN
UAR
Y
FEBR
UAR
Y
MAR
CH
APR
IL
MAY
JUN
E
JULY
AU
GU
ST
SEPTE
MBER
OCTO
BER
NO
VEN
BER
DEC
EMBER
TOTA
L 2006
TOTA
L 2005
PER
CEN
TAG
E
VAR
IATI
ON
2006-2
005
CASES 0 0 0 0 0 0 0 0 0 0 0 0 0 0 0%
VICTIMS 0 0 0 0 0 0 0 0 0 0 0 0 0 0 0%
CASES 1 1 0 0 0 0 0 1 0 0 1 0 4 2 100%
VICTIMS 5 6 0 0 0 0 0 6 0 0 4 0 21 21 0%
CASES 0 0 0 0 0 0 0 0 0 0 0 0 0 0 0%
VICTIMS 0 0 0 0 0 0 0 0 0 0 0 0 0 0 0%
CASES 0 0 0 0 0 0 0 0 0 0 0 0 0 0 0%
VICTIMS 0 0 0 0 0 0 0 0 0 0 0 0 0 0 0%
CASES 0 0 1 0 0 0 0 0 0 0 0 0 1 0 100%
VICTIMS 0 0 5 0 0 0 0 0 0 0 0 0 5 0 100%
CASES 0 0 0 0 0 0 0 0 0 0 0 0 0 0 0%
VICTIMS 0 0 0 0 0 0 0 0 0 0 0 0 0 0 0%
CASES 0 0 0 0 0 0 0 0 0 0 0 0 0 1 -100%
VICTIMS 0 0 0 0 0 0 0 0 0 0 0 0 0 4 -100%
CASES 0 1 0 0 0 0 0 0 0 0 0 0 1 2 -50%
VICTIMS 0 9 0 0 0 0 0 0 0 0 0 0 9 12 -25%
CASES 0 0 0 0 0 0 0 0 0 0 0 0 0 3 -100%
VICTIMS 0 0 0 0 0 0 0 0 0 0 0 0 0 15 -100%
CASES 0 0 0 0 0 0 0 0 0 0 0 0 0 1 -100%
VICTIMS 0 0 0 0 0 0 0 0 0 0 0 0 0 4 -100%
CASES 0 0 0 0 0 0 0 0 0 0 0 0 0 1 -100%
VICTIMS 0 0 0 0 0 0 0 0 0 0 0 0 0 4 -100%
CASES 0 0 0 0 0 1 0 0 1 0 0 0 2 0 100%
VICTIMS 0 0 0 0 0 5 0 0 4 0 0 0 9 0 100%
CASES 0 0 0 0 0 0 0 0 0 0 0 0 0 2 -100%
VICTIMS 0 0 0 0 0 0 0 0 0 0 0 0 0 8 -100%
CASES 0 0 0 0 0 0 0 0 0 0 0 0 0 0 0%
VICTIMS 0 0 0 0 0 0 0 0 0 0 0 0 0 0 0%
CASES 0 0 0 0 0 0 0 0 0 0 0 0 0 2 -100%
VICTIMS 0 0 0 0 0 0 0 0 0 0 0 0 0 13 -100%
CASES 0 0 0 0 0 0 0 0 0 0 0 0 0 0 0%
VICTIMS 0 0 0 0 0 0 0 0 0 0 0 0 0 0 0%
CASES 1 0 0 0 0 0 0 0 0 0 0 0 1 0 100%
VICTIMS 4 0 0 0 0 0 0 0 0 0 0 0 4 0 100%
CASES 1 0 0 0 0 0 0 0 0 0 0 0 1 0 100%
VICTIMS 4 0 0 0 0 0 0 0 0 0 0 0 4 0 100%
CASES 0 0 0 0 0 1 0 0 0 0 0 0 1 1 0%
VICTIMS 0 0 0 0 0 6 0 0 0 0 0 0 6 4 50%
CASES 0 0 0 0 1 0 0 0 1 1 1 0 4 1 300%
VICTIMS 0 0 0 0 4 0 0 0 4 6 4 0 18 4 350%
CASES 0 0 0 1 1 2 0 1 0 1 0 0 6 5 20%
VICTIMS 0 0 0 4 5 14 0 5 0 4 0 0 32 24 33%
CASES 0 0 0 0 0 0 0 0 0 0 0 0 0 2 -100%
VICTIMS 0 0 0 0 0 0 0 0 0 0 0 0 0 9 -100%
CASES 0 0 0 0 0 0 0 0 0 0 0 0 0 1 -100%
VICTIMS 0 0 0 0 0 0 0 0 0 0 0 0 0 4 -100%
CASES 0 0 0 0 0 0 0 0 0 0 0 0 0 0 0%
VICTIMS 0 0 0 0 0 0 0 0 0 0 0 0 0 0 0%
CASES 0 0 0 0 0 0 0 1 0 0 0 0 1 0 100%
VICTIMS 0 0 0 0 0 0 0 4 0 0 0 0 4 0 100%
CASES 0 0 0 0 1 0 0 0 0 0 0 1 2 0 100%
VICTIMS 0 0 0 0 6 0 0 0 0 0 0 4 10 0 100%
CASES 0 0 0 0 0 0 0 0 0 0 0 0 0 0 0%
VICTIMS 0 0 0 0 0 0 0 0 0 0 0 0 0 0 0%
CASES 0 0 0 0 0 0 0 0 0 0 0 0 0 0 0%
VICTIMS 0 0 0 0 0 0 0 0 0 0 0 0 0 0 0%
CASES 0 0 0 0 0 0 0 0 0 0 0 0 0 0 0%
VICTIMS 0 0 0 0 0 0 0 0 0 0 0 0 0 0 0%
CASES 0 1 0 0 1 0 0 0 0 0 0 0 2 3 -33%
VICTIMS 0 9 0 0 4 0 0 0 0 0 0 0 13 13 0%
CASES 0 0 0 0 0 0 2 0 0 0 0 0 2 1 100%
VICTIMS 0 0 0 0 0 0 17 0 0 0 0 0 17 5 240%
CASES 0 1 1 1 0 0 3 0 0 0 0 0 6 15 -60%
VICTIMS 0 4 4 4 0 0 15 0 0 0 0 0 27 87 -69%
CASES 0 0 0 0 0 0 0 0 0 0 0 0 0 0 0%
VICTIMS 0 0 0 0 0 0 0 0 0 0 0 0 0 0 0%
METROPOLITAN CASES 0 1 0 0 0 0 0 0 0 0 0 0 1 3 -67%
BOGOTA VICTIMS 0 6 0 0 0 0 0 0 0 0 0 0 6 13 -54%
METROPOLITAN CASES 0 0 0 0 0 0 0 0 0 0 0 0 0 1 -100%
CALI VICTIMS 0 0 0 0 0 0 0 0 0 0 0 0 0 4 -100%
METROPOLITAN CASES 0 0 0 0 1 1 0 0 0 0 0 0 2 1 100%
MEDELLIN VICTIMS 0 0 0 0 4 4 0 0 0 0 0 0 8 4 100%
3 5 2 2 5 5 5 3 2 2 2 1 37 48 -23%
13 34 9 8 23 29 32 15 8 10 8 4 193 252 -23%ONE CASE PER EACH 4 OR MORE VICTIMS
PUTUMAYO
QUINDÍO
RISARALDA
MAGDALENA
META
NARIÑO
NORTE DE SANTANDER
MAGDALENA MEDIO
VALLE
SANTANDER
SUCRE
TOLIMA
HUILA
SAN ANDRÉS
URABÁ
TOTAL CASES
TOTAL VICTIMS
ANTIOQUIA
ARAUCA
ATLÁNTICO
BOLÍVAR
BOYACÁ
CALDAS
CAQUETÁ
CAUCA
VICHADA
AMAZONAS
CHOCÓ
GUAINÍA
GUAVIARE
CASANARE
CESAR
CÓRDOBA
CUNDINAMARCA
GUAJIRA

Crime Report 2006
Avenida El Dorado No. 75 – 25 (Bogotá - Colombia) / Tel. (57) (1) 4266333 www.policia.gov.co / [email protected] / [email protected]
COLOMBIAN NATIONAL POLICE ▲ DIJIN
1
TABLE 4. TRAFFIC INJURIES
AMAZONAS 0 0 0 0 1 0 0 1 0 0 0 0 2 1 100% 2 0,05% 81.758ANTIOQUIA 10 14 5 14 13 7 9 11 9 10 8 8 118 71 66% 6 2,91% 1.931.837ARAUCA 2 2 0 2 4 2 1 3 3 0 3 3 25 14 79% 9 0,62% 292.540ATLÁNTICO 20 16 11 13 13 14 19 11 13 13 11 22 176 147 20% 7 4,34% 2.408.194BOLÍVAR 9 11 9 8 10 11 17 8 10 13 13 10 129 142 -9% 6 3,18% 2.116.932BOYACÁ 8 6 7 10 3 5 9 9 11 13 7 11 99 95 4% 7 2,44% 1.390.276CALDAS 8 5 5 5 6 9 17 20 13 16 11 7 122 83 47% 10 3,01% 1.191.027CAQUETÁ 4 1 0 6 1 4 3 8 5 6 5 2 45 16 181% 10 1,11% 472.423CAUCA 8 5 6 9 7 13 14 13 12 20 10 9 126 100 26% 10 3,11% 1.289.040CASANARE 3 3 3 6 7 1 2 0 2 2 6 4 39 33 18% 12 0,96% 330.528CESAR 7 7 2 10 2 5 7 8 11 10 15 11 95 124 -23% 9 2,34% 1.069.755CÓRDOBA 8 6 18 9 9 14 8 5 14 12 15 8 126 105 20% 9 3,11% 1.464.772CUNDINAMARCA 29 8 13 8 35 10 23 15 33 21 20 29 244 188 30% 10 6,01% 2.402.356CHOCÓ 1 0 1 1 0 0 0 1 0 1 0 3 8 9 -11% 2 0,20% 386.705GUAJIRA 7 2 4 6 6 5 10 4 5 14 6 9 78 68 15% 15 1,92% 534.457GUAINÍA 0 0 1 0 0 0 0 0 1 0 0 0 2 0 100% 5 0,05% 43.876GUAVIARE 1 0 0 0 0 0 1 0 0 0 0 0 2 4 -50% 1 0,05% 208.832MAGDALENA 8 14 6 9 7 2 9 4 4 2 2 5 72 83 -13% 5 1,77% 1.428.333MAGDALENA MEDIO 14 2 2 0 3 1 3 1 2 3 6 3 40 39 3% 8 0,99% 527.465META 12 11 12 13 3 5 9 6 7 10 9 11 108 119 -9% 14 2,66% 745.410NARIÑO 11 6 11 12 11 13 5 4 9 15 9 16 122 211 -42% 7 3,01% 1.804.020NORTE DE SANTANDER 8 7 12 14 17 15 20 21 17 11 13 18 173 136 27% 11 4,26% 1.517.817PUTUMAYO 1 2 0 1 0 3 2 0 0 5 0 1 15 35 -57% 4 0,37% 384.772QUINDÍO 7 7 4 9 19 5 6 6 7 14 8 9 101 63 60% 16 2,49% 622.395RISARALDA 10 5 5 10 3 10 4 7 7 8 10 7 86 138 -38% 8 2,12% 1.041.735SANTANDER 11 8 13 8 12 10 17 16 13 8 18 18 152 208 -27% 8 3,75% 1.847.582SAN ANDRÉS 1 3 0 1 2 0 2 1 0 2 0 1 13 17 -24% 15 0,32% 84.720SUCRE 4 5 3 3 2 3 3 1 3 2 3 3 35 50 -30% 4 0,86% 883.962TOLIMA 9 12 9 12 8 8 12 7 14 3 20 5 119 137 -13% 9 2,93% 1.312.344HUILA 15 16 6 9 6 9 7 11 31 18 13 15 156 165 -5% 15 3,85% 1.012.356URABÁ 4 2 0 4 1 0 2 5 3 4 3 8 36 44 -18% 7 0,89% 517.686VALLE 24 33 18 21 21 14 12 22 13 7 13 15 213 262 -19% 11 5,25% 2.013.860VICHADA 0 0 0 0 2 1 0 0 0 0 0 0 3 1 200% 3 0,07% 97.656METROPOLITAN BOGOTÁ 22 35 29 30 44 35 47 51 40 53 34 53 473 494 -4% 6 11,66% 7.299.374METROPOLITAN CALI 37 26 40 29 22 31 37 32 40 43 34 25 396 373 6% 15 9,76% 2.697.267METROPOLITAN MEDELLÍN 28 16 18 28 17 13 33 17 33 40 28 37 308 114 170% 9 7,59% 3.318.225
TOTAL 351 296 273 320 317 278 370 329 385 399 353 386 4.057 3.889 4% 9 100,00% 46.772.286
PO
PU
LATI
ON
2
00
6
JAN
UA
RY
FEB
RU
AR
Y
MA
RC
H
AP
RIL
MA
Y
JUN
E
JULY
AU
GU
ST
TOTA
L 2
00
6
POLICE DEPARTMENT
TOTA
L 2
00
5
PER
CEN
TAG
E V
AR
IATI
ON
2
00
6-2
00
5
RA
TE P
ER
10
0.0
00
IN
HA
BIT
AN
TS
20
06
PA
RTI
CIP
ATI
ON
2
00
6
SEP
TEM
BER
OC
TOB
ER
NO
VEN
BER
DEC
EMB
ER

Crime Report 2006
COLOMBIAN NATIONAL POLICE ▲ DIJIN
TABLE 5. PERSONAL INJURIES
POLICE DEPARTMENT
JAN
UA
RY
FEB
RU
AR
Y
MA
RC
H
AP
RIL
MA
Y
JUN
E
JULY
AU
GU
ST
SEP
TEM
BER
OC
TOB
ER
NO
VEN
BER
DEC
EMB
ER
TOTA
L 2
00
6
TOTA
L 2
00
5
PER
CEN
TAG
E V
AR
IATI
ON
20
06
-2
00
5R
ATE
PER
1
00
.00
0
INH
AB
ITA
NTS
2
00
6
PA
RTI
CIP
ATI
ON
2
00
6
PO
PU
LATI
ON
2
00
6
AMAZONAS 20 20 14 3 13 5 4 18 10 8 6 13 134 135 -1% 164 0,29% 81.758ANTIOQUIA 74 50 61 41 29 26 19 17 2 15 24 13 371 329 13% 19 0,80% 1.931.837ARAUCA 27 24 28 10 13 8 7 15 4 7 5 6 154 183 -16% 53 0,33% 292.540ATLÁNTICO 134 148 95 111 153 153 140 144 138 176 161 308 1.861 1.321 41% 77 4,00% 2.408.194BOLÍVAR 89 87 101 110 93 128 157 158 126 105 110 93 1.357 592 129% 64 2,92% 2.116.932BOYACÁ 219 236 139 143 130 231 246 174 212 203 197 289 2.419 889 172% 174 5,20% 1.390.276CALDAS 242 168 193 187 189 203 206 212 224 215 188 240 2.467 1.912 29% 207 5,31% 1.191.027CAQUETÁ 59 52 74 68 58 63 82 59 55 69 43 64 746 521 43% 158 1,60% 472.423CAUCA 70 41 48 42 60 40 36 42 83 36 48 75 621 720 -14% 48 1,34% 1.289.040CASANARE 22 27 23 20 18 31 19 28 50 46 75 83 442 179 147% 134 0,95% 330.528CESAR 18 20 14 29 23 16 31 40 42 31 30 24 318 297 7% 30 0,68% 1.069.755CÓRDOBA 43 42 39 40 12 19 10 8 17 32 29 26 317 268 18% 22 0,68% 1.464.772CUNDINAMARCA 305 257 190 147 225 192 176 222 333 255 278 194 2.774 1.129 146% 115 5,97% 2.402.356CHOCÓ 19 17 31 14 8 6 6 7 5 10 14 8 145 168 -14% 37 0,31% 386.705GUAJIRA 42 51 35 52 37 30 39 37 46 52 36 40 497 166 199% 93 1,07% 534.457GUAINÍA 9 7 1 0 4 1 6 3 8 12 4 8 63 39 62% 144 0,14% 43.876GUAVIARE 12 12 10 10 9 13 18 14 18 16 23 15 170 85 100% 81 0,37% 208.832MAGDALENA 31 42 50 56 28 46 57 57 61 56 64 70 618 329 88% 43 1,33% 1.428.333MAGDALENA MEDIO 59 54 47 36 44 68 67 56 53 46 40 44 614 544 13% 116 1,32% 527.465META 319 338 346 290 262 309 291 321 208 281 254 249 3.468 894 288% 465 7,46% 745.410NARIÑO 125 68 93 102 113 110 91 100 26 33 34 49 944 1.300 -27% 52 2,03% 1.804.020NORTE DE SANTANDER 55 39 38 42 36 27 44 57 50 36 37 55 516 638 -19% 34 1,11% 1.517.817PUTUMAYO 21 27 21 21 34 18 26 24 28 17 17 33 287 254 13% 75 0,62% 384.772QUINDÍO 38 20 26 31 32 56 57 43 45 47 45 65 505 464 9% 81 1,09% 622.395RISARALDA 112 99 95 79 77 103 102 136 124 158 140 134 1.359 1.056 29% 130 2,92% 1.041.735SANTANDER 203 156 176 246 271 246 227 258 317 338 230 273 2.941 2.429 21% 159 6,33% 1.847.582SAN ANDRÉS 40 22 10 15 12 4 7 11 14 21 28 16 200 273 -27% 236 0,43% 84.720SUCRE 84 69 47 57 59 63 61 52 54 62 59 59 726 253 187% 82 1,56% 883.962TOLIMA 73 69 74 98 94 76 65 61 67 69 76 84 906 1.052 -14% 69 1,95% 1.312.344HUILA 150 78 70 119 107 129 147 142 114 82 99 147 1.384 1.430 -3% 137 2,98% 1.012.356URABÁ 30 43 26 19 1 17 31 27 53 10 24 27 308 618 -50% 59 0,66% 517.686VALLE 361 357 382 440 372 421 387 322 332 407 229 224 4.234 1.349 214% 210 9,11% 2.013.860VICHADA 9 6 9 10 4 4 8 9 3 7 3 9 81 77 5% 83 0,17% 97.656METROPOLITAN BOGOTÁ 537 578 593 633 514 526 503 560 605 727 716 878 7.370 6.622 11% 101 15,85% 7.299.374METROPOLITAN CALI 201 293 303 305 277 287 380 476 489 488 402 411 4.312 891 384% 160 9,27% 2.697.267METROPOLITAN MEDELLÍN 145 108 113 95 107 55 48 27 47 33 44 45 867 997 -13% 26 1,86% 3.318.225
TOTAL 3.997 3.725 3.615 3.721 3.518 3.730 3.801 3.937 4.063 4.206 3.812 4.371 46.496 30.403 53% 99 100,00% 46.772.286
Avenida El Dorado No. 75 – 25 (Bogotá - Colombia) / Tel. (57) (1) 4266333 www.policia.gov.co / [email protected] / [email protected]
1

Crime Report 2006
COLOMBIAN NATIONAL POLICE ▲ DIJIN
TABLE 6. TRAFFIC INJURIES
AMAZONAS 12 8 2 4 6 1 0 5 8 6 5 8 65 38 71% 80 0,49% 81.758ANTIOQUIA 17 15 15 10 4 1 6 2 1 2 7 7 87 50 74% 5 0,66% 1.931.837ARAUCA 12 18 28 20 15 1 34 10 15 7 3 7 170 36 372% 58 1,29% 292.540ATLÁNTICO 44 35 51 24 31 31 34 50 23 25 26 38 412 383 8% 17 3,14% 2.408.194BOLÍVAR 34 34 33 30 34 33 32 33 26 27 9 6 331 116 185% 16 2,52% 2.116.932BOYACÁ 58 33 46 65 42 51 56 34 36 26 50 46 543 271 100% 39 4,13% 1.390.276CALDAS 144 94 96 156 56 49 45 64 52 37 29 53 875 483 81% 73 6,66% 1.191.027CAQUETÁ 33 32 20 31 16 22 24 31 22 41 26 31 329 192 71% 70 2,50% 472.423CAUCA 14 6 9 24 7 24 12 12 13 51 22 34 228 206 11% 18 1,74% 1.289.040CASANARE 5 1 5 3 6 6 10 13 24 23 12 14 122 58 110% 37 0,93% 330.528CESAR 8 12 15 8 21 6 32 24 16 11 14 14 181 182 -1% 17 1,38% 1.069.755CÓRDOBA 74 11 45 45 29 36 31 46 50 41 44 9 461 134 244% 31 3,51% 1.464.772CUNDINAMARCA 41 25 27 14 49 12 32 30 40 30 29 56 385 312 23% 16 2,93% 2.402.356CHOCÓ 1 3 0 0 0 0 0 0 0 0 0 12 16 12 33% 4 0,12% 386.705GUAJIRA 23 15 17 16 17 7 21 9 9 21 15 15 185 86 115% 35 1,41% 534.457GUAINÍA 1 2 1 1 0 0 0 3 2 0 5 5 20 10 100% 46 0,15% 43.876GUAVIARE 6 0 3 0 2 4 0 3 3 8 6 2 37 41 -10% 18 0,28% 208.832MAGDALENA 12 2 8 10 7 1 15 8 4 4 14 17 102 92 11% 7 0,78% 1.428.333MAGDALENA MEDIO 23 17 16 6 11 8 13 11 13 29 42 16 205 60 242% 39 1,56% 527.465META 88 89 68 86 81 69 84 64 48 54 46 60 837 204 310% 112 6,37% 745.410NARIÑO 32 12 17 17 10 20 9 8 5 10 1 16 157 355 -56% 9 1,20% 1.804.020NORTE DE SANTANDER 6 10 5 8 7 11 9 10 13 13 11 13 116 116 0% 8 0,88% 1.517.817PUTUMAYO 2 6 1 3 0 4 1 0 1 6 0 1 25 40 -38% 6 0,19% 384.772QUINDÍO 4 5 4 14 14 6 8 22 19 32 17 44 189 66 186% 30 1,44% 622.395RISARALDA 48 27 22 24 7 6 9 8 42 28 29 32 282 210 34% 27 2,15% 1.041.735SANTANDER 89 62 76 71 64 70 94 102 97 71 74 84 954 495 93% 52 7,26% 1.847.582SAN ANDRÉS 22 8 0 1 9 1 4 6 6 18 11 7 93 190 -51% 110 0,71% 84.720SUCRE 20 13 18 15 14 19 9 6 8 16 15 9 162 90 80% 18 1,23% 883.962TOLIMA 13 6 4 25 5 7 3 32 9 8 12 9 133 309 -57% 10 1,01% 1.312.344HUILA 82 33 18 20 20 55 65 71 36 45 31 44 520 515 1% 51 3,96% 1.012.356URABÁ 5 2 5 1 0 0 0 6 2 0 3 1 25 88 -72% 5 0,19% 517.686VALLE 115 88 103 88 78 85 86 38 34 53 64 58 890 310 187% 44 6,78% 2.013.860VICHADA 0 1 0 2 5 1 2 0 4 0 0 3 18 2 800% 18 0,14% 97.656METROPOLITAN BOGOTÁ 198 210 271 324 222 208 127 217 222 263 365 319 2.946 3.697 -20% 40 22,43% 7.299.374METROPOLITAN CALI 56 59 57 44 37 75 65 53 86 97 65 55 749 260 188% 28 5,70% 2.697.267METROPOLITAN MEDELLÍN 42 26 49 25 28 17 16 10 20 16 11 24 284 350 -19% 9 2,16% 3.318.225
TOTAL 1.384 1.020 1.155 1.235 954 947 988 1.041 1.009 1.119 1.113 1.169 13.134 10.059 31% 28 100,00% 46.772.286
PO
PU
LATI
ON
2
00
6
JAN
UA
RY
FEB
RU
AR
Y
MA
RC
H
AP
RIL
MA
Y
JUN
E
JULY
AU
GU
ST
TOTA
L 2
00
6
POLICE DEPARTMENT
TOTA
L 2
00
5
PER
CEN
TAG
E V
AR
IATI
ON
2
00
6-2
00
5
RA
TE P
ER
10
0.0
00
IN
HA
BIT
AN
TS
20
06
PA
RTI
CIP
ATI
ON
2
00
6
SEP
TEM
BER
OC
TOB
ER
NO
VEN
BER
DEC
EMB
ER
Avenida El Dorado No. 75 – 25 (Bogotá - Colombia) / Tel. (57) (1) 4266333 www.policia.gov.co / [email protected] / [email protected]
2

Crime Report 2006
COLOMBIAN NATIONAL POLICE ▲ DIJIN
TABLE 7. BURGLARY
AMAZONAS 6 8 5 13 4 3 3 0 2 5 5 0 54 67 -19% 66 0,27% 81.758ANTIOQUIA 21 23 19 14 10 10 3 9 3 4 6 4 126 255 -51% 7 0,62% 1.931.837ARAUCA 21 17 7 5 6 4 7 3 6 2 6 2 86 19 353% 29 0,42% 292.540ATLÁNTICO 35 56 39 40 69 56 47 29 41 63 70 64 609 440 38% 25 3,01% 2.408.194BOLÍVAR 45 46 53 48 41 71 71 85 63 63 79 56 721 362 99% 34 3,56% 2.116.932BOYACÁ 73 78 38 38 48 66 56 79 73 55 70 70 744 277 169% 54 3,67% 1.390.276CALDAS 47 60 35 43 39 40 19 32 40 52 43 44 494 594 -17% 41 2,44% 1.191.027CAQUETÁ 4 5 7 4 13 10 15 12 9 16 22 20 137 97 41% 29 0,68% 472.423CAUCA 21 8 17 23 10 24 26 22 30 21 32 31 265 227 17% 21 1,31% 1.289.040CASANARE 29 23 24 16 14 24 17 35 33 47 41 38 341 83 311% 103 1,68% 330.528CESAR 20 8 14 19 16 14 30 25 17 14 19 13 209 279 -25% 20 1,03% 1.069.755CÓRDOBA 27 21 26 27 20 8 13 19 32 15 17 23 248 204 22% 17 1,22% 1.464.772CUNDINAMARCA 137 148 115 103 185 150 123 182 280 217 186 98 1.924 622 209% 80 9,50% 2.402.356CHOCÓ 9 10 3 8 4 0 7 1 5 5 0 0 52 66 -21% 13 0,26% 386.705GUAJIRA 20 17 14 22 12 24 29 15 18 27 23 20 241 47 413% 45 1,19% 534.457GUAINÍA 5 4 0 7 0 3 2 3 2 7 4 3 40 13 208% 91 0,20% 43.876GUAVIARE 2 0 2 2 3 2 2 1 5 5 3 2 29 21 38% 14 0,14% 208.832MAGDALENA 11 6 23 14 15 22 26 22 28 37 31 19 254 75 239% 18 1,25% 1.428.333MAGDALENA MEDIO 21 22 25 38 24 22 17 20 26 21 22 14 272 227 20% 52 1,34% 527.465META 81 60 113 77 114 113 81 99 63 90 76 45 1.012 513 97% 136 5,00% 745.410NARIÑO 32 30 31 19 25 23 26 17 6 11 13 19 252 308 -18% 14 1,24% 1.804.020NORTE DE SANTANDER 36 19 15 15 6 4 10 14 5 9 12 23 168 236 -29% 11 0,83% 1.517.817PUTUMAYO 21 11 18 8 17 10 2 11 12 7 6 5 128 86 49% 33 0,63% 384.772QUINDÍO 34 28 30 26 37 24 41 35 41 43 38 30 407 307 33% 65 2,01% 622.395RISARALDA 79 72 80 61 59 73 65 62 72 64 81 73 841 615 37% 81 4,15% 1.041.735SANTANDER 75 51 43 49 60 49 53 81 90 75 54 30 710 651 9% 38 3,51% 1.847.582SAN ANDRÉS 16 15 9 13 12 8 8 15 13 15 8 11 143 167 -14% 169 0,71% 84.720SUCRE 30 16 12 10 15 13 3 4 5 2 2 4 116 97 20% 13 0,57% 883.962TOLIMA 59 61 48 66 91 56 45 51 73 37 50 45 682 623 9% 52 3,37% 1.312.344HUILA 61 23 22 25 25 40 11 14 22 61 47 45 396 375 6% 39 1,96% 1.012.356URABÁ 20 12 1 2 5 2 2 3 8 3 3 5 66 82 -20% 13 0,33% 517.686VALLE 83 81 73 105 99 76 91 69 51 58 56 38 880 472 86% 44 4,35% 2.013.860VICHADA 2 2 6 8 7 5 3 4 3 4 1 4 49 46 7% 50 0,24% 97.656METROPOLITAN BOGOTÁ 381 297 345 407 380 355 387 374 403 365 380 500 4.574 5.325 -14% 63 22,59% 7.299.374METROPOLITAN CALI 113 208 227 248 223 279 295 232 217 214 179 141 2.576 305 745% 96 12,72% 2.697.267METROPOLITAN MEDELLÍN 54 36 22 40 35 34 24 58 17 16 39 24 399 614 -35% 12 1,97% 3.318.225
TOTAL 1.731 1.582 1.561 1.663 1.743 1.717 1.660 1.737 1.814 1.750 1.724 1.563 20.245 14.797 37% 43 100,00% 46.772.286
DEC
EMB
ER
JAN
UA
RY
FEB
RU
AR
Y
MA
RC
H
AP
RIL
MA
Y
JUN
E
JULY
AU
GU
ST
POLICE DEPARTMENT
PA
RTI
CIP
ATI
ON
2
00
6
PO
PU
LATI
ON
2
00
6
TOTA
L 2
00
5
PER
CEN
TAG
E V
AR
IATI
ON
2
00
6-2
00
5
RA
TE P
ER
10
0.0
00
IN
HA
BIT
AN
TS
20
06
SEP
TEM
BER
OC
TOB
ER
NO
VEN
BER
TOTA
L 2
00
6
Avenida El Dorado No. 75 – 25 (Bogotá - Colombia) / Tel. (57) (1) 4266333 www.policia.gov.co / [email protected] / [email protected]
3

Crime Report 2006
COLOMBIAN NATIONAL POLICE ▲ DIJIN
TABLE 8. COMMERCIAL THEFT
AMAZONAS 2 3 0 6 2 1 3 5 4 3 6 1 36 28 29% 44 0,22% 81.758ANTIOQUIA 22 9 3 5 2 1 1 1 5 5 4 4 62 125 -50% 3 0,38% 1.931.837ARAUCA 7 13 6 6 7 9 3 6 2 3 1 3 66 15 340% 23 0,41% 292.540ATLÁNTICO 44 68 58 65 78 58 38 54 40 87 81 95 766 727 5% 32 4,71% 2.408.194BOLÍVAR 40 56 51 44 39 62 76 88 77 97 73 82 785 412 91% 37 4,83% 2.116.932BOYACÁ 58 58 34 37 40 45 45 66 84 58 56 66 647 211 207% 47 3,98% 1.390.276CALDAS 16 7 9 7 7 11 5 9 13 20 16 4 124 136 -9% 10 0,76% 1.191.027CAQUETÁ 2 1 1 1 2 0 2 1 0 1 2 5 18 17 6% 4 0,11% 472.423CAUCA 17 6 16 12 10 15 19 11 21 18 13 24 182 125 46% 14 1,12% 1.289.040CASANARE 7 5 5 13 5 10 12 14 19 25 18 16 149 22 577% 45 0,92% 330.528CESAR 18 11 15 19 17 18 22 16 31 25 18 20 230 214 7% 22 1,41% 1.069.755CÓRDOBA 9 19 9 21 11 3 7 9 9 13 8 4 122 106 15% 8 0,75% 1.464.772CUNDINAMARCA 88 92 71 53 66 75 47 92 117 109 104 57 971 613 58% 40 5,97% 2.402.356CHOCÓ 0 0 3 3 0 0 0 1 1 0 0 0 8 4 100% 2 0,05% 386.705GUAJIRA 9 10 15 5 6 8 12 8 13 24 22 14 146 21 595% 27 0,90% 534.457GUAINÍA 0 0 0 0 1 0 0 1 3 2 2 2 11 4 175% 25 0,07% 43.876GUAVIARE 3 3 1 3 4 5 3 3 6 6 2 3 42 12 250% 20 0,26% 208.832MAGDALENA 20 10 14 22 10 20 18 21 21 17 17 15 205 112 83% 14 1,26% 1.428.333MAGDALENA MEDIO 18 25 14 16 20 15 12 19 28 23 21 18 229 175 31% 43 1,41% 527.465META 35 32 52 41 43 49 56 42 71 64 64 57 606 211 187% 81 3,73% 745.410NARIÑO 26 10 29 20 13 18 25 22 1 6 7 6 183 175 5% 10 1,13% 1.804.020NORTE DE SANTANDER 30 26 29 14 15 14 16 18 7 11 14 10 204 234 -13% 13 1,25% 1.517.817PUTUMAYO 8 2 2 5 5 3 0 0 0 6 1 2 34 37 -8% 9 0,21% 384.772QUINDÍO 22 18 25 27 25 25 33 21 22 40 29 19 306 204 50% 49 1,88% 622.395RISARALDA 62 58 80 49 66 82 57 64 69 80 50 44 761 501 52% 73 4,68% 1.041.735SANTANDER 46 34 32 47 56 52 66 65 44 63 40 61 606 511 19% 33 3,73% 1.847.582SAN ANDRÉS 9 3 5 11 8 4 6 9 5 12 11 6 89 127 -30% 105 0,55% 84.720SUCRE 0 0 0 0 0 0 0 1 0 0 0 1 2 3 -33% 0 0,01% 883.962TOLIMA 24 25 62 42 39 26 33 48 48 45 47 43 482 538 -10% 37 2,96% 1.312.344HUILA 34 8 7 18 23 22 13 17 10 20 14 12 198 217 -9% 20 1,22% 1.012.356URABÁ 8 14 0 2 5 7 6 10 2 2 6 3 65 126 -48% 13 0,40% 517.686VALLE 38 43 48 42 67 72 51 47 60 31 46 28 573 436 31% 28 3,52% 2.013.860VICHADA 1 0 2 0 0 0 0 1 1 0 0 1 6 6 0% 6 0,04% 97.656METROPOLITAN BOGOTÁ 433 358 459 395 518 453 408 431 440 423 372 416 5.106 5.767 -11% 70 31,41% 7.299.374METROPOLITAN CALI 93 92 131 137 132 111 106 110 183 168 129 124 1.516 568 167% 56 9,32% 2.697.267METROPOLITAN MEDELLÍN 149 97 86 95 84 52 23 37 31 15 33 20 722 832 -13% 22 4,44% 3.318.225
TOTAL 1.398 1.216 1.374 1.283 1.426 1.346 1.224 1.368 1.488 1.522 1.327 1.286 16.258 13.572 20% 35 100,00% 46.772.286
DEC
EMB
ER
PO
PU
LATI
ON
2
00
6
TOTA
L 2
00
6
RA
TE P
ER
10
0.0
00
IN
HA
BIT
AN
TS
20
06
PA
RTI
CIP
ATI
ON
2
00
6
AU
GU
ST
SEP
TEM
BER
OC
TOB
ER
NO
VEN
BER
POLICE DEPARTMENT
TOTA
L 2
00
5
PER
CEN
TAG
E V
AR
IATI
ON
2
00
6-2
00
5
JAN
UA
RY
FEB
RU
AR
Y
MA
RC
H
AP
RIL
MA
Y
JUN
E
JULY
Avenida El Dorado No. 75 – 25 (Bogotá - Colombia) / Tel. (57) (1) 4266333 www.policia.gov.co / [email protected] / [email protected]
4

Crime Report 2006
COLOMBIAN NATIONAL POLICE ▲ DIJIN
TABLE 9. PERSONAL THEFT
AMAZONAS 2 7 0 3 6 1 1 3 3 1 1 2 30 35 -14% 37 0,05% 81.758ANTIOQUIA 34 28 50 33 17 6 3 2 6 2 7 7 195 336 -42% 10 0,36% 1.931.837ARAUCA 23 14 10 11 17 11 12 5 2 2 1 3 111 30 270% 38 0,20% 292.540ATLÁNTICO 147 142 188 166 168 199 145 187 172 305 345 439 2.603 2.089 25% 108 4,75% 2.408.194BOLÍVAR 130 164 159 142 144 180 198 179 183 217 249 229 2.174 1.071 103% 103 3,97% 2.116.932BOYACÁ 51 63 70 51 57 87 63 97 126 94 121 108 988 354 179% 71 1,80% 1.390.276CALDAS 285 321 322 232 256 258 226 280 265 260 260 213 3.178 3.332 -5% 267 5,80% 1.191.027CAQUETÁ 59 32 46 62 68 71 76 58 91 100 70 85 818 325 152% 173 1,49% 472.423CAUCA 51 47 77 61 47 48 47 56 69 60 96 83 742 445 67% 58 1,35% 1.289.040CASANARE 14 15 16 11 10 26 18 35 37 30 32 34 278 82 239% 84 0,51% 330.528CESAR 21 29 38 48 35 23 36 33 41 36 23 20 383 378 1% 36 0,70% 1.069.755CÓRDOBA 36 37 30 15 14 7 11 22 31 22 37 13 275 207 33% 19 0,50% 1.464.772CUNDINAMARCA 274 247 202 178 300 252 200 327 444 369 233 157 3.183 2.156 48% 132 5,81% 2.402.356CHOCÓ 18 11 7 18 2 2 12 14 14 24 11 0 133 148 -10% 34 0,24% 386.705GUAJIRA 15 22 22 21 26 20 24 22 36 51 45 40 344 54 537% 64 0,63% 534.457GUAINÍA 2 2 0 0 1 0 0 2 1 1 8 4 21 5 320% 48 0,04% 43.876GUAVIARE 3 2 3 3 5 6 4 7 13 9 12 5 72 21 243% 34 0,13% 208.832MAGDALENA 33 30 34 49 44 35 34 44 47 43 35 27 455 139 227% 32 0,83% 1.428.333MAGDALENA MEDIO 31 39 32 35 25 35 46 32 36 38 34 21 404 332 22% 77 0,74% 527.465META 100 141 160 124 128 128 136 190 194 217 143 111 1.772 553 220% 238 3,23% 745.410NARIÑO 34 34 40 32 39 37 41 27 10 31 19 18 362 413 -12% 20 0,66% 1.804.020NORTE DE SANTANDER 74 45 34 27 39 37 46 28 17 23 21 29 420 630 -33% 28 0,77% 1.517.817PUTUMAYO 5 7 6 7 11 11 1 14 3 10 10 8 93 58 60% 24 0,17% 384.772QUINDÍO 48 37 38 52 46 27 56 40 31 43 40 32 490 508 -4% 79 0,89% 622.395RISARALDA 162 185 185 116 119 158 151 145 161 141 175 125 1.823 1.495 22% 175 3,32% 1.041.735SANTANDER 329 229 217 243 284 304 275 295 317 367 374 301 3.535 3.185 11% 191 6,45% 1.847.582SAN ANDRÉS 18 23 14 10 11 9 10 12 9 5 11 23 155 206 -25% 183 0,28% 84.720SUCRE 67 63 53 60 66 64 64 66 66 81 85 70 805 248 225% 91 1,47% 883.962TOLIMA 83 106 154 159 158 115 102 118 161 134 124 115 1.529 1.413 8% 117 2,79% 1.312.344HUILA 133 101 129 160 131 188 216 206 174 137 115 149 1.839 1.788 3% 182 3,35% 1.012.356URABÁ 38 37 24 16 14 13 16 5 16 15 18 7 219 251 -13% 42 0,40% 517.686VALLE 322 394 360 377 349 388 323 293 347 355 270 195 3.973 1.992 99% 197 7,25% 2.013.860VICHADA 0 7 4 3 4 0 3 3 1 2 0 4 31 27 15% 32 0,06% 97.656METROPOLITAN BOGOTÁ 804 890 1.132 1.171 1.192 1.026 975 1.137 1.117 1.063 1.075 1.166 12.748 11.879 7% 175 23,25% 7.299.37METROPOLITAN CALI 317 494 524 596 490 589 619 571 684 605 590 539 6.618 1.651 301% 245 12,07% 2.697.267METROPOLITAN MEDELL
4
ÍN 263 164 225 156 192 163 119 164 151 121 167 145 2.030 3.435 -41% 61 3,70% 3.318.225TOTAL 4.026 4.209 4.605 4.448 4.515 4.524 4.309 4.719 5.076 5.014 4.857 4.527 54.829 41.271 33% 117 100,00% 46.772.286
PA
RTI
CIP
ATI
ON
2
00
6
SEP
TEM
BER
OC
TOB
ER
NO
VEN
BER
DEC
EMB
ER
POLICE DEPARTMENT
TOTA
L 2
00
5
PER
CEN
TAG
E V
AR
IATI
ON
2
00
6-2
00
5
RA
TE P
ER
10
0.0
00
IN
HA
BIT
AN
TS
20
06
PO
PU
LATI
ON
2
00
6
JAN
UA
RY
FEB
RU
AR
Y
MA
RC
H
AP
RIL
MA
Y
JUN
E
JULY
AU
GU
ST
TOTA
L 2
00
6
Avenida El Dorado No. 75 – 25 (Bogotá - Colombia) / Tel. (57) (1) 4266333 www.policia.gov.co / [email protected] / [email protected]
5
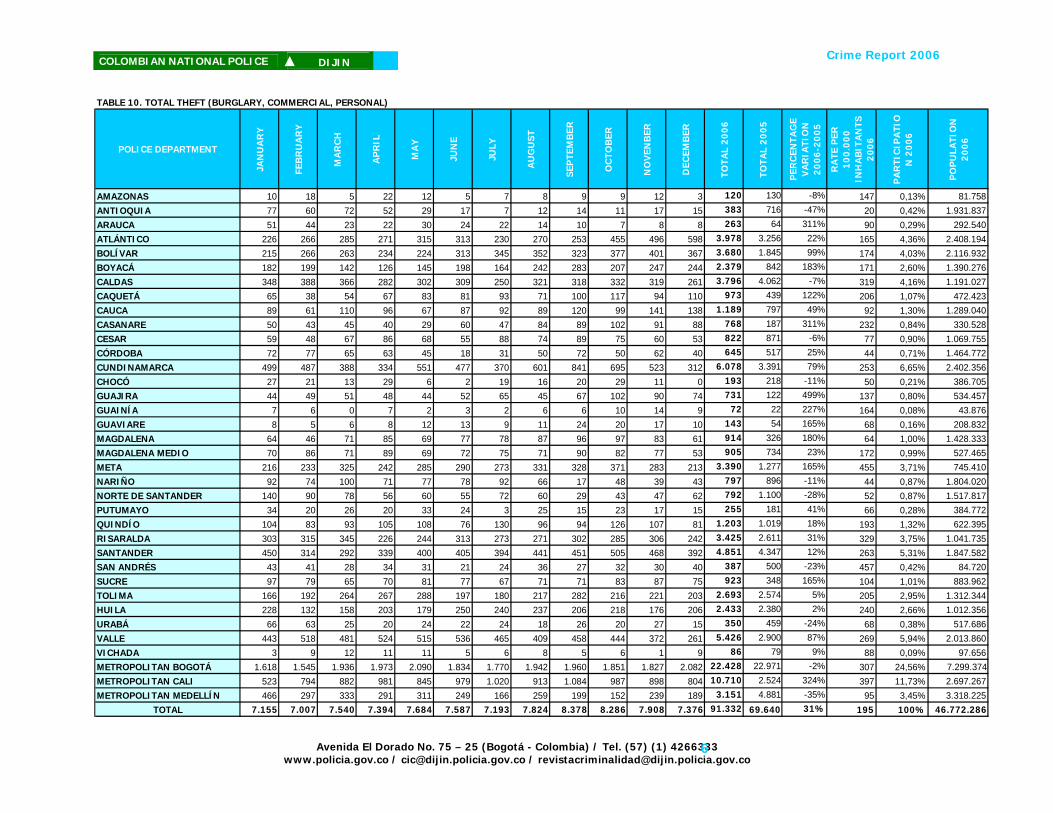
Crime Report 2006
COLOMBIAN NATIONAL POLICE ▲ DIJIN
TABLE 10. TOTAL THEFT (BURGLARY, COMMERCIAL, PERSONAL)
POLICE DEPARTMENT
JAN
UA
RY
FEB
RU
AR
Y
MA
RC
H
AP
RIL
MA
Y
JUN
E
JULY
AU
GU
ST
SEP
TEM
BER
OC
TOB
ER
NO
VEN
BER
DEC
EMB
ER
TOTA
L 20
06
TOTA
L 20
05
PER
CEN
TAG
E V
AR
IATI
ON
2
00
6-2
00
5
RA
TE P
ER
10
0.0
00
IN
HA
BIT
AN
TS
20
06
PA
RTI
CIP
ATI
ON
20
06
PO
PU
LATI
ON
2
00
6
AMAZONAS 10 18 5 22 12 5 7 8 9 9 12 3 120 130 -8% 147 0,13% 81.758
ANTIOQUIA 77 60 72 52 29 17 7 12 14 11 17 15 383 716 -47% 20 0,42% 1.931.837
ARAUCA 51 44 23 22 30 24 22 14 10 7 8 8 263 64 311% 90 0,29% 292.540ATLÁNTICO 226 266 285 271 315 313 230 270 253 455 496 598 3.978 3.256 22% 165 4,36% 2.408.194BOLÍVAR 215 266 263 234 224 313 345 352 323 377 401 367 3.680 1.845 99% 174 4,03% 2.116.932
BOYACÁ 182 199 142 126 145 198 164 242 283 207 247 244 2.379 842 183% 171 2,60% 1.390.276
CALDAS 348 388 366 282 302 309 250 321 318 332 319 261 3.796 4.062 -7% 319 4,16% 1.191.027CAQUETÁ 65 38 54 67 83 81 93 71 100 117 94 110 973 439 122% 206 1,07% 472.423CAUCA 89 61 110 96 67 87 92 89 120 99 141 138 1.189 797 49% 92 1,30% 1.289.040
CASANARE 50 43 45 40 29 60 47 84 89 102 91 88 768 187 311% 232 0,84% 330.528CESAR 59 48 67 86 68 55 88 74 89 75 60 53 822 871 -6% 77 0,90% 1.069.755CÓRDOBA 72 77 65 63 45 18 31 50 72 50 62 40 645 517 25% 44 0,71% 1.464.772
CUNDINAMARCA 499 487 388 334 551 477 370 601 841 695 523 312 6.078 3.391 79% 253 6,65% 2.402.356
CHOCÓ 27 21 13 29 6 2 19 16 20 29 11 0 193 218 -11% 50 0,21% 386.705GUAJIRA 44 49 51 48 44 52 65 45 67 102 90 74 731 122 499% 137 0,80% 534.457GUAINÍA 7 6 0 7 2 3 2 6 6 10 14 9 72 22 227% 164 0,08% 43.876
GUAVIARE 8 5 6 8 12 13 9 11 24 20 17 10 143 54 165% 68 0,16% 208.832MAGDALENA 64 46 71 85 69 77 78 87 96 97 83 61 914 326 180% 64 1,00% 1.428.333MAGDALENA MEDIO 70 86 71 89 69 72 75 71 90 82 77 53 905 734 23% 172 0,99% 527.465
META 216 233 325 242 285 290 273 331 328 371 283 213 3.390 1.277 165% 455 3,71% 745.410
NARIÑO 92 74 100 71 77 78 92 66 17 48 39 43 797 896 -11% 44 0,87% 1.804.020NORTE DE SANTANDER 140 90 78 56 60 55 72 60 29 43 47 62 792 1.100 -28% 52 0,87% 1.517.817PUTUMAYO 34 20 26 20 33 24 3 25 15 23 17 15 255 181 41% 66 0,28% 384.772
QUINDÍO 104 83 93 105 108 76 130 96 94 126 107 81 1.203 1.019 18% 193 1,32% 622.395
RISARALDA 303 315 345 226 244 313 273 271 302 285 306 242 3.425 2.611 31% 329 3,75% 1.041.735SANTANDER 450 314 292 339 400 405 394 441 451 505 468 392 4.851 4.347 12% 263 5,31% 1.847.582SAN ANDRÉS 43 41 28 34 31 21 24 36 27 32 30 40 387 500 -23% 457 0,42% 84.720
SUCRE 97 79 65 70 81 77 67 71 71 83 87 75 923 348 165% 104 1,01% 883.962TOLIMA 166 192 264 267 288 197 180 217 282 216 221 203 2.693 2.574 5% 205 2,95% 1.312.344HUILA 228 132 158 203 179 250 240 237 206 218 176 206 2.433 2.380 2% 240 2,66% 1.012.356
URABÁ 66 63 25 20 24 22 24 18 26 20 27 15 350 459 -24% 68 0,38% 517.686
VALLE 443 518 481 524 515 536 465 409 458 444 372 261 5.426 2.900 87% 269 5,94% 2.013.860VICHADA 3 9 12 11 11 5 6 8 5 6 1 9 86 79 9% 88 0,09% 97.656METROPOLITAN BOGOTÁ 1.618 1.545 1.936 1.973 2.090 1.834 1.770 1.942 1.960 1.851 1.827 2.082 22.428 22.971 -2% 307 24,56% 7.299.374
METROPOLITAN CALI 523 794 882 981 845 979 1.020 913 1.084 987 898 804 10.710 2.524 324% 397 11,73% 2.697.267METROPOLITAN MEDELLÍN 466 297 333 291 311 249 166 259 199 152 239 189 3.151 4.881 -35% 95 3,45% 3.318.225
TOTAL 7.155 7.007 7.540 7.394 7.684 7.587 7.193 7.824 8.378 8.286 7.908 7.376 91.332 69.640 31% 195 100% 46.772.286
Avenida El Dorado No. 75 – 25 (Bogotá - Colombia) / Tel. (57) (1) 4266333 www.policia.gov.co / [email protected] / [email protected]
6

Crime Report 2006
COLOMBIAN NATIONAL POLICE ▲ DIJIN
TABLE 11. AUTO THEFT
POLICE DEPARTMENT
JAN
UA
RY
FEB
RU
AR
Y
MA
RC
H
AP
RIL
MA
Y
JUN
E
JULY
AU
GU
ST
SEP
TEM
BER
OC
TOB
ER
NO
VEN
BER
DEC
EMB
ER
TOTA
L 2
006
TOTA
L 2
005
PER
CEN
TAG
E V
AR
IATI
ON
20
06
-2
00
5
THEF
T R
ATE
PER
1
.00
0 R
EGIS
TER
ED
VEH
ICLE
S
THEF
T R
ATE
PER
1
00
.00
0
INH
AB
ITA
NTS
20
06
PER
CEN
TAG
E P
AR
TIC
IPA
TIO
N
20
06
PO
PU
LATI
ON
20
06
AMAZONAS 0 0 0 0 0 0 0 0 0 0 0 0 0 0 0% 0 0 0,00% 81.758ANTIOQUIA 5 5 5 2 3 7 2 1 1 1 6 4 42 40 5% 0 2 0,45% 1.931.837ARAUCA 4 1 0 1 5 1 1 2 0 1 0 0 16 25 -36% 9 5 0,17% 292.540
ATLÁNTICO 39 25 26 43 33 39 50 62 46 41 64 47 515 425 21% 4 21 5,57% 2.408.194BOLÍVAR 8 5 9 7 7 10 7 9 2 7 8 5 84 66 27% 2 4 0,91% 2.116.932BOYACÁ 3 7 5 4 6 3 8 13 6 1 8 3 67 68 -1% 2 5 0,72% 1.390.276
CALDAS 11 7 10 14 8 2 6 3 3 4 4 5 77 78 -1% 1 6 0,83% 1.191.027CAQUETÁ 2 1 2 1 0 1 1 1 0 0 2 0 11 8 38% 2 2 0,12% 472.423
CAUCA 13 27 10 17 5 11 13 10 16 18 16 26 182 202 -10% 8 14 1,97% 1.289.040CASANARE 0 5 2 0 0 0 1 2 0 1 1 1 13 15 -13% 6 4 0,14% 330.528CESAR 2 5 2 8 1 5 6 4 3 8 3 7 54 51 6% 3 5 0,58% 1.069.755
CÓRDOBA 0 0 0 1 0 0 0 0 0 0 1 1 3 8 -63% 0 0 0,03% 1.464.772CUNDINAMARCA 29 35 11 16 28 15 16 13 11 13 11 10 208 130 60% 1 9 2,25% 2.402.356CHOCÓ 0 0 0 0 0 0 0 0 0 0 0 0 0 0 0% 0 0 0,00% 386.705GUAJIRA 2 8 2 1 1 3 7 4 4 1 3 1 37 18 106% 20 7 0,40% 534.457GUAINÍA 0 0 0 0 0 0 0 0 0 0 0 0 0 0 0% 0 0 0,00% 43.876
GUAVIARE 0 0 0 0 0 0 0 0 0 0 0 0 0 3 -100% 0 0 0,00% 208.832MAGDALENA 8 2 2 7 5 4 3 3 2 1 5 3 45 31 45% 2 3 0,49% 1.428.333MAGDALENA MEDIO 3 6 4 5 1 1 2 6 3 2 1 0 34 47 -28% 301 6 0,37% 527.465
META 9 12 11 16 7 13 6 10 13 13 5 8 123 95 29% 4 17 1,33% 745.410NARIÑO 9 3 8 10 18 11 20 15 7 11 23 7 142 171 -17% 4 8 1,54% 1.804.020NORTE DE SANTANDER 11 12 20 12 17 16 15 11 6 2 12 8 142 210 -32% 6 9 1,54% 1.517.817PUTUMAYO 1 2 0 0 0 2 0 1 0 0 0 0 6 6 0% 3 2 0,06% 384.772QUINDÍO 5 6 3 7 7 3 5 9 10 11 14 9 89 116 -23% 2 14 0,96% 622.395
RISARALDA 25 24 31 20 16 13 17 15 20 17 17 15 230 191 20% 4 22 2,49% 1.041.735SANTANDER 13 17 11 11 13 9 13 14 11 16 18 20 166 136 22% 1 9 1,80% 1.847.582SAN ANDRÉS 1 0 0 0 0 0 0 0 0 0 0 0 1 2 -50% 0 1 0,01% 84.720
SUCRE 3 1 0 2 0 0 0 1 2 0 1 2 12 6 100% 1 1 0,13% 883.962TOLIMA 5 1 5 10 3 2 4 8 11 10 5 2 66 121 -45% 1 5 0,71% 1.312.344HUILA 7 4 3 3 2 6 7 2 4 6 3 3 50 81 -38% 2 5 0,54% 1.012.356URABÁ 0 0 1 0 0 0 0 0 0 0 0 0 1 4 -75% 29 0 0,01% 517.686VALLE 29 28 21 23 26 26 24 23 14 16 3 4 237 114 108% 3 12 2,56% 2.013.860
VICHADA 0 0 0 0 1 0 0 0 0 0 0 0 1 1 0% 56 1 0,01% 97.656METROPOLITAN BOGOTÁ 311 288 312 319 323 350 327 295 303 293 269 235 3.625 4.640 -22% 5 50 39,21% 7.299.374METROPOLITAN CALI 114 134 129 136 88 128 119 149 119 127 164 112 1.519 1.125 35% 7 56 16,43% 2.697.267
METROPOLITAN MEDELLÍN 110 123 110 121 138 142 126 131 134 127 114 72 1.448 1.727 -16% 8 44 15,66% 3.318.225TOTAL 782 794 755 817 762 823 806 817 751 748 781 610 9.246 9.961 -7% 4 20 100,00% 46.772.286
Avenida El Dorado No. 75 – 25 (Bogotá - Colombia) / Tel. (57) (1) 4266333 www.policia.gov.co / [email protected] / [email protected]
7

Crime Report 2006
COLOMBIAN NATIONAL POLICE ▲ DIJIN
TABLE 12. MOTORCYCLE THEFT
POLICE DEPARTMENT
JAN
UA
RY
FEB
RU
AR
Y
MA
RC
H
AP
RIL
MA
Y
JUN
E
JULY
AU
GU
ST
SEP
TEM
BER
OC
TOB
ER
NO
VEN
BER
DEC
EMB
ER
TOTA
L 2
006
TOTA
L 2
005
PER
CEN
TAG
E V
AR
IATI
ON
20
06
-2
00
5
THEF
T R
ATE
PER
1
.00
0 R
EGIS
TER
ED
MO
TOR
CY
CLE
S
RA
TE P
ER 1
00
.00
0 IN
HA
BIT
AN
TS 2
00
6
PER
CEN
TAG
E P
AR
TIC
IPA
TIO
N
20
06
PO
PU
LATI
ON
20
06
AMAZONAS 1 3 0 3 1 1 0 1 1 2 1 1 15 17 -12% 4 18 0,14% 81.758ANTIOQUIA 13 9 10 6 9 4 2 4 1 1 8 4 71 95 -25% 1 4 0,67% 1.931.837ARAUCA 9 7 1 1 1 3 1 0 0 1 6 1 31 20 55% 2 11 0,29% 292.540
ATLÁNTICO 87 118 123 76 93 86 123 105 92 85 83 92 1.163 825 41% 27 48 11,04% 2.408.194BOLÍVAR 49 55 45 42 50 55 47 47 33 49 65 47 584 406 44% 19 28 5,55% 2.116.932BOYACÁ 8 3 2 6 3 1 7 6 5 5 8 10 64 64 0% 5 5 0,61% 1.390.276
CALDAS 9 11 14 11 11 7 8 8 12 5 11 7 114 176 -35% 3 10 1,08% 1.191.027CAQUETÁ 6 5 6 4 4 14 10 6 4 5 9 7 80 69 16% 4 17 0,76% 472.423
CAUCA 21 24 17 15 17 13 23 9 24 15 16 26 220 187 18% 7 17 2,09% 1.289.040CASANARE 9 3 11 5 5 5 3 5 4 10 4 0 64 52 23% 10 19 0,61% 330.528CESAR 6 4 5 12 13 12 11 9 12 10 7 12 113 71 59% 6 11 1,07% 1.069.755
CÓRDOBA 8 7 8 11 5 2 6 1 6 6 5 9 74 49 51% 1 5 0,70% 1.464.772CUNDINAMARCA 10 14 8 3 8 7 9 15 7 6 7 5 99 44 125% 1 4 0,94% 2.402.356CHOCÓ 5 3 0 3 0 0 0 7 3 0 2 0 23 33 -30% 33 6 0,22% 386.705GUAJIRA 1 2 3 5 3 3 5 3 1 4 3 2 35 1 3400% 90 7 0,33% 534.457GUAINÍA 0 0 0 0 0 0 0 1 0 0 1 0 2 2 0% 143 5 0,02% 43.876
GUAVIARE 6 1 3 4 2 5 2 2 3 7 5 2 42 14 200% 5 20 0,40% 208.832MAGDALENA 20 9 12 16 17 17 25 26 23 7 16 24 212 100 112% 16 15 2,01% 1.428.333MAGDALENA MEDIO 11 23 11 9 10 11 9 13 19 15 14 8 153 136 13% 55 29 1,45% 527.465
META 20 23 13 24 19 28 27 25 25 29 45 23 301 192 57% 9 40 2,86% 745.410NARIÑO 20 21 25 20 22 16 33 17 8 13 11 7 213 337 -37% 11 12 2,02% 1.804.020NORTE DE SANTANDER 9 12 13 13 15 8 14 16 13 18 12 18 161 255 -37% 7 11 1,53% 1.517.817PUTUMAYO 9 2 4 3 3 1 1 0 7 5 4 8 47 35 34% 3 12 0,45% 384.772QUINDÍO 5 12 9 7 4 4 2 6 8 15 18 11 101 80 26% 4 16 0,96% 622.395
RISARALDA 56 32 29 46 52 65 51 25 37 33 27 30 483 357 35% 10 46 4,59% 1.041.735SANTANDER 23 20 15 22 24 28 35 27 32 27 30 26 309 277 12% 3 17 2,93% 1.847.582SAN ANDRÉS 5 4 4 1 2 6 0 6 5 3 4 2 42 68 -38% 29 50 0,40% 84.720
SUCRE 11 2 6 8 3 6 2 1 2 5 4 6 56 94 -40% 3 6 0,53% 883.962TOLIMA 9 7 12 28 19 15 22 9 25 16 14 15 191 172 11% 4 15 1,81% 1.312.344HUILA 29 33 24 35 23 33 40 24 30 36 34 24 365 451 -19% 10 36 3,47% 1.012.356URABÁ 4 5 1 2 3 1 1 1 1 2 3 4 28 59 -53% 11 5 0,27% 517.686VALLE 81 53 78 68 92 87 65 59 50 26 11 8 678 325 109% 4 34 6,44% 2.013.860
VICHADA 0 1 0 1 2 0 0 1 0 0 1 1 7 3 133% 1.750 7 0,07% 97.656METROPOLITAN BOGOTÁ 117 108 109 90 91 84 99 92 118 113 90 93 1.204 1.229 -2% 59 16 11,43% 7.299.374METROPOLITAN CALI 102 154 109 138 115 141 151 157 124 142 140 133 1.606 1.013 59% 66 60 15,25% 2.697.267
METROPOLITAN MEDELLÍN 140 127 164 148 159 156 149 135 119 100 100 83 1.580 1.708 -7% 30 48 15,00% 3.318.225TOTAL 919 917 894 886 900 925 983 869 854 816 819 749 10.531 9.016 17% 9 23 100,00% 46.772.286
Avenida El Dorado No. 75 – 25 (Bogotá - Colombia) / Tel. (57) (1) 4266333 www.policia.gov.co / [email protected] / [email protected]
8

Crime Report 2006
COLOMBIAN NATIONAL POLICE ▲ DIJIN
TABLE 13. TOTAL MOTOR VEHICLE THEFTS
POLICE DEPARTMENT
JAN
UA
RY
FEB
RU
AR
Y
MA
RC
H
AP
RIL
MA
Y
JUN
E
JULY
AU
GU
ST
SEP
TEM
BER
OC
TOB
ER
NO
VEN
BER
DEC
EMB
ER
TOTA
L 2
00
6
TOTA
L 2
00
5
PER
CEN
TAG
E V
AR
IATI
ON
20
06
-2
00
5
THEF
T R
ATE
PER
1
.00
0 R
EGIS
TER
ED
MO
TOR
VEH
ICLE
S
THEF
T R
ATE
PER
1
00
.00
0
INH
AB
ITA
NTS
20
06
PER
CEN
TAG
E P
AR
TIC
IPA
TIO
N
20
06
PO
PU
LATI
ON
20
06
AMAZONAS 1 3 0 3 1 1 0 1 1 2 1 1 15 17 -12% 4 18 0,08% 81.758ANTIOQUIA 18 14 15 8 12 11 4 5 2 2 14 8 113 135 -16% 0 6 0,57% 1.931.837ARAUCA 13 8 1 2 6 4 2 2 0 2 6 1 47 45 4% 3 16 0,24% 292.540ATLÁNTICO 126 143 149 119 126 125 173 167 138 126 147 139 1.678 1.250 34% 10 70 8,48% 2.408.194BOLÍVAR 57 60 54 49 57 65 54 56 35 56 73 52 668 472 42% 9 32 3,38% 2.116.932BOYACÁ 11 10 7 10 9 4 15 19 11 6 16 13 131 132 -1% 2 9 0,66% 1.390.276CALDAS 20 18 24 25 19 9 14 11 15 9 15 12 191 254 -25% 2 16 0,97% 1.191.027CAQUETÁ 8 6 8 5 4 15 11 7 4 5 11 7 91 77 18% 4 19 0,46% 472.423CAUCA 34 51 27 32 22 24 36 19 40 33 32 52 402 389 3% 7 31 2,03% 1.289.040CASANARE 9 8 13 5 5 5 4 7 4 11 5 1 77 67 15% 9 23 0,39% 330.528CESAR 8 9 7 20 14 17 17 13 15 18 10 19 167 122 37% 4 16 0,84% 1.069.755CÓRDOBA 8 7 8 12 5 2 6 1 6 6 6 10 77 57 35% 1 5 0,39% 1.464.772CUNDINAMARCA 39 49 19 19 36 22 25 28 18 19 18 15 307 174 76% 1 13 1,55% 2.402.356CHOCÓ 5 3 0 3 0 0 0 7 3 0 2 0 23 33 -30% 21 6 0,12% 386.705GUAJIRA 3 10 5 6 4 6 12 7 5 5 6 3 72 19 279% 33 13 0,36% 534.457GUAINÍA 0 0 0 0 0 0 0 1 0 0 1 0 2 2 0% 56 5 0,01% 43.876GUAVIARE 6 1 3 4 2 5 2 2 3 7 5 2 42 17 147% 5 20 0,21% 208.832MAGDALENA 28 11 14 23 22 21 28 29 25 8 21 27 257 131 96% 7 18 1,30% 1.428.333MAGDALENA MEDIO 14 29 15 14 11 12 11 19 22 17 15 8 187 183 2% 65 35 0,95% 527.465META 29 35 24 40 26 41 33 35 38 42 50 31 424 287 48% 6 57 2,14% 745.410NARIÑO 29 24 33 30 40 27 53 32 15 24 34 14 355 508 -30% 7 20 1,80% 1.804.020NORTE DE SANTANDER 20 24 33 25 32 24 29 27 19 20 24 26 303 465 -35% 6 20 1,53% 1.517.817PUTUMAYO 10 4 4 3 3 3 1 1 7 5 4 8 53 41 29% 3 14 0,27% 384.772QUINDÍO 10 18 12 14 11 7 7 15 18 26 32 20 190 196 -3% 3 31 0,96% 622.395RISARALDA 81 56 60 66 68 78 68 40 57 50 44 45 713 548 30% 7 68 3,61% 1.041.735SANTANDER 36 37 26 33 37 37 48 41 43 43 48 46 475 413 15% 2 26 2,40% 1.847.582SAN ANDRÉS 6 4 4 1 2 6 0 6 5 3 4 2 43 70 -39% 9 51 0,22% 84.720SUCRE 14 3 6 10 3 6 2 2 4 5 5 8 68 100 -32% 2 8 0,34% 883.962TOLIMA 14 8 17 38 22 17 26 17 36 26 19 17 257 293 -12% 2 20 1,30% 1.312.344HUILA 36 37 27 38 25 39 47 26 34 42 37 27 415 532 -22% 6 41 2,10% 1.012.356URABÁ 4 5 2 2 3 1 1 1 1 2 3 4 29 63 -54% 12 6 0,15% 517.686VALLE 110 81 99 91 118 113 89 82 64 42 14 12 915 439 108% 4 45 4,63% 2.013.860VICHADA 0 1 0 1 3 0 0 1 0 0 1 1 8 4 100% 364 8 0,04% 97.656METROPOLITAN BOGOTÁ 428 396 421 409 414 434 426 387 421 406 359 328 4.829 5.869 -18% 7 66 24,42% 7.299.374METROPOLITAN CALI 216 288 238 274 203 269 270 306 243 269 304 245 3.125 2.138 46% 12 116 15,80% 2.697.267METROPOLITAN MEDELLÍN 250 250 274 269 297 298 275 266 253 227 214 155 3.028 3.435 -12% 13 91 15,31% 3.318.225
TOTAL 1.701 1.711 1.649 1.703 1.662 1.748 1.789 1.686 1.605 1.564 1.600 1.359 19.777 18.977 4% 5 42 100,00% 46.772.286
Avenida El Dorado No. 75 – 25 (Bogotá - Colombia) / Tel. (57) (1) 4266333 www.policia.gov.co / [email protected] / [email protected]
9

Crime Report 2006
COLOMBIAN NATIONAL POLICE ▲ DIJIN
TABLE 14. HIGHWAY BANDITRY
POLICE DEPARTMENT
JAN
UA
RY
FEB
RU
AR
Y
MA
RC
H
AP
RIL
MA
Y
JUN
E
JULY
AU
GU
ST
SEP
TEM
BER
OC
TOB
ER
NO
VEN
BER
DEC
EMB
ER
TOTA
L 2
00
6
TOTA
L 2
00
5
PER
CEN
TAG
E V
AR
IATI
ON
2
00
6-2
00
5
RA
TE P
ER
10
0.0
00
IN
HA
BIT
AN
TS
20
06
PA
RTI
CIP
ATI
ON
2
00
6
PO
PU
LATI
ON
2
006
AMAZONAS 0 0 0 0 0 0 0 0 0 0 0 0 0 0 0% 0 0,00% 81.758ANTIOQUIA 0 0 1 0 1 2 0 0 1 1 2 1 9 4 125% 0 1,34% 1.931.837ARAUCA 2 2 0 2 0 0 0 0 0 1 1 0 8 3 167% 3 1,19% 292.540ATLÁNTICO 5 4 5 1 5 7 1 3 1 2 6 6 46 58 -21% 2 6,86% 2.408.194BOLÍVAR 0 1 4 3 0 0 2 1 1 2 3 1 18 10 80% 1 2,68% 2.116.932BOYACÁ 2 2 2 0 0 1 2 0 1 1 0 0 11 3 267% 1 1,64% 1.390.276CALDAS 0 1 2 1 0 0 0 1 0 0 1 0 6 8 -25% 1 0,89% 1.191.027CAQUETÁ 0 0 0 0 0 0 0 0 0 0 0 0 0 0 0% 0 0,00% 472.423CAUCA 2 1 4 1 1 2 1 1 0 2 5 6 26 27 -4% 2 3,87% 1.289.040CASANARE 0 0 0 0 0 0 1 0 0 0 0 0 1 0 100% 0 0,15% 330.528CESAR 2 2 0 0 0 0 2 2 0 2 1 2 13 2 550% 1 1,94% 1.069.755CÓRDOBA 0 0 0 0 0 0 0 0 0 0 1 0 1 0 100% 0 0,15% 1.464.772CUNDINAMARCA 8 13 4 7 8 8 3 1 1 4 2 0 59 44 34% 2 8,79% 2.402.356CHOCÓ 0 0 0 0 0 0 0 0 0 0 0 0 0 0 0% 0 0,00% 386.705GUAJIRA 0 1 0 0 0 0 0 0 0 1 0 0 2 2 0% 0 0,30% 534.457GUAINÍA 0 0 0 0 0 0 0 0 0 0 0 0 0 0 0% 0 0,00% 43.876GUAVIARE 0 0 0 0 0 0 0 0 0 0 0 0 0 0 0% 0 0,00% 208.831MAGDALENA 0 0 0 0 0 0 0 1 0 2 2 1 6 1 500% 0 0,89% 1.428.333MAGDALENA MEDIO 1 5 2 3 0 1 0 5 2 1 0 0 20 22 -9% 4 2,98% 527.465META 0 0 0 0 2 0 0 1 0 0 0 0 3 2 50% 0 0,45% 745.410NARIÑO 0 0 0 1 0 3 1 0 0 0 0 0 5 3 67% 0 0,75% 1.804.020NORTE DE SANTANDER 0 0 0 0 0 0 0 0 0 0 0 1 1 2 -50% 0 0,15% 1.517.817PUTUMAYO 0 0 0 0 0 1 0 0 0 0 0 0 1 2 -50% 0 0,15% 384.772QUINDÍO 0 0 0 0 0 0 1 1 0 0 0 1 3 5 -40% 0 0,45% 622.395RISARALDA 0 1 1 0 0 0 1 0 0 0 0 0 3 5 -40% 0 0,45% 1.041.735SANTANDER 4 6 2 3 6 2 4 4 6 7 4 7 55 39 41% 3 8,20% 1.847.582SAN ANDRÉS 0 0 0 0 0 0 0 0 0 0 0 0 0 0 0% 0 0,00% 84.720SUCRE 0 0 0 0 0 0 0 0 0 0 0 0 0 0 0% 0 0,00% 883.962TOLIMA 1 0 2 3 2 1 3 2 4 5 2 1 26 50 -48% 2 3,87% 1.312.344HUILA 1 0 0 0 0 0 0 0 0 2 1 2 6 14 -57% 1 0,89% 1.012.356URABÁ 0 0 0 0 0 0 0 0 0 0 0 0 0 0 0% 0 0,00% 517.686VALLE 2 6 3 1 7 7 2 4 3 1 0 0 36 38 -5% 2 5,37% 2.013.860VICHADA 0 0 0 0 0 0 0 0 0 0 0 0 0 0 0% 0 0,00% 97.656METROPOLITAN BOGOTÁ 9 9 10 5 12 7 10 12 9 13 22 13 131 171 -23% 2 19,52% 7.299.374METROPOLITAN CALI 6 6 1 7 13 6 7 13 9 7 14 7 96 49 96% 4 14,31% 2.697.267METROPOLITAN MEDELLÍN 7 13 5 1 6 6 8 4 9 8 5 7 79 149 -47% 2 11,77% 3.318.225
TOTAL 52 73 48 39 63 54 49 56 47 62 72 56 671 713 -6% 1 100,00% 46.772.286IT IS NECESSARY TO CLARIFY THAT VAUPES PROVINCE'S POPULATION IS REGISTERED BY GUAVIARE PROVINCE'S JURISDICTION.
Avenida El Dorado No. 75 – 25 (Bogotá - Colombia) / Tel. (57) (1) 4266333 www.policia.gov.co / [email protected] / [email protected]
10

Crime Report 2006
COLOMBIAN NATIONAL POLICE ▲ DIJIN
TABLE 15. BANK ROBBERY
POLICE DEPARTMENT
JAN
UAR
Y
FEBR
UAR
Y
MAR
CH
APR
IL
MAY
JUN
E
JULY
AU
GU
ST
SEPTE
MBER
OCTO
BER
NO
VEN
BER
DEC
EMBER
TOTA
L 2006
TOTA
L 2005
PER
CEN
TAG
E VAR
IATI
ON
2006-2
005
RATE
PER
100.0
00
INH
ABIT
AN
TS
2006
PAR
TICIP
ATI
ON
2006
PO
PU
LATI
ON
2006
AMAZONAS 0 0 0 0 0 0 0 0 0 0 0 0 0 0 0% 0 0,00% 81.758ANTIOQUIA 0 0 0 0 0 0 0 1 1 0 1 0 3 0 100% 0 3,26% 1.931.837ARAUCA 0 0 0 0 0 0 0 0 0 0 0 0 0 0 0% 0 0,00% 292.540ATLANTICO 0 0 3 1 2 2 1 1 2 3 4 3 22 8 175% 1 23,91% 2.408.194BOLIVAR 0 0 1 0 0 0 0 0 0 0 0 0 1 0 100% 0 1,09% 2.116.932BOYACÁ 0 0 0 0 0 0 0 0 0 0 0 0 0 4 -100% 0 0,00% 1.390.276
CALDAS 0 0 0 0 0 0 0 0 1 0 0 0 1 2 -50% 0 1,09% 1.191.027
CAQUETA 0 0 0 0 0 0 0 0 0 0 0 0 0 0 0% 0 0,00% 472.423
CAUCA 0 0 0 0 0 0 1 1 0 0 0 0 2 3 -33% 0 2,17% 1.289.040
CASANARE 0 0 0 0 0 0 0 0 0 0 0 0 0 1 -100% 0 0,00% 330.528
CESAR 0 0 0 0 0 0 0 0 0 0 0 0 0 0 0% 0 0,00% 1.069.755
CORDOBA 1 1 1 1 0 0 0 0 0 0 1 0 5 2 150% 0 5,43% 1.464.772
CUNDINAMARCA 0 0 0 0 0 0 0 0 0 0 1 0 1 5 -80% 0 1,09% 2.402.356
CHOCÓ 0 0 0 0 0 0 0 0 0 0 0 0 0 0 0% 0 0,00% 386.705
GUAJIRA 1 0 0 0 0 0 0 0 0 0 0 0 1 0 100% 0 1,09% 534.457
GUAINIA 1 0 0 0 0 0 0 0 0 0 0 0 1 0 100% 2 1,09% 43.876
GUAVIARE 0 0 0 0 0 0 0 0 0 0 0 0 0 0 0% 0 0,00% 208.832
MAGDALENA 1 0 1 1 0 1 0 1 0 0 0 1 6 0 100% 0 6,52% 1.428.333
MAGDALENA MEDIO 0 0 0 0 0 0 0 0 0 0 0 0 0 1 -100% 0 0,00% 527.465
META 1 0 0 0 0 0 0 0 1 0 0 0 2 1 100% 0 2,17% 745.410
NARIÑO 0 0 0 0 0 0 0 1 0 0 0 0 1 0 100% 0 1,09% 1.804.020
NORTE DE SANTANDER 0 0 0 0 0 0 0 0 0 0 0 0 0 2 -100% 0 0,00% 1.517.817
PUTUMAYO 1 0 0 0 0 0 0 0 0 0 0 0 1 0 100% 0 1,09% 384.772
QUINDÍO 0 0 0 0 0 0 0 0 0 0 0 0 0 0 0% 0 0,00% 622.395
RISARALDA 0 0 0 0 0 0 0 0 0 0 0 0 0 1 -100% 0 0,00% 1.041.735
SANTANDER 0 0 0 0 0 0 0 0 1 0 0 1 2 3 -33% 0 2,17% 1.847.582
SAN ANDRES 0 0 0 0 0 0 0 0 0 0 0 0 0 0 0% 0 0,00% 84.720
SUCRE 1 0 0 0 0 0 0 0 0 0 0 0 1 1 0% 0 1,09% 883.962
TOLIMA 0 0 0 0 1 0 0 2 0 0 0 0 3 2 50% 0 3,26% 1.312.344
HUILA 0 0 0 0 0 0 0 0 0 1 1 0 2 3 -33% 0 2,17% 1.012.356
URABÁ 0 0 0 0 0 0 0 0 0 0 0 0 0 0 0% 0 0,00% 517.686
VALLE 0 0 0 0 0 0 0 0 0 1 0 0 1 0 100% 0 1,09% 2.013.860
VICHADA 0 0 0 0 0 0 0 0 0 0 0 0 0 0 0% 0 0,00% 97.656
METROPOLITAN BOGOTÁ 1 1 0 0 0 0 1 1 0 1 1 0 6 32 -81% 0 6,52% 7.299.374
METROPOLITAN CALI 2 2 0 2 0 2 2 3 3 2 2 0 20 8 150% 1 21,74% 2.697.267
METROPOLITAN MEDELLÍN 2 2 1 0 0 0 2 1 0 2 0 0 10 12 -17% 0 10,87% 3.318.225
TOTAL 12 6 7 5 3 5 7 12 9 10 11 5 92 91 1% 0 100,00% 46.772.286
Avenida El Dorado No. 75 – 25 (Bogotá - Colombia) / Tel. (57) (1) 4266333 www.policia.gov.co / [email protected] / [email protected]
11

Crime Report 2006
COLOMBIAN NATIONAL POLICE ▲ DIJIN
TABLE 16. KIDNAPPING
POLICE DEPARTMENT
JAN
UA
RY
FEB
RU
AR
Y
MA
RC
H
AP
RIL
MA
Y
JUN
E
JULY
AU
GU
ST
SEP
TEM
BER
OC
TOB
ER
NO
VEN
BER
DEC
EMB
ER
TOTA
L 2
00
6
TOTA
L 2
00
5
PER
CEN
TAG
E V
AR
IATI
ON
20
06
-2
00
5
RA
TE P
ER 1
00
.00
0
INH
AB
ITA
NTS
20
06
PA
RTI
CIP
ATI
ON
2
00
6
PO
PU
LATI
ON
20
06
AMAZONAS 0 0 0 0 0 0 0 0 0 0 0 0 0 0 0% 0 0,00% 81.758ANTIOQUIA 4 4 7 0 6 5 0 5 5 6 1 1 44 41 7% 2 6,40% 1.931.83ARAUCA 4 0 0 3 0 1 0 1 0 0 2 0 11 14 -21% 4 1
7,60% 292.54
ATLÁNTICO 1 0 0 0 1 1 0 0 0 2 1 0 6 9 -33% 0 00
,87% 2.408.19BOLÍVAR 0 4 0 2 1 1 1 2 0 0 0 1 12 23 -48% 1 1
4,75% 2.116.93
BOYACÁ 1 0 0 2 0 1 1 1 1 1 0 0 8 8 0% 1 12
,16% 1.390.27CALDAS 0 0 0 0 0 2 1 1 0 0 1 0 5 24 -79% 0 0
6,73% 1.191.02
CAQUETÁ 3 4 2 2 3 2 2 1 0 0 2 2 23 27 -15% 5 37
,35% 472.42CAUCA 9 4 3 4 2 4 2 1 4 5 3 1 42 60 -30% 3 6
3,11% 1.289.04
CASANARE 0 0 1 0 7 4 0 4 0 1 0 1 18 23 -22% 5 20
,62% 330.52CESAR 1 1 2 3 3 0 1 2 0 1 0 0 14 13 8% 1 2
8,04% 1.069.75
CÓRDOBA 0 0 0 0 1 0 1 0 0 0 1 0 3 2 50% 0 05
,44% 1.464.77CUNDINAMARCA 6 6 3 3 3 4 2 5 8 1 3 1 45 58 -22% 2 6
2,55% 2.402.35
CHOCÓ 0 0 1 2 0 1 0 6 1 0 2 0 13 11 18% 3 16
,89% 386.70GUAJIRA 0 0 1 0 0 1 1 0 0 0 1 1 5 16 -69% 1 0
5,73% 534.45
GUAINÍA 0 0 0 0 0 0 0 0 0 0 0 0 0 0 0% 0 07
,00% 43.876GUAVIARE 0 1 0 0 1 0 0 0 2 0 0 0 4 12 -67% 2 0,58% 208.83MAGDALENA 1 2 1 6 2 3 3 2 2 1 3 0 26 14 86% 2 3
2,78% 1.428.33
MAGDALENA MEDIO 1 7 3 0 0 1 0 0 2 0 0 0 14 12 17% 3 23
,04% 527.46META 6 8 2 4 7 7 11 11 2 6 9 2 75 86 -13% 10 10
5,92% 745.410
NARIÑO 4 5 6 4 2 3 0 0 5 2 0 2 33 61 -46% 2 4,80% 1.804.02NORTE DE SANTANDER 2 4 0 2 2 1 3 6 5 3 0 0 28 22 27% 2 4
0,08% 1.517.81
PUTUMAYO 1 0 1 0 0 1 1 0 2 0 1 1 8 4 100% 2 17
,16% 384.77QUINDÍO 0 0 0 0 0 0 0 0 0 0 0 0 0 0 0% 0 0
2,00% 622.39
RISARALDA 1 0 2 4 0 1 3 1 1 0 0 2 15 23 -35% 1 25
,18% 1.041.73SANTANDER 1 1 0 3 0 0 0 2 0 0 1 0 8 29 -72% 0 1
5,16% 1.847.58
SAN ANDRÉS 0 0 0 0 0 0 0 0 0 0 0 0 0 0 0% 0 02
,00% 84.720SUCRE 1 1 1 0 1 3 0 0 0 1 0 2 10 13 -23% 1 1,46% 883.96TOLIMA 1 2 2 3 9 1 3 9 8 8 7 5 58 63 -8% 4 8
2,44% 1.312.34
HUILA 0 1 1 1 3 1 3 0 4 2 0 1 17 23 -26% 2 24
,47% 1.012.35URABÁ 0 0 0 0 0 0 2 4 4 2 0 0 12 16 -25% 2 1
6,75% 517.68
VALLE 1 3 6 4 3 2 2 0 4 4 2 2 33 30 10% 2 46
,80% 2.013.86VICHADA 0 0 0 0 0 0 0 0 1 0 0 0 1 2 -50% 1 0
0,15% 97.656
METROPOLITAN BOGOTÁ 4 5 9 6 2 7 3 10 13 7 6 3 75 36 108% 1 10,92% 7.299.374METROPOLITAN CALI 1 1 1 1 3 0 1 2 0 3 1 1 15 17 -12% 1 2,18% 2.697.26METROPOLITAN MEDELLÍN 1 0 1 1 1 0 0 0 1 0 0 1 6 8 -25% 0 0
7,87% 3.318.22
TOTAL 55 64 56 60 63 58 47 76 75 56 47 30 687 800 -14% 1 1005
,00% 46.772.286
Avenida El Dorado No. 75 – 25 (Bogotá - Colombia) / Tel. (57) (1) 4266333 www.policia.gov.co / [email protected] / [email protected]
12

Crime Report 2006
COLOMBIAN NATIONAL POLICE ▲ DIJIN
TABLE 17. EXTORTION
POLICE DEPARTMENT
JAN
UA
RY
FEB
RU
AR
Y
MA
RC
H
AP
RIL
MA
Y
JUN
E
JULY
AU
GU
ST
SEP
TEM
BER
OC
TOB
ER
NO
VEN
BER
DEC
EMB
ER
TOTA
L 2
00
6
TOTA
L 2
00
5
PER
CEN
TAG
E V
AR
IATI
ON
20
06
-2
00
5
RA
TE P
ER 1
00
.00
0
INH
AB
ITA
NTS
20
06
PA
RTI
CIP
ATI
ON
2
00
6
PO
PU
LATI
ON
20
06
AMAZONAS 0 0 0 0 0 0 0 0 0 0 0 0 0 0 0% 0 0,00% 81.758ANTIOQUIA 15 9 17 9 6 6 9 15 7 6 1 3 103 98 5% 5 6,23% 1.931.837ARAUCA 0 1 0 0 0 0 1 0 0 1 0 0 3 3 0% 1 0,18% 292.540ATLÁNTICO 10 3 7 15 10 5 3 6 2 4 4 4 73 112 -35% 3 4,42% 2.408.194BOLÍVAR 3 5 2 5 3 3 6 3 0 4 2 2 38 51 -25% 2 2,30% 2.116.932BOYACÁ 4 3 4 4 5 5 0 5 4 2 6 0 42 21 100% 3 2,54% 1.390.276CALDAS 0 2 3 3 1 0 3 1 1 2 0 1 17 50 -66% 1 1,03% 1.191.027CAQUETÁ 4 1 2 1 2 1 1 0 3 2 2 1 20 21 -5% 4 1,21% 472.423CAUCA 2 5 11 4 0 4 8 5 3 3 4 1 50 32 56% 4 3,03% 1.289.040CASANARE 5 6 5 2 8 2 3 5 2 4 0 0 42 22 91% 13 2,54% 330.528CESAR 1 16 5 3 12 7 7 3 2 6 4 1 67 53 26% 6 4,06% 1.069.755CÓRDOBA 0 0 2 1 0 1 1 2 2 0 1 1 11 7 57% 1 0,67% 1.464.772CUNDINAMARCA 12 14 13 9 18 12 7 12 14 3 7 3 124 58 114% 5 7,51% 2.402.356CHOCÓ 0 0 1 0 0 0 0 1 0 0 0 0 2 0 100% 1 0,12% 386.705GUAJIRA 0 1 2 1 0 0 0 1 1 2 1 0 9 5 80% 2 0,54% 534.457GUAINÍA 0 0 0 0 0 0 0 1 0 0 0 0 1 2 -50% 2 0,06% 43.876GUAVIARE 0 1 0 1 1 0 1 0 0 0 0 0 4 2 100% 2 0,24% 208.832MAGDALENA 3 10 5 1 1 4 4 5 5 9 4 2 53 51 4% 4 3,21% 1.428.333MAGDALENA MEDIO 0 0 0 0 1 1 0 1 1 1 1 0 6 14 -57% 1 0,36% 527.465META 12 11 17 13 13 15 5 14 11 17 10 7 145 134 8% 19 8,78% 745.410NARIÑO 10 18 14 6 7 4 4 3 4 5 3 2 80 109 -27% 4 4,84% 1.804.020NORTE DE SANTANDER 5 4 5 5 5 7 6 4 6 12 9 4 72 47 53% 5 4,36% 1.517.817PUTUMAYO 0 0 0 0 0 1 0 1 0 1 0 0 3 1 200% 1 0,18% 384.772QUINDÍO 1 0 0 2 0 3 0 2 0 2 0 0 10 12 -17% 2 0,61% 622.395RISARALDA 0 6 7 3 2 3 3 2 2 4 0 2 34 34 0% 3 2,06% 1.041.735SANTANDER 0 2 4 8 5 0 1 1 2 2 1 0 26 92 -72% 1 1,57% 1.847.582SAN ANDRÉS 0 0 0 0 0 0 0 0 0 0 0 0 0 0 0% 0 0,00% 84.720SUCRE 15 4 11 5 7 7 2 1 2 0 3 4 61 97 -37% 7 3,69% 883.962TOLIMA 17 7 11 10 7 9 10 12 9 8 11 10 121 133 -9% 9 7,32% 1.312.344HUILA 32 8 6 6 10 12 10 17 8 4 6 5 124 127 -2% 12 7,51% 1.012.356URABÁ 0 0 0 0 3 0 3 1 0 0 0 0 7 2 250% 1 0,42% 517.686VALLE 4 3 3 0 1 3 2 8 3 2 2 3 34 28 21% 2 2,06% 2.013.860VICHADA 0 0 0 0 0 0 0 0 0 0 0 0 0 4 -100% 0 0,00% 97.656METROPOLITAN BOGOTÁ 15 9 12 13 4 10 6 13 8 19 16 5 130 155 -16% 2 7,87% 7.299.374METROPOLITAN CALI 10 5 13 9 10 5 3 1 3 3 2 2 66 84 -21% 2 4,00% 2.697.267METROPOLITAN MEDELLÍN 1 6 10 6 14 5 8 4 4 6 4 6 74 78 -5% 2 4,48% 3.318.225
TOTAL 181 160 192 145 156 135 117 150 109 134 104 69 1.652 1.739 -5% 4 100,00% 46.772.286
Avenida El Dorado No. 75 – 25 (Bogotá - Colombia) / Tel. (57) (1) 4266333 www.policia.gov.co / [email protected] / [email protected]
13

Crime Report 2006
COLOMBIAN NATIONAL POLICE ▲ DIJIN
TABLE 18. TERRORIST ACTIONS
POLICE DEPARTMENT
JAN
UA
RY
FEB
RU
AR
Y
MA
RC
H
AP
RIL
MA
Y
JUN
E
JULY
AU
GU
ST
SEP
TEM
BER
OC
TOB
ER
NO
VEN
BER
DEC
EMB
ER
TOTA
L 2
00
6
TOTA
L 2
00
5
PER
CEN
TAG
E V
AR
IATI
ON
20
06
-2
00
5
RA
TE P
ER
10
0.0
00
IN
HA
BIT
AN
TS
20
06
PA
RTI
CIP
ATI
ON
2
00
6
PO
PU
LATI
ON
2
00
6
AMAZONAS 0 0 0 0 0 0 0 0 0 0 0 0 0 0 0% 0 0,00% 81.758ANTIOQUIA 4 3 12 7 2 1 2 2 0 0 3 0 36 51 -29% 2 5,57% 1.931.837ARAUCA 4 10 7 4 6 0 0 2 0 0 0 0 33 62 -47% 11 5,11% 292.540ATLÁNTICO 2 0 3 1 1 0 0 0 0 0 0 0 7 23 -70% 0 1,08% 2.408.194BOLÍVAR 0 2 5 3 1 0 0 0 1 0 0 0 12 9 33% 1 1,86% 2.116.932BOYACÁ 1 0 0 0 1 0 1 0 0 1 2 0 6 17 -65% 0 0,93% 1.390.276CALDAS 0 2 4 2 1 0 2 3 4 4 1 2 25 8 213% 2 3,87% 1.191.027CAQUETÁ 1 6 6 2 1 0 1 2 2 3 1 1 26 26 0% 6 4,02% 472.423CAUCA 0 1 4 0 1 1 4 4 4 2 2 2 25 15 67% 2 3,87% 1.289.040CASANARE 0 0 1 1 1 1 0 1 1 0 0 0 6 9 -33% 2 0,93% 330.528CESAR 0 1 0 1 1 0 0 1 0 0 1 0 5 5 0% 0 0,77% 1.069.755CÓRDOBA 0 0 1 0 0 0 0 0 0 0 2 0 3 3 0% 0 0,46% 1.464.772CUNDINAMARCA 0 2 0 0 0 0 0 0 0 0 10 0 12 5 140% 0 1,86% 2.402.356CHOCÓ 0 0 2 1 0 0 1 1 0 0 0 0 5 6 -17% 1 0,77% 386.705GUAJIRA 1 4 2 0 5 2 0 1 0 1 0 0 16 3 433% 3 2,48% 534.457GUAINÍA 0 0 0 0 0 0 0 0 0 0 0 0 0 0 0% 0 0,00% 43.876GUAVIARE 0 1 1 0 0 0 0 1 0 1 0 0 4 19 -79% 2 0,62% 208.831MAGDALENA 0 0 0 0 1 0 0 0 1 2 0 0 4 6 -33% 0 0,62% 1.428.333MAGDALENA MEDIO 0 1 0 4 0 1 5 0 0 1 0 0 12 1 1100% 2 1,86% 527.465META 8 12 3 5 6 6 7 5 0 7 3 1 63 54 17% 8 9,75% 745.410NARIÑO 1 2 5 4 3 2 8 7 0 0 0 0 32 16 100% 2 4,95% 1.804.020NORTE DE SANTANDER 5 13 7 7 5 11 3 21 3 8 1 3 87 53 64% 6 13,47% 1.517.817PUTUMAYO 12 13 3 1 1 0 0 4 0 2 1 2 39 62 -37% 10 6,04% 384.772QUINDÍO 0 1 1 0 0 0 0 0 0 0 0 1 3 16 -81% 0 0,46% 622.395RISARALDA 0 0 2 0 2 1 1 1 1 0 0 2 10 5 100% 1 1,55% 1.041.735SANTANDER 0 1 0 0 4 0 1 0 2 4 2 3 17 9 89% 1 2,63% 1.847.582SAN ANDRÉS 0 0 0 0 0 0 0 0 0 0 0 0 0 0 0% 0 0,00% 84.720SUCRE 1 0 1 0 0 0 0 0 0 0 0 0 2 16 -88% 0 0,31% 883.962TOLIMA 0 3 9 4 4 2 1 2 0 2 3 0 30 20 50% 2 4,64% 1.312.344HUILA 1 3 0 5 1 1 1 2 3 2 2 6 27 35 -23% 3 4,18% 1.012.356URABÁ 0 0 0 0 0 0 0 0 0 0 0 0 0 5 -100% 0 0,00% 517.686VALLE 3 0 2 2 22 1 0 9 2 3 2 0 46 22 109% 2 7,12% 2.013.860VICHADA 0 1 0 0 1 0 0 0 0 0 0 0 2 0 100% 2 0,31% 97.656METROPOLITAN BOGOTÁ 4 0 7 5 1 0 1 1 0 1 0 1 21 12 75% 0 3,25% 7.299.37METROPOLITAN CALI 1 2 0 0 0 0 1 3 1 4 9 8 29 17 71% 1 4
4,49% 2.697.267
METROPOLITAN MEDELLÍN 0 0 0 0 0 0 0 0 0 1 0 0 1 2 -50% 0 0,15% 3.318.225TOTAL 49 84 88 59 72 30 40 73 25 49 45 32 646 612 6% 1 100,00% 46.772.286
Avenida El Dorado No. 75 – 25 (Bogotá - Colombia) / Tel. (57) (1) 4266333 www.policia.gov.co / [email protected] / [email protected]
14

Crime Report 2006
Avenida El Dorado No. 75 – 25 (Bogotá - Colombia) / Tel. (57) (1) 4266333 www.policia.gov.co / [email protected] / [email protected]
COLOMBIAN NATIONAL POLICE ▲ DIJIN
1
TABLE 19. OPERATIONAL ACHIEVEMENTS COMPARISON 2005-2006
2005 2006 ABSOLUTE PERCENTAGE
342.031 270.025 -72.006 -21%
CAPTURED 2.509 2.306 -203 -8%
KILLED IN ACTION 63 48 -15 -24%
SUBMITTED * 224 202 -22 -10%
CAPTURED 1.903 747 -1.156 -61%
KILLED IN ACTION 26 7 -19 -73%
SUBMITTED * 940 50 -890 -95%
143 111 -32 -22%
CARS 15.666 10.637 -5.029 -32%
VALUE IN MILLION PESOS 447.000 359.781 -87.219 -20%
MOTORCYCLES 13.603 10.215 -3.388 -25%
VALUE IN MILLION PESOS 40.634 32.604 -8.030 -20%
RECOVERED 627.013 526.858 -100.155 -16%
SEIZED 1.261.568 2.062.328 800.760 63%
74.581 70.047 -4.534 -6%
COCAINE 74.417 51.567 -22.850 -31%
MARIHUANA 92.423 89.040 -3.383 -4%
COCA BASE 19.803 33.026 13.223 67%
HEROIN 722 424 -298 -41%
POPPY 2.129 1.972 -157 -7%
COCA 172.943 213.480 40.537 23%
Guerrilla or Self-Deffense members who voluntarily surrended to the National Police
MERCHANDISE (VALUE IN MILLION
PESOS)
FIREARMS SEIZED
ILLICIT DRUG SEIZURES
(KILOGRAMS)
HECTARES SPRAYED OR MANUALLY
ERRADICATED
SELF-DEFENSE MEMBERS
DNAPPED PEOPLE RESCUED
RECOVERED MOTOR-VEHICLES
*
GUERRILLA
KI
OPERATIVE ACHIEVEMENTSYEAR VARIATION
ARRESTS (FOR ALL CRIMES)

Crime Report 2006
Avenida El Dorado No. 75 – 25 (Bogotá - Colombia) / Tel. (57) (1) 4266333 www.policia.gov.co / [email protected] / [email protected]
COLOMBIAN NATIONAL POLICE ▲ DIJIN
1
TABLE 20. GUERRILLA MEMBERS CAPTURED
POLICE DEPARTMENT
JAN
UAR
Y
FEBRU
AR
Y
MAR
CH
APRIL
MAY
JUN
E
JULY
AU
GU
ST
SEPTE
MBER
OCTO
BER
NO
VEN
BER
DEC
EMBER
TOTA
L 2006
TOTA
L 2005
PER
CEN
TAG
E
VARIA
TIO
N 2
006-2
005
PAR
TICIP
ATI
ON
2006
AMAZONAS 1 0 0 0 0 0 0 0 0 0 0 0 1 0 100% 0,04%ANTIOQUIA 3 5 2 11 5 1 0 12 4 10 1 19 73 124 -41% 3,17%ARAUCA 39 12 2 7 27 2 10 2 1 29 7 3 141 170 -17% 6,11%ATLÁNTICO 0 1 0 0 5 0 1 2 0 1 0 1 11 24 -54% 0,48%BOLÍVAR 5 3 3 3 6 4 1 8 3 18 3 13 70 58 21% 3,04%BOYACÁ 4 2 4 12 1 1 7 2 5 1 8 0 47 100 -53% 2,04%CALDAS 4 3 7 2 3 5 4 4 22 1 1 1 57 24 138% 2,47%CAQUETÁ 5 17 37 9 18 7 3 14 3 3 2 3 121 108 12% 5,25%CAUCA 1 6 4 2 2 0 1 0 6 4 3 3 32 38 -16% 1,39%CASANARE 0 0 7 2 6 5 0 7 6 2 1 2 38 55 -31% 1,65%CESAR 8 1 14 14 20 23 10 8 17 8 12 5 140 99 41% 6,07%CÓRDOBA 2 0 1 1 5 0 0 1 0 5 8 4 27 26 4% 1,17%CUNDINAMARCA 0 6 6 3 0 2 2 10 3 4 3 1 40 22 82% 1,73%CHOCÓ 0 3 3 0 3 7 2 12 1 4 18 10 63 57 11% 2,73%GUAJIRA 3 3 1 6 6 5 0 0 1 2 0 1 28 53 -47% 1,21%GUAINÍA 1 1 0 3 0 8 1 0 0 0 0 1 15 20 -25% 0,65%GUAVIARE 4 3 5 2 3 3 3 2 0 0 0 0 25 23 9% 1,08%MAGDALENA 1 1 2 5 1 1 1 4 1 3 7 1 28 51 -45% 1,21%MAGDALENA MEDIO 10 0 2 1 0 2 0 0 0 0 1 2 18 13 38% 0,78%META 3 2 2 2 4 0 6 8 1 0 0 1 29 40 -28% 1,26%NARIÑO 0 11 5 9 9 5 9 9 17 9 13 16 112 90 24% 4,86%NORTE DE SANTANDER 20 9 19 5 5 33 6 14 6 12 4 0 133 100 33% 5,77%PUTUMAYO 5 3 1 7 5 2 2 3 0 0 4 3 35 48 -27% 1,52%QUINDÍO 2 2 1 2 1 0 0 0 0 0 0 0 8 14 -43% 0,35%RISARALDA 1 1 10 1 2 2 1 0 0 0 1 0 19 47 -60% 0,82%SANTANDER 1 2 3 5 4 3 2 22 3 3 1 1 50 63 -21% 2,17%SAN ANDRÉS 0 0 0 0 0 0 0 0 0 0 0 0 0 0 0% 0,00%SUCRE 8 12 17 15 29 2 5 16 4 3 0 23 134 164 -18% 5,81%TOLIMA 11 14 8 13 19 24 9 27 13 17 3 2 160 206 -22% 6,94%HUILA 13 6 12 1 13 15 0 2 0 14 7 7 90 106 -15% 3,90%URABÁ 5 1 2 1 2 4 1 2 0 2 1 2 23 13 77% 1,00%VALLE 8 7 17 6 16 8 10 7 10 9 24 19 141 133 6% 6,11%VICHADA 0 0 1 0 0 0 0 0 0 0 0 0 1 0 100% 0,04%METROPOLITAN BOGOT 6 4 2 3 1 3 2 2 0 1 3 0 27 54 -50% 1,17%METROPOLITAN CALI 2 5 17 3 7 0 7 4 3 8 6 10 72 56 29% 3,12%METROPOLITAN MEDEL 2 2 7 5 5 7 0 3 4 6 5 4 50 130 -62% 2,17%DIRAN 0 1 0 0 0 0 0 0 0 1 0 0 2 6 -67% 0,09%DIJIN 17 16 43 6 18 13 9 46 14 15 22 3 222 168 32% 9,63%DIASE 7 0 0 0 16 0 0 0 0 0 0 0 23 6 283% 1,00%
TOTAL 202 165 267 167 267 197 115 253 148 195 169 161 2.306 2.509 -8% 100%

Crime Report 2006
COLOMBIAN NATIONAL POLICE ▲ DIJIN
TABLE 21. GUERRILLA MEMBERS KILLED IN ACTION
POLICE DEPARTMENT
JAN
UA
RY
FEB
RU
AR
Y
MA
RC
H
AP
RIL
MA
Y
JUN
E
JULY
AU
GU
ST
SEP
TEM
BER
OC
TOB
ER
NO
VEN
BER
DEC
EMB
ER
TOTA
L 200
6
TOTA
L 200
5
PER
CEN
TAG
E V
AR
IATI
ON
2006
-200
5
PA
RTI
CIP
ATI
ON
2006
AMAZONAS 0 0 0 0 0 0 0 0 0 0 0 0 0 0 0% 0,00%ANTIOQUIA 0 0 0 1 0 0 2 0 0 0 0 2 5 8 -38% 10,42%ARAUCA 0 0 0 0 0 0 0 0 0 0 0 0 0 5 -100% 0,00%ATLÁNTICO 0 0 0 0 0 0 0 0 0 0 0 0 0 0 0% 0,00%BOLÍVAR 0 0 0 0 0 0 0 0 0 0 0 0 0 1 -100% 0,00%BOYACÁ 0 0 0 0 0 0 0 0 0 0 0 0 0 1 -100% 0,00%CALDAS 0 3 1 0 0 0 0 0 0 0 0 0 4 0 100% 8,33%CAQUETÁ 0 0 1 2 1 0 0 2 0 0 0 0 6 1 500% 12,50%CAUCA 0 0 0 0 0 0 0 0 0 0 0 0 0 3 -100% 0,00%CASANARE 0 0 0 0 0 1 0 1 0 0 0 0 2 2 0% 4,17%CESAR 0 0 0 0 0 0 0 0 0 0 0 0 0 1 -100% 0,00%CÓRDOBA 0 0 0 0 0 0 0 0 0 0 5 0 5 0 100% 10,42%CUNDINAMARCA 0 0 0 0 0 0 0 0 0 0 0 0 0 3 -100% 0,00%CHOCÓ 0 0 2 0 0 0 0 0 0 0 0 0 2 0 100% 4,17%GUAJIRA 0 0 0 1 0 0 1 0 0 0 0 0 2 4 -50% 4,17%GUAINÍA 0 0 0 0 0 0 0 0 0 0 0 0 0 0 0% 0,00%GUAVIARE 0 2 0 0 0 0 0 0 0 0 0 0 2 0 100% 4,17%MAGDALENA 0 0 0 0 0 0 0 0 0 0 0 0 0 2 -100% 0,00%MAGDALENA MEDIO 0 0 0 0 0 0 0 0 0 0 0 0 0 0 0% 0,00%META 0 1 0 0 0 0 0 0 0 0 0 0 1 0 100% 2,08%NARIÑO 0 0 2 0 0 0 0 0 0 2 2 2 8 6 33% 16,67%NORTE DE SANTANDER 0 0 0 0 0 0 0 0 0 0 0 0 0 1 -100% 0,00%PUTUMAYO 0 0 0 0 0 0 0 0 0 0 0 0 0 2 -100% 0,00%QUINDÍO 0 0 0 0 0 0 0 0 0 0 0 0 0 0 0% 0,00%RISARALDA 0 0 0 0 0 0 0 1 0 0 0 0 1 0 100% 2,08%SANTANDER 0 0 0 0 0 0 0 0 0 0 0 0 0 1 -100% 0,00%SAN ANDRÉS 0 0 0 0 0 0 0 0 0 0 0 0 0 0 0% 0,00%SUCRE 0 0 0 0 0 0 0 0 0 0 0 0 0 4 -100% 0,00%TOLIMA 0 0 0 0 2 0 0 0 0 0 3 0 5 2 150% 10,42%HUILA 0 0 0 1 0 0 0 0 0 0 0 0 1 0 100% 2,08%URABÁ 0 0 0 0 0 0 0 0 0 0 0 0 0 0 0% 0,00%VALLE 0 0 1 0 0 1 1 0 0 0 0 0 3 3 0% 6,25%VICHADA 0 0 0 0 0 0 0 0 0 0 0 0 0 0 0% 0,00%METROPOLITAN BOGOTÁ 0 0 0 0 0 0 0 0 0 0 0 0 0 0 0% 0,00%METROPOLITAN CALI 0 0 0 0 0 0 0 0 0 0 0 0 0 2 -100% 0,00%METROPOLITAN MEDELLÍN 0 0 0 0 0 0 0 0 0 0 0 0 0 3 -100% 0,00%DIJIN 0 1 0 0 0 0 0 0 0 0 0 0 1 8 -88% 2,08%
TOTAL 0 7 7 5 3 2 4 4 0 2 10 4 48 63 -24% 100,00%
Avenida El Dorado No. 75 – 25 (Bogotá - Colombia) / Tel. (57) (1) 4266333 www.policia.gov.co / [email protected] / [email protected]
2

Crime Report 2006
COLOMBIAN NATIONAL POLICE ▲ DIJIN
TABLE 22. ILLEGAL SELF -DEFENSE MEMBERS CAPTURED
POLICE DEPARTMENT
JAN
UAR
Y
FEBRU
AR
Y
MAR
CH
APR
IL
MAY
JUN
E
JULY
AU
GU
ST
SEPTE
MBER
OCTO
BER
NO
VEN
BER
DEC
EMBER
TOTA
L 2006
TOTA
L 2005
PER
CEN
TAG
E
VAR
IATI
ON
2006-2
005
PAR
TICIP
ATI
ON
2006
AMAZONAS 0 0 0 0 0 0 0 0 0 0 0 0 0 0 0% 0,00%ANTIOQUIA 0 0 0 1 0 0 0 0 0 0 0 0 1 85 -99% 0,13%ARAUCA 0 0 0 0 0 0 0 0 0 0 0 0 0 46 -100% 0,00%ATLÁNTICO 0 0 0 0 0 0 0 0 0 0 0 0 0 51 -100% 0,00%BOLÍVAR 3 1 0 0 0 0 2 3 0 0 1 0 10 29 -66% 1,34%BOYACÁ 2 1 2 0 0 0 1 0 9 0 0 1 16 68 -76% 2,14%CALDAS 2 2 3 1 0 0 3 0 0 0 0 1 12 46 -74% 1,61%CAQUETÁ 1 4 0 0 3 1 3 1 0 7 2 0 22 68 -68% 2,95%CAUCA 0 0 0 0 0 0 0 0 0 0 0 0 0 11 -100% 0,00%CASANARE 2 2 0 2 1 1 4 0 1 1 2 1 17 113 -85% 2,28%CESAR 16 10 11 0 0 0 0 0 0 0 0 0 37 100 -63% 4,95%CÓRDOBA 3 0 13 4 2 0 16 0 3 1 3 4 49 47 4% 6,56%CUNDINAMARCA 4 18 10 2 26 0 3 11 1 20 2 0 97 74 31% 12,99%CHOCÓ 0 1 1 1 4 0 2 2 1 1 1 1 15 22 -32% 2,01%GUAJIRA 8 3 9 5 13 2 7 0 2 1 0 5 55 75 -27% 7,36%GUAINÍA 0 0 0 0 0 0 0 0 0 0 0 0 0 0 0% 0,00%GUAVIARE 3 0 7 5 2 0 0 0 0 0 0 0 17 50 -66% 2,28%MAGDALENA 6 11 2 2 0 0 0 0 0 0 0 0 21 114 -82% 2,81%MAGDALENA MEDIO 3 0 0 1 0 0 0 0 2 0 0 0 6 94 -94% 0,80%META 2 0 1 1 0 0 0 2 0 1 0 0 7 82 -91% 0,94%NARIÑO 0 0 0 3 0 0 0 1 0 0 0 0 4 33 -88% 0,54%NORTE DE SANTANDER 2 7 1 0 6 6 4 8 2 6 0 1 43 20 115% 5,76%PUTUMAYO 1 3 1 3 5 7 1 1 7 2 6 3 40 59 -32% 5,35%QUINDÍO 0 0 1 0 1 0 1 0 0 0 0 0 3 4 -25% 0,40%RISARALDA 0 2 0 0 0 0 0 0 0 0 0 0 2 26 -92% 0,27%SANTANDER 1 0 1 6 0 1 0 0 0 0 0 0 9 94 -90% 1,20%SAN ANDRÉS 0 0 0 0 0 0 0 0 0 0 0 0 0 0 0% 0,00%SUCRE 0 0 0 0 1 0 0 0 0 0 0 0 1 26 -96% 0,13%TOLIMA 5 2 1 5 3 16 13 7 17 8 3 3 83 128 -35% 11,11%HUILA 0 0 0 0 0 0 0 0 0 0 0 0 0 13 -100% 0,00%URABÁ 0 2 2 0 0 0 0 0 2 0 1 0 7 8 -13% 0,94%VALLE 3 0 0 3 2 0 0 0 2 1 0 0 11 69 -84% 1,47%VICHADA 0 0 0 2 0 0 0 0 3 1 1 0 7 3 133% 0,94%METROPOLITAN BOGOTÁ 12 6 12 2 2 3 0 3 0 0 1 0 41 89 -54% 5,49%METROPOLITAN CALI 0 0 1 2 0 0 0 0 0 0 0 0 3 5 -40% 0,40%METROPOLITAN MEDELLÍN 2 3 6 4 9 5 4 3 6 3 2 10 57 53 8% 7,63%DIRAN 2 2 1 0 0 0 0 2 1 46 0 0 54 70 -23% 7,23%DIJIN 0 0 0 0 0 0 0 0 0 0 0 0 0 16 -100% 0,00%DIASE 0 0 0 0 0 0 0 0 0 0 0 0 0 12 -100% 0,00%
TOTAL 83 80 86 55 80 42 64 44 59 99 25 30 747 1.903 -61% 100%
Avenida El Dorado No. 75 – 25 (Bogotá - Colombia) / Tel. (57) (1) 4266333 www.policia.gov.co / [email protected] / [email protected]
3

Crime Report 2006
COLOMBIAN NATIONAL POLICE ▲ DIJIN
TABLE 23. ILLEGAL SELF - DEFENSE MEMBERS KILLED IN ACTION
POLICE DEPARTMENT
JAN
UARY
FEBRU
ARY
MARCH
APRIL
MAY
JUN
E
JULY
AUG
UST
SEPTE
MBER
OCTO
BER
NO
VEN
BER
DEC
EMBER
TOTA
L 2006
TOTA
L 2005
PER
CEN
TAG
E
VARIA
TIO
N
2006
-2005
PARTI
CIP
ATI
ON
2006
AMAZONAS 0 0 0 0 0 0 0 0 0 0 0 0 0 0 0% 0,00%ANTIOQUIA 2 0 0 0 0 0 0 0 0 0 0 0 2 2 0% 28,57%ARAUCA 0 0 0 0 0 0 0 0 0 0 0 0 0 0 0% 0,00%ATLÁNTICO 0 0 0 0 0 0 0 0 0 0 0 0 0 0 0% 0,00%BOLÍVAR 0 0 0 0 0 0 0 0 0 0 0 0 0 0 0% 0,00%BOYACÁ 0 0 0 0 0 0 0 0 0 0 0 0 0 0 0% 0,00%CALDAS 0 0 0 0 0 0 0 0 0 0 0 0 0 4 -100% 0,00%CAQUETÁ 0 0 0 0 0 0 0 0 0 0 0 0 0 0 0% 0,00%CAUCA 0 0 0 0 0 0 0 0 0 0 0 0 0 0 0% 0,00%CASANARE 0 0 0 0 0 0 0 0 0 0 0 0 0 0 0% 0,00%CESAR 0 1 0 0 0 0 0 0 0 0 0 0 1 1 0% 14,29%CÓRDOBA 0 0 0 0 0 0 0 0 0 0 0 0 0 0 0% 0,00%CUNDINAMARCA 0 0 0 0 0 0 0 0 0 0 0 0 0 3 -100% 0,00%CHOCÓ 0 0 0 0 0 0 0 0 0 0 0 0 0 0 0% 0,00%GUAJIRA 0 0 0 0 0 0 0 0 0 0 0 0 0 0 0% 0,00%GUAINÍA 0 0 0 0 0 0 0 0 0 0 0 0 0 0 0% 0,00%GUAVIARE 0 0 0 0 0 0 0 0 0 0 0 0 0 1 -100% 0,00%MAGDALENA 0 0 0 1 0 0 0 0 0 0 0 0 1 2 -50% 14,29%MAGDALENA MEDIO 0 0 0 0 0 0 0 0 0 0 0 0 0 1 -100% 0,00%META 1 0 0 0 0 0 0 0 0 0 0 0 1 0 100% 14,29%NARIÑO 0 0 0 0 0 0 0 0 0 0 0 0 0 0 0% 0,00%NORTE DE SANTANDER 0 0 0 0 0 0 0 0 0 0 0 0 0 0 0% 0,00%PUTUMAYO 0 0 0 0 0 0 0 0 0 0 0 0 0 2 -100% 0,00%QUINDÍO 0 0 0 0 0 0 0 0 0 0 0 0 0 0 0% 0,00%RISARALDA 0 0 0 0 0 0 0 0 0 0 0 0 0 0 0% 0,00%SANTANDER 0 0 0 0 0 0 0 0 0 0 0 0 0 0 0% 0,00%SAN ANDRÉS 0 0 0 0 0 0 0 0 0 0 0 0 0 0 0% 0,00%SUCRE 0 0 0 0 0 0 0 0 0 0 0 0 0 1 -100% 0,00%TOLIMA 0 0 0 0 0 0 0 1 0 0 0 0 1 4 -75% 14,29%HUILA 0 0 0 0 0 0 0 0 0 0 0 0 0 0 0% 0,00%URABÁ 0 0 0 0 0 0 0 0 0 0 0 0 0 0 0% 0,00%VALLE 0 0 0 0 0 0 0 0 0 0 0 0 0 1 -100% 0,00%VICHADA 0 0 0 0 0 0 0 0 0 0 0 0 0 0 0% 0,00%METROPOLITAN BOGOTÁ 0 0 0 0 0 0 0 0 0 0 0 0 0 0 0% 0,00%METROPOLITAN CALI 0 0 0 0 0 0 0 0 0 0 0 0 0 0 0% 0,00%METROPOLITAN MEDELLÍN 0 0 0 0 0 0 1 0 0 0 0 0 1 1 0% 14,29%DIJIN 0 0 0 0 0 0 0 0 0 0 0 0 0 3 -100% 0,00%
TOTAL 3 1 0 1 0 0 1 1 0 0 0 0 7 26 -73% 100%
Avenida El Dorado No. 75 – 25 (Bogotá - Colombia) / Tel. (57) (1) 4266333 www.policia.gov.co / [email protected] / [email protected]
4

Crime Report 2006
COLOMBIAN NATIONAL POLICE ▲ DIJIN
TABLE 24. KIDNAPPED PEOPLE RESCUED
POLICE DEPARTMENT
JAN
UA
RY
FEB
RU
AR
Y
MA
RC
H
AP
RIL
MA
Y
JUN
E
JULY
AU
GU
ST
SEP
TEM
BER
OC
TOB
ER
NO
VEN
BER
DEC
EMB
ER
TOTA
L 2006
TOTA
L 2005
PER
CEN
TAG
E V
AR
IATI
ON
2006-
2005
PA
RTI
CIP
ATI
ON
2006
AMAZONAS 0 0 0 0 0 0 0 0 0 0 0 0 0 0 0% 0,00%ANTIOQUIA 0 0 0 0 1 0 0 1 0 0 0 0 2 5 -60% 1,80%ARAUCA 0 0 0 0 0 0 0 1 0 0 0 0 1 2 -50% 0,90%ATLÁNTICO 0 1 0 1 0 0 0 0 0 1 0 0 3 6 -50% 2,70%BOLÍVAR 0 1 0 0 0 2 0 1 0 0 0 1 5 3 67% 4,50%BOYACÁ 0 0 0 0 0 0 0 1 0 0 0 0 1 4 -75% 0,90%CALDAS 0 0 0 0 0 0 0 0 0 0 1 0 1 9 -89% 0,90%CAQUETÁ 0 0 0 0 0 2 1 1 0 0 0 0 4 1 300% 3,60%CAUCA 1 0 0 1 0 0 0 0 0 0 0 0 2 6 -67% 1,80%CASANARE 0 0 0 0 1 0 0 0 2 0 0 0 3 7 -57% 2,70%CESAR 1 0 0 0 0 1 0 0 0 0 0 0 2 2 0% 1,80%CÓRDOBA 1 0 0 0 0 0 0 0 1 0 0 0 2 0 100% 1,80%CUNDINAMARCA 4 1 0 2 2 0 0 0 1 3 0 0 13 9 44% 11,71%CHOCÓ 0 0 0 0 0 0 0 0 0 0 0 0 0 0 0% 0,00%GUAJIRA 0 0 0 1 0 0 0 0 0 0 0 0 1 4 -75% 0,90%GUAINÍA 0 0 0 0 0 0 0 0 0 0 0 0 0 0 0% 0,00%GUAVIARE 0 0 0 0 0 0 0 0 0 0 0 0 0 0 0% 0,00%MAGDALENA 0 0 0 0 1 0 0 0 0 0 0 0 1 2 -50% 0,90%MAGDALENA MEDIO 0 0 0 0 0 1 0 0 1 0 0 0 2 2 0% 1,80%META 0 0 1 0 0 0 0 0 0 0 0 0 1 5 -80% 0,90%NARIÑO 2 0 2 2 0 0 0 0 2 0 2 0 10 13 -23% 9,01%NORTE DE SANTANDER 0 1 0 1 0 0 0 1 0 0 0 1 4 7 -43% 3,60%PUTUMAYO 0 1 1 0 0 0 0 0 0 0 0 0 2 0 100% 1,80%QUINDÍO 0 0 0 0 0 1 0 0 0 0 0 0 1 1 0% 0,90%RISARALDA 0 0 0 0 0 0 3 1 0 0 0 2 6 4 50% 5,41%SANTANDER 0 1 0 2 0 0 0 0 0 0 0 0 3 5 -40% 2,70%SAN ANDRÉS 0 0 0 0 0 0 0 0 0 0 0 0 0 0 0% 0,00%SUCRE 0 0 0 0 0 0 0 0 0 0 0 0 0 0 0% 0,00%TOLIMA 1 0 1 0 0 0 1 1 0 0 0 0 4 8 -50% 3,60%HUILA 0 0 0 0 0 0 0 2 0 0 0 0 2 3 -33% 1,80%URABÁ 0 0 0 1 0 0 0 0 0 0 0 0 1 1 0% 0,90%VALLE 1 0 4 1 0 0 1 0 0 0 1 0 8 8 0% 7,21%VICHADA 0 0 0 0 0 0 0 0 0 0 0 0 0 0 0% 0,00%METROPOLITAN BOGOTÁ 0 0 0 0 0 0 0 5 3 0 2 0 10 9 11% 9,01%METROPOLITAN CALI 2 0 3 1 2 1 0 3 0 0 1 0 13 11 18% 11,71%METROPOLITAN MEDELLÍN 0 0 0 1 1 0 0 0 1 0 0 0 3 6 -50% 2,70%TOTAL 13 6 12 14 8 8 6 18 11 4 7 4 111 143 -22% 100,00%
Avenida El Dorado No. 75 – 25 (Bogotá - Colombia) / Tel. (57) (1) 4266333 www.policia.gov.co / [email protected] / [email protected]
5