critical issues and strategies for the development of … files/publications/nast... ·...
TRANSCRIPT

Trans. NaIl. Acad. Sci. Tech. Philippines 21: 72-119 (/999). ISSN 0115-8848
CRITICAL ISSUES AND STRATEGIES FOR THE DEVELOPMENT OF MAJOR
AGRICULTURAL CROPS
WILLIAM D. DAR Presidential Adviser on Food Security
ABSTRACT
This paper is a comprehensive review of the critical issues and strategies to develop the major agricultural crops in the country. It has been recognized that the crops sector dominates Philippine agriculture and could serve as a logical and potent springboard for the country to achieve global competitiveness. Among the major agricultural crops are rice. corn, sugarcane, coconut, fruits such as banana and mango, vegetables, and fiber such as abaca, root crops. The impact of globalization on Philippine agriculture is discussed. The Philippine Government has recommended activities and policies to modernize agriculture by the AFMA .
Keywords: Philippine agriculture, crops. modernization, production, world trade. global competitiveness, rice, corn, sugarcane, coconut, banana, mango.
I. INTRODUCTION
The new world order has placed the Philippines in a situation where its capability and viability to produce a wider range of products and services and offer opportunities comparable to those of the rest of the world are challenged. Amid this prevailing socioeconomic landscape that speaks of market forces, competition, and free flow of trade in goods and services, modernization of the production sector plays a prominent role.
In addressing the demands of global competitiveness as well as the promise of economic development, the new administration of President Joseph Ejercito Estrada has identified modernizing agriculture as a major fore that will fuel the nation's economy and ensure the social well-being of all Filipinos. The goal is for the government to spare no effort in empowering the agriculture sector to develop and sustain itself under the principles of food security, poverty alleviation and social equity, people empowerment, global competitiveness, and sustainability.
72

Dar 73
The new administration has, indeed, ushered in a greater appreciation of the crucial role of agriculture in economic development, with globalization and food security as the central concerns. While it is convinced that a liberal agricultural trading regime based on the interplay of market forces is the best way to kick-off agriculture on the path to progress and prosperity, a bigger challenge is providing the Filipino people at all times with access to enough food for an active, productive, and healthy life.
At the center of the Estrada Administration's agricultural modernization thrust is the fusion of the goals to meet the food requirements of the present and future generations of Filipinos, and to attain profitable production of world-class agricultural products that globalization will not only be competitive globally but flourishing locally- a decent source of livelihood for two-thirds of the Filipino poor who live in the rural areas, and a renewed hope of food that is accessible, available, nutritious and safe, and affordable to all.
A. Patterns of Agricultural Growth
Every new administration of this nation has set out to make economic development a reality - changing policies and experimenting with strategies, but the dream has remained elusive. One major setback to the realization of this dream is the status of the agriculture sector in the country, which speaks of minimal growth and low priority.
Among Asian countries as well as world averages, the growth of the Philippine agriculture sector has been less than satisfactory (Table I). The poor performance of Philippine agriculture is the primary cause of the high incidence or rural poverty at 47% in 1994 and 44.4% in 1997. Low purchasing power in the rural sector is a serious drag to the development of consumer and industrial goods sectors.
Table I. Comparative average annual growth of the agriculture sector(%)
Country 1980-90
Vietnam 4.3 China 5.9 Pakistan 4.3 Thailand 4.0 India 3.1 Indonesia 3.4 Malaysia 3.8 Philippines 1.0 All middle income 3.5 World 2.8 1.8
Note: Agriculture includes crops, livestock and poultry and fisheries. Source: World Bank, World Development Report 1998/99.
1990-97
5.2 4.4 3.8 3.6 3.0 2.8 1.9 1.9 2.3

74 Trans. Natl. Acad. Sci. Tech. Philippines 21 (1999)
In the sixties the spurt in agricultural growth has not brought about by an increase in productivity per hectare of land but by expansion of land put under cultivation. In the late seventies productivity was achieved in grains due to the Green Revolution technologies and the massive subsidies extended by the Marcos Administration to ensure the success of its Masagana 99 rice production program. In the middle and until the latter part of the eighties the economy was hit hard by a politicoeconomic crisis. And in the nineties agricultural productivity continued to decline as a result of the combined effects of past neglect, exhaustion of our natural resource base, and weather-rooted factors such as the EI Nino phenomenon.
Table 2 shows the lackluster performance of Philippine traditional crops, rice and com, as compared to our Asian neighbors. Except for Thailand, our productivity in rice was lowest among selected Asian countries. In com, the Philippines' yield was lowest at 1.72/ha. In 1995, the country imported about 263,250 metric tons (MT) of rice and 208,020 MT of com. In 1996, importation rose to 862,380 MT of rice and 402,340 MT of com. Importation has since continued to rise due to drought in certain parts of the country caused by El Nino, reaching as high as 2.0 million MT in 1998. Currently, the country is already importing substantial amounts of agricultural commodities, including sugar, except for coconut and its byproducts.
The performance of the crops subsector, as compared to the livestock, poultry and fishery subsectors, waned over the last 30 years. From 6.7% per annum in the early 1970s, it slid to negative growth in the early 1990s. Although there were some fast-effect and high-value crops, their size relative to the crops subsector was too small to effect a reversal. However, the influence of the crops subsector on total agricultural remains very substantial.
Table 2. Comparative average annual growth of the agriculture sector (%)
Crop/Country 1964-65 1979-81 1991 1993 1994
Rice Taiwan 3.65 4.24 5.66 Japan 5.15 5.59 5.86 4.59 6.77 Korea 3.33 5.51 6.01 5.81 6.10 Philippines 1.25 2.18 2.83 2.80 2.90 Thailand 1.61 1.89 2.00 2.20 2.40 Vietnam 1.02 2.12 3.09 3.50 3.60 Indonesia 3.26 4.35 4.38 4.34
Corn Taiwan 2.10 3.04 4.56 Philippines 0.68 0.97 1.30 1.43 1.72 Thailand 2.19 2.20 2.38 2.04 3.17 Indonesia 1.46 2.15 2.18 2.18
Source: F AO Production Yearbook, various issues.

Dar 75
Under the Ramos Administration, from January to June 1998, the agriculture sector posted a considerable 7.15% reduction in aggregate output. Livestock and poultry farms came up with moderate output increases. Fishery production was slightly lower than in 1997. The big slump in crop production brought down agriculture to its worst performance record in 20 years. In terms of gross value of output at current prices, the sector earned P245.1 billion indicating a 1.94% reduction from the 1997 level.
The effects ofEI Nino on crop farms translated into a 14.61% contraction in aggregate output in 1998. Rice and com production decreased by 26.57% and 43.62%, respectively. With the exception of tobacco, abaca, mungbean, onion and rubber, all other crops registered output losses in the first six months of 1998. The crops subs ector grossed P 127.6 billion at current prices, down by 9.68% from the 1997 level.
B. Emerging Global Challenges
The emerging global economic environment presents tremendous opportunities and challenges for Philippine agriculture as it crosses into the next century.
The entry of the Philippines into the World Trade Organization (WTO) in 1995 lifted practically all quantitative import restrictions but provided higher tariffs on sensitive agricultural products through the year 2004. Prior to this, the country had made commitments under the ASEAN Free Trade Agreement (AFT A) regarding accelerated tariff reductions. In late 1999, discussions on various trade agreements will continue, so must the safety net measures be adequately and concurrently put in place to make producers productive or make them diversify to other activities. This leads to the strategic question: How should we prepare and enable Philippine agriculture to meet the rigors of global competition?
With the country's low agricultural productivity, specifically in the crops subsector, trade liberalization in agriculture is a virtual prescription for economic suicide. At the present level of productivity, the agriculture sector will encounter serious difficulties in adjusting to the new trading arrangement particularly when its full impact is felt in year 2004. While it is true that a liberalized trading regime offers many opportunities for growth, only those that are competitive would be able to take advantage of these opportunities.
Unless the government addresses the basic and structural weaknesses of agriculture, the sector will be unable to supply the food requirements of the present and future generations of Filipinos, much less take advantage of the opportunities presented by the WTO. This will require radical changes not only in terms of priorities but in the manner by which the new administration fosters the development of the countryside. This will involve the modification of our thinking, attitude, policies, institutions and expenditure priorities so that Philippine agriculture will be prepared for the keener competition that will surely happen when the full implementation of the new global trade agreement is realized.
To this, modernizing Philippine agriculture is the new administration's response to globalization, and its strategy toward a hunger-free nation. Hence, under

76 Trans. NaIl. Acad. Sci. Tech. Philippines 21 (1999)
the Agriculture and Fisheries Modernization Act (AFMA) passed in 1997, global competitiveness and food security are two major concerns. The AFMA has been dubbed as a landmark legislation "prescribing urgent related measures to modernize the agriculture and fisheries sectors of the country in order to enhance their profitability and prepared said sectors for the challenges of globalization through an adequate. focused and rational delivery of necessary services ".
Among the goals and objectives of AFMA in the area of global competitiveness include increase in the volume, quality and value of agriculture production for domestic consumption and for export, reduction in post-harvest losses, increase in the number/types and quality of processed products, and a wider level of entrepreneurship among farmers. It recognizes that in a liberal trade environment, significant improvement in agricultural productivity, product quality and production cost driven by technological change is necessary.
In the area of food security, AFMA seeks to meet the food requirements of the present and future generations of Filipinos in substantial quality, ensuring the accessibility, safety, availability and affordability of food to all, either through local production or importation or both, based on the country's existing and potential resource endowment and related production advantages.
II. STATUS OF MAJORAGRICUL TURAL CROPS
Although growth and structural change within the crops subsector is slow primarily due to lack of diversification, it continues to dominate the agriculture landscape and hence, remain as the logical and potent springboard for achieving global competitiveness and food security in the country.
In this paper, analysis of individual agricultural crops was limited to a selection of dominant crops which make up a significant proportion of the subsector in tern1S of area planted, volume of production, and value of produce; and which carry tremendous potential in terms of meeting the government's goals of food security and global competitiveness.
Major crops that are deemed responsive to the country's thrust for food security and global competitiveness include rice, com, rootcrops (camote and cassava), legumes (peanut and mungbean) and vegetables (onion, tomato and cabbage), and crop commodities where the country is a net exporter such as sugarcane, coconut, fruits (banana, mango, and pineapple), abaca, and other fruit crops (exported as processed).
A. Rice (Palay)
When one speaks of food security in the Philippines, it usually means sufficiency in rice. Rice is a dominant crop in the country because it is a major staple of the Filipino diet. The dominance infuses the crop with a significant socio-political mystique which ensures that this subsector is favored by policy and heavily supported by public investments, or at least more investments than other crops.

Dar 77
As a staple food of over 90% Filipinos, the attainment of rice self-sufficiency remains an important policy objective of the government. Estimated per capita consumption is at I 03kg/yr, contributing an average of 35% of the total calorie intake. About 70% Filipinos are dependent on rice cultivation and marketing for their livelihood.
I. Production
Rice occupies 3.17 million ha (irrigated and rainfed) of land with an average yield of2.7 MT/ha. Production volume is at 8.55 million MT (Table 3). Central Luzon (Region 3), Cagayan Valley (Region 2), Southern Tagalog (Region 4) and Western
Table 3. Status of rice production in the Philippines, 1994-1998
RICE I 1994 1995 1996 1997
I 1998
Hectarage 3,651,530 3, 758,691 3,951,136 3,842,270 1 3,17o,o42
Production (MT) 10,538,054 10,540,649 11,283,568 11,268,963 8,554,824
Yields/ha (MT /ha) 2.89 2.80 2.86 2.93 2.70
Areas of production Top 4 regions: Region 3, 2, 4, and 6 Top 5 provinces: Nueva Ecija, lsabela, Pangasinan, Iloilo, Cagayan
Major problems • Low yield stagnation (and a possible yield decline) due to declining hectarage; limited use/availability of good seeds; varietal constaint; insufficient production and post production inputs; uncertainties in climate; depleted natural resource base; and high post-harvest losses.
• Deterioration of irrigation systems (given low and decreasing investments in systems maintenance).
• Increased pests (insects (insects, weeds) and diseases in some areas.
• Inadequate funding for research, development and extension (ROE).
Major problems • Wide gap between farm gate price of palay sold by fam1ers encountered and retail price of milled rice traded by wholesalers and and constraints to retailers. marketing • Increase in price of milled rice does not translate to increase in
the price of palay at the farm level.
• Gap in the wholesale to farm margn has increased dramatically over the years.
• High cost of transport and distribution due to lack of physical infrastructure such as farm-to-market roads and port facilities.
Note: Refer to Appendix Table I for 1990-98 data on estimated rice production. area harvested and yield per hectare by region. Appendix tables are available from NAST

78 Trans. Nat I. Acad. Sci. Tech. Philippines 21 ( 1999)
. ,
. . ,
... .
) •
.J rw,. t,rNM..,..N,.,...,.. .. ,..,........ ('OII ... t1UI
'-0 ~ ·~ ...... 2011 lOO 180 ~ ... soo
Figure I. Rice area harvested , by region ('000 ha) 1998
Visayas (Region 6) contribute the largest share of the total rice production (Figure I). The five top rice producing provinces are Nueva Ecija, Isabel a, Pangasinan, Iloilo and Cagayan (Figure 2). Rice production contributes 17% to the Gross Value Added (GV A) in agriculture, with the total industry valued at P II billion.
From 1970 to 1977, the country achieved increases in production because of the combined effect of increases in area harvested and yield. The quest for selfsufficiency and food security became part of an increasingly common agenda, and Jed to a worldwide Green Revolution. It was perhaps greenest in Asia, with the Philippines under the Masagana 99 rice program. The period was characterized by the expanded utilization of high-yielding varieties and availability of subsidized credit under the rice program. While before, exports had been sporadic and consisted mostly of re-exports influenced by policies on import duties, for a brief and heady time starting 1978 the Philippines became a rice exporter. That same year, however, area harvested began to stagnate. Among the problems encountered under the program were Joan repayment, post-harvest operations, and marketing.
The political upheaval in the 1980s caused dislocations in the bureaucracy, eventually resulting in reduced production growth. Production was highest in 1994

Pangasinan
Nueva Ecija
' ./
. • .,
~·
lsabela
Fig. a. Tooft'f'lpnnoinceal"'""' - .. ric• ('100 '-111117 = <10 10 ·50
- 60.100 - 100.110
- 150.250
Figure 2. Top five provinces in area harvested to rice ('000 ha) 1997
Dar 79
because of the relatively higher yield per hectare (2.89 MT /ha) compared with the previous year, plus an II% expansion in area harvested. Almost the same production level was obtained in 1995 attributed to a slight increase of about 3% in area planted to rice. Yield declined by about the same percentage.
Over the years, irrigated and rainfed rice production in the country has been fluctuating, dipping to a low 8.55 MT in 1998 (Appendix Table I) primarily attributed to weather-rooted factors such as the El Niiio. In general, the country has yet to achieve further production increases given the current low yield of 2.7 MT/ha compared with the potential yield in on-farm trials of6 MT /ha. This low yield can be attributed to the decline in area planted to rice; I imited use/availability of good seeds; insufficient irrigation; varietal constraint; insufficient production and post-production inputs; uncertainties in climate; depleted natural resources base; high postharvest losses; and inadequate funding for research, development and extension.
Out of the tota19.9 million ha devoted to agriculture in the country, only 39% is planted to rice (Appendix Table 2). Regions 4 and 5 had the highest agricultural
80 Trans. NaIl. Acad. Sci. Tech. Philippines 21 (1999)
land area, but only 30% area planted to rice. For the whole country, only 35% of the area planted to rice are covered by irrigation as of 1997.
2. Gap Between Production and Consumption
In determining the rice (palay) requirements of the present and future generations, the Policy Action Group of the Philippine Council for Agriculture, Forestry and Natural Resources Research and Development (PCARRD) considered three main uses ofpalay - as seeds, for human consumption and for buffer stock requirements for 90 days. Using the Bureau of Agricultural Statistics (BAS) data from 1991-1998, the trend was used to project the 1999-2004 palay requirements. Human consumption of rice was computed based on per capita consumption and the increasing population.
The computed total consumption of palay based on the requirements for seeds, actual consumption and buffer stock for the whole country reached as high as 13.9 million MT in 1998, 15.3 million MT in 1999, and 17.9 million MT in year 2004 (Appendix Table 3). Compared with the country's estimated palay production (Appendix Table I), self-sufficiency in rice is far from being realized given an estimated deficiency of 5.4 million MT in 1998,4.8 million MT in 1999 and 6.9 million MT in year 2004 (Appendix Table 4, Figure 3).
Meanwhile, under the Agrikulturang Makamasa Rice Component of the Department of Agriculture (DA), the projected total rice (milled) requirement for the year 1999 was pegged at 8.12 million MT. This figure was based on the current population of72 million Filipinos multiplied by an annual per capita consumption of 103 kg, plus wastes, seed requirement, industrial and other uses. Compared with the estimated total supply of7.21 million MT milled rice in 1999, a deficit of 900,000 MT was obtained. To narrow the gap between production and consumption 'toward self-sufficiency in rice, production needs to increase yearly by 1.65 million MT milled rice per year - driven by technological advancement through research and development (R&D), complete support from all sectors, and a genuine political will by all stakeholders.
In the past, importation was done to meet the country's rice (palay) consumption. Thevolume of importation ranged from 6,000 MT in 1991 to 2 million MT in 1998.
3. Marketing
From the farm to the end users, rice is distributed primarily by the private sector, with the government handling a very small portion of the produce that enters the marketing system. From the farm to the consumption point, the movement of rice produce through private traders is made possible by numerous market intermediaries such as local assemblers, assembler-wholesalers, millers, wholesalers, wholesalers-retailers, and retailers performing different marketing services. The grains marketing arm of the government, the National Food Authority (NFA), can purchase only 5-10% of the total rice production due to limited budget.

Dar 81
-----Production
. , ~--------------------
Figure 3. Production and consumption of palay in the Philippines, actual ( 1991-1998) and projections ( 1999-2004 ).
Given this marketing scheme, a major constraint is the wide gap that exists between farm gate price of rice sold by farmers and the retail price of milled rice traded by wholesalers and retailers. Increase in price of milled rice does not translate to increases in the price at the farm level. In fact, over the years, the gap in the wholesale to farm margin has increased dramatically. There is also the problem of high cost of transport and distribution due to lack of physical infrastructure such as farm-to-market roads and port facilities.
B. Corn
Just like rice, growing and eating com has become a way of life for most Filipinos. One-third of the farmers in the country are engaged in corn production and most of them arc small holders. As the second most important crop in the Philippines, about 12 million Filipinos prefer white com as their main staple. Thirty percent (30%) of the total production is consumed as food in the Yisayas and Mindanao. Meanwhile, 70% serves as an important input to the swine and poultry industries and some industrial applications. Corn is also processed into high value products, such as com starch, com oil, glutten and snack foods. About 60-70% of feed fonnulations use com as the major ingredient. Fifty-four percent (54%) of total com production comes from yellow com, which comprises one-third of the total com area.

82 Trans. Nat I. Acad. Sci. Tech. Philippines 21 { 1999)
. ._ .
""
) - 20.54) r:J S0-100 CJ100·20G ......... CJ"""· ...
.............
Figure 4. Com area harvested ('000 ha) by region 1998
1. Production
Com is largely grown in Mindanao which occupies about 60% of the entire area harvested to the crop. The combined output from Mindanao represents 70% of the country's total com production. The top corn producing regions in the country are Northern Mindanao (Region I 0), Southern Mindanao (Region II), Central Mindanao (Region 12), the ARMM, and Cagayan Valley (Region 2) Figure 4 ).
On a national average, com production in the Philippines is inefficient. Mean yield has been extremely low at 1.62 MT /ha in 1998, as compared to major com producing countries in the world. Despite the low yields attributed to marginal white com areas planted to traditional varieties, prime yellow corn areas have demonstrated high yield growth rates due to the adoption of high yielding open-pollinated and hybrid varieties. The yellow com technology demonstrated an annual yield growth rate of 15% over the past 25 years, in contrast to the white com technology which exhibited only I .4% annual growth rate during the same period.
Domestic com production decreased from its peak of 4.85 million MT in 1990 to a record low of 3.82 million MT in 1998. On the other hand, the composite

Dar 83
demand for com for food, feed and other industrial uses is projected to growth annually by 3.94% for the period 1995-2004. In fact, the demand from 1995 to year 2000 is 6.3 million MT. while total com supply at present growth level is only 5.2 million MT. If current productivity and profitability levels do not improve, the production-consumption gap is expected to worsen by the year 2000. On the average, some 400,000 MT of com have been imported annually since 1990, mainly to meet the requirements of the livestock and poultry sector.
As a result of poor profitability, area harvested to com declined drastically from 1990 (3.8 million hal to 1998 (2.3 million ha.) This decline can be traced mainly to the shift to white com areas to yellow com and to the production of high value crops. In major com producing provinces, farmers have exited from about 670,000 ha of white com lands, while shifting to only about 150,000 ha for yellow com production. To a greater extent, traditional and marginal white com areas may have likewise been left idle as farmers seek employment in urban areas.
The com industry is faced with varied problems that hinder government efforts to achieve com self-sufficiency. These include low level of adoption of improved com technology, especially the use of open-pollinated and hybrid varieties (as a consequence of inadequate supply of seeds), declining public investment in com research and development (R&D), inefficient delivery of extension services, lack of credit support, and inefficient com marketing and distribution system.
Table 4 summarizes the status of com production in the Philippines, while Appendix Table 5 presents ten-year (1990-1998) data on estimated com production, area harvested and yield per hectare by crop type by region.
2. Marketing
The protection of the corn industry through quantitative restrictIons has discouraged the transformation of the com sector into a more efficient industry. Overall, average product costs the farmgate level stood of about 10% higher than elF prices of imported com. This non-competitiveness of domestic com can be attributed to a confluence of constraining factors, such as: I) low adoption of modem com production technologies; 2) high cost harvest losses; and 3) high transport and marketing costs due to inadequate infrastructure.
The production and marketing inefficiencies plaguing the com sector have adversely affected farm profitability over the years. The absence of clear and consistent com import policies continues to depress farmgate pries to levels that do not afford com farmers reasonable returns.
Marketing agents of com include farmers, local assemblers, local millers, grain wholesale dealers, wholesale millers, feed millers and retailers. Imported com competes with local produce when its arrival coincides with peak harvest season. Seasonality of domestic com supply causes price fluctuations within the year. Other marketing problems include increase of prices of farm inputs, insufficiency of funds of the NF A to support its floor price scheme, and inadequate transport.

84 Trans. Natl. A cad. Sci. Tech. Philippines 21 ( 1999)
Table 4. Status of rice production in the Philippines, 1994-1998
CORN 1994 1995 1996 1997 1998
Hectarage (ha) 3,005,820 2,692,332 2,735,723 2,725,875 2,354,208
Production (MT) 4,519,246 4,128,510 4,151,332 4,332,417 3,8 3,184
Yields/ha (MT/ha) 1.50 1.53 1.52 1.59 1.62
Areas of production • Regions 2, 10, II, 12, ARMM
Major problems • Inadequate postharvest processing, and storage encountered • Decline in area harvested to com and contraints to • Limited access to available support systems (credit production support, crop insurance, etc)
• Low adoption of recommend technologies
• Very limited investment investment to corn research, development & extension
• Threats: competition from other countries, high population growth rate. decreasing land area devoted to corn
Major problems • Imported corn competes with local producer when its encountered arrival coincides with peak harvest reason. and constraints to • Seasonality of domestic com supply causes price marketing fluctuations within the year.
• Other problems are increase in prices of farm inputs, in-sufficiency of funds of the NF A to support its floor price scheme, and inadequate transport and infrastructure.
3. Globalization and the Corn Sector
The corn sector has catapulted itself into a new era with the Philippines' commitment to regional and international trade agreements. Under the General Agreement on Tariffs and Trade- World Trade Organization (GATT-WTO), the country is required to provide a minimum access quota or volume for imported corn of 130,000 MT starting 1995 and increasing to 217,000 MT in 2004 at 35% tariff. Quantities imported over these levels carry higher tariffs of I 00% in 1995 and declining to 50% in 2004.
Private sector importation of corn substituted in mixed feeds, i.e., feed wheat and barley, are allowed and carry lower tariff rates. Likewise, in-quota imports of swine and poultry under GATT-WTO enter the country at 30% to 40% tariff, respectively. Out-quota tariff rates for the two commodities are slightly higher at 40% and 65% for 1998, declining to 35% and 50% by 2000.
Globalization implies that both the com and livestock industries must economically survive in trade with declining tariff protection of its domestic product. Domestic corn can be price competitive with corn imported under out-quota tariff rates. However, import-quality differentials and the entry of low-price corn substi-

Dar 85
tutes continue to exert downward pressures on farmgate prices of domestic com. High domestic com prices, on the other hand, adversely impact on the competitiveness of the local livestock and poultry industry, in view of the lower tariffs on meat and poultry imports. The economic survival of both industries can only be met if adequate quality corn can be produced and sold at prices that ensure both farnlers profitability and the competitiveness of the livestock and poultry sector. Hence, a shift to a new paradigm of agricultural development strategy for the com sector is imperative.
C. Sugarcane
The sugar industry has been and will continue to be a mainstay of the Philippine economy, with more than half a million workers and another two to five million people directly and indirectly depending on it. Sugarcane is the fourth major agricultural crop of the country, next to rice (palay), coconut and com. The sugar industry provides direct employment to about 556,000 workers in the agricultural sector with 25,000 mill workers.
In terms of world production, the average area harvested and production volume (sugar) for 1990/91-1994/95 were 21.i I million ha and 74.9 million . MT, respectively. Leading producers for the same period were India, Brazil, China, Cuba and Thailand, with the Philippines ranking ninth in terms of area harvested (0 .37 million ha) and II th among the world producers with 1.9 million MT.
1. Production
Currently, the Philippine province of Negros Occidental accounts for 56% of total production, mainly because its regular monsoon rains and low typhoon incidence complement its good soil. Sugarcane growing, however, is widely dispersed: 17 provinces located in eight regions grow sugar. Other top-producing provinces include Negros Oriental, Bukidnon, Tarlac and Davao del Sur. It is grown on a wide variety of soil types, from sandy loams to clay loams and from acidic volcanic soils to calcareous sedimentary deposits.
Area planted to sugarcane fluctuated from 1992 to 1996, averaging at 345,920 ha/year. It increased by 24% from 302,000 ha in 1995 to 375, I 000 in 1996. However, it again declined to 330,486 ha in 1998 (Appendix Table 6). Largest area planted to sugarcane in 1998 was in Western Visayas (Region VI) at 184,402 ha (Figure 5).
Average production of sugarcane from 1992 to 1996 was 22,165 ,320 ton cane (TC)/ycar. Production in 1996 was 23,142,000 tc, up by 33% fi'om 199 5. However, it again declined to 17,347,886 TC in 1998 (Appendix Table 7). Western Visayas led domestic production in 1998 (9.65 million TC), followed by Central Visayas (2.25 million TC) and Southern Tagalog (1.63 million TC). Table 5 summarizes the status of sugarcane production in the Philippines. (Volume of production is expressed in ton cane (TC) or sugarcane harvested from the farm. as differentiated from metric ton (MT) for sugar.)

86 Trans. Natl. Acad. Sci. Tech. Philippines 21 (1999)
• ~.
Figure 5. Sugarcane area harvested ('000 ha) by region 1998
The 1990s have been marked by periods of declining productivity. mostly due to poor farm cultivation and poor harvesting schedules in addition to insufficient incentives for development and limitations on land ownership, transfer, and lack of mortgage value due to the Comprehensive Agrarian Reform Program (CARP). The scientific community, however, attributes these low figures to years of government neglect in research and development. as well as inadequate extension services.
A study conducted in 1995 by the Madecor Group, a consulting company, identified the reasons for the continuing decline in sugar farm productivity. Some of the reasons cited were the decline in piculs sugar per ton cane or PSTC, brought about by the lack of high-yielding cane varieties, diseases, outdated farm practices, improper fertilization, and post harvest losses, among others. Meanwhile, Ledesma ( 1997) identified constraints to sugarcane production as follows: I) lack of irrigation facilities; 2) limited adoption of newly released varieties; 3) insufficient and improper fertilizer application; 4) poor ratooning characteristics of current varieties; and 5) inadequate control of pests and diseases. Among the industrial constraints
Dar 87
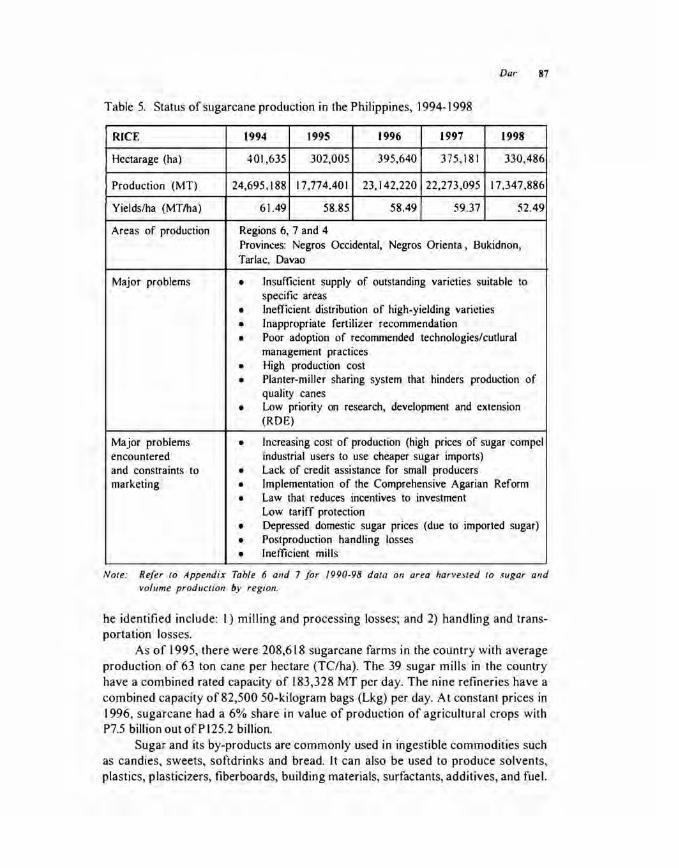
Table 5. Statt1s of sugarcane production in the Philippines, I 994- I 998
RICE 1994 1995 1996 1997 1998
Hcctarage (ha) 401,635 302,005 395,640 375,181 330,486
Production (MT) 24,695,188 17,774.401 23,142,220 22,273,095 17,347,886
Yields/ha (MT/ha) 61.49 58.85 58.49 59.37 52.49
Areas of production Regions 6, 7 and 4 Provinct:s: Negros Occidental, Negros Orienta , Bukidnon, Tarlac, Davao
Major problems • Insufficient supply of outstanding varieties suitable to specific areas
• Inefficient distribution of high-yielding varieties
• Inappropriate fertilizer recommendation
• Poor adoption of recommended technologies/cutlural management practices
• High production cost
• Planter-miller sharing system that hinders production of quality canes
• Low priority on research, development and extension (ROE)
Major problems • Increasing cost of production (high prices of sugar compel encountered industrial users to use cheaper sugar imports) and constraints to • Lack of credit assistance for small producers marketing • Implementation of the Comprehensive Agarian Reform
• Law that reduces incentives to investment Low tariff protection
• Depressed domestic sugar prices (due to imported sugar)
• Postproduction handling losses
• Inefficient mills
Note: Refer to Appendix Table 6 and 7 f or 1990-98 data on area harvested to .wgar and volume production by region.
he identified include: I) miiiing and processing losses; and 2) handling and transportation losses.
As of I 995, there were 208,618 sugarcane farms in the country with average production of 63 ton cane per hectare (TC/ha). The 39 sugar miiis in the country have a combined rated capacity of 183,328 MT per day. The nine refineries have a combined capacity of82,500 50-kilogram bags (Lkg) per day. At constant prices in 1996, sugarcane had a 6% share in value of production of agricultural crops with P7.5 billion out of P 125.2 billion.
Sugar and its by-products are commonly used in ingestible commodities such as candies. sweets, softdrinks and bread. It can also be used to produce solvents, plastics, plasticizers, fiberboards, building materials, surfactants, additives, and fuel.

88 Trans. Natl. Acad. Sci. Tech. Philippines 21 (1999)
By-products include cane tops, bagasse and molasses which can be used as components of swine and poultry feeds.
The Philippine sugar industry has the potential to increase productivity by nearly 30%. Such an increase could lead to annual raw sugar output being 30-45% higher by the year 2000. and the sugar industry could contribute an estimated US$104 million a year more to the Philippine economy.
Without productivity increases, sugar production looks set to fall due to rising costs elsewhere in the economy. Output is estimated to be lower by the year 2000. Meanwhile, increasing incomes and population are projected to cause Philippine sugar consumption to be between 60% and 75% higher by the tum of the century. Projected domestic demand for sugar is 2.12 million MT by 2000 and 2.95 million MT by 2010. There will be a production gap if the current production remained static at 1.9 million MT. If production declines, more of the sugar consumed will have to be imported. By year 2000, imports could make up nearly 45% of the total amount of sugar consumed. However, if productivity does increase, imports could account for only 1-10% of total consumption. The challenge can only be met by increasing the sugar yield per hectare or the productivity of the land, at the same time reducing the cost of production.
2. Marketing
The Philippine sugar industry does not exist in a vacuum and cannot be understood apart from a broader national and global contexts within which it functions. Issues such as currency valuation, interest rates, taxation, disincentives for economic diversification and investment, infrastructure development, wage rates, agrarian reform, and pricing policies all directly affect the sugar industry. Internationally, no sugar producer can avoid the impact of preferential agreements, quotas, subsidies, tariffs and trade consumption.
Sugar (centrifugal and refined) is among the country's principal agricultural exports, sharing 9.98% of the US$1.36 billion export value in 1996. Export volume and value equally grew by 107% from 153,210 MT in 1995 to 317,700 MT in 1996; and from US$65.88 million in 1995 to US$ I 36.2 million in 1996, respectively.
Average wholesale and retail prices of raw sugar in 1993 were P476. 14/Lkg and P 11.54/kg, respectively. Wholesale price of refined sugar was P722.81 ILkg, and retail price was P 16,49/kg for the same year. Centrifugal sugar was sold at P 13.60/kg in 1996, an increase of 52% from P8.95/kg in 1992.
Import of refined sugar tremendously increased from 4,539 MT in 1994 to 48,401 MT in 1995. Value likewise increased form 2.3 million to $25.3 million during the same peliod.
The Philippines supplies 13.5% of the US sugar demand under the latter's tariff rate quota system - the third largest share, next only to the Dominican Republic and Brazil. Meanwhile, sugar imports have started to make inroads in the domestic market due to trade liberalization under the GATT and the Association of Southeast Asian Nations (ASEAN) Free Trade Are (AFT A) agreement.

Dar 89
At the GATT Uruguay Round, the Philippines offered perhaps the biggest reduction in bound tariffs for out-quota imports over the life of the agreement. Recently, the sugar industry has sought a modification of the government's tariff commitments, including raising the final out-quota bound rate under the GATT -WTO. Leaders of the sugar industry have asked government to continue with the 65% tariff rate until the year 2003 to allow the sector more time to upgrade its efficiency, including additional investments in rehabilitation and modernization of sugar mills and refineries, as well as for government to correct the disincentives to agricultural investments.
A t risk of decline and demise are ncarly PI 00 billion in investments and the livelihood of 4,000 sugarcane farms that employ half a million Filipinos. Sugar mills with investments worth at least P50 billion will be in jeopardy as cane supply dwindles and the increasing domestic demand for sugar is met by imports of cheap, subsidized or even dumped refined sugar. The Philippine sugar industry admits the need to metamorphose and change its shape, character and destiny - not only through tariffs, but through investment and policy climate favorable to restoring sugar as a viable business, with competitive prices as the key to producing more.
D. Coconut
The coconut industry is a pillar in Philippine economy. It earns an annual average ofUS$700 million from exports alone. Moreover, the Philippines remains as the world's leading supplier of traditional coconut products, with a market share of 40.3% of world coconut production, 60.4% of world copra and coconut oil supply, and 59% in laurics output. The industry has strong processing sectors and stakeholder associations - 94 oil mills, 66 oil refineries, II desiccated coconut (DeN) plants, II activated carbon plants, and 16 oleochemical plants and food processing industries. It benefits 1.6 million farmers, 1.9 million farm workers, and 20 million people directly or indirectly. It occupies about one-fourth of the total area harvested to agricultural crops. It also contributes to the sustainable management of environments as the palm protects the soil from erosion and nutrient loss.
Lately, however, the coconut industry has been characterized as a sunset industry because of erratic and declining production, and its seeming inability to meet the challenges brought by the domestic economic climate, new competitors, and changes in international trading regulations.
With the reduction in tariffs under the GATT, domestic support and export subsidies will lead to greater market access. For the coconut industry, the goal is global competitiveness - enhancing the country's edge in the export market. The opportunities being brought about by trade liberalization must be maximized, while protecting the industry from the adverse impact of the opening of markets.

90 Trans. NaIl. Acad. Sci. Tech. Philippines 21 (I 999)
1. Production
World production of coconut was 43 .275 million MT in 1994. The average growth rate was 1.92% from 1980 to 1949. Major producing countries are in Asia and the Pacific where coconut is primarily a smallholder crop, with Indonesia and the Philippine leading the production.
Here in the Philippines, coconut is a major crop in 67 provinces, occupying 3.16 million ha in 1998 (distributed in Mindanao, 1.7 million ha; Luzon, 0.9 million ha; and Visayas, 0.6 million ha) with 240 million trees bearing an annual average of 7 billion nuts. It is widely grown in Mindanao which occupies over half of the total coconut hectarage and produces the largest proportion of outputs. Major producing regions are Southern Tagalog, Bicol, Eastern Visayas, Western Mindanao, and Southern Mindanao (Figure 6, Appendix Table 8).
From 1990 to 1998, the total area planted to coconut was highest in 1997 at 3.31 million ha (Appendix Table 8). There is, however, a continuing reduction trend in area planted to coconut, especially in Mindanao, due to the shift from coconut to other high-value crops, conversion of coconut lands to other more profi table uses (residential, commercial or industrial), and cutting of coconut trees for coco lumber. The shift in land use to other high value crops is significant in Mindanao where more lands are planted to banana, durian and other exotic fruits and commercial crops. Land conversion and cutting of coconut trees for lumber are prevalent in Southern Tagalog as a result of industrialization.
Through the years, coconut production has been on the downtrend and this could be attributed to the declining hectarage and yield. The ban on copra exportation in the early 1980s may have affected the industry's production during this period. With the lifting of the export ban in 1986, production surged to a record high of 14.33 million MT. In 1994, production fell by 23% from the 1986 level, with 11.2 million MT of nuts. This was attributed to senility of old trees, conversion of coconut farms to other uses in the Mindanao and CALABARZON areas, and typhoons in Visayas and Luzon. Production slightly increased in 1995 (12.18 million MT) and 1997 (12.11 million MT), but reached a low of 10.9 million MT in 1998 (Appendix Table 9).
Among the reasons identified for the decline in productivity of coconut in the country area: I) low productivity of old senescing trees and failure to implement replanting program; 2) non-utilization of improved farming practices to increase yield; 3) limited supply of improved and high-yielding varieties; 4) prevalence of typhoons in coconut-growing regions in Luzon and Visayas; 5) poor post harvest handling causing low quality copra and copra meal; 6) poo~ soil conditions; 7) inadequate funds to develop industry, scientific manpower is inadequate, and capability for RDE is low. Table 6 summarizes the status of coconut production in the Philippines.

•
• )
._ .
... 19 - 1!10
1M - U. ... .... f ll - SMI
Figure 6. Coconut area harvested ('000 ha) by region 1997
2. Uses, Consumption and Marketing
Dar 91
Coconut goes through a marketing system that has developed within the industry. The nuts are harvested by hired workers and brought to accessible areas, preferably near the road. They may be sold to barangay or town buyers who are normally involved in fresh nut and copra trading. The various users of copra get their supply from these buyers. The users are the millers, oil miller/refiners, and oil miller/refiner/manufacturers who may also be involved in the domestic sale and export of coconut products. For their raw materials, desiccated coconut manufacturers buy fresh nuts from the buyers.
Under this marketing scheme, farmgate prices fluctuate and are generally low, sharing arrangements are inequitable, and farm worker wages are low. The whole trading and marketing system works to the disadvantage of majority of the poor coconut farmers.
The Philippines used to export copra as a major item. Starting in 1980, however, copra became a minor export product. In 1995, it accounted for only about I% of the total volume of coconut export in copra equivalent. For the last ten years,

92 Trans. Nat!. A cad. Sci. Tech. Philippines 21 ( 1999)
Table 6. Status of coconut production in the Philippines, 1994-1998
COCONUT
Hectarage (ha)
Production (MT)
Yields/ha (MT/ha)
Areas of production
Major problems encountered and constraints to production
Major problems encountered and constraints to marketing
1994 1995 1996 1997 1998
3,082,651 3,064,457 3,149,035 3,314,416 3,115,832
11,206,997 12,183,088 11,368, Ill 12,118,452 10,905,328
3.64 3.98 3.61 3.66 3.50
Southern Tagalog, Bicol, Eastern Visayas. Western Mindanao, and Southern Mindanao
• Low productivity of old trees and failure to implement replanting program
• Non-utilization of improved farming practices Limited supply of improved and high-yielding varieties
• Prevalence of typhoon in coconut-growing regions • Poor harvest handling • Poor soil conditions • Inadequate funds for ROE
• Farmgate prices fluctuate and are generally low; sharing arrangements are inequitable; farm worker wages are low; the whole trading and marketing system works to the disadvantage of majority of the poor coconut farmers
• Industry is basically export dependent; domestic utilization is less competitive in the world oils and fats trade
• Development of new world sources of lauric acid fats has posed a threat to the industry.
Note: Refer to Appendix Table 8 and 9 for /990-98 data on area harvested to coconut and volume of production by region.
coconut oil (CNO) has become the dominant export product of coconut, accounting for about 74% in 1995. About 13% was exported as DCN, coco chemicals, and copra.
Twenty percent was used locally for the production of commercial edible cooking oil; coco chemicals; base material for shortening, laundry soap, and detergent; home made oil; and food. Other products with potential in domestic/foreign market are coir fiber and dust from the husk; charcoal and activated carbon from shell; beverage, vinegar, plant culture media, growth hormones for coconut water; and food products from coconut meat.
In 1995, coconut production was 2.65 million tons (copra terms). In 1997, Philippine coco chemical capacity was expected to grow by 63% (310,500 tons) with the entry of the Prime Oleochemicals, Inc., with production capacity of 120,000 tons. In the next five years, the composition of coconut exports is seen to change, with the Philippines exporting mostly processed or finished products.

Dar 93
From 1989 to 1995, the major markets for CNO value-wise are USA (43%); Europe (41 %); and non-traditional destinations (16%). Japan is the main market for coconut shell charcoal, while USA and Japan are the major markets for activated carbon. Exports of coco chemicals followed a downward trend from the recorded 154,000 tons in copra equivalent in 1987 to 43,000 tons in J 991 following an expanding domestic market. It recovered in 1992 and registered a peak of88,000 tons in 1993.
Prices of coconut products follow the international market trends. From 1980 to J 991, average domestic and export prices in nominal terms of copra, coconut oil, copra meal and DCN fluctuated. Such trend is attributed to fluctuating world coconut oil prices, and in response to the supply position in the Philippines which is basically controlled on a yearly basis by the weather.
The export-dependent nature of the industry is a valid concern among stakeholders, with domestic utilization of coconut as lowest among coconut-producing countries. Another concern that threatens the industry is the less competitive price of coconut oil compared to that of other vegetable oils in the world oils and fats trade, and the development of new world sources of lauric acid fats besides coconut oil. Lower tariff rates on imported coconut and coconut oils are also expected to increase their inflow into the country, thus the need to make local production more competitive.
The projected market outlook for coconut in the near term remains bright. It is and will continue to be a sunrise industry, especially with the government's sustained development efforts to increase coconut production at globally competitive prices.
F. Fruits and Vegetables
Fruits and vegetables are relatively cheap sources of healthy foods which impact the nutritional state .of Filipino consumers. While there are specialty fruits and vegetables for the high-end markets, there are more than can easily be grown for home consumption or marketed to the average consumers. The main thrust of the government is to promote market driven-based production system for fruits and vegetables that are technologically cost efficient and competitive in local and export markets, and home consumption-based production system for indigenous, nutritious crops.
Three factors led to the development of the Philippine fruit export industry; large investments and technology transfer by multinationals, principally in banana and pineapple; keen interest from Japanese traders and consumers; and export liberalization. The industry classifies major fruits and nuts into two categories. Currently exported fruits are banana, pineapple, mango and papaya. Potential exports include citrus, durian, cashew, pili, mangosteen and jack fruit.
Meanwhile, the growth and development of the vegetable industry in the last four decades contributed significantly to improvements in both the nutritional wellbeing and economic status of the Filipino. The Philippines enjoys a comparative advantage in the production of select fresh vegetables and vegetable seeds. Its

94 Trans. NaIl. Acad. Sci. Tech. Philippines 21 (1999)
favorable climate makes it possible to produce over 30 kinds of fresh vegetable allyear round and grow several vegetable seeds from crops that require different climate for flowering. Recent developments in the domestic and export markets open bright opportunities for vegetables.
This section will touch on two major fruit exports - banana and mango, and leading vegetable crops - onion and mungbean.
1. Banana
The Philippines ranks fifth in the international banana trade. The country is the only supplier of banana chips in the world, accounting for 95% of the annual export receipts of processed bananas over the past five years. Banana chips are exported to 32 countries, with the USA and EEC as the major importers. Under the GA TT, the banana industry can take advantage of the lower tariff in the export market.
Banana is a widely grown fruit in the country, planted as a component of the farming system or as a main crop in large plantations in Mindanao. It is an important source of cash income for small farmers who constitute 75% of the banana growers. A total of 5.9 million farm households are dependent on the banana industry.
Of the 80 distinct Philippine banana cultivars, Lakatan, Latundan, Bungulan and Saba are popularly grown for the local market. Meanwhile, Cavendish is produced for fresh fruit export market. At present, Senorita and Lakatan are gaining acceptance in major importing countries. Likewise, Saba is the chief source of banana chips and catsup.
Banana is the leading fruit crop in terms of area, volume and value of production. A total of 337,082 ha were planted to banana in 1998. Major areas of production are in Southern Tagalog, Western Visayas, Western Mindanao, Northern Mindanao, Southern Mindanao, Central Mindanao, CARAGA, and ARMM (Appendix Table 10).
Total production in 1997 was 3.4 million tons valued at PI 0.74 billion (Appendix Table II, Table 7). Top producing region is Southern Mindanao, accounting for 1.6 million tons of total production. The national average yield was 10.56 tlha while big plantations produced about 40 t/ha per year.
Bananas are consumed fresh or processed as chips, catsup, wine, flour, puree and other food/feed preparations. About 66% of production is being consumed locally, while 34% is exported. About 73% of the local consumer fruit intake consists of banana. Per capita consumption averaged about 22kglyear in 1993-1997.
Export earnings from fresh and processed banana averaged about US$244.13 million/year (1993-1997). About 1.14 million MT of fresh banana and 19,094 MT of chips were exported in 1997. Japan, Hong Kong, and the Middle East countries are the major export markets.
Domestic market for fresh banana is dominated by middlemen and traders, while the export industry is handled mostly by multinational corporations. In smallscale farms, bananas are sold on a finger count basis; in commercial plantations, these are sold by weight.
Dar 95
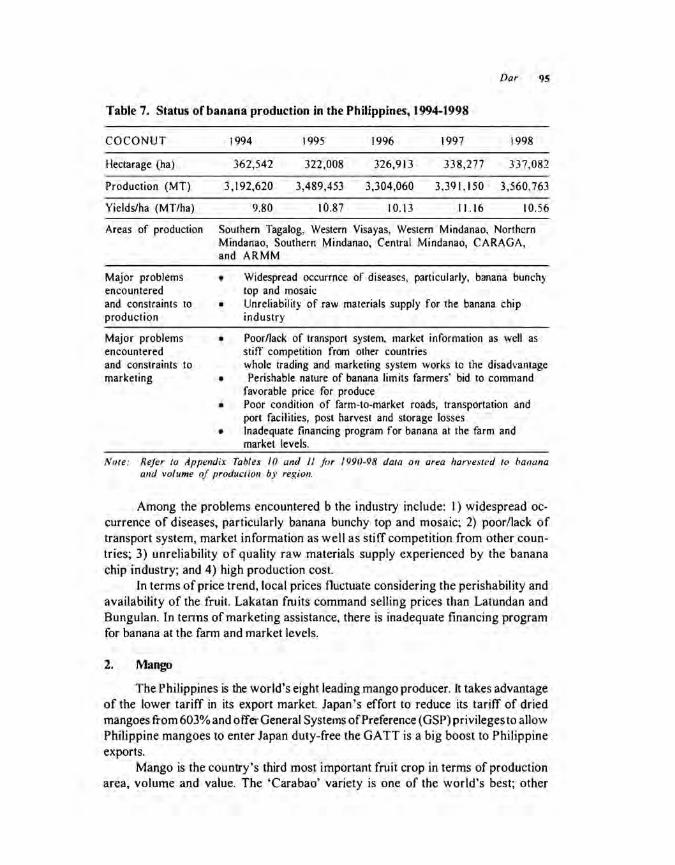
Table 7. Status of banana production in the Philippines, 1994-1998
COCONUT
Hectarage (ha)
Production (MT)
Yields/ha (MT/ha)
Areas of production
Major problems encountered and constraints to production
Major problems encountered and constraints to marketing
1994 1995 1996 1997 1998
362,542 322,008 326,913 338,277 337,082
3,192,620 3,489,453 3,304,060 3.391.150 3,560, 763
9.80 10.87 10.13 11.16 10.56
Southern Tagalog, Western Visayas, Western Mindanao, Northern Mindanao, Southern Mindanao, Central Mindanao, CARAGA, and ARMM
• Widespread occurrnce of diseases, particularly, banana bunchy top and mosaic
• Unreliability of raw materials supply for the banana chip industry
• Poor/lack of transport system, market information as well as still' competition from other countries whole trading and marketing system works to the disadvantage
• Perishable nature of banana limits farmers' bid to command favorable price for produce
• Poor condition of farm-to-market roads, transportation and port facilities, post harvest and storage losses
• Inadequate financing program for banana at the farm and market levels.
Note: Refer to tlpp1mdix Tables 10 and II j(Jr /990-98 data 011 area harvested to banana and volume of produaion by region.
Among the problems encountered b the industry include: I) widespread occurrence of diseases, particularly banana bunchy top and mosaic; 2) poor/lack of transport system, market information as well as stiff competition from other countries; 3) unreliability of quality raw materials supply experienced by the banana chip industry; and 4) high production cost.
In terms of price trend, local prices fluctuate considering the perishability and availability of the fruit. Lakatan fruits command selling prices than Latundan and Bungulan. In tenns of marketing assistance, there is inadequate financing program for banana at the fann and market levels.
2. Mango
The Philippines is the world's eight leading mango producer. It takes advantage of the lower tariff in its export market. Japan's effort to reduce its tariff of dried mangoes from 603% and offer General Systems of Preference (GSP) privileges to allow Philippine mangoes to enter Japan duty-free the GATT is a big boost to Philippine exports.
Mango is the country's third most important fruit crop in terms of production area, volume and value. The 'Carabao' variety is one of the world's best; other
96 Trans. Natl. Acad. Sci. Tech. Philippines 21 (1999)
important varieties are 'Pico' and 'Katchamita'. The industry supports some 2.5 million farmers and farm family members.
Mango thrives best in areas with at least five months of dry period. Area planted to mango in 1998 was 92,939 ha. Leading mango production areas are Ilocos, Cagayan Valley, Southern Tagalog, Western Visayas and Central Luzon (Appendix Table 12). Total volume produced in 1998 was 950,074 MT valued at US$51,376,000, with Ilocos Region leading at 290,169 MT. From 541,662 MT in 1994, production rose to 1,028,121 MT in 1997 and 917,471 in 1998 (Appendix Table 13). Table 8 summarizes the status of mango production in the Philippines.
The fruit is eaten fresh as dessert or as relish depending on fruit maturity. It is also processed into dried, puree,juice, nectar, chutney, pickle, and mango scoops; roll, powder, halves or scoops in light syrup; as used as flavoring for ice cream, bakery products, and confectioneries.
Philippine mango export is expected to increase by 13% because of growing market demand and world population. Domestic consumption is estimated at 16.3 kg/person annually.
In 1998, 32,513 tons fresh mango fruits worth US2$24 million (FOB) was exported to Hong Kong, Japan, Australia, United Kingdom, Canada and other countries. Export from dried and other processed mango products was 40,000 tons valuedat US$27,642,249 (FOB).
Marketing is done by middlemen who are contract-buyers, agents, assembler-wholesalers, wholesalers-exporters, and wholesaler-retailers. Fruits for local markets are packed with or without newspapers as liners in bamboo baskets, while those for export are placed in carton boxes or wooden crates.
Among the common problems in mango production are as follows: I) poor orchard management, especially lack of pruning, inadequate nutrition, indiscriminate use of chemicals, and use of inferior quality planting materials; 2) lack of crop zoning, which weakens necessary support services and infrastructure; 3) weak integrated pest management technology; 4) lack of an effective technology transfer program for growers; 5) insufficient pre-and post-harvest facilities . In terms of marketing, following are some concerns; I) inadequate financing and credit support and defective marketing system; 2) lack of standard quality control; and 3) Ii mited promotion and expansion of potential markets.
3. Onion
Onion is a dry season crop usually planted as a second crop to rice. It is usually grown in Nueva Ecija in Central Luzon (8,0 I 0 ha) and in the llocos Region (4,299 ha). Area planted with onion in the Philippines has doubled significantly from 5,854 ha in 1992 to 12,769 ha in 1998 (Appendix Table 14).
Central Luzon accounted for 60% (51,245 MT) of the total onion production of87,666 MT in 1998, while Ilocos region shared 36% (34,834 MT) (Appendix Table 15). There is a significant increase in the volume of production from 1990 (61,470 MT) to the 1998 level.

Dar 91
Table 8. Status of mango production in the Philippines, 1994-1998
MANGO 1994 199) ..,: 1996 1997 1998
Hectarage (ha) 64,960 80,393 87,680 91,899 92,939
Production ( MT) 541,662 595,138 932,730 1,028,121 950,074
Yields/ha (MT/ha) 8.34 7.40 10.64 11.19 10.22
Areas of production !locos Region, Cagayan Valley, Southern Tagalog, Western Visayas, Central Luzon
Major problems encountered and constraints to production
Major problems encountered and constraints to marketing
•
•
Poor orchard management, especially lack of pruning, inadequate nutrition, indiscriminate use of chemicals, and use of interior quality planting materials Lack of crop zoning, which weakens necessary support services and infrastructure
• Weak integrated pest management technology • Lack of an effective technology transfer program for growers • Insufficient pre-and post-harvest facilities.
•
• •
Inadequate financing and credit support and defective marketing system Lack of standard quality control Limited promotion and expansion of potential markets
Note: Refer to Appendix Tables 12 and 13 for /990-98 data on area harvested ro mango and volume of production by region.
Return on investment (ROI) in onion is high, making it one of the more profitable crops in the country. ROI for native onion is 2.47; for red creole, 2.06; and for yellow granex, 2.04 (Satang eta! as cited by Librero and Rola 1996). Onion production through the years, however, is marked by fluctuations because of changes in weather conditions, pests and diseases, area harvested and yield. The occurrence of long dry season enhances the incidence of pests and diseases that significantly affects onion yield.
The marketing system of onion is basically competitive because of the presence of many buyers and sellers interacting in the market. Farmers sell onions based on variety and size, with no strict standards being followed by both farmers and traders. The abundance of intermediaries has led to increased marketing cost.
There is a virtual lack of technology on the production of quality onions, particularly the yellow granex variety. Seeds are still being imported. Development activities on varietal improvement to lengthen shelf-life, higher solid components for processing, and alternative storage methods should be pursued. People venturing into onion growing should be cautious as the industry is sensitive to oversupply. Adequate storage facilities are needed to prolong shelf life and avoid price drops during the harvest season. Table 9 summarizes the status of onion production in the Philippines.

98 Trans. Nat I. Acad. Sci. Tech. Philippines 21 ( 1999)
Table 9. Status of onion production in the Philippines, 1994-1998
UNION 1994 1995 1996 1997 1998
Hectarage (ha) 7,559 8,693 9,806 I 1,888 12,769
Production (MT) 73,635 88,427 83,322 85,393 87,666
Yields/ha (MT/ha) 9.74 10.17 8.50 7.18 6.87
Areas of production Central Luzon and !locos Region
Major problems encountered and constraints to production
Major problems encountered and constraints to marketing
• Fluctuation in production due to changes in weather conditions, pests and diseases, and decline in yield. Occurrence of long dry season enhances the incidence of pests and diseases.
• Lack of technology on the production of quality onions, particularly the yellow granex variety. Seeds are still being imported.
• Inadequate R&D on varietal improvement to lengthen shelflife and higher solid components for processing, and on alternative storage methods.
• Lack of financing and high cost of inputs
• Inefficient marketing and distribution systems. Abundance of intermediaries lead to increased marketing cost.
• The industry is senstive to oversupply. Adequate storage facilities are needed to prolong shelf life and avoid price drops during the harvest season.
Note: Refer to Appendix Tables 14 and 15 for /990-98 data on area harvested to onion and volume of production by region.
Traditionally, onion has the biggest share in export earning. In 26 years, it accounted for 34% of the vegetable industry's foreign exchange earnings. From the 1970s, fresh onion exports showed fast growth. The record in volume ( 18,246 tons) and value (US$6.8 million) was reached in 1986. In 1996, export of fresh onion (including shallots or native onion) reached 27,227 tons, worth US$11.4 million. Japan got 87% of the onions, followed by Hong Kong, Singapore, Thailand, and the United Kingdom. Indonesia was the major exporter of shallots, absorbing 73% of the total. Dried and pickled onions, though in minimal quantities, were also exported to Singapore and Japan.
4. Mungbean
Of the 13 million ha devoted to agricultural production in the country, only 0.12 millionha are planted to legumes (BAS 1989-1996). Volume of production is low at 77,000 MT annually during the past 17 years, while demand has grown to more than I 00-200%. To meet the demand, importation was resorted. In the last six years, local supply of legumes (groundnut and mungbean) meet only about half of the demand.

Dar 99
Legumes are usually grown in combination with rice and com either as an inter-crop (com with peanut) or in rotation (com-legume; com-com-legume; ricelegume; rice-rice-Iegume).
Mungbean is a poor man's meat and, thus, has become part of the Filipino's eating habit. It is harvested all year-round in different areas of the country, thus, seed supply is not much of a problem.
Unlike other legumes which experienced declining trends in area and volume of production for the past nine years (1990-1998), there was not much change in area (35,000 ha) and volume (25,000 MT/year) of mung bean (Appendix Tables 16 and 17). Its status as a subsistence crop helped prevent the decline in area of production. The slight increase in mung bean yield (10%) between 1980-1997 may have been the result of high adoption of BPI Mg9 or "Taiwan Green" a drought resistant mungbean variety with a higher yield of I.OMT/ha. The Ilocos region has the largest area planted to mung bean ( I 1,897 ha) and the highest volume of production (12,197 MT) as well.
Among the major constraints to mungbean production are occurrence of pests and diseases, inadequate supply of seeds, high cost of production inputs, bad weather and natural calamities, lack of water or irrigation system, inadequate transportation, poor soil condition, and losses due to thieves and stray animals. Marketing constraints include price instability, lack of marketing information, high transport cost/poor transport system, and lack of market outlet. Table 10 summarizes the status of mung bean production in the Philippines.
F. Roots
Among the crops with great potential to fulfill the food security requirements of the country are the rootcrops, particularly cassava and sweetpotato - indigenous, nutritious crops that require minimal technology, labor and inputs. Lately, however, cassava and sweetpotato have emerged from their traditional image of being poor man's crops into important industrial and food crops. Both grow easily even under poor conditions and are major crop components in mixed cropping systems in the uplands.
1. Cassava
The Philippines is one of the major producers of cassava, along with Thailand, Indonesia, India, China and Vietnam. In 1997, the national production of cassava reached 1,958,004 MT, the highest level attained during the past 10 years. Yields range from 8-20 t/ha in the uplands to 20-40 t/ha in plantations. The national average, however, was 8.25 tlha in 1998.
Production area in the country reached 216,474 ha in 1998 (Table 11), with the ARMM having the largest area followed by the Bicol region and Eastern Visayas. These accounted for 57.9% of the area planted to cassava nationwide. ARMM, Bicol and Western Mindanao were the top cassava producers, withyields of869,278 MT, 226,883 MT, AND 216,626 MT, respectively.

100 Trans. Nat!. Acad. Sci. Tech. Philippines 21 (!999)
Table I 0. Status of mungbean production in the Philippines, 1994-1998
MUNG BEAN
Hectarage (ha)
Production (MT)
Yields/ha (MT/ha)
Areas of production
Major problems encountered and constraints to production
Major problems encountered and constraints to marketing
1994 1995 1996 1997 1998
34,006 34.860 35,453 36,420 34,629
24,218 26,651 26,792 27,468 27,670
0.71 0.76 0.76 0.75 0.80
• Occurrence of pests and diseases in mongo farms • Inadequate supply of seeds • High cost of inputs • Bad weather and natural calamities, lack of water or irrigation
system, inadequate transportation, poor soil condition and losses due to thieves and stray animals imported.
• Price instability Lack of marketing information
• High transport cost/poor transport system • Lack of buyer or market outlets
Note: Refer to Appendix Tables 16 and 17 for 1990-98 data on area harvested to mungbean and volume of production by region.
About 44% of production is consumed as food. Cassava can either substitute for or supplement rice and com in daily meals. It is the most important food crop in Lanao, Zamboanga, and Sulu where grated cassava is the staple of the Muslim population. Substantial production volume is processed into various industrial products such as starch and its derivatives. Increasing volumes are processed into dried chips which are either exported to Europe or utilized domestically as source of energy in aqua and livestock feeds.
2. Sweetpotato
The Philippines ranks eight in the world in terms of sweetpotato production. From 667,807 MT in 1994, production declined to 568, I 02 MT in 1998 (Table II). Current productivity level is at 4.44 MT /ha.
Production area in the country reached an averaged of 145,718 ha from 1993 to 1996. In 1998, however, it declined to 127,977 ha. 8 icol region has consistently led domestic production in terms of volume and hectarage, contributing 25% and 19.9% respectively, of the total production in 1996. Next to Bicol region in Eastern Visayas, sharing 14.7% in production volume and 17.6% in area harvested in 1996, followed by CARAGA and Central Visayas. The value of production was pegged at P3.17 billion in 1996.
Sweetpotato is utilized mostly as food in traditional forms (such as boiled, roasted, fried) and as unprocessed feeds. At present, sweetpotato can be made

Dar 101
Table ll . Status of cassava and sweetpotato production in the Philippines, 1994-1998
CASSAVA 1994 1995 1996 1997 1998
Hectarage (ha) 212,877 225,751 228,343 230,522 216,4 74
Production (MT) I ,890,509 1,905,903 1,910,775 1,958,004 1,786.714
Yields/ha (MT/ha) 8.88 8.44 8.37 8.49 8.25
Areas of production ARMM, Bicol, Western Mindanao
Major problems encountered and constraints to production
SWEETPOTATO
Hectarage (ha)
Production (MT)
Yields/ha (MT/ha)
•
•
•
Farmers-processors do not receive optimum returns on investments because of poor processing and low quality products. Traders offer low price for fresh and processed product because of lack of quality control by farmers and processors. The unstable supply and low quality of dried chips are some of the problems, especially in marketing for industrial uses. Lack of postharvest facilities and the continuous importation of cassava starch and glucose have also been cited as problems in the cassava industry
1994 1995 1996 1997 1998
146,111 145,236 141,006 141,701 127,977
667,807 667,946 654,231 631,431 568, I 02
4.57 4.60 4.64 4.46 4.44
Areas of production Bicol, Eastern Visayas, CARAGA and Central Visayas
Major problems encountered and constraints to production
•
• • • • • •
Low productivity due to inefficient production and low adoption of technology Incidence of pest and diseases Low dry matter content even of recommended varieties Use of marginal lands for most sweetpotato production lnsufticient postharvest facilities, tools and equipment Weak farm producers-market linkage Poor social/cultural acceptability of sweetpotato products
into semiprocessed products, flour/starch, catsup, fruit-like products, jam, snack chips, and beverage. Sweetpotato starch is used for the manufacture of paper, ink, paint, chemical products, feed stuff and accelerant. The by-products from starch processing can be used for alcohol and organic fertilizer production.
Sweetpotato has a potential demand of 648,000 MT/year from human consumption alone at 9 kg/capita consumption. There is a growing demand in the local and export markets for sweetpotato and its products. Initiatives/enterprises for the production of starch and flour for various high-value processed products are now

102 Trans. Natl. Acad. Sci. Tech. Philippines 21 (1999)
in place. Demand for sweet potato as energy source in commercial feeds and as raw materials for alcohol production has created growing need to further increase production in the country.
Domestic market still remains as the major outlet for fresh sweet potato. Increasing volume in the future is expected to cater to emerging local and international markets as ingredient for animal feeds and flour/starch.
F. Abaca
The Philippine abaca has remained a viable source of export earnings contributing an average ofUS$50 million from 1985 to 1995. It still dominates the world market supply of 85%. Being a consistent dollar earner and contributor to the upliftment of the socioeconomic condition of the people, abaca is identified as the flagship commodity of the Eastern Visayas region.
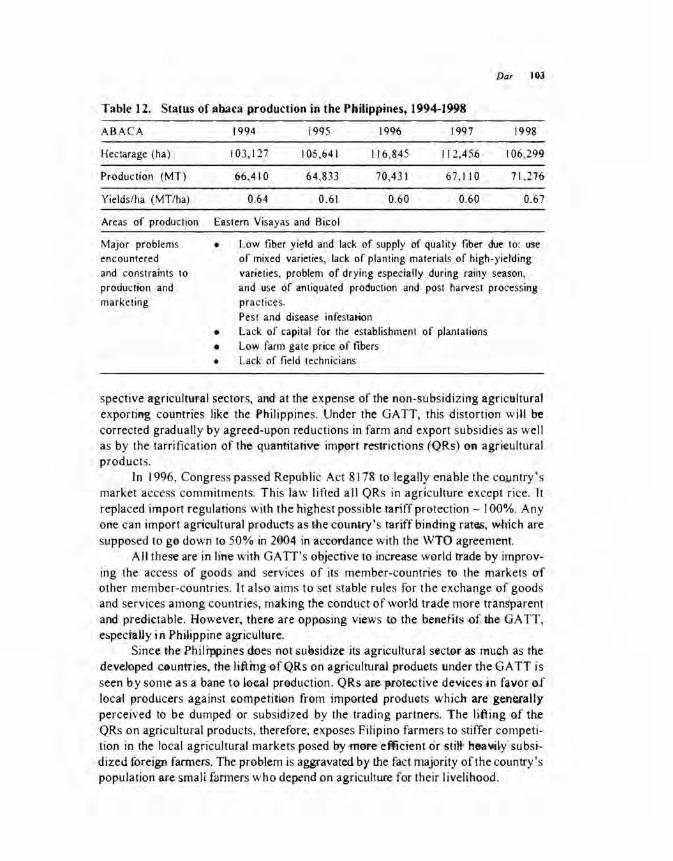
In 1996, abaca production in the country reached 70,400 MT valued at P 1.27 billion. In 1998, it slightly increased to 71,276 MT. Area of production is 106,299 ha in 1998 (Table 12), with a ten-year national average yield of 0.93 MT/ha. Eastern Visayas is noted as the largest abaca producer in the country, followed by Bico!.
Products derived from abaca are ropes and other cordage products; fibercrdft products such as bags, hats, place mats and other cottage industries; and abaca pulp.
Demand for raw abaca fiber in the world market increased by 6.6% from 18.7 T mt in 1994 to 19.32 T mt in 1995. Raw fiber production decreased from 48,915 MT to 45,541 MT (1994-1995). Export earnings from abaca fibers and manufacturers reached US$94.5 million in 1995 from US$82.4 million in 1994. The rising demand for abaca fiber can be attributed to the GATT ratification and new markets and growing popularity.
IlL PHIUPPINE AGRICULTURE: TRADING INTO TIlE FUTURE
As the country grapples over the propriety of opening up its agricultural markets to foreign competition, so unfolds the World Trade Organization's (WTO) process of continuing the negotiations to further globalize agricultural markets in the world, as well as to continue to process of installing rules-based trading regime for agriculture. Besides weighing the net advantages of deepening market access commitments, the country will have to assess if it is in its advantage to adopt the proposed new rules on agriculnual global trading.
Following the ratification by the Philippine Senate of the GATT Uruguay Round Final Act, the government acceded to the WTO in 1995 as one of the organization's founding members. Under this trade treaty, the Philippines agreed to not only increasing open its agricultural markets to foreign competition but also to legally enable the rules governing agricultural trade as defined in the treaty.
The Uruguay Round Final Act integrates for the first time agricultural trade under the rules and discipline of the GATT. In the past, agricultural trade has been distorted, both in favor of countries which have been able to subsidize their re-
Dar 103
Table 12. Status of ~baca production in the Philippines, 1994-1998
ABACA 1994 1995 1996 199'7 1998
Hectarage (ha) 103,1 27 105,641 116,845 I I 2..45.6 106,299
Production (MT) 66,410 64,833 70 ,431· 67 , 1 I 0 71 ,276
Yields/ha (MT/ha) 0.64 0.61 0.60 0.60 0.67
Areas of pr.oduction Eastern Visayas and Bicol
Major problems encountered and constraints to production and marketing
• Low tiber yield and lack of supply of quality tiber due to: use of mixed varieties, lack of planting materials of high-yielding varieties, problem of drying especially during rainy season, and use of antiquated production and post harvest- processing practices. Pest and disease infestation
• Lack of capital for the establishment of plantations • Low farm gate price of tibers • Lack of field technicians
spective agricultural sectors, and at the expense of the non-subsidizirrg agricultural exporting countries like the Philippines. Under the GATT, this distortion will be corrected gradually by agreed-upon reductions in farm and export subsidies as well as by the tarrification of theJ qua-ntitative· import restrictionS' (QRs) on agrieultural prod_ucts.
In 1996, Congress passed Republic Act 81 18 to legally enable the coJ,,mtry' s market access commitments. This law lifted all QRs in agriculture except rice. It replaced import regulations with the highest possible tariff protection - I 00%. Any one can import agricultural products as the country's tariff binding rat~. which are supposed to go down to 50% ·in 2004 in accordance with the WTO agreement.
All these are in line with GAIT's objective to increase world trade by improving the access of goods and services of its member-countries to the markets o'f other member-countries. It also aims to set stable rules for the exchange of goods and services among countries, making the conduct· of world trade niore tr'an~parent and predictable. However, there are· opposing views -to the beneHts .of. the GATT, especially in Philippine agriculture.
Since the Phili'ppines does not subsidize .its agricultural sect.or .as mw~h as the developed cGuntries, the lifti'ng•ofQRs on agricultural products under the 0ATT is seen by some as a bane to local production. QRs· ace. ~rotective devices jn favor af local producers against competition from imported produets whic.h are generally perceived to be dumped or subsidized by the trading partners. T he lifting of the QRs on agricultural products, therefore, exposes Filipino farmers to stiffer competition in the local agricultural markets posed by ·more·'eW!cient oT•stiH hoo-..ily'-subsi•dized foreign fanners. The problem is aggravated t>.,y the fact majority of the country 's population ·ate small fanners who depend pn agriculture for their livelihood.

104 Trans. Natl. Acad. Sci. Tech. Philippines 21 (1999)
With this possible loss in markets, farm income may decline. As a consequence, the access of farm families to food supply would be impaired, exacerbating the country's undernutrition problem. Critics of GATT also claim that the country's ability to provide food to its growing population will also be impaired because of the shift to high value crops for export to replace traditional crops as rice and corn.
Trade liberalization under the GATT-WTO is indeed, a double-edge swordit can make or break Philippine agriculture. Its long ternl goal is to make domestic producers more competitive in the world market through exposure and access to better technology, improved production efficiency and higher product standards. However, the preconditions to the achievement of these in the domestic situation rest upon the resources especially of the small farmers, and the so-called safety net measures in the form of infrastructure and institutional support from the government that would facilitate farmers' access to these free trade opportunities.
In thenext millennium, globalization will be a central concern. Filipino consumers will enjoy access to a wide range of goods and services. At the same time, however, Filipino farmers may fear - validly - that globalization is a threat to their livelihood.
Provided that all stakeholders are true to their commitments, modernizing Philippine agriculture through the AFMA, with the corresponding substantial increase in public investment, is what will cushion our small farmers from the fall.
A. Key Features of the Agricultural Accord under the GA rf
1. Conversion of all Quantitative Restriction (QRs) Imposed on Agricultural Products Into Tariffs
QRs are measures imposed by a government to deny entry or restrict the amount of agricultural products imported from other countries. Under the GATT, all these restrictions will be lifted by member-countries. However, they will' be allowed to impose tariff rates equivalent to the level of protection enjoyed prior to the removal of such restrictions.
2. Reduction of Tariffs on Agricultural products
All member-countries are required to "bind" or set a maximum limit on tariffs to be imposed on all agricultural products. Developing member-countries will then reduce these limits by a minimum of 10% for each tariff line and by a simple average of 24% for all tariff lines within ten years starting 1995 until year 2004. Developed member-countries, on the other hand, will reduce these limits by a minimum of 15% for each tariff line and by an average of 35% for all tariff lines within a six-year time frame starting in 1995.
3. Reduction of Domestic Subsidies
Domestic subsidies are measures implemented by a country to reduce the costs of production or increase the net revenues received by agricultural producers

Dar 105
in its domestic market, thereby encouraging the production of these commodities beyond what is economically efficient. Unfair subsidies will be phased out through reduction of aggregate measure of support CAMS). The AMS, which is the monetary value of subsidies given to agricultural producers of a given commodity, will be reduced by 20% over six years by developed countries and 13% over 10 years by developing countries.
4. Reductioll 0/ Export Subsidies
Export subsidies are payments made by the government to its domestic producers to permit them to reduce their cost of production, thus enabling them to compete more effectively in world trade. Prevalent in developed countries, these subsidies are provided to encourage the export of farm products which are domestically-produced in large amounts as a result of the domestic product support.
Developed countries are to lower their respective export subsidies by 21 % over six years while developing countries are required to cut the same by 14% over I () years.
5. .Market Access Commitmellf.'J
To promote transparency in agricultural trade, use of non-tariff measures (NTMs) such as QRs will not be expanded, and existing QRs on farm products will be tarrified. However. contracting parties can postpone their compliance for at most the length of the implementation period from 6 tot 0 years. For countries facing extreme political difficulties with respect to sensitive agricultural products, this requires the granting of minimum access of I % of consumption and the implementation of effective production restraining measures.
6. Harmollizatioll o/Sal/italY alld Phytosallitary Measures
Sanitary and phytosanitary measures necessary to protect human, animal, or plant life or health will be hannonized among GATT member-countries.
B. Impact on Philippine Agriculture
1. Removal 0/ QRs
The Philippines is required to lift all existing quantitative restrictions on all agricultural products, except rice. At present, the country imposes import restrictions and licensing regulations on corn, livestock, poultry and meat products, onions, garlics, potatoes, cabbage and coffee and coffee by-products. In lieu of these restrictions, higher tariff rates equivalent to at least double the final applied rates in 1995 will be imposed.
For critical agricultural products, the increase will be more substantial and reach the maximum allowable I imit of 100% under the Philippine Tariff and Customs Code. For example, the tariffs on corn imports has been increased from 20% to 100%.

106 Trans. Natl. Acad. Sci. Tech. Philippines 21 (1999)
In recognition of food security concerns, developing member-countries like the Philippines have been allowed the flexibility of retaining quantitative restrictions for staples. The Philippines chose to avail of this privilege; hence, import restrictions on rice will remain in place for the next ten years. However, in exchange for this privilege, the country will be required to allow the importation of rice equivalent to I % of our domestic consumption or about 59,000 MT in 1995. This level of importation will increase to 4% of our domestic consumption or about 239,000 MT in 2004. The Philippines reserves the right to allow the NFA to exclusively import such quantities of rice for its buffer stocking.
2. Reduction o/Tariffs
For agricultural products whose quantitative restrictions will be lifted, the Philippines will bind or set maximum limits on tariffs at a minimum of twice the existing tariff rates. For critical agricultural commodities like com and livestock and poultry products, the bound tariff rale is 100%. These bound tariff rates will be reduced to levels equivalent to at least ten percentage points higher than the existing rates within ten years starting 1995.
In case of com, whose tariff rate stands at 20%, the initial bound rate is 100%. This rate will be reduced to 50% by 2004. On the other hand, the initial bound rate for meat of swine, whose present tariff rate is at 20%, will be 100%. This will be reduced by 40% by 20004.
For agricultural products which do not enjoy protection through quantitative restrictions, the initial bound rates will be ten (10) percentage points higher than existing tariff rates. These bound rates will then be reduced by the minimum requirement of 10% by the year 2004.
For selected agricultural commodities whose tariffs are currently bound under the GATT Tokyo Round of Negotiations, the initial bound rates will be maintained at their existing levels. These rates will then be reduced by the minimum requirement of 10% by the year 2004.
These reduction in bound rates will enable the Philippines to comply with the requirement of reducing tar itT rates by an average of 24% for all tariff lines within the I O-year time period between 1995-2004.
3. Reduction 0/ Domestic Subsidies
The Philippine currently provides domestic subsidies to its rice, com, coconut and sugar sectors. These subsidies take the form of production support measures such as fertilizer, certified seed, and planting material subsidies, as well as price support mechanisms. The computed AMS for any of these sectors fall below the de minimis level for developing countries of 10% of the total value of production. In fact, the rice sector, which is the most heavily subsidized in the Philippines, merely receives an AMS for roughly 5% of its value of production. As such, the Philippines is not obligated to reduce its budgetary outlays for domestic support to any of these sectors.

Dar 107
C. I mpact on Rice, Corn and Sugar
If the country provides the appropriate infrastructure and implements the necessary policy reforms that further enhance the competitiveness of its agribusiness exports, there is a tremendous potential to significantly increase estimated income and employment benefits under the GA IT.
1. Rice
No major changes will be required by the GATT Umguay Round for the rice sector. Under the provision for special safeguards for staples, the country has opted to retain the quantitative restrictions on rice. Moreover, the amount of rice to be imported in exchange for this privilege is minimal. The MT that we are committing to import in 2004 is also 22.7% less than our computed average of rice imports.
Furthennore, a change in the NFA 's mandate away from price support toward buffer stock management for food security objectives will not be contrary to the GA IT since food security programs are exempt from reduction commitments. There is, therefore, sufficient flexibility in the Agreement to allow either the maintenance of the status quo in government policies and programs in rice or a change in policy direction.
1. COrti
The Philippines has committed to set the maximum limit on com tariff at 100% and to reduce this rate to 50% in 2004. Since, historically, the domestic wholesale price of corn has been above world prices by an average of 50%, the committed initial tariff rate of 100% will serve as adequate protection to domestic producers from com imports.
In addition to maintaining adequate protection on com under the GATT, significant improvement is foreseen as a result of the greater transparency and predictability to trade policies affecting the feed/livestock subsector. Under the regime of quantitative restrictions, both com farmers and feed users face a great deal of uncertainty on whether importation will be allowed, what the timing of the importation will be, and at what amounts. These uncertainties will be reduced with the policy changes earmarked for the com sector, thereby encouraging more investment in com production and agro-processing which will lead to a more stable supply of com. For farmers, complementary policy measures such as allowing com exports will further reduce uncertainties, thus, contributing to a more competitive and dynamic industry.
3. Sugar
The reduction in domestic support and export subsidies extended by developed countries. like the US and the members of the European Union (EU), will most I ikely raise the price of sugar in the world market. However, the estimated increase will be rather small at 1%.

108 Trans. Natl. Acad. Sci. Tech. Philippines 21 (1999)
From 1980 to 1983, the average world price of sugar has been estimated at 10.5 centers per pound while Manila prices hovered at 16.5 cents per pound. Given this large discrepancy between the world price and our domestic price for sugar, it does not seem likely that there would be an appreciable opening up of new opportunities for our sugar producers as a result of the GATT, despite the slight increase in the world price of sugar. However, with the special safeguards in the GATT that allows for temporary increases in tariffs during import surges, an advantage for Ollr
sugar producers will be the minimal adjustments they will have to undertake in response to increased imports.
More signi ficantly, the Philippine access to the US sugar market will be affected by the GATT since the US committed to phase out its sugar quota system by 200 I in compliance with the GATT rules. The volume of Philippine sugar exports to the US in 1992 was 155,000 MT, valued at US$I 00 million.
It is important to note that the US phase out of its quota system is a commitment under the GA TT, and that this commitment will be implemented as soon as the Agreement is ratified by the US Congress. This clearly spells out the need to formulate an action plan to ensure the efficiency and competitiveness of the Philippine sugar industry within the GATT implementation table.
IV. STRATEGIES AND OmONS
Open trading policies have underpinned strong economic growth in SouthEast Asia. If the Philippines is to participate in the growth of this region and respond to changes occurring elsewhere in the world, it must become a more open and liberal economy. But then again. the question remains; How should we prepare and enable Philippine agriculture, particularly the crops subsector, to meet the rigors of global competition at the same time secure food self-sufficiency for the nation? Following are some strategies and options:
A. Second Green Revolution
Green Revolution swept Philippine agriculture in the early 1970s in response to the rice crisis. Covering rice, Masagana 99 introduced a package of technology for rice that was supported by a non-collateral, supervised credit scheme for farmers, and which required close supervision of farm operations by the government's farm management technicians. However, while it resulted in surpluses and paved the way for the country's entry into the world market, second-generation problems involving postharvest and marketing became more pronounced. Viewed as too dependent on chemical inputs, problems in loan repayment, postharvest operations, and marketing persisted in the early 1980s even upon introduction of program improvements.
Currently, the pressure is increasing for a second green revolution that would increase yields of major agricultural crops without destroying the environment. This second green revolution will focus on the needs of the poor, increase productivity of

Dar 109
small fanns using low agricultural inputs, and promote environmentally sound policies and practices. It should be different from the first where higher yields from highyielding crop strains and chemical inputs cannot be sustained over time.
The essence of a second green revolution is a dramatic improvement in productivity, if agricultural production growth is to at least keep pace with growth inn food demand, and with the rigors of global competition. It will have to be more complex and will have to consider other important development challenges such as decreasing fann size and environmental degradation. According to Librero (1996), chemical inputs which characterized the first green revolution are now less acceptable given the growing awareness of the adverse environmental effects of such technologies. Also, unlike in the first green revolution, the concern should go beyond mere increasing agricultural output, but greater output should be achieved through highly efficient and competitive means. The second green revolution should also be greater in scope to focus not just on rice but on other commodities such as com, fmits and vegetables which have gained critical importance in view of the country's membership to the WTO.
The burden of realizing a second green revolution, Librero (1996) added, is placed 011 science and technology (S&T) - an aggressive program of technology generation and transfer, as well as a policy environment that will ensure the availability of the much needed infrastructure and support services. Following are general policy recommendations to pave the way for a second green revolution:
• Implement an ambitious public investment program for agricultural infrastructure and support service.
• Correct the built-in bias against the rural areas in the allocation of budget for road construction, repair and maintenance.
• Increase government support to research and development (R&D) in agriculture and natural resources. Recommended is a gradual but steady increase in R&D budget as percentage ofGYA from agriculture until the recommended level of 1-2% ofGYA is reached.
• Enhance the partnership among farnlers, the local government intervenors, and scientists. The participation of fanners in major aspects of development work is crucial to ensure the success and sustainability of development programs.
B. Biotechnology
For Philippine agriculture to survive and be competitive in this present world order, the country would have to increase and sustain production of high quality, low cost agricultural products amid a rapidly decreasing land area resource through the processes of biotechnology R&D. Biotechnology is certainly an extremely important component of the menu of answers that is needed to respond to growing concerns on food production for an expected population explosion in the future, amid a depleted natural resource base and deteriorating environmental conditions.

II 0 Trans. Natl. Acad. Sci. Tech. Philippines 21 (1999)
As food demand grows and world resources dwindle, new technologies that could address these concerns the soonest possible time should be given serious consideration. Biotechnology offers the opportunity to identify the value inherent in nature, and use this to meet expanding demand for nutrition and health in a way that preserves the environment. Many experts believe that it will not be possible to feed future world population while at the same time protecting the natural environment, until the full potential of biotechnology has been realized in world agriculture.
One major issue affecting Philippine development endeavors is how to catch up with its developed neighbors amid the present world order characterized by tremendous advances in economic. information and agricultural development. With GATT expected to level the playing field in international trade, it also threatens it dislocate many of the country's traditional products. Developing countries like the Philippines will have to compete with developed countries in the world market, especially in agriculture. The challenges and potential benefits of biotechnology in meeting these challenges are enonnous.
1. Biotechnology in Crop Improvement
Following are some of the more recent biotechnology R&D in the country, particularly on crop improvement.
• Tissue culture. Among the tools of biotechnology applied to crop improvement, tissue culture for micropropagation has been the most established. Advantages derived from the technology include; uniformness, vigor, early maturity, and cleanliness. Crops which have been successfully micropropagated in the country include orchids, banana, bamboo, rattan, abaca, sugarcane, root crops, and forest trees. In crop improvement, tissue culture is used to generate variability for a desired trait. Tomato tolerant to salinity, as well as banana and avocado variants with resistance to diseases have been developed. For wide hybridization, success has been achieved in the embryo culture of makapuno. To facilitate the development of homozygous lines, anther culture of rice to generate doubled haploid lines is now being utilized by the Philippine Rice Research Institute (PhiIRice). Tissue-culture tecniques for genebanking purposes have been used for banana, abaca, sweet potato, yam taro, garlic and taro.
• Genome mapping. markers and marker-assisted selection. The Institute of Plant Breeding (lPB) has pioneered in the area of genome mapping, DNA and protein markers for biodiversity and identity, and markerassisted selection (MAS) for various crops such as mungbean, cowpea and moth bean, potato, banana, abaca, coconut and mango. Genetic analyses of pathogens such as bacterial wilt and insect pests such a the Asiatic com borer have also been done.
• Genetic engineering. Although still at an early stage, plant transformation using genetic engineering is now being done in the country.

Dar III
BIOTECH in collaboration with PhilRice is developing rice varieties with resistance to stem borer by using the proteinase inhibitor gene, and to greenleaf hopper and brown plant hopper using snowdrop lectin gene. PhilRice is also involved in transforming rice with the XA21 gene for resistance to bacterial sheath blight and tungro disease.
2. Biotechnology for Global Competitiveness
Under the program "Biotechnology: Pole-Vaulting Philippine Agriculture into the 21 SI Century", genetic engineering is being applied to improve productivity and quality toward enhancing global competitiveness of tive major crop commodities - coconut, com, banana, mango and papaya.
• Coconut. Through genetic engineering, the medium chain fatty acid content in coconut oil will be increased. These are the fatty acids which make coconut oil unique and high-valued in industrial applications.
• Corn. Transgenic com varieties resistant to Asiatic com borer are being developed by incorporating borer-resistance gene from Bacillus thuringiensis or Bt. This in effect is expected to reduce yield loss from 75% to 5% or a gain of about P6.14 billion. The solution is environmentally-friendly since less pesticides shall be used, and it is compatible with other integrated pest management systems. In this genetic engineering strategy, the gene from the Bt will be incorporated into the com plant which will then develop resistance against corn borer.
• Banana. The development of transgenic banana varieties resistance to banana bunchy top virus (BBTV) and mass propagation of virus-free plantlets appear to be the best solution to cope with the disease. From the use of BBTV-resistant plants, yield loss can be reduced from 90% to 10%. With the availability of resistant plants, pesticide use shall be lessened, as well as the risk of farmers from exposure to hamlful chem icals. In effect, this will stabilize banana production in the country. Tht' process shall involve incorporating a part of the virus into the banana plant in a vaccine-like manner. The resulting transgenic banana plant will then have resistance to BBTV.
• Mango and Papaya. Through the development of transgenic papaya and mango varieties, early ripening of these fruits can be delayed from one week to seven weeks. Through biotechnology, shelf life can be increased, thereby retaining the high quality of these fruits while in transit. This will allow mango and papaya growers in the Philippines to export more and capture other foreign markets. Through genetic engineering, the production and activity of the gene responsible for ripening of mango and papaya will be inhibited or lowered.
Developing transgenic papaya resistant to PRSV is seen to suppress papaya ringspot virus (PRSV) infection from 100% to 10%, minimizing the yield loss from 40% to 5%. This would mean a recovery of

112 Trans. Natl. Acad. Sci. Tech. Philippines 21 (1999)
about 34,200 tons valued at PI36 million. Ultimately, with the available virus resistant papaya, the papaya industry in the Philippines will be revived. Under the Biotechnology Program, local papaya shall be genetically engineered using local PRSV strains. The resulting transgenic papaya will then have resistance against PRSV.
3. Philippine Biotechnology Issues and Concerns
The power of biotechnology to help the Filipino farmer achieve his utmost productive capability is immense. The R&D community in the Philippines does not doubt biotechnology's merits. Yet, certain issues must be addressed to fully actualize its advantages.
• Biosafety. The Philippines is the first Asian country to adopt biosafety rules and regulations. The National Committee on Biosafety of the Philippines (NCBP) headed by the Department of Science and Technology (DOST) Undersecretary for Research has the responsibility to set biosafety rules in the country to approve or disapprove, and monitor the conduct of researches involving genetic manipulation by genetic engineering. Each institution conducting biotechnology researches should have its own institutional biosafety committee (IBC) to screen proposals and monitor researchers with regard to biosafety concerns. In May 1998, the NCBP approved the "Guidelines on Planned Release of Genetically Manipulated Organisms (GMOs) and Potentially Harmful Exotic Species (PHES)".
The biosafety regulations were set up to study the possible impacts of the proposed releases of GMOs on public health and safety, occupational safety, biodiversity, agricultural productivity, and the quality of the environment.
• Intellectual Property Rights. The local development of transgenic crops further emphasizes the need for a law on plant variety protection and for the protection of intellectual property rights, in general. It should be noted that gene constructs in transformation make use of several genes or DNA key elements which are patented. Local researchers and their respective agencies should be assisted by concerned entities in the DOST in the negotiation for the use of these patented genes/elements.
• Transgenic Crops in IPM and Farming Systems. One controversial issue regarding transgenic crops is whether they will require a package of high input technology such as chemical fertilizers and pesticides -or whether they fit into the existing farming systems of the country.
Transgenic crops will require integrated pest management (IPM) and should fit well in a farming system. For some transgenic crops like the Bt com, insecticide inputs will be reduced tremendously. However, the package of technology developed in other countries may not necessarily be appropriate in the Philippines. Thus, for local conditions,

Dar 113
this point should be well studied alongside the development and testing of transgenic crops in order to provide the farnler with the proper technology package.
• Acceptance of genetical~y engineered products by Filipino consumers. In the Philippines, there exists an ensuing debate between oppositionists groups led by nongovernment organizations (NGOs) and other parties such as the R&D community, on acceptability of genetically engineered food. In general, NGO networks in the country seem to have a negative attitude toward genetic engineering in agriculture as they advocate free choice for consumers and producers. In the case of transgenic rice, political decision makers also have reservations concerning the sustainability of 8t rice as against the practice of alternative pest management. Hcnce, there is an urgent need for education and promotion of the potential benefits of genetic engineering to the attainment of the goals of global competitiveness and food security.
C. Modernizing Philippine Agriculture Through the AFMA
The goal of the AFMA is to empower the agriculture and fisheries sectors of the country to develop and sustain themselves under the principles of poverty alleviation and social equity, food security, global competitiveness, sustainable development, people empowerment, and protection from unfair competition. Through the AFMA, the Department of Agriculture (DA) in collaboration with other agencies of the government shall transfonn the present agriculture and fisheries sectors into one that is dynamic, technologically advanced, and competitive, yet centered on human resource development guided by the sound principle of social justice. It shall spearhead the improvement of Philippine agriculture and fisheries to one that is able to compete in an increasingly interdependent world, and to stimulate rural income and employment opportunity toward eradicating poverty.
Under the AFMA, the new banner program for agricultural development has been dubbed as Agrikulturang MakaMASA to reflect its preferential option for the poorest, often neglected segments of the population - the farmers and fisherfolk, who will be empowered to enhance their productivity and competitiveness in the global market.
Three of the components of the program are on major agricultural crops -rice, com and high-value crops. Thesc programs shall provide the national directions and framework for an increased productivity in the crops subsector, and shall harness a favorable environment conducive to increased agricultural investments and global competitiveness. Detailed in the respective programs are strategies and policy imperatives, which include provisions of production support services, research and development, irrigation, other infrastructure (such as postharvest, machinery, farm-to-market roads), rural financing, marketing and support services, communication and advocacy, and training and extension.

114 Trans. Natl. Acad. Sci. Tech. Philippines 21 (1'199)
V. RECOMMENDATIONS
The crops subsector continues to dominate the Philippine agriculture landscape and hence, remains as the logical and potent springboard for achieving global competitiveness and food security in the country. Agricultural crops were valued at P276 bilJion in 1997, 57% of which was accounted for by rice, com, coconut and sugarcane, with the balance of P 118.2 million attributed to other crops led by banana, pineapple, mango. cassava. sweet potato, vegetables, coffee and other fruits.
Agricultural modemization is imperative to enable the country's major crop commodities to achieve strong competitiveness as the domestic market is openedup, deregulated and liberalized . The enactment of Republic Act 8535 or AFMA provides a legislative framework for modemizing agriculture ~ strengthening and redirecting the government bureaucracy toward market orientation coupled with improved production and extension services. With Agrikulturang MakaMASA as its banner program under the AFMA, the Estrada Administration hopes to meet its goals of enhancing the profitability. and prepare the agriculture sector for the chal· lenges of the twin goals of global competitiveness and food security through an adequate, focused and rational del ivery of necessary support services.
Following are some general reC<lmmcndations toward modemizing Philippine agriculture, in general. and realizing the full potential of major agricultural crops in the country, in particular:
• Productivity-enhancing techn%g)! through R&D. This involves the generation of productivity enhancing technologies and product diversilication/value added technologies through R&D. R&D expenditures must be increased to at least I % of GV A. Private sector investment in R&D should be encouraged.
• Tarifland trade policies. Appropriate tariff and trade policies are necessary to attain highest possible gains from trade amid the GA TT -WTO.
A balance het'J,'een domestic production and importation must be maintained, consistent with the objective of growth, equity and efficiency. For domestic production. budget support must be for activities with the highest social returns. including exploring le'-'S favorable areas for production and generation of agro-c finlatic zone specific technologies.
• Provision of infrastructure and olher support services. This includes pubric investment in tann-to-market roads, irrigation systems, flood control and drainage. post-harvest facilities sllch as mechanical dryers and storage facilities, and other support services.
• Credit. This involves the provision of immediate .sources of credit to address lack of working capital owing to problems such as timeliness in release and access to credit, and high interest rates and transaction

Dar 115
costs. Among the measures toward this end are: performance rebates on production loans to farmers; strengthening credit institutions; innovative credit schemes; and supervised credit schemes. Better cooperative management should be promoted to ensure financial viability and easy access to credit. In supervised credit, farm plans and other investments programs should be established.
The bankability of agricultural enterprises and credit-worthiness of small farmers through stronger cooperatives should also be enhanced.
• Assured source of quality seeds/planting materials and other production inputs. Seeds/planting materials are important to production and hence, must be obtained easily at reasonable prices. Efforts to improve/ reenginecr planting materials that are high-yielding and tolerant to drought and pests and diseases should be enhanced. Sustainable, production-enhancing inputs are likewise vital to production, and hence should be readily accessible/affordable.
• Cultivation of available land to be use and sustainability of resource base. Most recent land use studies should be reviewed and put to use for this purpose. Govemment resources, being limited, should be directed to crop areas fi1r optimum use. Sustainability of resource base should also be ensured.
• Calami{v mitigation. This includes the development of strategies to cope with typhoonltlooded environment/drought, reduction of crop losses through effective crop protection strategies, and reduction of production costs and post harvest losses. This also includes coping with global climate change though modeling studies to investigate and predict the effects and implications of adverse climatic changes to plant growth/yield.
• Extension, technolo&'Y promotion and training. This entails the development of a critical mass of researchers, extension worker's farmers, local govemment managers, and policy makers to support improved crop production toward food security and global competitiveness; enhancement of extension services through the LGUs and extension support services through various channels; strengthening of agricultural education and training activities for famler's education; enhancement of extension delivery system; and strengthening linkages among agencies and organizations concemed with agriculture.
A liberal trade environment under the GATT necessitates significant improvement in agricultural productivity, product quality and production cost. Improving productivity means incrt~asing the level of output produced from a given ievel of input. Productivity can also be expressed in mom~tary terms per unit of cost or area or pcr producer. I mprovement in yield, however, does not necessarily lead to reduction to make prit'es of ' agricultural products more competitive. Equally important is the need to improve product market products in a highly competitive environment.
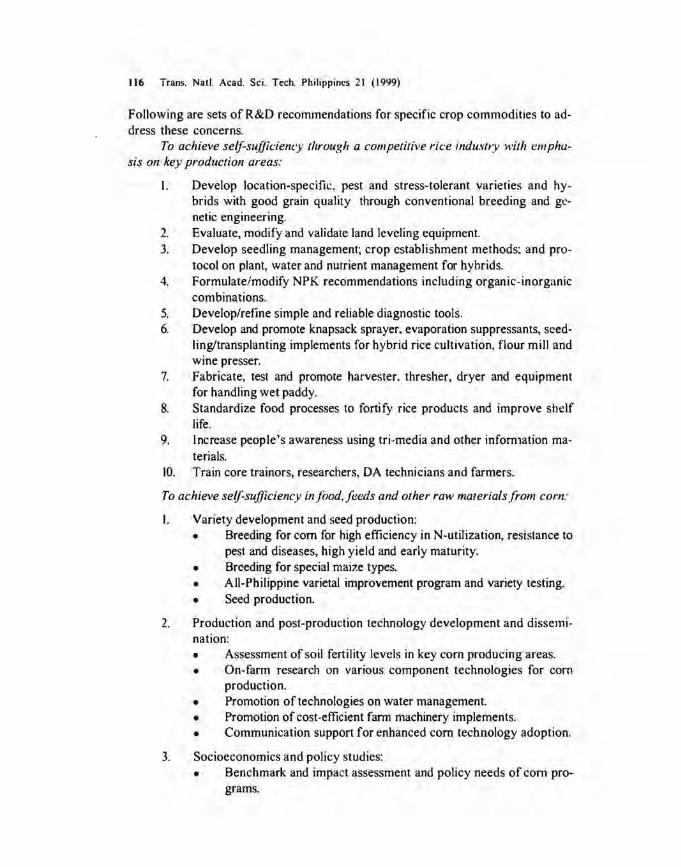
116 Trans. Natl. Acad. Sci. Tech. Philippines 2\ (\999)
Following are sets of R&D recommendations for specific crop commodities to address these concerns.
To achieve se/j:su.Dicienq through a competitive rice indu.\·tt:v with emphasis on key production areas:
I. Develop location-specific, pest and stress-tolerant varieties and hybrids with good grain quality through conventional breeding and genetic engineering.
2. Evaluate, modify and validate land leveling equipment. 3. Develop seedling management; crop establishment methods; and pro
tocol on plant, water and nutrient management for hybrids. 4. Formulate/modify NPK recommendations including organic-inorganic
combinations. 5. Develop/refine simple and reliable diagnostic tools. 6. Develop and promote knapsack sprayer. evaporation suppressants, seed
ling/transplanting implements for hybrid rice cultivation, flour mill and WIne presser.
7. Fabricate, test and promote harvester, thresher, dryer and equipment for handling wet paddy.
8. Standardize food processes to fortify rice products and improve shelf life.
9. Increase people's awareness using tri-media and other infornlation ma-terials.
10. Train core trainors, researchers, DA technicians and farmers.
To achieve se/j:sujjiciency injood.feeds and other raw materials/rom corn:
I. Variety development and seed production: • Breeding for com for high efficiency in N-utilization, resistance to
pest and diseases, high yield and early maturity. • Breeding for special maize types. • All-Philippine varietal improvement program and variety testing. • Seed production.
2. Production and post-production technology development and dissemination: • Assessment of soil fertility levels in key com producing areas. • On-farm research on various component technologies for com
production. • Promotion of technologies on water management. • Promotion of cost-efficient fam machinery implements. • Communication support for enhanced com technology adoption.
3. Socioeconomics and policy studies: • Benchmark and impact assessment and policy needs of com pro
grams.

Dar 117
• Assessment of com marketing schemes in key com producing areas and development of efficient market strategies.
• Evaluation of credit needs and capital formation and development of innovative financial assistance program for com enterprises.
To promote sustainable agro-industrial development of the coconut industry:
I. Support establishment of seedgardens. 2. Support coconut planting, replanting and rehabilitation. 3. Promote coconut-based farming systems. 4. Continue hybridization and genetic trial of promising cultivars
and hybrids through conventional techniques and application of DNA marker technologies.
5. Support to improve production package of technologies (POT) and post-harvest practices.
6. Develop and promote utilization of non-traditional coconut byproducts.
7. Enhance human resource capability, infrastruchlre and S&T services in research, information and technology transfer.
To meet the strategic sugar reserve requirements of the country as well as produce adequate amount to compete in the domestic and export markets:
I. Develop location-specific high-yielding varieties. 2. Establish micropropagation laboratories to produce tissue-cultures plant-
lets. 3. Improve dispersal system of high-yielding varieties. 4. Generate location-specific fertilizer recommendations. 5. Develop integrated pest management (lPM) strategies 6. Develop pest-resistant varieties. 7. Generate location-specific production technologies. 8. Package and massively disseminate site-specific technologies.
Amid the prevailing socioeconomic landscape that speaks of market forces, competition, and free flow of trade in agricultural products, ensuring a policy environment more supportive of agricultural development, in general, and of agricultural exports, in particular, is necessary. The following policy reforms are proposed:
• Provide of adeq uate puhlic investments to support the agriculture sec-tor.
• Encourage the flow of credit from institutional sources to rural areas. It Make the exchange rate reflect the true value of the peso. • Provide better access to more and lower-priced faml machinery, trans
port facilities, as well as greater variety of packaging materials.

118 T,ans. NatL Acad. Sci. Tech. Philippines 21 (1999)
• Reform transport policies and eliminate monopolies and other regulations creating inefficiencies in agricultural marketing.
The conditions necessary for this country to survive and win the global economic arena are increasingly being understood. In an era of trade liberalism within the framework of a border less economy, Filipinos must come to grips with cutting edge agricultural technologies and policy reforms to be globally competitive - and to attain our vision of a hunger-free nation.
For Appendix Tables of this paper, please contact NAST Secretariat, 2/F Philippine Science Heritage Center, DOST, Taguig, Metro Manila; [email protected] or [email protected].
\11. REFERENCES
BAS, 1999. Production statistics of major crop commodities from 1990-1998, Depart ment of Agriculture-Bureau of Agricultural Statistics (DA-BAS).
Clarete, R.L., Philippine Rice Indu~try and the GATT. School of Economics, Univer-sity of the Philippines, Diliman, Quezon City.
Claretc, R.L., __ . Trade-Related Problems and Policy Issues in Philippine Agriculture. School of Economics, University of the Philippines, Diliman, Quezon Cily.
CPDS-UPLB, 1997. Analysis of the Role of Policies in the State and Prospects of Biotechnology: Biosafety and Intellectual Property Rights (IPR) in the Philippines. Final Report submitted by the Center for Policy and Development Studies (CPDS) to PCARRD, Los Banos, Laguna.
DA, 1998. Agrikulturang MakaMASA Program Document, Department of Agriculture, Quezon City.
____ 1998. Agrikulturang MakaMASA for Corn Program Document, Department of Agriculture, Quezon City.
1998. Agrikulturang MakaMASA for High Value Commercial Crops Program Document, Department of Agriculture, Quezon City.
___ . Q&A About GATT: The GATT and Its Implications on Philippine Agriculture. Department of Agriculture, Quezon City.
Dar, W.D., 1995. Reshaping the National Agriculture and Natural Resources R&D System: A compendium of speeches. PCARRD, Los Banos, Laguna.
----::c-. 1996. New Challenges, New Strategies: A compendium of speeches. PC ARRD, Los Banos, Laguna.
Dy, R.T. (ed.), 1998. The Food and Agriculture Centennial Book. Center for Food and Agri Business, University of Asia and the Pacific, Manila, Philippines.
Escano, C.R., Clavcro, C.S., Tiamzon, F.D. and Tababa, S.P., 1999. Legumes in Tropical RiceBased Cropping Systems: Constraints and Opportunities - a Philippine Case StUdy. Paper presented during the Workshop on Legumes in Tropical Rice-Based Cropping Systems: Constraints and Opportunities, ICRISA T, India, 18-20.
Librero, A.R., 1996. Making a Second Green Revolution Possible Through Technologies and Policy Reforms. Paper presented to the PCARRD Media Conference, PCARRD, Los Banos, Laguna.
Librero, A.R. and Tidon, A.G. (eds.), 1996. Marketing of Agricultural Commodities b Producer Groups in the Philippines. PCARDD, Los Banos, Laguna. Book Series No. 158.

Da,. 119
Mendoza, E.M.T. Biotechnology in Agriculture, Forestry and Environment: Status and Concerns in the Philippines. Plant Biotechnology Program, Institute of Plant Breeding, UPLB, Los Banos, Laguna.
PCARRD. . Commodity Industry Situationers for Rice, Corn, COi:onut, Sugarcane, Banana, Mango, Onion, Cassava, Sweet potu to, and Abaca. PCARRD, Los Banos. Laguna.
PCARRD, 1997. National Biotechnology Research and Development for Agriculture, Forestry and Environment Program Document. PCARRD, Los Banos, Laguna.
PCARRD-PAG, 1999. Food Security in the Philippines; Current Situation and Some Recommendations. Paper prepared by the PCARRD Policy Action Group for the Presidential Adviser on Food Security, PCARRD, Los Banos, Laguna.
lJPLB, 1996. Modernizing the Coconut Industry: Prospects, Problems and Plan for Action. Report submitted to the Congressional Commission on Agricultural Modernization by the UPLB Coconut Research and Development Committee. UPLB. Los Bal10s, Laguna.