critical urban infrastructure handbook
DESCRIPTION
Critical Urban Infrastructure HandbookTRANSCRIPT

w w w . c r c p r e s s . c o m
K20543
CIVIL ENGINEERING
6000 Broken Sound Parkway, NW Suite 300, Boca Raton, FL 33487711 Third Avenue New York, NY 100172 Park Square, Milton Park Abingdon, Oxon OX14 4RN, UK
an informa business
w w w . c r c p r e s s . c o m
Critical Urban Infrastructure
Handbook
Critical Urban Infrastructure
Handbook
Critical Urban Infrastructure Handbook
Critic
al U
rba
n In
frastru
ctu
reH
an
db
oo
k
JSCE•
Hamada“This handbook provides a comprehensive overview of the design, construction, and management of critical infrastructures that underpin economic and socioeconomic activities in urban cities. All major infrastructures are covered: water supply, sewerage, gas, electricity, and telecommunication. The contributors of the handbook have profound knowledge and experience in individual fields and discuss the key essentials of infrastructure engineering and risk management in a concise manner. A unique aspect of this handbook is the disaster prevention and mitigation section, which is based on a long history of learned lessons dealing with the past disasters in Japan. This is a handy technical and professional book.”
—Katsu Goda, University of Bristol, UK
“This is an excellent handbook written by experts in the fields of water pipeline systems, sewerage systems, natural gas distribution systems, electric power systems, and telecommunication systems. The collaborative work by the contributors has produced a reference material that can be of practical use to engineers, practitioners, and stakeholders involved in the construction, maintenance, disaster prevention, and mitigation of urban lifeline systems. ... Senior undergraduate and graduate students will also benefit from this excellent reference material.”
—Lessandro Estelito O. Garciano, De La Salle University, Manila, Philippines
Represents the State of the Art in Urban Lifeline Engineering Urban lifelines are buried or aboveground network systems used for water, sewerage, gas, power, and telecommunications. Dedicated to preserving the functions of lifeline systems against natural disasters, the Critical Urban Infrastructure Handbook is a vital compilation of urban utility management. This text utilizes the input of leading experts with extensive experience in natural disasters and provides a better understanding of the technical and legal framework of infrastructure construction and operation.
Examine the Damage Data of Urban Lifelines Suffered by Seismic Disasters The book addresses water supply and sewerage, power, gas, telecommunications joint utility corridor lifeline facilities, and other critical civil infrastructure lifelines. It emphasizes the importance of the resilience of lifeline systems against natural disasters in protecting human lives and supporting survivors of disasters as well as in promptly recovering and reconstructing the affected areas. It describes the structural damage of nodes and links as well as the functional damage of the lifeline system from the viewpoint of disaster prevention and mitigation measures.
The Critical Urban Infrastructure Handbook comprehensively describes common issues of lifeline systems and provides practical information to engineers and industry professionals involved in the planning, construction, and maintenance of lifeline systems.
Japan Society of Civil EngineersCritical Urban Infrastructure Committee
M. Hamada, Editor-in-Chief
www.ebook3000.com


Editorial Board
Japan Society of Civil Engineers, Critical Urban Infrastructure Committee
M. Hamada, Editor-in-ChiefT. KoikeT. Suzuki
C. ScawthornN. Suzuki
K. OhtomoY. Shumuta
J. KosekiR. Kuwano
H. HorikawaF. SuginoK. Sakaki
www.ebook3000.com

Boca Raton London New York
CRC Press is an imprint of theTaylor & Francis Group, an informa business
Critical Urban Infrastructure
HandbookEdited by
Japan Society of Civil EngineersM. Hamada, Editor-in-Chief
Editors
T. Koike, T. Suzuki, C. Scawthorn
N. Suzuki, K. Ohtomo, Y. Shumuta
J. Koseki, R. Kuwano, H. Horikawa
F. Sugino, K. Sakaki
www.ebook3000.com

CRC PressTaylor & Francis Group6000 Broken Sound Parkway NW, Suite 300Boca Raton, FL 33487-2742
© 2015 by Taylor & Francis Group, LLCCRC Press is an imprint of Taylor & Francis Group, an Informa business
No claim to original U.S. Government worksVersion Date: 20141110
International Standard Book Number-13: 978-1-4665-9205-6 (eBook - PDF)
This book contains information obtained from authentic and highly regarded sources. Reasonable efforts have been made to publish reliable data and information, but the author and publisher cannot assume responsibility for the valid-ity of all materials or the consequences of their use. The authors and publishers have attempted to trace the copyright holders of all material reproduced in this publication and apologize to copyright holders if permission to publish in this form has not been obtained. If any copyright material has not been acknowledged please write and let us know so we may rectify in any future reprint.
Except as permitted under U.S. Copyright Law, no part of this book may be reprinted, reproduced, transmitted, or uti-lized in any form by any electronic, mechanical, or other means, now known or hereafter invented, including photocopy-ing, microfilming, and recording, or in any information storage or retrieval system, without written permission from the publishers.
For permission to photocopy or use material electronically from this work, please access www.copyright.com (http://www.copyright.com/) or contact the Copyright Clearance Center, Inc. (CCC), 222 Rosewood Drive, Danvers, MA 01923, 978-750-8400. CCC is a not-for-profit organization that provides licenses and registration for a variety of users. For organizations that have been granted a photocopy license by the CCC, a separate system of payment has been arranged.
Trademark Notice: Product or corporate names may be trademarks or registered trademarks, and are used only for identification and explanation without intent to infringe.
Visit the Taylor & Francis Web site athttp://www.taylorandfrancis.com
and the CRC Press Web site athttp://www.crcpress.com
www.ebook3000.com

v
Contents
Preface......................................................................................................................vii
Editors ....................................................................................................................... ix
Contributors ............................................................................................................. xi
Section i General Remarks of Lifeline Services
1 General .............................................................................................................. 3Masanori Hamada
2 Water Supply System: Planning Aspects ........................................................ 11Takeshi Koike
3 Sewerage System: Planning Aspects ............................................................... 27Masanori Hamada
4 Natural Gas Distribution System: Planning Aspects ..................................... 45Nobuhisa Suzuki and Hiroyuki Horikawa
5 Electric Power System: Network and Components ........................................ 61Keizo Ohtomo and Yoshiharu Shumuta
6 Telecommunication System: Network and Components ............................... 67Takanobu Suzuki, Fumihide Sugino, and Katsumi Sakaki
Section ii construction technology of Lifeline Pipelines and its Facilities
7 General ............................................................................................................ 87Nobuhisa Suzuki and Hiroyuki Horikawa
8 Water Supply System: Design Aspects ............................................................ 95Takeshi Koike
9 Sewerage System: Design Aspects ................................................................. 153Masanori Hamada
www.ebook3000.com

vi Contents
10 Natural Gas Distribution System: Design Aspects ...................................... 171Nobuhisa Suzuki and Hiroyuki Horikawa
11 Electric Power System: Design Aspects ........................................................ 201Keizo Ohtomo and Yoshiharu Shumuta
12 Telecommunication System: Design Aspects ................................................211Takanobu Suzuki, Fumihide Sugino, and Katsumi Sakaki
Section iii Maintenance technologies of Lifelines
13 General .......................................................................................................... 261Takanobu Suzuki
14 Water Supply System: Maintenance Technologies ....................................... 275Takeshi Koike
15 Sewerage System: Maintenance Technologies .............................................. 325Masanori Hamada
16 Natural Gas Distribution System: Maintenance Technologies .................... 335Nobuhisa Suzuki and Hiroyuki Horikawa
17 Electric Power System: Maintenance Technologies ..................................... 343Keizo Ohtomo and Yoshiharu Shumuta
18 Telecommunication System: Maintenance Technologies ............................. 347Takanobu Suzuki, Fumihide Sugino, and Katsumi Sakaki
Section iV Disaster Prevention and Mitigation technologies of Lifelines
19 General .......................................................................................................... 383Takeshi Koike
20 Water Supply System: Mitigation Technologies ........................................... 401Takeshi Koike
21 Sewerage System: Mitigation Technologies .................................................. 439Junichi Koseki and Reiko Kuwano
22 Natural Gas Distribution System: Mitigation Technologies ........................ 485Nobuhisa Suzuki and Hiroyuki Horikawa
23 Electric Power System: Mitigation Measures ............................................... 497Keizo Ohtomo and Yoshiharu Shumuta
24 Telecommunication System: Mitigation Measures ...................................... 519Takanobu Suzuki, Fumihide Sugino, and Katsumi Sakaki
www.ebook3000.com
vii
Preface
The Japan Society of Civil Engineers has been promoting the development of technologies and the accu-mulation of knowledge for design and construction, management and maintenance, disaster preven-tion, and environmental measures for lifeline systems. In addition, lifeline operators and enterprises have also made every effort to advance the services and reliability of their systems. Based on these contributions, this handbook summarizes the state of the art of lifeline engineering and directions for future research.
Even as this handbook was being written the March 11, 2011, magnitude 9.0 Tohoku earthquake (Great East Japan Earthquake and Tsunami Disaster) struck the northeast region of Japan. It was the largest earthquake in Japanese history. As a result of the destructive effects, including a tsunami, ground motion, soil liquefaction, and slope failure, the toll of dead and missing was 18,641 as of October 31, 2012. Thus, it was the severest disaster over the last half century in Japan. Numerous facilities of lifeline systems such as sewerage, water, electricity, and telecommunication were severely damaged, and the urban functioning of the affected areas was paralyzed for a long time. The Tohoku earthquake reminded us of the importance of the resilience of lifeline systems against natural disasters in protecting human lives and supporting the lives of survivors of disasters as well as promptly recovering and reconstructing the affected areas.
Technology development and knowledge accumulation have generally been carried out indepen-dently for each lifeline system, with technical guidelines and standards for the design and construction defined separately. However, many common issues exist among the lifeline systems, particularly related to design and construction, maintenance and management, disaster reduction, and environment pres-ervation. Furthermore, loss of function of a lifeline system strongly affects the function of other lifeline systems, and the overcrowding of recovery works among lifeline systems after natural disasters delays restoration and reconstruction of the damaged areas. One of the purposes of this handbook is to com-prehensively describe common issues among various kinds of lifeline systems that will be of practical use to engineers and concerned parties.
The frequency of natural disasters such as earthquakes, storms, floods, and landslides has been increasing globally in recent years. The reasons for this are believed to be changes in the natural envi-ronment on a global scale and society’s increasing vulnerability against natural hazards. The natural environment is changing rapidly, including global warming, heat island effects in urbanized areas, loss of forests and arable land, desertification, and erosion of riverbanks and seacoasts. Vulnerability to natural disasters is also increasing as a result of changes in social structures and land use, such as excessive population concentrations in urban regions, increased settlement in disaster-prone land, and depopulation of rural areas.
www.ebook3000.com

viii Preface
Under these conditions, preserving the functions of lifeline systems against increasing natural disas-ters is essential to create a safer, more secure society as well as to protect human lives. This requires proper maintenance of facilities and enhancement of the disaster-resistance capabilities of lifeline systems.
We hope this handbook will prove useful to engineers, operators, and other parties concerned with planning, constructing, and maintaining lifeline systems. Finally, we express our sincere gratitude to the authors and the members of the editing committee.
Organizing members
Masanori HamadaTakeshi Koike
Takanobu SuzukiCharles Scawthorn
www.ebook3000.com

ix
Editors
Masanori Hamada retired as professor in the Civil and Environmental Engineering Department, Waseda University, Tokyo, Japan. He worked for Taisei Corporation (1968–1983) and for Tokai University (1983–1994) before joining Waseda University. He has been chairman of the Asian Disaster Reduction Center, Kobe since 2014 and is contributing to the development of natural disaster reduction in this area. He has carried out researches on earthquake-resistant designs of lifeline systems against soil liquefaction and its induced large ground displacements. He recently published a technical book Engineering for Earthquake Disaster Prevention with Springer.
Takeshi Koike retired as professor in the Department of Civil Engineering of Kyoto University, Kyoto, Japan. He worked at Kawasaki Steel Corporation (presently JFE Engineering Corporation) for 25 years and then moved to Tokyo City University, where he remained for seven years before joining Kyoto University in 2010. He has studied structural and earthquake engineering concerning urban lifeline facilities and was involved in reliability-based seismic safety analyses of deteriorating infrastructure. He established a comprehensive seismic design method of several buried pipeline networks by tak-ing a slippage effect into consideration for severe large ground motions. He also developed a seismic risk analysis methodology to evaluate the functional damages of large-scale lifeline network systems in order to formulate disaster-prevention strategies. He is a member of JSCE and ASCE.
Takanobu Suzuki is a professor in the Civil and Environmental Department, Science and Engineering Faculty of Toyo University, Tokyo, Japan. He worked at Nippon Telegraph and Telephone Co. (NTT) for 9 years before joining Toyo University in 1993. He studied structural and earthquake engineering concerning urban lifeline facilities. He won the Technical Development Award of JSCE in 2004. He is a member of the Earthquake Engineering Committee of JSCE.
Charles Scawthorn retired as professor in the Department of Urban Management at Kyoto University, Kyoto, Japan and is currently president of SPA Risk LLC. With more than 30 years of experience, he is a recognized authority in the analysis and mitigation of natural and technological hazards risk and is well known for developing analyses of potential losses due to fire following earthquake, which has been applied since the 1980s by the insurance industry and investigators worldwide. He has developed innovative approaches for optimizing urban land use with respect to natural hazards risk, general loss estimation models for earthquake, wind, and flood, and seismically reinforcing low-strength masonry buildings. He has also played a leading role in the development of natural hazards loss estimation soft-ware, for example, leading the team developing the U.S. Flood Loss Estimation Model for HAZUS. He is a life member of ASCE and Fellow or Member of JSCE, SEAONC, EERI, and other organizations.


xi
Contributors
Hiroyuki Horikawa is a deputy manager of the pipeline design department at JFE Engineering Corporation in Japan. He joined NKK Corporation (presently JFE Engineering Corporation) in 1998. His background is seismic design of high-pressure natural gas pipelines to withstand ductility level earthquakes or strong ground shaking and liquefaction-induced permanent ground deformation. He has also been involved in seismic diagnosis and maintenance of high-pressure gas pipelines. He is a member of JSCE.
Junichi Koseki is a professor in the Civil Engineering Department, University of Tokyo, Tokyo, Japan. Before joining the university, he worked at the Public Works Research Institute (PWRI), Ministry of Construction, for seven years. His research topics include laboratory soil testing, strength and deforma-tion properties of geomaterials, liquefaction and its countermeasures, and seismic performance of earth structures and underground structures. He is a member of JSCE, the Japanese Geotechnical Society (JGS), and the International Geosynthetics Society (IGS).
Reiko Kuwano is a professor at the Institute of Industrial Science, University of Tokyo, Tokyo, Japan. In addition to her academic career in the Department of Civil Engineering, University of Tokyo, and at her current position, she worked at Taisei Corporation for six years and the Public Works Research Institute for four years. Her research topics include mechanical properties of geomaterials, maintenance and sustainability of ground and earth structures, and microbially induced cementation in soil.
Keizo Ohtomo is an associate vice president at the Central Research Institute of Electric Power Industry (CRIEPI), Chiba, Japan. He joined CRIEPI in 1983. His research area is earthquake engineering with a focus on soil–structure interaction during strong ground motions. This also covers electric power civil engineering structures like culverts and buried pipes. He won the Yoshida Award of JSCE in 2004 and the Concrete Institute Award in 2005. He is also a JSCE fellow; a member of EERI, JAEE, and JCI; a registered consulting engineer; and a concrete maintenance engineer.
Katsumi Sakaki is a senior research engineer for the Civil Engineering Project of NTT Access Network Service Systems Laboratories, Tsukuba, Japan. He has studied underground pipeline systems that contain telecommunication cables. He is a member of the Construction Robot Committee of JSCE.
Yoshiharu Shumuta is a senior researcher at the Central Research Institute of Electric Power Industry (CRIEPI), Chiba, Japan. He joined CRIEPI in 1991. His research area is reliability engineering and risk management with a focus on emergency response issues against natural disaster and maintenance history data analysis for electric power lifeline systems. This covers electric power civil engineering structures and transmission and distribution equipment. He won the OHM Technology Award of the Promotion Foundation for Electric Science and Engineering in 2010, an IEEJ Award in 2011, and the Sibusawa Award of JEA in 2012. He is a member of JSCE and IEEJ.

xii Contributors
Fumihide Sugino is an executive research engineer for the civil engineering project of NTT Access Network Service Systems Laboratories, Tsukuba, Japan. After he joined NTT in 1987, he studied auto-controlled equipment mole (ACEMOLE) construction technology, which is a construction method that does not involve road excavation. He has worked at NTT Access Network Service Systems Laboratories and NTT EAST, where his main focus was on telecommunication infrastructure including cable tunnels and underground pipeline systems.
Nobuhisa Suzuki is a president of PIN Technologies, a consulting company specializing in evaluat-ing the integrity of gas distribution networks in seismic areas and high-pressure gas pipelines in harsh environments. He worked at NKK Corporation, JFE R&D Corporation, and JFE Steel Corporation for 35 years, engaging in research and development in terms of seismic design of pipelines, seismic diagno-sis of lifeline network systems, and high-strength and high-strain line pipes. He is a member of JSCE, JWS, and ASME. He won the Iwatani Naoji Memorial Award in 2008, the Minister Award of MEXT in 2009, and the R&D 100 Award in 2013.

1
IGeneral Remarks of Lifeline Services
1 General Masanori Hamada ...................................................................................................... 3Introduction of Urban Lifeline Systems • Reliability and Safety of Urban Lifeline Systems • Measures for Lifeline Facilities against Future Tsunamis • References
2 Water Supply System: Planning Aspects Takeshi Koike .................................................. 11General Remarks on Water Systems • Planning of a Waterwork Project • References
3 Sewerage System: Planning Aspects Masanori Hamada ................................................. 27Sewerage System • Planning of Sewerage • References
4 Natural Gas Distribution System: Planning Aspects Nobuhisa Suzuki and Hiroyuki Horikawa ...................................................................................................................... 45Outline of Natural Gas Distribution Systems • Planning and Management of Distribution Systems • References
5 Electric Power System: Network and Components Keizo Ohtomo and Yoshiharu Shumuta ...................................................................................................................... 61Design and Construction of an Electric Power System • Components of Electric Power Transmission and Distribution System • References
6 Telecommunication System: Network and Components Takanobu Suzuki, Fumihide Sugino, and Katsumi Sakaki ..................................................................................... 67Overview of Information and Communication Systems • Plans and Future Image of Information and Communication Networks • References


3
1.1 introduction of Urban Lifeline Systems
1.1.1 classification of Urban Lifeline Systems
Lifeline was originally a maritime word meaning life-saving rope or life preserver. In the context of protect-ing human life by providing the necessary infrastructure in populated cities, the term is used to signify any system that maintains function in such cities. In a conference on earthquake engineering in the United States in 1975, Lifeline Earthquake Engineering was proposed [1]. With this motivation, water, sew-age, electric power, gas, telecommunication, and other public utilities came to be called lifeline systems.
Lifeline systems are generally classified based on the services they supply:
1. Water supply and purification systems—water, sewage, and river facilities (intake and discharge of water)
2. Energy systems—electric power, gas and liquid fuels, and local cooling/warming 3. Information and communication systems—telephone, information, and broadcast facilities 4. Transportation systems—roads, railroads, ports, and airports
Among these lifeline services that strongly affect urban life, water supply systems, sewage systems, urban gas systems, electric power systems, and telecommunications are the services this handbook deals with, by introducing current technologies and knowledge regarding the design, construction, and maintenance of these lifeline systems for engineers and researchers, and those working in the field of natural disaster reduction.
1.1.2 components and networks of Lifeline Systems
Urban lifeline systems provide services to citizens through their key station and network facili-ties. As shown in Table 1.1, urban lifeline systems consist of upstream and downstream facilities.
1General
1.1 Introduction of Urban Lifeline Systems ............................................3Classification of Urban Lifeline Systems • Components and Networks of Lifeline Systems • Interactions among Urban Lifeline Systems
1.2 Reliability and Safety of Urban Lifeline Systems .............................4Natural Disasters Affecting Safety of Lifeline Systems • Damage to Lifeline Systems by the 1995 Kobe Earthquake • Damage to Lifeline Systems during the 2004 Niigata–Chuetsu Earthquake • Measures for Damage Reduction against Future Earthquakes
1.3 Measures for Lifeline Facilities against Future Tsunamis ..............8Countermeasures for Sewage Facilities • Countermeasures for Nuclear Power Plant
References ........................................................................................................10Masanori HamadaWaseda University

4 General Remarks of Lifeline Services
Therefore, an interruption of the upstream facilities will strongly affect the function of the down-stream facilities, resulting in serious loss of urban function. Therefore, efficient and safe performance of upstream facilities is required.
Lifeline systems consist of various kinds of facilities and structures including their foundation and earthworks, the technology and knowledge for the design, and the construction and mainte-nance, which cover multidisciplinary fields. It is required to effectively and economically design, construct, and maintain these facilities. Furthermore, mitigation of the damage caused by future natural disasters such as earthquakes and floods is essential for quick recovery of their functions. Therefore, concerned experts and engineers should have a wide knowledge and efficient technology in various fields.
1.1.3 interactions among Urban Lifeline Systems
Lifeline systems have mutual interactions with each other. For example, stoppage of electric supply will disrupt the functioning of water purification and wastewater treatment plants. On the other hand, mal-function of the water supply and sewer seriously affect the lives of the personnel in power generation plants. Furthermore, failure of electric supply will hinder the transmission of information regarding the damage caused by the disaster, thus affecting restoration and reconstruction work of the lifeline systems.
During past earthquakes, such as the 1995 Kobe earthquake, water and soil flew into the buried pipes of gas, electricity, and telecommunication due to the breakage of water pipes, and the restoration work was hampered for a long time. Furthermore, the restoration of water supply before the repair of the sewerage system may cause a problem in public sanitary works. It was surmised that after the Kobe earthquake, the early restoration of electric supply to households caused subsequent fire, resulting in extended damage and delay in the recovery of the affected areas.
As mentioned earlier, lifeline systems are closely linked with each other during disasters as well as normal times; therefore, communication and exchange of information are essential for the function-ing of safer lifeline systems. Hence, a comprehensive and common data base of lifeline systems is being planned.
1.2 Reliability and Safety of Urban Lifeline Systems
1.2.1 natural Disasters Affecting Safety of Lifeline Systems
Natural disasters, such as earthquakes, volcano eruptions, floods, thunder, heavy rains, and snow, affect the reliability and safety of lifeline systems. In particular, past earthquakes have caused severe damage to key stations and buried pipes. The 1995 Kobe earthquake caused extensive liquefaction and large ground displacements in the artificial islands reclaimed from the sea, resulting in serious
TABLE 1.1 Composition of Urban Lifeline Systems
Lifeline System Composition of Each System
Water Reservoir (dam), intake → transmission facilities (pipes, tunnels) → purification facilities → distribution facilities (basin, tank, pump, pipe) → consumer
Sewage Consumer → wastewater pipe or rainwater pipe → trunk line → wastewater treatment plan → pumping station
City gas Loading facility of oil and gas → gas production facility → storage facility (tank) → high-pressure gas pipe → decompression station → medium-pressure gas pipe
Electricity Power plant → transmission facility (tower) → converter station (transformer) → distribution station → distribution line (buried and suspended) → consumer

5General
damage to buried pipes of lifelines and facilities of wastewater treatment plants. During the 2004 Niigata–Chuetsu earthquake, soil liquefaction more than 1500 sewer manholes “floated” due to the buoyancy of the liquefied soil.
Besides earthquakes, floods and extremely heavy rains threaten the safety of lifelines. Flood and storm disasters have been increasing, which are surmised to be caused by the global climate change.
1.2.2 Damage to Lifeline Systems by the 1995 Kobe earthquake
The Mw 6.9 (MJMA = 7.2) Hyogo-ken Nambu (Kobe) earthquake with epicenter near the Akashi Strait in Hyogo Prefecture occurred on January 17, 1995. The epicenter was at 34.58N 135.01E with a hypo-central depth of about 16 km. It was the first recorded occurrence of intensity 7 (the highest) on the Japan Meteorological Agency Seismic Intensity (JMAI; X or greater on the Modified Mercalli Intensity, MMI).
Around reclaimed seaside areas, soil liquefaction and large ground displacement resulted in heav-ily damaged lifeline facilities and structures. Key stations such as water purification plants, wastewa-ter treatment plants, electrical substations, and buried pipelines were seriously damaged.
Table 1.2 shows the damage to lifeline systems and the time needed for function recovery. The num-ber of households which experienced outages of water, city gas, and electricity reached about 1,300,000, 860,000, and 260,000, respectively. More than 280,000 phone lines were affected. Therefore, it took a long time to restore the function, with waterworks requiring 70 days, the sewage system about 5 months, electricity 6 days, phone lines 14 days, and city gas 54 days. The malfunction of transportation systems and damage to lifelines caused urban function paralysis for a long period.
1.2.3 Damage to Lifeline Systems during the 2004 niigata–chuetsu earthquake
On October 23, 2004, the Niigata–Chuetsu earthquake of Mw = 6.8 occurred in central Niigata Prefecture. The epicenter was at 37.17°N and 138.8°E, with a hypocentral depth of about 13 km.
Over 1400 manholes were floated by soil liquefaction in Ojiya, Nagaoka, and other areas. Figure 1.1 shows the relationship between the rate of lifted sewage manholes (the ratio of the number of lifted man-holes to the total number) and the micro-topographic conditions in Ojiya. The rate of floated manholes was higher on the alluvial fan than in the delta and old river streams. Generally, delta and old streams are considered to be more liquefiable than the alluvial fans, where gravel can release pore water pressure. The reason why many manholes were floating in the alluvial fan was due to the sandy backfilling soil, which liquefied as shown in Figure 1.2.
TABLE 1.2 Damage to Lifeline Systems by the 1995 Kobe Earthquake and Function Recovery Time
Functional Disorder Function Recovery Time (days)
Water 1,265,000 households cut off 70 (Kobe, Nishinomiya)64 (Ashiya)
Sewage 198 km of damaged pipe Buried pipes: 140Pumping stations: 24Sewage treatment plants: 5 months
Electricity 2,600,000 households with blackout 6Phone line 285,000 malfunctional lines 14City gas 857,000 households cut off 54

6 General Remarks of Lifeline Services
Mountainousarea
20
15
10
5
0Plateau Alluvial fan Delta
old streamMicrotopography
Rate
of f
loat
(%)
FIGURE 1.1 Relationship between rate of floated sewage manholes and micro-topographical condition (2004 Niigata–Chuetsu earthquake).
Buoyancy of liquefied soil
Sand backfilling
Groundwater
Silty and clayeyground
Ground surface
FIGURE 1.2 Floating of manholes by liquefaction of backfill soil.
www.ebook3000.com

7General
Since this earthquake, to prevent floating of manholes by soil liquefaction, several measures have been developed and implemented. These include weighting of manholes by cast-metal blocks and hard-ening of backfill soil by cement milk mixing.
Figure 1.3 reveals that the rate of sewerage pipe damage (the ratio of damaged length to total length) was greater in mountainous regions and the delta and old streams than in the alluvial fan and plateau. Damage to sewerage pipes in the mountainous areas was caused by landslides and slope failures of road embankments. The reason for the high damage rate in the delta and old streams was soil liquefaction.
1.2.4 Measures for Damage Reduction against Future earthquakes
The Central Disaster Management Council (CDMC), Cabinet Office of Japanese Government, and Headquarters for Earthquake Research Promotion of the Ministry of Education, Culture, Sport, and Science have predicted a magnitude 7.3 earthquake for northern Tokyo Bay. As of 2004, the probability of an earthquake with a magnitude of 7 within the next 30 years in the greater Tokyo area, including the northern Tokyo Bay, is estimated to be 70% [2,3].
CDMC also predicted the damage that would be caused by the northern Tokyo Bay earthquake. The estimates are that if such an earthquake occurred at 6 p.m., about 850,000 homes would be destroyed by ground motion, fire, and slope sliding. This is approximately seven times the number destroyed in the Kobe earthquake of 1995, which was 117,000. The prediction of 11,000 fatalities is approximately double the 5,520 directly caused by the Kobe event. The total estimated economic losses are ¥112 trillion, includ-ing ¥67 trillion in direct losses from the destruction of public and private property and ¥45 trillion in indirect losses from economic stagnation following the earthquake.
Table 1.3 shows the anticipated disruption of lifeline utility services following the northern Tokyo Bay earthquake, based on reports from utility companies. Restoration of electricity, telecommunications, and gas is forecast to take about the same number of days as the Kobe earthquake, but the predicted recovery time for water and sewer services would be much shorter. If lifeline utilities were damaged to a much greater extent than in the Kobe earthquake, it may take a much longer time for restoration. It will
Mountainousarea
25
20
15
10
5
0Plateau Alluvial fan
Microtopography
Dam
age r
ate
(dam
aged
leng
th/to
tal l
engt
h)
Deltaold stream
FIGURE 1.3 Relationship between damage rate of buried sewage pipes and micro-topographical condition (2004 Niigata–Chuetsu earthquake).

8 General Remarks of Lifeline Services
be necessary to inspect and reassess the vulnerabilities of these systems and facilities and take necessary measures, such as seismic retrofitting.
1.3 Measures for Lifeline Facilities against Future tsunamis
1.3.1 countermeasures for Sewage Facilities
In the 2011 Tohoku earthquake, wastewater treatment plants and pumping stations of sewage systems were subjected to severe damage across a wide region of Japan, from Tohoku to Kanto [4]. Among these plants within a distance of 100 m from the coast, 90% lost all function. Furthermore, with the tsunami inundation height greater than 3.0 m, all wastewater treatment functions ceased. To deal with such damage to sewage systems against tsunamis, the Technical Committee for Earthquake and Tsunami Restraint Sewage Systems proposed a basic concept for the design and countermeasure of sewage facilities against tsunamis. In this proposal, prevention of wastewater backflow, pumping, and disinfection was designated as mandatory. Functions of sedimentation and sludge treatment should be rapidly recovered, although temporary interruptions may be allowed. Facilities having mandatory functions should be located above inundation water levels, or be protected by walls higher than those levels (Figure 1.4). For facilities whose functions should be rapidly recovered, water protection struc-tures are required.
When sewage facilities are severely damaged by earthquake ground motion or a tsunami, the impact on the public is severe. There is the possibility of a secondary disaster, such as the spread of disease. All treatment plants and pumping stations are built on sites near the coasts. Therefore, both hardware and software measures should be implemented. The latter include the security of emergency electric power sources and evacuation system for the staff.
1.3.2 countermeasures for nuclear Power Plant
The safety of nuclear power plants against tsunamis [5] seeks to achieve the following objectives:
1. No seawater flows into the site, even at high tide. That is, the height of the site is higher than that of full tide plus the assumed tsunami height.
2. As the sea surface drops during the receding water stage of a tsunami, water intake should be assured. However, if water intake becomes impossible, cooling water should be assured by other means (e.g., on-site storage in ponds or tanks).
3. Seabed scouring or soil accretion around intakes due to a tsunami should be prevented.
The accident at the Fukushima Daiichi Nuclear Power Plant No. 1 was caused by the first requirement not being satisfied. Although it is critical to determine the anticipated height of tsunamis at nuclear power plant sites worldwide, it is also important to maintain the functioning of cooling system. For this,
TABLE 1.3 Damage Prediction of Lifeline Systems by the Northern Tokyo Bay Earthquake and Recovery Days
Number of Affected Households: Northern Tokyo Bay Earthquake (Recovery Days)
Number of Affected Households: Kobe Earthquake (Recovery Days)
Water 39,000,000 (30) 1,265,000 (70)Sewage 150,000 (40) — (140)Electricity 1,600,000 (6) 2,600,000 (6)Telephone (number
of damaged lines)1,100,000 (14) 285,000 (14)
Gas 1,800,000 (55) 857,000 (54)

9General
emergency power functions should be assured. Countermeasures, such as a stock of spare power genera-tors at high elevations or in watertight chambers, should be taken for post-disaster operation.
At Hamaoka Nuclear Plant in Shizuoka Prefecture, a tsunami barrier wall with a height of 18 m above sea level and a length of 1.6 km was constructed along the coast (Figure 1.5). This was meant for protec-tion against a tsunami caused by an earthquake that has been predicted along the Nankai Sea trough. Figure 1.6 shows the tsunami barrier wall, which uses continuous steel pipes and steel box frames. The construction of such a wall is currently being planned for another nuclear plant. However, the problem of wall design is determining the tsunami’s height. Geologic and seismic surveys by CDMC indicate that tsunamis several tens of meters high may impact the sea coast along the Nankai Sea trough on the Pacific Coast. In addition to hardware measures including construction of tsunami barrier walls, software measures should be provided to avoid serious accidents. These would maintain electric power source systems for cooling, even if tsunami water overtops barrier walls and flows into the site.
(a) (b)
Building: tsunami- resistant wall,water prooffacilities onhigher floor
Building: tsunami- resistant wall,water prooffacilities Stock of sparefacilities in water proof building
Building: on higher location
Barrier wall Building: tsunami- resistant wall,water proofing building
Nonflooded structures Waterproofing structures
FIGURE 1.4 Measures for protection of sewage system against tsunamis: (a) measures for preservation of func-tion and (b) measures for quick recovery of function.
Sand dune: E.L. 10~15 m, width 60~80 m, length 1.5 km
Sand dune
E.L.18 m
Wave-absorbing work
Tsunami barrier wall
FIGURE 1.5 Construction of tsunami barrier wall (Hamaoka nuclear power plant).

10 General Remarks of Lifeline Services
References
1. Duke, C.M. and D.F. Moran (1975). Guideline for evolution of lifeline earthquake engineering. Proceedings of the US National Conference on Earthquake Engineering, pp. 367–376.
2. Cabinet Office, Japanese Government (2008). White Note on Natural Disaster Prevention, Ministry of Finance, Tokyo, Japan. (in Japanese).
3. Cabinet Office, Japanese Government (2011). Disaster Management in Japan, Ministry of Finance, Tokyo, Japan.
4. Technical Committee for Earthquake and Tsunami Resistant Sewage Systems (2012). Japan Sewage Works Association, Basic Concept for Design and Countermeasures of Sewage Facilities against Tsunamis, JSWA, Japan. (in Japanese).
5. Hamada, M. (2014). Engineering for Earthquake Disaster Mitigation. Springer, Tokyo, Japan.
(a) (b)
FIGURE 1.6 Tsunami barrier wall of Hamaoka nuclear power plant: (a) steel pipe wall and (b) steel box wall.

11
2.1 General Remarks on Water Systems
2.1.1 General Remarks
As shown in Figure 2.1, water supply systems generally begin with surface or underground sources, from which water is conveyed via transmission lines to terminal reservoirs, from which it proceeds to water treatment (“purification”) plants, and then is distributed within the service area to on-demand residential, commercial, and industrial users [1–3].
Water supply systems are composed of multiple facilities including dams, intake facilities, aqueducts, purification system, and transmission and distribution systems. There are various kinds of civil and architectural structures and electrical and mechanical equipment. These facilities are interconnected and are operated systematically for water supply services.
Water pipelines are responsible for delivering a stable and reliable water supply, even during extreme situations such as earthquakes and water shortages. Many water systems are now aging and are in need of replacement. Additionally, since water systems consume almost 1% of Japan’s electric power for transmission and distribution, alternative energy-saving systems are now be investigated. Lastly, in order to minimize damage and realize rapid restoration in the aftermath of a disaster, vari-ous preparatory works are needed, such as seismic retrofitting, restoration planning, and emergency water supply training.
The water pipeline system is not only used as a means to supply potable water to the general pop-ulace but also used to supply industrial water, recycled wastewater, and water for special uses like
2Water Supply System:
Planning Aspects
2.1 General Remarks on Water Systems ................................................11General Remarks • Dam Facilities • Water Intake Facilities • Aqueducts • Water Purification Facilities • Water Transmission Facilities • Distribution Facilities • Water Service Installation
2.2 Planning of a Waterwork Project .....................................................15Planning Period • Supply Area • Supply Population • Supply Water Volume • Water Demand Analysis and Prediction • Effective Water Volume and Noneffective Water Volume • Water Source Quality and the Purification Method • Functions of Transmission and Distribution Systems • Location of Facilities • Location of Transmission and Distribution Network Systems (Blocking, Networking)
References ........................................................................................................25Takeshi KoikeKyoto University

12 General Remarks of Lifeline Services
cooling and cleaning. The different types of water in pipelines are pressurized and provided with less treatment than for potable demands.
2.1.2 Dam Facilities
While Japan’s annual precipitation is almost twice the world’s average, the rainfall volume per capita is half the global average. So water supply does not always meet the demand. Rainfall is concentrated in the rainy and typhoon seasons, when the water flow can often become runoff flow. Hence, during the rainy season, water must be stored in a facility like a reservoir and later delivered into the river accord-ing to demand.
Such facilities include dams and reservoirs in the upper river area, water ponds in the middle area, and river dams and underground storage in the lower river area. These dams also serve to control flood-ing and generate power, in addition to their primary function of water storage.
2.1.3 Water intake Facilities
Water sources are classified into surface water in rivers and lakes and underground water. The intake facility is installed at the water entry point.
When water is taken from a river flow which has a variable water level, the intake system must include a facility that can stabilize the water level. Typical intake facilities are dams, gates, towers, frames, and pipelines.
When underground water is pumped up, the volume intake must be controlled in order to avoid ground settlement and saltwater hazard. Since the intake of underground water is often affected by industrial wastewater, the intake point and its method must be carefully selected and controlled, and
Dam
Intake dam Elevatedtank
Receiving wellSettling
basinFilterbasin
Purificationpond
Pumping stationTransmission
pipeline
Reservoir basin
Elevated tank
Elevatedtank
Water tank
Water tank
Service lineService line
Distributionpipeline
Distributionpipeline
Distribution pipeline
FIGURE 2.1 Illustration of the water supply system.

13Water Supply System: Planning Aspects
equipment such as wastewater exposing and purifying equipment should be installed. The depth of a well is determined from the level of the underground water layer. The underground flow under the river bed can be siphoned off at the collecting points.
2.1.4 Aqueducts
Water taken at an intake facility is carried to a purification facility by the aqueduct system, which includes aqueducts, tunnels, and pumping stations.
The water is transported by buried structures such as pipelines, conduits, and tunnels or by surface structures such as above-ground conduits or open channels. Various transport methods are used, including the gravity flow method, the pumping and pressurized method, and the combined method. The water is also conveyed using pipelines under pressure or by open channels with a free water surface.
The standard method of water transport is the gravity flow method, while the pressurized method must be utilized under the following circumstances:
1. When the demand water level is higher than the supply 2. When the hydraulic grade line is located at a lower level than that of the demand point 3. When a long pipeline cannot convey the water by pressure due to head loss 4. When the whole required head is obtained at the starting point and then the gravity flow is applied
to the remaining water transmission 5. When a multistep pressurized flow is taken along the water transmission route
2.1.5 Water Purification Facilities
The water purification facility must supply potable water, as regulated by the water quality standard. There are several methods for water purification. The disinfection method can be exclusively applied
when the original water resources are sufficiently clean for drinking. Where the original source is not deemed potable, there are appropriate engineering methods that can be used, such as slow filtration, rapid filtration, membrane filtration, and high-quality purification. The most appropriate method should be selected on the basis of not only cost but also safety and reliable technologies. The original water quality, the purified water quality, the construction cost, and the operational cost are factors that should all be taken into consideration.
It should be noted that the disinfection treatment by chlorination is required in any purification pro-cesses based on code regulations.
2.1.6 Water transmission Facilities
The water transmission system is utilized to transport water from purification facilities to distribution facilities. This system is composed of transmission pipelines, pumping stations, regulating reservoirs, and control valves. The transmission capacity should be determined by the maximum water require-ment. There are several types of transmission methods, which include the gravity flow method, the pumped-up and pressurized method, and the combined method. Generally, a pipeline is sufficient to protect the system from any external hazards or accidents, but when the gravity flow method is used, a shield tunnel or aqueduct is required.
Mostly, a single transmission pipeline is installed from the purification facility to the storage tank in the distribution system. If there are multiple distribution areas in this purification facility’s area, the transmission pipelines are installed to each storage tank. In some cases, a distribution pipeline is branched directly from the transmission pipeline. In these cases, the transmission pipelines and their facilities should be designed to comply with the dynamic water pressure and the volume of water conveyed.

14 General Remarks of Lifeline Services
2.1.7 Distribution Facilities
The distribution system is composed of a distribution reservoir, tower, elevated tank, distribution pipe-lines, pumping stations, and various equipment for controlling flow in the pipeline. The distribution pipeline can supply purified water under adequate pressure in stable operating conditions. The capacity of the reservoir should be estimated from the maximum volume of water consumed in 12 h. The maxi-mum flow capacity can be evaluated on the basis of supply volume per hour.
There are several flow methods in the distribution system, the most appropriate of which is the grav-ity flow type. When the pumping method is used, the reservoir should be installed at a location with a high elevation to save the energy costs as much as possible.
2.1.7.1 Reservoir, Water Storage tower, and elevated tank
A reservoir is used for the storage of purified water and delivers potable water in accordance with demand in the distribution area.
As water demand varies during the day, the operating system has several control functions that can absorb water supply variations within several hours as well as maintain the water supply to the distribu-tion pipelines for several hours even if an accident at the purification plant terminates the water supply to the transmission pipelines. The reservoir can therefore provide an emergency water supply in the case of a disaster such as an earthquake.
Water storage towers and elevated tanks are installed to maintain sufficient pressure head for gravity flow when an appropriate higher location cannot be obtained in the distribution area. These cylindrical or spherical tanks can also control the volume and pressure level of the distributed water.
2.1.7.2 Distribution Pipelines
Distribution pipelines are composed of main lines and branch lines. The main lines deliver water directly to the branch lines, which in turn deliver water directly to users via service lines.
There are both loop- and tree-type distribution network layouts. A loop system is reticulated, that is, highly interconnected or gridded, while a tree system has one or a few isolated feeder mains, with no interconnection between feeder mains. Therefore, in a loop system, pressure loss is minimized when an unexpectedly large amount of water consumption, such as for firefighting activities, occurs, and any area required to be taken out of service can be minimized in case of the pipe work activities or acciden-tal damages. Another merit of this system is minimization of water quality deterioration due to flow stagnation at pipe ends.
2.1.7.3 Pumping Facilities
Pumping facilities are installed at the midpoint of distribution pipelines or at storage reservoirs in order to provide sufficient pressure for water delivery to service lines of variable elevation. They also maintain the gravity flow from the upstream water storage reservoir.
The pump can provide an adequate pressure level for water distribution, and there is no geographical limitation for a reservoir construction site using pumping facilities. However, in this facility, it must be taken into account that equipment or electrical failure would lead to a risk of water outage.
2.1.7.4 Auxiliary equipment of Pipelines
There are several types of valves such as gate valve, pressure reducing valve, air relief valve, any hydrant and blowout valve. These equipment are used to maintain the pressure and volume of the distribution pipelines and to keep the distribution network operating smoothly.
2.1.8 Water Service installation
A water service installation is composed of user-owned service lines, stop valves, water meters, and fau-cets as well as the branch line, directly connected with the distribution pipelines. Water tanks used to

15Water Supply System: Planning Aspects
store water taken from a distribution line (or easily connecting/taking off rubber hose) are not included in this water service installation.
Since the service line is directly connected to the distribution line, any works such as repairs and retrofitting activities must be carried out by a licensed company. Some miscellaneous work items, such as replacing rubber packing, are not included in the obligations of the licensed company.
There are two ways to deliver water using a service line. One is to deliver directly from the distri-bution line to the faucet, and the other is to store water in a water tank installed at an elevated point. The former method uses the water pressure of the distribution network to deliver water to the top floor of buildings, while the latter method is applied to high-rise buildings of greater height than can be served by the pressure in the water main, the maximum height being typically in the range of 3 to 6 stories.
Recent reports on water tanks have noted insufficient sanitary management and some sanitary acci-dents. Based on these experiences, the water supply law in Japan was revised in July 2001, so that the water supply firm can take part in adequately managing the installation and operation of the water tanks.
Recently, direct supply of water to high-rise buildings has become more prevalent using additional pumping-up pressure equipment as shown in Figure 2.2.
2.2 Planning of a Waterwork Project
2.2.1 Planning Period
A planning period of typically between 15 and 20 years is necessary to take into account the accuracy of predictions of future water demand and the rationality of facility adjustment.
2.2.2 Supply Area
The supply area is a region where the distribution pipelines are installed to supply water within the planned period. The size of this area is expected to be set from the wide-scale integration of the service regions, which include simple water supply systems.
Gate valve MeterCheck valve
Valve
Pump
P
MM
Distribution line
RoadFrame
Private area
Boundary
Faucet
Faucet
Faucet
(b)(a)
Tee
FIGURE 2.2 Comparison between a gravity water supply system (a) and a direct pumping-up system (b).

16 General Remarks of Lifeline Services
2.2.3 Supply Population
The supply population is estimated with the planning water supply rate to be multiplied for the popula-tion predicted by the local government in the planned period.
2.2.4 Supply Water Volume
Basic information on the supply water volume is needed not only to determine the capacity of the water supply system but also to gauge the financial requirement on the water supply’s operational manage-ment. In order to make an accurate water supply prediction, it is necessary to check the area’s water supply volume records and to compare them with those of similar-sized water supply systems.
2.2.5 Water Demand Analysis and Prediction
Water demand prediction for a municipality is carried out based on the socioeconomic trend and devel-oping direction of the supply area. In order to predict the water demand trend, several inductive statisti-cal methods are available.
In the water demand prediction, the recent trend of water saving, recycling, and use of underground water must be taken into consideration.
The entire area of water supply of the municipality is classified into subregions that have regional characteristics, in which the distribution pipeline network and control facilities must be adequately allocated for separate blocks.
2.2.5.1 temporal trend Method
This method assumes that the present trend of water usage will continue. A regression analysis is uti-lized for the prediction curve to extrapolate past water usage trend. This trend curve can be given by the following factors:
• Annual average of water demand changes• Modified exponential curve of water demand changes• Power curve of water demand changes• Logistic curve of water demand changes
2.2.5.2 Multiregression Analysis Method
A regression model is formulated in the following manner:
Y b b X b X b Xn n= + + + +0 1 1 2 2
whereY is the target variable; for instance, daily water usage volume (m3/day) or daily water usage volume
per capita (liters/(capita day))Xi are control variables; for instance, population, economical index, and so onb0 is the constantbi is the coefficient for Xi
2.2.5.3 Factor-Based Regression Method
When water usage volume is classified for several sectors such as housing, urban facilities, or industrial factories, a more precise trend of water usage volume can be obtained for the socioeconomic variations, which reflect the total activities of these sectors.

17Water Supply System: Planning Aspects
In terms of housing, the daily water usage per person is affected by such factors as the number of occupants and the number and size of consumption and saving equipment.
In the urban facility sector, the water usage volume will be different from the commercial and public sectors.
In the industrial sector, the water usage volume will vary greatly according to the demand character-istics and scale of each business.
2.2.6 effective Water Volume and noneffective Water Volume
2.2.6.1 Analysis of Distribution Water consumption
The delivered water from the storage tank to the demand node is called the water supplied volume, which is also classified into effective water volume to be used and noneffective water volume, which leaks out during the delivery process. Table 2.1 shows the analytical table of water consumption. The effective ratio (%) is defined as the ratio of the effective water volume to the water supplied volume. This rate is often used as a measure to check the water delivery performance of the current system or to judge the requirement of a new project for leakage reduction.
The effective water volume that can be charged to customers is called revenue water, and the water that cannot be charged to customers is called nonrevenue water (NRW). The effective revenue ratio is calculated by dividing the revenue water volume by the water supplied volume. Figure 2.3 shows the annual trend of the effective ratio, the effective revenue ratio, and the noneffective ratio in Japan. In 1975, the effective ratio was 81.1% and the effective revenue ratio 77.4%, but in 2006, these values were 92.5% and 89.7%, respectively. This trend suggests that water delivery management has improved in Japan. For an appropriate control of water pressure and discharge, these increasing effective ratios can reduce the energy consumption as well as CO2 exhaust.
2.2.6.2 estimation of Planned Water Supply Volume
Water supply volume is an important factor for basic planning in which the adequate scale of facilities and pipeline networks must be assessed for prospective water project management. This volume must
TABLE 2.1 Analytical Table of Water Consumption
Distribution water
Effective water
Accounted-for water
Commodity charge Water volume for pricingFixed-rate tap and its approved volume
Subdistribution Subdivided volume for other useOthers Water for park
Water for toiletWater for firefightingOthers (water delivered as maintenance fee)
NRW
Unmeasured volume Unmeasured volume due to insensitive meteringVolume for utility work Utility volume for cleaning and maintenance worksOthers Water for park
Water for toiletWater for firefightingOthers (water delivered as maintenance fee)
Noneffective water
Volume loss due to conciliation
Reduced volume lost by rust-colored water
Leakage volume Leakage volume for water mainsLeakage water volume for distribution linesLeakage from service lines before the meter
Others Uncertain volume or noneffective volume due to any other reasons

18 General Remarks of Lifeline Services
be evaluated based on the future development of socioeconomic trends of the local area as well as that of the customers.
The average and maximum water supply volumes can be calculated using the following formula:
1 day average planned water supply volume
1 day average water demand=
TThe planned effective ratio
1 day planned maximum water supply
1 day average water demand
The pla=
nnned load factor
in which the planned effective ratio is affected by the water distribution control and blocking manage-ment and also by facility deteriorations. The load factor is a ratio of the 1 day average water supply volume to the 1 day maximum water supply volume. This factor generally shows a lower value for small-scale towns, but a greater value for large-scale cities. This factor is also dependent on the climatic condi-tions and characteristics of the conurbation.
The planned load factor can be predicted on the basis of the long-term trend of past load factors, the current load factors of similar-sized cities, and the effect of climate trend and its variation.
2.2.7 Water Source Quality and the Purification Method
2.2.7.1 Management by objectives of Water Purification and Water Source Quality
Selection of a purification method depends on the water source quality [4]. In order to achieve the target purification quality, a purification method based on the water source quality should be selected. The water source quality is investigated not only on the basic quality checking parameters but also on vari-ous pathogenic bacteria such as Cryptosporidium.
The water quality should be predicted from both its present condition and projections of urban and/or agricultural development, and also any future possible changes or additions to the purification method must be considered.
Supp
ly vo
lum
e (10
0 m
m3)
Effectivewater ratio
Annu
al wa
ter c
onsu
mpt
ion Accounted-for
water ratio
Reactivefactor
170160150140130120110100
90807060 16.4 13.5 11.0 9.7 8.3 7.7 7.5
60 2 7 12 17 18
50
550 0
102030405060708090100
(2000)(1990)(1980)
129
143
157 161 161156 155
83.679.6 82.8
86.4 89.0 90.3 91.7 92.3 92.5
89.5 89.787.1 88.685.7
Effe
ctiv
e wat
er ra
tio (%
)
Year
FIGURE 2.3 The annual trend of the effective ratio, the effective revenue ratio, and the noneffective ratio in Japan.

19Water Supply System: Planning Aspects
When a dam construction project is executed at a site upstream of the intake point, the water quality at the intake point might be affected by waterweeds produced in the dam.
Water quality regulation is the minimum requirement to maintain water purification quality at the faucets. Future water management is requested to supply a more reliable and higher quality of water purification with the target approach to fulfill the highest water quality.
2.2.7.2 Purification Facility
The disinfection method, the sand filter method, and the membrane filtration method are all viable water purification methods. The most appropriate of these three (or a combination) is selected by tak-ing into account the original water quality, target level of water purification, purified water volume, and management levels of operation and maintenance activities.
In case of seawater desalination, a treatment such as the evaporation method, the reverse osmosis membrane method, or desalination by electrodialysis must be employed. If pH control is necessary, an appropriate additional method can be applied.
For a Cryptosporidium pollution, official guidelines request treatment in addition to the three afore-mentioned methods.
An advanced water purification method can be adopted on the basis of operational activity data of the existing system and test results of the new method, together with the safety and treatment effectiveness. If the safety and treatment capability of the current system cannot be clarified from the existing data, an experimental approach using the original water taken from the existing water purification facility will be preferable.
2.2.7.3 Selection of Water treatment Processes
The most appropriate method of water treatment should be selected as a combination of the treatment for insoluble materials such as algae and colon bacillus and the treatment for soluble materials such as agricultural chemicals and organic compounds.
2.2.7.3.1 Disinfection MethodIf underground water is of high quality, only the disinfection method is adopted. This method is simple and renders effluent treatment unnecessary, so that the maintenance management will be cost-effective. The flow chart of this treatment system is shown in Figure 2.4.
This approach should be reexamined if the water quality changes. If the original water is polluted by Cryptosporidium, this treatment method cannot be adopted. Management staff must pay attention to any potential pollution sources, such as livestock farms, near the water source area. Any pollutants such as indicator bacteria produced from feces found in the water sources are not allowed. Rigorous turbidity management is also requested.
2.2.7.3.2 Slow Sand Filtration SystemThis method is appropriate when water source quality is good and the turbidity is stable and at a low level, clean river water, for example. In this method, the original water passes through comparatively
Chlorine feeding
Raw water Receiving well Chlorine-feeding well Purificationreservoir Transmission
FIGURE 2.4 Disinfection process.

20 General Remarks of Lifeline Services
fine sand at a slow speed for 4–5 days. During this process, insoluble or soluble material is caught at the sand’s surface and brought to oxidative degradation by various bacteria staying in the sand layers.
This method can clean source water of the suspended solids, bacillus bacteria, ammonia nitrogen, odor, manganese (Mn), ferrum (Fe), anionic surface-active agents, and phenol. However, it is difficult to reduce the chromaticity caused by humic substances.
An ordinary settling reservoir is a basin to remove fine sands and large suspended substances; the source water flows slowly and suspended substances settle in a natural sedimentation process. If the source water (such as underground water) exhibits good quality, this sedimentation process can be skipped.
Chemical sedimentation is not used regularly for small suspended substances, but it is temporarily adopted for severe suspended substances. This process is described in Figure 2.5.
A slow sand filtration system is simply for the maintenance and stabilization of water that is already of a good quality. However, this method requires a wide space because of its slow suspending speed; scrape-off work of sand is also necessary periodically.
2.2.7.3.3 Rapid Sand Filter SystemThis method is appropriate when water source quality shows high turbidity and the plant operating space is limited. In this method, after the water source is taken into the receiving well, flocculants (poly-aluminum chloride) are added to the well, making a flock by condensing the suspended substances such as clay materials and algae in the water source.
This process is carried out by chemical sedimentation. Rapid filtration is applied for the flock made in the sedimentation basin. This method can be used for high-turbidity materials, but dissolved solids are difficult to eliminate using this method.
Using course sand, the speed of this method is approximately 30 times that of the slow sand filtration system, with water velocity through sand of 120–150 m/day. This method is possible in a narrow plant space and is also effective to deal with a large-volume water source. The flow chart of this method is shown in Figure 2.6.
Since the precipitating quality of a water source by this method is affected by the purification capacity, high-level quality management of filtering work such as the optimal feeding of coagulant is required. An effluent treatment plant is also necessary to store muddy substances obtained from the sedimentation and filtering process.
2.2.7.3.4 Membrane FiltrationThis method is used to separate suspended or colloid substances from the water source. If the diameter or molecular size of suspended solids or dissolved substances is less than the pit diameter, these sub-stances can be separated by membrane filtration.
Raw water Receiving well Purificationreservoir Transmission
Chemical feeder Chemical feeder
Plain sedimentation
basin
Slow filtration
pond
Chlorine-feeding
well
Chemicalfeeding
sedimentation basin
FIGURE 2.5 Slow sand filtration system.

21Water Supply System: Planning Aspects
Filtration membranes can be classified into the following four types (which depend on the pit diam-eter): microfiltration (MF) membrane, ultrafiltration (UF) membrane, nanofiltration (NF) membrane, and reverse osmotic (RO) membrane.
In order to effectively operate membrane filtration, prefiltering process to remove impurities is neces-sary. If membrane filtration cannot remove dissolved organic matters, foul smell and taste, and manga-nese, postfiltering process is required.
In order to maintain an effective operation of this method, it is necessary to remove clogging at the membrane hole. In the monthly chemical wash of the membrane pit, it will be necessary to change the membrane every several years. This maintenance work has been more easily operated by introducing an automatic and remote control system. The flow chart of this method is shown in Figure 2.7.
Recently, many water supply utilities in Japan have adopted the membrane filtration method because it is difficult to obtain a wide enough space for a filtration plant.
2.2.7.3.5 Advanced Water PurificationWhen the water source is a river whose quality is poor, the aforementioned methods cannot remove the dissolved solids, so one approach among several advanced water purification methods must be selected in accordance with the dissolved material and its concentration severity.
The advanced water purification method is used to remove substances that cannot be removed by the previous methods. These substances include those with offensive odor (2-methylisoborneol, geosmin, and mold), trihalomethane precursor, chromatic substances, ammonium nitrogen, anionic surface-active agents, and trichloroethylene. Advanced methods are classified into activated carbon treatment, ozonization treatment, biological treatment, and vaporization treatment.
These methods can remove the following materials from the water sources: iron, manganese, erosive free carbon dioxide, fluorine, ammonium nitrogen, nitrate nitrogen, and any inorganic substances.
An appropriate biological treatment is necessary to remove water weeds. The typical flow chart of this method is shown in Figure 2.8.
Ozonization treatments use oxidizing agents such as hydrogen peroxide to expedite oxidation treat-ment, chlorine dioxide for oxidization and disinfection, and ultraviolet beam for sterilization.
Raw water Receiving well TransmissionPurification
reservoir
Chemical feeder
Mixing basin Chlorine feeding
Coag
ulat
ion
basin
Chemicalsedimentation
basin
Slow filtration
pond
Chlorine-feeding
well
Rapid coagulation
basin
FIGURE 2.6 Rapid sand filtration system.
Raw water Receiving well Pretreatment Membranefiltration
Posttreatment
Chlorine feeding
Chlorine-feeding
wellPurification
reservoirTransmission
FIGURE 2.7 Membrane filtration system.

22 General Remarks of Lifeline Services
2.2.8 Functions of transmission and Distribution Systems
A transmission system is composed of pipelines from the purification facility to the supply points and pumping facilities. A distribution system is a network of distribution mains, the network of distribution pipelines and storage tanks. The distribution mains convey the potable water from the storage tanks to the demand nodes of the distribution network. The distribution pipelines are connected to service pipes, the water from which is delivered to the end users such as houses and offices.
The function of transmission and distribution systems is to supply potable water from the purifica-tion plants to the distribution areas, to control the daily temporal variation of water supply, and to store water for emergencies. In order to maintain these functions, these systems must be effectively operated and economically managed.
From the point of view of the supply function, the following preparations must be made:
1. In order to obtain stable supply, transmission lines and distribution mains must have multiple redundancy and duration in their networks for emergency usage in case of accidents or natural disasters.
2. These networks have to be reinforced for earthquake damage protection. 3. The water distribution area must be arranged to minimize the mutual elevation gaps at all nodes
in the network.
Raw water
Raw water
Ozone contact basin
Ozone contact basin
Biologicalactivated carbonadsorption basin
Biologicalactivated carbonadsorption basin
Rapid filtration
pond
Rapid filtration
pond
Purification reservoir
Purification reservoir
Transmission
Transmission
Receiving well
Receiving well
Chlorine feeding
Chlorine feeding
Chemical feeder
Chemical feeder
Chemicalsedimentation
basin
Chemicalsedimentation
basin
Rapidfiltration
pond
(a)
(b)
Advanced water purification
Advanced water purification
FIGURE 2.8 Advanced water purification: (a) prefiltration process and (b) non–prefiltration process.

23Water Supply System: Planning Aspects
From the point of view of the storage function, the following preparations must be made:
1. Control of the operation of the distribution system to absorb temporal demand variation 2. Prevention of water suspension in the distribution network 3. Removal of any materials causing the deterioration of water quality
From the point of view of the quality control, the following preparations must be made:
1. Prevention of the outbreak of disinfection by-product 2. Minimization of the transmission time from the purification plant to the demand nodes in order
to keep the residual chlorine 3. Adequate allocation of the pipeline configuration in order to avoid dead-end pipes
2.2.9 Location of Facilities
When the water system is planned, gravity flow is preferable from intake to demand nodes. In particular, the aqueduct and purification plants are expected to be constructed by taking the terrain topography into consideration because the maintenance management of water systems is improved by a gravita-tional configuration.
A gravity flow system is also preferable for the distribution network where possible. In city areas, which are typically located on flat plains, elevated tanks are often used in addition to gravity flow.
The location of the water network system is planned from the following points: (1) economic condi-tion, (2) ease of access for maintenance work, (3) stable and efficient water flow through the transmis-sion and distribution pipelines, and (4) applicability to the city’s future development. Figure 2.9 shows a system diagram of a typical water system.
The purification plants are located at a certain elevated point to save energy in conveying purified water to distribution areas. These plants should also be located on firm ground if such ground can be established without a huge amount of earthwork. Each purification plant should be located to effec-tively reflect the process flow of the purification system. Additional areas should be located for future
Source Intake AqueductPurification plant
Under-groundwater
Above-groundwater
Well
Intakefacilities
Basin
Tunnelaqueductreservoir
Receivingwell
Chlorine disinfection
Slow sedimentation system
Rapid sedimentation system
Advanced purification system
Membrane filtration system
Pouringdisinfection
Well
Purifi-cationreservoir
Transmission Distribution Service taps
Pipelinereservoir
Tank/pipelines
Service line/meter/taps
FIGURE 2.9 General configuration of a water supply system.

24 General Remarks of Lifeline Services
improvements, retrofitting, and enlargement of existing plants. When a purification plant must be located in an urban area where space is limited, an elevated location for all the plants can be considered. In terms of energy and resource saving, the effective use of dewatering cake, hydraulic head due to eleva-tion difference, and waste heat energy should be taken into consideration.
Distribution plants are composed of distribution pipelines, storage tanks, and pumping facilities to supply water at an adequate pressure in a condition of stable flow from the source nodes of the transmis-sion pipeline to the demand nodes that often show nonstationary demand changes as shown in Figure 2.10. Management is also required to control the water quality by preventing water pollution and deterio-ration, to supply water to fire hydrants, and to maintain the distribution plants in an effective and simple manner.
In addition to a stable daily water supply, an emergency water supply in case of natural disasters such as earthquakes or droughts must be taken into consideration while maintaining safe and reliable opera-tion of the distribution network system.
Since distribution nodes are located in all service areas, distribution pipelines are of necessity located in a variety of soil conditions. In order to protect them from deterioration, accidents, and maintenance outages, sustainable management and retrofitting of the distribution network system is expected.
2.2.10 Location of transmission and Distribution network Systems (Blocking, networking)
Transmission and distribution pipeline systems have two types of configuration: network type and tree type [5]. Since water flows from the higher elevated point to the elevations and through urban spatial developments, a reticulated or gridded network configuration of pipelines is preferred.
If water supply is required across extremely wide areas or to special areas of varying ground eleva-tions, it will be difficult to control the flow and pressure condition. In order to solve this problem, the distribution network should be separated into adequate block sizes to minimize the need to control pressure and flow changes.
A water distribution area has a pipeline network and several water reservoirs. Each area should be selected from not only natural conditions but also social conditions in order to operate water plant facilities rationally and economically. Rational operation means that an adequate pressure must be maintained for daily water demand changes and stable water supply in normal conditions as well as a minimum supply for emergency conditions.
Tem
pora
l wat
er su
pply
rate
Residence
Business
Time (h)
1.75
1.50
1.25
1.00
0.75
0.50
0.25 24 2 4 6 8 10 12 14 16 18 20 22
FIGURE 2.10 Temporal trend of typical water supply rate.

25Water Supply System: Planning Aspects
A water distribution area is divided into several water service areas in which adequate operation of water flow and plant management is necessary, and mutual cooperation between neighboring service areas is also expected. If the ground elevation changes frequently in one distribution area, the distri-bution network can be divided into two different pressure zones such as high-pressure zone and low-pressure zone.
If a water supply area is forced to be divided into distribution areas, because of its size or varying elevations, it will be difficult to maintain a stable daily water flow control and to operate water supply in emergency conditions. In this situation, the water distribution area is divided into several block areas. The distribution main pipelines are connected to the representative node of each block unit, but the distribution pipelines are connected to several nodes of subnetworks in a block unit as shown in Figure 2.11.
A blocking approach can be adopted not only to divide the water distribution area to meet the water supply conditions at several demand points but also to establish homogeneous operations at hierarchal network layers, which are composed of a distribution main layer as a large block unit, distribution layer as a medium block unit, and subsidiary distribution layer as a minor block unit. This approach facilitates mutual cooperation in emergency or accidents so that a stable water service can be provided in such situations.
In planning a blocking approach, there are several problems to be solved in terms of water flow control, in which additional protection works are necessary for decreasing water stagnation and residual chlorine at the boundary zones between neighboring blocks, and rust-colored water at the blocking work. Additional monitoring and control equipment for the blocking approach are also necessary.
In a comparatively small-scale water network system, or a simple water network system, a blocking approach is not always recommended; instead, a locally pressurized or depressurized zone approach in a distribution network can meet the local water supply conditions.
References
1. Iijima, N., H. Ueno, H. Funai, T. Matsuda, and T. Motoyama. Water Works Engineering, Supervised by K. Kawakita. Morikita Publishing Company, Tokyo, Japan, 1999 (in Japanese).
(1) Transmission pipelines and purification plant
(2) Transmission network (large blocks)
(3) Distribution main (middle blocks)
(4) Distribution network (small blocks)
FIGURE 2.11 General concept of a blocking system. (1) Transmission pipelines and purification plant, (2) trans-mission network (large blocks), (3) distribution main (middle blocks), and (4) distribution network (small blocks).

26 General Remarks of Lifeline Services
2. Ishii, T. Recent Knowledge on New Water Supply System. Japan Water Works News Company, Tokyo, Japan, 1995 (in Japanese).
3. JWWA. General Introduction of Water Works. JWWA, Tokyo, Japan, 2008 (in Japanese). 4. JWWA. Guideline for the Maintenance of Water Supply System. JWWA, Tokyo, Japan, 2006 (in
Japanese). 5. JWWA. Guideline for the Design of Water Supply System. JWWA, Tokyo, Japan, 2000 (in Japanese).

27
3.1 Sewerage System
3.1.1 Role of Sewerage System
The objective of sewerage systems and services is to ensure sustainable urban development, hygienic sanitary conditions, and clean water environment. In other words, the roles of the sewerage system are to collect and treat sanitary wastewater from domestic and industrial sources, and drain storm water so that the livable environment is safeguarded. In recent years, extreme rainfall events have been increas-ingly observed in Japan, as shown in Figure 3.1.
In addition to these basic functions, the recycling of resources from sewerage systems has emerged as a new role in recent years. Water, sludge, biogas, and heat are recyclable. By tapping into these sources, the creation of energy-independent treatment plants and the reduction of greenhouse gasses (GHGs) are being achieved. Sludge recycling rate is increasing as shown in Figure 3.2.
3.1.2 components of a Sewerage System
A sewerage system is defined as all the facilities to collect and treat municipal and industrial sanitary wastewater and drain storm water, and then to return the treated wastewater and storm water to the receiving water bodies [1].
3.1.2.1 collection of Domestic Sanitary Wastewater
Sanitary wastewater from the kitchen, toilet, and bath is collected through the house sewer and a clea-nout, which are located inside the private property. The house sewer and cleanout belong to the property owner, whose maintenance is the responsibility of the property owner (see Figure 3.3).
The wastewater then flows down to another cleanout located at the boundary with public roads. This cleanout and subsequent sewer belong to the municipality. Wastewater comes into the main sewer by
3Sewerage System: Planning Aspects
3.1 Sewerage System .................................................................................27Role of Sewerage System • Components of a Sewerage System • Hydrological Cycle and Sewerage
3.2 Planning of Sewerage .........................................................................31Principle • Type and Nature of Sewerage Plans • Process of Sewerage Planning • Basic Items in Planning • Data Collection • Treatment and Reclamation of Sanitary Wastewater • Sludge Treatment and Recycling • Storm Water Drainage Planning • Implementation Plan • Use of Sewerage Resource and Space
References ........................................................................................................44Masanori HamadaWaseda University

28 General Remarks of Lifeline Services
0
50
100
150
200
250
300
350
400
222
170
225
157140
230
186
110
157
103
188
251
190
295
156
112
256
132
159
95
178
331
275
245
207
174182
360
196
243
194
254
169
209
279
147
1976 80 85 90 95 00 05 10
183 events peryear, average from
1976 to 1991
199 events peryear, average from
1992 to 2001
226 events peryear, average from
2001 to 2010
[events per year]
FIGURE 3.1 Increase of recent rainfall extremes in nationwide events, with 50 mm/h or more in Japan.
38
15 16 1720
24 2430
15
4548 50 52
5660
64 6770
7477 78 77 78
0
10
20
30
40
50
60
70
80
0
500
1000
1500
2000
2500
Sludge recycling rate
Constructionmaterial
(cement)
Landfill or oceanreclamation
FertilizerConstruction
material(exceptcement)
Others
Fuel
20102005200019951990
Slud
ge g
ener
atio
n (d
ry so
lids 1
000
ton)
Slud
ge re
cycl
ing
rate
(%)
FIGURE 3.2 Trend of sludge recycling in Japan.

29Sewerage System: Planning Aspects
way of lateral flow. The diameter of the sewer pipe increases as the volume of wastewater increases down the line. Because wastewater is basically collected by gravity, the sewer pipe may have to kept at a greater burial depth as it travels toward its destination. Deep sewer pipes are costly to install and difficult to maintain. Therefore, wastewater may be periodically pumped close to ground level at lift stations to prevent excessive depth. Ultimately, the wastewater reaches a treatment plant and, after treatment, the treated water is discharged into rivers and seas.
3.1.2.2 Separate and combined Sewer System
Wastewater includes sanitary wastewater and storm water. Two systems exist for their collection. One is a separate system where sanitary wastewater and storm water run into separate sewer lines. The other is a combined system where sanitary wastewater and storm water run into the same sewer. Generally, the installation cost of a separate system is higher than that of a combined system. Combined sys-tems were used in older cities. Later, combined sewer systems were considered an affordable solution to improve sanitation and urban flood. However, because sanitary wastewater and storm water run into
Boundary of private
and public
Stor
m d
rain
Priv
ate s
torm
cl
eano
utCa
tch
basin
Sani
tary
sew
er
Publ
ic sa
nita
ry
clea
nout
Priv
ate s
anita
ry
clea
nout Ki
tche
n Pr
ivat
e san
itary
cl
eano
utBa
thPr
ivat
e san
itary
cl
eano
utTo
ilet
Stor
m se
wer
Boundary of private and
publicRoad
(a)
(b)Public sewerHouse sewer
Stor
m d
rain
Priv
ate s
anita
ry
clea
nout
Toile
tPr
ivat
e san
itary
cl
eano
utBa
thPr
ivat
e san
itary
cl
eano
ut Kitc
hen
Stor
m d
rain
Priv
ate s
anita
ry
clea
nout
Publ
ic sa
nita
ry cl
eano
ut
Boundary of private
and public
Catc
h ba
sin
Com
bine
d se
wer
Road
FIGURE 3.3 (a) Separate and (b) combined sewer systems.

30 General Remarks of Lifeline Services
the same sewer lines in wet weather, a part of the combined sewage overflows due to gravity from the sewer outfalls or is discharged from pump stations into the receiving water body. Normally, around three times as much as planned dry weather flow is accommodated in a combined sewer line and sent to a wastewater treatment plant (WWTP) by way of interceptors. Although combined sewer overflows (CSOs) are diluted by storm water, sanitation and pollution problems occur as long as sanitary waste-water is in the overflows. Especially in the beginning of rainfall events, pollutants deposited on road surfaces and sewer lines are flushed into the wet weather flow and can be a threat to health and environ-ment. Therefore, a separate system is mandatory for cities starting a new sewer project today. To reduce the CSO problems, many cities are working on control measures such as storing the first flush of wet weather flow and sending it to a WWTP in dry weather for treatment.
3.1.2.3 Sewer Service operator
Local governments, for example prefectures and municipalities in Japan, are sewer service operators. They build, own, and operate the sewerage system. Private companies undertake the tasks from local governments on a contract basis.
1. Municipal sewerage: Two types of municipal sewerage systems are in place. In one, municipal governments collect and treat wastewater. In the other, municipal governments collect wastewa-ter with their sewer network that connects the manholes to the prefecture’s trunk sewer.
2. Prefecture sewerage: Prefecture sewerage receives wastewater from two or more municipalities and transports it to WWTPs for treatment.
3.1.3 Hydrological cycle and Sewerage
The hydrological cycle begins with rainwater flowing on the ground surface and partially infiltrat-ing into the soil while the remaining flows into rivers and lakes. Surface and groundwater is used for human consumption and then flows down to rivers and seas. Water evaporates continuously by solar energy from the surface water, soil, and sea. It turns into clouds and returns to the ground in the form of precipitation. This is the complete natural hydrological cycle.
Industrialization and urbanization have made it impossible for the natural purification capacity to treat wastewater. Sewerage is man-made, but it plays an important role in the hydrological cycle for the management of sanitary wastewater and storm water, as shown in Figure 3.4.
Evaporation
WWTPWTP
Sanitary sewer Storm sewer Water main
FIGURE 3.4 Hydrological cycle.

31Sewerage System: Planning Aspects
3.2 Planning of Sewerage
3.2.1 Principle
The fundamental roles of sewerage are treatment of sanitary wastewater and drainage of storm water. Biosolids, grit, screenings, and scum are generated as by-products of sanitary wastewater treatment. Without treating and disposing of those by-products safely and surely, sustainable wastewater treat-ment is not possible. In the planning of sewerage, both sanitary wastewater and storm water need to be considered and not only liquid but solid by-products also have to be considered.
In recent years, due to changes in economic conditions and water conservation, reduction of waste-water generation per capita has occurred, so that many municipalities have faced shrinking revenue and deficit. In order to sustain sewer services, a reduction of operation and investment costs, setting a reasonable fee, and increasing the ratio of house connections to public sewers are absolute requirements.
Wastewater collection and treatment consume a lot of energy in pumping, aeration, sludge transport, and treatment. The more advanced the treatment used, the more energy is needed. Sewerage planning focuses on minimizing the life cycle cost for the total capital investment, operation, and maintenance by using energy-efficient equipment and automation systems [2].
3.2.2 type and nature of Sewerage Plans
Sewerage plans include a master plan and an implementation plan. A master plan forms the outline of a sewerage system based on natural and social conditions. The master plan should be consistent with other sectors’ master plans such as those for environment, economic development, water resource devel-opment, water supply, and so on. An implementation plan must be consistent with the master plan. In many cases, it takes a phased approach.
Sewerage is made up of a sewer network, pumping stations, and WWTPs. They are connected and related to each other to form a system. The master plan is the backbone of the system.
During or after a project start, it is preferable not to change any part of the implementation plan. A change of one facility or component is likely to influence many other facilities of the system. While mak-ing a master plan, however, the freedom to make changes exists but is more difficult and costly after-wards. Therefore, an appropriate master plan is very important for successful project implementation. Figure 3.5 shows a series of steps in a master plan from operation to management of a sewerage plant.
Big
O&MFree
dom
of c
hoic
e/po
ssib
ility
of c
ost r
educ
tion
Upp
er p
lans
and
prec
ondi
tion s
Mas
ter p
lan
Impl
emen
tatio
n pl
an
Des
ign
Cons
truct
ion
Small
Phase
FIGURE 3.5 From master plan to operation and management phase.
32 General Remarks of Lifeline Services
3.2.3 Process of Sewerage Planning
The process of creating a master plan includes formulation of a basic policy, necessary data collection, prediction, analysis, evaluation, and decision [3] (see Figure 3.6).
1. Formulation of basic policy: Based on local and national requirements for sewerage services, a basic policy should be decided taking the following points into account:
a. Setting a clear goal is necessary. An example is to meet the environmental quality standard of receiving water bodies.
b. Priority should be given to several goals such as sanitation improvement of individual prop-erties, pollution control of public water, urban flood control, and so on.
c. Feasibility of meeting the goals needs to be studied to identify what obstacles exist or will appear in the future.
2. Data collection: A master plan normally has a 20-year planning horizon. Necessary basic infor-mation includes social data such as population, economic data such as industry sales output, and natural data like weather and geography. These sets of data are used to determine the flow and quality of wastewater coming into a sewerage system.
3. Prediction: The planned flow for sanitary wastewater and storm water (wastewater flow) and the planned pollutant load are predicted using a variety of base data. These data include sanitary wastewater generation per person per day, population, industry sales output, precipitation, and runoff rate. The base data also need to be predicted 20 years ahead based on the past trend.
4. Analysis: Several alternatives are proposed for the trunk sewer route, location of WWTPs, and layout of WWTP facilities. Then, they are compared with each other based on planning assess-ment criteria for analysis (see Table 3.1).
Basic policy
• Target year• Planning area• Sewer type
• Natural condition• Related plans• Pollutant loads• Existing facilities
• Planned wastewater flow
• Planned pollutant loads
• Sewer• Pumping stations• WWTPs
Data collection Prediction
Regulatory requirements
Facility planning
FIGURE 3.6 Process of planning.
TABLE 3.1 Requirement of Sewerage Plan
The plan shall collect and treat sanitary wastewater and recycle the by-productsIt shall drain storm water and discharge it to the public watersIt shall be made on long-term perspectiveIt shall absorb changes in economic and social situationsIt shall enable economical and easy maintenanceIt shall comply with laws and regulationsIt shall conform to the master plan

33Sewerage System: Planning Aspects
5. Evaluation: Alternative plans are evaluated to see if they meet the objectives of sewerage accord-ing to local and national requirements.
6. Decision: Based on the process mentioned earlier, a sewerage plan is formalized after authoriza-tion of the central or prefectural government.
3.2.4 Basic items in Planning
The target year, area, sewer type, outfall, and high water level of receiving water are the basis of a sewerage plan.
3.2.4.1 target Year
The capacity of a sewerage system needs to be decided based on the long-term prediction of its useful-ness. Useful sewerage facilities have a long life and therefore their construction also takes longer. In the case of sewers, phased construction or installation is technically difficult. However, the future is uncertain. As a compromise for deciding a foreseeable future period, the target of 20 years ahead of the base year is often employed.
3.2.4.2 Area and Sewer type
The planning area should be the area, which will be urbanized by the target year. Relevant urban plans need to be referred as they designate the urbanization area and greenbelt area.
The sewer type includes a combined system and a separate system. A separate system is desirable but a combined system is an option if the receiving water is not sensitive and appropriate measures are taken. Features and precautions for both systems are described as follows with a comparison summary (see Table 3.2).
1. Separate system: A separate system accommodates sanitary wastewater and storm water in separate sewer lines. This is the standard for new projects. The feature and cautions are as follows.
a. Inflow and infiltration: As sanitary and storm sewer lines are installed in parallel, wrong con-nections may occur. Poor cleanout cover allows storm water to enter the sanitary line and groundwater infiltrates, wearing out the sanitary line. If a sanitary sewer alone is installed as a priority, the property owner may connect the house storm water line to the public sani-tary line. These situations lead to sanitary sewer overflow and pollution problems in rainfall events. In a separate system, supervision and training of plumbing work are very important to avoid wrong connections and poor workmanship.
b. Pollution by way of storm sewer line: A separate sewer system is desirable because it is designed to treat sanitary wastewater all the time. However, runoff contains pollutants from urban surfaces or farmland. The pollutants directly enter public waters and cause pollution in some cases.
c. Depth of sanitary sewer: A sanitary sewer line tends to be deep because a steep slope is neces-sary to secure a minimum flow rate due to reduced flow upstream of a network. Consequently, lateral lines connecting to the main sewer should be deep as well.
d. Congestion of underground utility line: In a separate system, two sewer lines are normally installed under the roads for sanitary wastewater and storm water. However, where trunk lines are installed under the roads, another line for collectors is needed. Not only sewers but also other utility lines such as gas, water supply, electricity, and communication are in place. Congestion of utility lines is likely to lead to high installation cost of sewers due to temporary relocation work. Therefore, trunk sewers need to be planned under big roads.

34 General Remarks of Lifeline Services
2. Combined system: A combined system accommodates sanitary wastewater and storm water in a single sewer line. It has been used in the center of older cities where urban flood control was a big problem. Its features and caution are described as follows.
a. Combined sewer overflows: At the beginning of rainfall events, a combined sewage system contains high concentration of pollutants as the deposits are flushed and are removed from the inner surface of the sewer line. If it overflows directly to public waters, it causes pollution. When a combined sewer system is used, CSO control is necessary.
b. Ease of installation: A combined sewer system uses a single sewer line for sanitary waste-water and storm water. Therefore, compared with a separate system, installation is easy and less costly. It has been used in the downtown of old cities where urban flood control was imminent. It runs at a relatively shallow depth and has significant advantages in flat areas.
3.2.4.3 outfall
The outfalls to receiving waters are for effluent from WWTPs, CSO from pumping stations, or overflow structures of gravity network. The necessary considerations for outfalls are as follows:
• The location needs to be decided taking into account the planned high water level, use, and water quality standards of receiving waters.
TABLE 3.2 Comparison of Sewer Types
Parameter Combined Separate
Construction Ease of work Single sewer installation reduces chances of conflicting with other utility lines. Combined sewer diameter is larger than separate sanitary sewer with the same dry weather flow.
Installation of two separate lines in narrow roads is difficult. A sanitary sewer with small diameter needs a steep slope leading to deep installation.
Cost Single installation reduces the cost. Two-line installation is costly, but only sanitary line installation is less costly compared with combined system.
Operation and maintenance
Deposition in sewer
Big diameter and mild slope cause deposition of solids. The deposited solids are flushed by wet weather flow.
Deposition in a sanitary line is less likely. A storm line situation is the same as a combined line.
Grit from surface
Grit inflow occurs, leading to wear of machinery and deposition.
There is little grit inflow for a sanitary sewer. A storm sewer has the same situation as a combined one.
Ease of inspection and cleaning
Big diameter is easy for inspection but difficult to clean.
Small diameter of a sanitary line is likely to clog, but easy to clean. A gutter for drainage tends to have much sedimentation.
Wrong connection
Not applicable. Supervision of plumbing is necessary. Inflow and infiltration problems are likely.
Pollution control
CSO CSO causes pollution. CSO control is necessary.
Sanitary sewer overflow can happen in wet weather.
Pollution by runoff
Initial runoff is accommodated in the sewer and sent to a WWTP by an interceptor. Additional runoff is discharged as part of CSO.
Storm water is discharged without treatment to waters.
Land use The gutter is removed after sewer installation, leading to widening of roads.
The gutter is likely to remain for the collection of storm water.

35Sewerage System: Planning Aspects
• The location and direction of the outfalls should be decided so that effluent flows away quickly given the current of receiving waters.
• Outfalls need to have a gate if a surge of receiving water level is expected or special measures are necessary to allow continual discharge from the outfall. CSO outfalls should have screens to reduce floatables entering the receiving waters.
3.2.4.4 Planned High Water Level
Planned high water level for sewerage should correspond to the planned high water level of the receiving waters or the highest water level on record. Based on the planned high water level, the hydraulic head and gradient are checked so that gravity drainage and pump drainage areas are discerned. Storm water and treated effluent need to be discharged smoothly in the event of planned high water level.
3.2.5 Data collection
3.2.5.1 natural Data
The important point of sewerage planning is to maximize the natural and existing capacities that help reduce the cost of new sewerage systems. Gravity flow is the principle of a sewer network as it reduces the installation and operational costs. Setting the trunk sewer route and locating pumping stations and WWTPs need to observe this principle as much as possible. For storm sewer planning, existing drainage channels should be utilized. These examples show why data collection and additional surveys on current natural and man-made conditions are important. Necessary data are shown by the following:
1. Geography and geology a. Geographical map b. Geological map, soil condition data, groundwater, and ground subsidence data 2. Hydrology a. Flow and water level of rivers, creeks, and channels in the planned area b. Longitudinal and cross sections of these areas c. Current of sea and lake 3. Weather a. Precipitation and flooding b. Temperature and wind direction at expected site for pumping stations and WWTPs
3.2.5.2 Relevant Plans
Relevant plans include a water supply plan for domestic and industrial uses, a development plan for industry and residence, and upper development plans. These plans need to be obtained and reviewed to decide the capacity and the location of a sewerage system. The specifics are shown as follows:
1. Long-term plans relating to sewerage planning 2. Urban plan a. Urbanization and greenbelt b. Zoning plan c. Plan for urban streets and highways d. Residential development and industrial development plans 3. River plan a. Planned longitudinal and cross sections b. Planned high water level and flow c. Planned low water level and flow d. Other river improvement plans
36 General Remarks of Lifeline Services
3.2.5.3 Generated and Allowable Pollutant Loads
In planning, the amount of current and future pollutant loads needs to be estimated together with allowable loads to the receiving waters. To do this, the following information is necessary:
1. Generated pollutant loads a. Current and future amounts of drinking water supply in its plan b. Current and future amounts of industrial water supply in its plan c. Population, industry sales output, manufacture, agriculture, and livestock d. Wastewater quantity and quality from major factories and commercial facilities 2. Allowable pollutant loads to receiving waters a. Current water quality and flow b. Environmental water quality standard, location of measurement, and low water flow c. Effluent permit 3. Use of water body a. Current and future water abstraction for tap b. Current and future fishery 4. Current and future plan for water use
3.2.5.4 existing Relevant infrastructures
The following facilities need to be surveyed as long as they are relevant:
1. Other underground utility lines 2. Existing sewerage facilities 3. Current situation of human waste disposal 4. Current highways and streets
3.2.5.5 Recycling and Use of Sewerage Asset
In the planning, recycling of energy, water, and sludge as well as open spaces for sewerage facilities needs to be studied. Other wastewater operators and solid waste disposal operators should be referred. The following are recyclable or usable assets:
1. Water reclamation 2. Sludge recycling 3. Footprint of WWTPs and pumping stations 4. Open space of sewer cross section 5. Heat of sanitary wastewater
3.2.5.6 others
If necessary, the following should be surveyed:
1. Cultural heritage and historic ruins 2. Earthquake, tsunami, seiche, storm surge, and tropical cyclone
3.2.6 treatment and Reclamation of Sanitary Wastewater
3.2.6.1 Planned Population
Planned population is the base for planned sanitary wastewater flow. Predictions are made for the total population and its distribution in the planned area in the target year.
1. Planned total population: At first, based on the past trend, prediction is made for the planned total population in the target year. Then, the figure is adjusted so that it fits the predictions made by
www.ebook3000.com

37Sewerage System: Planning Aspects
higher relevant authority predictions. Careful consideration is needed to avoid overestimation, especially in the area where major development for a housing complex is planned.
2. Distribution of population: Planned total population is distributed in the planned area corre-sponding to the land use plan and population density.
3. Daytime population: Planned population is the nighttime population or the number of registered residents. However, in big business and commercial districts, population inflow during the day-time is considerable. This influence is also considered in the planned sanitary wastewater flow. Therefore, planned daytime population needs to be estimated. Tourist places receive many sea-sonal and/or weekend visitors, and this population needs to be estimated in addition to residents.
3.2.6.2 Planned Sanitary Wastewater Flow
Planned sanitary wastewater includes domestic wastewater, commercial wastewater, industrial waste-water, tourism wastewater, groundwater, and other wastewater. By totaling the flow of each, planned daily average sanitary wastewater flow, planned daily maximum sanitary wastewater flow, and planned hourly maximum flow are estimated.
1. Domestic sanitary wastewater: Domestic wastewater is generated from ordinary households. Planned domestic sanitary wastewater is sanitary wastewater generated per person per day multi-plied by planned registered population.
2. Commercial wastewater: Planned commercial wastewater flow should refer to planned commer-cial water supply flow if it is clear. If not, planned commercial wastewater flow is calculated either from daytime population or from setting an incremental parameter for domestic wastewater by land use in zoning.
3. Industrial wastewater: Wastewater flow from existing major factories needs to be measured as this can influence the planning of WWTPs. Wastewater flow from minor planned factories is estimated by using industrial database or by multiplying the average flow per production output with actual production output by industry type.
4. Tourism wastewater: Tourism wastewater comes from tourist usage. Tourism wastewater flow should be calculated for daytrip and overnight tourists separately by multiplying the number of tourists with wastewater flow per tourist.
5. Other wastewater: Many touristic places often have hot springs. In general, it is necessary to study whether or not hot spring water should be treated as sanitary wastewater. The ways hot spring water is used need to be inspected for its acceptance. If used hot springs are accommodated into sanitary sewer lines, this needs to be added to the planned sanitary wastewater flow.
6. Groundwater: It is difficult to assess how much infiltration of groundwater into sanitary sewers occurs in dry weather when sewer lines are newly installed. When part of the sewer network is already in place, groundwater infiltration is estimated by subtracting metered water consumption flow from dry weather sanitary wastewater flow. Another way to estimate groundwater infiltration is by reference to similar sewer networks already in place like those of neighboring municipalities with similar sewer materials. If these methods are not feasible, 10%–20% of the total domestic and commercial sanitary wastewater is regarded as groundwater infiltration.
7. Planned daily maximum flow of sanitary wastewater: Planned daily maximum flow of sanitary wastewater is maximum daily flow out of 365 days in the target year. This flow is used to design WWTPs. Planned daily maximum flow of sanitary wastewater is daily maximum flow per per-son multiplied by planned population, plus industrial wastewater flow, groundwater flow, and other flows.
8. Planned daily average flow of sanitary wastewater in dry weather: Planned daily average flow of sanitary wastewater is the total amount of sanitary wastewater generated in the target year divided by 365 days. It is used for the prediction of tariff revenue. Planned daily average flow of sanitary wastewater is normally 70%–80% of planned daily maximum flow of sanitary wastewater.

38 General Remarks of Lifeline Services
9. Planned hourly maximum flow of sanitary wastewater: Planned hourly maximum flow of sanitary wastewater is a peak hour flow on the day when planned daily maximum flow of sanitary waste-water is expected. It is used to design sewers, pumping stations, and the pumps and channels in WWTPs. Planned hourly maximum flow is around 1.3–1.8 times as much as planned daily maxi-mum flow for medium to large sewer systems. The figure may reach more than twice the quantity in some small systems and systems receiving a lot of tourism wastewater.
10. Planned wet weather hourly maximum flow of sanitary wastewater in wet weather: For a combined sewer system, to reduce CSO pollution, planned wet weather hourly maximum flow of sanitary wastewater will be three times as much as that of dry weather and will be accommodated in inter-ceptor sewers.
11. Wet weather inflow and infiltration: For a separate sewer system, wet weather inflow and infiltra-tion to sanitary sewers may arise due to poor house sanitary sewers, keyhole of manhole cover, wrong connection of house storm drain, and raised groundwater level on rainfall events with a poor public sewer system. It is observed nationwide, but difficult to predict the flow in the plan-ning stage. Therefore, there is no need to take it into consideration in the plan.
3.2.6.3 Planned Pollutant Load
1. Pollutant load of domestic sanitary wastewater: Pollutant load of domestic sanitary wastewater is from human waste and gray water. The results of a survey on pollutant load per person per day are shown in Table 3.3.
2. Pollutant load of commercial sanitary wastewater: Pollutant load of commercial sanitary wastewa-ter differs with types of commerce and whether or not they have water reclamation within their property. Locally specific prediction is necessary. If it is difficult to make local predictions, the quality of commercial sanitary wastewater could be assumed to be the same as that of domestic sanitary wastewater.
3. Pollutant load of industrial sanitary wastewater: Basically, pollutant load of major industrial sani-tary wastewater should be surveyed. Pollutant load from minor factories and planned factories can be predicted by multiplying the average quality by factory type by the average discharge by factory type. The quality of discharge from factories with high concentration of pollutants should be assumed to be within a permit level by the use of pretreatment facilities.
4. Pollutant load of livestock sanitary wastewater: Cattle and pig barns generate much higher pol-lutant load compared with human-produced wastewater. This needs to be reflected in the plan appropriately.
5. Other pollutant loads: Other pollutant loads include those from human WWTPs, hospitals, laun-dry, solid waste incineration plants, and tourism facilities. These loads need to be reflected into the sewerage plan adequately.
3.2.6.4 Planned influent Quality and effluent Quality
Planned influent quality is planned daily influent pollutant load divided by planned daily average flow. Planned effluent quality needs to be set for biochemical oxygen demand (BOD), total nitrogen (TN), and
TABLE 3.3 Study Results on Pollutant Load (g/Person/Day)
Parameter Average
Breakdown
Human Waste Gray Water
Biochemical oxygen demand 58 18 40Chemical oxygen demand 27 10 17Suspended solids 45 20 25Total nitrogen 11 9 2Total phosphorus 1.3 0.9 0.4

39Sewerage System: Planning Aspects
total phosphorus (TP) by referring to the environmental quality standard of receiving water, which is technically achievable by treatment method, permit by law, and consistency with the upper plan.
3.2.6.5 Sewer Planning
Sewer planning must consider the following requirements:
• Gravity flow is the basis of a sewer network. In some geographies, pipe flow with either vacuum or pressure system may be feasible. The size of a separate sanitary sewer shall be decided to accom-modate the planned hourly maximum flow of sanitary wastewater. The size of a separate storm sewer shall be decided to accommodate the planned storm water flow.
• The interceptor of sanitary wastewater in a combined system shall be decided to accommodate the planned wet weather flow of sanitary wastewater.
• The position of the sewer shall be decided considering the geography, geology, width of roads, and the positions of other utility lines.
• The shape and slope at the cross section of the sewer shall have the velocity to avoid deposition and wear.
• The sewer shall have a structure with no exfiltration and infiltration.• The sewer shall be underground except for the open channel of the separate storm sewer and the
open channel to the outfall from WWTPs.• The sewer shall not be excessively deep while securing minimum allowable depth by the road
authority.• Inverted siphon shall be avoided except in inevitable cases.• Main roads accommodate other utility lines such as water and gas. Consultation with other utility
companies and the road authority shall be done while making cross section maps.
3.2.6.6 Pump Station Planning
Sanitary wastewater pumps include lift stations and final pumping at the WWTP. Lift stations are used to prevent the sewer from being too deep. Final pumps are placed in WWTPs to feed wastewater for the liquid treatment process. When storm water does not drain by gravity, storm water pumps should be planned. Storm water pumps should be able to drain planned storm water flow at planned high water level of the receiving water.
In a combined sewer system, sanitary wastewater pumping stations and storm water pumping sta-tions are located neighboring each other. The following items need to be kept in mind for planning:
• Pumping stations shall be located considering the factors of economy, ease of construction, ease of operation and maintenance, and impact to the surrounding environment.
• Sanitary wastewater pumps of a separate sewer system shall pump the planned hourly maximum flow.
• Sanitary wastewater pumps of a combined sewer system shall pump the planned wet weather sanitary wastewater flow.
• The electrical system shall be housed within a watertight chamber, with as much equipment and controls at maximum elevation as possible.
• The layout of pumping stations shall match the surrounding environment.• In case of a small capacity, when there is no need of grit removal, grinder pumps are used and
housed in the manholes.
3.2.6.7 Planning of a WWtP
Planning of a WWTP shall consider the following:
• Effluent permit• Location

40 General Remarks of Lifeline Services
• Site area• Planned sanitary wastewater flow• Ground level• Selection of treatment method• Harmonization with neighborhood
The liquid treatment method for the removal of organics is conventionally used for medium to large capacities with a population of over 10,000 and oxidation ditch for small capacities.
3.2.6.8 Water Reclamation
In case water reclamation is planned, its use and supply situations in target areas shall first be surveyed and then the necessary add-on treatment planned. If regulatory authorities set the permit for reclaimed water, it shall be met.
3.2.6.9 Advanced treatment
In case biological secondary treatment cannot meet the target effluent quality, advanced treatment shall be undertaken. Advanced treatment includes the internal mixed-liquor recycling process for nitrogen removal, the anaerobic–oxic (A/O) activated sludge process and the coagulant adding process for phos-phorus removal, and the A2/O process for the removal of both nitrogen and phosphorus.
3.2.7 Sludge treatment and Recycling
The sludge shall be treated and recycled as follows:
1. Planned sludge generation: Planned sludge generation shall be estimated from planned daily maximum sanitary wastewater flow, concentration of suspended solids, removal rate, and water content of sludge.
2. Treatment process: The sludge treatment process shall match a liquid treatment process, using recycling and a disposal method. An example of commonly taken pathways is shown in Figure 3.7.
3. Recycle use: Sludge is generated as long as wastewater treatment continues. The amount continues to increase with network expansion and continuation of liquid treatment. It is necessary to seek sustainable recycling methods.
3.2.8 Storm Water Drainage Planning
3.2.8.1 Planned Storm Water Flow
Planned storm water flow is calculated by the following formula:
Raw sludge Thickening Digestion Dewatering
Composting
Incineration/melting Constrictionmaterial
Fertilizer
FIGURE 3.7 Flowchart of sludge.

41Sewerage System: Planning Aspects
Q C I A= ⋅ ⋅ ⋅
1
360 (3.1)
whereQ is the planned maximum runoff flow (m3/s)C is the runoff ratioI is the rainfall intensity (mm/h)A is the drainage area (ha)
Ia
t bm n=+( )
wheret is the travel time (s)a, b, m, n are the statistically derived coefficients
3.2.8.2 Reduction of Runoff
The method to reduce runoff includes storage and infiltration as shown in Figure 3.8.
3.2.8.3 Storage tank and Sewer for Flood and cSo control
These structures are constructed to control urban flood and to regulate the amount of storm water entering the river channels through storm sewers or combined sewers so that river floods are prevented.
To reduce the CSO pollution, the first overflows from a gravity sewer line and the first discharges from the storm water pumps in a combined system are stored in a tank. After rainfall events, the stored combined wastewater is sent to WWTPs.
Reduction of runoff
Storage
Infiltration
Land use control
On-site
Off-site
ParkSchool playgroundOpen spaceParking lotIndividual housePublic land
Underground tankSewerPondOpen spaceFlood control greenery
CleanoutTrenchPavementGutterWell
FIGURE 3.8 Runoff reduction.

42 General Remarks of Lifeline Services
3.2.9 implementation Plan
3.2.9.1 efficient Planning
Construction of the main components in a sewerage system such as the trunk sewer line, pump-ing stations, and WWTPs shall follow a phased implementation plan to meet the actual inflow of wastewater while avoiding overcapacity. Equipment shall be selected not only by initial cost but also running cost. In the beginning of operation, special consideration should be given to little inflow of wastewater. Examples of considering factors for each component are shown in the follow-ing sections.
1. Sewer: A sewer cannot help being oversized in the initial stage when the network and the house connections are incomplete. The following actions might be feasible in some cases locally:
a. By dividing the planned flow into early flow and future expected flow, early flow is accom-modated in the first installed sewer, and the future flow will be accommodated in a second different sewer that will be installed at the time of construction of the new road. Installation of another sewer with the new road construction can lower the initial cost.
b. By connecting two neighboring treatment areas with an interceptor, one WWTP with a single trunk line can handle the wastewater generated from two planned treatment areas. After the increase of wastewater by the expanding network and collectors, another interceptor line and WWTP are constructed. The extra interceptor will be used for disaster management and a drying operational WWTP for rehabilitation work.
2. Pumping stations: Civil engineering structures should be constructed fully from the beginning even if the initially entering wastewater is relatively small. However, pumps can match the actual flow. The initial measures are as follows:
a. Use of submersible pumps may be economical. b. Manhole grinder pumps may be enough to delay the construction of pumping stations. 3. WWTPs: In the planning, the layout, the structures, and the required performance are set to meet
the planned wastewater flow in 20 years. On the other hand, projects are implemented phase by phase. In each phase or intermediate years, effective and efficient performance is required. In municipalities with declining population, a reduction of the initial investment may be needed. Some measures that could be taken are described as follows:
a. Prefabricated treatment system may be enough at the initial stage. b. Grit chamber, pump well, and first clarifier may be substituted with manhole grinder pump.
When the wastewater inflow increases, these facilities are constructed as planned. c. Pipe gallery can be delayed by ground or aerial installation. d. In the beginning, few operators are stationed. Operation building can be delayed. e. Chlorination tank can be delayed by the use of an outfall channel. 4. Types and Combinations of Pump Equipment: The types and combination of pump equipments
are as follows: a. The types and combinations of capacities shall match the rising trend of the inflow. b. The initially installed pumps are expected to reach their full capacities within a few years.
3.2.10 Use of Sewerage Resource and Space
3.2.10.1 Water Reclamation
Treated wastewater is a valuable water resource and this amount continues to grow as a sewerage sys-tem expands. Current use of treated wastewater in Japan is shown in Figure 3.9. For the use of treated wastewater, the quality permit is stipulated by application, and it is necessary to meet the requirement.

43Sewerage System: Planning Aspects
3.2.10.2 Sludge Recycling
Sludge generation continues to increase with sewerage expansion and the introduction of advanced treatment. The current recycling use of sludge in Japan is shown in Figure 3.10. In recycling, the follow-ing need to be considered:
• Effective and efficient use of material and energy in sludge• Matching supply and demand by securing customers• Education and advertisement on the recycled products for stakeholders
Landscaping27.2%
Recreational use 2.4%
River maintenance27.1%
Snow melting21.8%
Urban greeneryirrigation 0.1%
Agricultural irrigation8.7%
Supply to industrialwater supply system
0.9%
Supply to office 8.0%
Toilet flush 3.8%
FIGURE 3.9 Current use of treated wastewater in Japan.
Constructionmaterial
(except cement)486,806 kg
(28%)
Constructionmaterial(cement)
885,163 kg(50%)
Fuel57,473 kg
(3%)
Fertilizer341,558 kg
(19%)
FIGURE 3.10 Sludge recycling in Japan (2010).
44 General Remarks of Lifeline Services
3.2.10.3 Use of Sewerage Facility Space
1. Use of sewer cross section: A sewer network is connected to office buildings and individual houses. As wastewater runs by gravity, there is an open space inside the sewer. By installing a fiber-optic cable in the sewer, a reliable information network is made possible at relatively low cost. There are three uses of fiber-optic cables:
a. The sewer operator’s use for effective and efficient operation and maintenance of pumping stations and WWTPs by connecting one to the other
b. The local government’s use c. The ordinary citizen’s use 2. Use of open space of WWTPs and pumping stations: WWTPs and pumping stations are important
public assets in an urban area. The open space should be used wisely, for parks, sport fields, com-munity centers, and office buildings. When WWTPs and pumping stations are rehabilitated, the use of open space should be planned to enrich these facilities.
References
1. Japan Sewage Works Association (2008). The Sewerage Bluebook, Japan Sewage Works Association, Tokyo, Japan (in Japanese).
2. Sewerage Practitioners Research Group (2005). Practical Sewerage Planning for 21st Century, Sankaido, Tokyo, Japan (in Japanese).
3. Japan Sewage Works Association (2001). Guideline for Planning and Design of Sewerage System, Japan Sewage Works Association, Tokyo, Japan (in Japanese).

45
4.1 outline of natural Gas Distribution Systems
4.1.1 Description of natural Gas Distribution Systems
Natural gas (NG) is delivered to customers in Japan through pipelines by general gas suppliers in accor-dance with the Gas Business Act (GBA). Liquefied petroleum gas (LPG) is packed in gas cylinders after liquefying propane gas and butane gas, both containing hydrocarbon. A small portion of LPG has been vaporized and delivered to customers using pipelines; however, the LPG distribution system functions differently from the NG distribution system. NGs are produced at production factories and delivered to customers through pipelines, and this has been recognized as one of the most important lifelines in daily life. LPG is delivered only to customers who have registered gas cylinders; therefore, the NG dis-tribution system is widely used in areas where a gas pipeline has been constructed for customer delivery.
4.1.1.1 Gas Supply Businesses
The GBA classifies the gas supply business into four categories: a general gas supply business, a commu-nity gas supply business, a gas pipeline business, and a major gas supply business. A general gas supply business supplies gas using a pipeline besides the community gas supply. It delivers NG using pipelines to customers except in areas served by community gas suppliers. The number of general gas suppliers, the gas volume of sales, and the number of customers are listed in Table 4.1.
A community gas supply business delivers NG through pipelines to more than 70 customers from NG that is produced using a specified gas generator. The specified gas generator consists of containers and evaporation equipment consistent with the High Pressure Gas Safety Act and the Law on Integrity Issues and Rationalization of Dealings of Liquefied Petroleum Gas. The number of community gas sup-pliers, the clusters of customers, and the number of customers are presented in Table 4.2.
A gas pipeline business delivers NG to customers through gas pipelines in areas where gas sale has been licensed using long-distance transmission gas pipelines that are directly connected to power plants. A major gas supply business distributes NG to customers in areas where gas sale is licensed through their own gas pipelines or gas pipelines owned by other gas companies. Gas pipeline companies and major gas
4Natural Gas Distribution
System: Planning Aspects
4.1 Outline of Natural Gas Distribution Systems ................................45Description of Natural Gas Distribution Systems • Natural Gas Supply System • Principal Facilities of Natural Gas Distribution System
4.2 Planning and Management of Distribution System ......................54Planning of Distribution Systems • Operation of Supply System • Gas Supply Plan • Supply Control
References ........................................................................................................59
Nobuhisa SuzukiPIN Technologies
Hiroyuki HorikawaJFE Engineering Corporation

46 General Remarks of Lifeline Services
business suppliers were established to promote new entries to the gas supply business in accordance with the amendment of the GBA in 2003. Gas supply companies are increasing in number as shown in Table 4.3.
4.1.1.2 Gas Business Act
The GBA has been issued to develop and improve the following functions:
• Administration of gas supply businesses—GBA aims to protect the profit of customers and make substantial progress in the development of the gas supply business.
• Regulating construction, maintenance and operation of gas facilities, and production and sale of gas instruments—GBA secures public safety and prevents air pollution.
Companies planning to run a general gas supply business or a community gas supply business should receive permission from the Minister of Economy, Trade, and Industry, presenting the service area and the clusters of customers. Partial monopoly is permitted for a gas supplier, except if it is a major gas
TABLE 4.1 Circumstance of General Gas Suppliers in Japan
District
Number of SuppliersGas Volume of Sales
(×103 m3) at 41.8605 MJ/m3 Number of
Customers (×103) Private Public
Hokkaido 9 1 501,098 881Tohoku 31 6 506,277 878Kanto 75 18 16,863,808 13,594Tokai and Hokuriku 10 2 4,302,303 2,678Kinki 15 3 9,302,488 7,096Chugoku 31 2 920,893 980Shikoku 1 0 142,508 275Kyushu and Okinawa 28 1 1,222,387 1,759
Total 213 33,761,761 28,082
Source: Japan Gas Association, Natural Gas Volume of Sales in 2007, 2007, p. 4.
TABLE 4.2 Circumstance of Community Gas Suppliers in Japan
District Number of Suppliers Cluster of Customers Supply Areas (×103)
Hokkaido 61 384 136Tohoku 173 704 172Kanto 456 2224 562Tokai and Hokuriku 177 1003 250Kinki 231 1111 235Chugoku 164 684 156Shikoku 81 369 75Kyushu and Okinawa 294 1407 344
Total 1637 7886 1929
Source: Japan Gas Association, Handbook of Gas Business 2007, 2008, pp. 196–197.
TABLE 4.3 Circumstance of Gas Pipeline Companies and Major Gas Business Suppliers in Japan
Number of Suppliers Number of Major Gas Supply Business Suppliers
Gas pipeline companies 11 123Major gas business suppliers 17 67
Source: Japan Gas Association, Handbook of Gas Business 2007, 2008, p. 194.

47Natural Gas Distribution System: Planning Aspects
supplier, in the permitted service area where other gas companies are unable to supply. Gas pipeline businesses and major gas supply businesses are allowed to continue supply on notifying the Minister of Economy, Trade, and Industry.
The amendment of the GBA in 1999 relaxed the regulation and promoted new entries to the gas supply business and the license of sales of NG. Due to the relaxation of the regulation, anyone can run a large-scale gas supply business simply by notifying the Minister of Economy, Trade, and Industry without pre-senting any distribution areas. In the case that a major gas supplier has no gas pipeline to deliver to a new customer, a general gas supplier delivering NG to the neighboring area has to allow the major gas supplier to use their gas pipeline in order to avoid surplus investment and the overlap of gas pipelines in the area.
In a consignment gas supply system, a gas company having no gas pipeline in their own supply areas can commission a general gas supplier or a gas pipeline company that owns a gas pipeline within the area to supply gas to customers. A consignment gas supply system is called a connected consignment gas supply system when the pipeline is connected to another general gas supplier and it is called a retail sale consignment when the pipeline is connected to customers.
4.1.1.3 Raw Materials and compositions of natural Gas
Raw materials of NG delivered to customers are liquefied natural gas (LNG) imported from foreign coun-tries and NG produced in Japan. There are two main types of products in NG: one comprises coal gas, naphtha, and butane produced from coal and the other contains propane gas derived from petroleum-based materials. The composition of NG can be classified into seven groups depending on the weight, the heat capacity, and the capability of combustion. This classification is presented in Table 4.4 and Figure 4.1.
1. The Wobbe Index (WI) expresses the input gas calories to a gas appliance that is decided in terms of the heat capacity and the unit weight of gas.
2. Si expresses the burning velocity of each flammable gas component contained in gas and the val-ues are presented in Table 4.5.
3. fi is a coefficient related to each flammable gas component contained in gas and the values are presented in Table 4.5.
4. Ai indicates the volume fraction of each flammable gas component contained in gas. 5. K is a reduction factor derived by the following equation.
KCO N O
O
N O= ⋅
+ −−
+−−⋅
∑∑
A
A
i
i i( )
. .
.
.
.α
2 5 3 77
100 4 77
3 77
100 4 772 2 2
2
2 2
OO2
2⎛
⎝⎜
⎞
⎠⎟
⎧⎨⎪
⎩⎪
⎫⎬⎪
⎭⎪
6. αi is a correction factor of each flammable gas component contained in gas and the values are presented in Table 4.5.
7. CO2 expresses a volume fraction of the carbon dioxide contained in gas. 8. N2 is a volume fraction of the nitrogen contained in gas. 9. O2 is a volume fraction of the oxygen contained in gas.
TABLE 4.4 Wobbe Index and Number of Customers
Gas Group Wobbe Index (WI) Burning Velocity (MCP [cm/s]) Number of Customers (×103)
13A 52.7–57.8 35.0–47.0 26,66712A 49.2–53.8 34.0–47.0 7216A 24.5–28.2 34.0–45.0 87L1 (6B, 6C, 7C) 23.7–28.9 42.5–78.0 2825C 21.4–24.7 42.0–68.0 32L2 (5A, 5B, 5AN) 19.0–22.6 29.0–54.0 130L3 (4A, 4B, 4C) 16.2–18.6 35.0–64.0 111

48 General Remarks of Lifeline Services
Most 12A and 13A gases, which have a high WI, are made from raw materials based on NG. The raw materials of NG account for more than 90% of the raw materials of the town gas as presented in Table 4.6. The high percentage of the NG consumption is based on the fact that the CO2 emission of NG, mainly composed of methane during combustion, is less compared to that of other fossil fuels. Another reason can be that the NOx emission of NG is also less than of other fuels as NG contains almost no
Wob
be in
dex
(WI)
60
13A
12A
57
54
51
48
30
27
24
21
18
1530 40 50 60 70 80 90
Group L1
Group 5CGroup L2
Group L3
Burning velocity (MCP)
Group 6A
FIGURE 4.1 Flammability of gas group.
TABLE 4.5 Coefficients of Flammability
Si fi αi
Hydrogen (H) 282 1 1.33Carbon monoxide (CO) 100 0.781 1Methane (CH4) 36 8.72 2Ethane (C2H6) 41 16.6 4.55Ethylene (C2H4) 66 11 4Propane (C3H8) 41 24.6 4.55Propylene (C3H6) 47 21.8 4.55Butane (C4H10) 38 32.7 5.56Butene (C4H8) 47 28.5 4.55Other hydrocarbons 40 38.3 4.55
TABLE 4.6 Raw Material of Town Gas in 2006
Raw Material Production (×103 MJ) Ratio (%)
Petroleum 43,752,587 3.0Natural gas Domestic 93,778,611 6.4
LNG 1,321,480,165 90.6Total 1,459,011,363 100
Source: Japan Gas Association, Handbook of Gas Business 2006, 2007, p. 7.

49Natural Gas Distribution System: Planning Aspects
nitrogen component and is appropriate for combustion control. A comparison of the ecological balance of exhaust gas is presented in Table 4.7.
NG imported from foreign countries is liquefied at temperatures less than −162°C to decrease the volume by a factor of 1/600. NG mainly consists of methane gas; however, the components depend on the production site and therefore the combustion calories tends to vary over a wide range. The vaporized LNG is discharged from an LNG terminal to customers, and at that time NG is mixed with propane and butane gases (LPG) in order to adjust the combustion calories within a required range. In Japan, NG is mined in Hokkaido and Niigata, Chiba, Akita, and Fukushima prefectures, and some gas companies use the mined NG as their raw material.
While most gases consist of petroleum-based raw materials, the remaining consist of NG-based raw materials. As a gas production system can control the combustion calories of gas over a wide range, it is therefore possible to ensure that the gas made by the substitute natural gas (SNG) process is consistent with NG. There are no coal mines in Japan that do not produce gas.
4.1.2 natural Gas Supply System
4.1.2.1 Value chain from Gas Supply company to customers
A simplified flowchart of the value chain from production of town gas to final consumption at the cus-tomers’ end is presented in Figure 4.2 in terms of raw materials.
4.1.2.2 Gas Supply and transportation Systems
Domestic NG is transported to customers by high-pressure and middle-pressure pipelines after adjust-ing constituents and controlling the pressure of the gas. Gas produced from petroleum-based materials is also transported from factories to customers through gas pipelines. On the other hand, LNG is vapor-ized at the first receiving terminal and transported by gas pipelines to customers. These gas pipelines are operated at three pressure levels—low-pressure, middle-pressure, and high-pressure—depending on the function of the pipelines as illustrated in Figure 4.3.
The low-pressure distribution system is appropriate for delivering gas to a small cluster of custom-ers and is directly connected to these customers. The middle-pressure distribution system transports
TABLE 4.7 Ecological Balance of Exhaust Gas
CO2 NOx SOx
Liquefied natural gas (LNG) 60 40 0Petroleum 70 60 60Coal 100 100 100
Domestic natural gas
Production of natural gas
Convertion to town gas Energy supply
Production of town gas
Transporting by pipelines
Transporting by pipelines or tank
lorry
Transporting by pipelines
Development of gas field
Development of foreign gas field and LNG transporting
Procuring and transporting raw
material
LNG
Manufactured gas from petroleum
FIGURE 4.2 Value chain of town gas.

50 General Remarks of Lifeline Services
the gas at a pressure between 0.1 and 1.0 MPa and is controlled with a governor to connect to the low-pressure distribution system. This distribution system is adequate for transporting a large quantity of gas to many remote customers.
Large air-conditioning equipment installed in buildings and hospitals as well as gas engines and industrial boilers may require gas of middle pressure for their operation, in which case the gas is trans-ported from a production facility to the customers at the required pressure. This is called a middle-pressure straight distribution system. This system is divided into two systems: one is the middle-pressure A with an operating pressure of 0.3 MPa and higher and the other is the middle-pressure B with a pressure less than 0.3 MPa. These two systems operating at different pressures are connected with a governor.
The high-pressure gas distribution system supplies the gas at an operating pressure of 1.0 MPa and higher, which is pressure-reduced gradually with governors. This system is appropriate for delivering a large quantity of NG to many customers spread over a wide service area. The configuration of the gas distribution system is determined taking into account the quantity of gas demand, the number of cus-tomers, the extension of service area, the performance of manufacturing facilities, the future plan, and the balance of supply cost and supply stability.
When the first receiving terminal is located at a remote spot from customers and the construction of pipelines is difficult, a secondary receiving terminal is constructed closer to the customers. In this case, LNG is transported by tank trucks from the first receiving terminal to the secondary receiving terminal, where it is vaporized. The secondary receiving terminal tends to be located somewhere around the first receiving terminal and is therefore called an LNG satellite terminal. A schematic illustration of the gas distribution system from the satellite station is presented in Figure 4.4.
This distribution system is defined as the general gas supply business that supplies gas in a small city. LNG satellite terminals are increasing in number in accordance with the rapidly increasing demand of
Facilities ondomesticgas fields
Facilities for town gas producing Governor
stationGas
holderMajor
customersLocal
governor
Building
House
Low pressureMiddle pressureHigh pressureNatural gaspipelines
FIGURE 4.3 Schematic flow of domestic high-pressure gas supply.
LNG satellite station
LNG tank Vaporizer
Customers
Customers
Customers
Customers Customers
Pipeline
Tank lorry transporting
FIGURE 4.4 Schematic flow of gas supply from LNG satellite.

51Natural Gas Distribution System: Planning Aspects
gas outside the service areas. In the case where an LNG tank truck is not suitable for the transportation of LNG, an LNG ship can be an alternative to transport LNG to the secondary receiving terminal near the supply area where the LNG is vaporized. On-site LNG supply systems are also increasing in number for transportation to licensed industrial customers. In this case, LNG is transported by an LNG tank truck from the first receiving terminal to a small LNG tank and an evaporator provided by the custom-ers on their premises.
4.1.3 Principal Facilities of natural Gas Distribution System
4.1.3.1 Gas Production Facilities
The gas production system consists of a well through which NG is conducted from an underground basin, an evaporator that vaporizes imported LNG, and equipment to control the constituents and the pressure of the gas. The NG in the ground contains impurities like water and oily condensate. Therefore the impurities are removed by controlling the temperature and the pressure as presented in Figure 4.5. When a domestic NG supplier delivers to a general gas supplier, the gas usually has an odor added at the supply points.
A schematic illustration of the production process of gas is presented in Figure 4.6, which shows how the gas is chilled to lower than −162°C to liquefy it and produce LNG in foreign countries and how the LNG is evaporated in the first receiving terminal in Japan. Two significant concerns are presented in the figure: one is the vaporization of LNG by controlling the heat input and the other is the pressure fluctuation induced by vaporized dense fog. Impurities like water, oil, and nitrogen are removed dur-ing the production process of LNG, and the first receiving terminal has to control the heat input of the vaporized gas and add odor to the gas.
In the gas production process, a gas mixture of hydrogen, methane, and carbon dioxide is produced from petroleum raw materials by adding vapor, oxygen, and hydrogen to LNG and naphtha using a cata-lyst. The production process of the reformed gas is presented in Figure 4.7 and a part of the flow of the middle- and high-pressure gas-producing facilities is also presented in Figure 4.8. Various advanced gas production processes enable us to produce various gases. A key issue of the gas production process is the evaporation system, where raw materials are introduced to undergo a thermal process. A classification of gas generation is presented in Table 4.8.
Wellhead equipment
Cooler
Cooling system
Gas well
Gas reservoir
High-pressureseparator
Condensate
Condensate
Gas
Gas
Impurity removing
facility
Impurities (CO2, etc.)Cooling system
Low-pressureseparator
Separated water Steam
decom-pression
facility
Injection to reservoir after separation process
Low-pressure separator
Condensate
To condensate tank
To gas pipeline
FIGURE 4.5 Typical process of natural gas production plant.

52 General Remarks of Lifeline Services
4.1.3.2 Gas Distribution System
The gas supply facility consists of pipelines and subsidiary equipment that transport gas from a produc-tion facility to customers. The pressure within the gas pipelines decreases with increasing transporting distance due to loss by friction. Therefore, the gas company should monitor the operating pressure of the pipelines and see that the gas pressure is higher than that required to ensure normal combustion in gas appliances. In order to distribute gas through an extensive network of pipelines, a high-pressure pipeline is used to send gas from a production facility that is gradually depressurized before reaching
Unloading armLNG storage tank (aboveground)
LNG carrier
LNG storage tank underground
LPG storage tank (spherical)
LPG pump
LPG vaporizer
LNG pumpLNG vaporizer
BOG compressor
Calorie adjustment
Odorization
To pipeline
FIGURE 4.6 Typical process of primary LNG-unloading facility.
Naphtha tank
Naphtha purge
LPG lorry
Pump
Pump
Scrubber
Compression Calorie adjustment
facility
Gas holder
LPG, etc. Odorization
To pipeline
Gasholder
LPG tank Medium- or high- pressure gas
generator
Low-pressure gasification facility
FIGURE 4.7 Typical flow of gas-reforming process.
Naphtha orrecycledLPG gas
FuelSteam
Hea
ting
furn
ace
Prim
ary d
esul
furiz
er
Seco
ndar
y des
ulfu
rizer
Refo
rmin
g fu
rnac
e
Steam drum
Waste heat boiler
CO re
form
er
Heat exchanger
Produced gas
FIGURE 4.8 Typical flow of medium/high-pressure gas generator.

53Natural Gas Distribution System: Planning Aspects
the customers. The lengths of the pipelines owned by the general gas supplier, classified with respect to the operating pressure, are presented in Table 4.9.
The subsidiary facilities of the gas pipeline are as follows:
• A governor to control depressurization• A compressor for pressure recovery of long-distance pipelines• A gasholder to effectively level the daily demand and improve efficiency of the production and
supply facilities
A governor is a self-driven pressure control valve that maintains the secondary pressure at a constant. The governor has three systems: the direct drive, the pilot, and the axial flow. The gasholder has the fol-lowing functions, and the site of installation and capacity are decided depending on the function:
1. To secure the required supply performance by replenishing the demand shortage during peak time
2. To maximize the transportation efficiency of pipelines between a production facility and a gasholder
3. To ensure continuous supply during a temporary blackout and to oversee the construction of the production and supply facilities
4.1.3.3 Gas Appliances
Gas appliances are provided for residential, business, and industrial use. The classification of appli-ances is presented in Table 4.10. The gas cogeneration system (GCS) presented in the table supplies electricity and exhausted heat simultaneously and is therefore called the thermoelectric service. The GCS is superior to other systems using electric power generated at a thermal power plant because the GCS effectively uses lost energy from cooling heat and that induced by electric transmission. In addition to conventional generators such as gas engines and gas turbines, a new type of GCS that runs on a fuel
TABLE 4.8 Typical Classification of Gas Generation
Operating Pressure
Material Insertion Heating Gasification
Manufactured Gas Calories (MJ/N m3)
Low Cyclic Regenerative heating
Reformation process of moisture
~12
Middle or high
Continuous Regenerative heating
Partial combustion process ~8
External heating
Reformation process of moisture
High temperature
~12
Medium temperature
~19
Low temperature
~27
Self-heating SNG process ~38
TABLE 4.9 Pipeline Length of General Gas Suppliers in Japan, 2005
Pressure Length (m)
High pressure 1.0 MPa ≤ P 1,767,904Middle pressure 0.1 MPa ≤ P < 1.0 MPa 30,194,582Low pressure P < 0.1 MPa 199,899,209
Total 231,851,695

54 General Remarks of Lifeline Services
cell has been recently developed. The fuel cell is driven by an electrochemical reaction of oxygen reform-ing hydrocarbon in NG and hydrogen in the air. The new GCS can be used at home.
4.2 Planning and Management of Distribution Systems
4.2.1 Planning of Distribution System
Planning a gas supply system is required for updating an existing gas supply system, to renew old equip-ment based on the predicted increase of gas supply, and to expand the distribution area. The gas supplier will be able to deliver the gas to the customers at a stable pressure after implementing the construction scheme [4].
4.2.1.1 Prediction of Future Demand
The prediction of future demand is made considering a long-term fiscal sales plan and a user-wise sales plan. It is necessary to notify each distribution area about the local future demand as business informa-tion and improve the accuracy of the prediction of future demand in every distribution area.
4.2.1.2 Planned Supply equipment
The planned supply equipment is a general term representing the following equipment and facilities necessary to supply NG to customers:
1. A production facility that vaporizes the LNG to produce the raw material of town gas 2. A receiving facility that charges vaporized gas transmitted from other gas companies 3. A regulating facility like a governor station that depressurizes gas to the required pressure 4. A gasholder that stores and sends out gas 5. A gas pipeline that transports gas from a producing facility to the customers
Planning of the supply facilities can be classified into two functions [4]. One will reinforce and renew facilities to continue a stable gas supply using the existing gas supply facilities. Another will construct a new facility in the area where no supply facility exists. The supply facility will be planned to manage the fluctuation of long-term gas demand based on the prediction of future gas demand. The planning of pipeline construction will take into account the prediction of long-term demand increase of gas due to the difficulty of replacing pipelines [4]. A network gas-flow analysis system will be used for the plan-ning of gas supply facilities, especially to simulate sufficiency and lack of supply performance of the system. The network gas-flow analysis system will be utilized to build a sufficient distribution system for the future.
TABLE 4.10 Gas-Consuming Appliances
Use Category Examples
Household use Cooking Cooking stove, rice cooker, ovenHot water Water heater, floor heatingHeater Stove, fan heaterOthers Cloth drier
Industrial use Cooking Cooking stove, oven, fryerHot water Water heater and boilerBoiler Steam generatorOthers Furnace, gas producerAir conditioner Gas heat pump
Others Cogeneration Gas turbine, gas engine, fuel cellDistrict level air-conditioning, compressed natural gas facility

55Natural Gas Distribution System: Planning Aspects
4.2.2 operation of Supply System
Pipeline operation comprises taking gas from a production facility and delivering it to customers by controlling the pressure using governors. The starting point of the typical supply system in Japan is the vaporizer of the imported LNG. The gas vaporized at a production facility is transported by a high-pressure gas pipeline to a governor in a main supply station.
The NG transported by high-pressure gas pipeline is depressurized to middle pressure A at a governor station for use in power stations and industries. The NG is further depressurized by the middle-pressure A governor to middle pressure B for delivery to air conditioners and business offices. The NG depressur-ized by the middle-pressure B governor will be distributed to customers by pipeline networks. There are many gas companies that store gas in a gasholder within a pipeline network at middle pressure A and send gas after depressurizing to middle pressure B.
4.2.2.1 operation of a Production Facility
Flow-control and pressure-control gas vaporizers are used in a gas production system. The flow-control system keeps the flow rate of vaporized gas constant, and the pressure-control system maintains the delivery pressure of vaporized gas at a constant. The operation management of the flow-control system is simple because a certain quantity of gas is sent independent of the fluctuation of downstream demand. However, in order to maintain the pressure in the downstream pipeline within the operation criteria, the pipeline pressure is controlled.
On the other hand, the operation of the pressure-control system is complicated. Here it is required to control the vaporizer frequently to adjust the pressure, taking into account the fluctuation of midnight demand when there is an extreme drop in demand. The received gas quantity is almost equal to the dis-charged gas quantity; therefore, the fluctuation of gas pressure downstream will be very small and con-trolling the pressure becomes easy. The companies distributing gas from multiple production facilities run an effective production and supply system combining the different control systems of a vaporizer.
4.2.2.2 operation of Gasholders
A gasholder is an important facility that balances the supply demand and the quantity of production and has the following functions:
1. A gasholder replenishes the gas when the demand exceeds the supply capacity in order to supply gas in a constant and stable manner.
2. A gasholder stores the surplus gas when the gas demand falls below the gas supply. 3. A gasholder constructed near a supply area but remote from the gas production site ensures addi-
tional supply capacity to the pipelines during the peak time of gas demand. 4. A gasholder is able to ensure the stability and continuity of gas supply by replenishing the stored
gas in case of power failure in a production facility or any fatal damage to pipelines.
Gas use in air conditioners and generators has been increasing in recent years, and the daily change in gas demand in the summer season is similar to that of electricity.
4.2.2.3 operation of Remote Monitoring and Remote control System
The remote monitoring and remote control system is used to control the pressure in a large-scale gas distribution system, which monitors its own operating conditions such as the discharge quantity and the gas pressure at a production facility, the storage volume of gasholders, and the flow quantity and pressure in gas pipelines using an original radio network and/or a commercial telecommunication system.
The monitoring and data acquisition system for the entire gas production and gas supply systems is indispensable for the gas supply companies as well as other lifeline services. This sophisticated system is called supervisory control and data acquisition (SCADA).

56 General Remarks of Lifeline Services
Now, an extensive gas supply system can be constructed where the production facilities and custom-ers are spread over a wide area and are connected with long-distance pipelines. The supply system is operated by controlling multiple gas pressures simultaneously for which a remote monitoring system is required. The operation of a gas supply system requires remote control of pressure valves at governor stations, for storage in, and discharge from gasholders.
It is strongly recommended to prepare a backup supervising system in case of malfunction of the remote monitoring and the remote control system. The backup system should be constructed at a remote site from the main system to avoid simultaneous damage in case of a massive earthquake. The backup system should also be maintained so that it can be put to work at any time in an emergency.
4.2.3 Gas Supply Plan
The quantity of gas supply tends to fluctuate due to effects of air temperature, water temperature, weather, operating conditions of industrial customers and electric companies, and long holidays such as the New Year.
The gas supply plan consists of an annual plan, a monthly plan, and a daily plan:
1. The annual supply plan is prepared considering the annual gas volume of sales plans, the annual and monthly sales plans of industrial customers and electric companies, the temperature, and the special periods of long holidays.
2. The monthly supply plan includes the hourly supply plan of gas based on the latest monthly con-struction plan and the actual supply data.
3. The daily supply plan forecasts the amount of gas supply taking into account the temperature, the water temperature, and the working plans of industrial consumers and electric companies.
The annual supply scheme, which considers the annual supply volume of the sales plan, is used to pre-pare for the total amount of production and to discuss planned construction programs for the year. The monthly gas supply program, which takes into account a large-scale construction plan of high-pressure pipelines and gasholders, is used to plan the hourly production schedule of a production facility and to prepare guidelines of the monthly production and supply control. A daily supply program is planned based on a regression formula derived from the temperature, the water temperature, and the operation plans of industrial customers and electric companies.
The volume of gas supply generally depends on the temperature: the volume increases with falling tem-perature and decreases with rising temperature. However, the general trend of gas supply has changed remarkably; as the gas demand of air conditioners and power-generating systems increases when the temperature becomes higher than the critical temperature, the gas supply volume also increases. The supply volume to industrial customers and electric companies is increasing as their gas demand tends to be independent of the temperature change. In order to improve accuracy of the daily supply plan, it is required to gather basic data with respect to the operating situations of industrial customers and electric companies, as well as the total supply volume of the day.
4.2.4 Supply control
The role of supply control is to maintain a stable supply of gas to the customers operating produc-tion facilities, gasholders, and governor stations taking into account the prediction of fluctuating gas demand [4].
4.2.4.1 Pressure control
The gas pressure is determined based on the design pressure of supply facilities, the maximum and minimum gas pressures, and the required pressure for equipments of customers. The fluctuation in

57Natural Gas Distribution System: Planning Aspects
the gas supply pressure should be low, and the gas supply pressure should be stable in order to main-tain the requested pressure range. A sophisticated pressure-control system presented in Figure 4.9 is employed at the end of the pipeline in recent years due to the high-pressure requirement of gas appliances.
4.2.4.2 Volume control of Gas Production
The volume control of gas production presents the hourly gas demand based on the daily gas demand taking into account the current supply capabilities of production facilities, gasholders, and governor stations. To control the hourly production volume at all gas production facilities, as presented in Figure 4.10, the following points should be considered:
1. Prediction of daily supply volume 2. Prediction of hourly supply volume 3. Planning of the quantity of discharge and storage at gasholders 4. Planning gas pressure for discharge of supply facilities such as a governor station
4.2.4.3 control of the Supply System
A thorough hourly monitoring of the supply system’s operation is required to control the supply facili-ties that maintain the pressure within the required pressure range and assess the supply capacity of the facility with respect to the planned volume of gas supply. The planned volume of gas supply will vary depending on the temperature, the water temperature, the weather, and the operating conditions of industrial consumers and power-generating companies. Therefore, appropriate monitoring of the pressure and flow rate and quick assessment are essential in order to control the gas pressure within the required pressure range. Smooth operation of supply equipment is one of the most important functions to ensure a stable gas supply.
4.2.4.4 emergency control
Emergency actions should be taken quickly even against very rare disasters and accidents in order to ensure a stable gas supply. Emergency actions that are taken immediately after a disaster or accident will depend on the level of damage and its effect on the supply system:
FIGURE 4.9 Supply control center.

58 General Remarks of Lifeline Services
1. In case of an emergency shutdown of the production facilities, the stored gas in the gasholders will be discharged immediately.
2. Backup discharge of gas from entire factories including other backup discharge from extra facili-ties will be implemented.
3. Temporary gas supply from other possible gas companies connected to the damaged areas will be arranged.
4.2.4.5 Analysis of Pipeline network
An analysis of the pipeline network is necessary for managing the following supply operations [4]:
• Prediction of the transportation capacity and the supply performance• Judgment to construct an additional supply system for a new customer• Judgment to abandon and update the supply facilities• Improvement of a supply system in an area with a lack of supply
A static analysis (steady-state analysis) and a dynamic analysis (non-steady-state analysis) are used in the pipeline network analysis. The steady-state analysis is used to calculate the quantity of the flow and the pressure in the pipelines assuming the equality of the intake volume and the discharge volume of gas. This is an easy method; however, it tends to underestimate the pressure of the pipelines where the total gas volume is not taken into account [4].
Actually, the gas demand in the pipeline network may vary; therefore, the intake volume may be different from the discharge volume. The non-steady-state analysis will give a time-dependent solu-tion in terms of the pressure and the flow in the pipelines. This analysis is able to simulate the actual gas flow to simulate the behavior of long-distance gas pipelines with high accuracy; however, it is complicated.
0
35
70
105
140
175
210
245
280
315
350
0
50
100
150
200
250
300
350
400
450
500
0 1 2 3 4 5 6 7 8 9 10 11 12 13 14 15 16 17 18 19 20 21 22 23 24
Tota
l pro
duct
ion
volu
me (
×104
m3 )
Tota
l sup
ply v
olum
e (×1
04 m
3 )
Tota
l sto
rage
of h
olde
rs (×
104 m
3 )
Time (H)
Total storage of holdersTotal production volumeTotal supply volume
FIGURE 4.10 Control of gas production.

59Natural Gas Distribution System: Planning Aspects
References
1. Japan Gas Association. Natural Gas Volume of Sales in 2007, JGA Publishing, Tokyo, Japan, 2007, p. 4. 2. Japan Gas Association. Bulletin of Gas Business 2007, JGA Publishing, Tokyo, Japan, 2008, p. 7. 3. Japan Gas Association. Handbook of Gas Business 2007, JGA Publishing, Tokyo, Japan, 2008, pp. 194,
196–197. 4. Japan Gas Association. Summary of town gas industry—Volume of Gas Supply, JGA Publishing,
Tokyo, Japan, 2003, pp. 3–30.


61
5.1 Design and construction of an electric Power System
5.1.1 necessary network for a Stable operation of an electric Power System
The electric power system is divided into two systems by the network shape. Figure 5.1 shows the radial and loop types of network of an electric power system in Japan.
5.1.1.1 Radial System
Figure 5.1a shows a radial type of electric power system, which consists of radially connected compo-nents including the power plant, the substation, and the transmission lines. Because the composition of the radial system is simple, it is easy for the system operators to control the power flow. As a result, when an accident occurs in a radial system, it is easy to isolate the damaged components in the whole system to localize the effect of the damage. On the other hand, when a route cutoff accident (route fault accident) occurs in the loop system, it may be difficult to prevent power failure because of less redun-dancy in the system.
5.1.1.2 Loop System
Figure 5.1b shows a loop type of an electric power system, in which power plants are connected with transmission lines in a loop system. This system can supply power to customers even if a route fault accident occurs within it. On the other hand, compared with a radial system, the damage effect (power failure) easily spreads to other parts of the system because it is more difficult to control the power flow in a damaged system.
Besides these two systems, there is a grid type of electric power system (also termed a mesh type of system), which is connected by a large-scale of power grid. The grid system is often adopted in the United States and Europe. Though this system can supply power even if two or more accidents includ-ing a route fault accident occur within the system. There is a high risk potential against a massive power failure (a cascading accident) due to a system accident.
5Electric Power System:
Network and Components
5.1 Design and Construction of an Electric Power System ................61Necessary Network for a Stable Operation of an Electric Power System • Contents of Electric Power System Construction
5.2 Components of Electric Power Transmission and Distribution System ............................................................................64
References ........................................................................................................65
Keizo OhtomoCentral Research Institute of Electric Power Industry
Yoshiharu ShumutaCentral Research Institute of Electric Power Industry

62 General Remarks of Lifeline Services
5.1.2 contents of electric Power System construction
5.1.2.1 Basic idea of the network Design of electric Power transmission System
The electric power system is divided into two parts: transmission and distribution. The transmission system consists of transmission lines, substation, switching station, and AC/DC converter station. When a transmission system or a transmission line is constructed, it is necessary to precisely examine and discuss the effect that the construction will have in the long term. Because the transmission system is affected by the power generation method and capacity of the connected power plants, it sometimes takes longer to construct than a power plant, and will be an important element of the infrastructure in the local community for a long term. In general, the transmission system is divided into primary and secondary systems. The primary system is constructed based on an independent concept of each local power company. Figure 5.2 shows a basic flow chart of construction planning for a primary system. The purpose of an electric power system is to transfer electric power from power generators to customers. The electric power system is located within a wide area, which is exposed to various natural hazards including lightning, and component accidents, so it is the essential issue to always maintain a stable synchronized operation of some power plants. During severe circumstances, the system must be able to keep a stable power voltage level and frequency of electric power flow. Maintaining a reliable power system is a very important issue in power system design and operation.
5.1.2.2 evaluation Method of electric Supply Reliability
In order to evaluate the reliability of an electric supply, we have to consider two aspects: the demand side and the supply side. As for the demand side—power customers—the frequency and duration of power outage are very important issues in the evaluation of electric supply reliability. As for the supply side—electric power company—the supply power boundary and supply power capability of the components, as well as the causes of physical accident and power outage are key points for evaluating the reliability of the electric power supply.
In general, the reliability of the power supply is often represented by two indices: adequacy and secu-rity. The adequacy index relates to a supply power capability of power facilities within the system to sat-isfy customer demand. This index tries to evaluate the facilities necessary to generate sufficient energy and the associated transmission and distribution facilities required to transport the energy to the actual customer [1]. The security index, on the other hand, relates to the ability of the system to respond to disturbances arising in the system, such as dynamic, transient, or voltage instability situations. The primary system in Japan attaches importance to the security level. In other words, the adequacy and security indices indicate static and dynamic reliability levels of an electric power system, respectively.
Power plant
G G G G
Power plant
Tra
nsm
issio
n lin
e
Transmission line
Tra
nsm
issio
n lin
e
Substation(a) (b)
Substation
FIGURE 5.1 Typical network types of electric power system: (a) radial system and (b) loop system.

63Electric Power System: Network and Components
In order to secure supply reliability, an electric power system designer has to consider both reliability levels. However, in the planning stage, it is important to secure an appropriate adequacy level.
5.1.2.3 Reliability criteria
It is difficult to completely prevent power outage of an electric power system against natural disaster including lightning. Thus, an electric power system has some reliability criteria against component acci-dents including the N-1 and N-2 component accidents. The N-1 accident indicates a single accident in the total number of components N within a target power system. The electric power system council of Japan [2] provides system reliability criteria for a normal condition without accidents and an abnormal condition with accidents as follows:Normal condition without accidents
1. The electric current must not exceed the capacity of equipment. 2. The voltage level must be maintained appropriately. 3. The power generators can be stably operated.
N-1 accident
1. No supply power failure occurs.
N-2 accident
1. A part of power supply dropout and power failure are accepted. (However, when the power fail-ure has the potential to cause a serious social impact, appropriate countermeasures should be considered.)
Long-term plan (20–30 years)• Power supply constitution• Basic concept of system construc-
tion• Technology development policy
Long-term plan (10–15 years)• Concrete development• Cost reduction policy
Individual plan (several–15 years)• Securing of site, occupation of the
utility tunnel• Power plant, substation, and
transmission line
Facility construction• Cost reduction policy
FIGURE 5.2 Flowchart of a design plan for an electric power system.

64 General Remarks of Lifeline Services
5.2 components of electric Power transmission and Distribution System
The electric power transmission and distribution system consists of transmission lines, substation, and distribution equipment (Figure 5.3). The primary function of the transmission facility is to effectively transfer high-voltage power from power plants to all substations. For example, the Tokyo Electric Power Company (TEPCO) has already installed transmission facilities with 66–500 kV voltage levels. High-voltage transmission facilities with 275–500 kV are used for transporting electric current in large quan-tities to long distances. The voltage level of the electric current gradually lowers to 154, 66 and finally 6.6 kV as it approaches customers. In the current situation in Japan, the highest voltage level of the actually operated transmission facilities is 500 kV, though TEPCO has also installed the 1000 kV trans-mission facilities for future needs.
In urban areas, though the construction cost of underground facilities is more expensive than that of overhead facilities, underground high-voltage transmission facilities with 500 and 275 kV are often constructed from the viewpoint of the effective land use. In high-density residential areas and in urban areas where it is difficult to construct overhead facilities, underground transmission facilities with higher voltage level gradually increase to reduce the transmission loss of electricity.
Because an increase in voltage level causes a decrease in the transmission loss of electricity, electric-ity is usually transferred at high voltage from power plants to substations located near a consumer area.
On the other hand, the purpose of substations is to distribute electricity to customers and to isolate a damaged part in a system without causing power outage. TEPCO has already installed the various substations with 500, 275, 154, and 66 kV voltage levels. These substations are functioning as a control center of electricity.
The utility frequency in east Japan is 50 Hz, while that in west Japan is 60 Hz. Therefore, it is necessary to convert the frequency to transfer electric power between east and the west Japan. Three frequency converter facilities are in place to convert the frequency: Shin-Sinano substation (600 MW capacity), Sakuma converter station (300 MW), and Higashi-Shimizu converter station (300 MW). The power interchange consists of an economic power interchange, which mitigates the supply cost, and the emer-gency interchange in a system accident. The power interchange is effective in maintaining a stable power supply in Japan.
Hydro power plant
Nuclear power plant
Thermal power plant
Factory
Und
ergr
ound
ca
ble
Pole
tran
sform
er
Building
Amuse-ment
Residential house, shopRailway
Substation
FIGURE 5.3 Conceptual figure of an electric power flow from generation to consumption.

65Electric Power System: Network and Components
The purpose of a distribution facility is to transfer the electricity from a substation to customers. A distribution facility consists of overhead and underground facilities with 22 kV, 6.6 kV, 200 V, and 100 V voltage levels. It also consists of a transformer for changing the voltage level, service lines for transporting the electricity from the distribution line to the customer, and watt-hour meters for mea-suring power consumption.
References
1. CIGRE SC-38 WG-03. Power System Reliability Analysis, Application Guide, 1987. 2. Electric power system council of Japan. Rule of Electric Power System Council of Japan revision
No.33, 2014, http://www.escj.or.jp/making_rule/guideline/data/rule_japan140617.pdf.


67
6.1 overview of information and communication Systems
6.1.1 current Status of information and communication Services
According to the White Paper on Information and Communications in Japan [1], the information and communication industry is a term that encompasses three lines of business: telecommunications, broadcasting, and postal correspondence. This chapter chiefly discusses telecommunications business from an urban lifeline point of view, but given that telecommunications using metallic cables is now giv-ing way to optical communication using optical fibers and wireless communication using electromag-netic waves as the mainstream technologies, its discussion will be confined to the field of information and communication [2].
6.1.1.1 Fixed communication
6.1.1.1.1 Fixed PhonesWhen Nippon Telegraph and Telephone Corporation (NTT) was founded in 1952 under its original name Nippon Telegraph and Telephone Public Corporation (NTTPC), it could take at least a year to get a phone line installed after submitting an application. In some areas, it took several years. Demand for phones continued to increase nationwide, and by the end of 1970, phones had been installed in 29.1 million households. Thereafter, the demand gradually decreased, so by the end of 1978, it was possible to have a new phone line installed almost immediately after submitting an application. The telephone has not only contributed to the advanced growth of Japan’s economy and society and the improvement of people’s lifestyles but has also played a major role as a means of communication with people all over the world.
However, the telephone is in a state of transformation. In the past, it was associated with technolo-gies and services based on human speech and listening. But as progress is made in the development of
6Telecommunication
System: Network and Components
6.1 Overview of Information and Communication Systems .............67Current Status of Information and Communication Services • Information and Communication Services in the Future
6.2 Plans and Future Image of Information and Communication Networks ................................................................72Overview of Communication Networks • Telecommunication Networks • Integrated Services Digital Network • IP Network • Next-Generation Networks (NWGN and NGN)
References ........................................................................................................84
Takanobu SuzukiToyo University
Fumihide SuginoNTT Access Network Service Systems Laboratories
Katsumi SakakiNTT Access Network Service Systems Laboratories

68 General Remarks of Lifeline Services
an information society where all sorts of information is transmitted, processed, and stored, the field of information and communication has grown to include not only telephones but also multimedia network. In recent years, conventional phones have started to support IP phone services based on the Internet Protocol (IP), and there is a growing demand for such services, particularly when bundled with broadband Internet services.
6.1.1.1.2 FacsimileFacsimile communication is a recording communication method whereby static images such as text, drawings, or photos are transmitted by converting them into electrical signals that are reproduced as hard copies of the original images at the receiving end. The basic principle of this technology is not new—phototelegraphy apparatus had been implemented by Bell Laboratories as far back as 1925. However, it was only used in limited situations such as newsrooms and financial institutions for many years because of its expensive and complex terminal, its slow transmission speeds, and high commu-nication cost.
The development of image compression techniques and faster modems (modulator/demodulator devices) had the market of facsimile expand to home use. The G3 facsimile system, which is currently the mainstream for home use, uses a Modified READ (MR) system that was jointly proposed by NTT and Kokusai Denshin Denwa Corporation (KDD) in 1979 and adopted as an international standard. Compared with the conventional method, it made it possible to compress images by an additional 40%. Modems also became faster, with the initial standard of 4.8 kbps increasing to 7.2, 9.6, 14.4, and 28.8 kbps in successive ITU-T recommendations. With this influx of technology, the first home fac-simile machine went on sale in 1991, after which the home user market expanded.
6.1.1.2 Pay Phones
Pay phones are public telephones that are made available for use by the general public. In the early days of the telephone business, telephone receivers were themselves very expensive and beyond the means of ordinary people. Telephones were therefore made available to people who needed to use them, and this was the origin of pay phones. In recent years, the rapid spread of mobile phones has led to a decline in the use of pay phones, which are gradually decreasing in number each year.
6.1.1.3 Mobile communication
The number of fixed phone users in Japan peaked at 61 millions in March 1996 and has since been declining gradually. On the other hand, the users of mobile phones and other mobile communication services have grown rapidly (exceeding 110 million in March 2009), so we are now living in an age when everyone has their own telephone. This change has occurred not only because mobile phones are conveniently portable, but also because users can choose desirable mobile devices supplied by various manufactures and network providers and affordable communication tariffs through increased competi-tion and technological advances. In the future, there will probably be further developments of seam-less personal communication services that exploit the portable characteristics of wireless technology. Figure 6.1 shows the configuration of a mobile network.
6.1.1.4 Mobile Satellite communication
A mobile satellite communication system is a system that communicates via a communication satel-lite from satellite mobile phone devices or base stations installed in moving vehicles such as automo-biles, ships, or airplanes. Some mobile satellite communication systems use geostationary satellites (e.g., N-STAR, Inmarsat), while others use satellites in lower orbits (e.g., Iridium, Orbcomm). Since these systems work almost anywhere, including at sea, in the air, or in mountainous areas where ordi-nary mobile phone signals are unavailable, they are attracting attention as a means of communication when responding to natural disasters.
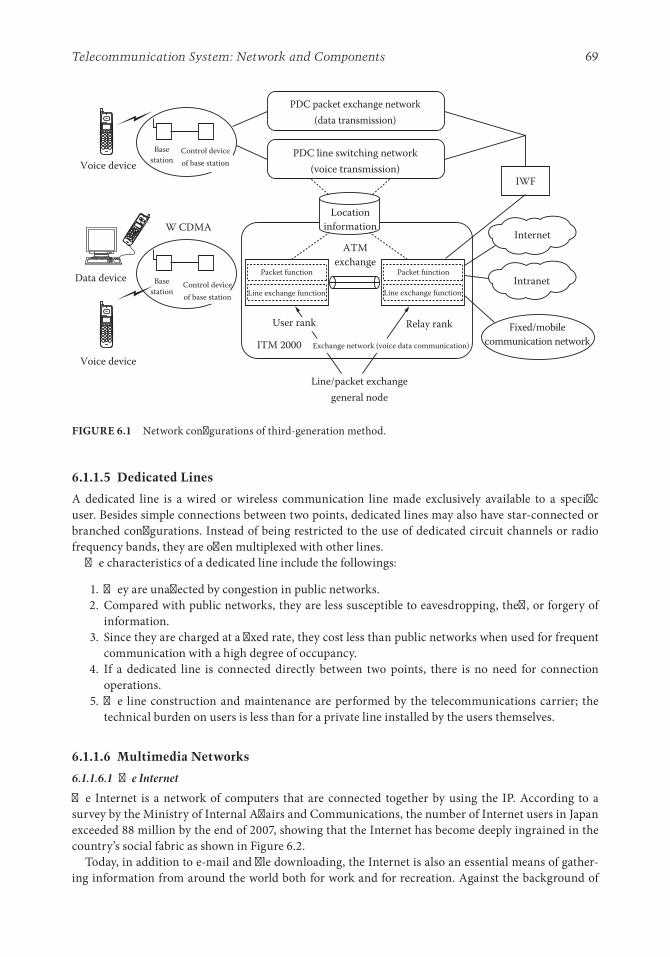
69Telecommunication System: Network and Components
6.1.1.5 Dedicated Lines
A dedicated line is a wired or wireless communication line made exclusively available to a specific user. Besides simple connections between two points, dedicated lines may also have star-connected or branched configurations. Instead of being restricted to the use of dedicated circuit channels or radio frequency bands, they are often multiplexed with other lines.
The characteristics of a dedicated line include the followings:
1. They are unaffected by congestion in public networks. 2. Compared with public networks, they are less susceptible to eavesdropping, theft, or forgery of
information. 3. Since they are charged at a fixed rate, they cost less than public networks when used for frequent
communication with a high degree of occupancy. 4. If a dedicated line is connected directly between two points, there is no need for connection
operations. 5. The line construction and maintenance are performed by the telecommunications carrier; the
technical burden on users is less than for a private line installed by the users themselves.
6.1.1.6 Multimedia networks
6.1.1.6.1 The InternetThe Internet is a network of computers that are connected together by using the IP. According to a survey by the Ministry of Internal Affairs and Communications, the number of Internet users in Japan exceeded 88 million by the end of 2007, showing that the Internet has become deeply ingrained in the country’s social fabric as shown in Figure 6.2.
Today, in addition to e-mail and file downloading, the Internet is also an essential means of gather-ing information from around the world both for work and for recreation. Against the background of
Voice device
Voice device
Basestation
Control deviceof base station
Basestation
Control deviceof base station
PDC packet exchange network(data transmission)
PDC line switching network(voice transmission)
Locationinformation
ATMexchange
Internet
Intranet
Fixed/mobilecommunication network
Line/packet exchangegeneral node
Packet function
Line exchange function
Packet function
Line exchange function
User rank
ITM 2000
W CDMA
Exchange network (voice data communication)
Relay rank
IWF
Data device
FIGURE 6.1 Network configurations of third-generation method.

70 General Remarks of Lifeline Services
increasing communication speeds, it has become possible for people to use the Internet to download and enjoy large quantities of data, such as long high-quality movies.
6.1.1.6.2 Intranets and ExtranetsAn intranet is a computer network with a limited range (e.g., a company’s internal network) that is built using standard Internet technologies in order to achieve lower costs and greater vendor independence. An extranet is a network system that connects between multiple intranets.
Corporate networks that connect a company’s head office, branch offices, factories, and the like have hitherto used dedicated and public lines separately depending on the type of traffic carried between these locations. However, due to the increased amount of voice and data traffic, especially in the form of IP packets, a growing number of businesses have introduced intranets to carry all their internal network traffic in the form of IP packets. The construction of extranets that use IP networks to connect between separate businesses is also being actively pursued.
6.1.1.6.3 Videophones and Teleconferencing SystemsVideophones and teleconferencing systems have been developed as media tools using visual communi-cation. Although videophones and teleconferencing systems employ the same core technologies, they are implemented slightly differently. For example, in a teleconferencing system when there are many participants, the participants can be imaged with two video cameras, and the two resulting pictures can be edited together and displayed as a single picture at the receiving end.
6.1.1.6.4 Community Antenna Television Community antenna television (CATV) is a system whereby high-quality TV signals received by a high-sensitivity antenna are distributed to TVs in multiple households via a broadband transmission path such as a coaxial cable. It was first used in 1949 in the city of Astoria, Oregon as a way of bringing TV signals to mountainous areas and other places where it was difficult to receive TV signals. Since that time, beginning with satellite broadcasting, various TV programs were supplied. Accordingly, CATV had developed into a multichannel urban-style cable system, which rebroadcasts satellite broadcasting programs or transmits a local content supplied from regional broadcast.
Japan is currently moving toward the use of digital technology for all TV broadcasts, including the switchover to terrestrial digital broadcasting and the introduction of digital satellite broadcasting ser-vices (such as BS, CS, and CS110). Progress is also being made in the conversion of CATV systems to digital technology, including the adoption of IP (bidirectional) communication services with the spread
Penetration rate
Year end1997
01000
5000
9000
2000 2005 200701020304050607080
11551694
2706
47085593
69427730 7948
8529 8754 8811[%]
Ten thousandpeople
No. of users
9.2 13.421.4
37.144.0
54.560.6 62.3
66.8 68.5 69.0
FIGURE 6.2 Number of the Internet users and penetration rate.

71Telecommunication System: Network and Components
of the Internet. Furthermore, video delivery technology has been developed based on all-optical fiber to the home (FTTH) networks, and this is evolving into a full-service network capable of delivering com-munications and broadcasting via a single network.
6.1.1.6.5 Video on DemandVideo on demand (VOD) is a service that allows users to watch what they like at any time by request-ing it over a network. In 1977, Japan’s NNTPC developed and marketed an analog system called video response system (VRS) that used recording media such as video cassettes and laser disks. Later on, in 1995, a digital video system compatible with the MPEG-1 and MPEG-2 digital video compression stan-dards was implemented.
Telecommunications differs from broadcast delivery in that it supports traffic in both directions. Using this characteristic, it is possible to implement interactive services that combine various types of informa-tion such as video, audio, and application software. Since this makes it possible to apply VOD systems to a wide range of multimedia services including remote education and training, online shopping, karaoke, and game distribution, there is currently a definite trend toward multimedia on-demand systems.
6.1.2 information and communication Services in the Future
6.1.2.1 trends in information Distribution
There are predicted to be three waves in the evolution of information distribution. The first wave is the switch to digital broadcasting and the accompanying spread of network TV. Hitherto, TV has only involved receiving programs sent from a broadcasting station. On the other hand, network TV includes bidirectional communication functions that support communication in both directions between homes and broadcasting stations. This allows viewers to not only watch TV programs but also access detailed information, such as the number of home runs scored by a player appearing in a live baseball game, and directly place orders for home accessories used in a TV drama, for example.
The second wave is the migration of mass media onto networks. This involves mass media content such as music and movies being distributed via networks. It is already possible to listen to music online and purchase it directly if desired instead of having to go and buy a CD. This also benefits the businesses that provide music content, since it allows them to provide a finely tuned service that provides custom-ers with recommendations suited to their tastes and can contact them directly with promotional mate-rial when a new song is released.
The third wave is the transmission of information from homes and small offices and home offices (SOHOs). Using high-speed networks, it has become possible to transmit information not only from large companies but also from SOHOs, households, local communities, and the like. For example, the Internet can now be used to distribute large amounts of content over networks in diverse fields such as real-time auctions and blog introductions.
6.1.2.2 Development of information Distribution
6.1.2.2.1 Faster Data TransferTo represent information more clearly using audio and video, there is a corresponding jump in the amount of data that have to be transferred. In the future, progress in the spread of FTTH will make it possible to send large amounts of information at low cost. The construction of networks that are devised to transfer data by different means such as downloads and streaming is also a key technique in the infor-mation and communication field.
6.1.2.2.2 Searching InformationGiven the huge amounts of information that are constantly appearing and disappearing around the world, the key to making effective use of content is to tailor searches to a user’s particular needs, for

72 General Remarks of Lifeline Services
example, by adjusting menu classifications according to the user’s needs and sending information matching these needs to the user whenever it has been updated. It is also important to consider data structures and search methods that can be used successfully by many people, such as methods for link-ing users to easily comprehensible web pages or for overcoming language barriers.
6.1.2.2.3 Distributing Information Safely and SecurelyFor the safe and secure distribution of information, technical security measures such as digital sig-natures and data encryption must be introduced. The providers of digital content such as music and movies may be concerned about having their content copied or modified. To enable them to provide content with confidence, it is necessary to monitor illegal activity by using mechanisms for adding IDs to content or inserting electronic watermarks.
6.1.2.2.4 Comfortable CommunicationAlthough mobile phones make it possible for people to make calls anywhere and anytime, they can be a nuisance to other people inside trains or buses and can even cause accidents when used at the wheel of a car. On the Internet, it is possible to send news anywhere in the world simply by pressing a key. The resulting potential for spreading false rumors and slander is having as large an impact on society as broadcasting. Websites can be accessed by anyone, but it is also important to consider ways of protect-ing children from undesirable content and blocking sites featuring offensive material such as violence and pornography.
It is therefore essential to obtain a social consensus on Internet usage by discussing a wide range of rules and etiquette, including the manner in which communication is performed and the ethical stan-dards relating to content.
6.1.2.3 expanding Business opportunities in information Distribution
It is now possible for anyone to find and purchase items over high-speed networks by using simple equipment. This has resulted in business opportunities in a wide range of fields such as manufacturing, distribution, finance, logistics, broadcasting, advertising, software, and entertainment, and it is thought that this will lead to a growing trend toward the business of information distribution.
A simple, fast, convenient, secure, and comfortable mechanism will work effectively, and if it is put to use by a large number of businesses, then we can expect the information distribution business to develop even more.
6.2 Plans and Future image of information and communication networks
6.2.1 overview of communication networks
The minimum requirements for performing communication are as follows:
1. A phone to use as a terminal 2. An exchange to select the called party and establish a connection to their phone 3. A communication network to connect the phones to the exchange
As the scale of a communication network increases, it becomes necessary to install multiple exchanges and connect these exchanges together with trunk cables. Furthermore, when considering a country, for example, the size of Japan, the exchanges, and trunk cables become as important as the mesh of a net. A communication network must provide reliable cover to the connection destination from the place where communication is required. Furthermore, the capacity of the exchanges and trunk cables must be set by taking the frequency of use into consideration, and it is necessary to use a device called a

73Telecommunication System: Network and Components
transit exchange to connect between trunk cables. A communication network cannot be built without the required minimum amount of facilities as shown in Figure 6.3.
These are the quantitative factors that determine the form of a telecommunications network, but com-munication quality is a qualitative factor in telephone networks. This is determined by the level of service required by users but is also greatly affected by the degree of technological progress. In a telecommunica-tions network, call quality is classified into the following three types: connection quality, transmission quality, and stable quality. Each of these is taken into consideration in the network design [3].
6.2.1.1 connection Quality
This is defined in terms of parameters such as the all-busy rate of the trunk lines, the connection delay between lifting the handset and the appearance of a dial tone, and the delay time between the comple-tion of dialing and the establishment of a connection to the remote user.
6.2.1.2 transmission Quality
The clarity of a call depends on parameters such as transmission losses, noise, transmission frequency band limitation, and fluctuation of the transmission characteristics. These factors determine the trans-mission quality of a telecommunications network.
6.2.1.3 Stable Quality
This is something that determines if a telephone network will be put out of action by faults, including those caused by natural disasters.
Some examples of how these factors affect the form of a telecommunications network are presented here. When the number of trunk exchange stages is increased due to a quantitative problem, the con-nection delay time naturally gets longer as the probability that all the trunk lines are busy increases, and this affects the connection quality. The increased number of line segments also has implications in terms of transmission quality since it causes more noise and more transmission losses that impair the quality of communication. Furthermore, as the transit exchanges are implemented with greater numbers of stages in order to make effective use of the trunk lines, the effects of a fault in a transmission path or an exchange become more pronounced and impact the stable quality of the system.
6.2.2 telecommunication networks
Among communication networks, it is the telecommunication network that is developing on the largest scale. From the first manually operated switchboards in 1878 to the first automated
Transit exchangeLocal switch
FIGURE 6.3 Communication network topology.

74 General Remarks of Lifeline Services
electromechanical exchange in 1892 and today’s global telephone system, the network has grown massively at each stage.
6.2.2.1 network configuration
A telephone network consists of a subscriber network built around local switches and a trunk net-work that consists of transit exchanges and trunk lines. The subscriber network consists of star net-works that extend into individual subscriber cables centered on local switches. The exchange facility in which a local switch is situated is called a group center (GC), of which there are several thousands in Japan.
Meanwhile, the trunk network connects the transit exchange with multiple local switches via trunk cables in a star configuration and is configured so as to mutually overlap several stages of multiple transit exchanges. The trunk network can be classified into two parts—a trunk network that connects calls between parties located within the same zone area (ZA) and a trunk network that connects calls between different ZAs as shown in Figure 6.4. The trunk network in a ZA consists of intrazone tandem centers (ICs), where exchanges are situated for connecting calls within ZAs, and zone centers (ZCs), which are connection centers situated throughout the country for connecting calls between ZAs and are connected to the GCs in a star configuration. The nationwide trunk network consists of a mesh net-work of ZCs for mutual communication between ICs and ZCs, with multistage connections to special ZCs (SZCs), which collect and forward calls.
6.2.2.2 number Plan
Number allocation methods can be broadly divided into closed numbering plans and open number-ing plans. The former allocates numbers uniformly across the entire communication network so that a number is always the same no matter where the call is made from. On the other hand, an open numbering plan is one that adopts a closed numbering plan in fixed small regions but uses different numbering systems inside and outside these regions (which are called closed numbering areas). In Japan’s fixed phone system, so-called city call regions are established as closed numbering areas, and an open numbering plan is employed whereby a 0 prefix is added to the number when calling numbers outside the city.
Japan’s national numbering plan for fixed phones is configured as follows:
0 + + +( ) ( ) ( )area code local number subscriber number
and consists of up to nine digits, excluding the 0 prefix. Subscriber numbers are always four digits, so the (area code) + (local number) part consists of five digits. Therefore, in cities with larger numbers of
SZC
IC
IC
ZAZA
ZC
GC
GC
FIGURE 6.4 Telephone network configuration.

75Telecommunication System: Network and Components
subscribers, the area codes have fewer digits. For example, the area code for Tokyo is 03, while the area code for Nagoya is 052.
6.2.2.3 Deployment on a Digital communication network
Initially, the transmission scheme used on the phone network was implemented entirely with analog technology. But with advances in semiconductor technology and digital circuit technology, work started on introducing digital pulse code modulation (PCM) transmission into the trunk network from the 1960s. Work also began on the research of digital exchanges capable of switching digital information through the use of digital memory and other devices, and from the latter half of the 1970s, digital exchanges for telecommunication started to be introduced in countries all over the world. In Japan, the introduction of digital technology was completed in 1997. Thus, although progress has been made in the introduction of digital technology into telecommunication networks, most subscriber lines still use analog technology, and from the user’s perspective, the network is still only capable of handling analog information.
On the other hand, the development of computers and the like has given rise to the concept of using data communication to exchange digital information. However, work is now being done to convert com-munication networks based on analog transmission like the telephone network into digital networks. This trend gave rise to the idea of an Integrated Services Digital Network (ISDN) to provide an integrated platform for all types of telecommunication services on a shared network by building a general-purpose digital communication network instead of creating individual communication networks for telephones, packet-switched communications, and other services. By the 1980s, research aimed at implementing this network was in full swing all over the world. In Japan, the INS model system was started up in Mitaka, Tokyo, in 1984, and the first commercial ISDN service (INS net service) was started in 1988. In ISDN, the same digital-enabled subscriber line can be used to access a variety of circuit-switched and packet-switched transmission services.
6.2.2.4 Digital circuit-Switched network
This is a network that transmits digital data directly between users by combining digital transmission with digital circuit switching and can therefore achieve high-quality data transmission at speeds rang-ing from 50 bps to 48 kbps. The user network interface has been standardized by the ITU-T and is sum-marized in recommendations including X.20 and X.21. In Japan, the DDX digital data exchange service was started in 1979.
6.2.2.5 Digital Packet-Switched network
In a digital packet-switched network, messages are partitioned into blocks called packets, which are each assigned destination information and a sequence number, and data are delivered in packet units based on a store-and-forward technique. The subscriber line speed is from 200 bps to 48 kbps, allow-ing high-quality transmission. Another characteristic is that it is possible to communicate between terminals operating at different speeds or with different protocols. In the 1970s, when the user network interface specifications or numbering scheme were internationally standardized by the ITU-T, packet communication services were launched in various countries starting with GTE’s Telenet service in the United States.
Other notable examples included the Accunet network of American Telephone and Telegraph (AT&T) in the United States and France’s Transpac network.
In Japan, NTT launched a packet-switched service (DDX-P) in 1980, and in 1990, it launched an ISDN packet communication service (INS-P). Also, in 1982, KDD (now KDDI) launched the VENUS-P service, which was primarily targeted at international packet communications.
The user network interface was compliant with ITU-T recommendation X.25. It is also possible to accommodate nonpacket devices, in which case the splitting and reassembly of packets is performed in the PMX. Almost all interoffice signaling methods are also compliant with X.25.

76 General Remarks of Lifeline Services
6.2.3 integrated Services Digital network
6.2.3.1 Definition of iSDn
ISDN is a network that was developed at the stage where it became possible to communicate directly by digital coding between devices due to the introduction of digital exchanges and digital subscriber lines. In other words, ISDN makes it possible for voice and data communications (including packets) to be delivered over a single subscriber line as shown in Figure 6.5. The basic speed is 64 kbps for digitally encoded audio, which is faster than digital data exchange networks.
6.2.3.2 Service overview
The services provided by ISDN are referred to in general as telecommunication services. Strictly speak-ing, they are defined as communication functions provided to users by ISDN in order to meet the require-ments of users who want to communicate using fixed protocols. In the Open Systems Interconnection (OSI) model, a service corresponds to a function provided to higher layers by lower layers, which is close to the ordinary everyday meaning of the term.
Telecommunication services can be broadly divided into two types: bearer services and teleservices. The difference between the two lies in the presence or absence of a standardized suite of protocols and device functions. That is, a bearer service is a service where protocols are only standardized for the lower layers (layers 1–3) and which is used to provide transmission functions. A teleservice is a service where protocols are defined not only for lower layers but also for higher layers (layers 4–7) and which is completed by the inclusion of terminal functions.
The main characteristics of ISDN bearer services include the ability to use the same interface to pro-vide circuit- and packet-switched services, defined dedicated line services, and the economic benefits derived from being able to perform processing suited to each type of traffic within the network because of the ability to be designated not only transparent digital path but also voice or modem traffic (3.1 kHz bandwidth services for communication with the analog phone network).
Phone
Facsimile
Videotex
Video device
Communicationprocessing function
64 kbps systemCircuit-switched/dedicated line functions
High-speed system Circuit-switched/dedicated line functions
Packet exchange function(VC PVC)
Highway signaling function
Dist
ribut
ion
func
tion
Dist
ribut
ion
func
tion
FIGURE 6.5 ISDN conceptual diagram.
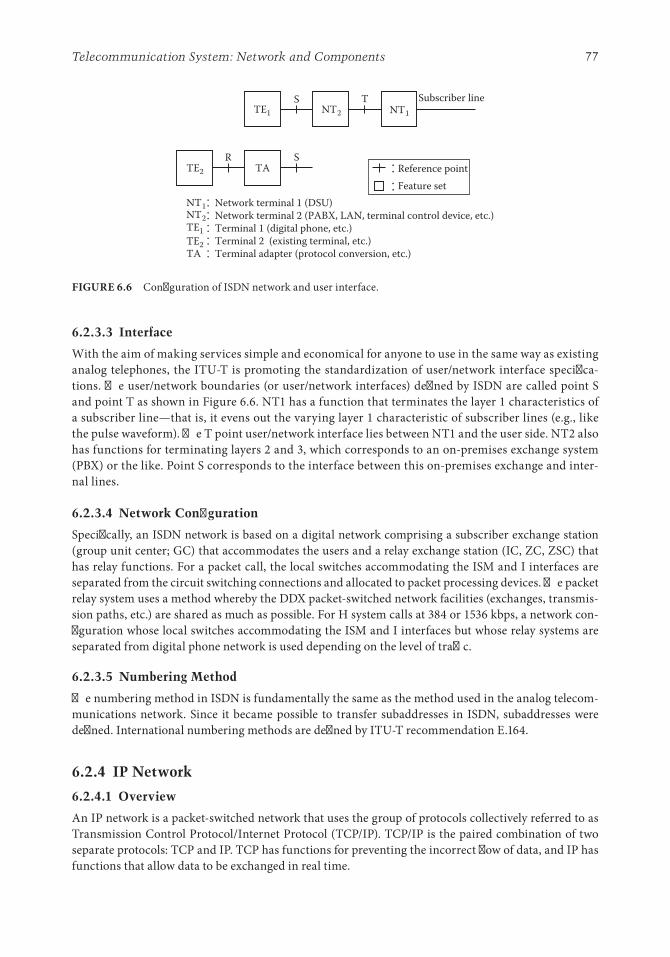
77Telecommunication System: Network and Components
6.2.3.3 interface
With the aim of making services simple and economical for anyone to use in the same way as existing analog telephones, the ITU-T is promoting the standardization of user/network interface specifica-tions. The user/network boundaries (or user/network interfaces) defined by ISDN are called point S and point T as shown in Figure 6.6. NT1 has a function that terminates the layer 1 characteristics of a subscriber line—that is, it evens out the varying layer 1 characteristic of subscriber lines (e.g., like the pulse waveform). The T point user/network interface lies between NT1 and the user side. NT2 also has functions for terminating layers 2 and 3, which corresponds to an on-premises exchange system (PBX) or the like. Point S corresponds to the interface between this on-premises exchange and inter-nal lines.
6.2.3.4 network configuration
Specifically, an ISDN network is based on a digital network comprising a subscriber exchange station (group unit center; GC) that accommodates the users and a relay exchange station (IC, ZC, ZSC) that has relay functions. For a packet call, the local switches accommodating the ISM and I interfaces are separated from the circuit switching connections and allocated to packet processing devices. The packet relay system uses a method whereby the DDX packet-switched network facilities (exchanges, transmis-sion paths, etc.) are shared as much as possible. For H system calls at 384 or 1536 kbps, a network con-figuration whose local switches accommodating the ISM and I interfaces but whose relay systems are separated from digital phone network is used depending on the level of traffic.
6.2.3.5 numbering Method
The numbering method in ISDN is fundamentally the same as the method used in the analog telecom-munications network. Since it became possible to transfer subaddresses in ISDN, subaddresses were defined. International numbering methods are defined by ITU-T recommendation E.164.
6.2.4 iP network
6.2.4.1 overview
An IP network is a packet-switched network that uses the group of protocols collectively referred to as Transmission Control Protocol/Internet Protocol (TCP/IP). TCP/IP is the paired combination of two separate protocols: TCP and IP. TCP has functions for preventing the incorrect flow of data, and IP has functions that allow data to be exchanged in real time.
Subscriber line
Reference pointFeature set
Network terminal 1 (DSU)Network terminal 2 (PABX, LAN, terminal control device, etc.)Terminal 1 (digital phone, etc.)Terminal 2 (existing terminal, etc.)Terminal adapter (protocol conversion, etc.)
TE2
TE1
RTA
S
SNT2
NT1NT2
TE2TA
TE1
NT1T
FIGURE 6.6 Configuration of ISDN network and user interface.

78 General Remarks of Lifeline Services
Against the backdrop of the ongoing explosive growth of the Internet, it can be said that an IP net-work exhibits the following characteristics:
1. Openness: It allows the connection of different types of computer made by different manufacturers. 2. Flexibility: It allows Internet connections to be made from all sorts of lines, including not only
ordinary public lines used by telephones and the like but also ISDN, asymmetric digital sub-scriber line (ADSL), FTTH, and CATV.
3. High speed: It is possible to achieve 100 Mbps when using FTTH, and development to make com-munication speeds higher is progressed currently though early PCs were generally only capable of communicating at a speed of 9600 bps when using a public line via a dial-up modem.
6.2.4.2 network configuration
An IP network consists of computers and networks such as LANs connected together by routers. These connections can be made via dial-up IP modems or dedicated lines using the telecommunications net-work or ISDN or via always-on connections such as ADSL, CATV, or FTTH.
The Internet is a connectionless communication network that uses inexpensive routers instead of expensive exchanges to select the best path for the transmission of each packet to its destination. Routing is the process whereby a packet is delivered to its destination by selecting a route based on the packet’s IP address, and a device that performs this process is called a router.
A router decides where to send packets by consulting a routing table. This routing table is prefilled with destination addresses and the directions in which packets must be sent in order to reach these destination addresses. The next router in the chain uses a similar process to decide where the packets should be sent next. By repeating this process, the packets are eventually delivered to their final des-tination. In this way, a router only needs to be able to deliver packets to the next router, which carries the responsibility for the next stage of delivery. Therefore, if the transmission paths are busy further on down the line, the router will send the packets on regardless. This can cause packets to become congested, resulting in long transfer delay times and can even cause packets to be dropped in the worst case. This is one of the major differences between IP networks and other types of network such as tele-communications networks and ISDN that use exchange equipment where information is only sent after checking the availability of a line to the destination.
6.2.4.3 iP Addresses
In an IP network, IP addresses are used to identify the origin and destination of IP packets and the equipment that forwards these packets. In IP version 4, which is currently in widespread use, an IP address is represented by a 32-bit number. This will eventually be replaced by IP version 6, which uses 128-bit numbers instead. The global IP addresses used on the Internet must all be unique so as to avoid ambiguity. This is ensured through the work of an organization called the Internet Assigned Numbers Authority (IANA). Under the authority of IANA, the allocation of IP addresses is managed by regional Internet registries such as the Asia Pacific Network Information Centre (APNIC) and national Internet registries such as the Japan Network Information Center (JPNIC).
6.2.5 next-Generation networks (nWGn and nGn)
6.2.5.1 nGn overview
The next-generation network (NGN) is defined as a packet-based network that provides communication services, that uses a large number of broadband transport technologies with end-to-end quality of ser-vice (QoS), and that has capabilities to provide service-related functions, which are independent of the underlying transport technologies. It also allows open-ended access to networks and service providers selected by users and supports mobility functions for the management of consistent ubiquitous services for users who are on the move as shown in Figure 6.7.

79Telecommunication System: Network and Components
Put more simply, it is a generic term for a network that achieves enhanced reliability and stability by creating a packet-based network from the networks of telecommunications providers currently offering telephone services, while maintaining the strong points of the existing telecommunications network. NGN services have been commercially available since March 2008.
6.2.5.2 Services implemented by the nGn
Specific examples of services that can be offered on the NGN include IP broadcasting (IPTV) and video phone services, which are already available. However, instead of enumerating individual services, we will concentrate here on introducing the new communication concepts leading to the implementation of each service.
6.2.5.2.1 Fixed Mobile Convergence ServiceFixed mobile convergence (FMC) is a service that integrates fixed and mobile access methods. As a specific example of an FMC service, we aim to implement technology whereby a miniature base station called a femtocell is placed indoors and used to connect to a paid-for broadband line.
6.2.5.2.2 Real-Time Multimedia Communication ServicesA multimedia service is a service that communicates with other forms of media besides audio, such as text and video data. Even now, it is possible to talk to people on the phone and use the Internet to send e-mails with attached video files; but to send an e-mail to the person at the other end of the phone,
Application server
Videophone
Contentdelivery
Sessioncontrol
Authenti-cation
security
Billingmanage-
ment
Corenetwork
Accessnetwork
Core node
Fixed phone, Personal computer, Information appliance, Mobile phone
Edge node
Other
Application feature
Platform/service infrastructure(service grant function)
Network infrastructure(transfer function)
WirelessLAN
ADSL FTTH
FIGURE 6.7 Configuration of the NGN defined by ITU-T.

80 General Remarks of Lifeline Services
we need to know their e-mail addresses separately. In the NGN, once a session (connection relationship) has been established with another party, the information exchanged in this session is no longer limited to voice only, so as long as the devices have the required functionality, the same session can easily be used to send and receive multimedia information such as videos and text messages.
6.2.5.2.3 Triple-Play Services/Fusion of Communication and BroadcastingIt is often said that telecommunications and broadcasting will merge together in the NGN era. On the other hand, a triple-play service is an existing type of service that fuses telecommunications and broad-casting. A triple-play service is usually implemented when data (the Internet), phone (IP phone), and TV broadcasting (IPTV) are provided in the broadband services of a single communications carrier. Sometimes, mobile phone services can be added to produce a quad-play service.
In the NGN, the IPTV service that forms an essential constituent of triple-play services can provide a simpler and more enjoyable environment due to the existence of a broadband access network such as an optical fiber connection, together with a QoS-managed network.
6.2.5.2.4 Personalized Communication ServicesSince open service development environments such as service delivery platform (SDP) are constructed by providing services that are not dependent on access, user data including authentication and billing are integrally managed inside the NGN. When this sort of environment is implemented, it becomes possible to provide a wide variety of communication services that are tailored to their users’ individual preferences and characteristics (e.g., occupation, age, or gender).
6.2.5.2.5 Context-Based Communication ServicesContext-based communication is a term that may be unfamiliar to some. Context refers to the situation in which something occurs, and in this case, context-based communication refers to a service that pro-vides users with communication and services optimized for their circumstances through an appropriate selection of networks and applications.
Considering the communication environment of the NGN era when communication terminals and communication access lines are becoming more diverse and sensors are becoming more powerful and less expensive, it seems that implementing communications suited to individual situations is a proper development direction.
6.2.5.2.6 Network-Based ServicesAlthough the NGN was not designed for thin clients (client devices with the bare minimum of process-ing capabilities), its characteristics such as broadband transport, network-based authentication func-tions, and QoS management work very effectively for thin client applications where large amounts of data need to be processed with short response times. Furthermore, this sort of function is an essential requirement in terms of being able to open up the NGN architecture via a standard interface. Since it is also equipped with fast, high-capacity security functions, the NGN will transform society’s communi-cation environment as shown in Figure 6.8.
6.2.5.3 overview of the nWGn
Today, new services are continuously appearing on the Internet due to the development of broadband networks in tandem with the expansion of network usage, and networks are continuing to grow in importance as a platform for socioeconomic activity. As networks become increasingly ingrained into society and the economy, they are used to carry increasingly vast quantities of information, and peo-ple have come to expect that this will be accomplished with high reliability. However, the movement of overcoming the limitations of the Internet is accelerated by implementation of a network based on new concepts instead of extending existing technologies as the basis for the future of NGN since there

81Telecommunication System: Network and Components
are various problems at the core of current networks. This new network is called the NeW Generation Newtork (NWGN), as it represents a further step beyond the NGN.
6.2.5.4 target Services of the nWGn
6.2.5.4.1 User-Friendly NetworkTo enable the network to be accepted into society as a user-friendly tool, it must be capable of being used easily by anyone without having to acquire special skills. To meet the needs of each user and accom-modate various usage environments, the NWGN embodies the idea of a network that adapts to its users by determining their circumstances.
6.2.5.4.2 Scalable NetworkThere have been requests for a scalable network where transmission is performed efficiently according to the diversity of data in cases where content would previously be transmitted and delivered in different types of media on the same network as shown in Figure 6.9. The NWGN’s transmission functions are specifically aimed at ensuring that data are transmitted according to its characteristics, whether they constitute a high amount of content or tiny amounts of data transmitted from huge numbers of sensors or electronic tags. It is also important that the network can adapt robustly and stably to bursty traffic
Upload terminal
Rootserver
Leafserver
· Delivery based on a specified schedule· Transmission via specified bandwidth· Transmit encrypted content
· Downstream relay transmission starts without having to wait for the completion of upstream transmission
· Error leaf server skipped
FIGURE 6.9 Basic operation of a scalable content delivery system.
Personalized communication
service
FMC service
· Access independent· General mobility· Transport-independent
service· Presence system· Transport-independent service· Integrated user database
· Access independent· QoS management transport· Integrated user database
· Presence system· Transport-independent
service
· All IP network· Transport-independent service
· QoS management transport· Broadband network
Triple-playservice
Context-based communication
service
Network-basedservice
Real-time/multimedia/ communication service
NGN
FIGURE 6.8 New service concepts of the NGN.

82 General Remarks of Lifeline Services
(traffic concentrated into short bursts), which has become an issue on the Internet. Adequately resolving these issues will make it unnecessary to choose the media or network for each type of content or applica-tion, allowing networks to be used more easily.
Another issue that will continue to exist in the operation of networks in the future is the rapid increase of power consumption. In addition to energy savings at the equipment level, the NWGN is geared toward the study and implementation of measures for achieving energy savings at the architec-ture level. A network is expected to continue providing services to users while striking the right balance between power consumption and traffic levels and performing power management while taking overall performance into consideration.
6.2.5.4.3 Portable Service NetworkIn the NWGN, it is thought that most data will be left on the network and hardly any will be left with the users themselves. Users’ data can be automatically provided to the users in a manner that is suited to the new terminal or users’ environment even if the data are managed on the network and the user moves to a different device or access environment. Hence, it is unnecessary for the users to copy data from the old device or learn new methods in order to operate the new device. Users can keep their own private information or preferences relating to their information device safely on the network, so that users can use devices in suitable environment for network automatically even if the device is a new one or borrowed one.
6.2.5.4.4 Highly Reliable NetworkIn the society of the future, the network will be essential for people’s everyday lives and for businesses and the like and is predicted to become part of the infrastructure at the core of a society’s activities. It is therefore important to ensure that it offers high reliability and functional continuity that can cope with any kind of threat such as natural disasters or cyber attacks. To implement ID portability more safely, network authentication is provided by a reliable framework centered on public organizations; thereby, security has to be ensured by using systems in which information is only divulged to those who ought to know according to the attributes of information.
In the NWGN, the aim is for devices to implement functions that cooperate with the network to auto-matically detect attacks from outside and block out the sources of these attacks and separate them from the network. They should also automatically detect breakdowns and viral infections in the constitu-ent equipment of the network, automatically disconnect or restore equipment that is not functioning normally, and prevent unwanted or illegal traffic from being transmitted outside the network. The aim is that the network should be capable of implementing self-repairs and automatic recovery so that the network remains operational and the effect on society is kept as small as possible, even when abnormal traffic levels are generated by a cyber attack or the communication network is partially damaged by a natural disaster or the like.
6.2.5.4.5 Network That Fuses Real and Virtual WorldsIt is thought that progress will be made in the fusion of real society with the virtual world that exists on the network because of accumulation of users’ experience derived from collective body of knowledge on the network and the implementation of device authentication by ID portability. Specifically, advances in sensor and display technology will make it possible for the things people see and hear to be stored directly on the network and played back with a high presence when needed. Also, by combining various sensors and devices, applications may be provided that use communication with a high sense of pres-ence to change people’s perceptions of distance by allowing them to experience remote locations as if they were actually there.
We may also see changes in the way people communicate over the network. So far, communication has been perceived as an activity that involves the use of equipment such as telephones and televisions,
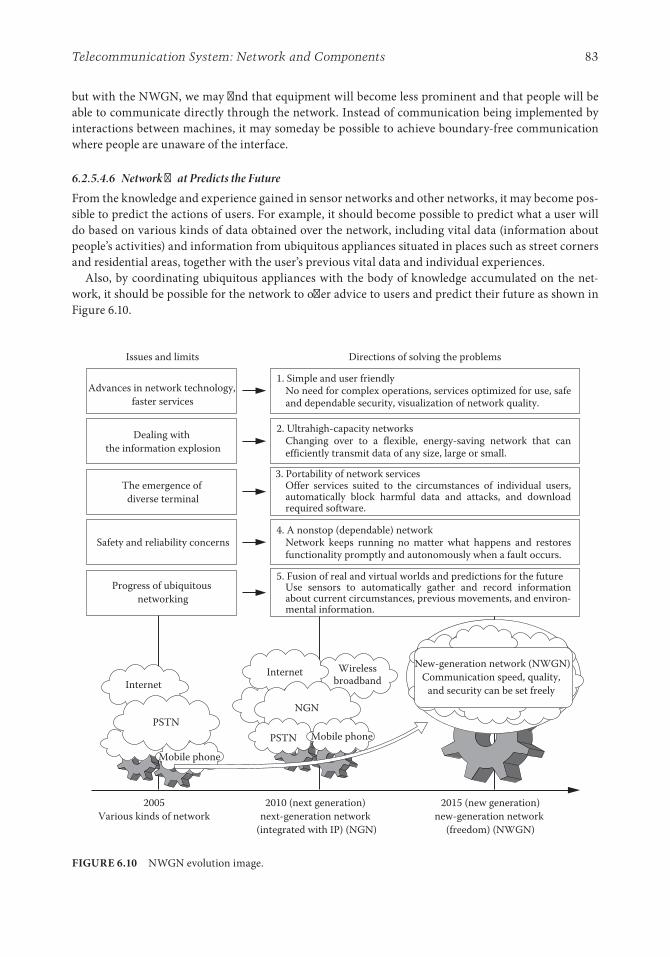
83Telecommunication System: Network and Components
but with the NWGN, we may find that equipment will become less prominent and that people will be able to communicate directly through the network. Instead of communication being implemented by interactions between machines, it may someday be possible to achieve boundary-free communication where people are unaware of the interface.
6.2.5.4.6 Network That Predicts the FutureFrom the knowledge and experience gained in sensor networks and other networks, it may become pos-sible to predict the actions of users. For example, it should become possible to predict what a user will do based on various kinds of data obtained over the network, including vital data (information about people’s activities) and information from ubiquitous appliances situated in places such as street corners and residential areas, together with the user’s previous vital data and individual experiences.
Also, by coordinating ubiquitous appliances with the body of knowledge accumulated on the net-work, it should be possible for the network to offer advice to users and predict their future as shown in Figure 6.10.
NGN
PSTN
Issues and limits Directions of solving the problems
Advances in network technology, faster services
Dealing with the information explosion
The emergence of diverse terminal
Safety and reliability concerns
Progress of ubiquitous networking
InternetInternet Wireless
broadbandNew-generation network (NWGN)
Communication speed, quality, and security can be set freely
Mobile phone
Mobile phone
2005Various kinds of network
2010 (next generation)next-generation network
(integrated with IP) (NGN)
2015 (new generation)new-generation network
(freedom) (NWGN)
1. Simple and user friendlyNo need for complex operations, services optimized for use, safe and dependable security, visualization of network quality.
2. Ultrahigh-capacity networksChanging over to a flexible, energy-saving network that can efficiently transmit data of any size, large or small.
3. Portability of network servicesOffer services suited to the circumstances of individual users,automatically block harmful data and attacks, and download required software.
4. A nonstop (dependable) networkNetwork keeps running no matter what happens and restores functionality promptly and autonomously when a fault occurs.
5. Fusion of real and virtual worlds and predictions for the futureUse sensors to automatically gather and record information about current circumstances, previous movements, and environ-mental information.
PSTN
FIGURE 6.10 NWGN evolution image.

84 General Remarks of Lifeline Services
References
1. Ministry of Internal Affairs and Communications. White Paper on Information and Communications in Japan, Government of Japan, Tokyo, Japan, 2012.
2. Japan Society of Civil Engineers. Handbook of Civil Engineering, 4th edn., Gihodo Publishing, Tokyo, Japan, 1989 (in Japanese).
3. Telecommunication Research Association. Outline for Telecommunication, Ohmsha, 2011 (in Japanese).

85
IIConstruction Technology of Lifeline Pipelines and Its Facilities
7 General Nobuhisa Suzuki and Hiroyuki Horikawa ........................................................87Required Survey for Lifeline Construction • Excavating Method for Lifeline Construction • Nonexcavation Method for Lifeline Construction • References
8 Water Supply System: Design Aspects Takeshi Koike ...................................................... 95Configuration of Water Pipeline Systems • Characteristics of Water Pipelines • Design of Water Pipeline Systems • References
9 Sewerage System: Design Aspects Masanori Hamada ................................................... 153Sewer System • Standards and Materials • Design of Sewers • Manhole Design • Cleanouts, Catch Basins, and Laterals • Other Structures • Process of Design • References
10 Natural Gas Distribution System: Design Aspects Nobuhisa Suzuki and Hiroyuki Horikawa .................................................................................................................... 171Materials of Gas Pipelines • Structural Design of Gas Pipeline • Seismic Design of Gas Pipelines • Inspection of Girth Weld • Corrosion Protection of Gas Pipeline • References
11 Electric Power System: Design Aspects Keizo Ohtomo and Yoshiharu Shumuta ...... 201Design of Overhead Transmission Facilities • Design of Underground Transmission Facilities • Seismic Design of Substation Equipment and Foundations • References
12 Telecommunication System: Design Aspects Takanobu Suzuki, Fumihide Sugino, and Katsumi Sakaki ..............................................................................211Overview of Telecommunications Civil Facilities • Communication Tunnels (Cable Tunnels) • Main Conduit Line • Buried Conduits • Special Facilities • References


87
7.1 Required Survey for Lifeline construction
A lifeline is mainly constructed under roads and sometimes across rivers, canals, water channels, rail-ways, and highways. A lifeline may be constructed in mountainous areas or deep in the ground where trenches for a lifeline system cannot be excavated. Therefore, a preliminary survey should be carefully conducted to collect sufficient information to complete the project. This includes a route survey, inves-tigation of other lifeline structures, a geotechnical survey, and a land survey.
7.1.1 Route Selection
The route survey is conducted along candidate routes for the lifeline construction. The best route will be selected taking into account pipeline integrity, maintenance method, maintenance cost, con-struction method, construction cost, and construction duration. The following issues are important for route selection:
1. Pipeline integrity to withstand external forces: In order to ensure the long-term integrity of a life-line, seismic risks, liquefiable zones, lateral spreading, landslides, slope failures, and nonuniform ground settlement should be carefully investigated along the route.
2. Maintenance: In order to simplify the maintenance of a lifeline system, it is necessary to ensure sufficient breadth of the road and less population along the lifeline route. Information regarding any future plans to be executed along the lifeline route is also necessary to finalize the life-line route.
3. Construction method, construction cost, and construction term: The shortest route may be the best for the construction; however, the existence of a river or other difficult construction conditions may be other controlling parameters to decide the best route for a lifeline.
7General
7.1 Required Survey for Lifeline Construction ....................................87Route Selection • Investigation of Other Lifeline Construction • Geological Survey
7.2 Excavating Method for Lifeline Construction ...............................887.3 Nonexcavation Method for Lifeline Construction ........................88
Pipe-Jacking Construction Method • Shield Tunnel Construction Method
References ........................................................................................................93
Nobuhisa SuzukiPIN Technologies
Hiroyuki HorikawaJFE Engineering Corporation

88 Construction Technology of Lifeline Pipelines and Its Facilities
7.1.2 investigation of other Lifeline construction
Other lifeline facilities in the ground will be investigated using markers along the route and databases of the other lifeline facilities. The lifeline company will inquire about existing routes of other lifeline operators. If necessary, a trial excavation may be conducted and underground radar may be used.
7.1.3 Geological Survey
A geological survey is conducted to recognize those areas along the lifeline route where the founda-tion may be soft and loose, nonuniform ground settlement may occur, or liquefaction and lateral spreading may be induced by earthquakes.
1. Preliminary survey: A preliminary survey is conducted for the purpose of route selection. Collecting existing geological databases is the main work at this stage. The collected database may be referred to find any difficult construction conditions for the planned lifeline.
2. Detail survey: A detailed geological survey is conducted to obtain geological information that will be used for pipeline design, planning of construction, and planning of maintenance. In addition to the existing geological database, the boring data, the sampling data, the sounding data, and the soil data collected on the site should be obtained at this stage.
7.2 excavating Method for Lifeline construction
Pipes and cables used for lifeline systems are constructed by excavating public roads. This consists of a series of works such as trench excavation, trench wall retaining, piping, backfilling, and temporary road recovery.
Lifeline construction in urbanized areas should be conducted so as to minimize the effects of the construction work on the traffic and on residents living near the site. Therefore, it is required to com-plete the series of construction works in a day. This may sometimes take all day depending on the environmental conditions of the construction site. In case the construction is using large-diameter pipes, an isolated pipeline construction zone is provided as it may be difficult to complete the series of works in a day.
The excavating construction method for lifeline facilities is advantageous in the following cases:
• Pipeline construction whose backfill coverage is less than 3 m.• A simple construction method is employed that can be conducted by general contractors.• A proper construction method is chosen considering the latest information obtained on the site.
7.3 nonexcavation Method for Lifeline construction
The tunnel construction method is chosen in the following cases where the excavation method cannot be applied:
• No excavation method can be applied due to heavy traffic conditions• Business zones where the excavation method cannot be applied• Construction under an existing large-diameter lifeline• Railroad crossings, rivers, canals, and waterways• Bay crossing
In the case a lifeline has to be constructed in a mountainous area or in areas where no public road exists, a mountain tunnel is constructed to accommodate the lifeline within it. The tunnel construction

89General
includes the pipe-jacking method, the shield method, the mountain tunnel method, and the horizontal directional drilling method.
7.3.1 Pipe-Jacking construction Method
The pipe-jacking construction method, presented in Figures 7.1 through 7.5, consists of two shafts and hydraulic actuators to push the pipes into the ground [1,2]. The leading pipe has a cutting edge at the head of the pipe to easily penetrate into the ground, and the reaction of the actuators is resisted by mas-sive concrete walls. Concrete pipes are used for main sewage lines and for the pipe-jacking construction system. On the other hand, in the case of gas and water pipelines, concrete pipes are used as casing pipes for welded pipes.
An appropriate construction method is chosen taking into account the total length of pipes, the pipe diameter, and soil conditions. The pipe-jacking construction system is applied to construct
Vertical shaft (end) Vertical shaft (start) Ground surface
WallWaterway
Casing pipe
Guide railJack
Spacer and strut
FIGURE 7.1 Simple pipe-jacking construction system for small-diameter pipes. (From Japan Society of Civil Engineers, New Frame of Civil Engineering 96—Pipeline, Gihodo Publishing, Tokyo, Japan, 1991, pp. 132.)
Pipe
Bucket
CraneAntifriction fluid and
backfill pump
Hydraulic pump
WallInletCutting blade
Strut Jack
FIGURE 7.2 Pipe-jacking construction system with cutting blade. (From Japan Society of Trenchless Technology, Navigation system of construction method, http://www.jstt.jp/kouhounavi/.)

90 Construction Technology of Lifeline Pipelines and Its Facilities
Central controlunit
Shield machineShield pipe Inlet
BulkheadDrain pump
Drain treatment unit Crane Hydraulicpump Antifriction
fluid andbackfill pump
Pump
Drain pipe
Hydraulicjack
Wal
l
FIGURE 7.4 Reverse circulation type shield method. (From Japan Society of Trenchless Technology, Navigation system of construction method, http://www.jstt.jp/kouhounavi/.)
Lubricant injection unit
Additive injection unit Crane Hydraulic
pump
Hydraulic jackInletTunneling machineBelt conveyor
Screw conveyor Trolley bucket
Wal
l
FIGURE 7.5 Mud pressure shielding method. (From Japan Society of Trenchless Technology, Navigation system of construction method, http://www.jstt.jp/kouhounavi/.)
Vertical shaft (end)
Pilot pipe
Casing pipe
Screw
Vertical shaft (start)
Pipe-jackingmachine
Jack
FIGURE 7.3 Pipe-jacking construction system with a screw digger. (From Japan Society of Civil Engineers, New Frame of Civil Engineering 96—Pipeline, Gihodo Publishing, Tokyo, Japan, 1991, p. 133.)

91General
pipelines with lengths of 500–1000 m, and some pipe-jacking construction systems are able to with-stand high water pressure.
7.3.2 Shield tunnel construction Method
The shield tunnel construction method constructs a shield tunnel between two vertical shafts, and the parameters of the shield tunnel method are similar to those of the pipe-jacking method. The shield tun-nel construction machine, which is similar to a tunnel-boring machine, consists of a ground excavator and soil discharger and segments that are assembled to construct a shield tunnel. The pipe-jacking con-struction method and the shield tunnel construction method are applied especially in urbanized areas where the excavation method cannot be applied.
7.3.2.1 classification of Shield tunnel construction Methods
The shield tunnel construction methods are classified in Figure 7.6 with respect to the boring device and stability of the ground [3].
7.3.2.2 Application of the Shield tunnel construction Method to Lifeline Systems
Examples of application of the shield tunnel construction methods to the lifeline systems are presented in Figures 7.7 through 7.11.
Handdigging
Blind type
Closed fronttype
Pressuredby water
Pressuredby soil
Partialmechanicaldigging
Fullmechanicaldigging
Illustration
Open fronttype
Partially openfront type
Type
FIGURE 7.6 Classification of shield tunnel construction methods. (From Japan Gas Association, Guidelines of High Pressure Gas Pipelines, Technical Committee on Structural Standards, 1989, p. 402.)

92 Construction Technology of Lifeline Pipelines and Its Facilities
Water pipe
(a) (b)Segment Segment
Water pipe
Secondaryconcrete layer
Maintenanceway
Concretefilling
FIGURE 7.7 Application to a water pipe: (a) concrete filling type and (b) maintenance way type. (From Japan Society of Civil Engineers, Standard Specifications for Tunnels—Shield Tunnels, 2006, p. 16.)
SegmentSecondary
concrete layer
SegmentSewage
Rain water Secondary concrete layer
(a) (b)
FIGURE 7.8 Application to a sewage line: (a) standard cross section and (b) separated cross section. (From Japan Society of Civil Engineers, Standard Specifications for Tunnels—Shield Tunnels, 2006, p. 15.)
(a) (b)
LightSegment
Segment
Electric cables
Elec
tric
cabl
es
Cable holder
Mortar filling
Cooli
ng pi
pe
FIGURE 7.9 Application to electric cables: (a) shield tunnel type and (b) pipe type. (From Japan Society of Civil Engineers, Standard Specifications for Tunnels—Shield Tunnels, 2006, p. 16.)
Light
Tele
com
mun
icat
ion
cabl
es
Secondaryconcrete layer
Segment
FIGURE 7.10 Application to telecommunication cables. (From Japan Society of Civil Engineers, Standard Specifications for Tunnels—Shield Tunnels, 2006, p. 16.)

93General
References
1. Japan Society of Civil Engineers. New Frame of Civil Engineering 96—Pipeline, Gihodo Publishing, Tokyo, Japan, 1991, pp. 130–133.
2. Japan Society of Trenchless Technology. Navigation system of construction method, http://www.jstt.jp/kouhounavi/.
3. Japan Gas Association. Guidelines of High Pressure Gas Pipelines, Technical Committee on Structural Standards, 1989, pp. 402, 418–422.
4. Japan Society of Civil Engineers. Standard Specifications for Tunnels—Shield Tunnels, 2006, pp. 14–17.
SegmentSegmentMortar filling
Gas pipelineGaspipeline
Pipe support
Secondary shell
(a) (b)
FIGURE 7.11 Application to a gas pipeline: (a) mortar filling type and (b) maintenance way type. (From Japan Society of Civil Engineers, Standard Specifications for Tunnels—Shield Tunnels, 2006, p. 17.)


95
8.1 configuration of Water Pipeline Systems
This chapter discusses water pipeline systems, whose function is to convey potable water from source points to users, as shown in Figure 8.1 [1]. Initially, water is impounded in catchment basins and their dams, from which it is conveyed via natural streams or aqueducts to a treatment plant. After treatment, the treated water is conveyed via transmission pipelines, terminal reservoirs, pressure zone tanks or reservoirs, pumping plants, distribution mains, and distribution branches to the customer. Figure 8.1 shows the water conveyed along the transmission pipelines to the distribution area as shown in Figure 8.2, in which a reservoir is located in each distribution area to store the water volume. These reservoirs also serve to smooth out fluctuations in demands. In order to maintain a reliable supply in emergency situations, a gridded distribution network is highly preferable. The water that is stored in the reservoir is supplied to all demand nodes via distribution mains and network system branches as shown in Figure 8.3. The distribution mains (also termed trunk mains) are the primary conveyance in the water network system, with the distribution branches being subsidiary pipelines to supply water to each customer. Service connections are the final link connecting (typically through a water meter) the distribution branch to the customer’s own plumbing, as shown in Figure 8.4.
8.2 characteristics of Water Pipelines
8.2.1 Aqueduct
An aqueduct is a below-ground tunnel or above-ground open or closed channel that conveys raw water from the dam to the water treatment or “purification” plant. There are several methods to convey raw water through aqueducts and transmission pipelines: the natural flow method using
8Water Supply System:
Design Aspects
8.1 Configuration of Water Pipeline Systems .......................................958.2 Characteristics of Water Pipelines ...................................................95
Aqueduct • Transmission Pipelines • Distribution Pipelines • Service Connections • Pipe Varieties
8.3 Design of Water Pipeline Systems ..................................................104Basic Concept of Pipeline Design • Seismic Design of Water Pipeline Systems • Pipes • Pressure • Pipe Diameters • Pipe Location and Depth • Foundation of Pipelines • Protection of Geometrical Piping • Indication of Pipeline Location • Cathodic and Other Corrosion Protection • Expansion Joints • Apparatus and Equipment • Water Stations • Design of Water Pipe Bridges
References ......................................................................................................152Takeshi KoikeKyoto University

96 Construction Technology of Lifeline Pipelines and Its Facilities
elevation difference, the forced flow method by pumping up, and their combined method as shown in Figures 8.5 and 8.6.
When the ground condition is flat and located with an effective elevation gap between the starting and ending points, the natural flow method is generally adopted. If any effective elevation gap is not obtained, a pumping-up method or a combined method is selected.
Source Purification plant
Distribution
Water stationWater supply
FIGURE 8.1 Configuration of water pipelines and their facilities.
Purification plant
Purificationplant
Main transmission pipeline
Zone A Zone B
Station Station
Subtransmission pipeline
FIGURE 8.2 Network of transmission pipelines.
Station
Trunk distribution main
Area
Subdistribution main
HousingHousing
Distribution main
Distribution line
FIGURE 8.3 Network of distribution system.

97Water Supply System: Design Aspects
Water meterService line
Distribution pipe
Roadside
Leakage responsiblefor water company
Section responsible by customer
Housing
FIGURE 8.4 Profile of a service line. Note: Figure 8.4 shows the service line is responsible for customers in Japan. But, in the United States, the service line before the main is often the responsibility of the utility, not the customer. It should be noted that the responsibility varies depending on local laws and practice.
Dam Intake towerJunction well
Hydraulic grade
Junction well Downwardwaterway
Purification plantArrival well
DuctTunnelPipelineTunnel
HWL
LWL
Water bridge
Buriedpipeline
FIGURE 8.5 Illustration of gravity flow.
Hydraulic grade line Purificationplant
Reservoir
Mai
n pu
mpi
ng st
atio
nPu
mpi
ng w
ell
Inta
ke po
int
Settl
ing b
asin
Surg
e tan
k
Airvalve
Airvalve
AirvalveGate
valveGatevalve
Gatevalve Blowoff
Arrival well
FIGURE 8.6 Illustration of pumping-up system of water flow.

98 Construction Technology of Lifeline Pipelines and Its Facilities
If an accident occurs at an aqueduct and flow is stopped, service to a large-scale area is suspended. Therefore, an aqueduct is expected to provide high-reliability supply of an adequate amount of raw water. Redundant pipeline allocations are often provided to assure adequate reliability.
In the natural flow method, an open channel flow method is also adopted, versus the tunnel method, with various channel structures, as shown in Figure 8.7.
8.2.2 transmission Pipelines
Transmission pipelines convey purified water from the purification plant to the distribution network system.
Since raw water from an aqueduct and purified water after the treatment process must not be mixed, care must be taken to maintain safe operation of the system. There are several methods to convey the purified water to the distribution network such as the natural flow method, the pumping-up method, and the combined method.
The transmission pipeline must keep a stable supply both for daily use and in an emergency situation or period of drought. When the transmission pipeline is connected between a single purification plant and a single reservoir or tank, a duplicate pipeline system is usually provided, to allow outages of one line for maintenance work. A mutual accommodation agreement is recommended between neighboring water authorities.
For disaster protection from seismic hazard or leakage accidents in the case of the natural flow method, an emergency shutoff valve should be installed at the exit point of the reservoir. A remote con-trol system of valves is also important and recommended.
8.2.3 Distribution Pipelines
Distribution pipelines convey purified water from the reservoir of the distribution system to the demand node of each house.
Segment
Diameter
Secondary lining concrete
HWL
HWL
HWL
HWL
(a)
(e) (f)
(b)
(c)
HWL
(d)
HWL
FIGURE 8.7 The cross section of various open channel water conveyances. (a) Open cut type with covers, (b) open cut type without covers, (c) culvert type, (d) trapezoid type without covers, (e) buried tunnel type, (f) shield tunnel type.

99Water Supply System: Design Aspects
Distribution pipe size and properties are selected according to the requirements of hydraulic, envi-ronmental, and construction conditions. Hydraulic safety is assessed for water pressure and external pressure. The thickness of the pipe wall must be able to resist the maximum pressure. Water pressure is given as a summation of the maximum static water pressure and hydraulic inertia pressure. The external pressures are composed of soil pressure, traffic load, and seismic force.
Especially in seismically sensitive areas, pipes and joints should be adopted to considering seismic loading, and the network system should be also redundant and resilient. The seismic design adequate for the importance of the pipelines is also required.
Additionally, the following items must be taken into consideration in the installation of the distribu-tion pipelines: special joint installation, protective earthwork of geometrical piping, and a corrosion-protective method.
In general, distribution pipes are installed by the trenching construction method. In order to avoid traffic jams, noise, and vibration effects caused by trenching a trenchless method or shield tunneling method is often adopted. The most appropriate method can be selected on the basis of soil and construc-tion conditions. When a multipurpose underground utility conduit is constructed by the road adminis-trator, the distribution pipelines can be installed in this conduit.
Retrofit or replacement must be considered for deteriorated or aged pipes. For pipelines exposed to accidents due to deterioration, seismic reinforcement or replacement with new pipes with seismically strong joints is essential to ensure future seismic safety.
8.2.4 Service connections
Service connections are from the distribution branch point to the connection of each house. Past the connection, plumbing and appliances must meet the applicable specifications and ordinances with regard to materials, sizes, and workmanship. In Japan, standards of the Japan Industrial Standard (JIS) committee and the Japan Water Works Association (JWWA) suffice for this purpose. Self-certificated products or third-party certificate products are also possible.
8.2.5 Pipe Varieties
The following pipe varieties are used for water supply: ductile cast iron pipe, steel pipe, stainless steel pipe, rigid polyvinyl chloride (PVC) pipe and polyethylene water pipe. Since these pipes are each dif-ferent in their respective material, production method, allowable dimension, strength, and internal and external coating method, the most appropriate pipe should be selected from the viewpoint of safety, seismic performance, and maintenance accessibility. In the case of a natural flow aqueduct, for example, prestressed concrete cylinders or centrifugal reinforced concrete pipes are used.
8.2.5.1 Ductile cast iron Pipe
8.2.5.1.1 CharacteristicsDuctile cast iron pipe is classified into two categories: pearlite and ferrite.
Ductile cast iron pipes used as water pipes must be strong enough to withstand both tensile and impact force. Ferrite-type ductile cast iron pipe is generally used for water pipes because it has a higher tensile strength than the high-quality cast iron pipe, and it also has a superior elongation property in comparison to the pearlite-type pipe.
In Japan, ductile cast iron pipe is regulated by the JIS G 5526 in which the strength should be 42.8 N/mm2 (or 420 kgf/mm2) and the elongation should be more than 10%.
The advantages of the ductile cast iron pipe include strength, excellent durability, high ductility, and great shock resistance. Various types of mechanical joints are also prepared for many purposes, show good flexibility for ground settlement, and are easy to install.

100 Construction Technology of Lifeline Pipelines and Its Facilities
On the other hand, ductile cast iron pipe is heavy and susceptible to corrosion when damaged, either internally or externally. Certain joints require installation of a protection block.
8.2.5.1.2 Types of JointThere are many types of joints hereunder:
1. Type K: Figure 8.8. 2. Type T: In order to improve the speed of installation, a push-on-type joint such as Type T joint was
developed (Figure 8.9). 3. Type U: This joint was developed to make jointing work possible internally (Figure 8.10). 4. Type KF: This joint is developed to protect the pulling-out failure mode of Type K joint. This pipe
is always used at the bending points where Type S joint pipes must be used in straight pipe sec-tions (Figure 8.11).
5. Type US: This joint was developed to add seismic resistance to the Type U joint. This joint is useful to minimize the trench width, because installation work is possible from the inside of the pipe (Figure 8.12).
6. Type UF: This joint is used at the bending portion in which the straight portion uses Type US joint pipes (Figure 8.13).
Nut Bolt
Socket
Follower Rubber ring Spigot
FIGURE 8.8 K-type joint.
Rubber ringSocket
Heel Valve
Cross sectionof rubber ring
Spigot
FIGURE 8.9 T-type joint (for 300–600 mm diameter).
Rubber ring Follower
Split ring Bolt Supporting bar
SocketStopper
SpigotInfilling mortar
Effective length
FIGURE 8.10 U-type joint (Y: standard gap length).

101Water Supply System: Design Aspects
7. Type S: Type S joint was developed to resist seismic effects such as large ground movements and liquefaction. The seismic performance capacity of this joint is ±1% in its elongation and 3.0 DkN in its tensile force, and the allowable bending angle of 4° (Figure 8.14).
8. Type SII: Type SII was developed for the Type S joint pipe, which has a smaller diameter (Figure 8.15).
9. Type NS: The Type NS joint pipe is a simplified version of the Type SII joint (Figure 8.16). 10. Type PI: The Type PI joint is used for installing the existing pipe (Figure 8.17). 11. Type PII: The Type PII was developed for the prevention (1.5 DkN is expected as the resisting
force) of the pulling-out failure mode in the Type PI joints (Figure 8.18).
FollowerBolt and Nut
Sealing cap
Setting boltSealing ring
Socket
Locking ringRubber ringSpigot
FIGURE 8.11 KF-type joint.
Infilling mortar in tube Vinyl tube
Rubber ringSplit ring Bolt
Follower Supporting bar
Infilling mortar
Effective lengthSpigot withprotrusionLocking ring
FIGURE 8.12 US-type joint.
Setting bolt
Rubber ring Follower BoltSupporting bar
Socket
Infilling mortarLocking ringSpigot
FIGURE 8.13 UF-type joint.

102 Construction Technology of Lifeline Pipelines and Its Facilities
Bolt and nut Locking ring
(hand of doors)Socket
Y
Effective length
Backup ring
Spigot with protrusion
Rubber ringSpigot
Follower(split type)
FIGURE 8.15 SII-type joint (Y: standard gap length).
Rubber for centering of locking ring
Locking ringRubber ring
Socket
Effective lengthSprit withprotrusion
SpigotY
FIGURE 8.16 NS-type joint (Y: standard gap length).
Rubber ring SocketSetting bolt
Spigot ringSpigot
FIGURE 8.17 PI-type joint.
Setting bolt Rubber ring Socket
SpigotLocking ring
FIGURE 8.18 PII-type joint.
Bolt and nut Follower
Locking ring
Socket
Effective lengthBackup ring
Rubber ring
Spigot
Split ring
Y
FIGURE 8.14 S-type joint (Y: standard gap length).

103Water Supply System: Design Aspects
8.2.5.2 Steel Pipes
8.2.5.2.1 CharacteristicsThe first JIS code of steel pipes for water pipelines was given in 1933. Since then, there have been revisions in 1952 and 1987, which are applicable to pipes of nominal diameters of 80–3000 mm.
Arc-welded steel pipelines are used for plant piping, gas pipelines, oil pipelines, and water pipelines. Steel pipes have strong tensile strength and large flexibility, so that steel pipelines better resist large internal and external pressures. Once the steel pipe exceeds the plastic limit, the steel pipe stress is redistributed. Then the pipe is elongated as much as possible until it exceeds the tensile failure level. An arc-welded steel pipeline is strong enough not only for uneven settlement and seismic ground motion, but also to withstand leakage and any other damage.
Internal and external coatings can provide good long-term corrosion resistance and durability. Since the steel pipes do not have large variations in their quality, they are used especially for the most impor-tant portion such as a river crossing pipeline.
When a large stress is forced by thermal expansion, uneven settlement, or earthquake-induced per-manent deformations of the ground, expansion joints should be installed at those points.
8.2.5.2.2 Pipe VarietiesThe standard specification in Japan of the steel pipe for transmission or distribution network systems is JWWA G 117 and JIS G 3443 for the coated water pipelines. In general, coating specification is epoxy resin coatings for internal surfaces and polyurethane coating for external surfaces. Arc-welded jointing is necessary for jointing steel pipes.
The standard specification of the steel pipe for service lines to the house is regulated by the govern-mental and ministerial ordinance No. 14 of the Ministry of Health, Labor and Welfare. The following pipes are adequate for this ordinance: rigid PVC lining steel pipe (JWWA K 116 for 13–150 mm nominal diameter) and polyethylene powder lining steel pipe (JWWA K 132 for 13–100 mm nominal diameter). A screw-type jointing method is used for these pipes.
8.2.5.3 Stainless Steel Pipes
8.2.5.3.1 CharacteristicsStainless steel does not corrode easily. The corrosion-protective surface is formed by a passive belt coat-ing of chrome iron oxide. The stainless steel is classified into three categories: martensitic, ferritic, and austenitic–ferritic. These three stainless steels are different in their physical properties such as magnetic characteristics, coefficient of thermal expansion, and thermal conductivity; in their mechanical char-acteristics, such as tensile property, creep property, and impact property; and also in their corrosion characteristics.
Austenitic stainless steel is adopted as a stainless steel pipe for water pipelines.
8.2.5.3.2 Pipe VarietiesThe standard specification of the stainless steel pipes has the following categories: stainless steel pipe for piping (JIS G 3459), stainless steel pipe for large-diameter arc-welded joint (JIS G 3468), and stainless steel pipe for service line (JWWA G 115).
8.2.5.4 Polyethylene Water Pipes
This is one type of plastic pipe. For the jointing, the thermal melting method or mechanical joint method is used. This pipe is lightweight and suitable in cold climates as well as for impact forces. But this mate-rial can be damaged by organic solvents or gasoline.

104 Construction Technology of Lifeline Pipelines and Its Facilities
8.2.5.5 Rigid Polyvinyl chloride Pipe
This pipe is superior in terms of corrosion and electric corrosion. Since this pipe is lightweight and has a low chance of rust, jointing work is easy. However, this material is inferior in terms of impact force, thermal effect, easy deterioration for ultraviolet light, and vulnerable in cold conditions. This material is also easily melted by organic solvents such as thinners. For jointing, the TS method (using adhesive agents for a vinyl pipe) and the RR method (rubber bonds) are used.
8.3 Design of Water Pipeline Systems
8.3.1 Basic concept of Pipeline Design
8.3.1.1 General Remarks
8.3.1.1.1 Basic ItemsA distribution pipeline network is a system to convey potable water from the purification plant to the demand nodes [2]. This system is composed of reservoirs, aboveground storage tanks, elevated tanks, distribution pipelines, pumping stations, valves, and other facilities.
The distribution network system must supply the water in stable flow and adequate pressure condi-tions for seasonally and temporally variable demands. This system is also effectively managed in terms of plant maintenance, water quality control, and emergency water supply for firefighting activities.
8.3.1.1.2 Design Requirements for Service ReservoirsService reservoirs have various roles that include controlling the temporal variations of the water demanded from the distribution service areas and minimizing the deviations of demand flow in case of accident or emergency.
For this purpose, the capacity and location of the reservoirs must be prepared bearing both daily and emergency demands in mind.
The capacity can be estimated as the summation of the mean demand volume and the temporal varia-tion, emergency uses, and firefighting water demand.
The target water capacity of reservoirs for each distribution area should be determined by taking into account the actual demand trend of each area.
8.3.1.1.3 Improvement for Distribution PipelinesDistribution pipelines should be designed to meet the service requirements not only in the stable flow and adequate pressure conditions but also in emergency conditions. It is important that the water qual-ity in the distribution pipelines be maintained and access for pipe repair works in very complicated distribution pipeline networks be made easy to satisfy this requirement.
The diameter and thickness of the distribution pipelines can be designed to meet internal hydraulic conditions and external load conditions. The distribution pipeline system is classified into two systems: the distribution mains and distribution branches. The distribution mains are pipelines to convey water from reservoirs to demand nodes connected to a distribution branch. The distribution branch pipeline brings water to each service point connected to a service line of each house.
The following points are important for the improvement of the distribution pipeline network system:
1. General matters a. Prevention of negative pressure. b. Selection of pipe material and joint systems appropriate for being buried and to take corro-
sion protection into consideration if necessary. c. Valve locations determined to minimize water stoppage areas in emergency conditions.

105Water Supply System: Design Aspects
d. To take shallow installation into consideration to reduce construction costs and to minimize construction-associated debris. The effect to the maintenance caused by shallow installation must also be taken into account.
2. Distribution mains a. In order to maintain mutual connections, a loop-type system configuration of the distribu-
tion mains network, instead of a tree-type system, is preferable. b. The water demand capacity of the distribution mains can be estimated as the summation of
the total demand of the distribution areas and the additional supply capacity to the neighbor-ing distribution mains in emergency conditions. This additional supply capacity should be evaluated from the capacity of the plant capability and from the demand characteristics of the distribution areas.
c. Mutual accommodation with other distribution mains should always be arranged to meet both daily and emergency requirements.
3. Distribution branches a. The distribution branch has an adequate block size for water supply that can escape from the
stagnation of water flow. Any pipeline dead end must not be allocated in this branch. b. Several valves should be installed to obtain mutual flow control between neighboring distri-
bution blocks. c. The minimum dynamic pressure at the service branch point must be more than 0.15 MPa.
If water supply is possible at a dynamic pressure less than 0.15 MPa, this requirement is not always applied. (In Japan, this requirement is governed by Ministerial ordinance No. 15 of Ministry of Health, Labor and Welfare.)
d. The minimum static pressure at the service branch point must be less than 0.74 MPa. If water supply is possible at a static pressure more than 0.74 MPa, this requirement is not always applied. (In Japan, this requirement is governed by Ministerial ordinance No. 15 of Ministry of Health, Labor and Welfare.)
8.3.1.2 Design Formula of Pipe Wall thickness
This section discusses the design formula of the pipe wall thickness for the ductile cast iron pipes. The formula for the steel pipe, on the other hand, can be referred to in the design guideline of waterworks plants published from JWWA.
Applied loads to pipe are static water pressure, water hammer pressure, and soil pressures from the vertical surcharge and from traffic loads.
Using the static water pressure Ps and the water hammer pressure Pd, the hoop stress σt due to internal pressures Pd is given by
σt
s dP P D
t=
+( )2
(8.1)
in which D, t are pipe diameter (mm) and pipe wall thickness (mm).Using the bending moment Mf due to soil pressure, and the moment Mt due to traffic load, the bend-
ing stress σb due to the external force is given by
σb
f tM M D
Z=
+( ) (8.2)
whereZ = (bt2)/6b is the unit length of pipe

106 Construction Technology of Lifeline Pipelines and Its Facilities
Then, assuming b = D
σb
f tM M
t=
+( )62
(8.3)
These moments of soil pressure Wf (kN/mm2) and traffic load Wt (kN/mm2) are calculated from the fol-lowing formula:
M K W R
M K W R
f f f
t t t
=
=
⎧⎨⎪
⎩⎪
2
2 (8.4)
whereKf is a coefficient given by the supporting angle at the foundation bed as shown in Table 8.1 and
Figure 8.19Kt is a coefficient of the value 76 × 10−6 at the pipe head and 11 × 10−6 at the pipe bottom as shown in
Figure 8.20
Using Equation 8.4,
σb
f f t tK M K M R
t=
+( )6 2
2 (8.5)
TABLE 8.1 Coefficient for Supporting Angle at Pipe Bed (Ductile Cast Iron Pipe)
Supporting Angle at Pipe Bed (°) 40 60 90 120 180
Location Head 140 × 10−6 132 × 10−6 120 × 10−6 108 × 10−6 96 × 10−6
Bottom 128 × 10−6 223 × 10−6 160 × 10−6 122 × 10−6 96 × 10−6
WfR
Wf /sin q
2 q
Wf
Mf
FIGURE 8.19 Load distribution by overburden soil weight.
1.64Wt
Wt
Wt
FIGURE 8.20 Load distribution of traffic load.

107Water Supply System: Design Aspects
In the pipe wall thickness design of ductile cast iron pipe, the allowable stress method has been adopted.
When the equivalent tensile stress due to the bending stress is approximately evaluated by 0.7σb, the combined hoop stress σt + 0.7σb must be less than the pipe strength. If the partial safety factor for each stress component is given by 2.5 for static pressure, 2.0 for water hammer pressure, and 2.0 for soil pres-sure, the combined stress can be related to the pipe strength as
2 5 2 0 0 7 2 0. . . .σ σ σts td b S+( ) + ( ) = (8.6)
whereS is the pipe strength (N/mm2)σts,σtd are hoop stresses due to static pressure and water hammer pressure, respectively
Using Equations 8.1 and 8.5, Equation 8.6 is rewritten as follows:
St P P tD K W K W Ds d f f t t2 21 25 2 1 0− +( ) − +( ) =. .
Then,
t
P P P P S K W K W
SD
s d s d f f t t=
+( ) + +( ) + +( )1 25 1 25 8 4
2
2. . .
(8.7)
The nominal pipe wall thickness T is given by
T
t t
t t=
+( ) × + ≥
+( ) × + <
⎧⎨⎪
⎩⎪
2 1 1 2 10
2 1 0 2 10
. , ( )
. , ( )
for mm
for mm
Since this wall thickness is evaluated at the pipe head point and pipe bed point, a comparatively larger thickness should be adopted.
8.3.2 Seismic Design of Water Pipeline Systems
The seismic design of the water pipeline systems is shown in the guidelines of seismic resistance method for waterwork facilities (JWWA 2000).
In the process of planning, designing, and constructing water pipeline systems, special care should be paid to all the structures according to their importance, and these structures must be safe for seismic ground motions as well as permanent ground displacements such as liquefaction-induced unsettlement or lateral spreading. Even if a part of the structural system is damaged, the whole system must be con-structed so that it can rapidly recover.
8.3.2.1 Basic concept of Seismic Design Method
8.3.2.1.1 Materials and JointsIn constructing the water pipeline systems, materials equivalent to or of higher quality than those meet-ing the standard specification, for example JIS and JWWA, should be selected. These materials must also show good seismic performance.
When an earthquake occurs, large relative displacements appear in the ground surface, and the ground response increases at the boundary areas in which soil properties or layer structures change. Large relative displacements can also be obtained at a connected point between the structure (reservoirs and valve stations) and the pipeline where their structural rigidities are mutually different.

108 Construction Technology of Lifeline Pipelines and Its Facilities
In order to absorb these relative displacements, an expansion joint or seismically resistant joint should be installed at such connected portions in order to escape any seismic damage.
When reinforced concrete structures are designed and constructed, special care should be taken to ensure water tightness with concrete mixing conditions, reinforcing bar alignment, wall thickness, pro-tective coating, expansion joints, and treatments around the wall-penetrating hole.
8.3.2.1.2 Earthquake-Resistant Approach of Water Pipeline SystemsThe seismic design of the water pipeline system requires seismic safety not only for each structural element, but also for the whole system under a given earthquake, which is predicted as the first main scenario at the site.
One approach from the structural aspect to obtain the seismic performance of the whole system under adequate seismic damage assumptions is to improve the seismic safety of the main plants such as the source water intake plants and purification plants, main pipelines such as transmission and distribution main lines, and reservoirs, which are useful as the water supply point in any emergency situation.
Additionally, in order to maintain a designated water supply level under damaged conditions, a redundant and flexible system of plants, pipelines, and mutual interconnections among blocked distri-bution network systems is important. In addition to the water supply structures, the emergency control headquarters must also be seismically reinforced or retrofitted.
From a social aspect, the other approach alternative is to prepare the total seismic damage prevention plan to meet the restoration planning under adequate social damage conditions.
8.3.2.2 Basic Procedures of Seismic Design Method
8.3.2.2.1 General RemarksWater pipeline facilities must be designed to assure their own seismic performance, which are deter-mined based on their importance and seismic load severity.
Water pipeline systems are composed of the following components:
• Underground storage tanks and reservoirs that are classified to be a rigid body.• Underground structures such as buried pipelines, tunnels and conduits, and riser towers con-
nected to a shield tunnel. These structural responses are affected by ground deformations.• Aboveground structures such as elevated tanks, reservoirs, and pipe bridges. The structural
responses excited by seismic ground motion are amplified with the typical periods of their structures.
• The headquarter and control buildings at the purification plants.• Dams and any other structures.
These structures should be seismically designed to meet their structural requirements.
8.3.2.2.2 Earthquake Ground Motions for Seismic DesignIn terms of seismic load, two types of ground motion are used for seismic design. It is assumed that in a structure’s service life, it will experience Level 1 ground motion at least once, but the probability of a strong ground motion (Level 2) is very low.
Level 1 ground motion (noted as L1) is the largest ground motion to be predicted around the site area during the service period, and Level 2 ground motion (L2) is the largest possible ground motion to be predicted around the site area.
8.3.2.2.3 Importance of Water Pipeline FacilitiesThe importance of water pipeline facilities is classified into A1, A2, and B rank, respectively, as shown in Table 8.2. Details of the important facilities are listed in Table 8.3.

109Water Supply System: Design Aspects
8.3.2.2.4 Seismic Performance of Water Pipeline SystemsSeismic performance categories are defined as follows:
• Seismic performance 1: The state in which the system function is maintained• Seismic performance 2: The state in which structural components may be slightly damaged, but
can be rapidly repaired so that the system function is not, or only slightly, affected• Seismic performance 3: The state in which structural components may be damaged but restored in
a certain period so that the system function will be recovered in due time
8.3.2.2.5 Target Seismic Performance of Water Pipeline SystemsThe water pipeline system should be designed to keep these seismic performances in their own design conditions.
Figure 8.22 is given for Level 1 ground motion, in which the performance level is given that the important facility of the importance levels A1, A2, and B must remain intact in the seismic event. Figure 8.23 is given for Level 2 ground motion in the same manner.
Especially, since the seismic performance of the pipelines including the pipe bridges is required not to produce any leakage, seismic performance 3 is not acceptable (Tables 8.4 and 8.5).
8.3.2.2.6 Detailed Procedures of Seismic Design MethodThe seismic design procedures are shown in Figure 8.21:
1. Selection of construction site 2. Selection of the seismic performance to meet the importance of the facility
TABLE 8.2 Rank of Importance for Water Service Facilities
Rank of Importance Water Service Facilities
A1 Important facilities shown in Table 8.3 in which A2 facilities are excludedA2 Among the important facilities shown in Table 8.3, the following facilities are defined as A2:
(1) redundant system or (2) by the facility damage, its secondary damage will not be followed
B Any water service facilities that are excluded from A1 and A2
TABLE 8.3 Important Facilities for Water Supply Systems1. Intake facility, dams, aqueduct, purification plants, transmission pipelines2. Distribution facilities that have higher possibility to develop secondary damages3. Distribution facilities that are not included in (2), but distribution mains, pumping station, and reservoirs directly
connected to the distribution mains
TABLE 8.4 Seismic Performance of the Water Service Facilities for Level 1 Ground Motion
Rank of Importance Seismic Performance
1 2 3A1 — —
A2 — —
B —
Note: The triangle symbol means facility (B), which can recover after the minor repair work of the dam-aged portion.

110 Construction Technology of Lifeline Pipelines and Its Facilities
3. Investigation of the ground conditions at the site 4. Selection of the structural type and determination of the facility dimensions 5. Seismic calculation 6. Seismic assessment of the seismic performance
8.3.2.3 Seismic Design Method of Pipelines
The seismic design method of aqueducts and transmission and distribution pipelines are given in the guideline of earthquake-resisting design and engineering for the waterwork facilities.
8.3.2.3.1 General RemarksThe seismic safety of the pipelines can be assessed by using the stress and strain of the pipe and the rela-tive displacement at the joint with a method that can reflect the dynamic responses in the ground. The assessment criteria are shown in Table 8.6.
Since buried pipelines are forced to behave with the response of the surrounding ground, the seismic design method of such pipelines is executed by the response displacement method. This amplitude is calculated with the design response spectrum that was given as the envelope of the response spectrum calculated from historical earthquakes.
The response displacement method is a static analysis approach, and the dynamic response is reflected by the seismic response spectrum of the ground. It should be noted that the ground is assumed to be homogeneous. If any inhomogeneity of the surface ground is taken into consideration, an indication coefficient η is introduced in order to classify its inhomogeneity. The seismic design is assessed as shown in Figure 8.22 with
• The pipe stress and strain• The relative displacement and bending angle of the joint in the axial direction
8.3.2.3.2 Seismic Design Calculation Method of Buried Pipelines by Response Displacement MethodThe ground strain in the axial direction is given by
ε
πG
hU
L= (8.8)
whereεG is a ground strainUh is a displacement amplitude of the surface ground at the pipe depth when a horizontally traveling
seismic wave is transmitted to the incident angle of 45°L is a wavelength that is given by
TABLE 8.5 Seismic Performance of the Water Service Facilities for Level 2 Ground Motion
Rank of Importance Seismic Performance
1 2 3A1 — —
A2 — —
B — —
Note: The star symbol means facility (B), which is expected to be recovered soon.
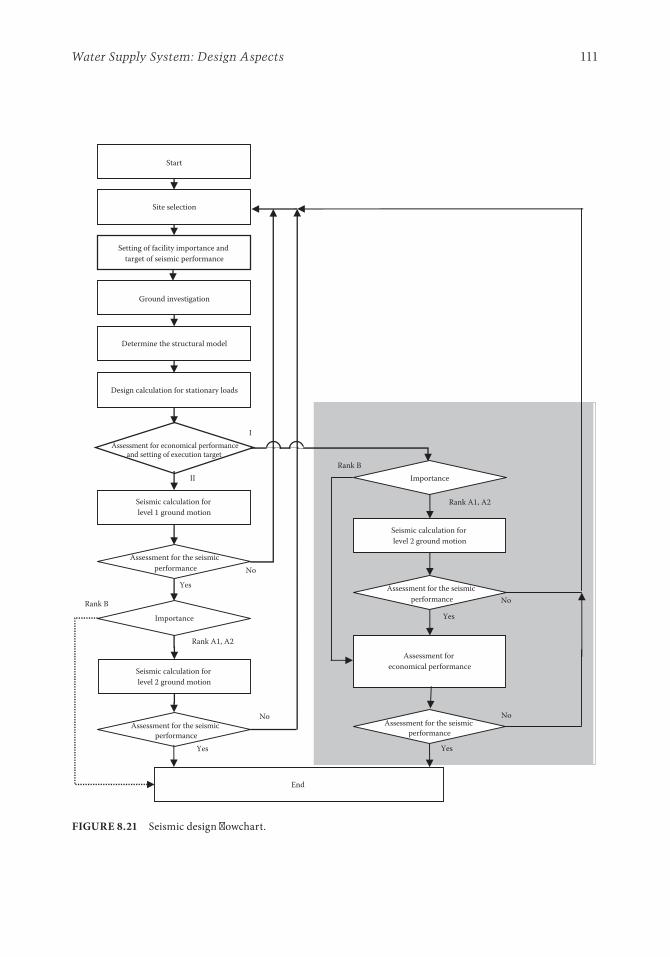
111Water Supply System: Design Aspects
Site selection
Setting of facility importance and target of seismic performance
Ground investigation
Determine the structural model
Design calculation for stationary loads
Assessment for economical performanceand setting of execution target
Seismic calculation for level 1 ground motion
Assessment for the seismic performance
Importance
Seismic calculation for level 2 ground motion
Assessment for the seismic performance
Rank B
Rank B
Rank A1, A2
Rank A1, A2
Importance
Seismic calculation for level 2 ground motion
Assessment for the seismic performance
Assessment for economical performance
Assessment for the seismic performance
Yes
Yes
No
No
End
Yes
Yes
No
No
I
II
Start
FIGURE 8.21 Seismic design flowchart.

112 Construction Technology of Lifeline Pipelines and Its Facilities
TABLE 8.6 Critical Values for Assessment
Pipe
Item Seismic Load
Earthquake ClassGround Motion
DBELevel 1
MCELevel 2
Ductile cast iron pipe Allowable joint displacement Ucr Ucr
Allowable joint bending angle θcr θcr
Steel pipe Allowable strain 23t/D 46t/D
Setting of the seismic load for level 1 ground motionDesign seismic intensity at the base rock
local area modification factor, seismic intensity at base rock
Setting of the seismic load for level 2 ground motion
Typical period of the surface ground
Ground displacement along the pipeline
Investigation of the ground inhomogeneity andsetting the coefficient of inhomogeneity index
Pipe dimensions
Structural parameters complying with seismic design for level 1 ground motion
Assessment for the permanent ground displacement
Safety check
Impossible
Possible
Safety check
Check the liquefaction hazard
Seismic calculation based on the response displacement method
for level 1 ground motion
Seismic calculation based on the response displacement method
for level 2 ground motion
Wavelength
Ground strain
Ground strain
Ground displacement along the pipeline expressed by response velocity spectrum
Check for requirement for level 2
ground motion
K 'h01 :
TG 4i=1
n HiVsi
L2L1L2
L1 L2
Sv
TGUh
Uh
2π2
Uh2π2
π
πxSVTG
TG
Kh́1 cos 2H
πxcos 2H
εG η L
UhπεG η L
TG
No
No
Yes
Yes
End
Yes
No
Sv'
K 'h1 CzK 'h01
Start
Cz : Sv'
FIGURE 8.22 Flowchart of seismic design calculation for buried pipelines.

113Water Supply System: Design Aspects
L
L L
L LL V T L V TDS G BS G=
+= =
2 1 2
1 22, ,for 1 (8.9)
whereVDS is an average shear velocity (cm/s) of the surface layersVBS is a shear velocity of the base rockTG is a typical period of the surface layers given by
T
H
Vi
Si
= ∑4 (8.10)
whereHi is the ith ground layerVSi is a shear wave velocity at the ith ground surface
Generally, the shear velocity of the ground is measured by seismic survey. If actual data are not available, the shear wave can be estimated by the formula in which the Standard Penetration Test (SPT) result or N-value is used as shown in Table 8.7.
In the actual ground layers, the horizontal discrepancy of shear velocity can be found. Such spatial variation of the shear velocity can be evaluated with the inhomogeneity coefficient η shown in Table 8.8.
8.3.2.3.3 Case of Level 1 Ground MotionsThe ground displacement amplitude for Level 1 ground motion is given by
U x S T K
x
Hh V G h( ) = ⎛
⎝⎜
⎞
⎠⎟
2
22 1π
πcos (8.11)
whereUh(x) is the ground response displacement (cm) at the pipe depth x (m)SV is a response spectrum velocity per one gravity acceleration as shown in Figure 8.23TG is a typical period of the surface ground
TABLE 8.7 Shear Wave Velocity of the Ground
Ground Classification Soil Classification
Shear Wave Velocity, VS (m/s)
Surface Ground Intermediate Ground Base Rock Ground
Diluvial ground Clay 129N 0.183 156N 0.183 172N 0.183
Sand 122N 0.125 200N 0.125 205N 0.125
Alluvial ground Clay 123N 0.0777 142N 0.0777 143N 0.0777
Sand 61.8N 0.211 90N 0.211 103N 0.211
Note: N means number of cycles given by SPT.
TABLE 8.8 Coefficient for Inhomogeneity of the Surface Ground
Level Coefficient Ground Conditions
Homogeneous 1 Diluvial ground, homogeneous alluvial groundPartly inhomogeneous 1.4 Alluvial ground that has layers of gradually changing
thickness or residential hillside areasCompletely inhomogeneous 2 Riverside area, alluvial ground that is inhomogeneous and
composed of drowned valleys

114 Construction Technology of Lifeline Pipelines and Its Facilities
Kh01 is the design seismic intensity in the horizontal direction at the base rock as given by
K C Kh Z h1 01=
whereCZ is the coefficient of the area characteristics as shown in Figure 8.24Kh01 is the basic seismic intensity given in Table 8.9H is a thickness (m) of the surface layer
The vertical response of the ground is estimated as
U UV h=
1
2
Resp
onse
velo
city
spec
trum
per
se
ismic
inte
nsity
of 1
.0 (c
m/s
)
Period (s)
100(0.5, 80)
(0.25, 57)
(0.1, 17.5)
100.1 1 10
FIGURE 8.23 Design response velocity spectrum for Level 1 ground motion.
Legend
Okinawa :
A : Cz 1.0B : Cz 0.9C : Cz 0.8
Cz 0.7
FIGURE 8.24 Coefficient for local modification for Japan.

115Water Supply System: Design Aspects
8.3.2.3.4 Case of Level 2 Ground MotionsThe ground response displacement (cm) for Level 2 ground motion at a depth of x is given by
U x S T
x
Hh V G( ) = ʹ ⎛
⎝⎜
⎞
⎠⎟
2
22ππ
cos (8.12)
in which SV′ is the response spectrum velocity for Level 2 ground motion as shown in Figure 8.25.If inhomogeneous ground is supposed to be seismically amplified, an overdesigning factor of 1.2 is
often applied.
8.3.2.3.5 Seismic Design Calculation Method of Joint, Pipe Body, and Axial Pipe Strain by Response Displacement Method
Seismic design calculations of joint, pipe body, and axial pipe strain are executed for Level 1 ground motion and Level 2 ground motion, respectively. For Level 1 ground motion, the slippage effect between the pipe and its surrounding soil is not taken into consideration to obtain the pipe stress and strain, but for Level 2 ground motion, the slippage effect must be taken into consideration.
TABLE 8.9 Basic Seismic Intensity Used for Underground Structures (Level 1)
Ground Classification Typical Period of
the Ground
Basic Horizontal Ground Intensity
Surface Ground Base Rock Ground(Kh01) (Kh02)
I Ground TG < 0.2 s Kh01 = 0.16 ʹ =Kh01 0 15.
II Ground 0.2 s ≤ TG < 0.6 s Kh01 = 0.20III Ground 0.6 s ≤ TG Kh01 = 0.24
Period (s)
Resp
onse
vel
ocity
spec
trum
(cm
/s)
1000
100
10(8)(6)
10.1 1 5 10
(0.7, 100)
(0.7, 70)
FIGURE 8.25 Design response velocity spectrum (Level 2).

116 Construction Technology of Lifeline Pipelines and Its Facilities
The soil rigidity per unit length for the axial and transverse directions along the pipe axis is formu-lated with
K Cg
V
K Cg
V
gt
S
gt
S
1 12
2 22
=
=
⎧
⎨⎪⎪
⎩⎪⎪
γ
γ (8.13)
whereγt, g, V are unit weight of the soil (N/m3), gravity acceleration (9.8 m/s2), and shear wave velocity (m/s),
respectivelyC1 and C2 are coefficients of ground rigidity per unit length in the axial and transverse directions,
respectively
Rigorously, these coefficients can be calculated by FEM. Numerical results C1 and C2 of the pipes of a diameter of 150–3000 mm in the thickness of surface layer are given by
C H D
C H D
10 4 0 25
20 4 0 25
1 3
2 3
=
=
⎧⎨⎪
⎩⎪
−
−
.
.
. .
. .
where H and D are thickness (m) of the surface ground and pipe diameter (cm), respectively.The friction force between the pipe and the surrounding soil is estimated approximately as 0.01 MPa,
which will be used in the seismic assessment for Level 2 ground motion. If the pipeline is so important or so complicated to assess with more precise analysis, a nonlinear response analysis should be used for the assessment.
8.3.2.3.6 Seismic Design Calculation Method of Continuous Pipelines by Response Displacement MethodIn the case of Level 1 ground motion, the shear deformation of the soil at the pipe surface may not exceed the critical level of the soil capacity. Then, slippage does not occur between the pipe and the surrounding soil.
In the case of Level 2 ground motion, on the other hand, the shear deformation of the soil at the pipe surface may exceed the critical level of the soil capacity. In this case, slippage occurs between the pipe and the surrounding soil.
8.3.2.3.6.1 Calculation of Pipe Stresses ( for Ductile Cast Iron Pipes) For Level 1 ground motion, the pipe stresses are estimated by the following formula:
σ απ
σ απ
σ σ σ
1 1
1 2
2
2
1 12
12
2
Lh
Bh
x L B
U
LE
DU
LE
=
=
= +
⎧
⎨
⎪⎪⎪
⎩
⎪⎪⎪
(8.14)
whereσ1L, σ1B, and σ1x are an axial stress (Pa), a bending stress, and a combined stress, respectivelyα1 and α2 are conversion factors from the ground strain to the pipe strain as given by

117Water Supply System: Design Aspects
α
π λα
π λ1
12 2
24
1
1 2
1
1 2=
+ ʹ=
+( ) ( )/,
/L L (8.15)
whereλ1 1= ( )K EAg /
λ2 24= ( )K EIg /
L′, L, E, A, I, Uh, D are apparent wavelength equal to 2L (m), wavelength (m), elastic rigidity of the pipe material (Pa), cross-sectional area of the pipe (m2), cross-sectional rigidity (m4), ground response displacement in the horizontal direction (m), and pipe diameter (m).
For Level 2 ground motion, the axial stress of the buried pipeline is given by
σ
π τ2
4L
D L
A=
ʹ (8.16)
This equation is derived on the assumption that Level 2 ground motion forces the slippage at the pipe surface along the apparent wavelength. Any other stresses of transverse component and combined one are given by the same formula shown in Equation 8.14. If any additional safety is necessary for the pipeline, the partial safety factor γ of 1.0–3.12 could be added in the formula of Equation 8.14 in the following way:
σ γσ σ1 12
12
x L B= +
8.3.2.3.6.2 Calculation of Pipe Strains ( for Steel Pipes) For Level 1 ground motion, the pipe strains are estimated by the flowing formula:
ε α ε
ε απ
ε
ε ε ε
1 1
1 2
1 12
12
2
L G
B G
x L B
D
L
=
=
= +
⎧
⎨
⎪⎪
⎩
⎪⎪
(8.17)
in which ε1L, ε1B, ε1x are axial, bending, and combined strains of the pipeline.If the ground strain εG exceeds the yield strain of the pipe εy (e.g., 0.11%), the axial pipe strain is
assumed to be ε1L = εy.For Level 2 ground motion, the seismic response of the pipeline often produces a slippage along the
pipe axis. When a pipe material shows the strain hardening of bilinear curve with hardening parameter of κ (e.g., κ = 0.1), the axial strain can be reevaluated in the following way:
εξ
εκξ κ
ε
ε ε
2 1
2 1 2
2 2
11
L
L y
L G
LL L
LL L L
L L
= ≤
= + −⎛
⎝⎜
⎞
⎠⎟ ≤ <
= ≤
⎧
⎨
⎪⎪⎪
⎩
⎪⎪⎪
(8.18)

118 Construction Technology of Lifeline Pipelines and Its Facilities
where
L
L
y
G y
1
2 11
=
= − −⎛
⎝⎜
⎞
⎠⎟
⎡
⎣⎢
⎤
⎦⎥
⎧
⎨⎪
⎩⎪
ξε
κξ εκ
ε (8.19)
ξ
τ= 2 2
Et
in which t, τ are pipe wall thickness (m) and shear stress (Pa) of the soil at the pipe surface.
8.3.2.3.7 Seismic Design Calculation Method of Pipelines with Mechanical Joints by Response Displacement Method
A pipeline that has a mechanical joint is mutually connected in the axial direction by the compressive pressure of a shielding rubber at the mechanical joint. This compressive pressure is produced by jointing flange bolts. The stress of the pipe with a mechanical joint is proportional to the stress of a continuous pipeline.
8.3.2.3.7.1 Calculation of Pipe Stress (for Ductile Cast Iron Pipes) For Level 1 ground motion, the pipe stress with a mechanical joint is given by
ʹ ( ) = ( )ʹ ( ) = ( )
ʹ ( ) = ʹ ( )⎡⎣ ⎤⎦ + ʹ
σ ξ σ
σ ξ σ
σ σ σ
1 1 1
1 2 1
1 1
2
1
L L
B B
x L B
x x
x x
x x x(( )⎡⎣ ⎤⎦
⎧
⎨
⎪⎪
⎩
⎪⎪
2
(8.20)
whereʹ ʹ ʹσ σ σ1 1 1L B xx x x( ), ( ), ( ) and are axial, bending, and combined stresses of a pipeline having a mechani-
cal joint at the point of x from the mechanical joint end, respectivelyξ1(x) and ξ2(x) are the modification factors for continuous pipelines
For Level 2 ground motion, the axial stress can be estimated by the following simplified formula:
σ
π τ2
2L
D l
A= (8.21)
where l is a pipe length (m). If a more rigorous estimation is required, nonlinear response analysis should be applied to this pipeline model.
8.3.2.3.7.2 Calculation of Pipe Strain (for Steel Pipes with Expansion Joints) When an expansion joint is located in the steel pipeline, the same approach as Section 8.3.2.3.7.1 is applied:
ʹ ( ) = ( )ʹ ( ) = ( )
ʹ ( ) = ʹ ( )⎡⎣ ⎤⎦ + ʹ
ε ξ ε
ε ξ ε
ε ε ε
1 1 1
1 2 1
1 1
2
1
L L
B B
x L B
x x
x x
x x x(( )⎡⎣ ⎤⎦
⎧
⎨
⎪⎪
⎩
⎪⎪
2
(8.22)
in which ʹ ʹ ʹε ε ε1 1 1L B xx x x( ), ( ), ( ) and are axial, bending, and combined strains of a pipeline having a mechanical joint at the point of x from the mechanical joint end, respectively.

119Water Supply System: Design Aspects
The corresponding axial strain for Level 2 ground motion is given by
ʹ =ε
τ2
2L
eL
Et (8.23)
where Le is an interval of the neighboring expansion joints (m).
8.3.2.3.7.3 Elongation and Bending of Joints Elongation and bending of joints can be obtained with the horizontal ground displacement due to Level 1 and Level 2 ground motions.
The axial displacement |UJ| of a joint can be given by
U U UJ J= 0 (8.24)
whereU0 is an axial seismic response displacement of a long stretched pipeline (m)U J is a coefficient to be given by
U U UJ a=
−=
2 1 1 1
1 10 1
γ β γ
β βα
cosh cos
sinhand
where
α
γ ββ λ γ
π1
1 12 1 1
11
1
1
2 1
2=
+= = =
ʹ=
( ), , ,
/l
K
EAl
l
LU Ug
a h
where l, L′ are a pipe length and apparent wavelength along the pipe axis, respectively.In the case of a seismic intensity greater than 4, the following simple formula for the joint displace-
ment ep (m) is possible for ductile cast iron pipelines:
e lp G= ε (8.25)
The bending angle θ (rad) of a joint is given by
θ
π=
4 2
2
lU
Lh (8.26)
8.3.2.3.8 Safety Assessment for Permanent Ground DisplacementsPermanent ground displacement is generated by liquefaction-induced vertical settlement or lateral spreading, ground cracking or fault movement.
8.3.2.3.8.1 Calculation for Axial Ground Displacement The following formula is used to assess that ground displacement can be absorbed by the total elongation of n jointing pipes such as
ε βGL n l<
When this ground displacement εGL exceeds the total elongating length nβl by n joints, on the other hand, the following assessment for joint failure is done, where the pulling force must be less than the maximum strength of the joint, such as
L
n lL
Ga− <
βε

120 Construction Technology of Lifeline Pipelines and Its Facilities
in which La is the maximum length to pull the pipe joints and is estimated by the following equation:
L
F
Da
p=π ατ
where Fp and α are the maximum resisting strength of the joint for pulling force and a reducing factor for pipe slippage, respectively, and L − (nβl/εG) is the portion of the pipe length that is locked with the mechanical locking system.
8.3.2.3.8.2 Calculation for Ground Displacement in the Axial Direction Figure 8.26 is an example where a permanent ground displacement of 2 m is produced, each pipe is 5 m in length, and joint displace-ment for a pipe is assumed to be 1% of the pipe length so that the joint displacement can be calculated as 50 mm per one joint.
New ductile cast iron pipes with locking mechanisms are adopted in this pipeline section. The axial pulling resisting force is evaluated as
F Dp mm= 3 ( )kN
where Dmm = D × 1000.Noting that the shear stress τ is approximately 0.01 MPa and α is assumed to be 1.0, the maximum
length La is
L
D
Da
mm= ≈3
100π α
m
A single pipe of 5 m length has a 50 mm allowable joint displacement. Then the total joint displacement of 20 joints in 100 m length is calculated as
50
100
51mm m× =
So this result suggests that a new ductile cast iron pipe can absorb approximately 1 m permanent ground displacement.
8.3.2.3.8.3 Calculation for Ground Displacement Perpendicular to the Pipe Axis Figure 8.27 is an exam-ple for vertical permanent ground displacements.
PGD
Symmetric
150 mm dia. NS type
100 m 2 m 100 m
50 mm
1 m 1 m
5 m
No. 1 No. 2 No. 19 No. 20
FIGURE 8.26 Schematic illustration of mechanical pipe alignment.
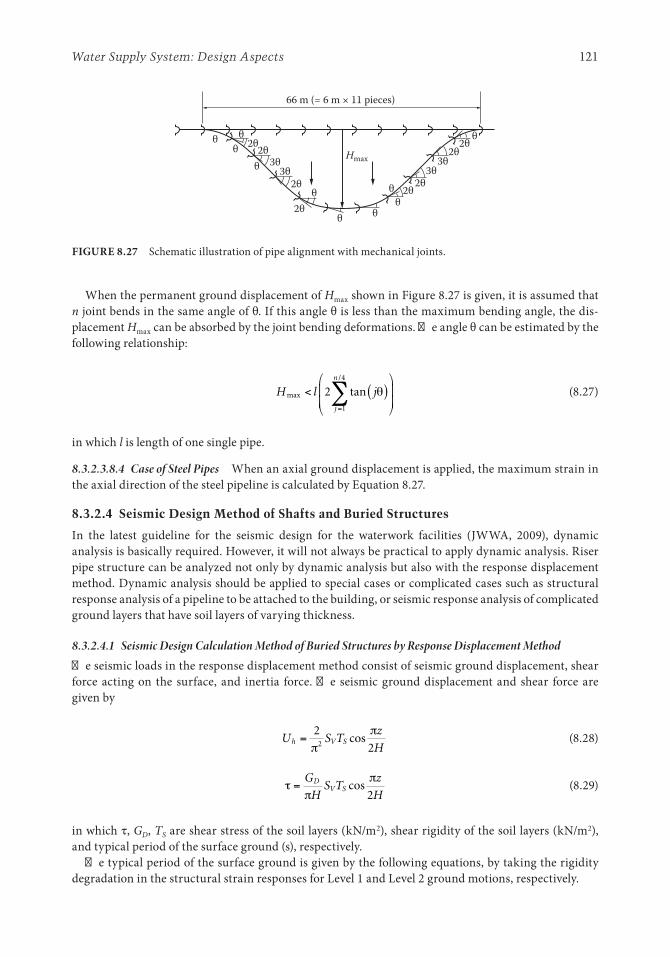
121Water Supply System: Design Aspects
When the permanent ground displacement of Hmax shown in Figure 8.27 is given, it is assumed that n joint bends in the same angle of θ. If this angle θ is less than the maximum bending angle, the dis-placement Hmax can be absorbed by the joint bending deformations. The angle θ can be estimated by the following relationship:
H l jj
n
max
/
tan< ( )⎛
⎝
⎜⎜
⎞
⎠
⎟⎟
=∑2
1
4
θ (8.27)
in which l is length of one single pipe.
8.3.2.3.8.4 Case of Steel Pipes When an axial ground displacement is applied, the maximum strain in the axial direction of the steel pipeline is calculated by Equation 8.27.
8.3.2.4 Seismic Design Method of Shafts and Buried Structures
In the latest guideline for the seismic design for the waterwork facilities (JWWA, 2009), dynamic analysis is basically required. However, it will not always be practical to apply dynamic analysis. Riser pipe structure can be analyzed not only by dynamic analysis but also with the response displacement method. Dynamic analysis should be applied to special cases or complicated cases such as structural response analysis of a pipeline to be attached to the building, or seismic response analysis of complicated ground layers that have soil layers of varying thickness.
8.3.2.4.1 Seismic Design Calculation Method of Buried Structures by Response Displacement MethodThe seismic loads in the response displacement method consist of seismic ground displacement, shear force acting on the surface, and inertia force. The seismic ground displacement and shear force are given by
U S T
z
Hh V S=
2
22ππ
cos (8.28)
τ
ππ
=G
HS T
z
HD
V S cos2
(8.29)
in which τ, GD, TS are shear stress of the soil layers (kN/m2), shear rigidity of the soil layers (kN/m2), and typical period of the surface ground (s), respectively.
The typical period of the surface ground is given by the following equations, by taking the rigidity degradation in the structural strain responses for Level 1 and Level 2 ground motions, respectively.
66 m (= 6 m × 11 pieces)
θθ
θ
θ
θ θθ
θ
θ
θ2θ2θ
2θ 2θ2θ
2θ2θ
2θ
3θ3θ 3θ
3θHmax
FIGURE 8.27 Schematic illustration of pipe alignment with mechanical joints.

122 Construction Technology of Lifeline Pipelines and Its Facilities
Level 1 ground motion : .T TS G=1 25
Level 2 ground motion : .T TS G= 2 00
where TG is the fundamental period of the ground under very small shaking.
8.3.2.4.2 Seismic Design Calculation Method of Buried Structures by Dynamic Response AnalysesThe dynamic approach can be applied to the whole structural system, and it can also be applied to a pipeline connection to the building. Level 1 ground motion is used for the elastic response analysis, but Level 2 ground motion is applied for the inelastic response analysis.
One approach is to make a model of the structure and its surrounding soil system, and the other is to separate the whole structural system into riser pipe, buried structure, and common conduit and its connected portion. For each structural component, dynamic analyses can then be applied.
8.3.3 Pipes
The following pipes can be used for distribution pipe: ductile cast iron pipe, steel pipe, stainless steel pipe, rigid PVC pipe, and polyethylene pipe. These pipes must be selected to satisfy the exudative-weeping standard, which is given by ordinance on the technical standard of the waterwork facility.
Since the pipe safety is dependent on the internal and external pressures, the pipe material and its wall thickness must be selected to satisfy the design conditions. The water pressure is composed of the maximum static water pressure and the pressure produced by water hammer, whereas the external pres-sure includes soil pressure, traffic load, and earthquake load.
If the pipe may be affected by earthquake load, seismically strong pipe and joint material should be selected. Additionally, the geometric piping configuration must be utilized to improve the seismic performance.
8.3.3.1 Selection
8.3.3.1.1 Contamination preventionIn order to protect the purified water from being contaminated by pipe materials, the water pipe must be selected to satisfy the safety criterion based on the exudative-weeping standard, which is given by the ministerial ordinance on the technical standard of the waterwork facility. For this purpose, the pipe must be tested by the method determined by the ministerial ordinance and be checked to meet the requirement of the standard.
8.3.3.1.2 Safety for Internal and External PressuresThe pipe is designed to resist internal and external pressures. The internal pressure is the maximum static pressure and the pressure produced by water hammer. The design guideline for water pipelines by the JWWA describes that the water hammer effect produces a pressure of 0.45–0.55 MPa in ductile cast iron pipe, steel pipe, and stainless steel pipe, whereas it produces 0.25 MPa for rigid PVC pipe and polyethylene pipe. The external pressure includes the soil pressure, traffic load, and earthquake load. The seismic design can be given in the seismic design guideline of water pipelines by the JWWA.
8.3.3.1.3 Buried ConditionsThe optimal pipe can be selected by taking into account the buried site conditions (soil condition and underground water), any other underground structures not related to the waterworks, and traffic load conditions.
If the buried pipe is in corrosive soils, the pipe material must be corrosion resistant. If the site condi-tion is affected by organic solvents, rigid PVC and polyethylene pipes must not be selected.

123Water Supply System: Design Aspects
8.3.3.1.4 Buried EnvironmentsPipes have their own joint systems that affect the ease of construction. When other underground struc-tures are congested or requested to install and backfill in a short period, the installation efficiency of the joint at the site must be taken into account in its selection. Additionally, an expansion joint can also be considered to meet the buried conditions.
8.3.4 Pressure
8.3.4.1 Minimum Hydrodynamic Pressure
The minimum hydrodynamic pressure at the branching point from the distribution line to the service line must be more than 150 kPa (0.15 MPa) as determined by the Ordinance No. 15 of the Ministry of Health, Labor and Welfare on the technical standard of waterwork facilities in Japan.
When the water service is directly supplied to the second floor of a building, the minimum hydrody-namic pressure should be 0.15–0.20 MPa as standard. In order to extend the service area in which the water service is directly supplied to the higher floor, special attention should be paid to solving sanitary problems in water storage tanks and on the effective utilization of energy. For carrying out this direct water supply, the water supplier must determine the minimum hydrodynamic pressure of the distribu-tion lines and its service area size by considering the distribution of the buildings and water demand characteristics of the service area.
When water is supplied to higher elevations such as the third, fourth, or fifth floor of a building, the adequate minimum hydrodynamic pressures are 0.20–0.25, 0.25–0.30, and 0.30–0.35, respectively.
8.3.4.2 Maximum Hydrostatic Pressure
The maximum hydrostatic pressure at the branching point from the distribution line to the service line must be less than 740 kPa (0.74 MPa), which is determined by the Ordinance No. 15 of the Ministry of Health, Labor and Welfare on the technical standard of waterwork facilities. The maximum working pressure of the water pipes is given by 1.00 MPa for ductile cast iron, steel, and stainless steel pipes, and 0.75 MPa for rigid PVC and polyethylene pipes. Since various kinds of pipes are used in the distribution network, the allowable pressure of 0.74 MPa is set to protect the water supply equipment. The maximum hydrodynamic pressure of 0.50 MPa is recommended to be compatible with the increasing minimum hydrodynamic pressure that is necessary for the extended service area of direct water supply to higher floors.
8.3.5 Pipe Diameters
8.3.5.1 Pipe Diameters of Distribution Pipes
The pipe diameter of the distribution network should be determined based on the network flow analysis.The dynamic water pressure of the pipe must be more than the minimum dynamic pressure of the
service area under average daily conditions and be uniformly distributed over the spatial area. The pipe diameter must be determined to satisfy the water pressure conditions so that the minimum dynamic water pressure is not less than the planning value. The water pressure in the water reservoir, storage tank, and elevated water tower should be low, and the minimum dynamic water pressure at the fire hydrants should have a positive value.
The water flow equations used in Japan are the Hazen–Williams formula, the Ganguillet–Kutter for-mula, and the Ikeda formula. The most representative equation is the Hazen–Williams formula:
H C D Q L= ⋅ − −10 666 1 85 4 87 1 85. . . . (8.30)

124 Construction Technology of Lifeline Pipelines and Its Facilities
where H, C, D, Q, L are friction head loss (m), coefficient of flow factor, pipe internal diameter (m), flow volume (m3/s), and pipe length (m), respectively. The value of C = 110 is a general value for many types of pipes, and the value of 130 is used for straight new pipelines.
8.3.5.2 calculation Method of network Flows
The network flow analysis is classified into the pipeline flow method and the pipeline pressure method.In the pipeline flow method, the pressure at every node is calculated using flow volume adjustment;
the Hardy Cross method is most popular.In the pipeline pressure method, on the other hand, the pipe flow volume is calculated from the
assumed pressure at the node point; the head node process method is most popular.The calculation procedure is as follows:
8.3.5.2.1 Calculation Method of Network Flow under Normal Conditions 1. Assume that the network configuration and all pipe diameters are known. 2. Divide the distribution system into a subdivided network of town blocks, ground elevations, and
population density. 3. Determine the planned maximum flow per hour for each pipeline. (Simplified calculation is pos-
sible on the assumption that half of the water at each pipeline flows out from one node, and the other flows out from the other node.)
4. If a major large water consumer is located in the network, its demand volume must be taken into account in the flow analysis as an outlet point.
5. The effective water head and its volume can be calculated from the water heads at all the nodes in the network and from the flow volumes given by the flow analysis method.
6. If the network model is huge, a simplified approach to reduce the size of the network may be effec-tive to solve the flow analysis.
The head loss should be exclusively estimated by the head loss friction.
8.3.5.2.2 Calculation Method of Network Flows according to the Firefighting Demand 1. When the planned population is more than 100,000, the planned maximum required water per
hour is estimated with so much allowance, and the same flow condition is applied for the flow analysis network according to the firefighting demand.
2. When the planned population is less than 100,000, the water demand of each pipeline should be preferable to be the sum of daily demand and the firefighting demand. The discharge point of the firefighting flow is assumed at the point of the worst condition. If multiple points of water dis-charge are requested, the water flow analysis method is applied to the modified network by adding the discharge nodes. The points of the worst condition mean the locations to be difficult to supply water such as the low-pressure area, high-elevation area, distant location from the reservoir or pumping station, and so on. The water volume for firefighting is calculated from the number of the hydrant to be used at the planning scheme for emergency use.
Special attention of the network flow analysis should be paid on the tree-type pipe flow.
8.3.6 Pipe Location and Depth
8.3.6.1 Location and Depth of Distribution Pipelines
The location and depth of distribution pipelines is determined by the following conditions:
8.3.6.1.1 Negotiation with Various Lifeline AdministratorsWhen a pipeline is installed under a public road, negotiations with the road administrators are neces-sary to determine the location and depth, which must be based on the Road Traffic Law and its related

125Water Supply System: Design Aspects
codes. When a pipeline is installed under a private road, a negotiation with the land owner is necessary to obtain the approval of use.
When a pipeline is installed under a public road, the distribution pipelines should be installed on the side where it will be easiest to connect to service lines. If the road width is relatively narrow, the distribution pipelines should be installed on only one side, whereas if the road width is relatively large, the distribution pipelines should be installed on both sides, along the road lane or the pedestrian lane. The road crossing must be avoided in locating the distribution pipelines to protect the leakage accidents along the service lines.
In general, an agreement on the location and depth is concluded among the lifeline companies such as road, waterworks, industrial waterworks, sewerage, gas, telecommunication, power, telephone, and so on. If any special conditions are requested on this installation, a new agreement among these lifeline companies must be concluded. Also when a water pipeline is installed along a riverbed, a car-track lane, or a private zone, an approval of use must be obtained from the owner of this area.
Standard depth of burial for water pipelines is 120 cm. If this designated depth cannot be met because of limited clearance at a bridge abutment or a narrow space with the existing lifelines, a depth of 60 cm is acceptable.
8.3.6.1.2 Neighboring ConstructionWhen a water pipeline is installed near or crossing over any existing underground structures, a spatial allowance of more than 0.30 m must be kept among those underground structures.
8.3.6.1.3 Buried Depth of Water Pipelines in the Cold RegionThe depth of water pipelines in cold regions must be deeper than the depth of frost penetration. If this is impossible, a freeze protection method such as the use of an insulation mat must be adopted to prevent the water pipes from freezing.
8.3.7 Foundation of Pipelines
8.3.7.1 Foundation of Buried Pipelines
8.3.7.1.1 Foundation of Buried Pipes8.3.7.1.1.1 Profile of Foundation For ductile cast iron pipes that are buried at the standard depth, the foundation is a flatbed and does not need any special soil. The foundation for steel pipes is the same as that for the ductile cast iron pipes. In the case that the excavation bed is rocky ground or gravel-mixed soil, a sand bed is used to reduce the bending stress and deformation of cross-sectional pipe. For rigid PVC pipes and polyethylene pipes, a 0.10 m sand bed should be installed.
8.3.7.1.1.2 Supporting Angle at Pipe Bottom (Design Supporting Angle) In the pipe wall thickness design, supporting angle at pipe bottom is necessary. This angle is evaluated by taking the ground condition, backfill soil property, and supporting angle of the foundation into account. For steel pipes and stainless steel pipes, more than 90° of the supporting angle at the pipe bottom is recommended, because 60°–150° is requested in JWWA.
8.3.7.1.2 Selection of Backfilling SoilAdequate selection of backfill soil guarantees the structural safety of pipelines. Gravel and rock materi-als must be removed from the backfill soil when using steel pipes, rigid PVC pipes, and polyethylene pipes, as the surface of these materials is easily damaged.
If the excavated soil is not adequate to use as backfilling soil material, sand and selected sandy soil materials must be utilized for backfilling work.

126 Construction Technology of Lifeline Pipelines and Its Facilities
8.3.7.1.3 Foundation in Soft GroundIn soft soil or alluvial ground, pipe installation work is difficult, as sometimes the pipe will settle in an uneven profile. When a pipeline is installed in a thin layer of soft soil, the soil pressure will be increased by the weights of pipe, water, and backfill soil. This additional weight creates ground settlement. In order to keep the pipes safe from this settlement, correct pipes and joints should be selected. In ground depths of 20%–50% of pipe diameter under the pipe bed, soil around the pipe should be replaced with sand. In the case that the soft soil ground layer is so thick that heavy-duty construction equipment cannot be operated at the trench, chemical grouting method or sand drain method is adopted to improve the ground condition. In this situation, in order to minimize the settlement, the backfill material should be replaced with sand up to the depth of 30%–100% of the pipe diameter. In such a deep trench, restraint fitting type of ductile cast iron pipe is preferable.
8.3.8 Protection of Geometrical Piping
8.3.8.1 Protection of Ductile cast iron Piping Fittings
Pipe fittings such as pipe bends, T-junctions, and reducers receive an unbalanced pressure horizontally and vertically. Since this unbalanced pressure forces the joint to be pulled out, these pipings must be protected by thrust blocks.
8.3.8.1.1 Internal PressureThe internal pipe pressure is calculated as the summation of the maximum static pressure and water hammer pressure.
The protection forces come from the soil weight, soil pressure, and friction force surrounding the pipe surface. The resisting force will be reduced from the summation of the protection forces, if the pipe joint is pulled out easily, or the buried pipe condition is changed. Especially in the street, excavation works are often executed near the pipe, so that the resisting force cannot expect full amount of the protection forces.
8.3.8.1.2 Protective Concretes and Restraint JointsProtection for ductile cast iron pipe and rigid PVC pipe is achieved by installing concrete blocks or by adopting the restraint fitting joint.
The adequate size of protective concrete is determined by taking the concrete block weight, pipe weight, water weight, shear force acting on the concrete block, and passive soil pressure into account.
Ductile cast iron pipe with restraint fitting joint is UF type for large-diameter pipe, KF type for medium size, and SII, NS types for small-diameter pipe.
8.3.8.1.3 Protection of Steel Piping FittingsArc-welded steel pipe, stainless steel pipe, and polyethylene pipe with fusion bonding joints can resist the unbalanced force due to internal pressure. Protective concrete blocks are not necessary for these types of pipes.
When an expansion joint is installed in the pipeline and the restraint length to protect for the unbal-anced force is not long enough, additional protective blocking should be installed.
8.3.9 indication of Pipeline Location
8.3.9.1 indication of Pipeline Location
In Japan, to aid in pipe identification, identification tape should be installed on the top of the pipe under the road. The information on the tape should include company name, installation year, and business type and is required by Road Traffic Act [3] Enforcement Order No. 14-2-3 and 4-3-2.

127Water Supply System: Design Aspects
The following items do not require this identification tape:
• Pipe that is less than or equal to 80 mm in outside diameter• Pipe that is buried in rural area where other lifelines are not installed• Pipe that is encased by concrete
A taping is applied the pipe body for smaller than 350 mm in diameter, whereas the other tap-ing is bounded around the body and placed on the top of pipes greater than 400 mm in diameter, respectively.
8.3.9.1.1 Materials for Indication TapeThe tape is a PVC tape with a blue background and white letters. The drum width, crown width, and thickness are given in Table 8.10.
8.3.9.1.2 Intervals of Banding TapeFor pipes 4 m in length, identification tape should be applied at three locations. For longer pipes of 5–6 m, the identification tape should be applied at four locations. For special pipes, such as pipe fittings and valves, the identification tape should be located every 2 m. In the case of shield pipes, blue color strip should be painted at the top portion with 100 mm width.
8.3.9.1.3 Method of IndicationThe contents shown in Table 8.8 should be printed on the tape. The letter size should be 8 mm, and the interval between each letter should be 4 mm. If the existing pipe is exposed, an indication tape should be put on the exposed portion.
8.3.9.1.4 Special PortionsFigure 8.28 shows an example of taping for geometrical pipes. An indication mark is not applied to the valve, because it is easy to identify the valve from any existing lifelines. When a pipeline is protected from third-party accidents, an indicating sheet as shown in Figure 8.29 is installed over the pipeline.
TABLE 8.10 Indication Tape for Pipes
Diameter (mm) Drum Width (cm) Crown Width (cm) Thickness (mm)
350 3 — 0.15 ± 0.03400 3 3
Tape for drum
Tape at crown (in the case of 400 mm)
FIGURE 8.28 Indication of tape.

128 Construction Technology of Lifeline Pipelines and Its Facilities
8.3.10 cathodic and other corrosion Protection
8.3.10.1 Mechanism of cathodic Protection
Corrosion of iron pipes is termed stray current corrosion and is distinguished from natural corrosion as shown in Figure 8.30.
Stray current corrosion is caused by leakage electricity from the DC power supply of a railway or by protection current from a cathodic protection system. Natural corrosion, on the other hand, is classi-fied into microcell corrosion and macrocell corrosion in accordance with the size of galvanic corrosion. Microcell corrosion is formed on the pipe surface by a microscale local galvanic corrosion in which a relative difference in a circumference condition creates an anode on the pipe surface, whereas a cathode is produced at other portion.
The locations and the size of anode and cathode in the macrocell corrosion can be measured.
8.3.10.2 Adequate Methods for Buried environments
8.3.10.2.1 Corrosive SoilWhen a water pipeline is installed at the ground with corrosion-sensitive, acid-sensitive, or salty water invaded soil, the site investigation should be carried out at the initial stage, and then an appropriate pipe should be selected with regard to corrosion protection method.
8.3.10.2.2 Pipe Penetration Point of Concrete StructuresIn the following points, macrocell corrosion will be formed:
• RC concrete block (such as an anchor block or a bridge abutment) penetrated by a pipeline that is attached with a reinforcing bar in the concrete
400 mm
200 200
300
mm
PipeCross section
Indicatingsheet
FIGURE 8.29 Example of indicating sheet.
Corrosion
Natural corrosion
Cathodiccorrosion
Microcellcorrosion
Macrocellcorrosion
General soil corrosionSpecial soil corrosionBacterial corrosion
Concrete, soil Oxygen concentrationDissimilar metal
Stray current of railwayInterference
FIGURE 8.30 Classification of metal corrosion.

129Water Supply System: Design Aspects
• Pipeline that is installed at the boundary soil condition such as loam and clay soil grounds• Pipeline attaching to any different kind of metal such as copper pipe and brass valve
In order to protect such various types of cathodic corrosion, preliminary protection for galvanic corro-sion is necessary (Figures 8.31 through 8.34).
8.3.10.2.3 Neighboring RailwaysIn the DC power supply of a railway, the railway is used as a return route of electricity to the power sta-tion. In this situation, some of the electricity will leak from this route and will return to the power sta-tion through the soil. If any buried lifelines such as water, gas, telecommunication, or power lifelines are located in the same soil ground, this stray current will be transmitted along these lifelines to the power station. This electric leakage flow produces a galvanic corrosion.
When a water pipeline must be installed near a railway route, adequate cathodic protection is neces-sary based on the site investigation of electric potential gradient. Generally, the existing lifelines such
Surface
Clay layer Coarse sand layer
Anode Corrosion Cathode Buried metal
FIGURE 8.31 Corrosion due to different soil boundary.
Soil
Reinforced concrete
CathodeSteel bar
Anode Corrosion
Foundation
FIGURE 8.32 Corrosion at the boundary of pipe and RC concrete.
Breathable soil
Wet soil
FIGURE 8.33 Corrosion due to differential aeration.

130 Construction Technology of Lifeline Pipelines and Its Facilities
as telecommunication and electric and gas pipelines have been protected by the cathodic protection so that the interference between those lifelines and a new water pipeline must be investigated to prepare an appropriate cathodic protection.
Special attention should be paid to the following points.
8.3.10.2.3.1 Protection by a Person Who Manages an Existing LifelineIf a stray current risk is anticipated, coordination is necessary with a person in charge hav-
ing the current source to decrease the stray current flow. The following works are recom-mended: the reinforcement of the rail joint, the reinforcement and increase of electric cables between the rail and power stations, and the improvement of sleepers and gravel ballasts of the railway.
8.3.10.2.3.2 Protection by a Person Who Installs a New Water PipelineImpressed current protection is introduced when a DC power source is installed to produce the
electric circuit of the source, aerial cable, insoluble anode, buried cable, water pipeline, aerial cable, and the source. The stray current from the water pipeline can be canceled with the cur-rent flow entering through this circuit from the source as shown in Figure 8.35. This method is appropriate for the large stray current.
Selective drainage method is introduced when the water pipeline must be installed at the anode level that is higher in voltage than that of the railway as shown in Figure 8.36. The drain-age is installed between the water pipeline and railway in order to send back electric current smoothly from the water pipeline to the source. This method is limited at the site where cor-roded pipe and railway are located at mutually neighboring locations.
Forced electric drainage method is introduced in which forced drainage equipment is installed between the water pipeline and the railway as shown in Figure 8.37. The theoretical mechanism
Anode (corrosion)
Copper metalSteel metal
Cathode
FIGURE 8.34 Corrosion at the boundary of different metals.
AC cable
BackfillMagnetic iron oxide
Pipe
Rectifier
Connector boxConnector box
line
line
Pole Pole
FIGURE 8.35 Impressed current protection method.

131Water Supply System: Design Aspects
is the same as that in selective drainage method. This method is applied when a positive volt-age from the railway to ground is so large, and stray current from the water pipeline occurs far from the site at which the current from the railway enters the pipeline.
Sacrificial anode method is introduced in which a sacrificed metal such as magnesium having low-standard electrode potential is installed at the pipeline as anode and creates electric circuit between the pipe and the sacrificed metal to bring the corrosion-protective current flow into the pipeline as shown in Figure 8.38. This is the most popular method that can be applied in general conditions.
When a pipeline is installed near the power plant where an extreme potential change is not anticipated, one appropriate method is to install a resistance at the pipe joint so as to preclude the stray current return to the source. If a barrier is installed around the pipeline, this barrier is effective for the protec-tion of stray current and for the protection of the corrosive soil. As a barrier material, the insulator or semiconductor is recommended.
Current
RailS Transformer
Drainage
Water pipe
FIGURE 8.36 Selective drainage corrosion method.
Force drainage equipment
Three-phase alternating current
Rail200 V
Buried metal
FIGURE 8.37 Forced electric drainage method.
Connecting box
Terminal
Pipe
Vinyl cable Vinyl pipe
Magnesium anode
FIGURE 8.38 Sacrificial anode method.

132 Construction Technology of Lifeline Pipelines and Its Facilities
If coating a steel pipeline is not enough for a corrosion risk, these corrosion protection methods should be effectively used together with the coating approach.
8.3.11 expansion Joints
Expansion joints are installed to absorb a differential settlement of buried pipeline in soft ground, to release an elongated displacement due to thermal expansion in the elevated pipelines, and also to absorb any additional pipe stress caused by earthquake ground motion.
Expansion joints must be located at the proper positions in order to ensure the safety of the distribu-tion pipelines.
8.3.11.1 Setting of expansion Joints
8.3.11.1.1 Protection from Uneven SettlingWhen a large-scale uneven settlement is predicted due to soft ground, the pipeline should be flexible along the pipe route with several expansion joints. When an expansion joint is installed at the connec-tion point of a water pipe bridge or underground structures, its allowable displacement should be more than the predicted settlement displacement and also its sealing tightness should be adequate to resist against the internal and external pressures as well as the endurance for longtime loading conditions.
8.3.11.1.2 Exposed Pipeline PortionFor elevated pipelines without any flexibility, expansion joints should be installed every 20–30 m along the exposed portion. Since the exposed portion of the water pipe bridge is easily elongated by thermal expansion, expansion joints must be installed.
8.3.11.1.3 Arc-Welded Steel PipelinesFor arc-welded steel pipelines, expansion joints should be installed as necessary. In some cases, expan-sion joints are not used in arc-welded steel pipelines. In this case, however, expansion joints must be installed on both sides of the valve. Additional protection will be necessary to protect the valve from unbalanced pressure. The same approach should be used in T-junctions. The effect due to unbalanced pressure must be taken into consideration when an expansion joint is installed.
When an arc welding is applied to the last jointing of a steel pipeline, an expansion joint should be installed near the last jointing point to minimize the thermal stress.
8.3.11.2 Flowchart for the expansion Joint Selection Procedure
Figure 8.39 is a flowchart for the selection of the expansion joints.There are several types of expansion joints used for water pipelines as shown in Figure 8.40.
8.3.12 Apparatus and equipment
There are various apparatus and equipment that include gate valves, control valves, air valves, pressure reducing valves, blow-outs, hydrants, flowmeters, and pressure gages [4]. All these apparatus and equip-ment should be prepared to maintain effective operation of the distribution pipelines.
8.3.12.1 Gate Valve
8.3.12.1.1 Function8.3.12.1.1.1 Shutoff Valve Gate valves are used to control the flow by on–off operation of the valve disk as shown in Figure 8.41. They are used to enclose the distribution area and make several blocks or change the blocking configuration of the distribution network. In the installation work of the pipe or at an accident, the gate valve is often adopted, because this valve can stop the water flow completely. The gate valve must be used in a definite mode of completely closed or open.

133Water Supply System: Design Aspects
Start
Check for buried condition• To select the site location• To check the soil stiffness• To predict unsettlement• To estimate the ground resistance
Check the functional condition• To select the soil load• To check the operating water pressure• To estimate the expansion displacement• To estimate the maximum bending angle• To estimate the maximum bending deflection• To check the bending behavior and torsion• Material• Production method• Safety factor
Check the type• Performance• Length between the both ends• Additional performance• Coating/lining specification• Restraint fitting joint performance
Request to production factories• Structural performance sheet• Shape and production• Cost estimation
• Comprehensive estimation• Economical assessment
Check the corrosion• Setting of the terminal• Checking the bonding method• Other corrosion protection method
Check the additional function• To assess the corrosion hazard for concrete/soil macro cell• To assess the corrosion at the boundary of different metals• To check the connecting method for the neighboring pipe (welding, NS, SII, KP, UF)
Check the aboveground condition• To select the outdoor or indoor• To locate the facility setting point• To check the climate condition (temperature, humidity)
Location
Determine the structural type
Underground Aboveground
Yes
Yes
End
No
FIGURE 8.39 Flowchart for the selection of the expansion joints.

134 Construction Technology of Lifeline Pipelines and Its Facilities
If some sand particles might be accumulated, the gate valve with a nonditch type by soft sealing as shown in Figures 8.42 through 8.44 is recommended. This type of gate valve is also used to prevent rust-colored water.
8.3.12.1.1.2 Control Valve Control valves are used to keep dynamic pressure steady when a rapid change of water flow occurs based on abrupt water demand. The opening angle of the valve disk is con-trolled to obtain the adequate pressure and flow volume by considering the ground elevations, demands from the large-scale buildings, and distribution pipeline network characteristics.
8.3.12.1.2 Attention at Valve InstallationGate valves and control valves are installed in order to control the distribution network flows, minimize the dynamic water pressure loss due to the ground elevation, smoothly control the daily water flow, and easily control the water stop at the maintenance work. Control valves must be installed at the most important points for controlling the water flow during both ordinary and emergency situations.
Water sealing Sleeve StiffenerSpigot pipe
(a)
(c)
K-type rubber ringFlanged sleeve
Pressed ringT-type bolt & nut
Spigot pipe
Fixed screw & nut
(b)
StiffenerSpigot pipe
Water sealingSocket pipe
(d)
BellowsCover Rubber
sheet
Setting bolt
Sleeve pipe
Tig welding
(g)
Reinforcing code Outer rubberInternal rubberStopping ring
Flange
Reinforcing wire
Screw base
(e)
Casing coverRubber ring
Sleeve
Rubber ringRocking ring
BallCasing
(f)
SleeveRing
Bolt & nut
Rubber ring
FIGURE 8.40 Expansion joints: (a) closer A type, (b) closer B type, (c) flange adapter type, (d) bellows type, (e) ball type, (f) mechanical joint, and (g) rubber joint.

135Water Supply System: Design Aspects
Cap
Valve rod
Valve body
Valve box
FIGURE 8.41 Gate valve.
(a) (b)
FIGURE 8.42 Flow profile in the gate valve: (a) Gate must be fully opened or closed. Both flow is possible and (b) soft seal type.
Valve rod
Valve cover
Valve body
Screw head
Valve box
FIGURE 8.43 Gate valve with soft seal.

136 Construction Technology of Lifeline Pipelines and Its Facilities
Detailed descriptions of the valve locations are as follows:
8.3.12.1.2.1 Distribution Mains Valves are located at the starting node, at branching nodes, at both ends of a water pipe bridge and undercrossing portions, and at the branching point for blowoff. For a long pipeline, valves should be installed every 1–3 km for ease of maintenance work. When the pipeline has a large elevation difference along the sloping portion, a pair of valves must be installed, one at both ends.
8.3.12.1.2.2 Distribution Branches Valves must be installed at branching points from the distribution mains, at both ends of a water pipe bridge and undercrossing portions, and at the branching point of blowoff. At the branching points or at the crossing points, additional valves should be installed as necessary.
8.3.12.1.2.3 Consideration for Water Quality After long-term usage of valves, rust will be generated from the deteriorated coating of valve disk or valve casings. This rust may produce rust-colored water and make the disk operation difficult. A coating material must be selected so as not to result in poor water quality. Generally, the coating methods for valves are either the epoxy resin powder coating method or the epoxy resin coating method. For a gate valve smaller than 350 mm in diameter, the valve disk should be coated using the epoxy resin powder coating method, whereas any ditch inside the valve is removed. A soft sealing valve, the valve disk of which is coated with rubber seat, is recommended.
8.3.12.1.2.4 Bypass Pipes Gate valves need large torque, especially at the beginning of the disk opening and closing. This torque is larger for higher pressure and for larger diameter. Too large a torque at large-diameter valve might cause damage at the valve disk. In order to prevent this damage, bypass pipes of small diameter should be installed beside the valve if the pipeline is greater than 0.4 MPa in water pres-sure and larger than 400 mm in diameter. A small-diameter valve should also be installed at the bypass line. This bypass valve should be operated before the operation of the valve in the pipeline, in order to decrease the pressure difference at both sides of the valve disks. By this preparatory operation, the valve can easily operate. If the pressure difference at the disk is still large, a butterfly valve as shown in Figure 8.45 is recommended for easy operation of valve disk.
8.3.12.1.2.5 Valve Chamber Valve chambers are constructed for valves of more than 400 mm in diam-eter. Since this valve is installed under traffic roads, the valve chambers must be strong enough to resist large traffic loads as shown in Figure 8.46.
Valve chambers must be designed with enough space to replace the valve. Manholes are used for inspection and maintenance work, in which an access ladder attached to the manhole must be fixed with anticorrosive metal fittings. When a spindle is installed for valve operation, a clamper is often used to fix
Nozzle side
Orifice side
FIGURE 8.44 Flow profile of gate valve.

137Water Supply System: Design Aspects
the spindle. When electric equipment for measurements or mechanical equipment for valve operation is installed, valve chamber should be kept in water tightness and low humidity.
Valves of less than 300 mm in diameter must be covered with a special cover as shown in Figure 8.47. This cover is supported with a gravel foundation.
8.3.12.2 Air Valve
8.3.12.2.1 FunctionAir contained in the water is separated under negative pressure and trapped at the highest point of the water pipeline. This air must be removed because it disturbs smooth water flow and sometimes causes pipeline accidents.
Reamer bolt and nut
Valve rod
Valve body
Rubber seat
Rubber seat holderBearing
FIGURE 8.45 Control valve (butterfly valve).
Manhole cover f 900
Wall block
f 1500f 1230f 964
Drain pipe f 25
Cover concrete
Coarse gravel
Pile
G.L.
1291
+h30
060
091
300
h AA1
1200A (h = 300), B (h = 600)
FIGURE 8.46 Valve vault (Osaka city) (unit: mm).

138 Construction Technology of Lifeline Pipelines and Its Facilities
When water is filled in the pipeline, any air must be removed. When water is removed from the pipe-line because of maintenance or installation work, adequate volume of air must be entered.
Air valves must be installed at the appropriate points to satisfy these requirements.
8.3.12.2.2 Kinds of Air ValvesThe following three types of air valves satisfy the requirements of ventilation speed such as single-mouth air valve in Figure 8.48, dual-mouth air valve in Figure 8.49, and high-speed air vent valve in Figure 8.50.
The input ventilation speed is determined by the possible discharge, water volume in the pipe, and allowable discharge duration time. The output ventilation speed is determined by water supply capacity from the pipeline, water supply speed in safety operation, and the allowable time duration of water sup-ply. The air valve must be selected to comply with these requirements.
8.3.12.2.3 Consideration for SettingAir valves are composed of simple elements such as a ball and packing. These elements are easily dam-aged, so they must often be replaced or repaired. To prevent the temporary stop of the water flow, a repair valve should be installed between the air valve and its branching point of the pipeline.
Regarding air valve maintenance, first it should be emptied into the air valve chamber, although this type of chamber is not installed at the water pipe bridges or at the bridge-attached pipelines. The valve chamber is made of RC concrete or concrete block masonry, and its size should be wide enough to do the repair work. A drainage system should be placed in the chamber to allow rainwater to escape.
50120 370 120
50
10
730
180 180
D
390
565
381
10
1060
6060
120
FIGURE 8.47 Valve box (unit: mm).

139Water Supply System: Design Aspects
Manhole cover
Air mortarCoarse gravel
For main pipe more than 600 m dia.
f 860
f 760
f 65050Lc
200
300
300
5028
103
50
G.L.
791
+ h
FIGURE 8.48 Single-mouth air valve (Osaka city) (unit: mm).
Manhole cover
Adjustable cover
Prefabricated manhole
f 600
400 200150
~450
300
300
600 100
400 400 800 150 150 15015001750
600600
300 300
f 600
H6
H4
H4
H5
H3 H
3́
H3́
H3
H2
H
H5
D D
FIGURE 8.49 Dual-mouth air valve vault (Osaka city) (unit: mm).

140 Construction Technology of Lifeline Pipelines and Its Facilities
8.3.12.2.3.1 Distribution Mains Distribution mains cannot discharge any air from the network, because this network is not connected to service lines. This is why air valves are necessary to dis-charge the air from the distribution mains. In general, the air is trapped at the highest elevation points. So the air valve must be installed at every high elevation point or at the highest point of the water pipe bridge.
An air valve is also necessary when the water is supplied to the distribution mains or discharged from the distribution mains.
When a pipeline is long but there are not any bending portions, the air valves are installed near the valves that are located for the maintenance work at every 1–3 km interval. If the pipeline profile is monotonically inclined, however, the air valve should be installed at a lower position than that of the gate valves. For a large-diameter pipe more than 800 mm in diameter, the air valve should be installed in the manhole where the air valve is connected to the tapping point or the T-junction from the pipeline.
8.3.12.2.3.2 Distribution Branches Distribution mains can discharge any air from the network because this network is connected to service lines. When new distribution pipeline installation or maintenance work is carried out, the hydrant can be used for the supply and discharge of the water.
8.3.12.3 Blowoff equipment
8.3.12.3.1 FunctionThe blowoff is installed to discharge the impurities produced during the construction stage, to drain muddy water, to displace the pipe water obtained during installation work, or during an accident or an emergency.
In general, the blowoff is installed at the distribution mains, whereas the hydrant is used for this pur-pose in the distribution pipelines, but it should be noted that the hydrant cannot discharge all the impu-rities. To solve this difficulty, a combination of a centrifugal-type T-junction and a hydrant is adopted to increase the drainage performance. It should be pointed out that the blowoff is required to maintain water quality.
Air valve cover
Cover concrete
Drain pipe
f 1500f 1230f 964
100
1291
+ h
300
300
600
91h
FIGURE 8.50 High-speed air vent valve (Osaka city) (unit: mm).
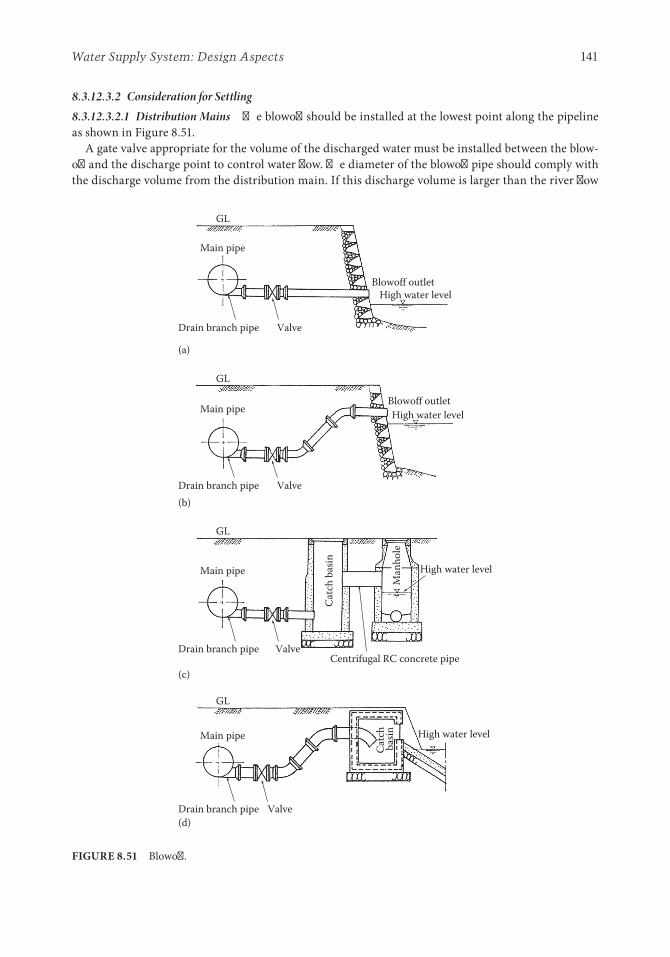
141Water Supply System: Design Aspects
8.3.12.3.2 Consideration for Settling8.3.12.3.2.1 Distribution Mains The blowoff should be installed at the lowest point along the pipeline as shown in Figure 8.51.
A gate valve appropriate for the volume of the discharged water must be installed between the blow-off and the discharge point to control water flow. The diameter of the blowoff pipe should comply with the discharge volume from the distribution main. If this discharge volume is larger than the river flow
Blowoff outlet
Main pipe
ValveDrain branch pipe
Main pipe
ValveDrain branch pipe
Main pipe
ValveDrain branch pipe
Main pipe
ValveDrain branch pipe
High water level
Blowoff outletHigh water level
High water level
High water level
Catc
h ba
sin
Catc
h ba
sin
Centrifugal RC concrete pipe
Man
hole
GL
GL
GL
GL
(a)
(b)
(c)
(d)
FIGURE 8.51 Blowoff.

142 Construction Technology of Lifeline Pipelines and Its Facilities
capacity, the pipe diameter may be limited by taking the river capacity into consideration. The elevation of the discharge point must be higher than the estimated high water level (HWL) in order to prevent the backward flow of dirty water.
8.3.12.3.2.2 Distribution Branches The blowoff is installed at adequate points in the distribution net-work. If a discharge river is located in the network, the blowoff can be installed near this river.
8.3.12.4 Hydrant
8.3.12.4.1 FunctionA hydrant is installed in the distribution network in order to supply water for firefighting. Hydrants are placed at a distance of 100–200 m in general, and its interval will change based on street conditions.
A hydrant should be located to allow the intake air during the discharge of water from the pipe-line, to discharge air when filling water, and to blow off the dirty water to maintain water quality. Hydrants in Japan and some other countries are typically located in hydrant pits below street level, while above-ground standing hydrants are typically used in some other countries (e.g., the United States).
8.3.12.4.2 Kinds of Hydrants8.3.12.4.2.1 Two-Way Type Two-way-type hydrants can drain water from two outlets as shown in Figure 8.52. This type of hydrant is used for pipelines of 300 mm in diameter. When a dynamic water pressure is higher in a pipeline smaller than 300 mm in diameter, this type of hydrant can be installed after checking the hydraulic condition at the firefighting.
8.3.12.4.2.2 Single-Way Type During firefighting, several hydrants are used together. So single-way-type hydrants shown in Figure 8.53 should be installed along the distribution pipelines of more than 150 mm in diameter. A single-way-type hydrant is often used for the distribution pipeline of smaller diameter than 150 mm, when the existing network of such a smaller-diameter pipeline has been operated.
880100
50 50 50 50
6021
021
021
021
011
0
200
120
100~
100GL
Dual-mouth hydrant
Mortar
Crasher
680
FIGURE 8.52 Dual-mouth hydrant (Osaka city) (unit: mm).

143Water Supply System: Design Aspects
8.3.12.4.2.3 Consideration for Setting Firefighting equipment is standardized to connect to a hydrant outlet of 65 mm in diameter. A special valve is used to disconnect the hydrant from the distribution network so that repair work can be executed without any disturbance in the daily flow.
8.3.12.5 Meters of Flow Volume and Water Pressure
8.3.12.5.1 FunctionThe water demand changes due to temporal and seasonal variation can be measured by water pres-sure and flow in the distribution network. For this purpose, flowmeters and pressure meters should be installed at critical points in the distribution network.
8.3.12.5.2 Kinds of Flow Volume Meters and Water Pressure MetersFlowmeters are classified into magnetic flowmeter and ultrasonic flowmeter. Pressure meters are classi-fied into water pressure meters with electronic pressure sensor and Bourdon tube gauge.
8.3.12.5.3 Consideration for SettlingFlowmeter and pressure meters should be located on the roadside where data collection and mainte-nance work are easily executed. The recommended places are as follows:Flowmeters
• The starting node of the distribution main and its major branching points• The entrance point of the distribution block• The connecting point between different distribution networks and blocks
Pressure meters
• The same place as flowmeters• The highest and lowest points in ground elevations• Any special points to control the water pressure
8001000
150
5040
500 10
80
1200
200
100
40
GL
f 600
Hydrant
Valvefor
repair
Pipe Mortar
Crasher gravel
FIGURE 8.53 Single-mouth hydrant (Yokohama city) (unit: mm).

144 Construction Technology of Lifeline Pipelines and Its Facilities
Information management centers are necessary for data storage and analysis of water flows and pres-sure, when increasing data from measurement are predicted.
8.3.13 Water Stations
8.3.13.1 Reservoir
A reservoir in the distribution network is a storage facility as shown in Figure 8.54 that delivers water from the trunk line and keeps it in volume more than the demand in the distribution network. The reservoir can control not only temporal variation in the daily demand of the distribution water, but also abrupt deviation due to emergency request.
A single reservoir might not be adequate to maintain the stability of water flow and pressure in special hydraulic conditions and in the emergency conditions. In this situation, several reservoirs should be sparsely located to keep the adequate pressure distribution.
When a disaster event such as a severe earthquake occurs, the reservoir will be a key station for emer-gency water supply, so power generators and submersible pumps must be prepared. When maintenance activity such as inspection, cleaning, and repairs is taken into consideration, the reservoir should have more than two ponds with dedicated emergency shutoff valves that should be set to keep the purified water, which must not be leaked from the broken pipeline or equipment.
8.3.13.1.1 Structure and Water ElevationThe reservoir, which is a storage facility for purified water, must be protected from external pollution such as rain and dust, direct sunshine, and growth of weeds or algae. For this purpose, the reservoir must be sealed from the external defects, be waterproof and durable, and be seismically protected. The three types of reservoirs are aboveground, underground, and semibasement type.
The reservoir is generally constructed as an RC concrete building; however, prestressed concrete, steel, and reinforced plastics are also possible. In the case of RC concrete reservoirs, rectangular types are popular, but other types, such as circular, are also available depending on the site and scale condi-tions. The reservoirs are constructed as a beam-column structure or as a flat slab structure.
RC concrete reservoirs should be constructed with high-quality concrete to ensure that they are waterproof. Special care should be paid to the joint portion of concrete surface from which a water leakage may start. The location and direction of the concrete joint portion must be shown in the design drawings. As an alternative approach, a water shut plate can be used to stop a leakage from the concrete joint. As it is necessary to minimize the settling, shrinkage, or cracking due to thermal, expansion joints
Reservoir(50,000 m3)
Reservoir
Pum
pPu
mp
Tunnelconstruction
FIGURE 8.54 Reservoir (pond, pumping yard).

145Water Supply System: Design Aspects
should be installed every 20–30 m. But it should be noted that expansion joints have a potential risk to easily cause a leakage or pullout failure. So the installation interval of expansion joints should be long as much as possible in the effective range.
8.3.13.1.2 Capacity VolumeThe reservoir is designed to control the temporal variation between any water flow demand and the sup-ply from the transmission pipelines, and also to supply water flow over a period of time at any emergency.
The effective volume capacity of the reservoir is estimated at 50% of the maximum supply design water flow per day, which can be estimated as a summation of temporal variation per day, emergency demand at the service area, emergency volume used in the upper stream areas (unusual drought, water quality accident, and facility accidents), emergency volume used in the lower stream area (emergency water supply and facility accidents), and firefighting water flow demand.
8.3.13.1.3 Effective Water DepthThe effective depth of reservoirs means a depth between the HWL and the low water level (LWL). In the case of the shallow reservoir, a wide space is necessary, whereas in the case of the deep level, the required space is small. In order to select the reservoir effective depth, some potential risk problems such as seis-mic safety and waterproof requirement must be taken into consideration. From past experiences and economical evaluation, a depth of 3–6 m is generally recommended as the effective depth of reservoirs. When the site space is limited because of the additional construction of other reservoirs in the same area, a depth of 10 m is selected as an example.
The effective depth of reservoirs should be compared and estimated from various points of view such as the difficulties of land acquisition, construction, and the minimum requirement of cost.
8.3.13.1.4 Inlet, Outlet, and Bypass PipesAn overflow dam should be constructed in front of the inlet pipe of the reservoir in order to reduce the water flow velocity and to stop the backflow of the stored water. If such an overflow dam is not set, the inlet pipe should be placed at the highest point of the reservoir or a check valve should be installed.
The outlet pipe should be placed at a lower elevation to discharge all the effective water. The outlet pipe is placed in a pit, the size of which should be more than three times the pipe diameter. The pipe center of the outlet pipe is set on a lower elevation from LWL, which is expected to be more than two times the pipe diameter.
In the gravity flow, an emergency shutoff valve must be installed at the outlet point in order to mini-mize the purified water flow from the reservoir to prevent the secondary disaster by the water leakage due to the pipe accident.
At the connecting point between the reservoir and connected pipes, an expansion joint or a flexible expansion joint should be installed.
Sometimes, water supply is stopped for long time periods, and also in some cases, a high-pressure flow from the purification plant is carried out in the nighttime directly. In this situation, the water flow into the reservoir must be stopped. For this purpose, a bypass pipe and a shutoff valve must be installed at the reservoir.
8.3.13.2 Pumping Stations, Mechanical and Power equipment
Pumping stations, mechanical equipment, and power equipment play important roles in the water puri-fication treatment as well as in water flow control and management. These facilities are adequately oper-ated in a mutual interdependency.
When these facilities are planned and designed, the following points must be taken into consider-ation: compatibility in the water pipeline network system, conformity with new equipment introduced in the future, and adaptability in the retrofitting of existing equipment.

146 Construction Technology of Lifeline Pipelines and Its Facilities
8.3.13.2.1 Pumping StationsThe operational method of pumping stations must be selected from the following points of view: energy saving, capacity size, discharge range as well as multistation control, valve opening position control, rotational speed control, and replacement method of a vaned wheel (summer, winter).
8.3.13.2.1.1 Planning of Pumping Station The planning of a pumping station, which should be satisfied with the distribution flow conditions and be easily operated, must determine factors such as number of pumping units to provide the planned water flow, discharge capacity, pumping head, power of prime mover, and rotating speed. In some cases, water hammer pressure must be checked. If some equipment is necessary for the water hammer pressure, not only the units in the pumping station but also surge tank may be included in the total design concept.
8.3.13.2.1.2 Pumping Capacity and Number of the Units Pumping capacity for intake and transmission pipeline in which temporal changes are not remarkable can be estimated as a combination of the flow capacity in the steady operation at the most appropriate efficiency of the pump. The required number of pumping units can be calculated as the average flow based on the maximum daily demand curve for the distribution network. Therefore, the pumping capacity for the distribution network must be determined in combination with the flow capacity. So the number of pumping units must comply with temporal deviation of water flow, because the temporal and seasonal changes of the planned water flow are signifi-cant. The control method of pumping equipment that is compatible with the distribution volume and its volume changes is determined based on the design conditions, which consist of unit control, valve control, rotational speed control, and replacement of a vaned wheel in summer and winter. Standby units should be provided for the situation when an accident or repair work forces stoppage of pumping equipment.
8.3.13.2.1.3 Pumping Type The pump type must match the planned discharge capacity and total pump head so that cavitation is not be generated in the planned suction process. The pump type should be selected with the following points in mind: operational method, maintenance, and management, including major overhauling.
8.3.13.2.1.4 Dimensions of Pumping Equipment The dimensions of the pumping equipment should be determined with the following points in mind: total pumping head, discharge volume, pipe diameter, prime mover power, and rotational speed.
8.3.13.2.2 Mechanical EquipmentThe water pipeline network system includes the following mechanical equipments: submerged machin-ery, air compressor, crane, hoist, ventilation, and air conditioner.
This mechanical equipment is designed according to its material and structure on the operational and environmental conditions in order to handle continuous operations. For mechanical equipment used in the submerged condition in the purification or discharge process, the following points must be taken into consideration: material selection compatibility with the water quality, simple structure, and the allowable capacity in the performance volume and mechanical strength.
8.3.13.2.2.1 Submerged Machinery Submerged machinery have different duration times depending on the water quality. So the most appropriate selection is necessary based on its material and structure, which require the durability and the safety. The prevention of oil leakage as well as the water seal-ing method are factors for consideration. A simple maintenance management is also expected for sub-merged machines.
8.3.13.2.2.2 Crane and Hoist The crane and hoist are strongly suggested to ensure operational safety and precision. The crane is used to lift and to horizontally move any loaded materials. The hoist includes an electric hoist, electrical chain block, and electric winch.

147Water Supply System: Design Aspects
8.3.13.2.2.3 Ventilation and Air Conditioners In the water network system that includes mechanical, electrical, or chemical facilities, poisonous gas may be generated from a heat source or chemical mate-rial for disinfection. These facilities must be equipped with ventilation and air-conditioning machines in order to keep the safety, the normal operation of mechanical equipment, and the long-life capacity. The two types of ventilation are natural ventilation and forced ventilation. Appropriate air-conditioning machine will be necessary for computer systems.
8.3.13.2.3 Electric Power EquipmentThe electric power system of a water pipeline network system is composed of power-receiving equip-ment, transforming equipment, distribution equipment, and loading systems. This equipment should be chosen with the following points in mind: easy operation and maintenance management, high safety, and reliability. The adequate working operation in the increasing constructions or retrofitting works in the future must be taken into consideration in the design stage.
8.3.13.2.3.1 Power-Receiving Plan The maximum power demand (kW) is evaluated from the final planned loading condition and the present loading condition together with the operational method of the water system. An exclusive right of way for electric cable routing for the water pipeline network system is recommended receiving an electric power supply, but might be difficult due to the electric distribution network condition. So a redundant system for receiving the electric power supply is rec-ommended for important facilities, by which the electric power supply can be continued given an acci-dental situation. The underground cable facility should be installed to supply electric power in order to keep the safety and reliability. The standby line for the underground cable facility will be effective in the accident or maintenance work of power cables.
8.3.13.2.3.2 Power Substation Facility The power substation facility is the most important facility in the water pipeline network system. This system requires the highest level of safety possible. The main circuit of the power substation facility must be divided into two circuits, one of which is the main circuit to supply power in the daily scheme and the other is a different circuit for the maintenance use in order to prevent a power failure of the whole circuit system during maintenance work. The power substation should be laid out in a simplified configuration as shown in the power flowchart. The cable layout at the site should be identical to that shown in the main switchboard. This kind of simplicity is important to prevent misunderstanding during daily operation and maintenance work. Especially, the cables in the substation must be installed in an appropriate separation distance with the other cables in order to prevent a cascading failure. A lightning rod is necessary to protect the circuit. The load breaker or disconnecting switch must be installed at the boundary point between the power supply company and the water supply company in order to show the mutual responsibility of security and also to prevent a power failure during daily inspection and maintenance. The user has a responsibility to prevent the development of power failure to the upstream power facilities by intercepting the power surges in order to protect the loaded equipment and cables.
8.3.13.2.3.3 Protection and Safety Equipment All the equipment in the substation must be protected with appropriate methods. On the assumption that an abnormal current is generated in the circuit, the protection coordination among this equipment must be prepared to prevent cascading accidents and to localize the outage area of power supply. For abnormal voltage in the circuit, the insulation coordination among the related equipment is important, so that the heavy current circuit and the light current circuit are clearly divided and separately grounded. All the equipment must be protected from a shock hazard. The interlocking system is useful to prevent operation mistakes.
8.3.13.2.3.4 Electric Distribution Equipment The distribution voltage for special use should be decided by taking the intended purpose and loading condition into consideration. The bus-bar system and

148 Construction Technology of Lifeline Pipelines and Its Facilities
distribution system should be decided by the importance of the equipment and the operational condi-tion. In all the distribution cables, intercepting devices must be installed in order to control the loading current and the accidental current. The electric cables must be used to protect the insulation deteriora-tion and accidental damages.
8.3.13.2.3.5 Power Plants As a method of control, it is recommended that the power plant be installed near the loaded equipment and the closed switchboard approach. The loading circuit must have the switching device for the loaded current and also have the interception device or fuse for a faulty current.
8.3.13.2.3.6 Uninterruptible Power Supply Equipment An uninterruptible power supply (UPS) equip-ment is required for critical equipment. The capacity is decided from the total demands in a daily use, at the power failure, and at the startup time after the loading demand prediction is fully investigated. This system must be installed in the chamber of closed switchboard with the care of seismic protection and temperature control. The electric power is divided into separated subsystems that supply the power to their belonging equipment, and each subsystem has a switching device to prevent the failure cascading at the accident.
8.3.13.2.3.7 Emergency Power Supply Equipment It is recommended that important water facilities have dual receiving routes supplied from the power station in order to prevent a power failure. In spite of this preventive action, it is difficult to completely prevent a power failure. In order to recover as quickly as possible from the failure condition, emergency power supply equipment should be installed.
8.3.14 Design of Water Pipe Bridges
8.3.14.1 Water Pipe Bridge
8.3.14.1.1 Structural TypesWater pipe bridges can be classified into two types: pipe beam bridges and pipe-supporting stiffened bridges [5]. When selecting which bridge type to use, structural stability, economic feasibility, and appropriateness with structural beauty in the surrounding landscape should be considered. Figure 8.55 is a flowchart to select the type of the water pipe bridge, and Table 8.11 is a table for the structural bridge types.
8.3.14.1.2 LoadsThe design loads are as follows:
• Water pressure• Pipe weight• Water weight in the pipe• Wind load, earthquake load• Temperature change• Snow load and other loads
8.3.14.1.3 Backfilling and Protection for UnsettlementSince the abutment is firmly compacted, differential settlement between the abutment and the attached pipeline can occur, as can differential shaking in an earthquake, so a flexible expansion joint is recommended.
The backfill soil after the construction of abutment or the surrounding soil around the pipeline that is attached to the bridge must be fully compacted with good soil. If the soil liquefaction or consolidation settlement is predicted, the soil improvement should be taken into consideration.

149Water Supply System: Design Aspects
At both sides of the bridge, a gate valve must be installed at a safe location where there is no risk of building collapse or bank failure so as to permit interruption of water flow due to seismic damage or repair work.
8.3.14.1.4 Protection from CollisionsThe bridge piers must be protected from collisions by floating timbers or any other floating materials including ships with an appropriate protection method.
8.3.14.1.5 Air ValvesThe air valve must be installed at the highest point in the pipeline that overcrosses an underground structure. This is to allow air to discharge from the pipeline. A rapid discharge air valve is often installed on the water pipe bridge. In this case, an access lane is necessary for the valve inspection and operation. This type of air valve is selected to use because of its effectively discharged and beautiful appearance. For safety purposes, a block to the access lane must be installed at both sides.
Start
Possible as pipe beam bridge?
Possible as stiffened beam bridge
Yes Yes
No No
Fixed both ends
Simple support
Continuous support
Pipe-supported stiffened bridge
Plate girderTruss typeLanger typeArch typeOthers
Shor
t spa
n
Long
span
Sing
le sp
an
Mul
ti sp
an
One fixed and other free
ends
Short
Smal
l dia
.
Arch type Flange typeLarge Large
Special type
Truss reinforcing type
Triangle or 4-code type
Arch reinforcing typeArch reinforcing type
Diameter DiameterSmall/
mediumSmall/
medium
Gen
eral
Spec
ial One Two
Long
Number of pipes
Span length
FIGURE 8.55 Flowchart of bridge-type selection.

150 Construction Technology of Lifeline Pipelines and Its Facilities
TABLE 8.11 Structural Types of Pipe Bridges
Type Structural Type Remarks
Pipe beam
Simple support
Ring support Air valveExpansion jointRing support
Expansion joint 1. Pipeline is supported with
ring support or saddle support. Bending deflection and axial elongation can be absorbed by expansion joint or special elements.
2. Several support conditions are available as a similar structural system: free/fixed-end model, continuous support model, and both fixed-end models.
Stiffening type
Flange Stiffener Air valve Cross section profile 1. Pipeline is stiffened with flange-type stiffener such as T type or π type.
2. Stiffener is equipped at the crown portion or bottom portion.
Truss Upper chord
Bracing Pipeline
Cross section profile 1. Pipeline is used as an upper or lower beam of the truss structure.
2. Cross sections such as triangle or box are available.
Langer Upper chord
Bracing Pipeline
Cross section profile 1. Pipeline is used as a stiffened element in the stiffened arch bridge, and the vertical strands from the upper beam support the pipeline.
2. All the members are loaded by axial forces. These characteristics are structurally rational.
Nielsen Lohse Upper chord
Cross section profile
Bracing Pipeline(Single warren truss type)
1. Pipeline is used as a stiffened element in the stiffened arch bridge, and the diagonal strands from the upper beam support the pipeline.
Cable stayBracing cable
Pipeline
Cross section profile 1. Pipeline is used as a continuous beam bridge, and the bracing cables from the tower can support the pipeline.
2. The wind effect must be taken into account.
(Continued)

151Water Supply System: Design Aspects
8.3.14.1.6 Freeze-Proofing TechniqueWater pipe bridges are affected by temperature changes more severely than a buried pipeline. This may result in the water in the pipes freezing in cold districts. To prevent this from happening, the pipeline is often covered with antifreeze materials such as polyurethane foam, which is then covered by steel plates.
8.3.14.1.7 Protection for Bridge FallingTo prevent the falling of the upper shoe from the lower shoe, protection devices should be installed at the movable supporting piers as a seismic disaster prevention measure. The girder placed on the abut-ment or piers should also be connected with protection joint cables to the pier as shown in Figure 8.56. Leakage from the expansion joint is expected when using this measure, however. Various protection methods for bridge falling have been developed, such as a method to join a girder to the pier or the other method to join two neighboring girders. A seismic load for the design should be evaluated on the basis of the seismic horizontal capacity design method.
8.3.14.1.8 Corrosion ProtectionThe corrosion protection method for exposed portions of the pipeline is designed with the water steel pipeline (WSP) guideline of WSP009 in Japan. Special attention should be paid to macrocell corrosion at the abutment.
AbutmentExpansion joint Expansion jointRing support
Ring supportShock-absorbingrubber pat
Connecting boardSpring
PinPC cable
FIGURE 8.56 Prevention work for bridge fall.
TABLE 8.11 (Continued) Structural Types of Pipe Bridges
Type Structural Type Remarks
Bridge attached
Steel bridge, PC bridge
Saddle support type
Pipeline PC highway bridgeSteel highway bridge
1. These structures are used as a beam-type bridge.
2. Construction cost and installation space can be saved.
3. The following points must be taken into consideration: relative response between pipeline and road bridge, additional support for seismic effect, construction method, and accessory equipments.

152 Construction Technology of Lifeline Pipelines and Its Facilities
8.3.14.1.9 Maintenance WorkMaintenance work includes items such as inspection, painting, and repair works for the expansion joint, and attached metal fittings. Therefore, a maintenance lane always should be prepared.
8.3.14.2 Bridge-Attached Pipes
In order to absorb elongation of the pipe beam bridge piers due to temperature change, an expansion joint should be installed on a bridge-attached pipeline. The location of this expansion joint should be at the movable pier. Since the seismic force is concentrated on both ends of the bridge, the seismic forces should be applied to all the fixed piers and the abutments. To decrease the seismic forces applied to the pipe, the pipeline should be connected with the bridge girder if possible. If the pipe diameter is too large for the bridge girder height, several small pipes should be installed on the bridge, rather than a single large pipe.
References
1. JWWA. Guideline for the Design of Water Supply System. JWWA, Tokyo, Japan, 2000 (in Japanese). 2. JWWA. Guideline and Instruction for the Seismic Design of Water Supply System. JWWA, Tokyo,
Japan, 2009 (in Japanese). 3. JWWA. Handbook of Valves for Water Supply System. JWWA, Tokyo, Japan, 1987 (in Japanese). 4. Ministry of Land, Infrastructure and Transport. Enforcement Order No. 14-2-3 and 4-3-2 of Road
Traffic Act in Japan, 1952 (in Japanese). 5. Tokyo Metropolitan Water Works Office. Instruction for Water Pipeline Design, Tokyo Metropolitan
Water Works Office, Tokyo, Japan, 2006 (in Japanese).

153
9.1 Sewer System
9.1.1 components of Sewer System
Sewer systems include sewers, manholes, cleanouts, catch basins, depressed siphons, outfalls, and so on. They play an important role in carrying sanitary wastewater generated from domestic and industrial sources to pumping stations and wastewater treatment plants (WWTPs). House sewers drain wastewa-ter and stormwater into the public sewer. In accordance with Japanese sewerage law, property owners shall connect their house sewers to public sewers once the public sewer connection is made, as shown in Figure 9.1.
9.1.2 Shape of Sewer
The shapes of a sewer section may be round, rectangular, horseshoe, or egg, as shown in Figure 9.2. The most common type is round. Round pipes are suitable for hydraulic and mechanical use. Factory-made round pipes are available up to sizes of 3000 mm in diameter.
9Sewerage System:
Design Aspects
9.1 Sewer System .....................................................................................153Components of Sewer System • Shape of Sewer
9.2 Standards and Materials ..................................................................154Reinforced Concrete Pipe • Polyvinyl Chloride Pipe • Glass-Reinforced Pipe • Resin Concrete Pipe • Polyethylene Pipe • Ductile Iron Pipe • Steel Pipe • Tunneling Segment
9.3 Design of Sewers ...............................................................................157Basic Policy • Capacity Design • Foundation • Sewer Joining and Joints
9.4 Manhole Design ................................................................................163Basic Policy • Distance, Manhole Cover, and Invert
9.5 Cleanouts, Catch Basins, and Laterals ..........................................164Sanitary Cleanout • Storm Cleanout and Catch Basin • Lateral
9.6 Other Structures ...............................................................................166Inverted Siphon • CSO Structure • Storage Structure for Urban Flood Control
9.7 Process of Design ..............................................................................168Selection of Sewer Route and Flow Calculation
References ......................................................................................................170Masanori HamadaWaseda University

154 Construction Technology of Lifeline Pipelines and Its Facilities
9.2 Standards and Materials
Sewer pipes in Japan are standardized according to three categories: Japan Sewage Works Association Standards (JSWAS) [1], Japan Industrial Standards (JIS), and manufacturer’s standards. The selection of sewer pipes is made considering the flow capacity, wastewater quality, pipe strength, soil condition, economy, and so on. Round pipes are usually made up of reinforced concrete, polyvinyl chloride (PVC), fiberglass-reinforced plastic mortar, resin concrete, polyethylene (PE), ductile cast iron, and so on. In Japan, currently more than 80% of new installations of sewers use PVC pipes.
9.2.1 Reinforced concrete Pipe
Figure 9.3 shows several varieties of reinforced concrete pipes manufactured by centrifugal cast-ing. There are three load classes and other types include jacking pipe for reinforced concrete, egg-shaped pipe, and fiberglass-reinforced concrete pipe for jacking. Not only straight but T, Y, and curved shapes are also available. Joint-type straight pipes include external band, belled socket, and inwall.
Industrial wastewater Pretreatment
Sani
tary
clea
nout
Sanitary cleanout
Walkway
Wastewater
Hou
se se
wer
Sew
er m
ain
Trun
k sew
er
Pum
ping
st
atio
n
WW
TP
Driveway
Domestic wastewater
Sewer
Storm cleanout
Catc
h ba
sin
Rive
r
WWTP
Effluent
Pumping station
Sani
tary
sew
er
Stor
m se
wer
Walkway
FIGURE 9.1 Sewer.
(a) (b) (c) (d)
FIGURE 9.2 Sewer shape: (a) round, (b) rectangular, (c) horseshoe, and (d) egg.

155Sewerage System: Design Aspects
9.2.2 Polyvinyl chloride Pipe
Figure 9.4 shows PVC pipes manufactured by mechanical extrusion of the molten form of resin and several additives. Installation is easy because of their light weight. The nominal diameter of a PVC pipe ranges from 75 to 800 mm and the standard length is 4000 mm. They can be joined at the sockets with either a rubber ring or adhesive. In addition to straight pipes with round cross section and solid wall for open cut installation, other types include egg-shaped pipes, PVC pipes for jacking, and profile wall.
9.2.3 Glass-Reinforced Pipe
The glass-reinforced pipe (GRP) is a composite of fiberglass, resin, and other aggregates. It has high strength and is easy to install. Pressure and nonpressure types are available. For sewer application, the nonpressure type is mainly used. The nonpressure GRP has two standard load classes (see Figure 9.5). The nominal diameter ranges from 200 to 3000 mm with a standard length of 4000 or 6000 mm. GRP is used as sliplining for pipe rehabilitation. It is also used in tunneling for segment lining as a secondary lining.
L
D
L
D
L
D
L
D
(a) (b) (c) (d)
FIGURE 9.3 Standard resin concrete pipes (RCPs): (a) A pipe, (b) B pipe, (c) C pipe, and (d) D pipe.
L
D
L
D
(a)
(b)
FIGURE 9.4 Standard PVC pipes: (a) adhesive joint and (b) rubber ring joint.
L
D
L
D
L
D
L
D
FIGURE 9.5 Standard glass-reinforced pipes (GRPs).

156 Construction Technology of Lifeline Pipelines and Its Facilities
9.2.4 Resin concrete Pipe
Resin concrete pipe (RCP) is made of resin, aggregates, and filler. It has excellent corrosion-resistant properties due to not using cement. Two types of joints are available as shown in Figure 9.6. Nominal diameters for open cut installation are 150–600 mm with a length of 2000–2430 mm. RCP for sewer jacking is also available.
9.2.5 Polyethylene Pipe
PE pipes, shown in Figure 9.7, are manufactured by extrusion of molten PE resin. PE pipes are highly flexible, highly resistant to abrasion, and have little shrinkage. They are often used in cold climates, in areas where land subsidence is taking place, and for high-velocity sewers such as in vacuum and pressure systems. The nominal diameter ranges from 30 to 300 mm with a length of 5000–9000 mm. Joinings are made by butt fusion.
9.2.6 Ductile iron Pipe
Ductile iron (DI) pipe was developed as a successor to cast iron pipe. DI pipe is less brittle than cast iron due to having graphite in spherical form instead of flake form. DI pipe is strong and flexible. It is used basically as a pressure pipe. A wide variety of joints are available (see Figure 9.8). The standard pipes are 75–2600 mm in diameter and 4000–6000 mm in length, with six classes of thickness. Normally, the internal surface is treated with epoxy coating or cement mortar lining. PE wrap is placed outside if a DI pipe is installed in corrosive soil. In the case of sewers, DI pipe for jacking is available.
9.2.7 Steel Pipe
Steel pipes are strong and leakproof and have high flexibility. They are mainly used as pressure pipes. Mechanical and welded joints are available. Internal corrosion protection includes tar-epoxy coating and cement-mortar lining. External protection includes tape and asphalt coating.
L
D
L
D
(a)
(b)
FIGURE 9.6 Standard RCP: (a) A pipe and (b) B pipe.
L
D
FIGURE 9.7 Standard PE pipes.

157Sewerage System: Design Aspects
9.2.8 tunneling Segment
The following three kinds of tunneling segments are available:
1. Steel segment for sewers: Segments are made of rolled steel for welded structures. Segments with five or six joints exist to form a ring in a sewer section as shown in Figure 9.9. The standard outer diameter is 2150–6000 mm.
2. Concrete segment for sewers: Segments with five or six joints exist to form a ring in a sewer section. The outer diameter is the same as that of steel segments.
3. Reinforced concrete segment for sewers: Segments are used for small-diameter tunneling from 900 to 2000 mm. A segment with three joints forms a ring in a sewer section.
9.3 Design of Sewers
9.3.1 Basic Policy
The basis of sewer design is the flow of wastewater and stormwater coming into the sewer. The capacity of a sewer should be calculated to accommodate maximum flow under design conditions, taking into account a safety margin. The necessary capacity decides the cross-sectional area and slope of a sewer. The principle of wastewater or stormwater flow is by gravity. A sewer system needs to be designed economically by
L
L
Detail of joints
D
FIGURE 9.8 Standard DI pipes.
L D
D120°
L
L
W
D
(a) (b)
(c)
FIGURE 9.9 Tunneling segment: (a) steel segment, (b) concrete segment, and (c) resin concrete segment.

158 Construction Technology of Lifeline Pipelines and Its Facilities
considering geography and geology. The size of a trunk sewer is decided from several alternative longitudi-nal section plans with slopes and cross-sectional areas by considering the following: topography, whether or not collectors can connect to the trunk at their ends, whether or not each collectors can accept waste-water from individual properties, whether or not the trunk can meet the levels of WWTP and pumping station inlets, avoiding the downstream sewer becoming so deep, increasing the flow velocity gradually as the trunk goes downstream, whether or not the planned trunk line can avoid existing underground struc-tures, whether or not there may be operation or maintenance problems, and the cost of installation [2].
9.3.2 capacity Design
9.3.2.1 Flow Design for Sanitary Wastewater and Stormwater
The flow design of a sewer is decided according to its capacity, as follows:
• In the case of a separate system, the flow design, in terms of hourly maximum sanitary wastewater flow, is assigned for a separate sanitary sewer. The stormwater flow design is also assigned for a separate stormwater sewer.
• In the case of a combined system, the flow design is assigned in terms of the total hourly maxi-mum sanitary wastewater and stormwater flow, except for the interceptor (or intercepting sewer). The flow design of the interceptor is assigned to be three times as much as the hourly maximum sanitary wastewater flow or even more.
1. Design for sanitary wastewater flow: The design for sanitary wastewater flow for a sewer with a catchment area is calculated by multiplying the hourly maximum flow per area with the total catchment area.
Designhourly maximum flow per hectare(m /s)
Designdaily maximum
3
= ssanitary wastewater flow per person(m /day/person)
1 3 1 8)
3
× ×( . .∼ 11 24 1 60 1 60/ / / ( )× × ×design populationdensity persons/ha (9.1)
2. Design of stormwater flow: The design of stormwater flow is calculated using a theoretical formula rather than an empirical method.
9.3.2.2 Shape of Sewer cross Section
The shape of a sewer’s cross-section is decided considering the hydraulic smoothness, stability against external loads, economy of installation and of operation and management (O&M), and so on.
9.3.2.3 Flow calculation
Flow is calculated using the following equation:
Q A V= × (9.2)
whereQ is flow (m3/s)A is cross-sectional area of flow (m2)V is flow velocity (m/s)
9.3.2.4 Flow Velocity Formula
Sanitary wastewater and stormwater contain suspended solids; however, they do not influence the results for hydraulic calculations of clean water conditions. Manning’s formula is used for gravity flow, and Hazen–Williams’ formula is used for pipe flow.

159Sewerage System: Design Aspects
1. Manning’s formula
Q A V= ×
V
nR I2 3 1 2= × ×
1 / / (9.3)
whereQ is flow (m3/s)A is cross-sectional area of flow (m2)V is flow velocity (m/s)n is roughness coefficientR is hydraulic radius (m) (=A/P)I is slope of water surfaceP is wetted perimeter (m)
2. Hazen–Williams’ formula
Q A V= ×
V 84935CR I63 54= 0 0 0. . . (9.4)
whereQ is flow (m3/s)A is cross-sectional area of flow or pipe (m2)V is flow velocity (m/s)C is roughness coefficientR is hydraulic radius (m)I is hydraulic gradient (head loss per length, h/L)
9.3.2.5 Flow Velocity and Slope
It is economical to match the sewer slope with the ground surface slope if it slopes downward. A flat slope may result in small velocity with solid deposition, which will require frequent cleaning. High velocity, on the other hand, may cause erosion of pipes and manholes. Therefore, ensuring adequate velocity is essential.
1. Sanitary sewer: In a gravity sewer, the flow velocity needs to be set to prevent solids from deposit-ing; thus, the minimum flow velocity should be 0.6 m/s. If the velocity is too high, on the other hand, sewer pipes and manholes might get eroded. Therefore, the maximum velocity should be 3.0 m/s. If the velocity exceeds 3.0 m/s due to a steep ground surface slope, a drop manhole should be installed to reduce the velocity.
2. Storm sewer and combined sewer: In storm and combined sewers, solids in wastewater are heavier than those in a sanitary sewer because of grit inflow from runoff. Therefore, the minimum flow velocity should be 0.8 m/s and the maximum velocity 3.0 m/s. If the velocity exceeds 3.0 m/s due to a steep ground slope, a drop manhole and down-step structures should be installed to reduce the velocity.
9.3.2.6 Minimum Sewer Diameter
The minimum diameter of a public sewer is 200 mm for sanitary sewers and 250 mm for combined sew-ers as per norm. Sewers with a diameter of 150 or 100 mm are used in some cases where future increase of wastewater flow is not expected at all.

160 Construction Technology of Lifeline Pipelines and Its Facilities
9.3.3 Foundation
The sewer pipe foundation or bedding is important to prevent sewer settlement and to increase mechan-ical stability. The type of foundation is selected considering the material of the sewer pipe, the condi-tions of the ground and load, the construction method, and so on. Some foundations are costly, but they may be needed to ensure durability of the sewer. Quality control of construction work is of importance. Sewer settlement and stagnant wastewater due to poor or improper foundation may cause sewer gas release. Sewer gas causes odor problems and damage to concrete sewers and manholes. In the worst case, the sewer could break and collapse, leading to sinkholes on the roads.
9.3.3.1 Rigid Pipe Foundation
Sand, crushed stone, wooden ladder, concrete, reinforced concrete, and pile foundations are used for rigid pipes depending on ground conditions, as shown in Figure 9.10. If the conditions are good, a foun-dation is unnecessary.
1. Sand/crushed stone foundation: Sand or crushed stone foundations are used for relatively good ground conditions. The foundation materials are placed and compacted uniformly to support the pipes as a support. The support angle is the contact range between the foundation material and the pipe as shown in Figure 9.11. The bigger the support angle, the more effective is the expected reinforcement of the pipe strength.
2. Concrete/reinforced concrete foundation: In the case of soft ground and where high load is expected on the pipe, a concrete or reinforced concrete foundation is used. By solidifying the bottom of the pipe with concrete, deflection is restrained, leading to increased pipe strength, as shown in Figure 9.11.
3. Wooden ladder foundation: In the case of soft ground and where uneven load is expected on the pipe, a wooden ladder foundation is used. Two pieces of longitudinal wooden bars are placed along the trench, with short pieces of transverse wooden sleepers placed at regular intervals between the two bars to form a ladder shape. A wooden ladder is often combined with a sand and crushed stone foundation.
4. Pile foundation: In the case of extremely soft ground where soil strength is not expected, piles are driven to support the wooden ladder.
(a) (b) (c)
(d) (e) (f)
FIGURE 9.10 Bedding for rigid pipe: (a) soil, (b) crushed stone, (c) reinforced concrete, (d) concrete, (e) wood support, and (f) wood support and pile.

161Sewerage System: Design Aspects
9.3.3.2 Flexible Pipe Foundation
Flexible pipes like PVC and GRP should use sand or crushed stone foundations as they provide a free support. The minimum thickness of the foundation below the bottom of the pipe should be between 100 and 300 mm. In order to ensure passive resistance of the soil to support the pipe horizontally, soil cement or sheet enclosure foundations are used, as shown in Figure 9.12. In some cases, they are used together with a wooden ladder or concrete footing. Between the pipe and the wooden ladder, a com-pacted sand layer is inserted. In order to prevent soil liquefaction during earthquakes, proper compac-tion of backfill soils or the use of soil cement/crushed stones for backfilling is needed.
9.3.4 Sewer Joining and Joints
9.3.4.1 Sewer Joining
1. Joining of sewers with different diameters: In order to join sewers with different diameters or to meet two sewers, the flow surface or the top of the sewer should be aligned. Flow surface align-ment is hydraulically reasonable, but one needs to calculate the water level. Top alignment is a safe
Concrete
q q
Sand/crushed stone
Support angle
Support angle
(a) (b)
FIGURE 9.11 Bedding types for pipe support: (a) fixed support unexpected deformation and (b) free support expected deformation.
Sand/crushed stone
Wood
ConcreteSoil
cement
Sheet
(a) (b)
(e)(c) (d)
FIGURE 9.12 Flexible pipe bedding: (a) sand/crushed stone, (b) wood support, (c) concrete, (d) sheet enclosure, and (e) soil cement.

162 Construction Technology of Lifeline Pipelines and Its Facilities
way to drain wastewater, but the sewer tends to go deep. A deep sewer is expensive with regard to installation and pumping of wastewater/stormwater. Other than the two recommended methods, center line alignment and bottom alignment are done in some cases. Center line alignment is an intermediate method between flow surface alignment and top alignment. It does not need calcu-lation of the water level. It is used as an alternative for flow surface alignment. Bottom alignment can make the sewer network shallow and reduce the cost of installation. The pumping height and operation cost will be reduced as well. However, the hydraulic gradient line may go above the top of the sewer at the upstream of the network, which is unacceptable (see Figure 9.13).
2. Joining at steep ground slope: In case of a steep ground slope, sewer joining should use a drop manhole or downstep structure as shown in Figure 9.14. Drop manholes should be placed to make the elevation change of 1.5 m or less. If the elevation change is 0.6 m or more, a drop pipe should be provided for the incoming sanitary sewer and the combined sewer. The downstep structure is used for large-diameter sewers. The height of one step should be 0.3 m or less. If local conditions do not allow a drop manhole and downstep structure, other energy dissipation methods should be considered.
3. Sewer junction: The angle between the center lines of two meeting sewers should be 60° or less. The curve radius should be five times as big as or more than the diameter of the sewer joining as shown in Figure 9.15.
Manhole Manhole
Manhole Manhole
Manhole Manhole
Manhole Manhole
Alignment of sewer tops
Center line
Alignment of sewer bottoms
(a)
(b)
(c)
(d)
FIGURE 9.13 Alignment of sewer: (a) flow surface alignment, (b) sewer top alignment, (c) center line alignment, and (d) sewer bottom alignment.

163Sewerage System: Design Aspects
9.3.4.2 Sewer Joints
Sewer pipe joints should be watertight and durable. Poor joints may cause inflow and infiltration when ground water level is high, and exfiltration and pollution when the level is low. Poor joints with sandy soil and high ground water level cause not only inflow and infiltration of groundwater but also inflow of surrounding soil and subsequent soil loosening, leading to clogging, sinkholes, and damage to other utility lines. Selection of proper joints and quality control of joining works are as important as founda-tion bedding selection and its construction.
9.4 Manhole Design
9.4.1 Basic Policy
Manholes are necessary for inspection and cleaning of a sewer. They are placed at the upper end of a sewer, at points where the slope and direction change drastically, at points where elevation or diameter changes, and at sewer junctions. A manhole needs to have enough space for inspection and cleaning. A manhole needs to be big enough to make incoming wastewater flows meet smoothly [2], (see Figure 9.16).
Manhole
Droppipe
Manhole
Manhole
(a)
(b)
FIGURE 9.14 Alignment of sewer for steep ground: (a) drop manhole and (b) downstep structure.
R = 5 d or over
60°
R1 R2
d
d2
d 1 45° 60°or less
FIGURE 9.15 Angle and curve radius for sewers meeting.

164 Construction Technology of Lifeline Pipelines and Its Facilities
9.4.2 Distance, Manhole cover, and invert
Manholes are useful for maintenance even on a straight sewer line. However, having many manholes increases the cost of installation. In the case of a separate sanitary network, too many manholes lead to excessive inflow of stormwater through the ventilation holes on the manhole cover. The maximum distance between manholes is listed in Table 9.1 according to sewer diameter.
The diameter of a manhole cover is usually 60 cm as the size is big enough for a man to enter. Under the cover, a sloping wall gradually increases the inside space toward the bottom.
At the invert of a manhole, a flow channel is created to accept water smoothly from incoming sewers and to send water to outgoing sewers without lumps. In case the channel becomes too big, the channel wall should have steps for workers to reach the bottom.
9.5 cleanouts, catch Basins, and Laterals
9.5.1 Sanitary cleanout
A sanitary cleanout is placed at the boundary of a private land and a public road. A cleanout is round or rectangular in shape and made up of concrete, reinforced concrete, or plastic. A flow channel is provided at the invert. A cleanout cover should be strong and watertight and be made with materials such as cast iron, DI, reinforced concrete, or plastic (Figure 9.17).
Cover Concrete
Adjustment concrete block
Precast cone sectionPrecast cone
section
Precast barrelsections
Slab
Precast barrel sections
Invert
Slab
Mortarseal
Upp
er p
art
Low
er p
art
Steps
Droppipe
Foundation
FIGURE 9.16 Standard type of manhole.
TABLE 9.1 Maximum Distance of Manholes by Sewer Diameter
Sewer diameter (mm) Up to 600 Up to 1000 Up to 1500 Above 1650
Maximum distance (m) 75 100 150 200

165Sewerage System: Design Aspects
9.5.2 Storm cleanout and catch Basin
A storm cleanout is placed at the boundary of a private land and a public road. The distance between catch basins is decided taking into consideration the width and slope of the road. A storm cleanout and catch basin are round or rectangular in shape and made up of concrete, reinforced concrete, or plastic. The cover should be strong and watertight and made with materials such as cast iron, DI, reinforced concrete, or plastic. A sand trap should be provided at the invert. An infiltration type is also available (see Figure 9.18).
9.5.3 Lateral
The lateral is considered based on the following aspects (see Figures 9.19 and 9.20):
1. Material: Lateral material should be reinforced concrete or PVC. 2. Lateral line and distance: a. The lateral connection in a plan should be at right angles to the collector. b. The lateral connection in a vertical cross section should be at an angle of 60° or 90° to the
collector. c. The minimum distance between laterals should be 1 m. 3. Slope and connection point: The lateral slope should be 10 per mil or more, and the lateral should
be connected to the elevation above the center line of the collector. 4. Diameter: The minimum diameter of the lateral should be 150 mm, while smaller laterals can be
used to connect to smaller collectors. 5. Connection method: Laterals should be connected with saddle connectors and saddle-mounted
pipes (see Figure 9.21).
Plan
Section
Dep
thDD
FIGURE 9.17 Sanitary cleanout (#1–4).
Width
D
D
150 mm or over
Plan Section
FIGURE 9.18 Storm cleanout (#1).

166 Construction Technology of Lifeline Pipelines and Its Facilities
9.6 other Structures
9.6.1 inverted Siphon
An inverted siphon is used to avoid unrelocatable infrastructure lines such as a river channel, irriga-tion and drainage channel, railway, subway, water main, gas pipe, power cable, and so on, as shown in Figure 9.22. An inverted siphon should be the last option as it is difficult to maintain.
9.6.2 cSo Structure
A combined sewage overflow (CSO) structure is used to discharge the combined sewage into public water when the combined sewer cannot accommodate the mix of sanitary wastewater and stormwater. This structure should be placed close to the receiving water and maintain continuous discharge even at high water level of receiving waters as shown in Figure 9.23.
With public cleanout
B
A
Public sewer
Private Walkway
Lateral
House sewer House sewer
Storm sewer
Storm sewer
Lateral
Lateral Lateral
WalkwayDriveway Private
Without public cleanout
Stormcleanout
Stormcleanout
B
A
Sanitarycleanout
Lateral
Stor
m cl
eano
ut
Sani
tary
clea
nout
Sani
tary
cl
eano
ut
Sani
tary
se
wer
Stor
m
clea
nout
Stor
m
clea
nout
Catc
hBa
sin
Sani
tary
sew
erSa
nita
ry
sew
er
Sani
tary
sew
er
Sani
tary
cl
eano
ut
Catc
h ba
sin
Late
ral Ca
tch
basin
Priv
ate
Priv
ate
(a)
(b)
(c)
FIGURE 9.19 Lateral in a separate system: (a) plan, (b) A–A section, and (c) B–B section.

167Sewerage System: Design Aspects
9.6.3 Storage Structure for Urban Flood control
Urbanization and increase of runoff increase the risk of riverine flooding. Urban rivers have difficulty in increasing their flood capacity because many private properties are located along the river course. Under such circumstances, some urban sewer systems cannot drain their designed wet weather flow into rivers. Therefore, storage structures are needed such as underground tanks, storage sewers, dams, and ponds.
Priv
ate
Priv
ate
Priv
ate
Catc
h ba
sin
Sew
er m
ain
Priv
ate
House sewer
A
L
L
B B
ASanitary cleanout
Sanitary cleanout
House sewer
Lateral Lateral
Lateral
Walkway
Public sewer
Driveway
Sewer mainCatch basin
(a)
(b) (c)
FIGURE 9.20 Lateral in combined system: (a) plan, (b) A–A section, and (c) B–B section.
PVC cover
Cleanout
Elbow
SaddleSewer main
LateralInvert
FIGURE 9.21 Example of lateral.

168 Construction Technology of Lifeline Pipelines and Its Facilities
9.7 Process of Design
The general process of designing begins with a collection and review of the master plan followed by an arrangement with the relevant authorities, scrutiny of installation method, and documentation. The flowchart of a design procedure is shown in Figure 9.24 [3].
The following procedures need to be conducted in the design to enable smooth construction work:
1. Confirmation that the concerned sewer has already obtained authorization under urban planning law and sewerage law
2. Confirmation that arrangements have been made with the relevant authorities and other utilities
3. Confirmation that arrangements have been made with the relevant residents and businesses
10,000(a)
(b)
FIGURE 9.22 Example of inverted siphon: (a) plan and (b) section.
Inte
rcep
tor
Combined sewer
Combined sewer
InterceptorWeir
Pipeline to outfall
Pipeline to outfall
Manhole with overflow weir
Combined sewer Weir
Pipeline to outfall
Interceptor
Weir topInterceptor
Combined sewer
(b)
(c)(a)
FIGURE 9.23 Example of storm outfall: (a) plan, (b) longitudinal section, and (c) cross section.

169Sewerage System: Design Aspects
9.7.1 Selection of Sewer Route and Flow calculation
Sewer flow calculation is made from the uppermost collector that the sewer reaches up to pumping stations and WWTPs by way of a trunk line. Flow calculation decides the sewer size, slope, and depth. The process and necessary considerations are described as follows.
9.7.1.1 Setting of Drainage Area and treatment Area
The planned area is divided into a drainage area of 20 ha or larger in case of stormwater. The planned area is divided into a drainage area of 10 ha or larger in case of sanitary wastewater. A trunk line is set for each drainage area or treatment area.
9.7.1.2 Sewer Routing
A sewer is routed by referring to the topography and with the following considerations:
1. Trunk line a. Position of pumping stations and WWTPs b. Width of roads to see if the trunk can be accommodated c. Minimization of crossing of railways, rivers, etc. d. Current situation and future plan of other utility lines and structures e. Installation method: open cut or trenchless
Des
ign
Cost
ing
Date collection
Analysis
Sewer routing
Survey
Making of sewer flow table
Selection of installation method
Structural analysis
Making of drawings
Estimation of work and equipment
Cost calculation
Finish
FIGURE 9.24 Design process.

170 Construction Technology of Lifeline Pipelines and Its Facilities
2. Collector a. Collector slope should match that of ground surface b. Minimization of crossing of sanitary line and stormwater line c. Connection to trunk without detour d. Minimization of highway crossing e. Avoidance of inverted siphon
9.7.1.3 Sectioning of Drainage Area and treatment Area, and Sewer numbering
After setting the drainage area/treatment area and routing sewer, the areas should be sectioned according to the amount of wastewater and stormwater entering each collector from the ground sur-face. The sectioning process should consider the topography and the smooth acceptance of stormwater or wastewater into the sewer line.
Each sewer in each section should be numbered as each numbered sewer needs flow calculation.
References
1. Japan Sewage Works Association (2007). Textbook for Wastewater Engineers, Japan Sewage Works Association, Tokyo, Japan (in Japanese).
2. Japan Sewage Works Association (2001). Guideline for Planning and Design of Sewerage System, Japan Sewage Works Association, Tokyo, Japan (in Japanese).
3. Sewerage Management Research Group (2007). Current Statute and Challenge, Japan Sewage Works, Tokyo, Japan (in Japanese).

171
10.1 Materials of Gas Pipelines
10.1.1 outline
The gas transportation system starting from a gas production facility to the customer’s sites generally consists of a high-pressure pipeline system, a medium-pressure pipeline system, and a low-pressure distribution line network as presented in Figure 10.1. High-pressure or middle-pressure gases shall be discharged from a production facility and pressure-reduced at a governor station. Furthermore, the gas pressure shall be reduced to low pressure at a local governor station in order to deliver to residential customers.
A low-pressure direct delivery pipeline system can be available for industrial customers. The percent-age of the latest extension of gas pipeline and the gas supply pressures in Japan is shown in Figure 10.2. The total length of gas pipelines was about 230,000 km in 2005. The percentages of pipe length of the high-pressure and middle-pressure pipelines and the low-pressure distribution lines are a little less than 1%, 13%, and 86%, respectively. Steel line pipes, cast iron pipes, and plastic pipes have mainly been used for gas pipelines.
Steel pipes have been used for high-pressure gas pipelines to low-pressure distribution lines based on such desirable qualities as high strength, high toughness, excellent manufacturability, and uniform mechanical properties of the material. On the other hand, cast iron pipes and plastic pipes have been used for middle-pressure gas pipelines and low-pressure distribution lines.
American Petroleum Institute (API) and Japan Industrial Standards (JIS) are the standards for steel line pipe used for gas pipelines. API 5L is the most widely used line pipe specification in the world
10Natural Gas Distribution
System: Design Aspects
10.1 Materials of Gas Pipelines ...............................................................171Outline • Line Pipe Materials
10.2 Structural Design of Gas Pipeline ..................................................176Regulations and Technical Standards • Pipeline Design
10.3 Seismic Design of Gas Pipelines .....................................................177Assumptions and Requirements of Seismic Design • Seismic Design Codes • Examples of Seismic Design
10.4 Inspection of Girth Weld .................................................................187Welding Method • Nondestructive Inspection of Girth Weld
10.5 Corrosion Protection of Gas Pipeline ............................................192Outline • Corrosion Protection by Pipe Coating • Cathodic Protection
References ......................................................................................................198
Nobuhisa SuzukiPIN Technologies
Hiroyuki HorikawaJFE Engineering Corporation
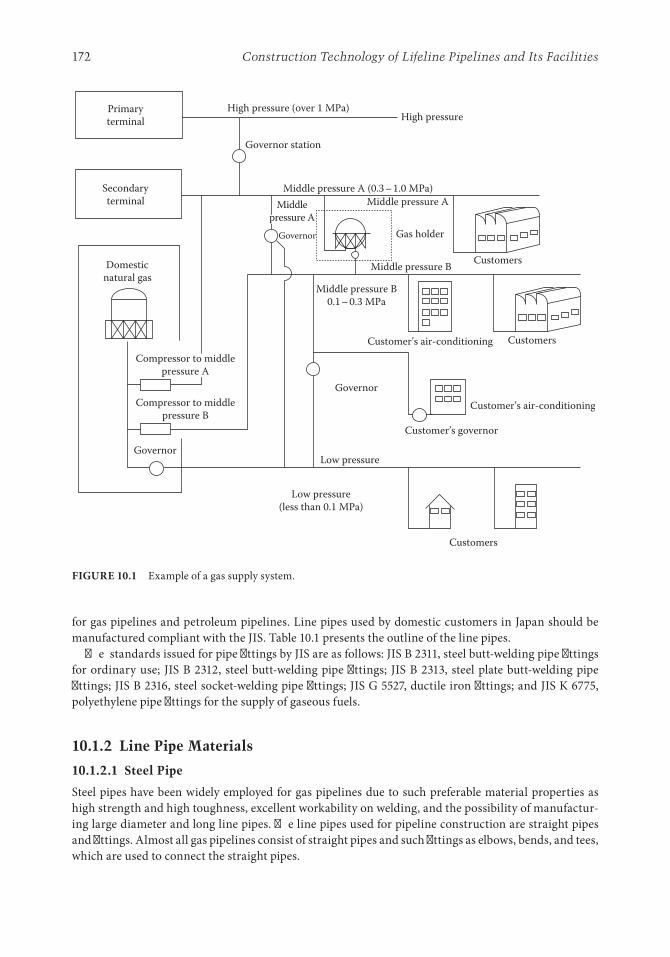
172 Construction Technology of Lifeline Pipelines and Its Facilities
for gas pipelines and petroleum pipelines. Line pipes used by domestic customers in Japan should be manufactured compliant with the JIS. Table 10.1 presents the outline of the line pipes.
The standards issued for pipe fittings by JIS are as follows: JIS B 2311, steel butt-welding pipe fittings for ordinary use; JIS B 2312, steel butt-welding pipe fittings; JIS B 2313, steel plate butt-welding pipe fittings; JIS B 2316, steel socket-welding pipe fittings; JIS G 5527, ductile iron fittings; and JIS K 6775, polyethylene pipe fittings for the supply of gaseous fuels.
10.1.2 Line Pipe Materials
10.1.2.1 Steel Pipe
Steel pipes have been widely employed for gas pipelines due to such preferable material properties as high strength and high toughness, excellent workability on welding, and the possibility of manufactur-ing large diameter and long line pipes. The line pipes used for pipeline construction are straight pipes and fittings. Almost all gas pipelines consist of straight pipes and such fittings as elbows, bends, and tees, which are used to connect the straight pipes.
Primaryterminal
Secondaryterminal
Domesticnatural gas
Compressor to middlepressure A
Compressor to middlepressure B
Governor
Low pressure(less than 0.1 MPa)
Customers
High pressure (over 1 MPa)
Governor station
Middle pressure A (0.3 – 1.0 MPa)Middle pressure A
Middle pressure B
Governor Gas holder
Customers
Customers
Middle pressure B0.1 – 0.3 MPa
Governor
Low pressure
Customer’s air-conditioning
Customer’s air-conditioning
Customer’s governor
High pressure
Middlepressure A
FIGURE 10.1 Example of a gas supply system.

173Natural Gas Distribution System: Design Aspects
Year
Low pressure(less than 0.1 MPa)
Middle pressure(0.1–1.0 MPa)
High pressure(1 MPa and high)
1995 86.7% 12.7%0.6%
0.6%
0.6%
0.7%
0.8%
0.8%
198.755
205.820
212.577
218.933
225.192
232.328
12.7%
12.8%
12.9%
12.9%
12.9%
86.7%
86.6%
86.4%
86.4%
86.3%
1997
1999
2001
2003
2005
FIGURE 10.2 Total gas pipeline length (km).
TABLE 10.1 Pipe Material Standards
Pipe Materials Tensile
Strength Yield Strength Application
Steel JIS G 3452: Carbon steel pipes for ordinary piping
SGP 290 N/mm2 — Low or middle pressureLess than 10 in. diameter
JIS G 3454: Carbon steel tubes for pressure piping
STPG 370STPG 410
370 N/mm2
410 N/mm2215 N/mm2
245 N/mm2Middle or high pressureLess than 14 in. diameter
JIS G 3457: Arc-welded carbon steel pipes
STPY 400 400 N/mm2 225 N/mm2 High pressureLess than 16 in. diameter
JIS G 3456: Carbon steel pipes for high-temperature service
STPT 370STPT 410
370 N/mm2
410 N/mm2215 N/mm2
245 N/mm2Middle- or high-pressure
fittingsLess than 20 in. diameter
API 5L PSL1: Line pipe X42/L290 415 MPa 290 MPa High pressureX52/L360 460 MPa 360 MPaX60/L415 520 MPa 415 MPaX65/L450 535 MPa 450 MPa
Cast iron JIS G 5526: Ductile iron pipes
FCD 420-10 420 N/mm2 — Low or middle pressureMore than 4 in. diameter
Polyethylene JIS K 6774: Polyethylene pipes for gaseous fuels
17.7 MPa — Low or middle pressureLess than 12 in. diameter
JIS K 6775: Polyethylene pipe fittings for gaseous fuels
17.7 MPa —

174 Construction Technology of Lifeline Pipelines and Its Facilities
Seamless pipes and arc-welded straight seam pipes are used for the line pipes. A pipe manufacturing process of the seamless pipe is presented in Figure 10.3. The roll-forming manufacturing process shall be applied to manufacture the seamless pipes. The seamless pipes are manufactured through a series of manufacturing processes that involve a heat-up process of a steel billet in a furnace, a penetrating pro-cess of a billet with a mandrel mill in the longitudinal direction, a properly forming process with a roll mill, and finally a shape-up process to finish to the required size with a sizing mill.
Line pipes with a straight seam are manufactured by the use of the arc welding method, the elec-tric resistance welding (ERW) method, and the butt welding (BW) method. In the case of the arc welding method, a steel plate shall be rolled or pressed in order to form the pipe shape, and then the straight seam shall be welded by the submerged arc welding method and other methods. The manu-facturing methods shall also be applied to produce UOE line pipes and bending roll line pipes. The ERW pipes shall be produced through the following production processes: the combined recoiling and rolling process to form a pipe shape, the high-frequency induction heating process to fuse the root faces, and the final welding process. The BW pipe shall be manufactured through the combined recoiling and rolling process to form a pipe shape, the heating process, and the BW process for the straight seam.
The general production processes of UOE pipe, ERW pipe, and BW pipe are illustrated in Figures 10.4 through 10.6, respectively.
The fittings had been manufactured connecting some pipe pieces by weld until around 1965, and the specifications of the fittings had almost been compliant with JIS G 3451, the specifications for the fit-tings of water pipes. The present specifications of the fittings were established around 1966. The major examples of the specifications were altered as follows around 1966: the hot bend should be a replacement of the welded miter bend, the hot bend with a smooth curvature should be used instead of the welded tee, and the reducer should be replaced by the welded reducer.
10.1.2.2 cast iron Pipe
Cast iron used to have been the main material for the gas distribution system from the beginning of the construction. Steel pipes and plastic pipes have occupied a main portion of the construction of distribution lines instead of cast iron pipes. Ductile iron pipes had been used since around 1965
Rotary heating furnace Piercer Elongator
Plug millReelerReheating furnaceSizer
Cooling table Straightening Cutting
InspectionsHydrostatictestingShipment
FIGURE 10.3 Seamless piping.

175Natural Gas Distribution System: Design Aspects
because of the superior material properties to the conventional cast iron pipes due to the strength and ductility. A historical record of the development of cast iron pipes and ductile iron pipes is presented in Table 10.2.
10.1.2.3 Polyethylene Pipe
Polyethylene pipes have been used for the middle-pressure pipeline and the low-pressure distribution lines. Polyethylene pipes have mostly been used for newly constructed low-pressure distribution lines with a nominal diameter up to 300 mm.
Tab welding Edge milling and beveling
O-ing U-ing ClimpingUltrasonic inspection
Outside weldingInside weldingContinuous tack welding
End facing and beveling
Ultrasonic inspection
Inspections Shipment
Hydrostatic testing Mechanical expansion
FIGURE 10.4 UOE pipe milling.
Ultrasonic inspection
Uncoiling
Edge milling Cageforming
Electricresistancewelding
Inside andoutside flash
cutting
Post-annealing
Cooling
Pipe
Ultrasonic inspection
Facing and chamfering
Inspections Shipment
Hydrostatic testing Cutoff Sizing
FIGURE 10.5 ERW pipe milling.

176 Construction Technology of Lifeline Pipelines and Its Facilities
10.2 Structural Design of Gas Pipeline
10.2.1 Regulations and technical Standards
The Examples of Structural Design in accordance with Technical Standard of Gas Facilities (The Examples of Structural Design), which is a part of The Gas Business Act (The GBA), specifies that gas companies and gas pipeline companies should ensure facility integrity to withstand the external loads, the maximum operating pressure at the operating temperatures. And the design formula to calculate the minimum required pipe wall thickness and the required seismic integrity for gas pipelines are presented in the Examples of Structural Design. The contents are presented in Section 10.2.2.
The following design codes are available related to the GBA: the Seismic Design Codes of High Pressure Gas Pipeline (SDC for HPPL), the Seismic Design Codes of High Pressure Gas Pipelines Considering Liquefaction-Induced Permanent Ground Deformation (the SDC for PGD), the Guidelines for Design of High Pressure Pipelines (GLS for HPPL), and the Guidelines for Design of Distribution Lines (the GLS for DLs).
The high-pressure pipelines and the distribution lines to be constructed beneath the road shall be compliant with the Road Law with respect to the burial position and the burial depth besides the techni-cal standards of the GBA.
Uncoiling Leveling Cutshears
Coiljoint
Looper
Edge roll
Heating
Cooling table
Straightener
InspectionShipment
Rotary hot saw
Stretch reducer Forming butt-welding
FIGURE 10.6 Butt welding pipe milling.
TABLE 10.2 Material Changes of Cast Iron Pipes
Period Material Casting Strength (kg/mm2) Remarks
1885 General cast iron pipe Stand tube casting 12.6 Graphite flake scattered in ferrite base metal
1932 High-grade cast iron pipe Stand tube casting 19 Pearlite mainly contained1954 High-grade cast iron pipe Centrifugal casting
with sand mold26 Improvement of nests and
thickness deviations1961 Ductile cast iron pipe Centrifugal casting
with metal mold26 Improvement of nests and
thickness deviations

177Natural Gas Distribution System: Design Aspects
10.2.2 Pipeline Design
10.2.2.1 outline
The gas pipelines shall be designed to withstand the specified external loads and ensure pipeline integ-rity. The pipe stress induced by internal pressure, soil pressure, and vehicles more than thermal change shall be less than the allowable stress to ensure pipeline integrity. The required performance of pipeline to withstand external loads is presented in Table 10.3.
10.2.2.2 Minimum Pipe Wall thickness Presented in the Design examples complying with technical Standard of Gas Facilities
Pipe wall thickness shall be determined in order that pipe stress, pipe strain, and displacements induced by the design loads shall be less than the corresponding allowable values. The Examples of Structural Design, the technical standards of the GBA [1], prescribes the design equation to calculate the minimum pipe wall thickness as follows:
t
PD
PC
a
=+
+0
2 0 8σ η .
wheret (mm) is the minimum wall thicknessP (MPa) is a maximum operating pressure
Moreover, σ (MPa) expresses the tensile strength of pipe, which is defined by JIS or shall be determined by tensile test, and D0 (mm) means outside diameter. C (mm) represents a corrosion allowance that should be larger than 1.0 mm; however, that could be ignored in the case some sort of corrosion-resistant materials was used or some appropriate anticorrosion measure was employed.
10.2.2.3 Basis of Seismic Design of the examples of Structural Design complying with the technical Standards of Gas Facilities
The SDC of HPPL and the SDC for PGD, both of which were issued by JGA, are requesting to investigate the seismic effects on gas facilities in accordance with the necessary issues.
10.3 Seismic Design of Gas Pipelines
10.3.1 Assumptions and Requirements of Seismic Design
10.3.1.1 outline of Seismic Design
Seismic integrity of gas pipelines shall be investigated considering the effects of ground motion, lat-eral spreading, and surface ground fissures. The ground motion and the lateral spreading shall be
TABLE 10.3 Required Performance of Pipeline to External Loads
Load Required Performance
Primary load Internal pressure Stress shall be within elastic regionSoil pressureSoil pressure induced by vehicle weight
Secondary load Third-party construction effectThermal changeEarthquake Level 1 earthquake No damage and no service suspension
Level 2 earthquake No leakageDeformation is allowedLiquefaction

178 Construction Technology of Lifeline Pipelines and Its Facilities
taken into account for the seismic design of high-pressure gas pipelines as presented in Figure 10.7. And the surface ground fissures shall be considered for the seismic design of low-pressure gas distri-bution lines as presented in Figure 10.8. The maximum ground displacement induced by the ground motion may develop as large as several centimeters to several tens of centimeters. The design ground displacement taken into account of the seismic design of the middle-pressure gas pipelines and the low-pressure gas distribution lines shall be the surface ground fissures with vertical and horizontal displacements of 5 cm.
(a) (b)
FIGURE 10.7 Deformation of ground and pipe: (a) seismic waves and (b) ground displacement due to liquefaction.
Ground displacement
Friction
Rigidstructure
Ground displacement
Friction
Rigidstructure
Δv
Δv
Δu
Δu
FIGURE 10.8 Seismic design models for middle- and low-pressure pipelines. (From Japan Gas Association, Seismic Design Code for Middle and Low Pressure Lines, 2014, pp. 20,27.)

179Natural Gas Distribution System: Design Aspects
10.3.2 Seismic Design codes
10.3.2.1 outline
The Draft Technical Standard of Petroleum Pipeline [2] issued in 1974 has been the basis of the design methodology of the high-pressure gas pipelines. The Seismic Design Codes of High Pressure Gas Pipelines issued in 1982 was the beginning of seismic design of high-pressure gas pipelines, and the Seismic Design Codes of Middle and Low Pressure Gas Distribution Lines issued in the same year was also the first document describing seismic design of the distribution lines. Both seismic design codes have been updated taking into account of the lessons learned from the effects induced by some hazard-ous earthquakes since their first enforcement.
The ground motion level 2 (GML2) has been defined in the SDC of HPPL based on the observed ground motion during the 1995 South of Hyogo-Prefecture earthquake (the Kobe earthquake), and the other seismic design codes considering liquefaction-induced permanent ground deformation were issued after the enforcement of the aforementioned GML1. Project-specific pipeline design taking into account the surface faulting has been conducted as the current design codes and guidelines do not deal with the design method.
The following seismic design codes and guidelines were issued after “The Draft Technical Standard of Petroleum Pipeline”:
1. Seismic Design Code of High Pressure Gas Pipelines [3] (SDC of HPPL) 2. Seismic Design Code of High Pressure Gas Pipelines Considering Liquefaction-Induced
Permanent Ground Deformation [4] (SDC for PGD) 3. Seismic Design Code for Middle Pressure Pipelines and Low Pressure Distribution Lines [5] (SDC
for MLPL) 4. Design Code of High Pressure Gas Pipeline [6] (DC of HPPL) 5. Design Code of Gas Distribution Main Pipes and Distribution Lines [7] (DC of Distribution
Lines)
10.3.2.2 Seismic Design code of High-Pressure Gas Pipelines
10.3.2.2.1 OutlineThe SDC of HPPL specifies the seismic design methods in terms of the design formula to calculate pipe strain induced by the seismic excitation and the corresponding allowable strain to ensure pipeline integ-rity [3]. The SDC of HPPL requires the pipeline integrity depending on the level of ground motions, GML1 and GML2. Requirements for the pipeline integrity are listed in Table 10.4, which requires no damage to gas pipelines and possibility to resume operation immediately during earthquakes with GML1, and no break and no leak should be ensured in spite of permitting high-strain deformation dur-ing earthquakes with GML2.
TABLE 10.4 Seismic Design Wave and Requirement for High-Pressure Pipelines
Seismic Design Wave Requirement
Level 1 seismic wave Strong seismic wave, generally once or twice during total service period
No damageNo suspension of service
Level 2 seismic wave Very strong seismic wave; very few during total service period
Categorized to inland earthquake
No leakDeformation is allowed
Source: Japan Gas Association, Seismic Design Code for High Pressure Gas Pipelines, 2013, p. 13.

180 Construction Technology of Lifeline Pipelines and Its Facilities
10.3.2.2.2 Seismic Design MethodTraveling seismic waves along pipeline shall be taken into account for the seismic design as presented in Figure 10.9, where the excursion of the ground motion is expressed with a sinusoidal function and the direction coincides with the axis of pipeline.
The apparent wavelength is expressed by Equation 10.1 in terms of the natural ground period T (s).
L VT= (10.1)
whereL (m) is an apparent wavelength of the seismic wavesV (m/s) is an apparent propagating velocity of the seismic waves presented in Figure 10.10
Longitudinal grounddisplacement Direction of seismic wave
Wavelength L
Distribution of longitudinaldisplacement
Pipe
FIGURE 10.9 Progressive wave.
5.02.01.00.50.20.13
5
10
30
50
100
300
Velo
city
resp
onse
Sv [
m/s
]
Ground natural period T [s]
FIGURE 10.10 Apparent propagation velocity of seismic waves. (From Japan Gas Association, Seismic Design Code for High Pressure Gas Pipelines, 2013, pp. 55,57.)

181Natural Gas Distribution System: Design Aspects
Figure 10.11 defines the design ground motions I and II, which may be caused by an inland earthquake and an offshore earthquake, respectively.
The ground displacement at the buried pipeline can be calculated with:
U T S
z
Hh v= ⎛
⎝⎜
⎞
⎠⎟
2
22πν
πcos (10.2)
whereUh (cm) expresses the horizontal ground displacement at z (m)Sv (m/s) represents the response velocity of design ground motionν is a zone factorz (m) means the burial depth of pipelineH (m) expresses the thickness of surface layer
Longitudinal ground strain induced in a uniform surface layer is expressed as Equation 10.3 at the burial depth of pipeline.
ε
πG
hU
L=
2 (10.3)
where εG is the longitudinal ground strain induced at the burial depth in a surface layer with uniform thickness.
The longitudinal ground strain generated by the design ground motion can be presented as in Figure 10.12 in terms of a natural ground period in a uniform surface layer, where the values were obtained using Equation 10.2 neglecting both the local correction factor and the burial depth.
The longitudinal pipe–soil interaction is expressed by the linear–perfect plastic relationship as pre-sented in Figure 10.13, which is useful to express such a nonlinear behavior as slippage as presented in Figure 10.14. The longitudinal pipe strain can be obtained multiplying the longitudinal ground strain and a strain transfer factor α in which the slippage is taken into account. When the longitudinal pipe
5.02.01.00.50.20.150
100
200
500
1000
2000
App
aren
t pro
paga
tion
velo
city
V [m
/s]
Natural period of ground surface layer T [s]
FIGURE 10.11 Velocity response and ground natural period. (From Japan Gas Association, Seismic Design Code for High Pressure Gas Pipelines, 2013, p. 64.)

182 Construction Technology of Lifeline Pipelines and Its Facilities
5.02.01.00.50.20.10.03
0.05
0.1
0.2
0.5
1
Gro
und
stra
in o
f uni
form
surfa
ce la
yer [
%]
Ground natural period T [s]
Type I waveType II wave
FIGURE 10.12 Ground strain of uniform surface layer. (From Japan Gas Association, Seismic Design Code for High Pressure Gas Pipelines, 2013, pp. 67–68.)
Shea
r str
ess o
f gro
und
[τ]
Relative displacement between ground and pipe [δ]
1
k
τcr
FIGURE 10.13 Nonlinear property of longitudinal ground spring. (From Japan Gas Association, Seismic Design Code for High Pressure Gas Pipelines, 2013, p. 26.)
Shear stressof ground
Slip section
τcr
–τcr
FIGURE 10.14 Slip section due to nonlinearity of ground spring. (From Japan Gas Association, Seismic Design Code for High Pressure Gas Pipelines, 2013, p. 161.)
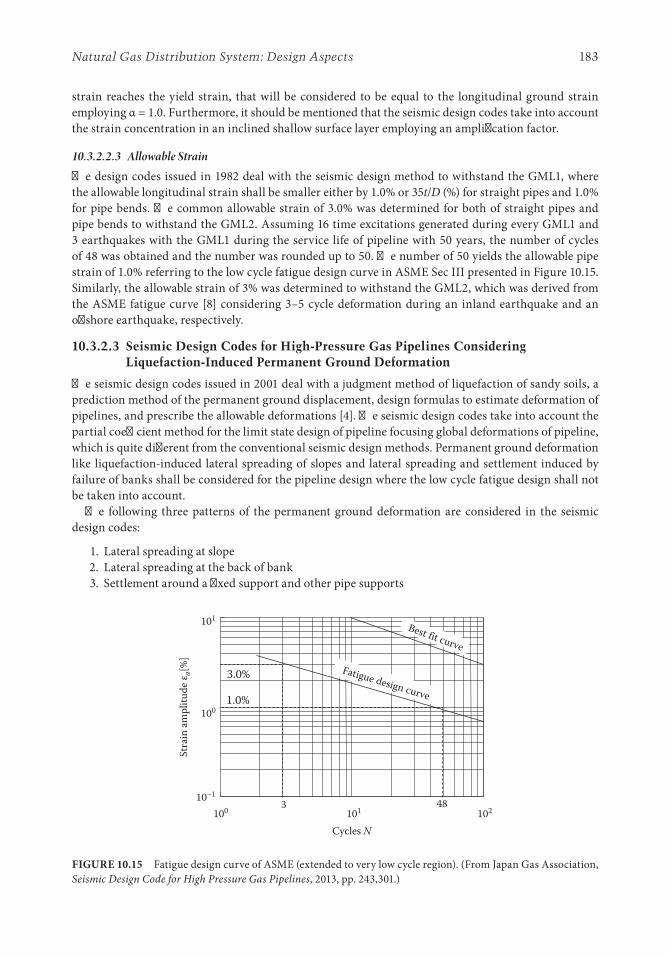
183Natural Gas Distribution System: Design Aspects
strain reaches the yield strain, that will be considered to be equal to the longitudinal ground strain employing α = 1.0. Furthermore, it should be mentioned that the seismic design codes take into account the strain concentration in an inclined shallow surface layer employing an amplification factor.
10.3.2.2.3 Allowable StrainThe design codes issued in 1982 deal with the seismic design method to withstand the GML1, where the allowable longitudinal strain shall be smaller either by 1.0% or 35t/D (%) for straight pipes and 1.0% for pipe bends. The common allowable strain of 3.0% was determined for both of straight pipes and pipe bends to withstand the GML2. Assuming 16 time excitations generated during every GML1 and 3 earthquakes with the GML1 during the service life of pipeline with 50 years, the number of cycles of 48 was obtained and the number was rounded up to 50. The number of 50 yields the allowable pipe strain of 1.0% referring to the low cycle fatigue design curve in ASME Sec III presented in Figure 10.15. Similarly, the allowable strain of 3% was determined to withstand the GML2, which was derived from the ASME fatigue curve [8] considering 3–5 cycle deformation during an inland earthquake and an offshore earthquake, respectively.
10.3.2.3 Seismic Design codes for High-Pressure Gas Pipelines considering Liquefaction-induced Permanent Ground Deformation
The seismic design codes issued in 2001 deal with a judgment method of liquefaction of sandy soils, a prediction method of the permanent ground displacement, design formulas to estimate deformation of pipelines, and prescribe the allowable deformations [4]. The seismic design codes take into account the partial coefficient method for the limit state design of pipeline focusing global deformations of pipeline, which is quite different from the conventional seismic design methods. Permanent ground deformation like liquefaction-induced lateral spreading of slopes and lateral spreading and settlement induced by failure of banks shall be considered for the pipeline design where the low cycle fatigue design shall not be taken into account.
The following three patterns of the permanent ground deformation are considered in the seismic design codes:
1. Lateral spreading at slope 2. Lateral spreading at the back of bank 3. Settlement around a fixed support and other pipe supports
Cycles N
Stra
in am
plitu
de ε a
[%]
Fatigue design curve
Best fit curve
10248
3.0%
1.0%
10110–1
100
101
3100
FIGURE 10.15 Fatigue design curve of ASME (extended to very low cycle region). (From Japan Gas Association, Seismic Design Code for High Pressure Gas Pipelines, 2013, pp. 243,301.)

184 Construction Technology of Lifeline Pipelines and Its Facilities
10.3.2.3.1 Lateral Spreading at SlopeThe lateral spreading will occur at a slope due to the effect of liquefiable layer, which may generate defor-mation of pipeline. The lateral spreading of slopes with a gradient larger than 1% shall be taken into account for the pipeline design. However, a conservative assumption has been made that the backfilling of pipelines does not liquefy although gas pipelines are being buried with a depth of 1.0–2.0 m. While liquefaction actually occurs in liquefiable layers including the surface layer and the surrounding soils of pipeline, the conservative assumption does not require a reduction of the pipe–soil interaction. It is recognized that backfilling may not liquefy in the case the backfill sand can be compacted in accordance with the regulations issued by the administrator of the road [9] (Figure 10.16).
Examples of straight pipeline and pipeline with a pipe bend are presented in Figure 10.17, which shall be used to calculate the critical deformation of pipelines subjected to axial compression of a straight pipe and the closing-mode and the opening-mode bending of a pipe bend.
10.3.2.3.2 Lateral Spreading at the Back of BankThere are two types of bank protection, a gravity-type bank and a sheet pile bank. The ground at the back of the bank may move toward the water zone and that may deform a pipeline in case the bank loses the bearing strength due to liquefaction of the foundation soils. The effect of lateral spreading shall be investigated to comply with the design codes when a gas pipeline runs through an area within 100 m from bank protection and the height of bank is more than 5 m. Typical evaluation models of a straight pipeline and a pipeline with a bend near bank protection are presented in Figure 10.18.
10.3.2.3.3 Settlement around a Fixed Support and Other Pipe SupportsWhen a pipeline is fixed by very stiff foundations and the neighboring ground settles, the pipeline near the support may largely deform. The effect of ground settlement shall be investigated when a pipeline is supported by an abutment or other massive structures. The ground settlement of 5% of thickness of liquefiable layer shall be employed for the seismic design.
10.3.2.4 Seismic Design codes of Middle-Pressure Pipeline and Low-Pressure Distribution Lines
The seismic design codes specify ground fissures and a relative displacement near structures presented in Figure 10.19, which shall be the input ground displacements of the seismic design [5]. Seismic integ-rity of the pipes shall be confirmed to withstand the ground fissures with an opening displacement of 5.0 cm and a vertical gap of 2.5 cm assuming the allowable strain of steel pipes, cast iron pipes, and polyethylene pipes to be 3.0%, 2.0%, and 20%, respectively.
Ground displacement
Pipe
Liquefied layer
Nonliquefied layer
FIGURE 10.16 Ground movement due to liquefaction with sloping ground. (From Japan Gas Association, Seismic Design Code for High Pressure Gas Pipelines Considering Liquefaction-Induced Permanent Ground Deformation, 2001, p. 57.)

185Natural Gas Distribution System: Design Aspects
10.3.3 examples of Seismic Design
An example of seismic design of pipeline to withstand the liquefaction-induced lateral spreading, pre-sented in Figure 10.20, is explained in this section, and the assumptions are presented in Table 10.5. The seismic design of pipeline was conducted to comply with the SDC for PGD. The finite element and the tensile properties of material used for the design are presented in Figure 10.21. The maximum
Uniform distribution of ground displacement
Pipe
Slope
Ground deformation area
400 m
δh
(b)
Uniform distribution of ground displacement
Ground deformation areaPipe
Slope
δh
Wh
(a)
Triangle distribution of ground displacementPipe
Slope
90° bend pipe
Ground deformation area
400 m
45°
δh
(d)
Triangle distribution of ground displacement
PipeSlope
Ground deformation area
45° bend pipe
δh
22.5°
(c)
FIGURE 10.17 Evaluation models of ground movement with sloping ground: (a) for compressive deformation, (b) for straight pipe bending, (c) for closing-mode bending, and (d) for opening-mode bending. (From Japan Gas Association, Seismic Design Code for High Pressure Gas Pipelines Considering Liquefaction-Induced Permanent Ground Deformation, 2001, pp. 77, 85.)
Ground displacement
Nonliquefaction layer PipeSeawall
Liquefaction layer
FIGURE 10.18 Ground movement near a seawall. (From Japan Gas Association, Seismic Design Code for High Pressure Gas Pipelines Considering Liquefaction-Induced Permanent Ground Deformation, 2001, p. 57.)

186 Construction Technology of Lifeline Pipelines and Its Facilities
Pipe
Seawall
Seawall leaning sectionWater
δh
(b)
(d)
45° bend pipe
Pipe
Seawall
Seawall leaning section
Water
δh
45°
400 m
(c)
Needless
(a)
Pipe
Seawall
Seawall leaning sectionWater
Disp
lace
men
t dist
ribut
ion
90° bend pipeδh
400 m
FIGURE 10.19 Evaluation models of ground movement near a seawall: (a) for compressive deformation, (b) for straight pipe bending, (c) for closing-mode bending, and (d) for opening-mode bending. (From Japan Gas Association, Seismic Design Code for High Pressure Gas Pipelines Considering Liquefaction-Induced Permanent Ground Deformation, 2001, pp. 96,99.)
Slope
400 m
Triangle distributionMaximum displacement = 3 m
FIGURE 10.20 Evaluation model for straight pipe bending.
TABLE 10.5 Conditions of Seismic Design ExampleDiameter 40.64 cmWall thickness 7.9 cmMaterial API 5L X52Cover depth 1.8 m

187Natural Gas Distribution System: Design Aspects
tensile and compressive strains of pipeline induced by the liquefaction-induced lateral spreading are presented in Figure 10.22. The figure clarifies that the strain tends to increase with increasing ground displacement.
10.4 inspection of Girth Weld
10.4.1 Welding Method
10.4.1.1 Welding Method and Geometry of Groove
An example of a weld joint used for gas pipelines is presented in Figure 10.23. A BW joint is gener-ally used for pipeline construction applying a one-sided Uranami welding with a V-shaped groove except an automatic welding system with high efficiency. The V-shaped groove is presented in Figure 10.24 [10], and the welding quality tends to highly depend on the length of root face, the root gap, the groove angle, and the high–low discrepancy. The root angle between 60° and 70° shall be used for the shielded metal-arc welding and 20° and 70° for the automatic metal active gas (MAG) welding. The following requests are usually given for pipeline welding: the length of root face less than 2.6 mm, the root gap between 1 and 6 mm, and the high–low gap less than 2.0 mm. Both bevel angles shall be a half of the groove angle.
Model Element
Pipe
Property
Soil reaction properties in axial,normal, and circumferentialdirections are modeled.(Soil spring model is shown next.)
For API line pipesYield stress on 0.5% total strainTensile strength on 5% total strainYoung modulus = 2.06 × 10e7 N/cm2
Shellelement
Gro
und Nonlinear
trusselement
σ
σtσy
0 0.5
Spring elementof normal direction
Spring element ofcircumferential direction
Spring elementof axial direction
E
5.0ε [%]
FIGURE 10.21 Elements and material properties.

188 Construction Technology of Lifeline Pipelines and Its Facilities
0.200.150.100.050.00
–0.05–0.10–0.15–0.20
0.0 0.5 1.0 1.5Ground displacement [m]
Max
imum
stra
in [%
]
2.0 2.5 3.0
FIGURE 10.22 Maximum tensile and compressive strains.
t
θ
ft
t t t
ff
g g g
θ θ/2Single V-groove Double V-groove Single U-groove
(a)
(b)
FIGURE 10.23 Examples of welded joints: (a) butt weld joint and (b) fillet weld joint.
Groove angle θ
Groove face
Root gap g
Bevel angle
Generally
Root
face
f
θ/2
Line
arm
isalig
nmen
t e
FIGURE 10.24 Schematic illustration of single V-groove. (From Narita, K. and Fuji, T., Practical Welding for Piping and Pipeline, Sanpo Publishing, 1995, p. 65.)
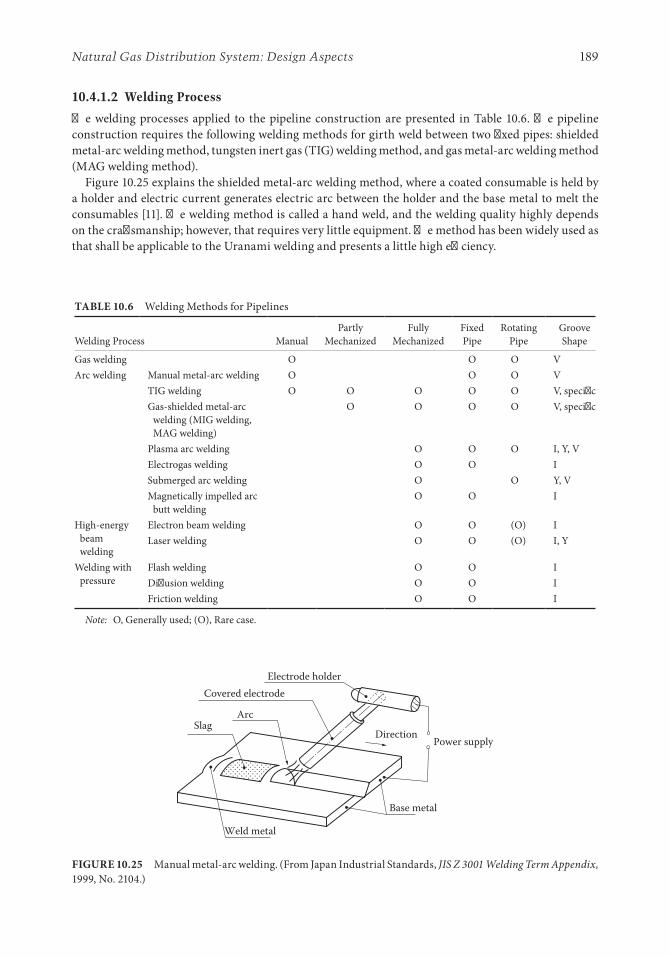
189Natural Gas Distribution System: Design Aspects
10.4.1.2 Welding Process
The welding processes applied to the pipeline construction are presented in Table 10.6. The pipeline construction requires the following welding methods for girth weld between two fixed pipes: shielded metal-arc welding method, tungsten inert gas (TIG) welding method, and gas metal-arc welding method (MAG welding method).
Figure 10.25 explains the shielded metal-arc welding method, where a coated consumable is held by a holder and electric current generates electric arc between the holder and the base metal to melt the consumables [11]. The welding method is called a hand weld, and the welding quality highly depends on the craftsmanship; however, that requires very little equipment. The method has been widely used as that shall be applicable to the Uranami welding and presents a little high efficiency.
TABLE 10.6 Welding Methods for Pipelines
Welding Process Manual Partly
Mechanized Fully
Mechanized Fixed Pipe
Rotating Pipe
Groove Shape
Gas welding O O O VArc welding Manual metal-arc welding O O O V
TIG welding O O O O O V, specificGas-shielded metal-arc
welding (MIG welding, MAG welding)
O O O O V, specific
Plasma arc welding O O O I, Y, VElectrogas welding O O ISubmerged arc welding O O Y, VMagnetically impelled arc
butt weldingO O I
High-energy beam welding
Electron beam welding O O (O) ILaser welding O O (O) I, Y
Welding with pressure
Flash welding O O IDiffusion welding O O IFriction welding O O I
Note: O, Generally used; (O), Rare case.
Electrode holderCovered electrode
ArcSlag
Weld metal
Base metal
Power supplyDirection
FIGURE 10.25 Manual metal-arc welding. (From Japan Industrial Standards, JIS Z 3001 Welding Term Appendix, 1999, No. 2104.)

190 Construction Technology of Lifeline Pipelines and Its Facilities
Figure 10.26 illustrates the TIG welding method, which is an arc welding process that uses a non-consumable tungsten electrode and a separate rod of filler metal to produce the weld. The weld area is protected from atmospheric contamination by an inert shielding gas (argon or helium) [11]. TIG welding is often used to weld stainless steel and aluminum and has been used for pipeline construction in recent years due to ease of welding in difficult configurations of fixed pipes, ease of forming a root weld with-out backup bar in a root pass, and decrease in slag. The efficiency of TIG welding tends to be inferior to that of the shielded metal-arc welding, and arc welding or automatic MAG welding can be used for the second and higher layers of weld metal.
Figure 10.27 presents the MAG welding method, where the wire electrode shall be fed and fused con-tinuously, and therefore the welding efficiency has been recognized to be very high. An arc shall occur between the wire electrode and the base metal, and the arc and the weld metal shall be shielded with an inert gas. A carbonic acid gas or a mixture of carbonic acid gas and argon gas shall be used for the shield-ing, and the mixture tends to be used for the pipeline construction. A wire with flux and a solid wire without flux can be used for the wire electrode; however, the solid wire shall be used nearly always. The automatic welding system shall usually be applied to the pipeline construction, and the semiautomatic
Tungsten electrode
Contact tipShielding gas
Nozzle of shielding gasFiller rod
Weld metal ArcBase metal
DirectionPower supply
FIGURE 10.26 TIG welding. (From Japan Industrial Standards, JIS Z 3001 Welding Term Appendix, 1999, No. 2108.)
Electrode wire
Contact tip
Shielding gas
Nozzle of shielding gas
Weld metalArc
Base metal
Direction
Feed roller
Power supply
FIGURE 10.27 MAG welding. (From Japan Industrial Standards, JIS Z 3001 Welding Term Appendix, 1999, No. 2113.)

191Natural Gas Distribution System: Design Aspects
welding system has seldom been used. An example of practical use of the MAG automatic welding sys-tem is presented in Figure 10.28.
The welding methods used for pipeline construction are summarized in Table 10.6.
10.4.2 nondestructive inspection of Girth Weld
10.4.2.1 Purpose of nDi and Weld Defect
The organization of the arc weld is not homogeneous intrinsically due to sudden heat and quench, and the weld joint tends to have residual stress and thermal deformation, and various weld defects can occur in the weld joint. The harmful weld defects shall be detected by nondestructive inspection (NDI) and excluded in order to ensure integrity of the weld joint. Typical flaw defects possible to be generated dur-ing a one-side weld joint are presented in Figure 10.29 [12]. The relationship between the weld defect and the strength of the weld joint has not been clarified theoretically; however, the semiempirical relation-ship can be expressed as in Table 10.7.
10.4.2.2 nondestructive inspection
The following NDI methods shall be applicable to the weld joint, radiographic test (RT), ultrasonic test (UT), magnetic powder test (MT), dye penetration test (PT), and visual inspection (VI). The RT and UT shall be used for the inspection of internal defects, and the MT, PT, and VI are appli-cable to detect the surface flaws. The merits and demerits of the NDI methods are explained in Table 10.8; therefore, an appropriate method shall be chosen and applied for the inspection to comply with the specified usage [10]. JIS Z 3050 specifies the NDI method of the weld joint of pipelines, which describes the general issues in terms of the technical divisions of the NDI method, and the test engi-neer also comments on conducting the following tests: VI, RT, UT, MT, and PT. The appendix of JIS Z 3050 specifies the criteria of the aforementioned NDI methods.
FIGURE 10.28 Automatic MAG welding system.

192 Construction Technology of Lifeline Pipelines and Its Facilities
10.5 corrosion Protection of Gas Pipeline
Steel pipes have been used for the construction of gas pipelines mainly due to such reliability as strength and toughness, workability to manufacture, and the cost merits. And the necessity of ensur-ing pipeline integrity has strongly been focused in these years with increasing pipe diameter and operating pressure. Appropriate anticorrosion countermeasures shall be taken when the gas pipelines are constructed in the urbanized areas and the waterfront industrial areas where such burial condi-tions can be anticipated as the corrosive soils, the complex affective factors, and the increasing stray electric currents.
(h)
(b)
(i)
(e)
(l)
(f)
(m)
(g)
(n)
(c)
(j)Slag
(d)
Gas pore
Surface pore
(k)
(a)
FIGURE 10.29 Welding defects for pipelines: (a) crack, (b) incomplete penetration (1); (c) incomplete penetration (2); (d) incomplete penetration due to high–low; (e) root concavity; (f) excessive penetration; (g) burn through; (h) lack of fusion between weld bead and parent material; (i) lack of fusion due to cold lap between adjacent beads; (j) slag inclusion; (k) porosity; (l) incompletely filled groove; (m) overlap; and (n) undercut.

193Natural Gas Distribution System: Design Aspects
10.5.1 outline
10.5.1.1 corrosion
Corrosion of steel in the ground shall be defined as the phenomenon where a steel pipe is eroded electro-chemically. Steels are made from iron ore existing in the nature, and the resolved state of the ore shall be unstable to remain being steel and that tends to turn to be some sort of oxide rust by corrosion, which shall be stable as presented in Figure 10.30.
TABLE 10.7 Relationship between Welding Defects and Properties of Welded Joints
Defects
Properties of Welded Joints
Mechanical Environmental
Strength Ductility FatigueBrittle
Fracture Corrosion
Stress Corrosion Cracking
Fatigue with Corrosion
Dimensions Over Ο △ Ο ΟUnder Ο Ο Ο Ο Ο Ο Ο
Discontinuity of shape △ △ Ο Ο Ο Ο ΟSurface
defectsSurface pore △ △ △ △Undercut △ Ο △ Ο Ο ΟOverlap Ο Ο Ο ΟCrack Ο Ο Ο Ο Ο Ο Ο
Included defects
PorosityIsolated slag
inclusion△
Slag inclusion △ △ △ △Lack of fusion Ο Ο Ο Ο △ △ △Incomplete
penetrationΟ Ο Ο Ο △ △ △
Crack Ο Ο Ο Ο △ △ △
Ο, Related; △, partly related; blank, less related.
TABLE 10.8 Relationship between NDI Methods and Defect Types
Defect Types
NDI Methods
VT PT MT UT RT
Crack △a Οa Οa Ο △Incomplete penetration △b △b △b Ο ΟLack of fusion X — — Ο △Slag inclusion X — — △ ΟGas pore X — — △ ΟExternal undercut Ο — — — —Internal undercut △b X X △ ΟWelding appearance shape Ο — — — △
Source: Narita, K. and Fuji, T., Practical Welding for Piping and Pipeline, Sanpo Publishing, 1995.Ο, Fairly effective; △, poorly effective; X, not detected; —, not applicable.a Surface only.b Attached on surface.

194 Construction Technology of Lifeline Pipelines and Its Facilities
10.5.1.2 classification of corrosion
The corrosion that happens by an electrochemical action under the existence of water is called a wet corrosion, and the chemical corrosion that happens by contact with high-temperature gas in the water-less state is called a dry corrosion. The wet corrosion of a buried steel pipe is roughly divided into the spontaneous corrosion and the stray current corrosion. While the former can be generated in the pipe-line that is buried in the ordinary burial conditions, the latter can be induced by flow-out and flow-in of a stray electric current that comes from other sources. Classification of the corrosion is presented in Figure 10.31.
10.5.2 corrosion Protection by Pipe coating
The corrosion protection pipe coating with electric resistance properties shall prevent such electrolyte as soil and water from the pipe wall and protect pipe from flow-in and flow-out of corrosive currents and leakage currents.
10.5.2.1 Pipe coatings
Bituminous paint of coal tar enamel and asphalt has mainly been employed as coating materials of bur-ied pipelines. Table 10.9 presents the external coatings and their properties. Plastics like as polyethylene and similar materials have mainly been used for the coating of pipeline in recent years due to the excel-lent insulation capacity as presented in Figure 10.32.
Iron
Ener
gy
RefinementCorrosion
RustIron ore
FIGURE 10.30 Refinement and corrosion of iron. (From Matsushima, I., Rust and Corrosion Protection Revision 2, Nikkan Industrial Newspaper Company, 1987, p. 10.)
Corrosion
Dry corrosion
Wet corrosion
Free corrosion
Stray current corrosion
Macrogalvaniccell corrosion
Differential aeration
Dissimilar metal
Concrete/soilMicrogalvaniccell corrosion
Microbiological-influenced corrosion
DC stray current corrosion
AC stray current corrosion
FIGURE 10.31 Classification of corrosion.

195Natural Gas Distribution System: Design Aspects
10.5.3 cathodic Protection
Electric potential and pH of a neutral aqueous solution and iron in the ground are presented in Figure 10.33. The following measures are applicable to prevent the corrosion of steel in the corrosion zone A:
Method 1: Change the electric potential of iron to be negative.Method 2: Change the electric potential of iron to be positive.Method 3: Increase pH in the environment.
Methods 1 and 2 are called the electric anticorrosion measures; the former is the cathodic protection method, and the latter is the anodic protection method.
10.5.3.1 electric Anticorrosion Method
The electric anticorrosion methods are divided into four groups that are the sacrificial anode method, the external power source method, the polarized electric drainage method, and the forced drainage method.
Extrusion-type polyethylene
Polyethylene tape with primer
Fusion bond–type epoxy
Polyethylene tape with primer
Polyethylene tape without primer
Asphalt immersed vinylon cloth
Test period [month]1104
106
108
1010
5 10 50 100
Isol
atio
n re
sista
nce [
Ω/m
3 ]
FIGURE 10.32 Change of electrical isolation resistance of coating material with time. (From NKK Technical Notes, Cathodic Protection of Buried Piping and Pipelines, 1996, p. 21.)
TABLE 10.9 Kinds and Features of Buried Pipe Coating
Kinds Polyethylene (Extrusion)Vinyl Chloride (Heat Shrink) Asphalt Coal Tar Enamel
Material Substratum Polyethylene Polyvinyl chloride
Petroleum system asphalt
Coal tar pitch system
Primer Modified polyethylene (P1H)Synthetic rubber + asphalt (P2S)
Epoxy system resin
Asphalt Coal tar
Medicine-proof property ◎ ◎ Ο ΟWaterproof property ◎ ◎ △ ΟOil-proof property ◎ ◎ X XImpact-proof property ◎ △ Ο ΟAdhesive property Ο (with adhesive agent) Ο (with adhesive
agent)Ο (with primer) Ο (with primer)
Corrosion-proof property
◎ ◎ Ο
◎, Excellent; Ο, good; △, not good; X, bad.

196 Construction Technology of Lifeline Pipelines and Its Facilities
10.5.3.1.1 Sacrificial Anode MethodThe sacrificial anode method, the general concept of which is explained in Figure 10.34, may achieve the corrosion protection effects by attaching a piece of metal to the pipeline in order to form a galvanic cell where the potential of metal should be lower than that of line pipe steel.
10.5.3.1.2 External Power Source MethodThe external power source method illustrated in Figure 10.35 prevents corrosion of pipeline lowering the potential by the way of connecting a cathode of a direct current power supply to pipeline.
10.5.3.1.3 Selective Drainage MethodThe selective drainage method presented is an effective method to prevent corrosion especially under the effect of stray currents from electric rail loads by connecting a pipeline and a rail through a selective
With
resp
ect t
o hy
drog
en re
fere
nce e
lect
rode
Stable area of oxidation
Corrosion
Immunity
2
3A
1
0
–15
–1.0
–0.5
0
0.5
1.0
1.5
2 4 6pH
8 10 12 14
FIGURE 10.33 Relationship between iron potential and pH protection method. (From Tokyo Cathodic Protection Committee, New Edition of Guidelines of Cathodic Protection, 2004, p. 114.)
Terminal box GL
Terminal
Buried pipeAnode
Protective current
Backfill
FIGURE 10.34 Galvanic anode system. (From Tokyo Cathodic Protection Committee, New Edition of Guidelines of Cathodic Protection, 2004, p. 125.)
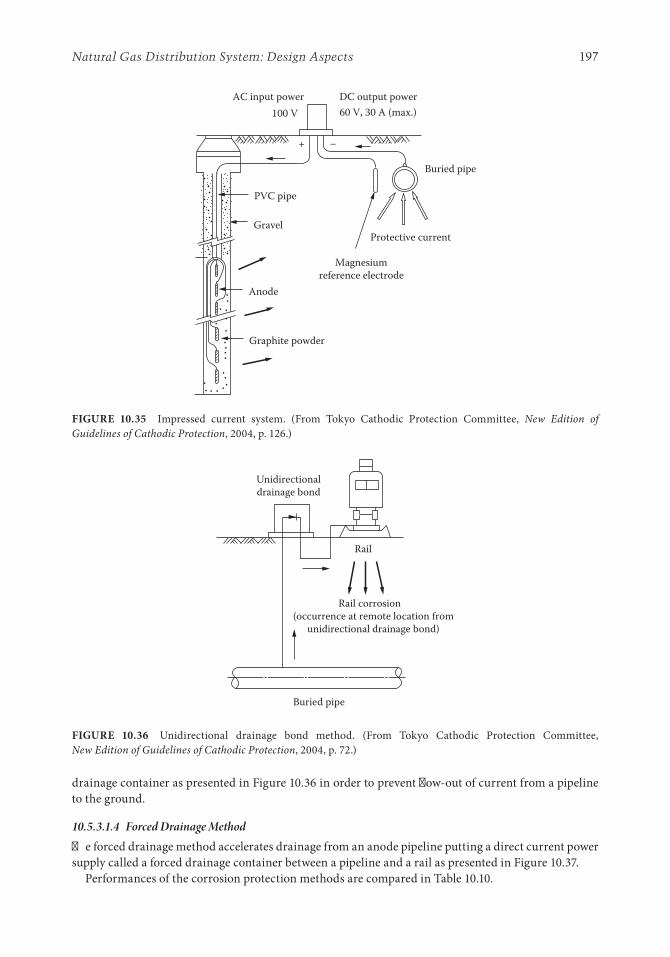
197Natural Gas Distribution System: Design Aspects
drainage container as presented in Figure 10.36 in order to prevent flow-out of current from a pipeline to the ground.
10.5.3.1.4 Forced Drainage MethodThe forced drainage method accelerates drainage from an anode pipeline putting a direct current power supply called a forced drainage container between a pipeline and a rail as presented in Figure 10.37.
Performances of the corrosion protection methods are compared in Table 10.10.
AC input power100 V
+ –
DC output power60 V, 30 A (max.)
Buried pipe
Protective current
Magnesiumreference electrode
PVC pipe
Gravel
Anode
Graphite powder
FIGURE 10.35 Impressed current system. (From Tokyo Cathodic Protection Committee, New Edition of Guidelines of Cathodic Protection, 2004, p. 126.)
Unidirectionaldrainage bond
Rail
Rail corrosion (occurrence at remote location from
unidirectional drainage bond)
Buried pipe
FIGURE 10.36 Unidirectional drainage bond method. (From Tokyo Cathodic Protection Committee, New Edition of Guidelines of Cathodic Protection, 2004, p. 72.)

198 Construction Technology of Lifeline Pipelines and Its Facilities
References
1. Nuclear and Industrial Safety Agency, Gas Safety Division. Examples of Interpretation on Technical Standard of Gas Facilities, Gyosei Corporation, Tokyo, Japan, 2009.
2. Japan Road Association. Draft Guidelines for Petroleum Pipelines, JRA Publishing, Tokyo, Japan, 1974.
Forced drainage bond
G.L
Alternate current(100 V or 200 V)
To rail
Rail corrosion
Buried pipe
FIGURE 10.37 Forced drainage bond method. (From Tokyo Cathodic Protection Committee, New Edition of Guidelines of Cathodic Protection, 2004, p. 72.)
TABLE 10.10 Comparison of Cathodic Protection System and Method
Methods
Items
Effective Limits Interference Initial Cost
Maintenance Fee
Power Supply
Adjustment of Power Remarks
Galvanic anode
Narrow No Cheap Cheap Unnecessary Difficult Powerless against stray current corrosion.
Impressed current
Wide Yes Expensive Expensive Necessary Easy Possible to protect object using low coating resistance or large areas to be protected.
Unidirectional drainage bond
Depending on the location
Yes Cheaper Cheaper Unnecessary Possible When rail potential is higher than buried pipe, this bond method is not working. It should be used with other cathodic protection system.
Forced drainage bond
Wide Yes More expensive
More expensive
Necessary Easy Take care of signal circuit of electric railway and corrosion of rail.
199Natural Gas Distribution System: Design Aspects
3. Japan Gas Association. Seismic Design Code for High Pressure Gas Pipelines, JRA Publishing, Tokyo, Japan, 2006.
4. Japan Gas Association. Seismic Design Code for High Pressure Gas Pipelines Considering Liquefaction-Induced Permanent Ground Deformation, JRA Publishing, Tokyo, Japan, 2001.
5. Japan Gas Association. Seismic Design Code for Middle and Low Pressure Lines, JRA Publishing, Tokyo, Japan, 1982.
6. Japan Gas Association. Code for High Pressure Gas Pipelines, JRA Publishing, Tokyo, Japan, 2006. 7. Japan Gas Association. Code for Branch Piping—Design, JRA Publishing, Tokyo, Japan, 1998. 8. ASME. Boiler & Pressure Vessel Code, Sec. III, ASME, New York, 1977. 9. Japan Gas Association. Seismic Design Guidelines for High Pressure Gas Pipelines Considering
Liquefaction-Induced Permanent Ground Deformation—Appendix, JRA Publishing, Tokyo, Japan, 2001, pp. 132–143.
10. Narita, K. and Fuji, T. Practical Welding for Piping and Pipeline, Sanpo Publishing, Tokyo, Japan, 1995.
11. Japan Industrial Standards. JIS Z 3001 Welding Terms Appendix, Japanese Standards Association, Tokyo, Japan, 1999.
12. Japan Society of Civil Engineers. Revised Version of Civil Engineering 96 Pipeline, Gihodo Publishing, Tokyo, Japan, 1991.
13. Matsushima, I. Rust and Corrosion Protection Revision 2, Nikkan Industrial Newspaper Company, Tokyo, Japan, 1987.
14. NKK Technical Notes. Cathodic Protection of Buried Piping and Pipelines, 1996. 15. Tokyo Cathodic Protection Committee. New Edition of Guidelines of Cathodic Protection, Tokyo
Cathodic Protection Committee Secretariat, Tokyo, Japan, 2004.


201
11.1 Design of overhead transmission Facilities
11.1.1 Route Selection
Selecting suitable routes is particularly important for the design of overhead transmission facilities, so as to minimize disruptions due to operations and environmental conditions. The following issues are generally considered for route selection:
1. Matching with future planning for transmission network, substation allocation, and power supply 2. Accommodation for local and environmental conditions 3. Consideration of severe meteorological conditions like strong wind, snowstorm, and lightning 4. Difficulties for site acquisition 5. Safety and ease of construction and maintenance works 6. Reduction of construction costs and site acquisition 7. Adaptation of existing facilities and relevant construction works
11.1.2 Design
Designing overhead transmission facilities includes the following items: (1) electrical conductor; (2) methods of insulating the conductor, such as insulators and porcelain bushings; (3) structures support-ing the conductor, such as transmission towers; (4) foundations of the towers. General descriptions for supporting structures and their foundation designs are given in the following sections. An aseismic design concept will be given later.
11.1.2.1 Supporting Unit Design
11.1.2.1.1 Transmission Tower ConfigurationThe configuration of the upper part of a transmission tower can be determined with respect to the isola-tion clearance between the current-carrying conductor and towers and the spacing between the power
11Electric Power System:
Design Aspects
11.1 Design of Overhead Transmission Facilities ................................201Route Selection • Design
11.2 Design of Underground Transmission Facilities .........................205Route Selection • Design
11.3 Seismic Design of Substation Equipment and Foundations ......208Seismic Design of Substation Equipment • Seismic Design of Foundations
References ......................................................................................................210
Keizo OhtomoCentral Research Institute of Electric Power Industry
Yoshiharu ShumutaCentral Research Institute of Electric Power Industry

202 Construction Technology of Lifeline Pipelines and Its Facilities
lines under their presumed galloping. The lower part of a transmission tower is represented by leg sepa-ration, which generally ranges from one-seventh to one-fourth of the total height of the tower depend-ing upon the horizontal deviation angles between the adjacent towers. That is, if the horizontal angle between suspended conductors on the two sides of a tower is zero (i.e., the line “goes straight through” at a “tangent” tower), then there is no lateral load on the tower due to the summed vector conductor ten-sions and the overturning moment on the tower is relatively small (however, there is still a lateral load due to wind). If the line turns at the tower (e.g., 90 degrees), then there is a large overturning moment on the “angle” tower, and for economy the tower legs will normally be further separated. Site restriction sometimes leads to a design with narrower leg clearance. Other aspects that determine the transmission tower shape are erection, maintenance, and construction. Figure 11.1 illustrates the general relation-ships between the carrying voltages and the height of steel towers.
11.1.2.1.2 Structural DesignSupporting units are designed based on the Technical Standards for Electrical Installations in Japan. The supporting units associated with ultrahigh-voltage (equal to or more than 275 kV) power transmission lines are also strengthened per JEC-127-1979 and design manuals prepared by utility companies.
The following conditions should be considered for the design of supporting units:
1. Maximum wind velocity in higher-temperature seasons, that is, during typhoons 2. Maximum wind velocity in lower-temperature seasons, that is, in an iced state 3. Under unusual accreted snows
In addition to these conditions, power line breakages should be applied under maximum wind speeds in summer as well as winter.
The design loads to meet the presumed conditions are described as follows:
1. Vertical loads: These are permanent loads (the weight of a supporting unit), ice and snow loads, and tension loads of power lines (vertical deviation load).
2. Horizontal loads in the transverse direction: These are wind pressure loads (tower body, power cables, insulators, and metal fittings) and tension loads of power lines (unbalanced tension forces, torsion force derived from unbalanced tension force).
3. Horizontal loads in the longitudinal direction: These are wind pressure loads (tower body), tension forces of power lines (unbalanced tension force and torsion force derived from unbalanced ten-sion force).
In addition, a strengthened design will be used to resist loads under the tower construction works and/or severe meteorological effects associated with the transmission line.
100 m
75 m
50 m
25 m
60 kV 150 kV 270 kV 500 kV 1000 kV
FIGURE 11.1 Relationship between height of a steel tower and carrying voltage.

203Electric Power System: Design Aspects
11.1.2.2 Design of transmission tower Foundation
Transmission tower foundations should be designed to satisfy the safety of the tower body, lightning of construction materials and hardwares, minimization of temporary workspace, and economical aspects by reducing the construction period.
11.1.2.2.1 Foundation Type SelectionThe most suitable foundations should be selected in accordance with soils, loads, construction works, and economical conditions that are imposed on the concerned sites. In general, an inverse T-type foun-dation, a caisson foundation, and a pile foundation should be selected in mountainous sites, while an inverse T-type foundation, a pile foundation, a mat foundation, and a rigid-frame foundation should be selected in flat sites. Figure 11.2 depicts typical steel tower foundations.
11.1.2.2.2 Design LoadsThe foundations of towers are normally subjected to loads through the main legs and diagonal bracing of the tower body. The compression, the uplift, and the lateral forces in both the transverse and longi-tudinal directions should be considered for design loads. The uplift force design loads of transmission tower foundations are among the larger uplift loads, compared with other civil engineering structures, and can be as much as 70%–80% of the compression force.
11.1.2.2.3 Stability AnalysisStability analysis of the foundation should be performed to check for possible failure by overturning, uprooting of stubs, sliding and tilting of foundations, etc. Safety factors that maintain stability should be employed as 2.0 for normal load conditions and 1.33 for unusual load conditions according to the Reading of Technical Standards for Electrical Installations. Specific design methods taking into account the bearing capacity to resist uplift forces have been developed, since the foundation of a transmission tower sustains relatively large uplift forces.
11.1.2.2.4 Structural AnalysisThe foundations of transmission towers consist of a foundation body and leg anchor units. Their struc-tural elements are independently designed based on Standard Specifications of Concrete Structures (Japan Society of Civil Engineers [JSCE]). Structural analyses for characteristics of the tower founda-tion such as the leg anchor have been conducted by engineers of utility companies, who have developed various ways of anchorage and design methods. Anchorage is usually determined based on foundation types. Representative anchorages are a holding anchorage and a bearing plate anchorage. The former is employed to anchor to a foundation footing, while the latter to a slender foundation.
11.1.2.3 earthquake-Resistant Design
In general, earthquake resistance of overhead transmission foundations is satisfied with the designed capacity against winds. Particular sites resting on grounds are, however, screened and designed for seismic loads, when topographical conditions are deemed vulnerable to seismic action. The concerned facilities are evaluated in view of liquefaction potential, slope stability, soil types, presumed earthquake intensity, topographical and ground structure conditions, structural characteristics of towers, and transmission route characteristics. Then, a preliminary determination is made regarding whether or not there is sufficient earthquake resistance for both tower body and foundation. Either static or dynamic seismic response analyses should be adopted when the concerned facilities are required to be designed for seismic force resistance.
The static seismic response analysis first estimates the magnitude of ground response accelera-tion based on the dynamic ground response analysis, which incorporates topographical and soil conditions. Second, the seismic forces (inertia force) based on the ground response are applied to

204 Construction Technology of Lifeline Pipelines and Its Facilities
(a)
Embe
dded
stee
l
Tow
er le
g
Embe
dded
stee
lan
chor
age
Dia
gona
l br
acer
Tower
Body
Foundation
Slab
(b)
Tower Foundation
Body Slab Anchor
(c)
Tower Foundation
Body Slab Pile
(d)
Tower Foundation
Body Slab
(f)
Tower Foundation
(e)
Embe
dded
stee
l
Tow
er le
g
Hol
low
if an
y
Tape
red
if an
y
Bear
ing
plat
e
Tower
Body
Foundation
Body
(g)Em
bedd
ed st
eel
anch
orag
e
Tower Foundation
Pile Slab
FIG
UR
E 11
.2
Type
s of f
ound
atio
n an
d em
bedd
ed st
eel:
(a) i
nver
se T
type
, (b)
anc
hor,
(c) p
ile fo
unda
tion,
(d) m
at, (
e) c
aiss
on, (
f) ri
gid
fram
e, a
nd (g
) sin
gle
pile
.

205Electric Power System: Design Aspects
the tower body. Third, reaction forces from the tower body are used as the design forces of the tower foundation. The resistance of the foundation is usually analyzed using a ground deformation method where seismic inertia force and ground displacement are applied to the foundation by tak-ing the deformation of the foundation into account (see Figure 11.3). The dynamic seismic response analysis is generally employed when detailed seismic performance is examined under specific con-siderations such as topography, soil and ground structural shape. The dynamic response analysis constructs a coupled structural model with the tower body, the foundation, and the soils, providing dynamic responses like accelerations, axial forces of the tower body, and effects of soil and founda-tion interaction (see Figure 11.4).
11.2 Design of Underground transmission Facilities
11.2.1 Route Selection
Securing underground transmission power line routes is a difficult task in modern urban areas since there are many restrictions on permissions for road excavation, increasing traffic, congestion of buried structures operated by other utilities in urban areas, and opposition acts of local residents against road construction works intended for environmental preservation. This situation is likely to intensify year by year. Thus, designing underground transmission facilities requires selection of the most effective route, facility installation, and spatial occupation and construction periods, paying attention to urban plan-ning, highway planning, and the movement of other utility plannings for underground spaces available in a long-term outlook. The following issues are generally considered for selecting the most preferred route:
1. Matching with future planning like transmission, substation allocations, and power supply 2. Coordination and effective use of existing conduits, utility tunnels, and multiple utility tunnels 3. Effective use of public as well as private lands 4. Accommodation for local requirements like coordination of relevant planning, cooperation with
local community, and legal restrictions for road and land uses 5. Assessment of hazards like flood and fire and establishment of disaster mitigation measures 6. Consideration of effects of multiple laying on transmission power capacity 7. Reduction of transmission power loss and maintenance costs 8. Reduction of construction works and land acquisition costs 9. Safety and readiness for construction and maintenance works
Inertia force Maximum relative displacement
depth
Horizontal subgradereaction coefficient
Structural analysis fordisplacement and member forces
kH:Seismic response analysis
kH
FIGURE 11.3 Illustration of ground deformation method.

206 Construction Technology of Lifeline Pipelines and Its Facilities
11.2.2 Design
11.2.2.1 Facility installations
Underground power line facilities can be installed in either a conduit or a utility tunnel. Selection poli-cies are as follows:
• A conduit shall be generally employed.• A conduit shall be diverted into multiple conduits when it is difficult to use a single conduit in the
same route due to transmission power capacity.• A utility tunnel shall be employed when it is difficult to employ diverted conduits or it is cheaper
to construct a tunnel. From the viewpoint of transmission power capacity, it is possible to install a maximum of 20 conduits along the same route.
11.2.2.2 conduit Design
A conduit shall be designed with the following viewpoints: (1) there should be enough section area to hold the required cables; (2) there should be minimal trouble in the maintenance works; (3) it should satisfy electrical requirements of cables like power voltage, transmission power capacity, laying and ten-sion forces; and (4) it should have a minimum effect on the ground surface due to subsidence, assumed traffic pattern, soil conditions, and overburden soil.
Added spring of cables (300 kN/m)
Added mass of cables (43,000 kg)
Tower: truss elementE = 2.1E+7 N/cm2
h = 2%
Energy-transmitting boundary9.51 m
50 m
104.
5 m
30 mRigid foundation
FIGURE 11.4 Example of a dynamic analysis model (coupled with steel tower–foundation–ground).
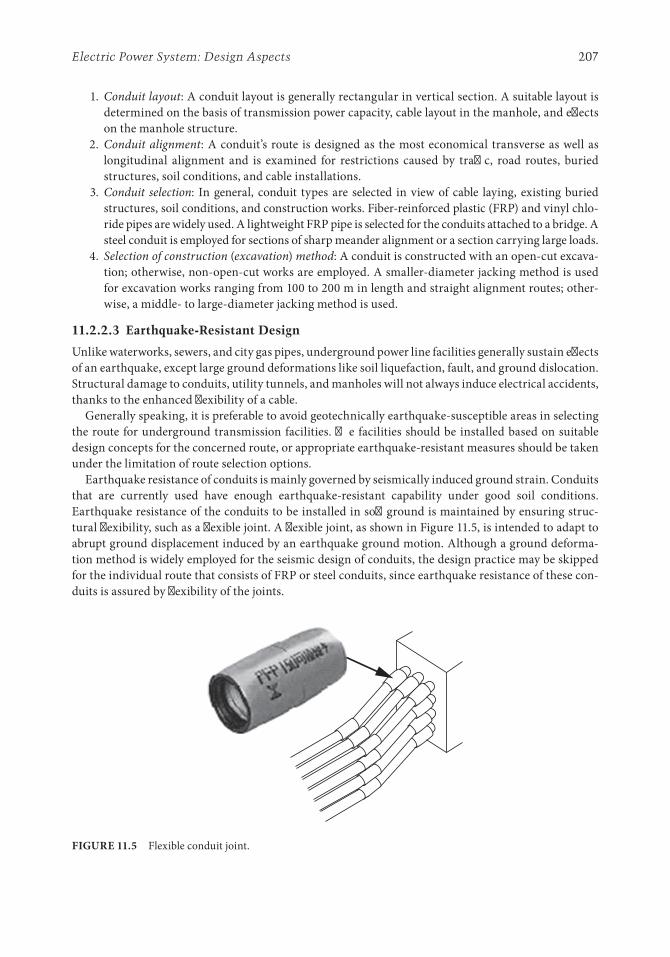
207Electric Power System: Design Aspects
1. Conduit layout: A conduit layout is generally rectangular in vertical section. A suitable layout is determined on the basis of transmission power capacity, cable layout in the manhole, and effects on the manhole structure.
2. Conduit alignment: A conduit’s route is designed as the most economical transverse as well as longitudinal alignment and is examined for restrictions caused by traffic, road routes, buried structures, soil conditions, and cable installations.
3. Conduit selection: In general, conduit types are selected in view of cable laying, existing buried structures, soil conditions, and construction works. Fiber-reinforced plastic (FRP) and vinyl chlo-ride pipes are widely used. A lightweight FRP pipe is selected for the conduits attached to a bridge. A steel conduit is employed for sections of sharp meander alignment or a section carrying large loads.
4. Selection of construction (excavation) method: A conduit is constructed with an open-cut excava-tion; otherwise, non-open-cut works are employed. A smaller-diameter jacking method is used for excavation works ranging from 100 to 200 m in length and straight alignment routes; other-wise, a middle- to large-diameter jacking method is used.
11.2.2.3 earthquake-Resistant Design
Unlike waterworks, sewers, and city gas pipes, underground power line facilities generally sustain effects of an earthquake, except large ground deformations like soil liquefaction, fault, and ground dislocation. Structural damage to conduits, utility tunnels, and manholes will not always induce electrical accidents, thanks to the enhanced flexibility of a cable.
Generally speaking, it is preferable to avoid geotechnically earthquake-susceptible areas in selecting the route for underground transmission facilities. The facilities should be installed based on suitable design concepts for the concerned route, or appropriate earthquake-resistant measures should be taken under the limitation of route selection options.
Earthquake resistance of conduits is mainly governed by seismically induced ground strain. Conduits that are currently used have enough earthquake-resistant capability under good soil conditions. Earthquake resistance of the conduits to be installed in soft ground is maintained by ensuring struc-tural flexibility, such as a flexible joint. A flexible joint, as shown in Figure 11.5, is intended to adapt to abrupt ground displacement induced by an earthquake ground motion. Although a ground deforma-tion method is widely employed for the seismic design of conduits, the design practice may be skipped for the individual route that consists of FRP or steel conduits, since earthquake resistance of these con-duits is assured by flexibility of the joints.
FIGURE 11.5 Flexible conduit joint.

208 Construction Technology of Lifeline Pipelines and Its Facilities
11.3 Seismic Design of Substation equipment and Foundations
11.3.1 Seismic Design of Substation equipment
11.3.1.1 Seismic Performance of Substation equipment
In Japan, dynamic design has been strongly recommended since the 1978 Miyagi-ken-oki earth-quake, which caused severe damage to substation equipment. As a result, the Guide for Seismic Design of Substation Equipment (JEAG 5003) was published in 1980 based on related research. The guide has been improved since the 1995 Hyogoken-Nanbu earthquake, and the revised version was published in 1998 [1]. On the other hand, in foreign countries, a similar design guide, IEEE 693, by the Institute of Electrical and Electronics Engineers was published in 1980 and revised versions were also published in 1997 and 2005. IEEE 693 covers all types of substation equipment. The basic ideas of JEAG 5003 associated with the design for the seismic force, the evaluation method of the seismic resistant capacity, and the seismic performance test methodology are completely different from those of IEEE 693. Furthermore, the seismic performance evaluation methods for substation equipment around the world were surveyed by the Electric Technology Research Association, and a report was published in 2008 [2].
11.3.1.2 target equipment of Seismic Design Guide, JeAG 5003
The seismic design guide, JEAG 5003, is applied to the main circuit apparatus and auxiliary equipment in the substations and other power facilities rated above 170 kV. Equipment rated lower than 170 kV is left out of the scope of this guide for the following reasons:
1. The impact of the loss of service is comparatively small, power can be supplied from the adjacent substations by simple switching operations, and the restoration time for the operation is short.
2. The equipment in those installations has a comparatively high mechanical strength in their structure.
11.3.1.3 Standard Seismic Design Force
The seismic force applied to the individual equipment and other fundamental factors in the standard seismic design are defined in this section. In this guide, the following seismic force is specified for stan-dard ground conditions:
1. Maximum horizontal acceleration, 3 m/s2
2. Predominant frequency range, 0.5–10 Hz
The standard ground condition indicates that the velocity of the shear wave (Vs) is higher than 150 m/s or Standard Penetration Test (SPT) N value of the soil is higher than 5. If the ground does not meet these conditions, a special design should be applied to each type of equipment.
The value of the maximum horizontal acceleration, 3 m/s2, is based on the Kawasumi map [1], accord-ing to which, a horizontal acceleration of 3 m/s2 on the ground surface in Japan is expected once in 75 years (return period of 75 years). The existing earthquake records (from 1921 to 1995) show that the estimated probability of seismic accelerations that exceed 3 m/s2 (≈0.3 g) is very small (1.06%–2.28%) in Japan. Accelerations of 0.3 g on the ground surface correspond to a seismic intensity of 6 on the JMA seismic intensity scale. According to existing seismic damage records in Japan, this intensity seems to be at a level that substation equipment can be expected to withstand without undergoing damage. From these records, the horizontal acceleration of 3 m/s2 on the ground surface is reasonable as a criterion in the seismic design for substation equipment.
This guide supposes that the vertical force does not usually need to be considered in the seismic design of standard substation equipment. However, for specific equipment such as a horizontal bushing, the vertical acceleration should be taken into account as one-half of the horizontal acceleration.

209Electric Power System: Design Aspects
11.3.1.4 Seismic Design Method
11.3.1.4.1 Outdoor Porcelain-Type EquipmentAn outdoor porcelain-type equipment includes switchgear, instrument transformer, and pot head for power cable to be installed outdoors. The equipment is to be designed to withstand the quasiresonant dynamic force specified in Figure 11.6. Specifically, the seismic force for the design is given as:
1. Acceleration: Horizontal acceleration, 3 m/s2
2. Wave form: Three cycles of resonant sinusoidal wave Note: When the natural frequency of the apparatus in question is lower than 0.5 Hz or higher than
10 Hz, the frequency of the applied wave is specified as 0.5 or 10 Hz, respectively. 3. Location of the force input: Lowest end of the supporting structure
11.3.1.4.2 Outdoor-Type TransformerAn outdoor-type transformer consists of the bushing, the main body, and the anchor bolt installed out-doors. The bushing is also designed by the quasiresonant dynamic force method as well as the outdoor porcelain-type equipment specifications. However, the horizontal acceleration is 5 m/s2. In setting this value of 5 m/s2, the amplification of acceleration at the center of gravity of the main body of the trans-former is considered. On the other hand, the main body and the anchor bolt are designed by the static design method under a horizontal acceleration of 5 m/s2.
11.3.1.4.3 Indoor Porcelain-Type EquipmentAn indoor porcelain-type equipment consists of the transformer, switchgear, instrument transformer, and pot head for the power cables to be installed within a building including the basement and rooftop. The design criteria and the seismic force in the design for the equipment installed on the basement or on the first floor are in accordance with those for the outdoor porcelain-type equipment. On the other hand, the equipments installed on the second or higher floors are designed individually considering the seismic response of the building.
11.3.1.4.4 Other EquipmentOther equipment includes the station power supply equipment, various types of switchboard, and com-pressed air supply units. The equipment is usually designed by a static design method. The static hori-zontal accelerations of 5, 15, and 5 m/s2 are applied, respectively, for the station power equipment other than internal combustion engine generators to be installed on the first floor or in the basement, switch-boards to be installed on the third floor or below, and compressed air supply units to be installed on the first floor or below.
11.3.1.4.5 Seismic Design for Nonstandard GroundThe seismic design of the equipment installed on nonstandard ground depends on the ground condition and equipment type. For the determination as to whether the standard ground condition is applicable
Equipment
Model
Mass 1
Mass 2
Input
Three cycles of resonant sinusoidalwave with an amplitude of 3 m/s2
FIGURE 11.6 Dynamic model based on a pseudoresonance method.

210 Construction Technology of Lifeline Pipelines and Its Facilities
or not, it is sufficient to confirm that the mean value of Vs is greater than 150 m/s in the ground at a depth approximately equal to the width of the foundation. The outdoor porcelain-type equipment, transformer bushing, and aluminum pipe bus bar are designed by a soil–foundation–equipment interaction model using two cycles of the resonant sinusoidal wave with the horizontal acceleration of 3 m/s2 or actual seismic wave records. The indoor-type equipment, on the other hand, is designed based on the seismic force of each floor evaluated by a building response analysis using actual seismic wave records.
11.3.2 Seismic Design of Foundations
Seismic damage of the foundation of substation equipment is typically caused by the liquefaction of the ground and the uneven displacement by the subsidence of the fill. However, because the seismic damage of the foundation is usually more negligible than that of equipment, it has been agreed that the current seismic design criteria for the foundation are appropriate so far.
However, considering recent seismic activity and the importance of substation equipment as a life-line, there is increased use of nonstandard ground conditions due to land use limitation, resulting in an increasing need for specific seismic foundation designs based on the soil–foundation–equipment interaction model. This section presents the basic idea of the standard and specific seismic designs of the foundation of substation equipment.
The foundation type for substation equipment is classified roughly into the spread foundation and the pile foundation. The spread foundation is applied on the condition that it can safely support the equipment against its superimposed load and the inertial force due to an earthquake without any subsidence, falling, or sliding. The pile foundation is applied on the soft ground under which a load-bearing layer is located in deep underground. When the depth of a soft ground layer is comparatively shallow, the ground improvement that replaces soft soil on the surface with a good quality soil may be carried out in order to apply the spread foundation. Note that when two or more equipments with different types of foundations are installed at the same site, such as piping or duct, which is installed between two equipments, the equipment and the building are exposed to a high risk of damage due to earthquake. Therefore, in such cases, specific seismic countermeasures should be employed to avoid any seismic damage.
The typical seismic damages of the foundation originate due to ground failure. Thus, a geotechni-cal survey including boring exploration is very important for the design of the foundation. Recently in Japan, a land condition map (classification map of geographical features) [3], earthquake acceleration map, and boring records have been made available to the public through government websites and each local municipality. This information is also useful for a foundation design in case the foundation design-ers, who cannot make detailed ground survey.
References
1. The Japan Electric Association. Guide for Seismic Design of Substation Equipment, JEAG 5003, 1998, 1998.2 (in Japanese).
2. Electric Technology Research Association. Internationalization of the Specification for Substation Equipment 63(4), 2008 (in Japanese).
3. Minatory of Land, Infrastructure, Transportation and Tourism. Hazard Map Portal Site (in Japanese), http://www1.gsi.go.jp/geowww/dispotal/index/html.

211
12.1 overview of telecommunications civil Facilities
12.1.1 Role and configuration of telecommunications civil Facilities
Buried Telecommunications facilities are an important social infrastructure that on which an advanced information society depends. As information and communication services become more diverse, these facilities are being constructed below roads and the like in the same way as other lifeline facilities such as electricity and gas are aimed at accommodating any type of service on a permanent basis.
12.1.1.1 Role of telecommunications civil Facilities
Telecommunications facilities occupy the most basic layer in the hierarchy of network structures that support the distribution of information as shown in Figure 12.1. They are required to be universal and unaffected by changes such as fluctuations in the demand for communications, the shift in demand from fixed phones to IP communications, or the migration from metallic cables to optical cables and are deliberately built to last a long time. The functions required for constructed or telecommunications civil facilities are as follows.
12.1.1.1.1 Safety and Long-Term DurabilityThey must not only be properly constructed and strong enough so as not to adversely affect the function-ing or stability of the roads or other facilities that they occupy but must also protect communication
12Telecommunication
System: Design Aspects
12.1 Overview of Telecommunications Civil Facilities .......................211Role and Configuration of Telecommunications Civil Facilities • Basic Planning of Telecommunications Civil Facilities
12.2 Communication Tunnels (Cable Tunnels)....................................219Planning of Cable Tunnels • Design of Cable Tunnels
12.3 Main Conduit Line ...........................................................................229Planning of Main Conduit Line • Conduit Design • Manhole Design • Conduit Construction • Manhole Construction
12.4 Buried Conduits ................................................................................243Overview of Buried Conduits • Design of Buried Conduits • Handhole Design
12.5 Special Facilities ................................................................................247Conduits Attached to Bridges • Private Bridges • High-Reliability Conduits • Shield Tunnel Interface Conduit
References ......................................................................................................257
Takanobu SuzukiToyo University
Fumihide SuginoNTT Access Network Service Systems Laboratories
Katsumi SakakiNTT Access Network Service Systems Laboratories

212 Construction Technology of Lifeline Pipelines and Its Facilities
cables from being damaged. Breaks in communication caused by damaged communication cables have a very major effect on social and economic activity. It is therefore necessary to implement cable pro-tection functions that are designed to cope with natural disasters and man-made accidents caused by roadworks or the like [4].
12.1.1.1.2 Ease of Installation and Maintenance of Communication CablesIn telecommunications civil facilities, new telecommunications cables are added when the demand arises, so it is important for them to be constructed with enough work space to facilitate cable instal-lation and maintenance work. With the deregulation of the telecommunications industry in 1985, sys-tems were set up for sharing telecommunications civil facilities between multiple telecommunications businesses, and functions were used to make it possible to adapt flexibly to the need for increasing and maintaining telecommunications cables.
12.1.1.1.3 Consideration of Local Residents and Global Environmental ProtectionIn the construction of telecommunications civil facilities, it is essential to consider the reduction of construction waste soil and other waste and the minimization of traffic congestion due to roadworks. An effective approach to these issues is to avoid installation work where possible by using existing public facilities and to promote joint (simultaneous) construction with other businesses. It is also effective to reduce the environmental impact by using nonexcavating methods that do not involve digging up roads.
12.1.1.2 configuration of telecommunications civil Facilities
Communication cables can be broadly divided into trunk cables, which connect between the build-ings of communications carriers, and subscriber cables, which connect between communication central offices and end users. Subscriber cables are divided into feeder cables, which connect from communi-cation central offices to a fixed number of user areas, and distributed cables, which incorporate addi-tional users. Of these, trunk cables and feeder cables are laid underground, while distributed cables are sometimes suspended from utility poles instead of being laid underground. Telecommunications civil facilities are facilities that accommodate and protect underground cables. These facilities come in three different types, accommodating different numbers of communication cables, namely, cable
Applicationcontent
IP
ATM
SDH
Information andcommunication platform
Wavelength
Optical fiberTelecommunications civil
facilities, buildings
Networklayer model
Geared toward providing an agile, flexible response to market trends
Structure is mostly unaffected bytrends in the upper layers
FIGURE 12.1 Hierarchical model of communication networks.

213Telecommunication System: Design Aspects
tunnel facilities, high-reliability conduit facilities, and conduit facilities. For river crossing sections, either bridge-attached facilities or private bridges for telecommunications are used.
Although the underground installation of distributed cables is more advanced in Europe and the United States than in Japan, it is being actively pursued in regional environmental facilities zones and in urban areas centered around Tokyo and now also in new town developments. The form of telecom-munications civil facilities is illustrated in Figure 12.2, and the number of facilities of each type operated by (Nippon Telegraph and Telephone Corporation [NTT]) is shown in Figure 12.3.
High-reliability conduits,240 km (combined length)
Conduits, 630,000 km(combined length)
(including buried conduits)
Buried conduits,40,000 km (combined length)
Cable tunnels,630 km
(tunnel length)Manholes and
handholes, 840,000
Conduits attached to bridges, 38,000 locations
Private bridges, 3,000 locations
FIGURE 12.3 NTT’s infrastructure equipment.
Cable tunnel
High-reliabilityconduit
Ordinary conduit
Buried conduits Development area Residential area
Industrial area
Loopconfiguration
Loopconfiguration
Peripheryof buildingAround building
commercial area
Feederroute
Interconnectionroutes
Essential routesfor network
configuration(aggregate routes)
FIGURE 12.2 The configuration of telecommunications civil facilities.

214 Construction Technology of Lifeline Pipelines and Its Facilities
12.1.1.2.1 Cable TunnelsA cable tunnel is a telecommunications facility that can accommodate a large quantity of underground cables. The tunnel diameter is from 2 to 5 m, which is wide enough for workers to get inside to perform installation and maintenance of communication cables. Sections where cable tunnels are used include sections extracted from facilities such as communication central offices, trunk route sections that will accommodate roughly 40 cables or more in the future, and sections where high reliability is required on special routes such as crossing rivers or railroads. A cable tunnel is a structure that has a high con-struction cost but is very robust against natural disasters. In places where it is difficult to add more conduits due to congestion of buried objects or where traffic conditions make it difficult to work from manholes in the road, a cable tunnel is a superior solution in terms of the speed at which the number of communication cables can be increased and the ease with which faults in these cables can be fixed. Cable tunnels are therefore one of the key public resources supporting information and communica-tion services.
Cable tunnels can be for single business use, or they can be operated jointly as authorized common conduits or as conduits that are shared with other utilities such as electric power companies. As shown in Figure 12.4, they are classified according to the methods used in their construction, such as the shield tunneling method (circular) and the open-cut construction method (rectangular).
12.1.1.2.2 High-Reliability ConduitsA high-reliability conduit is a conduit with a nominal diameter of approximately 250–500 mm, whose internal space is divided by pipes of smaller diameter called spacers, where communication cables are accommodated. Duct sleeves are used to attach these conduits to manholes. These sleeves are made using thin polyvinyl chloride pipe or the like since they must be able to expand and contract as an earthquake-proof measure. In 1994, the gaps between spacers would have been filled in, but in 1999, a free-space structure was adopted where these gaps were left empty instead. This resulted in the introduc-tion of free-space high-reliability conduit facilities, as shown in Figure 12.5, with greater flexibility with regard to the capacity of facilities.
(b)(a)
FIGURE 12.4 Cable tunnels made by the open-cut and shield tunneling methods: (a) open cut and (b) shield.

215Telecommunication System: Design Aspects
High-reliability conduits are designed with factors such as the importance of a route, its predicted demand fluctuations, the congestion status of buried objects, and the future construction environment situation taken into consideration and are evaluated in comparison with conduits and tunnels with regard to their economic benefits, including the cost of exclusive road use and the running costs such as maintenance costs. They are particularly advantageous when the number of cables is roughly in the range of 10–30. Construction by nonexcavating methods is also introduced because it suppresses the need for roadworks and avoids traffic congestion and because it addresses the environmental demand for a reduction in the dumping of waste.
12.1.1.2.3 Main Conduit LinesA main conduit line is a pipe with a nominal diameter of 75 mm in which multiple cables are laid and is buried at a depth of 1–2 m. This is the most common construction method. This type of conduit can be made of rigid polyvinyl chloride, steel, or cast iron. The choice of material to be used is made based on environmental factors at the burying location, such as the risk of liquefaction and the need for measures to avoid electromagnetic induction. Hitherto, it was common practice to accommodate a single com-munication cable inside each conduit with a nominal diameter of 75 mm, but more recently, a half duct system has also been used whereby two cables protected by flexible pipes are accommodated in a single conduit.
To provide space for work such as connecting communication cables and for the installation of connections and branching points, manholes are constructed at regular intervals from where it is possible for engineers to enter and carry out their work. These manholes can be built by on-site concrete casting or by assembling precast concrete blocks (made of reinforced concrete or resin concrete).
Middle part of conduitFixed duct part
FIGURE 12.5 Free-space high-reliability conduit.

216 Construction Technology of Lifeline Pipelines and Its Facilities
Furthermore, duct sleeves or insertion joints are used at the connections between manholes and con-duits or between adjacent conduit sections to allow for a fixed amount of expansion and contraction in the event of an earthquake.
12.1.1.2.4 Buried ConduitsA buried conduit is a conduit with a nominal diameter of 25 or 50 mm that accommodates one commu-nication cable per conduit. Since 1999, a free-access single-conduit system as shown in Figure 12.6 was introduced, whereby multiple communication cables are accommodated in a conduit with a nominal diameter of 150 mm. This made it possible to lay, branch, and extract distributed cables in response to the downsizing of facilities or the creation of new demand. For buried conduits, manholes are con-structed at regular intervals for the installation of cable branch points and connection points.
12.1.1.2.5 Other FacilitiesTelecommunications civil facilities that can accommodate communication cables include not only facilities provided independently by communications companies but also authorized common con-duits, communication cable box (CCBOX) facilities, and information box facilities. These public facili-ties offer a more economical way of installing telecommunications civil facilities while reducing the number of times roads have to be dug up. Authorized common conduits make up some of the internal sections of tunnels installed by road administrators based on Japanese laws regarding common-use cable tunnels. Authorized common conduits can provide the same level of reliability as cable tunnels, have the same functions, and make it possible to secure an exclusive space more economically than by constructing facilities independently and are therefore used for trunk communication routes, chiefly in urban areas.
CCBOXs have been in use since the third-stage cable burying plan based on the directives of the Japanese Ministry of Construction (as it was known at the time). They offer an effective way of perform-ing maintenance on buried conduits (burying overhead electric cables) in conjunction with conven-tional local government road administration systems. Information box facilities started to be installed as spaces to accommodate optical fibers for shared facility management based on the directives of the Ministry of Construction (as it was then known) according to a 1995 policy document on basic policies for high-speed communications companies, and in 2001, information boxes were released to telecom-munications companies and the like as part of the e-Japan focus plan. With regard to cable construc-tion, since these facilities can be used very cheaply by paying for the occupied space on a pro rata basis, it is expected that they will be effectively used as a means of securing trunk routes and the like in the future.
Branchpoint
Free-access conduit
Distributed cable Down-lead
FIGURE 12.6 Free-access buried conduit facility.

217Telecommunication System: Design Aspects
12.1.2 Basic Planning of telecommunications civil Facilities
12.1.2.1 evolution of Basic Plans and the Grand Design
The network that connects the communication central office and the users is called an access network. To expand the access network, Japan is split into several central office areas, with a communication central office situated in the center of each area. These central office areas are further subdivided into blocks called distribution areas of the access network, and each user belongs to one of these distribution areas. The feeder points and communication central offices at the center of these distribution areas of the access network are connected by underground cables, which are accommodated by telecommunica-tions civil facilities. Connections from the feeder cables to the users are primarily made via overhead cables suspended from a number of telegraph poles.
The size of underground cables (the number of copper wire pairs) is determined by the demand in the distribution area of the access network. Since the routes from each distribution area of the access network to the communication central office are bundled together, the cables that accommodate users are piled together in increasing numbers, and the number of ducts needed to accommodate these cables also becomes large. Therefore, the number of ducts must be set appropriately based on the predicted future demand in distribution areas of the access network. In the postwar expansion of telecommunica-tions facilities, metallic cables were laid down based on 5–10-year demand estimates in order to meet the explosive growth in demand for telephone services, whereas the number of additional conduits for telecommunications civil facilities was determined by extrapolating a fixed rate of growth in the num-ber of cables over 15 years. This method was an efficient approach in the days when it was not possible for construction work to keep up with demand.
However, in the current situation where communication services are becoming more advanced and more diverse, predictions based on older demand projection methods are unable to track the actual demand. This raises the risk of either having an insufficient number of conduits, necessitating repeated additional installation work, or installing too many routes, which is economically disadvantageous. Furthermore, in the modern era, as demand shifts from telephone services to nontelephone services and communication systems migrate from metallic cables to optical fibers, new methods for the design of facilities have been explored.
Therefore, as a rational approach to the design of telecommunications facilities, these facilities have been classified into several types, and planning proposals have been made based on the characteristics of each type. These are graduated according to the proportion of fixed costs in the construction of facilities for the provision of services and the time taken to complete the construction. Specifically, these are classified into service-related equipment such as the lines and facilities needed for individual communication services and users, basic equipment such as transmission conversion inside commu-nication centers and the cables and wireless facilities installed in electric power facilities and out-doors, and infrastructure equipment that takes a lot of time and money to build, such as buildings, underground structures, and steel towers (pylons) for wireless communication. For facilities that have large fixed costs and take a long time to build, it is more economical to build as much as possible in one go, so the increase in the quantity of facilities is determined based on how far the future demand can be estimated in a single construction project. Telecommunications civil facilities are classified as infrastructure equipment. The construction costs of these facilities include a high share of fixed costs such as the costs of earth moving and pavement construction. They can last for many years and usu-ally occupy spaces underneath roads and other such structures. This places restrictions on the times at which additional cables can be installed, so a particularly long-term vision is required at the construc-tion planning stage.
Currently, the planning of telecommunications civil facilities is being revised from a method where the required number of communication cables is estimated based on the number of cables currently required to a method based on urban planning, which considers all aspects of society. For the transi-tional period where metallic and optical cables are both used, a new planning method has been devised

218 Construction Technology of Lifeline Pipelines and Its Facilities
whereby the quantity of facilities is planned based on the assumption that all cables will eventually be upgraded to optical fibers. (The planning of telecommunications civil facilities based on this method is called the grand design [GD] [2].)
12.1.2.2 calculating the Required Quantity of Facilities
In the GD, the required quantity of telecommunications civil facilities in a region is reckoned from the future number of households and business premises in the region based on the division of land use for each purpose and on the ratio of building size to lot size. After allocating the number of optical fibers needed per business and per household, the total optical demand is calculated, and the number of ducts needed is calculated based on the maximum number of optical fibers in optical cables that are expected to be implemented in the future by extrapolating current research and development. For example, in a region designated as a commercial district by urban planners where the ratio of building size to lot size is at least 60%, the number of business premises is determined to be one per 175 m2 of floor space over the region’s total floor area. Here, the total floor area is obtained by multiplying the site area, floor area ratio, urban development rate, and effective floor area rate.
Similarly, taking as an example a region used for residential accommodation, the accommodation rate is determined as one household per 100–200 m2 of floor space. The urban development rate is a cor-rection value set by considering regional characteristics from the fact that the degree of development in the advancement of land use differs according to the region’s land usage conditions and the effective area of the site area and effective floor area rate are areas that exclude roads, rivers, parks, and public spaces within buildings (e.g., communal areas) from the total area.
The ultimate optical fiber demand is obtained by allocating a suitable number of optical fibers to the numbers of business premises and residential homes obtained in this way, and the required number of ducts is obtained from the maximum number of cores in optical fiber cables that are expected to be developed in the future.
12.1.2.3 Route Selection
Figure 12.7 shows a schematic illustration of the configuration of new telecommunications civil facili-ties in a central office area based on the GD. The route selection of telecommunications civil facilities should strive to make the conduit network as simple as possible, and in sections close to the communi-cation central office where multiple conduits are laid together, the facilities should be built to be highly reliable. The route construction method employs the following principles:
1. Extract optical fiber cables with as many optical fibers as possible from the communication cen-tral office without branching.
2. Aggregate the routes together, and prioritize them into trunk routes, branch lines, and feeder routes according to their importance.
Therefore, a number of conventional access network distribution areas are consolidated into a piping area over the range that can be accommodated by the optical fiber cables extracted from the communi-cation central office without branching, and the feeder points that can be reached by cables inside this piping area form pipe arrangement points. Centered on these pipe arrangement points, the routes are branched toward the feeder points of each distribution area of the access network, and these sections are called feeder routes.
On the other hand, as the routes from pipe arrangement points to the communication central office pass through an increased number of pipe arrangement points and their importance increases, they are divided into branch line routes and trunk routes. The facilities for trunk parts are then planned with variations introduced to take into account the fact that optical cables are accommodated in facilities such as cable tunnels and medium-size bored tunnels with a long usable lifetime and high resistance to earthquake.

219Telecommunication System: Design Aspects
This method based on a GD aims to create highly durable facilities by drawing up plans for tele-communications civil facilities with high fixed costs based on long-term predictions of the envisaged future development of cities, without becoming entrenched in short-term considerations of the balance between supply and demand, such as the current demand levels and communication services. In other words, since this method determines the future demand based on how many business premises and residential dwellings can be built in urban regions, it can provide telecommunications civil facilities based on a long-term perspective.
12.2 communication tunnels (cable tunnels)
12.2.1 Planning of cable tunnels
Cable tunnels are planned through a balanced process of study, planning, and construction, taking the following into consideration [1,3]:
1. Sections that are necessary for ensuring that the network operates reliably 2. Sections where it is better to use cable tunnels instead of conduits with regard to the facility costs 3. Participation in cooperative installation works with other public utilities and the design of com-
mon conduit facilities with road administrators with the aim of making better use of roads while ensuring the smooth flow of traffic
Above all, with regard to point (1), long-term plans have been drawn up for a cable tunnel network con-necting the main NTT offices in Osaka, Nagoya, and the central 23 wards of Tokyo, and the construction of this network has already begun. They are contributing to ensure that high reliability is maintained and communication services are rapidly restored when cables are affected by natural disasters such as earthquakes or by human activities such as construction work.
Since the construction of cable tunnels involves a great deal of investment in facilities and an adjust-ment period lasting several years, it is important to thoroughly investigate how to make the best invest-ment based on a long-term perspective.
Distribution area
Branch route
Feeder route Pipe arrangement pointDistribution area of access network
Feeder pointCommunication
central office
Trunk routeDistribution area of access network
FIGURE 12.7 Schematic view of conduit layout based on GD.

220 Construction Technology of Lifeline Pipelines and Its Facilities
12.2.2 Design of cable tunnels
The design of cable tunnels is performed by separating the task into a basic design and an implementa-tion design. Figure 12.8 illustrates the cable tunnel design procedure.
12.2.2.1 Basic Design
12.2.2.1.1 Gathering ResourcesWhen performing the basic design, it is necessary to gather the following resources and obtain a full understanding of factors such as the status of facilities and the planning and constraints of installations along the construction route:
1. General maps and subsoil maps 2. Infrastructure equipment and GD plans 3. Facility drawings 4. Future plans for facilities of each organization along the construction route
Finalize cable tunnel plan
Plan
ning
revi
ew
Basic
des
ign
Det
aile
d de
sign
Gather resources
Investigation
Survey
Investigate construction methods
Open cut
Determine internaldimensions
Investigation of alignment
Detailed design
Design of cable tunnelinternal facilities
Shield
Determine internaldimensions
Investigation ofalignment
Investigation of places wherevertical shafts are needed
Can land be securedfor a vertical shaft?
Choose the vertical shaft’sshape and dimensions
Choose the vertical shaftconstruction method
Detaileddesign
FIGURE 12.8 Cable tunnel design procedure.

221Telecommunication System: Design Aspects
12.2.2.1.2 InvestigationsVarious types of investigations are performed: site conditions, environmental protection, hindrance objects, land topography, and soil properties. The specific items and details of these investigations are in accordance with [5,6].
12.2.2.1.3 SurveysSurveys are conducted to ascertain the current conditions such as the land topography, the positions occupied by buried objects, and the cable tunnel alignment in order to determine the position of the cable tunnel and vertical shafts.
12.2.2.1.4 Construction MethodThe cable tunnel can be constructed by open-cut or nonexcavating methods. Cable tunnels are often constructed in urban areas, where the choice of construction method must take into consideration the harsh construction environment of recent years. When choosing the construction method, due con-sideration is given to factors such as road construction, road traffic conditions, and the situation of the surrounding environment, and the decision is made after a comprehensive investigation of factors such as ease of construction, economic performance, and whether or not there is a need for auxiliary construction methods. It is also necessary to bear in mind that it may be necessary to provide additional cable branch points after the cable tunnel has been constructed.
12.2.2.1.5 Determining the Cable Tunnel’s Internal DimensionsOnce a decision has been made between the open-cut method and shield tunneling method for the con-struction of a cable tunnel, the internal dimensions of the tunnel have to be decided upon. The internal dimensions of a cable tunnel are chosen to ensure that there is enough rack space for the cables to be laid in the tunnel, together with sufficient space for engineers to move around and perform installation and maintenance work and space for other utilities such as an electricity supply and ventilation. Cable tun-nels made by the open-cut method are configured from special sections that perform cable branching and the like, together with rectangular cross-sectional parts. Cable tunnels made by the shield tunnel-ing method are configured from vertical shafts that perform cable branching and the like, together with cylindrical tunnel sections. Open-cut cable tunnels and cable tunnels constructed by the shield method are both fully investigated with regard to the flow of cables that will be accommodated in the future (including branches), and parameters such as the cable capacity, maintenance space, and construction method are kept in mind when determining the cross section of the inner space.
12.2.2.1.6 Investigation of AlignmentThe alignment of a cable tunnel—both horizontal and vertical—should be thoroughly investigated as it depends on the choice of the construction method, the site conditions, hindrance objects, soil condi-tions, and the like. When investigating the horizontal alignment, full consideration is given to factors that affect the design and construction, such as the shape of the road and the existing buried objects. On the other hand, when investigating the vertical alignment, consideration is given to the longitu-dinal gradient of the road, buried objects, soil, earth covering, and the like, together with drainage, pedestrian access, ease of materials transportation, and the maintenance and management of shared facilities.
The longitudinal gradient of the cable tunnel is chosen to be at least 0.2% and <12.5%. Stepped struc-tures can be provided at special parts such as conduit attachments and branches when the longitudinal gradient is 12.5% or above.
12.2.2.1.7 Investigation of Places Where Vertical Shafts Are NeededVertical shafts are facilities that are provided for cable operations such as branching and splicing cables and are used for the departure and arrival of shield tunneling machines in cable tunnels constructed by

222 Construction Technology of Lifeline Pipelines and Its Facilities
the shield method. When securing a vertical shaft site, care is taken to ensure that its position and area do not obstruct the installation of the cable tunnel. The installation position of a vertical shaft is deter-mined by comprehensively taking account of economic factors and ease of construction. In making the decision, the following details are considered:
1. The attachment of cable tunnels and conduits must be simple, and cable operations must be per-formed smoothly.
2. Locations secured for vertical shafts must enable effective use of the cable tunnel’s basic facilities. 3. Sufficient land must be secured for use when constructing the vertical shaft. 4. The number of buried objects must be kept as small as possible. 5. The effect on adjacent structures and neighboring households must be kept as small as possible. 6. It must be easy to obtain the consent of authorities including the police and road administrators. 7. The effect on road traffic must be kept as small as possible. 8. For a cable tunnel constructed by the shield method, an installation site must be secured at a posi-
tion as close as possible to the starting vertical shaft.
12.2.2.1.8 Shape and DimensionsVertical shafts should have a standard rectangular or circular planar shape, which is chosen based on a comprehensive investigation of the attachment between the vertical shaft and cable tunnel, the occupied space, the cable operations to be performed, the construction methods, economic factors, and the like. The internal dimensions required for cable operations, the accommodation of facilities inside the cable tunnel, and work inside the cable tunnel are determined by considering the following:
1. Cable branching and splicing conditions 2. Number of cables 3. Size of vertical drop 4. Size of facilities to be accommodated inside the vertical shaft and the size of the space needed for
their operation 5. Size required for carrying out the work inside the vertical shaft (cable laying method, introduc-
tion of equipment and materials, allowing workers to enter/leave and go up and down)
12.2.2.1.9 Choosing a Vertical Shaft Construction MethodRetaining walls are essential in the construction of vertical shafts. Vertical shaft construction meth-ods can be divided into those with a caisson vertical shaft and underground connecting wall vertical shaft where the retaining structure doubles as the main vertical shaft (single wall, integral wall, stacked wall) and those where a temporary retaining structure is constructed and an ordinary vertical shaft and underground connecting wall where vertical shafts are built separately (temporary construction). When choosing a construction method, the aforementioned characteristics are fully evaluated, giving due consideration to the scale of excavation, the construction conditions, ground conditions, and envi-ronmental conditions.
12.2.2.1.10 Cable Tunnel Internal FacilitiesThe term cable tunnel internal facilities refers to the cable supports and any other facilities beside the main structure that ensure the safety of people working inside the tunnel. These are investigated in order to make effective use of the main body of the cable tunnel while constantly maintaining a favor-able environment and implementing safety measures. The point of this investigation is to configure the features such as cable supports, work spaces, and corridors so as to make effective use of the main body of the cable tunnel. Investigations are also performed with regard to other factors including ventilation, maintaining a favorable environment for the correct operation of electrical equipment, damp-proofing measures, coping with natural disasters, and providing various labels to ensure the safety of workers and facilities.

223Telecommunication System: Design Aspects
12.2.2.2 Detailed Design of open-cut tunnels
An open-cut tunnel is a tunnel made by the open-cut construction method whereby the road surface is excavated to insert a suitable retaining structure, after which the rectangular main body of the cable tunnel is constructed inside the excavated trench and then covered over. An overview of an open-cut tunnel is shown in Figure 12.9.
12.2.2.2.1 Design ProcedureFigure 12.10 shows the design procedure for an open-cut tunnel. Various types of investigation are performed—a study of the local land conditions, a study for environmental conservation, a study of hindrance objects, a terrain study, and a soil investigation. The details of these investigations conform to the document “Tunnel standard specification (open-cut construction, with commentary).”
12.2.2.2.2 AlignmentWhen building an open-cut tunnel, it should be made straight wherever possible, and if bends are neces-sary, they should have as large a radius of curvature as possible. When covering with earth, the instruc-tions of road administrators are adhered to, and decisions are made by considering factors such as the economics of construction and the safety of the facilities. The vertical alignment is chosen by consider-ing the longitudinal gradient of the road, buried objects, soil, the depth of earth covering, and so on, together with factors such as drainage, walkways, and ease of materials transportation. This method is selected when the longitudinal gradient of the road is at least 0.2% and <12.5%.
12.2.2.2.3 Selection of Construction MethodOpen-cut tunnels are classified into cast-in-place telecommunication tunnels and block cable tunnels according to the method used for the framework construction.
A cast-in-place telecommunication tunnel is one where the excavation work is completed, and then a framework is built by constructing a mold in situ, filling it with concrete, and then breaking up the mold.
A block cable tunnel is made from concrete box culverts approximately 2 m long (referred to as blocks in the following), which are mass produced and then transported to the construction site for assembly into a framework. For short cable tunnel sections, a thorough economic assessment is essential. Table 12.1 compares the characteristics of cast-in-place telecommunication tunnels and block cable tunnels.
Air vent
Manhole
Conduit
Conduitattachment part
Access hole Sewer pipe Access hole
Steppedpart
Open-cut cable tunnel
Drainage pit Branch part
On-
prem
ises
man
hole
FIGURE 12.9 Overview of an open-cut cable tunnel.

224 Construction Technology of Lifeline Pipelines and Its Facilities
12.2.2.2.4 Structural CalculationsThe construction budget calculations for open-cut tunnels conform to the document [5,6].
12.2.2.2.5 Additional FacilitiesDrainage facilities are designed so that normal flood water from outside can be properly discharged when it enters the open-cut cable tunnel. For facilities installed on public roads, road management con-straints and the safety of external installations are also taken into consideration.
Choice of cable tunnelconstruction method
Open-cut cable tunnel
Investigation
Choose alignment
Design of additional facilities
Alignment and in situ castingCable tunnel design
Block cabletunnel design
FIGURE 12.10 Open-cut tunnel design procedure.
TABLE 12.1 Comparison of Cast-in-Place and Block Cable Tunnel Construction Method
Item Cast-in-Place Telecommunication Tunnel Block Cable Tunnel
Alignment and special cross section
Structure can be adapted to work site conditions, even regarding curvature and special cross sections.
Applied to linear sections as a rule.
Quality Adequate construction management is required to ensure quality.
High quality achieved by factory production; adequate management of water blocking materials at joints is required.
Work environment Work such as formwork assembly and rebar assembly must be done in confined spaces.
Work is mechanized through the use of large cranes.
Construction period Tasks such as pile driving, excavation, and framework construction are performed in sequence, and each requires the corresponding number of days.
Framework can be produced in the factory while pile driving and excavation take place on site, so the construction period can be made shorter.

225Telecommunication System: Design Aspects
Ventilation facilities introduce air from outside the cable tunnel and expel the noxious gases pro-duced when work is carried out and are designed to maintain a favorable work environment and prevent equipment from rusting. Air vents are installed at one or both ends of each ventilated section, and when installed on a road, their positions should be determined based on a careful consideration of environ-mental conditions. In principle, ventilation towers are used with the air outlets positioned above the danger level of high tides or road surface flooding (at least 2.5 m aboveground level). Their structure is determined by considering factors such as the surrounding environment.
They are connected using flexible joints so as to prevent the effects of thermal expansion/contraction, uneven ground subsidence, earthquakes, or the like. Fire walls are installed to prevent the spread of fire into communication central offices in the event of a fire breaking out inside a cable tunnel, and bulk-heads are installed in regions where flooding is expected, for example, in low-lying areas. Access holes are designed by considering the amount of labor needed to lay and remove cables and the measures to be taken when workers need to escape from inside the tunnel in an emergency. A rectangular shape is used if the grade ring length exceeds 1.5 m and a circular shape otherwise.
12.2.2.3 Design and implementation of cable tunnels constructed by the Shield Method
A cable tunnel constructed by the shield method uses a strong steel pipe (called a shield) that is capable of adequately resisting the pressure of soil and water. This shield is propelled through the ground, and segments are assembled along the inside of the machine. Figure 12.11 shows an overview of a cable tun-nel constructed by the shield method.
12.2.2.3.1 Design ProcedureFigure 12.12 shows the design procedure for a cable tunnel constructed by the shield method. Various investigations must be performed, including a study of the local land conditions, an environmental con-servation study, a study of hindrance objects, a terrain study, and a ground investigation. The details of these investigations conform to the document “Tunnel standard specification (shield method construc-tion, with commentary).”
Open-cut cable tunnel
Communication central office
Verticalshaft
Manhole
Conduit
Branch pipeCable tunnel constructed by
the shield method
FIGURE 12.11 Overview of a cable tunnel constructed by the shield method.

226 Construction Technology of Lifeline Pipelines and Its Facilities
12.2.2.3.2 AlignmentThe horizontal alignment of a cable tunnel constructed by the shield method should be linear where possible, or very gently curved, taking into consideration factors that affect the ease of construc-tion, such as the site conditions, hindrance objects, and bedrock conditions. The minimum radius of curvature that can be excavated varies according to factors such as the bedrock conditions, the size of the excavation cross section, the length of the shield machine, the construction method, and the structure of the shield machine. Particular care must be taken when using a small radius of curvature. In using the shield method, an investigation of the construction method is required when there is a sharp bend in the route or a bend with an excessively small radius of curvature or when connections must be made in the middle of the tunnel. When a cable tunnel constructed by the shield method is installed in close proximity to other structures, care should be taken to ensure that they do not affect each other.
The vertical alignment is determined by considering the ease of construction and the maintenance and administration needs. Also, with regard to the longitudinal gradient of a cable tunnel constructed by the shield method, a minimum uphill gradient of approximately 0.2%–0.5% is required during construction, and the gradient should preferably be no more than 2% for the sake of safety and work efficiency.
12.2.2.3.3 Selection of Construction MethodWhen selecting a shield tunneling method, a method is chosen that matches the bedrock conditions, the duration of the construction work, and the tunnel alignment. It is important to be able to incorporate auxiliary construction methods where reasonable and to deploy construction facilities such as excava-tion plants that are suited to the excavation performance of the shield equipment.
12.2.2.3.4 Design of Primary CoatingThe structural calculations of a cable tunnel constructed by the shield method conform to the document “Tunnel standard specification (shield method construction, with commentary).” The cross-sectional
Choice of cable tunnelconstruction method
Cable tunnel constructed bythe shield method
Investigation
Choose alignment
Selection of shield construction inconsideration of PMF super
additive sludge material
Design of additional facilities
Design of secondary coating
Design of primary coating
FIGURE 12.12 Design procedure for a cable tunnel constructed by the shield method.
227Telecommunication System: Design Aspects
forces acting on segments are treated as a ring model with uniform bending stiffness. Other factors to be considered are as follows:
1. In the selection of segment materials, factors such as durability, economy, and ease of construc-tion should be investigated while bearing in mind the ground conditions and the cable tunnel’s cross section, alignment, and construction method, and the most suitable structure and materials (steel, concrete, etc.) should be chosen accordingly.
2. In the design of segments for the shield tunnel interface conduit (STIC, refer to Section 12.5.4) planning phase, the design should take the reinforcement of connecting parts into consideration.
3. When steel segments are used in places where there is pronounced corrosion, either a corrosion margin should be considered in the skin plate or suitable anticorrosion measures should be used.
4. Provision of air holes in the longitudinal ribs and main girders of steel segments. 5. Provision of seal grooves in the segment sidewalls to ensure they remain watertight. 6. Use of wedge-shaped segments as a basic approach for K segments of cable tunnels constructed by
the shield method with an earth-covering depth of 30 m or more. 7. Using anticorrosion and antirust measures where necessary when using steel segments without
secondary coating. 8. Performing preliminary studies of the installation of hardware facilities and accessory facilities
when using concrete segments without secondary coating.
12.2.2.3.5 Design of Secondary CoatingA secondary coating is provided when using the shield tunneling method. The purposes of a secondary coating are as follows:
1. Corrosion protection and waterproofing 2. Facilitating the attachment of facilities and other hardware 3. Reinforcement of segments 4. Correcting for meandering 5. Providing an improved surface finish
Water blocking panels are installed in the construction joints of the secondary coating concrete, and the concrete is laid to a fixed thickness. The materials used in these water blocking panels must be carefully considered, as they must exhibit their resistance to water leakage. When applying the secondary coat-ing, inserts for the fixing of metal reinforcements used for cable installation must also be embedded as a rule. At the joints between vertical shafts and cable tunnels constructed by the shield method and at points where the ground changes suddenly, earthquake resistance measures are taken such as inserting reinforced concrete inside the secondary coating.
12.2.2.3.6 Additional FacilitiesThe installation of additional facilities in a cable tunnel constructed by the shield method is performed based on the same considerations as for the open-cut method. However, compared with an open-cut tunnel, there are more constraints on the positioning of ventilation holes, access holes, and drainage holes, so a thorough investigation is needed.
12.2.2.4 Design of Vertical Shafts
Vertical shafts can be broadly divided into ordinary vertical shafts that are used to secure a supply of air necessary for work to be carried out inside cable tunnels constructed by the shield method and underground shafts that are used to secure a space where it is possible for work on cables and the joining of cable tunnels constructed by the shield method. An overview of vertical shafts is shown in Figure 12.13.

228 Construction Technology of Lifeline Pipelines and Its Facilities
12.2.2.4.1 Design of Ordinary Vertical Shafts (Pneumatic Caisson Shafts)The investigation of vertical shafts and their design criteria conforms to the document [5,6]. Various types of investigation are performed, including a study of the local land conditions, an environmental conservation study, a study of hindrance objects, a terrain study, and a ground investigation.
12.2.2.4.2 Underground ShaftsAn underground shaft is a structure installed when making an underground joint between the cable tunnels of two or more routes in cases where it is structurally impossible or economically disadvanta-geous to construct a vertical shaft from the road surface. The function of a vertical shaft is to provide a structure that secures the space needed for cable operations and the movement of workers inside the cable tunnel. Figure 12.14 shows an overview of an underground shaft. The factors to be considered when choosing the internal dimensions of an underground shaft are as follows.
As a rule, the dimensions should be sufficient for cable operations and for workers inside the cable tunnel, but the decision is made after thoroughly considering the balance with connecting cable tunnels.
In addition to the dimensions required when completed, the dimensions required during construc-tion should also be considered.
12.2.2.4.3 Choosing the Construction MethodThe optimal construction method is selected after thoroughly considering the cable tunnel cross sec-tion, the scale of the underground shaft, and the soil conditions and after performing a comparative investigation of factors including safety, economy, and the stages of construction.
12.2.2.4.4 Structural CalculationsStructural calculations for underground shafts shall be performed in the same way as for vertical shafts, but since the construction procedure requires that the cable tunnel openings are available in advance, the design is made by thoroughly considering their construction methods and reinforcement methods. For the cable tunnel apertures, the following are considered:
Air exhaust
Ventilationfacilities
Vertical cablesupportinghardware
Cable
Metalreinforcements
Workplatform
StaircasePower distribution
equipment
Drainage pit
Access hole
FIGURE 12.13 Overview of a vertical shaft.

229Telecommunication System: Design Aspects
1. Full consideration of supporting structures when excavating the lower sections for the under-ground shaft structure.
2. When a detailed review of the stress states that involves cutting a segment is performed and the stress intensity is found to be insufficient, reinforcement members are arranged at positions where they do not obstruct the cross section of the interior space required during construction and after completion in each case.
3. The reinforcement of parts where support is provided is considered with regard to factors such as structural stability, securing sufficient work space, and distributing the reaction forces at support-ing points.
4. When the reaction forces at supporting points are applied to piles, every effort is made to distrib-ute the applied load and achieve an arrangement that avoids imbalanced loading.
12.3 Main conduit Line
12.3.1 Planning of Main conduit Line
When a new increase in telecommunications civil facilities becomes necessary (e.g., due to the emer-gence of new demand), it is necessary to plan how these new facilities will actually be constructed. During this planning and design process, it is essential to conduct a comprehensive investigation of the following with reference to the GD, which is the medium-to-long-term master plan including estima-tions of potential future demand:
1. Clarifying the form of facilities and their required qualities such as reliability 2. Ascertaining emerging demand, estimating potential demand, and determining the cable
capacity
(a) (b)
(c)
FIGURE 12.14 Overview of underground shafts: (a) T-intersection vertical shaft, (b) cross intersection vertical shaft, and (c) parallel vertical shaft.

230 Construction Technology of Lifeline Pipelines and Its Facilities
3. Cost comparison of each type of equipment, evaluation of design time, and cost–benefit performance
4. Assessment of the impact on the urban environment, road traffic, and road structure 5. Ease of cable laying, safety of facility maintenance, etc.
12.3.1.1 importance of Basic negotiation
When telecommunications civil facilities have to be installed due to new demand or the movement of obstructions by public engineering works, the current situation must be studied and the scale of the required installation must be judged straight away. Almost all telecommunications civil facilities are objects that make exclusive use of roads, so it is essential to accommodate the needs of road adminis-trators, traffic managers (local police), and other business-related entities, and basic negotiations are essential for ensuring that the work proceeds smoothly.
In the specific installation plans, the road structure, pavement condition, the presence of urban plans, and the like are first checked based on the GD of the section in question. Then the current state of the existing facilities and the buried objects of other businesses are ascertained, and the projected area of the installation, the demand fluctuations on the route to the installation, and the effects of the installation work on the surrounding area are studied. Based on these studies, basic negotiations are held with other public organizations regarding the state of the facilities, the con-struction methods, the construction period, and so on. Recently, active efforts have been made to reduce the disruption of roadside households and traffic by installations, and a positive effort has been made in basic negotiations to promote joint construction projects, which have the benefit of lower construction costs.
12.3.1.2 Ascertaining the current Status of existing Facilities and the Buried objects of other companies
When there are existing telecommunications civil facilities in a particular section, records of the installed facilities are studied to ascertain the shape of these facilities, their degree of obsolescence, their cable service condition, and so on. The possibility of avoiding installation work by multicable laying, rerouting, or winding up cables to change or assimilate routes is also studied, and equipment that needs to be upgraded when performing this installation work is also identified. Furthermore, the positions and installation plans of buried objects belonging to other businesses at the location in question are also ascertained from the records kept by road administrators and the facility records of each business, and for ducts and the like of unknown jurisdiction, the state of the planned installation location is reliably confirmed by performing trial excavations and the like and by using buried object detectors such as ground-penetrating radar.
12.3.1.3 Studying the Planned installation Region and Demand Fluctuations along Local Routes
Access facilities are generally provided in management units such as the distribution areas of the access network. In the planning of an individual installation, a demand fluctuation study is performed for the corresponding distribution area of the access network or its local routes. Recently, there have been many cases where a main conduit line had to be installed, including the provision of supplies to redevelopment areas, upgrading of poor conduit lines, and the movement of obstacles associated with installations performed by road administrators and other businesses.
12.3.1.4 Studying the environment Surrounding an installation
Since almost all telecommunications civil facilities are installed in roads, the effects of installations on traffic and roadside residents often give cause for complaint. A study of the environment along-side roads is generally performed before construction commences. In particular, when installing cable tunnels and other large-scale structures, the local conditions must be fully studied from the

231Telecommunication System: Design Aspects
planning stage and reflected in the designs of telecommunications civil facilities. Checks are also made to see if the area in question is affected by any urban development plans, town planning, or road construction plans, whether the road pavement is due to be replaced, whether or not there are any excavation restrictions, and so on, and by investigating the occupied position and mode of installation and the possibility of installations competing with other public utilities, a basic understanding of the construction methods and construction period is gained from road administrators and, if necessary, traffic managers.
12.3.1.5 Determining the Scale of construction
The basic construction route and the target section are decided based on the status of existing facilities, the status of demand fluctuations, and the outcome of basic negotiations with related entities. The target section is generally restricted to the minimum scale necessary for maintaining services in response to the demand for information and communication within the lead time period, but there may be cases involving joint construction with other businesses or extensions of the installation section based on relationships such as the scale of pavement excavation, in which case a cost–benefit analysis is per-formed based on facility investment evaluation methods and the like.
12.3.1.6 intercompany Adjustment of installations that Make exclusive Use of Roads
Installations of telecommunications civil facilities almost always make exclusive use of roads, so the constructors must obtain permission for making exclusive use of roads based on Japan’s road law, as well as road use permission based on Japan’s road traffic law. Roads are not only used for the installation of telecommunications civil facilities but also for the installation of utilities such as electricity, gas, water, and drainage by other companies as well as by road surfacing contractors. To minimize the disruption of people living alongside the roads and prevent repeated roadworks caused by public utilities, the road administrators of national and prefectural highways and major towns and villages hold a coordinating council on the exclusive use of roads (road use coordinating council), which is required to coordinate the work of different businesses while at the planning stage so that joint construction can be performed if necessary in the same excavated trench.
The coordination methods used at the road use coordinating council can differ between road admin-istrators and regions but include an annual coordination council dealing with relatively large-scale planned installations and a monthly coordination council that deals with supply installations and the like on a smaller scale. In particular, for installations such as authorized common conduits and route maintenance where there is competition between companies, the duration and other details of instal-lations carried out by each company are specified by plotting each company’s installation section and construction period together on a diagram.
12.3.2 conduit Design
Telecommunications civil facilities secure a stable space where underground cables can be laid quickly and protect the cables from the effects of work by other companies, earthquakes, and the like. Therefore, to design telecommunications civil facilities, it is necessary to have an understanding of a wide range of technologies, including not only civil engineering but also telecommunications (especially cable con-struction technology) and the technology of facilities buried in the same road by other companies. The form of telecommunications civil facilities can be broadly divided into ordinary conduit systems, high-reliability conduit systems, and cable tunnel systems. The choice is mainly determined by the facility’s capacity, reliability, and economy.
12.3.2.1 Design overview
A conduit is a protective pipeline that accommodates cables connecting between manholes, handholes, cable tunnels, lead-up poles, and the like. It allows underground cables to be inserted and removed

232 Construction Technology of Lifeline Pipelines and Its Facilities
without the need for excavation. The reasons for adopting a conduit system with an underground line instead of an overhead line for the cable route are as follows:
1. Sections where there are physical limitations on aerial structures and sections where a cable’s self-weight or wind loading exceeds the maximum permissible loading of aerial structures
2. Sections where priority is given to economy and ease of maintenance and sections where a maintenance-free solution is more economical, such as in areas prone to the occurrence of typhoons or heavy snowfall
3. Sections where reliability of the network is of overriding importance, sections of high importance such as repeated transmission routes, and feeder cable sections where there are multiple converg-ing lines
4. Sections where the surrounding environment is taken into consideration and sections where the installation of aerial cables is undesirable, such as parks or narrow busy roads
In general, sections of types (1) and (3) are designed as main conduit lines, and those of types (2) and (4) are designed as buried conduits.
12.3.2.2 conduit configuration
A conduit is an assembly of standardized components and consists of a conduit main body, joints, and a duct sleeve as shown in Figure 12.15. Depending on the choice of materials, the conduit main body can consist of a rigid polyvinyl chloride pipe, a steel pipe, or a cast iron pipe. Some have joints at the ends of the pipe; others do not. The standard length is 5.5 m for rigid polyvinyl chloride pipes and steel pipes and 4 m for cast iron pipes.
Various types of joint are possible, including insertion joints, expansion joints, and secession pre-vention joints. Insertion joints have the ability to maintain an airtight seal and are used for ordi-nary connections. Expansion joints have better expansion and contraction capabilities, and insertion joints are used in sections where it is not possible to accommodate shifts in position due to expansion and contraction caused by earthquakes or changes in temperature. Secession prevention joints are expansion joints that also have the ability to prevent disengagement and are used in sections where large displacements are expected to occur in the conduit due to earthquakes and the like. A duct sleeve is installed at the conduit attachment part of a manhole or the like and is used for the inser-tion and attachment of the main body of the conduit. It provides a joint that is both airtight and expandable.
Joint
Conduit main body
Joint
Duct sleeve
Manhole
Duct
FIGURE 12.15 Example of conduit configuration.

233Telecommunication System: Design Aspects
12.3.2.3 calculating the number of Ducts
For a new installation, the number of spare conduits for replacement cables (1, 2, or 3 cables for conduits with 1–15, 16–30, or 31–45 cables, respectively) is added to the number of cables that can be accommo-dated, assuming a rate of one cable per conduit.
When laying optical cables along an existing conduit route, multiple optical cables are laid by adding one or two cable protection flexible tubes in order to eliminate the need for installing a new conduit. In cases where the number of existing conduit routes is insufficient even with multicable laying, additional conduits are planned.
12.3.2.4 Selection of conduit type
The type of conduit is selected according to various factors: the ease with which cables can be laid, the terrain along the route of the conduit, the soil conditions, buried objects along the route, induction from electrified railroads/power lines, surface loading, the conduit’s physical/chemical properties, and economic factors. Rigid polyvinyl chloride pipes developed for communication applications are used as standard, but metallic pipes can be used when extra strength is needed (e.g., for deep burial), when the pipe is subjected to geothermal heat near hot springs or the like, or when it is necessary to take measures against electromagnetic induction, for example, near railroads. The physical properties and other attri-butes of each type of pipe are shown in Table 12.2.
The pipe diameter is selected by considering factors such as the type of cable, its maximum diameter, the ease with which cables can be laid inside the pipe, and economic factors. For main conduit lines and lifting conduit lines, a pipe with a nominal diameter of 75 mm is used as standard. The wall thickness of the pipe is determined by considering factors such as the pipe’s long-term corrosion and deformation under external forces. For a nominal diameter of 75 mm, it should be 6.5 mm for rigid polyvinyl chlo-ride pipes, 4.2 mm for coated steel pipes, and 5.2 mm for cast iron pipes.
In buried conduits, the standard approach is to use a nominal diameter of 50 mm with one cable per pipe, and pipes with a nominal diameter of 75 mm have also come into use. Recently, nominal diameters of 75 and 150 mm have been used to facilitate multicable laying.
12.3.2.5 conduit Alignment
The alignment of a conduit is preferably linear to facilitate cable laying, both for horizontal and vertical alignments, but it may be impossible to avoid curvature depending on the shape of the road, the posi-tioning of other buried objects, and the like. In such cases, a curve is provided within the permissible range of the radius of curvature based on the cable’s traction force, bending characteristics, and the like. For a main conduit line, the standard bending radius is at least 10 m, and if there is no alternative, then the acceptable limit is 2.5 m. For the vertical alignment, except in sections where measures are taken to prevent freezing, a linear shape with permissible sagging is applied, and all the conduits within a span
TABLE 12.2 Materials and Standard of Pipes
Properties Units Rigid Polyvinyl Chloride Pipe Steel Pipe Cast Iron Pipe
Material Vinyl chloride pipe Steel Cast ironSpecific gravity 1.38 7.35 7.15Elastic Limit MPa 49.0 and more 294.2 and more 392.3 and moreUltimate strain % 100–150 30 and more 3–10Elastic modulus MPa 2.3–3.1 × 10³ 2.1 × 10⁵ 1.6 × 10⁵
Service temperature limit °C 65 None NoneCoefficient of linear expansion 1/°C 8 × 10⁻⁵ 1.1 × 10⁻⁵ 1.1 × 10⁻⁵
Thermal stress kN 1.96–3.69 25.79Coefficient of friction 0.21–0.32 0.21–0.41 0.48–0.72

234 Construction Technology of Lifeline Pipelines and Its Facilities
are attached by insertion joints. A duct water stop valve is installed at the duct exit from the conduit to prevent the inflow of underground water, earth, and sand.
According to directives from bodies such as the Ministry of Land, Infrastructure, Transport, and Tourism, the depth of earth covering a conduit underneath a road should be no <0.3 m plus the pave-ment thickness (the distance from the road surface to the bottom surface of the roadbed) or no <0.6 m if the pavement thickness is <0.6 m. For sidewalks, the design must ensure a minimum earth covering of 0.5 m while taking into consideration the safety of pavement installations and facilities for installa-tions by other businesses and must be designed so as to achieve an optimal covering depth, considering economic factors.
In cases where there is no possible way of achieving the required earth covering due to the position-ing of other buried objects, for example, a conduit protection rack made of plastic recycled from scrap conduit sheaths (or concrete, in case such protection rack cannot be used) and a conduit protector made by combining steel plate and ceramic plate may be used to prevent damage to the conduit by road exca-vation or pavement cutting, depending on the earth covering and pavement thickness, and only after obtaining the road administrator’s permission as shown in Figure 12.16.
12.3.2.6 Span Length
The distance between the centers of two manhole covers connected by a conduit is called the span length. The span length is determined by taking into consideration the cable branching points, the work involved in laying the cable, the cable piece length, and the ease of maintenance and varies depending on factors such as the class of conduit facility (main conduit line), the alignment (intersecting angle, radius of curvature), and the type of cable accommodated inside the conduit.
12.3.2.6.1 Metallic CableFor a conduit accommodating a metallic cable either on its own or together with an optical cable, the span length should be limited to 250 m if the intersecting angles of the horizontal and longitudinal
Steel plate protection + ceramic board protection
Steel plate protection
Conduit protection rack
Surface
Conduit protection rack
Rigid vinyl pipe
Range at risk of damage by backhoe diggers
Range at risk of exposure by road stripping
Range at rick of damage by pneumatic drill
Range at risk of breakage by pavement cutter and damage by pneumatic drill
FIGURE 12.16 Example of cable protection measures and positioning.

235Telecommunication System: Design Aspects
sections sum to 60° or less (for linear sections and sections with a radius of curvature of at least 10 m). When a span includes a curve with a radius of curvature of <10 m, the tension applied when laying the cable is verified and, if necessary, the line shape or span length is modified.
12.3.2.6.2 Optical CableThe span length of sections where only optical cables are accommodated is limited to 500 m where the radius of curvature is 10 m or more and may be appropriately reduced after verifying the cable tension. When a span includes a curve with a radius of curvature of <10 m, the span length shall be limited to 150 m.
12.3.2.7 natural Disaster Measures
Natural phenomena such as earthquakes and heavy rain can cause damage to telecommunications civil facilities as a result of embankment collapse, landslides, ground subsidence, ground liquefaction, flood-ing, sediment runoff, and so on. Natural disaster measures should therefore be considered when tele-communications civil facilities occupy embankment or ground that is liable to undergo liquefaction.
12.3.2.7.1 EmbankmentThe occupied positions of embankment shall basically be positions where there is little danger of embankment collapse. Also, when using metallic pipes (coated steel pipes or cast iron pipes), one seces-sion prevention joint is placed every 11 m or less for coated steel pipes or every 16 m or less for cast iron pipes. At the manholes, approximately 2 m of protection concrete is used.
12.3.2.7.2 Liquefiable GroundWhen a conduit occupies ground that is expected to undergo liquefaction during an earthquake, metal-lic pipes (coated steel pipes or cast iron pipes) are used, and secession prevention joints are installed at the manhole’s primary connection points. Also, when the span length of a coated steel pipe exceeds 250 m, secession prevention joints are installed after a span of up to 286 m and at every 36 m thereafter. When the span length of a cast iron pipe exceeds 250 m, a secession prevention joint is installed after a span of up to 292 m and at every 42 m thereafter. Manholes are made of cement and concrete and have gravel drains formed around them.
12.3.2.7.3 Poor SubsoilPoor subsoil is generally found in places such as riversides, deltas, back marshes, marshland, or lake traces where the ground consists mostly of new alluvial deposits or ground in low-lying areas such as reclaimed land. It consists of components such as clay, silty clay, and sandy silt peat with an SPT N value of 0–4 for viscosity ground or 0–10 for sandy soil.
When crossing over structures in regions with poor subsoil and when the ground suddenly changes from a region of poor subsoil, cables are laid in a single metallic pipe or rigid polyvinyl chloride pipe, and in the case of a metallic pipe, secession prevention joints are used. In the case of a rigid polyvinyl chloride pipe, insertion joints and rigid polyvinyl chloride pipes are used in lengths shortened to 2.75 m.
12.3.2.8 Design Drawings
12.3.2.8.1 Design Drawing Preparation and CAD SystemsThe design drawings show information such as the shape, structure, dimensions, and occupied posi-tion of the objects to be installed and form part of the contract documents for a contracted installation, including the stages of work required for installation, the calculation of material requirements, and requests for occupancy permits. When the installation has been complete, they are used as reference material for facility management, resource management, and the like. The drawings must therefore be of sufficient scale so as not to hinder the installation or management of facilities. In cases where there are facility records for a particular section, these should be used wherever possible, and when creating

236 Construction Technology of Lifeline Pipelines and Its Facilities
new drawings, they should be created in facility management units that make it easy for facility draw-ings to be stored and replaced. Drawings should be prepared from electronic data such as records of existing facility records or records of buried objects and should be produced as design drawings using a CAD system. Also, for contracted installations, drawings such as a guide map, outline view, plan view, cross-sectional view, development view, and special design diagram are prepared as reference material for the installation specification document and are used to calculate the process quantities, materials requirements, and so on as shown in Figure 12.17.
12.3.2.8.2 Conduit Design DiagramPlan views are normally prepared at a scale of 1:500 with symbols to show the telecommunications civil facilities such as conduits and manholes. Text annotations are added to convey necessary information
(b)
Preparation of blueprintsRoad record
books
Preparation ofnew drawings
Scanning
Drawing management system
Plotter(drawing output)
Blueprints Facility drawings
(a)
FIGURE 12.17 Example of design by CAD system: (a) Example of design by CAD system and (b) screen shot of CAD interface and drawing.

237Telecommunication System: Design Aspects
such as the conduit type, nominal diameter, number of ducts, and manhole shape and capacity. Where a CAD system has been introduced, these may in some cases be represented by their actual forms instead of text annotations.
Longitudinal sections are produced to show a conduit’s vertical alignment using a vertical scale 10 times larger than the horizontal scale so as to clearly show the gradient of the conduit. They also show the ground height, invert elevation, earth depth, and other measurements at regularly spaced measure-ment points and at the locations of manhole covers and the like. Where necessary, other diagrams may be produced at suitable scales, such as a development view showing the conduit attachment positions and a special design diagram showing the locations of bridge attachments.
12.3.3 Manhole Design
12.3.3.1 Manhole configuration
A manhole primarily consists of a framework, a grade ring, and an iron lid. The cable attachment part of the framework is equipped with an architrave trim where cable ducts are attached, waterproof con-crete that prevents water from seeping in from the surroundings of the conduit, and a duct sleeve that absorbs the overhang of the conduit during an earthquake. The base part is equipped with a water drain-age pit, a pulling bolt used when laying cable, supporting hardware and inlet/outlet steps to support cables accommodated inside the conduit, and an iron ladder as shown in Figure 12.18. For manholes with a length of <4 m, the upper and lower floors are made of a slab structure, and the sidewalls are made of a strong horizontal rigid-frame structure. For lengths of 4 m and above, a reinforced concrete structure comprising a vertical rigid-frame structure and gable walls is used to withstand the lateral earth pressure and surface load and the like.
Plan view
Flat steel
Flat steel
Hook bolt
Ducts
Hook bolt
Iron cover
Step
Ironladder
DuctsFlat steel
Waterproofconcrete
Rectangular
Conduit
Ductsleeve
Iron cover
Flat steel Hook bolt
Ducts
Flat steel
Hook boltPulling bolt
Cross-sectional view 1 Cross-sectional view 2
FIGURE 12.18 Overview of manhole configuration.

238 Construction Technology of Lifeline Pipelines and Its Facilities
12.3.3.2 Manhole Design
12.3.3.2.1 Installation LocationsWhen choosing where to install manholes, the locations required for the installation of outdoor line facilities such as cable splicing/branching points and lifting cable branch points are investigated, and the intervals between these installations should conform to the considerations of conduit span lengths as discussed in the previous section. In practice, the following must be considered when deciding where manhole installations should be installed:
1. The entrances to houses must be avoided. 2. They must be sited where they cause no interference to existing installations above- or
below-ground. 3. When installing manholes near road intersections, they must be positioned where it is possible to
install cable branches or rising lines in the future. 4. They must be positioned where they have little effect on road traffic. 5. They must be positioned where they will have little effect on road paving associated with
roadworks. 6. In the case of bridge edge manholes for conduits attached to bridges, they must be positioned
approximately 15 m or more away from the abutments.
12.3.3.2.2 Determining Their Volume and ShapeThe volume and shape of a manhole are determined based on factors such as the number of conduits along the route, the number of cables they accommodate, and the branching directions of these cables. Manholes are classified into standard manholes whose dimensions and shape are determined by stan-dards and special manholes whose dimensions and shape are considered on an individual basis. In general, standard manholes are used.
Standard manholes are assigned numbers ranging from 3 to 8, and their shapes can be linear or branched (L-shaped, T-shaped, or X-shaped). In cases where a standard manhole cannot be applied due to factors such as the cable branching shape, constraints such as buried objects, or special loading condi-tions, a special manhole is used with an individually designed shape and structure.
12.3.3.2.3 Manhole Grade Rings and Iron LidsA manhole’s grade ring is installed as an access hole that connects the manhole framework with the iron lid installed on the road surface. The grade ring opening is circular with a diameter of 0.7 m and is usually 0.5 m long. Concrete block products are used to adjust the height of the manhole cover so it can adapt to changes in pavement thickness as a result of roadworks and the like.
12.3.4 conduit construction
The functional characteristics of a conduit are watertightness to prevent road collapse and to stop the inflow of earth and sand that can impede the future renewal of cables and earthquake resistance to protect cables by absorbing ground vibrations during an earthquake. The structural specifications and installation work specifications are determined to ensure that these characteristics are achieved.
In the construction of conduit facilities, it is first necessary to obtain road use permission accord-ing to Japan’s road traffic law and to carry out the construction according to the conditions of the permit. In general, the working time zone is specified as daytime or nighttime, and it will be nec-essary to open the road on the same day by temporary backfilling or street covering. Also, since there are other lifeline facilities under city roads, such as electricity, gas, sewers, and water mains, a thorough study of buried objects is performed according to the following method before starting a construction.

239Telecommunication System: Design Aspects
12.3.4.1 Buried object Survey technology
The underground space below Japan’s roads has become very congested, particularly in urban areas. Due to the need for the construction of telecommunications civil facilities in this sort of environment, buried object surveys are becoming an increasingly important prerequisite. Recently, nonexcavating technologies have been established to facilitate the detection of buried objects and the like in advance explorations, and these have been put to use at various construction sites including telecommunications civil works.
12.3.4.1.1 Electromagnetic Wave MethodThe electromagnetic wave method is the currently most widely used search method for buried objects at depths of up to several meters below the ground. In the electromagnetic wave method, an electro-magnetic wave pulse is transmitted into the ground from a transmitting antenna at the ground surface, and the reflected waves produced at interfaces between materials with different electrical properties are captured by a receiving antenna and used to calculate the positions of buried objects based on the time taken for these pulses to be reflected back to the surface. Although the detection performance varies with the frequency of the electromagnetic waves, it is possible to detect buried pipes with diameters ranging from ϕ = 25 to 1000 mm. Furthermore, the detection depth varies between different types of material such as soil and pavement, but it is normally possible to detect objects at depths ranging from 1.5 m to several meters as shown in Figure 12.19.
12.3.4.1.2 Electromagnetic Induction MethodThis method detects the depth of buried objects by sending a signal from a transmitter to buried metal objects (such as the steel cores of optical fiber cables) and measuring the induced magnetic field gener-ated above the ground by these materials. Currently, this electromagnetic induction method is used to perform accurate searches in places where it is not possible to ascertain the locations of buried objects from drawings alone. Since errors can arise when there is secondary induction, NTT has implemented a highly accurate technique by developing a program that ascertains the induction conditions and lessens the occurrence of induction.
12.3.4.2 open-cut construction technology
Even for telecommunications civil facilities, conduit installations are mostly achieved by small-scale ditch excavation according to the series of construction procedures shown in Figure 12.20. Mechanical excavation is particularly difficult in cities where buried objects are highly congested, so there is no choice but to rely on excavation by manual labor. Working inside a trench excavation carries a high risk of personal injuries due to soil collapses or the like, so to make the construction of conduits safer, NTT has made full use of steel retaining walls from as early on as possible in the field of civil installations. Furthermore, since 1985, they have where possible introduced a safe pipe construction method (SAPIC) that was developed as a system whereby the entire sequence of operations from excavation to backfilling can all be performed from the road surface. This includes excavation by vibration shredder or backhoe, soil removal by soil removal crates, formation of a retaining structure by soil retaining struts, use of long-handled extending arms to introduce pipes in excavated ditches, formation of pipe joints by using pipes with insertion joint structures and hydraulic pipe connecting machines, and backfilling and roll-ing compaction through the use of pipe tamping tools and compactors.
12.3.4.3 nonexcavating construction technology
The environments in which conduit construction is performed are subject to harsher constraints due to increasing traffic levels and a lack of available space due to congestion of buried objects, resulting in increasingly strict restrictions on road excavation and environmental protection requirements. Open-cut construction is liable to incur large costs due to the current requirement for opening the road on the

240 Construction Technology of Lifeline Pipelines and Its Facilities
Hor
izon
tal d
istan
ce (m
)
Dep
th (m
)
Cros
s-se
ctio
nal
view
bas
ed o
nex
plor
atio
n da
ta
6.30
5.92
4.54
3.18
2.24
1.34
1.16
1.36
1.74
1.31
1.43
Wat
erm
ain
Wat
erm
ain
Wat
er m
ain
φ100
Wat
er m
ain
φ200
Sew
erpi
pe
Sew
er p
ipe
φ300
Gas
pip
e
Gas
pip
eφ1
50
NTT
pip
e
NTT
pip
eN
TT p
ipe
φ75×
6(a
)(b
)
FIG
UR
E 12
.19
Exam
ple
of th
e el
ectr
omag
netic
wav
e m
etho
d: (a
) bur
ied
pipe
exp
lora
tion
data
and
(b) d
iagr
am o
f bur
ied
obje
cts.
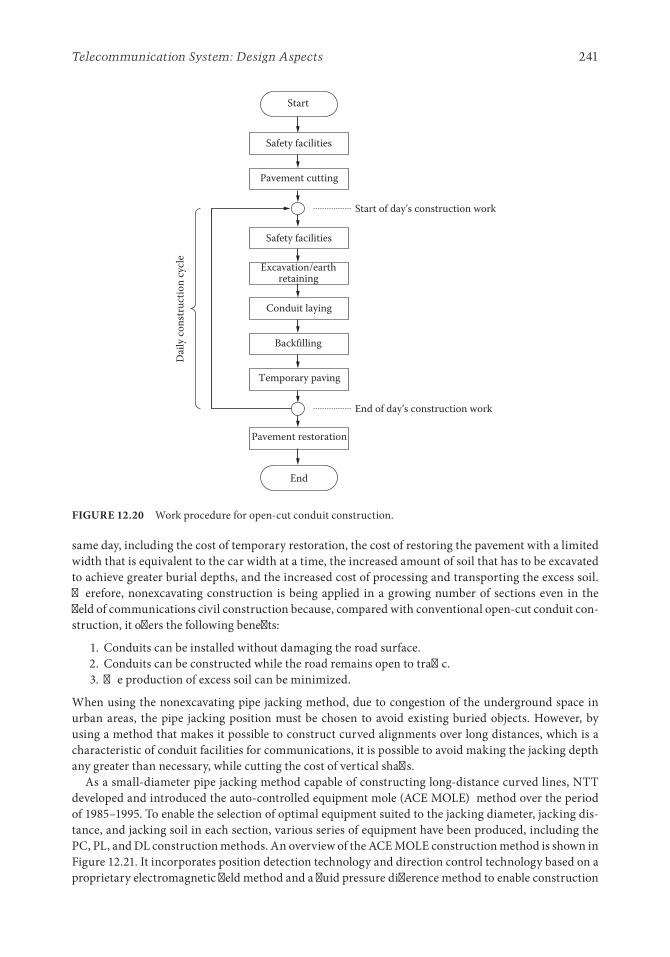
241Telecommunication System: Design Aspects
same day, including the cost of temporary restoration, the cost of restoring the pavement with a limited width that is equivalent to the car width at a time, the increased amount of soil that has to be excavated to achieve greater burial depths, and the increased cost of processing and transporting the excess soil. Therefore, nonexcavating construction is being applied in a growing number of sections even in the field of communications civil construction because, compared with conventional open-cut conduit con-struction, it offers the following benefits:
1. Conduits can be installed without damaging the road surface. 2. Conduits can be constructed while the road remains open to traffic. 3. The production of excess soil can be minimized.
When using the nonexcavating pipe jacking method, due to congestion of the underground space in urban areas, the pipe jacking position must be chosen to avoid existing buried objects. However, by using a method that makes it possible to construct curved alignments over long distances, which is a characteristic of conduit facilities for communications, it is possible to avoid making the jacking depth any greater than necessary, while cutting the cost of vertical shafts.
As a small-diameter pipe jacking method capable of constructing long-distance curved lines, NTT developed and introduced the auto-controlled equipment mole (ACE MOLE) method over the period of 1985–1995. To enable the selection of optimal equipment suited to the jacking diameter, jacking dis-tance, and jacking soil in each section, various series of equipment have been produced, including the PC, PL, and DL construction methods. An overview of the ACE MOLE construction method is shown in Figure 12.21. It incorporates position detection technology and direction control technology based on a proprietary electromagnetic field method and a fluid pressure difference method to enable construction
Pavement restoration
Temporary paving
Backfilling
Conduit laying
Excavation/earthretaining
Safety facilities
Pavement cutting
Safety facilities
Start
End
Dai
ly co
nstr
uctio
n cy
cle
Start of day’s construction work
End of day’s construction work
FIGURE 12.20 Work procedure for open-cut conduit construction.

242 Construction Technology of Lifeline Pipelines and Its Facilities
over long distances and along curved paths. Also, the introduction of a compact split launching type (DL-C) has made it possible to perform pipe jacking from a smaller hole than has hitherto been neces-sary (ϕ ≥ 2000 mm). This enables it to be deployed on narrower streets, reduces the amount of time needed for construction, and is also useful for cutting the amount of soil that has to be disposed of.
12.3.5 Manhole construction
The materials used for manhole framework parts include cement concrete and resin concrete, and con-struction methods include the in situ casting method, where reinforced concrete is cast on site, and the block method, where precast parts of suitable size are transported to the site for final assembly.
12.3.5.1 construction by the Block Method
In the construction of communications civil facilities, the block construction method is becoming widely used since it allows the construction of facilities with stable quality with a shorter amount of work on site. Block manholes made of cement concrete are currently standardized as straight connecting models 3–5 and L branching models 3–4 for new installations, and models 3–5 for reconstruction projects.
In the field of telecommunications civil facilities, resin concrete was used from an early stage as this polymer material offers superior stability. Resin concrete is also used for block manholes because it can be made into lighter structures with thinner walls than can be achieved with cement concrete. Resin block manholes are standardized as straight connecting models 3–5 and L branching models 3–4 for new installations and straight connecting models 3–5 for reconstruction projects. In the block construc-tion method, a suitable block weight is needed to increase the efficiency of transportation and assembly work, so the framework is split into separate parts. Therefore, in telecommunication manholes where the framework is required to be watertight, an adhesive with the required strength and water-tightness is used to join these blocks together.
12.3.5.2 construction by the in Situ casting Method
The in situ casting method is used when a manhole is required to have a complex nonstandard shape or when it is impossible to transport blocks to the work site for modifications to an existing manhole.
Induced magneticfield detector
Magnetic flux
Induced magneticfield generator
Operatorcontrol panel
Aboveground units
Additiveinjector
Wastesoil tank
Standard fluid pressure measuring device
Pipe jacking equipment
Outer pipe
Lase
r osc
illat
or
Used by curve equipment
Drill head
FIGURE 12.21 Overview of the ACE MOLE method.

243Telecommunication System: Design Aspects
12.4 Buried conduits
12.4.1 overview of Buried conduits
12.4.1.1 Purpose of Buried conduits
Buried conduits allow overhead cables to be placed underground, which helps to free up space for pedes-trians and other road users while improving the urban landscape and making it easier to fight fires and prevent damage caused by toppling of utility poles in the event of an earthquake. The sections where buried conduits are applied are as follows:
1. Areas with a high demand density a. Built-up areas in commercial districts and the neighborhoods of terminal stations b. Other residential areas 2. Areas where it is difficult to construct and maintain overhead line equipment a. Areas where overhead lines are difficult to construct and maintain due to traffic conditions or
the presence of roadside trees or housing b. Areas where there is a harsh natural environment that makes it impossible to ensure the reli-
ability of overhead lines 3. Areas where buried cables are mandated by government or local authorities a. Areas where overhead line facilities would obstruct road traffic b. Areas where they would interfere with fire prevention or other emergency activities c. Areas where overhead lines are aesthetically undesirable
In recent years, the burying of electrical wires has been actively promoted based on the participation of multiple businesses centered on road administrators, and cases where businesses have undertaken this work on their own are becoming fewer. The facilities of road administrators are used to jointly accom-modate various types of underground cable including communications and electric power cables, and for this purpose, there are CCBOX structures and cab systems made of box-shaped concrete structures built underground as an integral part of the road structure. Also, a system whereby a conduit is installed by a regional authority as an independent business is called a municipal conduit system.
12.4.1.2 classification of Buried conduits
The form of buried conduits has been reviewed in the past for purposes such as reducing construction costs and making them more responsive to services. A mixture of three forms is currently used: free-access conduit systems and subscriber underground distribution (SUD) systems SUD-1 and SUD-2 as shown in Figure 12.22. In order of when these systems were introduced, the first was SUD-1, which is a system where distributed cables and leading-in cables are laid in separate conduits at a ratio of one cable per pipeline. Next, the SUD-2 system allowed a single conduit (a subscriber branch conduit) to contain multiple leading-in cables for distribution to users. The free-access system that is currently used allows a single conduit (free-access conduit) to contain a mixture of distributed cables and leading-in cables.
12.4.2 Design of Buried conduits
12.4.2.1 Basic concepts
In the design of a buried conduit, it is necessary to consider factors such as the reliability of the facility, the ease of conduit installation and maintenance, and the economics of its construction. The following design criteria are considered and reflected in the design:
1. The number of conduits is determined from the required number of cables and spare conduits. 2. The pipe diameter is determined based on information such as the type of cable to be
accommodated.

244 Construction Technology of Lifeline Pipelines and Its Facilities
3. The size and shape of manholes is determined according to factors such as the type of cable to be accommodated and whether or not it contains cable connection points.
4. The position occupied by a conduit is selected to suit the positioning of cable branches and sub-scriber conduit lines and is positioned closer to buildings so as not to obstruct the buried objects belonging to other organizations. On roads where there is no demarcation between the roadway and sidewalk, conduits are kept as close to the side as possible.
5. When determining the positions occupied by handholes, it is important to choose a location where cables can be lifted up or pulled down easily, where the effects on other facilities above- and belowground are minimized, and where excavation has little effect on the road pavement.
6. According to a directive of the Ministry of Land, Infrastructure, Transport, and Tourism, the depth of earth covering buried conduits should be 0.5 m on sidewalks as a rule, but if this rule is difficult to apply due to a special pavement structure or some other reasons, then a sufficient depth is required.
12.4.2.2 Design of Free-Access Systems
A free-access (single-pipe) system consists of distribution conduits, free-access conduits, subscribers’ conduit lines, finger holes, and handholes. A single free-access conduit accommodates distributed cables between handholes, down-lead cables to individual users, and underground outside metal-lic cables. Branch cables to users can be laid by lifting up (or pulling in) the free-access conduit at any location.
Regarding the vertical alignment, the floors of handholes are kept above the underground water level to avoid culverts and buried objects and the like, and non-water-retentive handholes with water drain-ing holes are used in the lower floor slab to produce a U-Line (slumped) alignment at one location per half span. The span length is 120 m or less (60 m or less for a slumped line shape), and the farthest attachment position of a branched pipe must be within 60 m of a handhole. The type of pipe used is rigid
Sidewalk
Finger hole
Leading-in conduits
Leading-in conduits(φ100 or φ150 mm)
Leading-in conduits(φ50 or φ25 mm)
Existing handhole
SUD branch pipeDistribution conduits
(φ50 mm)
SUD branch pipe
Down-leadDistributed cableDistribution conduits
(φ75 or φ50 mm)
(a) (b) (c)
Distribution conduits
φ150 mm(leading-in conduits)
FIGURE 12.22 Configuration of buried conduits: (a) one cable per conduit (SUD-1 system), (b) laying multiple cables only in leading-in conduits (SUD-2 system; since 1995), and (c) free-access (single-pipe) method (since 2000).

245Telecommunication System: Design Aspects
polyvinyl chloride (VP or VU pipe) with an insertion joint structure. VP pipe is used at soil depths of up to 1.2 m, and VU pipe is used at soil depths >1.2 m. The pipe radius should be ϕ = 150 mm.
12.4.2.3 Design of Subscriber Lifting (Leading-in) conduits
The design criteria for subscriber lifting and leading-in conduits are as follows:
1. The bending radius should be at least 10 m. However, if there is no other way of avoiding buried objects, the permissible limit shall be 2.5 m.
2. For long flexible pipes, the radius of curvature should be at least 0.5 m. 3. Curved pipes of 90° with diameters of ϕ = 25 and 50 mm should have a radius of curvature
of 0.5 m. 4. In a free-access (single-pipe) system, a single span of the subscriber lifting (leading-in) conduit
branching from the free-access conduit (between this branch and the neighboring base point) should have no more than three curves and should be no longer than 25 m. Here, base point refers to pulling points and finger holes. At bends, cable laying tension calculations are essential in designs for subscriber lifting (or leading-in) conduits in free-access (single-pipe) systems includ-ing bends in the vertical lifting sections and branching parts from the free-access conduit (with single bends of 90° or less). However, the span length of subscriber lifting (or leading-in) conduits in SUD-1 sections must be determined after calculating the individual cable laying tensions.
The types of pipe for underground parts should in principle be made of rigid polyvinyl chloride pipe with insertion joints, but when this cannot be used, a suitable pipe is chosen based on Table 12.3. A subscriber lifting conduit can be a sidewall attachment type that attaches directly to the building or a free-standing type that stands by itself. The type of pipe to be used for vertical sections is determined according to the mode of attachment.
The pipe diameter should be suited to the outer diameter of the cables accommodated inside it, and different diameters should not be connected in the same span. (For a list of pipe diameters and cable diameters that can be accommodated inside them, see Table 12.4.) In particular, when leading conduits
TABLE 12.3 Laying Conduits and Suitable Conduit Types
Laying Conditions Suitable Conduit Type
• T-25 load running sections (road) where the earth-covering depth is <0.6 m
Insertion joints
• Roads in regions such as hot spring resorts where the ground temperature exceeds 40°C
Coated steel pipe (PL, PS)
• Sections of soft ground Sections other than building leading-in conduits
Building leading-in sections Corrugated flexible pipe• T-6 load running sections (sidewalk) or T-25 temporary
static loading sections (places where vehicles are temporarily parked on the sidewalk) and sections where the buried objects are judged to be in a congested state and it is economically advantageous to reduce the depth of soil covering by using the flexibility of the pipes
Long flexible pipes
TABLE 12.4 Conduit Diameter and Outer Diameter of Cable That Can Be Laid
Conduit Diameter (mm) Outer Diameter of Cable That Can Be Laid
75 70 mm and fewer50 15–38 mm25 14 mm and fewer
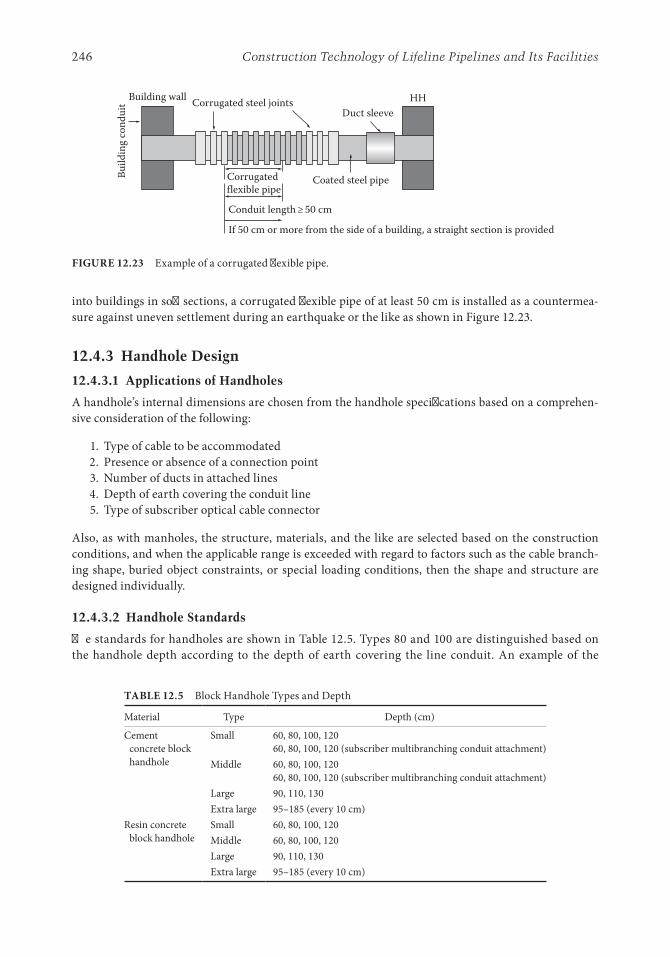
246 Construction Technology of Lifeline Pipelines and Its Facilities
into buildings in soft sections, a corrugated flexible pipe of at least 50 cm is installed as a countermea-sure against uneven settlement during an earthquake or the like as shown in Figure 12.23.
12.4.3 Handhole Design
12.4.3.1 Applications of Handholes
A handhole’s internal dimensions are chosen from the handhole specifications based on a comprehen-sive consideration of the following:
1. Type of cable to be accommodated 2. Presence or absence of a connection point 3. Number of ducts in attached lines 4. Depth of earth covering the conduit line 5. Type of subscriber optical cable connector
Also, as with manholes, the structure, materials, and the like are selected based on the construction conditions, and when the applicable range is exceeded with regard to factors such as the cable branch-ing shape, buried object constraints, or special loading conditions, then the shape and structure are designed individually.
12.4.3.2 Handhole Standards
The standards for handholes are shown in Table 12.5. Types 80 and 100 are distinguished based on the handhole depth according to the depth of earth covering the line conduit. An example of the
Building wall Corrugated steel jointsBu
ildin
g co
ndui
t
Corrugated flexible pipe
Conduit length ≥ 50 cm
If 50 cm or more from the side of a building, a straight section is provided
Duct sleeveHH
Coated steel pipe
FIGURE 12.23 Example of a corrugated flexible pipe.
TABLE 12.5 Block Handhole Types and Depth
Material Type Depth (cm)
Cement concrete block handhole
Small 60, 80, 100, 12060, 80, 100, 120 (subscriber multibranching conduit attachment)
Middle 60, 80, 100, 12060, 80, 100, 120 (subscriber multibranching conduit attachment)
Large 90, 110, 130Extra large 95–185 (every 10 cm)
Resin concrete block handhole
Small 60, 80, 100, 120Middle 60, 80, 100, 120Large 90, 110, 130Extra large 95–185 (every 10 cm)

247Telecommunication System: Design Aspects
structure of a handhole is shown in Figure 12.24. The selection is made after considering the applica-tions listed in Section 12.4.2.
12.5 Special Facilities
12.5.1 conduits Attached to Bridges
12.5.1.1 Design of conduits Attached to Bridges
When crossing obstacles such as rivers, it is necessary to design structures such as conduits attached to bridges or private bridges (i.e., bridges built exclusively for conduits as a fixed asset of a communications carrier). Attaching a conduit to a bridge is a simple and economic solution in cases where it is possible to make joint use of (occupy) a structure such as a road bridge, but joint use is subject to numerous con-straints and requires that the rights for bridge attachment are obtained at the bridge planning stage. The following points must be kept in mind:
1. Bridge attachment has a direct effect on the structure of road bridges; so it is important that the design conditions such as the attached weight associated with joint use are incorporated at the design stage of road bridges and the like and information about plans for road bridges and the like is obtained at an early stage.
2. To ensure the longevity of conduit routes through conduits attached to bridges, it is necessary to check the current status, stability, durability, and renewal plans of the primary joint use facilities such as road bridges.
3. Unlike conduits that occupy roads, conduits attached to bridges have a direct effect on the structure of road bridges and the like, and it is necessary to engage in consultation with road administrators regarding details such as the added weight, attachment methods, and attachment positions.
Some joint use methods use the bridge’s superstructure for the attachment of cables, while others use the bridge’s substructure. In each case, the choice between the two is made individually by considering fac-tors relating to its ease of construction and maintainability, such as the type and structure of the bridge attachment, the conduit’s type, layout, number of ducts, and fire protection measures.
12.5.1.1.1 Joint Use of a Bridge’s SuperstructureJoint use of a bridge’s superstructure involves fixing a joint use appliance made with L-shaped steel sec-tions and U-shaped bolts to the upper structure of a road bridge or the like and using this appliance to carry a conduit. Figure 12.25 shows an overview of the joint use of a bridge’s superstructure.
Iron lidFlat steel
Step Rectangular
Waterproof concrete25 mm
duct sleeve
50 mmduct sleeve
100 mm duct sleeve(150 mm duct sleeve)
Pulling bolt
Ducts
Subscriber multibranching
FIGURE 12.24 Example of block handhole configuration.

248 Construction Technology of Lifeline Pipelines and Its Facilities
12.5.1.1.2 Joint Use of a Bridge’s SubstructureJoint use of a bridge’s substructure involves suspending a dedicated conduit upper structure made by NTT to the substructure (bridge piers, abutments) of a road bridge or the like and attaching a conduit to this structure. The form of facilities such as the dedicated conduit superstructure and joint use appli-ance is the same as for a private bridge (see Section 12.5.2). Figure 12.26 shows an overview of joint use of a bridge’s substructure.
The joint use position is chosen by selecting a place on either side of a road bridge’s girders or below the floor slabs where it will be less affected by factors such as direct sunlight or external forces caused by the flow of water during a flood.
Rigid polyvinyl chloride pipe is generally used as the conduit material, but steel pipe may be used in the bridge abutments or in places where it is not possible to use rigid polyvinyl chloride due to constraints such as the spacing between supports. The spacing between pipe supports is chosen by considering the pipe’s horizontal movement, axial flexing, allowable load, and resonance with bridge vibrations. For rigid polyvinyl chloride pipes, it should be roughly 2.0–2.5 m, and for steel pipes, it should not exceed 5.5 m.
The joint use appliance that supports a conduit is generally fixed to the upper structure by an assem-bly of L-shaped steel sections or the like, which secures and supports the conduit with U-shaped bolts. The conduit is supported by ordinary support points, with expansion joints at appropriate intervals to support the conduit without restricting its axial movement, allowing them to absorb the thermal expansion/contraction of the conduit and any displacements that may occur during an earthquake or the like, or by special support points where the axial movement of the conduit is restricted. If the inter-vals between joint use appliances are made shorter (reducing the conduit support spacing intervals), then it is possible to prevent vibration of the conduit and cables. In places where there is a possibility of fires being lit below the bridge girders, fire protection measures are implemented. The status of conduits attached to bridges is shown in Figures 12.27 and 12.28.
12.5.2 Private Bridges
12.5.2.1 Design of Private Bridges
A private bridge is a bridge built exclusively to carry communication cables across a river or the like when no suitable road bridge can be secured for the purpose. It consists of a superstructure that includes
SlabSlab
Conduit
Joint useappliance
Bridge pier(abutment)
U-shaped bolt
L-shaped steel
Supe
rstr
uctu
re o
fro
ad b
ridge
sSu
bstr
uctu
re o
fro
ad b
ridge
s
Mainsupport beam
Mai
n su
ppor
t bea
m
Mainsupport beam
FIGURE 12.25 Overview of joint use of a bridge’s superstructure.

249Telecommunication System: Design Aspects
a conduit containing the cables and a substructure that includes the supporting abutments and bridge pier foundations. The superstructure is the bridge girder part provided so that the conduit route can cross over the river or other obstacles. It must be able to cope not only with the weight of the attached conduit but also with the weight of the bridge girders, wind loading, snow loading, the effects of changes in temperature, the effects of earthquakes, and so on. The substructure is made to safely transfer the loads from the upper structure to the ground.
In the design of a private bridge, the facility’s GD, maintainability, economy, and ease of construction must be considered in addition to harmonizing with the surrounding environment, and it is important to thoroughly investigate the future plans for obstacles such as rivers, roads, and railways crossed by the bridge and to consult fully with their respective administrators.
Private bridges can take various forms such as rolled steel beam bridges, pipe beam bridges, plate girder bridges, or truss bridges (see Figures 12.29 and 12.30).
Slab
Main
supp
ort b
eam
Main
supp
ort b
eam
Mai
n su
ppor
t bea
m
Conduit
Joint useappliance
Superstructure for exclusive use by conduits’(example) rolled steel beam bridge
Bridge pier (abutment)
Channel steel
Bridge bearing
Bridge pier (abutment)
Supe
rstr
uctu
re o
fro
ad b
ridge
sSu
bstr
uctu
re o
fro
ad b
ridge
s
FIGURE 12.26 Overview of joint use of a bridge’s substructure.

250 Construction Technology of Lifeline Pipelines and Its Facilities
12.5.3 High-Reliability conduits
12.5.3.1 Design of High-Reliability conduits
A high-reliability conduit is a type of conduit facility used by NTT, and a free-space type of facility is a new mode of implementation for telecommunications civil facilities that is flexible enough to handle demand fluctuations and has the structural reliability to rival that of a cable tunnel. When using high-reliability conduit, the facility configuration is determined by performing an economic comparison of conduit systems including the costs of occupancy and maintenance from an evaluation of the route’s importance, a prediction of demand fluctuations on the route, the current congestion status of buried objects, and the future construction environment. Compared with a cable tunnel, a conduit system is particularly suitable for carrying roughly 10–30 cables, but to take advantage of the characteristics
FIGURE 12.27 Conduits attached to a bridge.
FIGURE 12.28 Fire protection.
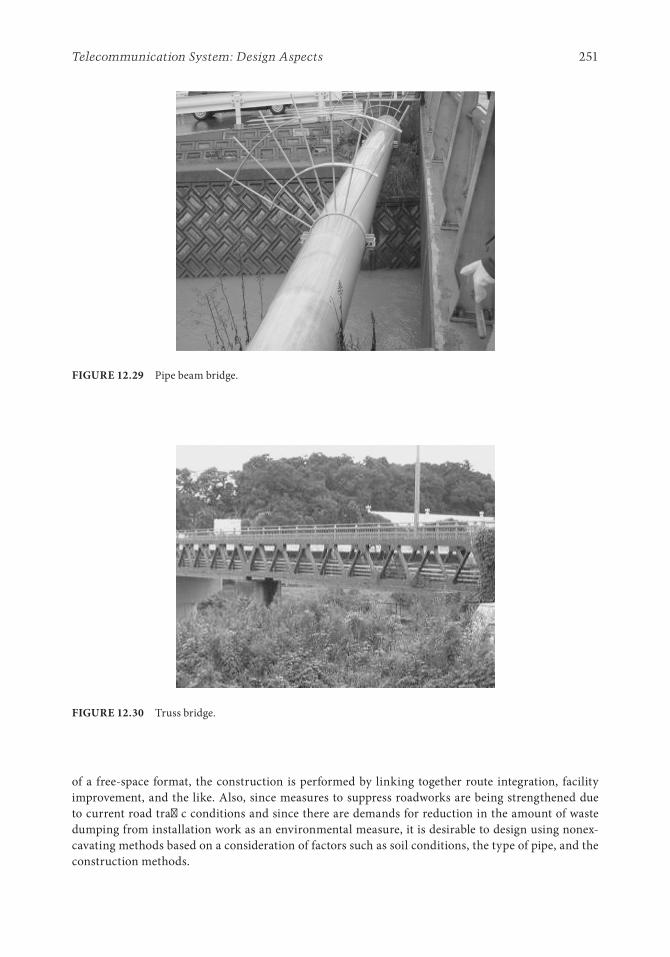
251Telecommunication System: Design Aspects
of a free-space format, the construction is performed by linking together route integration, facility improvement, and the like. Also, since measures to suppress roadworks are being strengthened due to current road traffic conditions and since there are demands for reduction in the amount of waste dumping from installation work as an environmental measure, it is desirable to design using nonex-cavating methods based on a consideration of factors such as soil conditions, the type of pipe, and the construction methods.
FIGURE 12.29 Pipe beam bridge.
FIGURE 12.30 Truss bridge.

252 Construction Technology of Lifeline Pipelines and Its Facilities
Conduits are required to block effects such as induction and protect cables from ground movements during earthquakes, so the type and diameter of pipe and the construction method are selected to meet these conditions.
The alignment of a high-reliability conduit is designed to be very close to a straight line both hori-zontally and vertically, and when curves are provided to follow the road shape or avoid buried objects or the like, the conduit is designed so as to keep the radius of curvature and the amount of slump within fixed values.
The considerations regarding the depth of earth covering the conduit are the same as for ordinary conduit systems, but since pipe jacking is principally performed from the planned site of manhole struc-tures, the optimal earth-covering depth is determined from the allotted manhole spacing and con-straints associated with the vertical alignment and the required separation from neighboring structures (including buried objects and structures belonging to other businesses). In nonexcavating construction, the earth-covering depth is less of an economic consideration than in open-cut methods, but a depth in the range from 1.5 to 5.0 m from the road surface is generally used based on considerations such as the manhole structure and the economics of the pipe jacking operations.
12.5.3.2 Structure of High-Reliability conduits
A high-reliability conduit can be implemented with a pipe-in-pipe method, whereby a conduit (output pipe) with a nominal diameter of 250–500 mm is packed with multiple cable accommodation spacers (inner pipes) and the spaces between the outer pipe and inner pipes are filled with mortar or the like, or with a free-space method where no mortar is used and instead the spacers are laid in the space inside the high-reliability conduit when the demand for cables arises as shown in Figures 12.31 and 12.32.
In the free-space method, the lower spacers of ϕ = 75 mm VU for larger diameter cables are laid while constructing the outer pipe, while the upper space is used to lay cables with upper spacers (inner pipes) suited to the cable diameters added when necessary according to demand. This allows
MH MHPart B
Thin polyvinylchloride pipe
Jacking pipe Jacking pipe duct sleeve
A
A
(a)
MH
Filling material
Thin polyvinylchloride pipe
Jacking pipe
Duct sleeve
(b)
Jacking pipeThin polyvinylchloride pipe Filling
material
FIGURE 12.31 Example configuration of a high-reliability conduit with a filled interior: (a) section A–A and (b) details of part B.

253Telecommunication System: Design Aspects
the space to be used more effectively and is expected to reduce costs by making the size of the outer pipe more compact.
The outer pipe has a tough structure that can adequately withstand the external forces of excavation machinery and the like, and it also has a watertight joint structure that can maintain the interior space and is earthquake resistant with the ability to absorb seismic displacements. In regions prone to lique-faction, joints that function to allow expansion/contraction and prevent secession are used, and induc-tive joints are used in places that are expected to be affected by electromagnetic induction and the like. The functional parameters of the outer tube structure are shown in Table 12.6.
A duct sleeve with a flexible structure that absorbs earthquake displacements in the axial direction and in the plane perpendicular to the axis is also installed in the manhole attachment parts, since these parts are the most liable to concentrate the stresses that occur during an earthquake. The joints and duct sleeves are designed to be earthquake resistant based on data gathered from the 1995 Kobe earthquake.
12.5.3.3 High-Reliability conduit construction techniques
12.5.3.3.1 Open-Cut Construction TechniqueHigh-reliability conduits are mainly constructed by nonexcavating methods, but in some cases, it may be necessary to use an open-cut conduit construction method as discussed in Section 12.3.4.2, for
MH MH
Duct sleeve Outer pipe
Front view Slit
Fixedpart
Fixedpart Attachment
part
Upperspacer
Expansionjoint
Ductsleeve
Outer pipe
Expansion jointLower spacer
Spacerclamp
FIGURE 12.32 Example configuration of a free-space high-reliability conduit.
TABLE 12.6 Functional Parameters of High-Reliability Conduit
Ordinary Area
Liquefaction AreaOpen-Cut Nonexcavating
Outer pipe structure
Materials Polyvinyl chloride Steel, cast iron Steel, cast ironJoint Insertion joint Stopper jointDuct sleeve Duct sleeve for liquefaction area
Functional parameter
Earthquake resistance Seismic scale 6 (Japanese standard)Water bearing pressure (MPa) 0.098 0.196

254 Construction Technology of Lifeline Pipelines and Its Facilities
example, when connecting to an existing manhole or when it is not possible to ensure sufficient sepa-ration between buried objects. The external pipe can be laid by a lifting down method or by a method where it is pushed along from a vertical shaft that also serves as the location of a manhole facility. In either of these methods, it is necessary to completely connect the joint locations according to the pre-scribed standards, and great care must be taken in cases where the conduit is laid along a curved path or when an insertion is performed in the middle of a span.
12.5.3.3.2 Nonexcavating Construction TechniquesThe construction procedure for a high-reliability conduit by nonexcavation means is almost the same as for the nonexcavation construction of ordinary conduits (see Section 12.3.4.3), but different methods are used in manholes for the duct sleeve attachment and duct formation. Also, in the case of high-reliability conduit facilities, since nonexcavating construction is used between manholes, the pipe jacking align-ment is set after using an underground detector or the like to perform a careful study of the status of buried objects and soil quality along the entire span. Along this alignment, manhole structures are used to construct vertical shafts for the start and end points, the bore head of the small-bore pipe jacking equipment is set up at the starting vertical shaft, and excavation proceeds from the starting vertical shaft to the ending vertical shaft.
12.5.3.3.3 Free-Space Cable Laying MethodWhen using the free-space method to lay cables inside a high-reliability conduit, it is first necessary to lay the inner pipes. In this case, compressed air is used to pass the wiring rope through a tube while sending it back on the outside.
12.5.4 Shield tunnel interface conduit
12.5.4.1 Stic Design
12.5.4.1.1 OverviewA branch conduit used to branch cables off at an arbitrary position in a cable tunnel constructed by the shield method is called a shield tunnel interface conduit (STIC), which is a type of conduit facility. Research into such techniques for connecting cable tunnels and conduits was started in 1982, and in 1987, as a result of various investigated improvements, by restricting to a shielded cable tunnel with steel segments as the primary street covering, this was incorporated into the STIC application. Then in 1992, its application was extended to concrete segment cable tunnels.
STIC offers features such as the following:
1. It allows effective use to be made of cable tunnels constructed by the shield method. 2. It makes it possible to achieve greater economy and shorter construction times than the use of
adjacent vertical shafts. 3. It allows construction work to be carried out even in city streets where road use is limited. 4. It achieves sufficient hole drilling accuracy even for cable tunnels with an earth-covering depth
of 30 m. 5. It offers excellent earthquake resistance.
12.5.4.1.2 Configuration and ApplicationsThe STIC design process considers factors such as the number of branching cables, the size of the connecting cable tunnels, the type of segments in the cable tunnels, and the earth-covering depth of the cable tunnels. STIC is used in cases where it is necessary to branch a cable from a cable tunnel, and it is uneconomical or difficult to construct a branch by means of a conduit from a vertical shaft.

255Telecommunication System: Design Aspects
When doing so, consideration should be given to the technical conditions, the ground conditions, and the cross-sectional shape of the cable tunnel in addition to the current status and future plans for the accommodation of cables inside the cable tunnel. Figure 12.33 shows a block diagram of an entire STIC installation.
12.5.4.2 Stic construction
In an STIC construction, a slurry trench is formed by a boring machine situated aboveground, a medium bore casing is built up, and a water blocking process is performed at the top part of the shield, after which the slurry is removed and the shaft is connected to the primary coating. After that, the bottom of the manhole is connected to the shaft, and finally, the manhole is constructed. The general construction procedure is shown in Figure 12.34.
Connections at the side of the manhole are formed by manhole connection sockets that connect the branching manhole parts with the branch pipes. These socket parts are configured with the ability to function as expansion joints to deal with ground subsidence, and waterproofing is also given due con-sideration as shown in Figure 12.35.
Vertical cable supporting hardware
Vertical cable support rack
Type B cable movement prevention hardware
Secondary waste concrete
Primary waste concrete
Bridge-attached vinylpipe expansion joint
Insertion jointRigid polyvinylchloride pipe
Cable tunnelside connection
Insertion joint
Branch manholeside connector
Branch pipe
CB filling
Insertion joints compatiblewith coated steel pipes and
vinyl pipesInner pipe connection plate
Restorationof secondary
coating
Mul
tibra
nch
man
hole
STIC
mai
n bo
dyCa
ble t
unne
lm
ain
body
Cable
FIGURE 12.33 STIC configuration.

256 Construction Technology of Lifeline Pipelines and Its Facilities
End
Main reinforcement
Socket connection/water blocking
Restore secondary coating
Lay inner pipe
Duct �nishing
Segment aperture
Check arrival positionsof branch pipes
Ground improvement
Drilling
Install drilling machinery
Construct verticalshaft for drilling
On road Inside cable tunnel
Chipped secondary coating
Reinforcement before aperture
Survey
Start
FIGURE 12.34 Standard construction procedure.

257Telecommunication System: Design Aspects
The cable tunnel connections are formed from parts including a segment connector socket that joins to the cable tunnel and an inner pipe connector plate that attaches the inner pipe. Also, a cable tunnel connector socket has a hinged structure that allows it to mitigate stresses during an earthquake while remaining watertight.
References
1. Japan Society of Civil Engineers. Handbook of Civil Engineering, 4th edn. Gihodo Publishing, Tokyo, Japan, 1989 (in Japanese).
2. Telecommunication Research Association. Outline for Telecommunication. Ohmsha, Tokyo, Japan, 2011 (in Japanese).
3. Information Infrastructure Research Association. The Telecommunication Civil Technology Supporting Information Infrastructure. The Telecommunication Association of Japan, Tokyo, Japan, 2000 (in Japanese).
4. F. Sugino. R&D trends in communications infrastructure to achieve safe and secure access networks. NTT Technical Review, 11(6), 8–13, 2013.
5. Tunnel Engineering Committee. Standard Specifications for Tunneling—2006: Shield Tunnels. Japan Society of Civil Engineers, Tokyo, Japan, 2007.
6. Tunnel Engineering Committee. Standard Specifications for Tunneling—2006: Cut-and-Cover Tunnels. Japan Society of Civil Engineers, Tokyo, Japan, 2007.
Duct finishing
Manholeconnection socket
CB filling
Rigid polyvinyl chloridepipe insertion joint
Floor slab belowbranched manhole
Floor slab belowbranched manhole
Primary waste concrete
Secondary waste concrete
FIGURE 12.35 Branch manhole side connector.


259
IIIMaintenance Technologies of Lifelines
13 General Takanobu Suzuki ..................................................................................................... 261Maintenance Management of Urban Lifeline Facilities • Causes of Deterioration • Inspection and Repair Technologies • Environmental Preservation Technology • Reference • Bibliography
14 Water Supply System: Maintenance Technologies Takeshi Koike ............................... 275Maintenance and Retrofitting of Water Pipeline Systems • Maintenance and Management of Transmission and Distribution Waterworks Facilities • Leakage Protection Technologies • Retrofitting Technology of Waterworks Facilities • Measures for Environmental Conditions • References
15 Sewerage System: Maintenance Technologies Masanori Hamada .............................. 325Operation and Maintenance of Sewers • Water Pollution Control • Prevention of Overflow, Flood, Odor, and Flying Manholes • References
16 Natural Gas Distribution System: Maintenance Technologies Nobuhisa Suzuki and Hiroyuki Horikawa ............................................................................................................ 335Maintenance of Gas Pipelines and Distribution Lines • Corrosion Inspection • References
17 Electric Power System: Maintenance Technologies Keizo Ohtomo and Yoshiharu Shumuta ....................................................................................................................343Maintenance Technologies of Underground Transmission Facilities • Daily Rounds and Inspection of Underground Transmission Facilities • Diagnosis of Underground Transmission Facilities • Remediation Measures of Underground Transmission Facilities • References
18 Telecommunication System: Maintenance Technologies Takanobu Suzuki, Fumihide Sugino, and Katsumi Sakaki ................................................................................347Maintenance of Telecommunications Civil Facilities • Inspection and Diagnosis Technologies for Telecommunications Civil Facilities • Repair and Reinforcement Technologies for Telecommunications Civil Facilities • References


261
13.1 Maintenance Management of Urban Lifeline Facilities
13.1.1 Basics of Maintenance Management of Urban Lifeline Facilities
Urban lifeline facilities are mainly a group of facilities that have been created by using public utility funds. Structurally, they have the following shared characteristics:
1. They are a collection of linear facilities developed over a wide area. 2. They are essentially separate networks constructed for each service. 3. They are a group of facilities that are constructed over many years and provide services using a
combination of new and old facilities. 4. They are services provided as a network, and damage at one location will affect other locations. 5. Generally, they are buried under roads.
In addition to such common characteristics, technology development for maintenance management in line with the characteristics of the facilities for each urban lifeline operator has been carried out, and the maintenance management is in operation.
The methods for maintenance management are being systematized according to the characteristics of each lifeline facility, but the basic conception is as shown in Table 13.1. The characteristics shared by the maintenance management of urban lifeline facilities can be arranged as follows:
1. They are basic elements of the social environment, and service interruptions should be prevented as far as possible to minimize impact.
13General
13.1 Maintenance Management of Urban Lifeline Facilities .............261Basics of Maintenance Management of Urban Lifeline Facilities • Corrective Maintenance and Preventive Maintenance • Labor Saving Technology • Lifecycle Costs • Deterioration Prediction • Asset Management • Facility Management • Maintenance Management and Risk
13.2 Causes of Deterioration ...................................................................267Deterioration of the Structure Materials • Deterioration of Concrete • Iron Corrosion • Fatigue
13.3 Inspection and Repair Technologies .............................................269Types of Inspection • Nondestructive Inspection • Remedial Measures • Monitoring Technologies
13.4 Environmental Preservation Technology .....................................271Laws Related to Environmental Technology • Urban Lifeline Facilities and Urban Problems • Lifecycle Assessment • Recycling Technology • Reduction Technology • Urban Landscape
Reference .......................................................................................................273Bibliography ..................................................................................................273
Takanobu SuzukiToyo University

262 Maintenance Technologies of Lifelines
2. Because facilities are built and operated using public funds, maintenance management requires economic efficiency and planning rationality.
3. The facilities are buried underground, and road collapses causing damage to urban lifeline facili-ties and social confusion caused by the adverse effects on the surroundings must be prevented to the greatest extent possible.
4. Facility management is important because various old and new facilities are mixed over a broad area.
13.1.2 corrective Maintenance and Preventive Maintenance
Methods of maintenance can be broadly classified into corrective maintenance and preventive mainte-nance. In corrective maintenance, countermeasures are carried out after deterioration and deformation in facilities and structures have become severe. In preventive maintenance, countermeasures are carried
TABLE 13.1 Outline of Maintenance Methods
Facility Basic Conception Main Maintenance Management Technology
Water supply Without deterioration, clean water is supplied that has undergone purification processing at a water purification facility. There are management for preventing water leakage and explosive accidents and management that maintains the supply functions such as the water amount, water pressure, and water quality.
• Function evaluation and testing technologies for water delivery facilities
• Analysis, detection, and prevention technologies for water leakage prevention
• Repair technologies for water pipes• Water quality management technologies
Sewage systems Maintenance management for water quality maintenance, improvement of life environment, and elimination of water penetration is strengthened. The objective is maintenance management for ensuring flow-down function and ensuring the soundness of the structure.
• Inspection and examination technologies for sewage systems
• Corrosion and deterioration inspection technologies
• Renovation, reconstruction, and rehabilitation technologies
• Emergency response technologies for accidents
Natural gas Maintenance management for safely and conveniently using city gas is strengthened. This includes preventive maintenance in which gas is safely delivered by preventing accidents due to gas beforehand, and corrective maintenance that takes actions when an accident has occurred.
• Leakage inspection of gas pipes and emergency repair technologies
• Steel pipe corrosion inspection technologies
• Repair technologies for gas pipes• Monitoring technologies for gas supply
systemsElectrical power A system is used by balancing economy, quality,
and reliability in order to economically supply high quality electricity having little fluctuation in frequency and voltage. Abnormal cites in a facility are discovered and repaired by strengthening the inspection rounds.
• Monitoring control systems related to conduction of electrical power
• Accident elimination systems and accident effect prevention system
• Abnormality testing technologies for underground wiring facilities
• Repair technologies for underground wire facilities
Telecommunication In order to ensure reliability of communication, maintenance management methods for conduits and cable tunnels, which protect communication cables, are determined in order to ensure the reliability of communication. Countermeasures for deteriorated facilities are strengthened in order to prevent malfunctioning in communication cables inconvenience to society.
• Investigation and testing technologies for communication outside facilities
• Repair and reinforcement technologies for communication outside facilities
• Distance monitoring technologies for telephone tunnels
• Operation technologies for communication cables

263General
out before degradation and deformation have become severe based on inspection results and deterioration prediction results. If the degree of importance is low and the impact of damage would be negligible, cor-rective maintenance is advantageous. However, in the case in which the impact of damage would be immense, making preparations for immediately repairing and reinforcing is necessary. Depending on the degree of the deterioration or deformation, preventive maintenance may also be necessary because cases also occur in which restoration is impossible using only corrective maintenance methods.
Urban lifeline facilities are basic elements of the social system. Because an interruption of services has a great effect on society, the corrective maintenance and preventive maintenance methods are system-ized by taking into consideration the importance of the facilities. The system by which repair, reinforce-ment, and renovation are methodically carried out is prepared based on regularly scheduled inspection results, and at the same time, an organization that responds to facility accidents that suddenly and sporadically occur is prepared.
13.1.3 Labor Saving technology
Urban lifeline structures typically have a long construction length. The number of facilities is also large, and labor and expenditures are required in test and repair. Furthermore, many structures that are bur-ied in the ground cannot be visually inspected, and innovations are required in the inspection opera-tion. In order to make the inspection and repair operations efficient, technical development is being promoted by each operation. As testing technologies that are shared by each facility, the inspection technology for concrete structures, examination technology for steel structures, probe technologies for underground spaces and buried pipes, and monitoring technologies using optical fiber are available. As shared repair technologies, techniques for lining pipes and tunnel repair techniques are available. In this book, advances for computerization, mechanization, and robotizing in the maintenance manage-ment of the urban lifeline are summarized.
13.1.4 Lifecycle costs
The structures which make up the components of urban lifeline facilities are designed to have specific functions. Generally, the performance of the structures gradually declines as the in-service period pro-gresses. Although some margins are planned for when designing, continuing to use structures that are no longer capable of exhibiting the required performance is impossible. At a stage following a certain number of years, this must be resolved, and additional costs are incurred. To the extent that the required performance can be restored, there is a cycle of a decrease and a restoration of performance, but even-tually the performance will fall to a level that it cannot be restored. In this case, the structure will be dismantled or abandoned, or renovated.
The period starting from the construction of and ending with the dismantling or abandoning of a structure is referred to as a lifecycle. Making additions to the cost of the construction of a structure, the cost of maintenance management during use, dismantling, and abandoning are referred to as the life-cycle cost. Recently, the anticipated environmental and risk costs have also come to be considered, and the prevailing practice considers economic efficiency in terms of minimizing the lifecycle cost overall, rather than restraining construction costs.
Scenario design is required in maintenance that takes lifecycle into consideration, and this is based on predictive results that project into the future. Formulating a scenario design requires knowing the current state of facilities and properly anticipating what may occur in the future.
13.1.5 Deterioration Prediction
Deterioration prediction constitutes an important component technology in maintenance that takes the lifecycle into consideration. Renovation plans differ depending on how the deterioration is predicted

264 Maintenance Technologies of Lifelines
to progress when defects have been discovered as a result of systematically performed inspections. Additionally, even when the inspection results show that the structure is sound, if the time and location that a defect will occur can be anticipated, standardization of renovation construction can be easily planned. Accompanying urban development, frequently the construction of urban lifeline facilities will progress concentrated in certain areas for a certain period. Thus, if deterioration prediction is possible, maintenance management can be performed very efficiently.
An image of the deterioration of a structure is shown in Figure 13.1. The vertical axis shows the required performance (degree of soundness), and is actually a quantitative amount. The horizontal axis is time, and generally a model is used in which the soundness decreases following a curve in which the rate of decrease gradually increases with the passage of time. There is a permissible level for the required performance, and whether to repeat small-scale repairs before the performance falls below the limit-ing level or to undertake large-scale repairs when the limiting level has been reached is determined by a facility manager’s decision. The decline in soundness each year is referred to as the deterioration prediction.
Deterioration prediction includes both macroestimates and microestimates. The macroestimate eval-uates a facility or an entire structure according to an evaluation unit, whereas a microestimate evalu-ates a structural member or portion according to an evaluation unit. However, the macroestimation is not a level having a precision that is technically guaranteed, and currently, the microestimate is basic. Frequently, techniques are used in which the progress in deterioration while in service is estimated by deterioration factors, and the decline in performance is inferred based on this microestimation.
The estimation techniques can be divided into theoretical techniques that are based on deterioration mechanisms and methods based on empirical results. Among theoretical techniques, a technique in which statistical analytic results of investigation data that have been obtained on-site are also included (this can also be said to be a semitheoretical technique), and an assumed mechanism is applied to data and an estimated formula for the degree of deterioration is proposed. By contrast, methods based on empirical results include methods that are based on accumulated field data and methods that carry out deterioration estimates statistically without reference to individual deterioration mechanisms.
Soundness
Small-scale repair small-scale repair
Large-scale Repair
Case 1
Case 2
Assessment period
T1 T2 T3
Required performance
Elapsed time
FIGURE 13.1 Image of the soundness of a structure and repair.

265General
13.1.6 Asset Management
Asset management denotes maximizing property value by investing individual financial assets while considering risk and profitability. In recent years, it is notable that this idea has also been applied to social assets. Specifically, this can be understood to mean that taxes and public charges are held on behalf of the user, who is a customer, are invested in social assets, public services are increased through this investment and management, and this service is delivered to the user. The asset management of social assets is positioned as activities that maximize the asset value by minimizing the costs necessary for the operation and management, and providing high quality services. The flow of asset management for public construction projects is shown in Figure 13.2. However, this is characterized by the fact that services and conveniences and the like are delivered to the user, and these are difficult to measure; there are a variety of persons concerned and the liquidity of assets is low; the proportion of the management costs of the asset is high; and the loss in asset value can be controlled based on the extent that the main-tenance management is performed.
The asset management idea can also be introduced into the maintenance management of urban life-line facilities. This is a scheme in which taxes and public charges serve as a deposit that is reinvested into the construction and the maintenance management of facilities, and services as an urban lifeline that satisfies the user are delivered to the user. The following points are examples of the effects of the introduction of asset management:
1. The necessity of a business plan based on technical judgment becomes easily explained. 2. Understanding the state of assets and the improvement activities can be carried out reliably. 3. Assets are systematically and effectively used by reducing the lifecycle costs. 4. The accountability of the operator for the user is improved.
Needs of public Environment
Facility assets (before)
Man power
Capital
Management system
Facility assets (after)
Public service
Aim
Planning profit increases fornation based on a long-term perspective
(1) Maintenance and improvement of facility assets
Management cycle
Plan Do Check Action
(2) Improving the performance of services
FIGURE 13.2 Flow chart of asset management for public works projects.

266 Maintenance Technologies of Lifelines
13.1.7 Facility Management
Characteristics of urban lifeline facilities include linear facilities that have been developed over a broad area and old and new facilities being used together. Correct position information is indispensable for maintenance management of such facilities, and although in the past facility information was written onto maps and these maps were used in facility management, there has been a movement to man-agement using data that has been electrically digitized using computers. In recent years, by applying the geographic information system (GIS), unified management that combines numerical map data and attribute data such as facility registers has become possible.
GIS is a system in which graphic technologies and database technologies have been merged, accom-panying the development of computer technology; recently, a variety of systems and data formats have become standardized, and data are also distributed via the Internet. The geographical informa-tion that is handled by GIS is also effective in making administrative services efficient; this can also be used by local governments as integrated GIS, and the preparation of the base map information is progressing. The gigantic urban lifeline facilities on GIS are managed by being separated into space coordinates and attribute data. The searching of facilities, management by area, and data analysis can be effectively carried out by applications that manipulate data. If facility inspection data is input as attribute data, the distribution of defective facilities in an area and the degree of advance of deteriora-tion in a region are displayed, and if an application that analyzes these is used, deterioration predic-tions for each region becomes possible. A repair plan can be optimized based on the deterioration prediction data.
13.1.8 Maintenance Management and Risk
In urban lifeline facilities, while reductions in function due to deterioration during the in-service period are expected, there are, in addition, for example, risks due to natural disasters, risks due to human activ-ity, and risks due to environmental change and the like, and significant reductions or interruptions of functions are possible.
The risks of natural disasters include damage due to earthquakes, typhoons, heavy rain, volcanic eruptions, and others, but there are also cases in which these are incorporated into the design require-ments for a structure. Even when strengthened against natural disasters, damage may occur if assump-tions made during the design period are exceeded. The risks due to human activity include the effects of war and terrorist acts and the like, and these are risks that are rarely anticipated in design requirements. In terms of facility operation, countermeasures against terrorist acts including, for example, monitoring entrances and exits at a facility, are effective.
Environmental risks include the effects of a change in society and changes in the installation envi-ronment, and examples include redevelopment of the city, neighboring construction, and changing design loads, and so on. The roads under which urban lifeline structures are installed are not per-manent structures, and there are cases in which roads are widened or moved and the renovation of buried structures under a road is carried out, and renovation of existing underground facilities is necessary due to these effects. Neighboring construction occurs accompanying other constructions because one road may include several urban lifeline structures. Thus, damage due to construction machines and changes that accompany excavation occur. Because design guidelines related to each type of structure are revised after the time of severe accidents, there are also cases in which old urban lifeline structures come to have insufficient resistance strength. In particular, due to the 1995 Kobe Earthquake, existing structures with the old design code suffered severe damage, and the design of earthquake resistance has been changed intensely on urban lifeline structures. This is an example of social change.
Suitably strong structures can resist such risks. However, not only are countermeasures to elimi-nate accidents required, but assuming that accidents will occur, emergency response and early recovery

267General
technologies are also required. Emergency response provides control for preventing significant damage. Early restoration technologies that quickly restore function by using machinery and materials have been prepared in advance. Figure 13.3 shows facility risks and the flow of test and reinforcement. With respect to each type of risk to which a facility is exposed, a sequence is shown in which screening is performed by a primary test, and in the case in which a response is necessary, a structure check is per-formed, and reinforcement or renovation is carried out.
13.2 causes of Deterioration
13.2.1 Deterioration of the Structure Materials
Principal urban lifeline facilities are buried in the ground, and soil pressure, water pressure, and the road load act on them. Furthermore, adding the actions of nature, such as heavy rains and earth-quakes, conditions may become different from the installation environment at the time of construc-tion. Materials that form structures include iron, concrete, plastic, and the like, but these materials are known to change with the passage of years, and there are cases in which they become unable to resist continuously acting loads, repeated loads caused by human activity, vibration, and loads due to the action of nature.
In order to extend the service life of urban lifeline facilities, technical developments for clarifying, predicting, and controlling the deterioration mechanisms are necessary at the various levels of materi-als, structures, and facilities. Among these, the deterioration mechanisms of materials are a shared problem for each of the lifeline operations, and these form the basis for deterioration testing, deteriora-tion prediction, and deterioration control.
Aging deterioration
Decrease of loading capacity malfunction
Changes in installed sites
Changes in loading conditions
Changes in designing policy
Insufficient loading capacity
Natural Disaster
Structural damage
malfunction
Primary check
Structural analysis
OK
OK
NG
NG
Retrofit renewalPeriodic
inspection
FIGURE 13.3 Response flow for facility risks during use.

268 Maintenance Technologies of Lifelines
13.2.2 Deterioration of concrete
Representative causes of long-term deterioration of concrete include carbonation, chloride-induced deterioration, frost damage, alkali–aggregate reaction, chemical attack, and fatigue. Among these, carbonation and chloride-induced deterioration are phenomena in which carbon dioxide or chloride ions, which are deterioration causes that come from the environment, penetrate into concrete to cause rebar corrosion, but do not alter the concrete itself. In contrast, frost damage, alkali–aggregate reaction, chemical attack, and fatigue have differing mechanisms, but they result in the deterioration of the con-crete itself, and not only cracks and strength reduction occur, but rebar corrosion also occurs, due to the breaking down of concrete’s steel protection function.
13.2.2.1 carbonation of concrete
Carbonation is a phenomenon in which carbon dioxide in the atmosphere penetrates into the concrete. The pH of concrete is reduced due to a carbonation reaction. Reinforcement steel in concrete acquires a stable state due to the fact that a passive state film is produced on the reinforcement steel surface in an alkali. However, if the pH decreases, the possibility of corrosion arises. Due to advances in steel reinforce-ment corrosion, cracks occur, and a decrease in load bearing capacity results due to separation and peel-ing of cover coatings and cross-sectional defects, and the performance of the structure is compromised.
The progress of carbonation is a basic diffusion phenomenon, and it is known that increasing car-bonation depth is proportional to the square root of time. Thus, this relation is used in deterioration prediction. In addition, factors influencing the deterioration speed include the water cement ratio and the degree of drying. Carbonation progresses readily in concrete of high water–cement ratio, and an environment in which drying easily occurs makes carbonation progress easily. In concrete that incor-porates blast furnace slag, the progress of carbonation can be suppressed.
13.2.2.2 chloride-induced Deterioration
Chloride-induced deterioration denotes a phenomenon in which the performance of a structure decre -ases because of the promotion of corrosion of steel in the concrete due to the presence of chloride ions, the expansion of volume of the corroded parts causing cracks and flaking in the concrete, and a reduc-tion in the cross-section of the steel. There are cases in which the chloride ions are supplied externally from, for example, ocean water or antifreezing agents, and cases in which they are supplied from the raw materials during the manufacture of the concrete, for example, when sea sand is used that has not been sufficiently washed.
The factors that predict the progress of salt damage include the mobility of material in the cement and the supply conditions of the salt, and corrosion of the steel becomes rapid when a large quantity of salt is supplied to highly porous concrete.
13.2.2.3 others
Considering sewage facilities, there are cases in which chemical corrosion occurs due to the influence of inorganic and organic acids that are included in wastewater, and this causes the concrete to deteriorate. Similarly, in a volcanic zone, chemical corrosion occurs, and a special design is required because mate-rial readily deteriorates.
Likewise, when an earth covering is thin and a road load is directly acting on underground struc-tures, there are cases in which the effect of fatigue due to repeated loading cannot be ignored.
13.2.3 iron corrosion
Corrosion denotes a phenomenon in which erosion occurs due to a metal reacting electrochemically with the environment in which it has been placed, and the metal is transformed into a compound.

269General
When moisture that includes dissolved oxygen adheres to the surface of steel, an anode, which releases electrons, and a cathode, at which hydrogen ions are formed due to the moisture receiving the elec-trons, are formed. When a current flows due to the anode–cathode potential difference, the iron ions and the hydrogen ions bond to generate an iron hydroxide. The iron hydroxide is further oxidized to form iron oxide, this becomes stable, and iron rust forms. Iron oxides are raw materials for steel, but because their strength is low, when the cross-section is damaged due to rust, the load bearing capacity deceases.
Because corrosion is an electrochemical reaction, at sources of stray electric currents such as near train tracks, a phenomenon occurs called electric corrosion, in which current leaking from the rails promotes the corrosion of iron. In the case in which there is a buried metal pipe near rails, a portion of the current that leaks from the rails flows through the buried pipe, and in this situation, the location at which the current flows out becomes an anode and erosion is promoted. When pipelines are built near tracks, countermeasures to prevent electric corrosion are necessary. Buried metal pipes that are buried near the ground surface are sufficiently supplied with moisture and oxygen, and thus, it can be said that they are in an environment in which rust readily occurs. Measures to prevent corrosion include a method in which a coating layer is applied to the surface of a pipe to prevent contact with water and oxygen, and a method in which a current flows such that an electrochemical reaction does not occur in the body of a buried pipe. Designs sometimes employ a corrosion allowance when corrosion prevention measures are difficult.
13.2.4 Fatigue
It is known that, generally, when a metal material is continuously subject to stress greater than a thresh-old value or a repeated stress, the material strength decreases. When temporarily subject to small stresses that are less than the material strength, the metal material is restored to its original state when the stress is removed. However, even when macroscopically exhibiting elastic behavior, the microscopic state at the atomic level may exhibit inelastic behavior in which a portion of the atoms do not return to the original position. Due to an accumulation of the effects of inelastic behavior at the atomic level, the strength gradually weakens. This phenomenon is called fatigue.
In a civil structure, designs take into consideration fatigue in large beams that are subject to stress variation and flaw inspections are employed. In addition to steel structures, fatigue in reinforced con-crete structures should also be considered.
Urban lifeline structures are buried underground, and these are mainly subject to loads from a road. In the case in which the burial position is shallow and the stress variation is large, and in the case in which vibration readily becomes large in a bridge consisting of a frame structure, the strength decreases due to fatigue.
13.3 inspection and Repair technologies
13.3.1 types of inspection
Inspection denotes carrying out information collection for use in maintenance, and it is the basis of evaluation and identification, and countermeasures. Large urban lifeline facilities must be inspected efficiently and economically, and must be maintained in an excellent condition. However, problems such as the lack of information during construction, insufficient inspection frequency, unclear rela-tionships between the inspection items and performance, and insufficient standardization have been pointed out.
According to the Standard Specification for Concrete Structures: Maintenance Edition [1], inspec-tions are classified as follows based on the object of execution, frequency, and facility scale:

270 Maintenance Technologies of Lifelines
1. Initial inspections: These are carried out before the start of service of the structure, during use, or after large-scale countermeasures, and performed with the objective of grasping the presence of early defects, damage, and deterioration.
2. Periodic inspections: These are performed on a periodic schedule with the objective of grasping the presence or degree of deterioration, damage, and early defects, including the minute portions of structures that are difficult to grasp during routine inspections.
3. Detailed inspections: These are carried out in the case in which initial inspections, routine inspec-tions, periodic inspections, and extraordinary inspections are deemed necessary, performed in order to grasp the state of a structure in detail and the condition of any deterioration that has occurred.
4. Routine inspections: These are performed with the objective of grasping the presence or degree of deterioration, damage, and early defects at locations that can be inspected on routine check.
5. Extraordinary inspections: These are carried out when natural disasters such as an earthquake or typhoon, fire, or collisions with vehicles and boats have affected a structure, and performed with the objective of grasping the condition of a structure after disasters or accidents and the like have affected a structure, and to assess and identify advantageous countermeasures.
Considering the types of inspection as listed earlier as examples, in each lifeline operator, a flow of inspection activities is established.
13.3.2 nondestructive inspection
In order to further refine the inspections of the urban lifeline structures, a variety of nondestructive inspection technologies have been developed. These nondestructive technologies inspect the internal condition of a structure without affecting the structure. Nondestructive inspections mainly use various wave phenomena, such as elastic and acoustic waves, ultrasonic waves, x-rays, and ultraviolet beams. When physical energy applied from a surface is propagated as waves, properties that refract and reflect waves are used. An inspection can be repeatedly carried out at the same location, and the changes in the inspection object, such as the quality and the progress of cracks, can be tracked while the inspection object is in use. In contrast, because this is an indirect method mediated by physical energy, attention must be given that uncertainty is included in the inspection results.
Nondestructive inspection techniques are constantly being researched and developed that con-form to the characteristics of a structure depending on each lifeline operation. The standardization of inspection methods and the organization of standards that are applied to urban lifeline structures are desired.
13.3.3 Remedial Measures
When the required performance of a structure has become unsatisfactory due to the progress of dete-rioration, repairing or improving the compromised performance is necessary. This does not mean instantly restoring the functions of all the deteriorating structures, but based on inspection results and deterioration prediction results, planning the restoration of functions in a suitable timeframe. The required performance of a structure includes safety performance, use performance, performance related to the degree of third party influences, performance of the external aesthetic appearance, land-scaping, and durability. The identification of the need for repair or reinforcement is a performance regu-lation type, and this identification must be carried out on each structure. Generally, repair denotes the restoration to the previous state and function, and reinforcement denotes adding to a structure a perfor-mance that is greater than the previous function. Repair techniques and reinforcement techniques are developed in conformity with various urban lifeline facilities.

271General
In urban lifeline facilities, there are many cases in which standardized pipes are connected and used, and repair parts are developed that conform to various characteristics, and repair techniques are estab-lished. In addition, development of technologies for restoring old pipes is also progressing for each operator.
13.3.4 Monitoring technologies
Monitoring technologies are being developed for structures or systems that continuously monitor and evaluate whether abnormalities have occurred or the required performance is present. From the view-point of the continuation of urban lifeline services, monitoring technologies is indispensable for grasp-ing the condition of systems that have been developed as networks, and various data is collected at centers and control is performed according to the conditions. In supply systems such as water supply, gas, and electricity, and in communication systems, monitoring is extremely important.
Many monitoring technologies that continuously monitor the physical changes in structures are in the research stage, but essential technologies that intensively monitor a necessary location during a necessary timeframe are being developed. In addition to strains and deformations, if systems that incor-porate data using nondestructive technologies and that detect abnormalities can be produced inex-pensively, the maintenance management business of urban lifeline facilities can be made increasingly efficient. Sensor technologies and data analysis technologies that discover defects and communication technologies that gather data are examples of the basic components of the monitoring technologies for structures. Furthermore, progress is anticipated in research related to smart structures, in which the structure itself performs self-testing and self-repair when there are defects.
13.4 environmental Preservation technology
13.4.1 Laws Related to environmental technology
In the second half of the twentieth century, problems related to industrial pollution emerged, and the deterioration of the urban environment became a problem. As urban areas expanded, the contami-nation of air and water zones, the loss of the natural environment, the heat island phenomenon, and increasing waste and the like became worse. In addition, the exhaustion of resources on a global scale has become a problem, and a paradigm shift has occurred in which expansion and growth are not con-sidered inevitable.
Understanding the expanding environmental problems, basic environment laws were formulated in Japan in 1993, and the era of an environmentally friendly society began. In order to establish a recycling-based social system, even fields related to construction came to be regulated by the following laws:
1. The Basic Law for Establishing a Recycling-Based Society (enacted in 2001) A basic framework for establishing a recycling-based society was determined, and the Basic Plan
for Establishing a Recycling-based Society was enacted. 2. Waste Disposal Act (enacted in 2000) The act established reductions in the discharge of waste, appropriate processing of waste, making
the living environment clean. Appropriate processing of waste that is generated by facility con-struction was also made obligatory.
3. The old law that focused on using discarded materials as raw materials was revised, and not only the simple promotion of recycling, but integrally performing reduction, reusing, and recycling measures were established. The intention of the act is recovering soil displaced due to construc-tion, concrete chunks, asphalt concrete, and wood material generated during construction for use as resources.

272 Maintenance Technologies of Lifelines
4. Construction Recycling Act (enacted in 2002) By promoting the scrapping and resource redeployment of special building materials by category
and the like, the act established the planning of effective use of resources and the appropriate pro-cessing of waste. Special building materials according to administrative order include concrete, construction materials made of concrete and iron, wood, and asphalt concrete.
13.4.2 Urban Lifeline Facilities and Urban Problems
Because urban lifeline facilities function as a supply and processing system for a city, a reduction of lifeline functions is linked to urban problems. A reduction in the function of water service is linked to water quality contamination, and a reduction in the function of the sewer becomes a waste and a soil contamination problem. In addition, the construction of urban facilities cause problems such as noise, vibration, foul odors, and traffic congestion, and thus, construction plans must be drafted by paying attention to urban problems. When carrying out large-scale public works construction, an anticipatory assessment of the impact on the environment is obligatory based on the Environmental Impact Assessment Act (enacted in 1997, commonly known as the Environmental Assessment Law). Environmental assessment denotes a system that combines into one scheme techniques of scientifically inspecting and predicting the impact that civil works and building construction have on the environ-ment, and procedures (information disclosure and resident participation laws, and the like) that reflect the inspection and predicted results of intentional decisions. Although typically the construction of an urban lifeline is small-scale and an environmental assessment is not required, there are pollution prevention regulations for each local government, and there are also cases in which impact is expected and the understanding of the residents must be obtained. Construction is a cause of pollution such as air pollution, water contamination, noise, and vibration, and the like, or in the case in which an impact on the natural environment is expected, due to fixed environmental impact assessment laws, planning and implementation must be carried out so as to satisfy environmental requirements (environmental standards and the like) that take into consideration regional characteristics. When results are produced that do not satisfy standards, the structure construction must be reviewed.
Waste that is discharged by construction projects in a city is normally disposed and processed outside the city, but appropriate processing, resource redeployment, and recycling are required. In particular, construction-generated soil, concrete, asphalt, and wood must be strictly managed.
13.4.3 Lifecycle Assessment
Lifecycle assessment (LCA) denotes a technique in which a certain product (not only factory-made prod-ucts, but also buildings and civil structures) is the object, and is assessed through the service life start-ing from the acquisition of the resources until recycling or the final disposal, LCA integrally performs evaluations by quantitatively grasping the investment of raw materials and energy and the discharge of an environmental load brought about by these products, and the degree of the environmental load. By implementing LCA, an approach to environmental load reduction can be known, and information useful for selecting products having a low environmental load can be obtained. Internationally, stan-dards established by the ISO (International Standards Organization) “ISO 14040: Lifecycle Assessment: Principles and Framework” and the like have been prepared.
In relation to individual structures, the LCA idea about manufactured products can be applied to the resources that are invested for construction and maintenance management, the waste that is pro-duced, and the environmental load that is produced as a consequence. However, when preparing social assets, a broader assessment is necessary because the regional social system itself will be changed. An operation decision must be made by providing LCA results for public decision making.

273General
13.4.4 Recycling technology
Huge resources are invested for social infrastructure, including urban lifeline facilities. The main resources are steel and concrete, and considering the lifecycle of the structures, the resource utilization efficiency must be improved. Waste that is produced accompanying construction must be decreased as much as possible, and technologies that effectively exploit recyclable materials are required.
Steel is superior in terms of economy, strength, machinability, reliability, and supply stability, and has superior recyclability. Steel can be used as a resource in industries outside of construction, and is distributed as iron scrap and recycled.
Concrete requires sand, stone, and cement as raw materials. A vast amount of concrete is present in modern society and, in addition to progress in the use of waste and byproducts in the cement manufac-turing process, the use in roadbeds and reaggregation is progressing as resource redeployment.
13.4.5 Reduction technology
Means that will reduce the amount of waste that accompanies construction are being studied. Waste that accompanies construction is being reduced by innovations in design and execution such as reduc-ing the amount of excavated soil as far as possible, reducing the excavation area, and reusing scaffolding materials many times. The nonexcavation construction method is considered to qualify for inclusion as a reduction technology in the sense that the excavated amount of soil is reduced. In addition, nonde-structive testing technologies for structures and technologies that examine the ground from the surface are also considered to fall under reduction technologies in the sense that waste due to destruction and excavation is suppressed. In addition, the promotion of joint construction and joint storage can be said to be reduction matters in the sense that they also reduce building construction. The preparation of common utility duct carried out by sharing a plurality of operations can be said to be an example for reduction technology.
13.4.6 Urban Landscape
Many urban lifeline facilities are facilities that are buried under roads, and these do not directly influ-ence the urban landscape. However, aerial lines are used for electric power and communication, and there are also cases in which these worsen the urban landscape. In the urban areas, dismantling of aerial lines and installing into underground place are progressing. In addition, the design of wiring facilities that takes the landscape into consideration is also being carried out.
Additionally, iron manhole lids, tunnel entrances and exits, transformer towers, and various types of dedicated bridges, and the like, in which a portion of an underground facility appears aboveground, are being designed so as to harmonize with the regional landscape.
Reference
1. Japan Society of Civil Engineers. The Standard Specification for Concrete Structures: Maintenance Edition, Japan Society of Civil Engineers, Tokyo, Japan, 2001.
Bibliography
Japan Society of Civil Engineers. Challenge for Introduction of Asset Management, Gihoudo Press, Tokyo, Japan, 2005 (in Japanese).
Joint Task on Maintenance Engineering (JSCE). Infrastructure Maintenance Engineering, University of Tokyo Press, Tokyo, Japan, 2004 (in Japanese).


275
14.1 Maintenance and Retrofitting of Water Pipeline Systems
14.1.1 Maintenance of Waterworks Facilities
The safety and security of potable water relies on the quality of maintenance for waterworks facilities [1]. Prevention management is divided into two categories: operational management and maintenance management. Operational management controls water flow, pressure, and quality, while maintenance management provides the diagnosis and evaluation of facility functions in order to maintain stable ser-vice and improve the service level of the water pipeline system.
The purpose of prevention management is to optimally utilize the water pipeline system by making adequate and normal operations of each facility and also by keeping the equipment in proper working
14Water Supply System:
Maintenance Technologies
14.1 Maintenance and Retrofitting of Water Pipeline Systems .........275Maintenance of Waterworks Facilities • Maintenance of Water Pipelines • Retrofitting of Water Pipelines
14.2 Maintenance and Management of Transmission and Distribution Waterworks Facilities ................................................286Inspection and Investigation and Diagnosis and Evaluation of Transmission and Distribution Waterworks Facilities • Role Evaluation of Transmission and Distribution Waterworks Facilities • Functional Evaluation of Transmission and Distribution Waterworks Facilities • Functional Evaluation and Diagnosis for Transmission and Distribution Pipelines • Diagnosis and Evaluation for Auxiliary Facilities of Pipelines • Diagnosis and Evaluation of Water Pipeline Bridges and Pipeline-Attached Bridges • Seismic Assessment of Main Transmission Pipelines • Electrolytic Corrosion Investigation
14.3 Leakage Protection Technologies ...................................................302General Remarks of Leakage Protection • Planning of Leakage Protection • Basic Measures • Symptomatic Measures • Preventive Measures
14.4 Retrofitting Technology of Waterworks Facilities .......................315Repair and Retrofitting Methods for External Pipe Surface • Repair Method for Internal Pipe Surface
14.5 Measures for Environmental Conditions .....................................319Basic Concept for Environmental Load Reduction • Operation of Transmission and Distribution Pipeline Facilities • Control of Water Flow and Pressure by Distribution Flow Management • Effective Usage of Distribution Flow Pressure • Pipe Laying in Shallow Depth
References ......................................................................................................324Takeshi KoikeKyoto University

276 Maintenance Technologies of Lifelines
condition. In other words, the operational management’s job is to provide clean water of sufficient water flow with adequate pressure to all customers in the service area. It is important to manage the whole water pipeline system from the dam reservoirs to the service connections in an adequate and effec-tive manner. Recently, in Japan, comprehensive management of water pipeline systems is required, for instance, micro hydropower generation by excess water, prevention of leakage causing energy loss, safe drinking water, and directly pressurized water supply. Close cooperation between the operation team and the maintenance team is necessary to reflect the diagnosis and evaluation data on the maintenance and retrofitting plans prepared by maintenance team into the operation management.
The prevention management aims to operate the water pipeline system within safe and stable condi-tions, with full performance during the entire service period. This management has the responsibilities of carrying out the life management of facilities and equipment, reducing the life cycle cost, and plan-ning maintenance and repair to recovering its original performance. The maintenance management is responsible for accidents, repair work after the accidents, corrective maintenance such as repair work, preventive maintenance by diagnosis, and functional evaluations to prevent accidents and troubles of each equipment and also planning of maintenance and retrofitting of water facilities.
The basic approach for the maintenance management is to treat the water pipeline facilities as a single system that is composed of reservoirs, aqueduct, purification plants, transmission pipelines, distribu-tion pipeline networks, and service lines. By executing the diagnosis of each facility and the functional integrity of each element, a quantitative evaluation of the system’s performance is obtained.
Figure 14.1 shows the deteriorating trends of the facilities and equipment that can be compared with the critical levels for the corrective and preventive managements. As a general trend, preventive manage-ment needs excessive cost, but these costs can be reduced by maintaining the functional performance of facilities and equipment. Corrective management, on the other hand, appears to be less expensive than preventative management.
Once an accident occurs, important facilities and equipment are damaged. Therefore, the water service is stopped or reduced as well as water quality decreased. As a result, social condition of customers and urban activities become worse, and the damage compensation cost will be large. To prevent such a significant damage cost, both adequate operation management and preventive management must be taken into consideration.
Higher
Func
tion
of fa
cilit
ies
Systematic maintenance
Ex-post maintenanceNatural deterioration
Service period Operating time
Revised function
Relative deterioration(out of fashion)
Original function
Absolute deterioration(out-of-date facility)
Serviceability limit
Upd
ate f
unct
ion
Life extension
Lower
FIGURE 14.1 Function and maintenance.

277Water Supply System: Maintenance Technologies
It is important to know the present state of both individual equipment and the system as a whole to predict the future trends of the equipment. Additional assessment should be done to know the capability for future changes, such as extended trend of the direct pressurized water supply, dete-rioration of water source, high purification requested on the revision of the water quality standard, and saving energy. In the operation management, environmental problems such as global warming countermeasures and reducing the waste matters must be solved in the whole system of water pipe-line networks together with consideration for the reuse of waste materials and for the reduction of electric power use.
As shown in Figure 14.1, system performance should be recovered not only to the original level but also to a level high enough to resist future environmental changes.
14.1.2 Maintenance of Water Pipelines
14.1.2.1 General Remarks of Water Pipelines
Water pipeline systems are composed of reservoir dams, intakes, aqueducts, purification plants, trans-mission and distribution network systems, and service lines. More than 70% of all assets belong to these network systems.
The major parts of a transmission and distribution network systems are pipeline networks. These have a role to transport purified water from the purification plant to demand nodes with an adequate water pressure and without any deterioration in quality.
Since the water pipeline system is directly connected to the customers, malfunctions or accidents of pipelines immediately affect them. Customer trust depends on sustainable water supply services by an appropriate maintenance in a daily activity. Almost all structural components, except for valves and pipe bridges, are located underground making it difficult to do a visual inspection of these components.
The pipelines used for the transmission and distribution network systems for waterworks are classi-fied into asbestos cement pipe, lead pipe, cast iron pipe, rigid polyvinyl chloride pipe, steel pipe, stainless steel pipe, ductile cast iron pipe, and polyethylene. Buried pipelines are affected by traffic loads and suf-fer deterioration of the old pipe material. Asbestos cement pipe, lead pipe, and cast iron pipe deteriorate easily affecting their strength and making it difficult to maintain water purity. For these reasons, old pipes should be replaced as soon as possible.
It is important for the maintenance work of the water pipeline systems to keep hydraulic conditions of pressure, flow rate, and water quality together with protecting the leakage and emergent accidents by removing the deterioration factors.
14.1.2.2 causes of Pipeline Deterioration
Pipeline deterioration can occur at both the external and the internal surfaces of the pipe.
14.1.2.2.1 Causes of Deterioration of the Pipe’s External SurfaceThe aging of materials or loading repetitions play an important role in the deterioration of the external surface. On metal surfaces, such as cast iron pipe buried under the ground, corrosive soil can cause the corrosion shown in Figure 14.2 or the corroded bolts in Figure 14.3.
In the case of rigid polyvinyl chloride pipes and polyethylene pipes, organic solvents can externally corrode the pipes. Aging effect is not neglected for these pipes.
Water pipe bridges and bridge-attached pipelines that are exposed to the air can be corroded by any materials in the air, especially by salt content materials near the seashore.
Recently, many corrosion accidents have been reported that can be classified into three cases:
• Microcell corrosion by connecting different metals• Macrocell corrosion between steel pipe and its surrounding concrete as shown in Figure 14.4• Cathodic corrosion due to a stray current, such as from electric trains

278 Maintenance Technologies of Lifelines
There are many reported accidents of pullout joints that could be caused by corrosion at the joint portion in the excavation works by the third party near the pipeline. Since the water transmission pipeline is pres-surized, special attention should be paid to joint pullout failure, which could cause significant accidents.
14.1.2.2.2 Causes of Deterioration of the Pipe’s Internal SurfaceInternal corrosion does not occur in rigid polyvinyl chloride pipes and polyethylene pipes. Cast iron pipe and other metal pipes can be corroded at any interface that is covered with water. This corrosion effect produces iron rust as shown in Figure 14.5. This iron rust decreases the cross-sectional area of pipe and produces turbid water. The internal seal coat of the internal surface of ductile cast iron pipes often comes off and will be discharged from the faucet.
These corrosion phenomena are produced by pipe materials. Exact knowledge of the pipe’s material characteristics will be necessary for adequate maintenance and management. Iron rust might be created when a rapid flow in the pipeline takes off metal, such as manganese, which is attached to the internal pipe surface.
FIGURE 14.2 External corrosion of ductile cast iron pipes.
FIGURE 14.3 Corrosion of bolt and nut.

279Water Supply System: Maintenance Technologies
14.1.2.3 Maintenance to Prevent Leakage and Sudden Accidents
In order to prevent abrupt accidents or leakage accidents from water pipelines, both technical docu-ments from the construction stage activities, customers’ daily reports and pipeline inspection, and site petrol reports should be collected in order to know the exact situation of the pipeline facing any dif-ficulties. Based on this information, exact pipeline performance and capability can be estimated in the quantitative measures. Then adequate maintenance action should be executed.
14.1.2.3.1 Management of Pipeline InformationIn order to adequately determine the present situation of the pipeline network system, the pipeline con-figuration map prepared during the construction stage should be obtained. This map must include the following information:
• Construction year, diameter, length, bury depth, and location of pipes• Pipe (joint type, specification of internal lining and external coating, use of polyethylene sleeves
at the joint portion)
FIGURE 14.5 Corrosion at the internal surface of cast iron pipe.
FIGURE 14.4 Macrocell corrosion between concrete and steel pipe. (Corrosion occurred during 11 years follow-ing installation in 1980.)

280 Maintenance Technologies of Lifelines
• Pipeline-related equipment (valves, air valves, hydrants)• Permission numbers for occupancy of roads and rivers• Name of design engineers• Name of construction companies
GIS mapping system is effective to manage all the data on pipeline maintenance as shown in Table 14.1. This system can create various database for pipeline diagnosis.
14.1.2.3.2 Preservation of Permission for OccupancyAll the pipelines that are installed at roads, river crossings, and railway crossings are requested to get permissions for occupancy before the operation. These permissions must be adequately kept and always be prepared for the updated procedures.
14.1.2.3.3 Patrol and Inspection of PipelinesPeriodic patrol and inspection should be performed in order to find the accidents and to repair the damaged points of the transmission and distribution pipelines. The inspection priority level is estimated based on the importance and severity of the pipelines.
The damage inspection rule at an earthquake should be determined in advance based on the seismic intensity and magnitude of the earthquake. The inspection record book must be maintained.
Using the telemeter of the water pressure and flow, which are closely related, a leakage accident in the pipeline can be detected as shown in Figure 14.6. Early detection of pipe damage can be possible by developing an early detection system.
14.1.2.3.4 Provision for Leak Prevention SystemLeak protection measures are important in order to establish an effective water system that can reduce the environmental load. Leakage from the transmission and distribution pipelines causes economical loss of purified water from the purification plants, insufficient water supply by pressure loss, and con-tamination of polluted water from pressurized underground water. Leakage can also cause a cave in a road, invasion of water to houses, and traffic accidents due to a road surface freezing. Preparation of repair work for leakage accidents is important.
TABLE 14.1 Kinds of Diagnostic Information for Water Pipelines
Kinds Content
Pipe body Corrosion and damage at the outside and inside of pipeCorrosion of boltsDeteriorating of internal coating, carbonation of concrete liningPipe closure by iron rust formation
Buried environments Soil cover depthTraffic volumeCorrosive soil and possibility of unsettlementUnderground water tablePossibility of stray current
Hydraulic condition (water quality)
Water volumePressureQualityFlow direction
Accidents (claim information)
Date and location of accidentContent of accidentRepair and its coping methodEffect

281Water Supply System: Maintenance Technologies
14.1.2.3.5 Measures for Neighboring Construction by the Third PartiesA tape is installed on pipelines buried under roads based on the Road Traffic Act in Japan to identify the pipeline information such as name, type, company name, installation date, and so on. If any company finds an unidentified pipeline, the tape describing the identification information must be installed on this pipeline.
The tape color is given for each lifeline as shown in Table 14.2.When construction work is executed near the pipeline, the managing company of this pipeline must
have a conference in advance with the construction company and its related companies in order to con-firm the following information:
• Names of companies, the date, and the location• Specification of the water pipeline near the construction site (type of pipe, diameter, material,
installation date, location, and depth of installation)• Construction content (pipeline elongation, road construction or building construction, boring
data, and test boring)• Size, duration, and method of the construction (open-cut method, jacking-up method, shield tun-
neling method, chemical grouting method, and retaining wall method)• Effect to the water pipelines (exposed portion, necessity of a hanger, and its support)
If neighboring construction work can affect the existing water pipeline, the following protection works as shown in Table 14.3 are necessary.
The location of the existing water pipeline can be identified not only by the drawings of the complete book, but also by the location of gate valves and hydrants at the site that can be checked by a test boring.
Data value Alarm of pipeabnormality
Flow data
Pressure data
Time
FIGURE 14.6 Alarm on the abnormal relation between pressure and volume of the pipeline. (In the case of decreasing pressure or increasing volume, leakage accident will be possible.)
TABLE 14.2 Tape Colors for Lifelines
Lifelines Tape Color
Telephone RedElectric power OrangeWater BlueIndustrial water WhiteSewerage ChocolateGas Green

282 Maintenance Technologies of Lifelines
In the case of chemical grouting methods, the existing pipeline must be exposed by test boring, and the site location must be identified. If the location of the water pipeline is not identified, casing pipe or guided pipe must be installed to ensure the safety of the construction.
In general, the trench width is measured with a bed width and a pair of slopes with 45° where a back-filling soil or soil type is affected. The interval width between the neighboring two pipelines should be dependent on the pipe diameter and be more than 30–50 cm, which is estimated from the safety of the existing pipeline and working space for future repair works or branching works.
In on-site witnessing, the contents of the construction works must be checked based on the prior consulting items. It is preferable if any manuals describing the on-site witness of the other lifelines are pre-pared. Figure 14.7 is a typical example of the flow chart for prior consulting work to on-site witnessing work.
14.1.2.4 Maintenance of the integrity of Water Flow, Pressure, and Quality
The transmission and distribution pipelines are requested to supply the safety water treated from the purification plant in the adequate pressure and flow in the stable and effectively operational conditions. To satisfy this requirement, the control of water flow, pressure, and quality is extremely important. At an accident, drainage, or disaster event, the water supply to the customers must be carried out with fairness.
The operation of the transmission and distribution pipelines includes the water supply control and management at the water source, the purification plants and service stations, and the delivery adjust-ment of the water at the service area.
14.1.2.4.1 Water Supply Control and Management in the Main FacilitiesThe most effective operation is requested for the main facilities based on their own capability. The main facility includes water storage dams, intake plants, aqueducts, and purification plants. The following points in the water control operation of the pipelines must be taken into consideration: effective usage of original water source, minimum energy consumption, equalization of pressure deviation, reduction of residual chlorine density, and production inhibition of disinfectants such as trihalomethane.
Tele control with telemeter systems at service stations or pumping stations is used to operate the water flow, pressure, and quality.
14.1.2.4.2 Water Supply Control in Transmission and Distribution PipelinesWater supply control should be executed with attention to the mutual hydraulic conditions among the whole network, subnetwork in the blocks, and subnetwork between neighboring blocks. The pressure
TABLE 14.3 Kinds of Protection WorksProtection work
Suspension device To hang the pipe with a wireProtective support To support the pipe with membersStopper of vibration, protection of pulling out To protect the pipe vibration and pulled-out with protection devices
Other work besides protectionRelocation To relocate the pipe from the effective zone to the outsideTemporal piping To relocate the pipe for the temporal purposeReplace the pipe To replace from the old pipe to the new and seismically strong pipeTemporal stopping To stop the operation of the water supply during the protection workExpansion joint To install the expansion joint to absorb the displacementJoint reinforcement To reinforce the joint by specially designed steel cover or leak
protection deviceInstallation of emergency shut-off valve To install the emergency shut-off valveRepair of external coating To repair the damage by external coatingSetting of the settlement measurement bar To install a bar to measure the settlement

283Water Supply System: Maintenance Technologies
and flow in the service area are controlled by valve opening position control and pumping operations at the pump station.
In order to maintain the purified water service performance, various data on the water quality, pressure, and residual chlorine density in each service area must be collected. Then the cleansing and removing works of the dirty material from the pipelines should be carried out based on the collected data.
In the case of low pressure and low flow due to small distribution pipelines, increasing the pipe diameter or adding new pipeline or additional looping in the network is encouraged. If the actual water demand is less than the planned demand, the pipe diameter should be reduced to an adequate size.
Water quality should be daily tested or automatically measured.
Does the water facility have safety capacity?
Reconsideration on the construction method
*Check on the drawing *Check the affection to the water facility
Check the construction method
Is any security measure necessary?
*Keep a separation distance between the pipe and the others*Indication of the importance notice at the construction
Check the security measures
Provide the security measure
Check the construction to meet the agreement
Completion
Stop and re-discussion on the construction
On-site witnessing
Design of other construction companies
Check the mutual designs
FIGURE 14.7 Flow chart of on-site witnessing.

284 Maintenance Technologies of Lifelines
14.1.3 Retrofitting of Water Pipelines
Transmission and distribution pipelines occupy the major portion of the asset of the water network system. The construction cost is huge, and installation of the pipeline network needs much time to be completed. Given this background, the pipeline retrofitting project should be planned for long and medium term, and be executed based on the systematic and continuous process.
14.1.3.1 Purpose of Retrofitting for Water Pipelines
The retrofitting of water pipelines has been executed originally to prevent a leakage due to aging, to protect the burst failure of the pipe, to escape from the dirty water by rust formation, and to dissolve the bad water delivery. In recent situation, on the other hand, this retrofitting is carried out to reduce the residual chlorine density, to extend the direct supply area, and to reinforce the seismic performance.
In 2008, the Japanese code required improving improve the seismic performance of existing major pipelines including transmission and distribution pipelines. Those major pipelines must be retrofitted immediately. In addition, pipeline replacement is also required to prepare the emergent water service points at the disaster and to keep the water service lines to hospitals and their related medical facilities.
14.1.3.2 Procedure for the Planning of Water Pipelines
A general procedure for the planning of water pipelines is shown in Figure 14.8.
14.1.3.2.1 Basic InvestigationBasic investigation is taken to diagnose pipe situations based on the pipeline data. From this investiga-tion, the function of the pipeline is determined, and the effect of the malfunction is also evaluated. The priority of retrofitting plans of the pipelines can be given based on these investigation results.
Pipe information Basic investigation Estimation method
Completion drawingAccident reportsSite investigation
Role estimation Direct/indirect diagnosis Importance of pipelines
Main target (maintenance of network, seismic disaster prevention, water quality control)Street plan Water service planRelation with the other constructions
Coordination with other plansBasic planning
Determine the compre- hensive priority Selection of pipelines to be replaced Planning period Project cost and others
Execution plan
Decision of replacing method (water stopping method, construction period)
Retrofitting construction
Decision method of priority
Guideline for water businessReplacing guidelinesof water facilities
Finance planning
Selection of methodsFunction and importance
For pipeline evaluation
FIGURE 14.8 Flow chart of replacing plan for pipelines.

285Water Supply System: Maintenance Technologies
Asbestos pipe, lead pipe, and cast iron pipe that is too old should be replaced immediately, without need for investigation.
14.1.3.2.2 Basic PlanThe basic plan is executed to determine the priority of pipelines from the comprehensive retrofitting scheme that is evaluated on the basis of the investigating results. The total cost, period, and executing scheme for the retrofitting project must be prepared.
The priority of the pipelines can be determined by taking the following points into consideration: the compatibility with the purpose of the water supplier, the effect in the occurrence of earthquakes and accidents, the integrity with the city planning, and the consistency with the construction works by any other companies. For instance, Figure 14.9 is a sample of the prioritization method for deci-sion making. In this method, the score is given for the physical soundness and the importance of the pipelines.
14.1.3.2.3 Execution PlanningRegarding the basic plan, the execution plan must be discussed on the water suspension procedures, retrofitting methods, and construction periods.
14.1.3.2.3.1 Selection of Retrofitting Method The retrofitting method means to replace old pipe with new pipe. If the pipe diameter can be decreased to a smaller diameter, various trenchless methods are often adopted.
The most appropriate retrofitting method can be selected by taking the following points into consid-eration: water supply in the construction period, shortening the working period, preventing traffic jams during the working period, and reduction of cost. Figure 14.10 is a sample procedure for the retrofitting work. Figure 14.11 is a procedure for obtaining the water supply.
14.1.3.2.3.2 Water Supply Suspension Water supply suspension must be minimized in its duration and cycles in order to decrease the effect to the customers.
When a distribution flow is changed due to the restriction of the existing network configuration, the water suspension and service reduction cannot be prevented. To minimize these difficulties, various methods of nonsuspension water are proposed, in which branch pipe and gate valves are prepared for this work. This method can be applied for pipes with a diameter of more than 2000 mm. When the non-suspension method is discussed, the comparison between the suspension method and nonsuspension
Scor
e fro
m co
mpr
ehen
sive
phys
ical
eva
luat
ion
Order of priority
XII100
75
50
25
0 30 70 100
XI X
VIIVIIIIX
VI V IV
II IIII
Good
Minor improving
Systematic replacing
Immediate replacing
Score fromimportanceHigher
Importance measureMediumLower
FIGURE 14.9 Priority for pipeline replacing and its evaluation.

286 Maintenance Technologies of Lifelines
method must be investigated for cost, duration, and surrounding effect. Figure 14.12 shows a typical sample of the nonsuspension method.
A temporary pipeline installation method is generally adopted during an emergency to maintain water supply. This method is also used to minimize the water suspension period after an accident. The temporary pipeline should be selected to take the internal and external pressures as well as water quality from the structural point of view. It is important to minimize the cost by choosing the minimum diam-eter pipe to comply with the pressure conditions. The selected pipelines can be reused, and are easily joined to the existing pipelines, making them cost-effective. Stainless steel pipe and polyethylene pipe can be used for this purpose. Figure 14.13 shows a case in which a temporary pipeline is installed on the bridge in an earthquake disaster.
14.2 Maintenance and Management of transmission and Distribution Waterworks Facilities
14.2.1 inspection and investigation and Diagnosis and evaluation of transmission and Distribution Waterworks Facilities
In order to maintain the performance of transmission and distribution pipelines, inspection and inves-tigation are important. Based on the inspection and investigation results, the present performance and
Start
Replaced pipelinesLocationOther buried structuresHousing densityTraffic volumeConstruction environment
Possible to replace at the present site
Possible to adopt open cut method
(1) Ordinary open-cut method
(2) Relocate to other route
(3) Tunneling method
(4) Install new pipes in the existing pipeline
Execution plan
End
Leaving the old pipes(acceptance by the
owner)
FIGURE 14.10 Flow chart for the selection of pipeline replacement methods.

287Water Supply System: Maintenance Technologies
Start
No No
Yes Yes
Collect information (stand-by performance, bypass route,available construction period)
No service in long term
No service in short term
Change the construction to the other pipelinesNonwater suspension method
Work under water stopNot applied to the main line
Short stop of water supply Change the replacement
Back-up functionSetting of un-service section and periodEmergency scheme
Water service during the workCoordination with the related agenciesAdvertising to the customers
End
FIGURE 14.11 Flow chart of water supply service during the replacing construction.
(a)
(b)
(c)
(d)
FIGURE 14.12 Example of non-water-stopping method (in the case of branch pipe installation). (a) Setting the drilling machine (set gate valve and drill machine to the main pipe, then open the gate valve); (b) drilling; (c) completion (pull out the drilling machine and close the gate valve); and (d) restart the water service.

288 Maintenance Technologies of Lifelines
functional capability should be quantitatively assessed, based on which appropriate repair and retrofit action can be adopted.
When the maintenance strategy of the transmission and distribution pipeline is considered, it is important that not only the structural performance of pipelines on their strength and durability, but also the functional capability of the major pipeline network system in the comprehensive waterworks system should be assessed.
14.2.2 Role evaluation of transmission and Distribution Waterworks Facilities
The distribution network system has a role to bring water from transmission pipes to the demand nodes, to distribute from the storage reservoirs to a subnetwork of distribution systems and to supply purified water to the customers. Storage reservoirs can control the pressure and flow rate to absorb the temporal deviation of water demands in daily operations and to absorb the hydraulic changes at the location of accidents.
When the existing waterworks facilities are assessed on their performance, it should be determined that those facilities can be operated in effective and economical requirements, be durable for the seismic loads, and be sustainable for uncertain future severities.
The following conditions are preferable for the waterworks facilities:
14.2.2.1 Distribution Area
The distribution area is expected to have the following hydraulic and geotechnical conditions:
• The distribution area is lower than the site elevation of purification plants or storage reservoirs.• The spatial variation of flow rate and pressure is small in the distribution area.• The area size is adequate for easily controlling the water flow and pressure with minimal energy
loss in the flat service area.
FIGURE 14.13 Temporary pipe laying in the 2007 Niigata Chuetsu-Oki earthquake.

289Water Supply System: Maintenance Technologies
14.2.2.2 Storage Functions
Storage reservoirs should have enough capacity to absorb the temporal fluctuations in the daily use and have a good performance of the purification and water supply in the emergency or accidental use.
If the reservoir capacity is too large, deterioration of water quality due to retaining water or increased disinfection byproducts due to trihalomethane could develop. The reservoir tanks should have a volume consistent with the demand volume of the distribution area.
14.2.2.3 transportation and Distribution Functions
Transportation and distribution of water are executed by various pipelines such as transmission pipe-lines, distribution mains, and distribution pipelines. Transmission pipelines convey purified water from the purification plant to the reservoir tanks. Distribution mains are pipelines from reservoir nodes to the nodes connected to the distribution network. The distribution network supply water to the service areas, and customer can obtain water from the distribution pipeline by the service lines.
In order to achieve water supply by transmission and distribution pipelines, pumping stations and reservoirs should be easily operated in controlling water pressures. But in order to prevent excess pressurization and extreme water flow rate, these operational functions must be separated from the pipeline.
When a transmission pipeline or a distribution main is very important, networking and redundancy scheme are introduced, and seismically strong pipelines are adopted.
The distribution main pipelines must have the capacity for the distribution flow to the demand-ing areas and additional capacity for accidents. The neighboring network mains should be mutually connected.
14.2.2.4 Water Service Function
The distribution pipeline is used to maintain adequate water flow, pressure, and purification quality. Network is formed to comply with the ground surface elevation and to remove the dead end pipes. The distribution pipe that includes a pipeline with a large diameter from the first gate valve to the service lines is also seismically strong.
If a service line is installed in parallel along the road, the distribution pipeline is intentionally installed to improve the seismic capacity instead of the service line.
14.2.3 Functional evaluation of transmission and Distribution Waterworks Facilities
The functional evaluation should be given for the following points:
14.2.3.1 Analysis of Distribution Flow
Distribution flow analysis is classified by water usage shown in Table 14.4 in order to evaluate the perfor-mance of the transmission and distribution pipelines. The analytical data are very useful for the water-works system management. The most important data are effective water ratio, which can be defined as the ratio of leakage per normal flow.
14.2.3.2 energy consumption and Personnel cost
One of the criteria to assess effective uses of transmission and distribution system facilities is to compare the energy consumption and personnel cost of the system with that of other similar types of operation companies.
The energy consumption is investigated for the annual change of electric power consumption. The energy consumption rate is defined as the ratio of annual electric power consumption for annual

290 Maintenance Technologies of Lifelines
distributed water volume. If the energy consumption rate has increased, the reason and the saving coun-termeasure for this increasing result must be examined.
By comparing the personnel cost per the energy consumption rate of other companies, it is possible to check the effective use of the system facilities. Based on these data, easy and economical manage-ment of the facilities should be investigated and also the possibility of automated operation must be studied.
14.2.3.3 Water Supply Services
Transmission and distribution system facilities are assessed because of water supply service for the cus-tomers who request the safe and accessible drinking water.
The safe drinking water supply is the most important issue in water service. To maintain this water service, several preventive measures are executed to remove iron rust, to eliminate contaminants, and to decrease the density of residual chlorine.
Small water tanks are often managed inadequately, and its water quality cannot cover the standard criteria. Increased water pressure together with the extension of direct water supply areas can solve this problem.
Problems with the water supply service can be estimated with the ratio of recorded complaints per total number of customers.
14.2.3.4 Accidental effect Such as earthquakes and other events
When an earthquake or sudden accident occurs while any installation works are under construction, the water supply services as a lifeline network system must be maintained.
TABLE 14.4 Analytical Table for Distribution Water
Item 1 Item 2 Item 3 Item 4 Content
Distribution water
Effective water Accounted-for water
Volume for charge
Volume for chargeApproved volume
Water for separate use
Separate volume used for the other water firm
Others Volume for park useVolume for a public lavatoryVolume for hydrantOthers (volume for the maintenance paid from
the other party)Nonrevenue
waterMeter intangible
flowWater not to be charged due to meter
intangible flowWater volume
for business useWater for pipe cleaning, water for leakage
protection workOthers Volume for park use
Volume for a public lavatoryVolume for hydrantOthers (volume for the maintenance paid from
the other party)Unavailable
waterDeduced
consumptionWater for deduced consumption due to red
waterLeakage volume Leakage water in the distribution main
Leakage water in the distribution networkLeakage from the service pipe
Others Water volume produced from uncertain causes or from other damaged plant

291Water Supply System: Maintenance Technologies
The vulnerability of the water supply system can be assessed with the damage occurrence rate or the suspension rate for the scenario earthquake. The effect of a sudden accident is assessed by the number of customers who cannot obtain water supply services or are suffered by low pressure and dirty water. The effective area of the secondary disaster is an important point for the damage assessment of a water sup-ply system. Once the damage is predicted for a future earthquake, several disaster mitigation measures, including pipe replacement methods can be prepared.
14.2.4 Functional evaluation and Diagnosis for transmission and Distribution Pipelines
Generally, the transmission and distribution pipeline system is composed of reservoirs, water towers, elevated tanks, pumping stations, transmission pipelines, distribution mains, distribution pipelines, valves, and their related equipment.
Functional evaluation and diagnosis for water supply systems must be applied not only to the plant, facilities, and their related equipment, but also for the pipeline network systems. The evaluation of the network system of transmission and distribution pipelines can be executed using the method described in Sections 14.2.2 and 14.2.3. On the other hand, the functional evaluation and diagnosis for the plant, facilities, and their related equipment can be done as follows:
For reservoirs, water towers, and elevated tanks, the functional evaluation and diagnosis should be executed based on the investigation of cracks in the concrete surface, carbonation, leakage from joints, and corrosion of steel bars and plates. The settlement of the basement and its surrounding ground sur-face should be measured to assess the durability and seismic capacity of the whole structure. The seismic capacity of structures should be evaluated based on both the static and earthquake-induced dynamic stresses, as well as the unsettled ground displacement.
Daily and periodic maintenance with detailed examinations are necessary to adequately operate the pumping equipment. The periodic intervals and inspection items are dependent on the pumping opera-tional conditions, size of equipment, and control methods. Deterioration diagnosis of pumping equip-ment requires insulation resistance and vibration tests once or twice per year.
Since the transmission and distribution pipelines make up more than 70% of the water supply system, a long-term and a large investment is necessary for the retrofitting work of the system. So the functional evalu-ation and diagnosis of the present system are extremely important to obtain suitable adequate maintenance.
It should be noted that the reliability of the transmission and distribution pipeline network system is based on the safety of pipe elements that are connected in a series system in one link, and on the safety of links that are interconnected in a redundant way of the network. So the safety level of the pipe elements must meet the safety requirement of the whole network system.
The method of diagnosis is divided into the direct method and the indirect method. The direct method is to investigate the pipe states directly by physical methods. This method is expensive but pro-vides detailed results. The indirect method is an economical approach using the daily maintenance data together with the reports from the direct method. Both methods can be adequately selected to meet the investigating conditions of the pipelines.
14.2.4.1 Direct Diagnosis
This method is used to directly investigate pipe conditions with high accuracy. This method is used only when the indirect method cannot be applied to check the condition of the pipes. The investigation points are as follows:
• External pipe surface (existence of polyethylene sleeve lining, existing coating, corrosion, residual wall thickness)
• Internal pipe surface (coating, rust, mortar lining condition, narrowed cross-sectional area of the water flow in the pipeline)
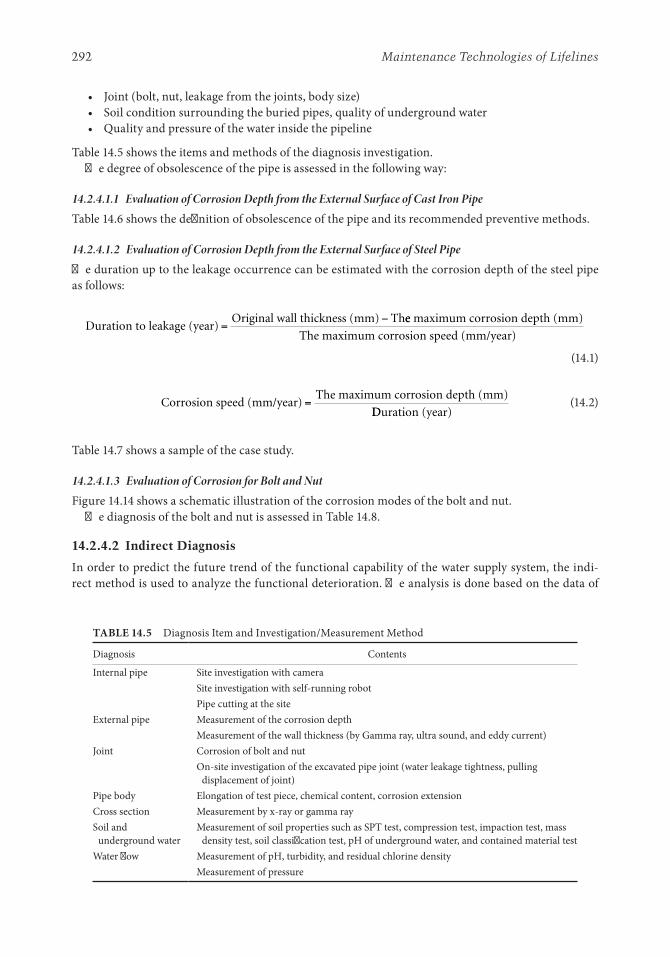
292 Maintenance Technologies of Lifelines
• Joint (bolt, nut, leakage from the joints, body size)• Soil condition surrounding the buried pipes, quality of underground water• Quality and pressure of the water inside the pipeline
Table 14.5 shows the items and methods of the diagnosis investigation.The degree of obsolescence of the pipe is assessed in the following way:
14.2.4.1.1 Evaluation of Corrosion Depth from the External Surface of Cast Iron PipeTable 14.6 shows the definition of obsolescence of the pipe and its recommended preventive methods.
14.2.4.1.2 Evaluation of Corrosion Depth from the External Surface of Steel PipeThe duration up to the leakage occurrence can be estimated with the corrosion depth of the steel pipe as follows:
Duration to leakage (year)
Original wall thickness (mm) Th=
− ee maximum corrosion depth (mm)
The maximum corrosion speed (mm/year)
(14.1)
Corrosion speed (mm/year)
The maximum corrosion depth (mm)=
DDuration (year) (14.2)
Table 14.7 shows a sample of the case study.
14.2.4.1.3 Evaluation of Corrosion for Bolt and NutFigure 14.14 shows a schematic illustration of the corrosion modes of the bolt and nut.
The diagnosis of the bolt and nut is assessed in Table 14.8.
14.2.4.2 indirect Diagnosis
In order to predict the future trend of the functional capability of the water supply system, the indi-rect method is used to analyze the functional deterioration. The analysis is done based on the data of
TABLE 14.5 Diagnosis Item and Investigation/Measurement Method
Diagnosis Contents
Internal pipe Site investigation with cameraSite investigation with self-running robotPipe cutting at the site
External pipe Measurement of the corrosion depthMeasurement of the wall thickness (by Gamma ray, ultra sound, and eddy current)
Joint Corrosion of bolt and nutOn-site investigation of the excavated pipe joint (water leakage tightness, pulling
displacement of joint)Pipe body Elongation of test piece, chemical content, corrosion extensionCross section Measurement by x-ray or gamma raySoil and
underground waterMeasurement of soil properties such as SPT test, compression test, impaction test, mass
density test, soil classification test, pH of underground water, and contained material testWater flow Measurement of pH, turbidity, and residual chlorine density
Measurement of pressure

293Water Supply System: Maintenance Technologies
TABLE 14.6 Diagnosis Cast Iron Pipe Bodies
Rank of Obsolescence Definition Measures
I Corrosion passing through the wall thickness Emergent action such as replacing is necessary, because the remaining thickness is not guaranteed.
Corrosion depth > designed thickness tolerance
II Safety factor (SF) should be <1.0 Emergent action such as replacing is necessary, because SF of 1.0 for the loads such as static pressure, dynamic pressure, and external pressure is not guaranteed.
Designed thickness tolerance ≥ corrosion depth > designed thickness tolerance − the net wall thickness (A)
III Safety factor should be >1.0 and <2.0–2.5 Since SF of 2.5 for static pressure, and SF of 2.0 for dynamic pressure, and external pressure is not guaranteed, comprehensive diagnosis and assessment are necessary. If necessary, additional investigation is requested. The replacing plan for important pipeline is specially considered.
Designed thickness tolerance − the net wall thickness (A) ≥ corrosion depth > designed thickness tolerance − the net wall thickness (B)
IV Safety factor should be more than 2.0–2.5, and corrosion depth allowance is more than 2.0 mm
Since the corrosion will be developed, the same diagnosis should be done within 10 years.Designed thickness tolerance − the net wall
thickness (B) ≥ corrosion depth > allowable wall thickness (2.0 mm)
V Corrosion allowance of 2.0 mm is greater than the corrosion depth
The corrosion allowance of 2.0 mm affords the corrosion defect.
Notes: The wall thickness (A) is calculated from SF = 1.0 for static pressure, water pressure, soil pressure, and traffic load. The wall thickness (B) is calculated from static load of SF = 2.5, and water pressure, soil pressure, and traffic load of SF = 2.0.
TABLE 14.7 Deterioration Rank for Coating/Lining Steel Pipe
Deteriorating Rank Year (y) to the Corrosion Evaluation
I y ≤ 5 Measurement is necessaryII 5 < y ≤ 10 Notify for the important pipeII 10 < y Pay attention to the pipe
Ring portion
Flange portion
Bolt in the buried condition
(a) (b)
Corroded stages
(c) (d)
FIGURE 14.14 Schematic illustration of corroded stages of bolts: (a) heavy, (b) moderate, (c) minor, and (d) none.
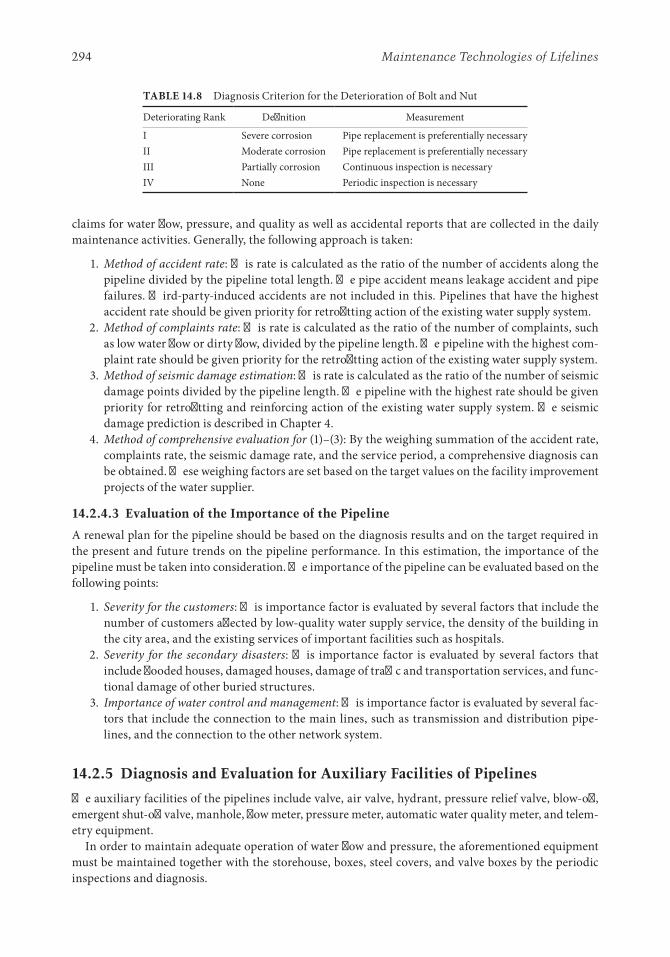
294 Maintenance Technologies of Lifelines
claims for water flow, pressure, and quality as well as accidental reports that are collected in the daily maintenance activities. Generally, the following approach is taken:
1. Method of accident rate: This rate is calculated as the ratio of the number of accidents along the pipeline divided by the pipeline total length. The pipe accident means leakage accident and pipe failures. Third-party-induced accidents are not included in this. Pipelines that have the highest accident rate should be given priority for retrofitting action of the existing water supply system.
2. Method of complaints rate: This rate is calculated as the ratio of the number of complaints, such as low water flow or dirty flow, divided by the pipeline length. The pipeline with the highest com-plaint rate should be given priority for the retrofitting action of the existing water supply system.
3. Method of seismic damage estimation: This rate is calculated as the ratio of the number of seismic damage points divided by the pipeline length. The pipeline with the highest rate should be given priority for retrofitting and reinforcing action of the existing water supply system. The seismic damage prediction is described in Chapter 4.
4. Method of comprehensive evaluation for (1)–(3): By the weighing summation of the accident rate, complaints rate, the seismic damage rate, and the service period, a comprehensive diagnosis can be obtained. These weighing factors are set based on the target values on the facility improvement projects of the water supplier.
14.2.4.3 evaluation of the importance of the Pipeline
A renewal plan for the pipeline should be based on the diagnosis results and on the target required in the present and future trends on the pipeline performance. In this estimation, the importance of the pipeline must be taken into consideration. The importance of the pipeline can be evaluated based on the following points:
1. Severity for the customers: This importance factor is evaluated by several factors that include the number of customers affected by low-quality water supply service, the density of the building in the city area, and the existing services of important facilities such as hospitals.
2. Severity for the secondary disasters: This importance factor is evaluated by several factors that include flooded houses, damaged houses, damage of traffic and transportation services, and func-tional damage of other buried structures.
3. Importance of water control and management: This importance factor is evaluated by several fac-tors that include the connection to the main lines, such as transmission and distribution pipe-lines, and the connection to the other network system.
14.2.5 Diagnosis and evaluation for Auxiliary Facilities of Pipelines
The auxiliary facilities of the pipelines include valve, air valve, hydrant, pressure relief valve, blow-off, emergent shut-off valve, manhole, flow meter, pressure meter, automatic water quality meter, and telem-etry equipment.
In order to maintain adequate operation of water flow and pressure, the aforementioned equipment must be maintained together with the storehouse, boxes, steel covers, and valve boxes by the periodic inspections and diagnosis.
TABLE 14.8 Diagnosis Criterion for the Deterioration of Bolt and Nut
Deteriorating Rank Definition Measurement
I Severe corrosion Pipe replacement is preferentially necessaryII Moderate corrosion Pipe replacement is preferentially necessaryIII Partially corrosion Continuous inspection is necessaryIV None Periodic inspection is necessary

295Water Supply System: Maintenance Technologies
The inspection and diagnosis of the distribution pipelines are executed for the entire area covering the water services. But the inspection and diagnosis of main pipelines, such as transmission and distri-bution mains, are carried out along the pipeline routes. When inspection work is executed inside a valve vault, precautions for oxygen concentration and poisonous gas are necessary. Ventilation is important during this inspection work in the valve vault.
14.2.5.1 Valve
A valve is used to control water flow and pressure, to stop water flow during installation work, and to divide the distribution service areas into several blocks. In the valve box or valve vault, as shown in Figure 14.15, valve information should be recorded on a bulletin board on which valve number, rotat-ing direction, and rotation cycles are indicated. In order to prevent mistakes, a board such as shown in Figure 14.16 is used to indicate the valve opening states, whether open or not.
Valves used in main pipelines should be periodically inspected, during which cleaning, oiling, and operational checking of the rotational part must be executed as a maintenance work. Rainfall water and dirty water in the valve vault must be removed. Any valve that has not been operated for a long period of time must be checked on the rotational part and be recovered for daily operational use. Especially for the main valves used in the transmission pipelines, the ledger shown in Table 14.9 is recommended to make a report as a historical database of valve operations.
14.2.5.2 Air Valve
Air valves are used to remove air that enters the pipeline or is removed from the water. During water discharge in the pipeline installation site, air valves are used to absorb air.
In the air valve, a float valve shown in Figure 14.17 is often shielded to the valve seat with a gum pack-ing. In order to release the air flow through the float valve, the inspection and maintenance should be fully conducted.
When an air valve is installed along a road, it is often installed under the road, where the air valve may absorb the dirty water and rust in the valve vault. So the valve vault must always be kept clean. The air valve should be installed locally at the highest point such as a riser corner from the underground
Valve specification
Name of route: Valve no.:
1. Diameter and type of valve Diameter mm, Type: Made by metal material: Manufactured by Date:
2. Rotation for opening
3. Torque for operation a. Pressure difference b. Maximum effective torque c. Torque limiter for opening hand
4. Reduction gear a. Type b. Cam angle indicator c. Manufacturing company
Setting dateOffice
FIGURE 14.15 Panel of valve specification.

296 Maintenance Technologies of Lifelines
pipeline to the pipe bridge. If the gum packing material is covered by dust or iron rust, air shielding effect is lost, and water leakage is caused from the air valve.
Corrosion of bolts and nuts that fix the air valve to the pipe body must be checked.
14.2.5.3 Hydrant
Hydrants are used not only for fire-fighting water but also for measuring water flow and pressure, wash-ing the distribution pipelines, and discharging of dirty water. Periodic inspection and investigation of hydrants are necessary, and if any fault point is found, it should be repaired immediately. All steps of
Full open state (indicated on spindle with red color in the triangle form)
Valve no. written on the iron coverCare for deficiency of oxygen
Opening limit on spindle with yellow color in the half circle form
FIGURE 14.16 Valve aperture at the site.
TABLE 14.9 Ledger of Main Pipelines
Valve No. Location Purpose
Pipe diameter
mm Valve diameter mm Subvalve dia. mm
Name Cycle Valve revolution Cycle Subrevolution CycleInstallation Year/
monthValve material CIP/Steel Factory name
Operating record
Year/month/day Hour
Main valve Subsidiary valve
Open cycles Close cycles
Present opening
Open cycles Close cycles
Present opening Remarks
(Drawing)(Remarks)

297Water Supply System: Maintenance Technologies
repair works such as finding, starting, and finishing must be reported to the firehouse. When a hydrant will be disturbed due to construction work, advanced notification of this matter must be submitted to the firehouse.
14.2.5.4 Relief Valve
When a certain level of pressure gap occurs because of various elevations in the water distribution area, the relief valve is installed to reduce the leakage risk due to high pressure or to protect water hammer phenomenon. As the relief valve is sensitive, even a small amount of sand, dust, or iron rust could dis-turb proper operation of the relief valve. Important relief valves must be installed in valve vaults, and its water pressure should always be monitored by telemetry system. Periodic inspection and maintenance are necessary. Bypass pipes and gate valves should be installed as shown in Figure 14.18 for easy mainte-nance work. Discharge pipe should be equipped in the bypass line as shown in Figure 14.18.
14.2.5.5 Blow-off
Blow-off should be installed at the bottom of the pipe to remove various kinds of admixture and to dis-charge or intake water during the construction stage. The discharged water is conveyed to the nearest river or drain. Since the original profile and capacity of the blow-off pipe might be different, periodic inspection and investigation of the blow-off as well as the drains are necessary.
In the distribution network, hydrants are often used as blow-off points. So the blow-off itself is installed at the limited point such as undercrossing site. In main pipelines on the other hand, blow-off is installed for water discharge and intake during the pipeline construction period. The adequate number of blow-off is located to obtain the discharge to the nearest river or drain. It means that the location of blow-off does not meet the requirement on the adequate arrangement of blow-off for future maintenance
(a) (b) (c) (d)
Large air hole Cover
Small air holeMoving valve
Floating valve
FIGURE 14.17 Mechanism of air valve. (a) During filling water, floating valve is closed. The air is exhausted from the large air valve. (b) After filling water, float valve is opened. Both air valves are closed. (c) When air staying, float valve is down. Air is exhausted from small air valve. (d) When internal pressure is lower than air pressure by drain-age, floating valve is down, and air comes through large air hole.
Direction of flow
To sewerage line Reducing valveGate valveDrainage chamber
FIGURE 14.18 Configuration of reducing valve, related valves, and bypass pipe.

298 Maintenance Technologies of Lifelines
or on the emergent discharge from the blow-off at the water quality accident. Since blow-off is necessary to maintain water quality, the most appropriate allocation plan of blow-off should be prepared.
14.2.5.6 Flow Meter, Pressure Meter, Automated Water Quality Meter, and telemetry System
Flow meters and pressure meters are indispensable equipment to control water flow in the network and to operate the water supply in severe service conditions. Since the accumulated data of water flow and pressure are important for operation and distribution control, periodic calibration of these meters is necessary to keep them in high accuracy of measurement.
Automatic water quality monitoring equipment is useful to measure continuous deviations of dis-tribution water flow, which will be effective for rapid response in the case of emergent accident. During the periodic inspection and maintenance, the automatic calibration devices and washing equipment for the sensors should be carefully checked, and repaired if necessary. Telemetry systems for water flow, pressure, and automatic water quality monitors are necessary to make adequate control and operation in water supply services. Periodic inspection and investigation for the cable network are also necessary.
14.2.5.7 emergency Shut-off Valve
Emergent shut-off valves are used to automatically close the valve in emergency situations, to reduce the secondary disaster, and to prevent water loss from storage tanks. This valve should be installed at the outlet of the reservoir and storage tanks. The control criterion of this valve depends on the site condi-tion. Extreme flow rate or extreme seismic load in terms of gravity acceleration is a typical indicator of the control criterion. Since the emergency shut-off valve must be operated in case of accident, the inspection and investigation should be carefully checked for its emergency use.
14.2.5.8 Steel Plate and others
Steel plates are used to cover manholes. A slight gap between the steel plate and the surrounding road surface may disturb any transit by passengers and traffic vehicles. Also, this gap produces a noise, so local residents may make a lot of complaints. Figure 14.19 shows a sample of diagnosis for steel plates.
When a valve box or valve vault deteriorates, cracks will be produced in its wall, and all equipment in the box is corroded. This damage of the valve box and valve vault might also produce cracks in the road surface. All these auxiliary equipment must be maintained properly for avoiding the bad effect to the road.
14.2.5.9 examples of evaluation and Diagnosis
Table 14.10 shows a sample result of diagnosis and investigation of the auxiliary equipment.
(b)
d d
d
(f)(d)
(a)gap
d d d d
(e)(c)
FIGURE 14.19 Diagnosis of iron cover and gap. (a) Type 1 (cover is higher); (b) type 2 (cover is lower); (c) type 3 (pavement is higher); (d) type 4 (pavement is lower); (e) type 5 (cover is lean to pavement); and (f) type 6 (cover is lean to pavement).

299Water Supply System: Maintenance Technologies
14.2.6 Diagnosis and evaluation of Water Pipeline Bridges and Pipeline-Attached Bridges
Pipe bridges or pipeline-attached bridges are used when pipelines need to cross over rivers, aqueducts, roads, and railways. It is easy to find any damage on the pipe surface and structural elements of a pipe bridge. But it is difficult to find damage on pipeline-attached bridges, because there are many limitations for the site inspection and observation. For these reasons, the periodic inspection and investigation are necessary especially for the pipeline-attached bridge.
In pipe bridges, settlement of abutment and bridge piers, cracks in concrete piers, damage to pro-tective piles by the impact of floating substances, leakage from air valves, and damage to expansion joints must be periodically inspected and investigated. In pipeline-attached bridges, deterioration of pipe holders due to vibration by traffic loads must be checked.
In seaside areas, effect of salt damage by seawater must be inspected.
14.2.6.1 Periodic Repeated coating
Exposed portions of pipelines such as pipe bridges are mostly composed of steel pipelines due to their ease of construction. Protective coated pipelines deteriorate from repeated temperature differences on the inside due to water temperature and also on the outside due to air temperature. The coating on the structural surfaces must be periodically coated.
Standard coating specifications for water pipelines should be repeated every 5–6 years. This interval depends upon the coating materials and site conditions. The Japanese Water Steel Pipe Association (WSP)
TABLE 14.10 Evaluation and Diagnosis of Auxiliary Equipment
Item Definition
A Plants are deteriorated, so immediate retrofitting is necessary.B Plants lost effective functional performances, so retrofitting will be necessary.C Plant is slightly damaged, so retrofitting will be necessary in the future.
Evaluation
A B C Buried A cover that is buried cannot be
identifiedOpening/closing
of cover plateImpossible to open/close covers Possible to operate the
valve, but the opening of cover is limited.
The cover is attached to the girder rail, but the valve rod can be operated.
Impossible to operate the valve to open/close the cover
Rattle Make a noise due to rattle Make a noise.Indication of
coversWrong indication or no
indication.Damage of covers Damages at the hinge and pin Cracking and damages
except for evaluation A.Damage of key hole.
To disturb the traffic by cracking and damages
Muddy Buried air valveDamage of valve
vaultImpossible to open the valve by
gaps of valve boxDamage and corrosion
of valve box, ladder, trap, stopper, and scour-protection board.
To operate the valve rod in the valve box.
No equipment such as scour-protection plate, ladder, and trap
Operational damage
Impossible to set the hydrant hose Significant damage and corrosion of grand bolts and handles.
Moderate corrosion of bolt and nut.
Impossible to operate the valves of a hydrant
Deformed valve rod or lack of valve head.
Corrosion of valve box.
Damage of cover of the air valve.

300 Maintenance Technologies of Lifelines
issued coating recommendation WSP 009-2004, where the period of coating is suggested, and also coat-ing record should be displayed in the bridge as shown in Figure 14.20.
Recently, stainless steel pipelines have been adopted for pipe bridges and pipeline-attached bridges. This is because stainless steel pipe seems to be cost-effective for the maintenance total cost that includes initial installation and operating costs. It should be noted that stainless steel pipe is not always free of stain. Adequate maintenance is necessary even for stainless steel pipelines.
14.2.6.2 Seismic Assessment
Since pipe bridges and pipeline-attached bridges belong to important pipelines, seismic damage of the bridge might extend the suspension of water flow services to the whole network system. Because of the difficulties in immediate procurement, a period of several months is necessary for restoration work. So, based on the seismic diagnosis, any reinforcement and replacements must be carried out.
Direct diagnosis should be executed according to the guidelines of water pipeline seismic design by Japan Water Works Association (JWWA). If the direct diagnosis is difficult for all the bridges in its inspection cost, the approach with two alternatives is shown in Tables 14.11 and 14.12. The approach includes the initial screening for all the equipment and the repair for the remaining equipment. They are based on the practical diagnosis guidelines of waterworks facilities for an earthquake occurring under or in the vicinity of the urban area as shown in Tables 14.11 and 14.12.
14.2.7 Seismic Assessment of Main transmission Pipelines
The main pipelines such as transmission and distribution pipelines should always be in service. As a result, these main pipelines have not been investigated for a long term since its construction.
The diagnosis and investigation of main pipelines should be executed based on the order of impor-tance and the deterioration stage of each pipeline. The indirect diagnosis method is used for the initial inspection, and then the direct diagnosis method should be adopted for seismic diagnosis planning.
In the seismic prevention planning of the main pipelines, the seismic performance of the whole net-work system should be taken into consideration. When a replacement of the old pipeline is necessary, the redundancy of the network system should be taken into account.
14.2.8 electrolytic corrosion investigation
When a pipeline is installed under or in the vicinity of a railway, stray current corrosion from the railway must be inspected to protect the electrolytic corrosion. If necessary, cathodic protection
Name of bridge: Date of coating work: Diameter1. Diameter2. Pipe Manufactured by3. Coating work companies Under coating Middle coating Upper coating4. Coating materials Under coat supplied by Middle coat supplied by Upper coat supplied by
FIGURE 14.20 Panel of coating records.

301Water Supply System: Maintenance Technologies
TABLE 14.11 Diagnosis of Simplified Seismic Performance of Pipe Bridges
Item Condition Weight Range Remarks
Soil Type I 1.0 1.4 Type I: a good diluvial ground or rock site.
Type II 1.4 Type II: a ground not to belong to types I and II.
Type III 1.2 Type III: soft ground in the alluvial ground.
Effect of permanent ground displacement
None 1.0 3.0 Permanent ground displacement due to liquefaction, effect to the bridge foundation due to slope failure.
Likely 2.0Definitely possible 3.0
Foundation Use piles 1.0 1.4 Footing foundation supported by piles is defined as pile support, but the wood pile and direct foundation is not defined as the pipe support.
Use not piles, but pile bent
1.4 PC well, caisson, and its equivalent are defined as a pile support.
Material of abutment and pier Bricks, plain concrete
1.4 1.4 Gravity abutment with plain concrete whose strength is verified is not included in the others.
Others 1.0
Height of bridge pier H < 5 (m) 1.0 1.7 The height means elevation from the ground surface. The height of the bridge piers is the height from the river basement.
5 ≤ H ≤ 10 (m) 1.4H > 10 (m) 1.7
Girder type Both fixed ends, arch, rahmen
1.0 3.0 In the case that both ends are restrained with concrete.
Beam of fixed and free ends, continuous beam
2.0 The support type should be continuous.
Simple beam 3.0 The support type should be a simple support. (Langer, truss, and Rose girders are included in this type).
No. of span N = 1 1.0 1.8 For the continuous beam, the span composed of continuous support piers is defined as one span. In the case that two sets of three-span continuous beam is defined as two span herein.
N ≥ 2 1.8
Pipe material Steel pipe (SP) 1.0 2.4 For the weight factor for the CIP, comparatively larger weight value is assigned, because the strength of CIP is lower than that of SP and DCIP.
Ductile cast iron pipe (DCIP)
1.0
Cast iron pipe (CIP) 2.4
Support Safety gear 0.6 2.0 The case of both fixed ends is applicable.
Standard 1.0Movable 1.2 The case of no fixed shoe is
applicable.(Continued)

302 Maintenance Technologies of Lifelines
should be installed. There are three typical methods of cathodic protection: impressed current protec-tion, sacrificial anode protection, and forced electric drainage protection.
In the inspection of cathodic protection equipment, the following items are checked: the change of stray current, the sacrificial anode current, and the earth potential to the pipeline.
14.3 Leakage Protection technologies
14.3.1 General Remarks of Leakage Protection
The prevention of water leakage is very important for the effective management of water supply.In leakage protection planning, a supply–demand relationship between the supply source and cus-
tomers, cost for leak protection work, and its economical efficiency must be taken into consideration. Then a possible and higher target for the water leak protection should be prepared successfully to com-plete the leak prevention work.
During leak protection work, the following three methods should be integrated:
• Basic analyses such as water distribution analysis and cause analysis of leakage• Adoption of the makeshift method of leakage detection and repair above- and an underground• Execution of the preventive measures by the improvement of distribution and service pipes
Since, by the makeshift method, leakage problems cannot be solved, adequate cause analysis of leakage and preventive approach are important.
TABLE 14.11 (Continued) Diagnosis of Simplified Seismic Performance of Pipe Bridges
Item Condition Weight Range Remarks
Width of crown (A/S ≥ 1) Wide 0.8 1.5 For bridge length less than L = 100 mm, the width of crown is defined as wide.
(A/S < 1) Narrow 1.2 S = 0.5L + 20, A = actual distancePipe joint
Expansion joint (steel pipe)Closer (eccentric) 0.8 2.5 The joint of flexible bending
capacity is estimated to have higher safety, while the joint of short displacement is estimated to have lower safety. Victaulic joint is equal to be a mechanical joint.
Bellows (eccentric)Closer and bellows 1.0Dresser and sleeve 1.5Mechanical joint,
none2.0
Ductile cast iron pipe, cast iron pipe
Expansion type, restraint joint type
0.5 2.0 The joint of expansion type or restraint type is estimated to have higher safety. So small factor is assigned.
Others 1.0
Seismic intensity of JMA
V 1.0 3.6 It depends on the seismic intensity of Japan Meteorological Agency (JMA).
VI 2.2VII 3.6
Criterion of seismic assessment
High y < 14 No damage.Medium 14 ≤ y ≤ 28 Water service is possible even if
there are any damages.Low 28 < y Water service is impossible
because of significant damages.
Note: The range is calculated as the ratio of the maximum weight factor divided by the minimum weight factor.

303Water Supply System: Maintenance Technologies
TABLE 14.12 Diagnosis of Simplified Seismic Performance of Pipe-Supported Bridges
Item Condition Weight Range Remarks
Soil Type I 1.0 1.4 Type I: a good diluvial ground or rock site.Type II 1.4 Type II: a ground not to belong to type I
and II.Type III 1.2 Type III: soft ground in the alluvial
ground.Effect of permanent
ground displacementNone 1.0 3.0 Permanent ground displacement due to
liquefaction, effect to the bridge foundation due to slope failure.
Likely 2.0Definitely possible 3.0
Bridge structure Arch and rahmen 1.0 3.0 From the seismic safety, arch and rahmen, which are estimated to have relatively higher safety, have smaller weight factor, while that of cable stay and suspension bridges have larger weight factor, because the large seismic response might provide significant damage to the pipe.
Continuous beam 2.0Simple beam, cable
stay bridge, suspension bridge
3.0
Height of bridge pier H < 5 (m) 1.0 1.7 The height means the elevation from the ground surface. The height of the bridge piers is the height from the river basement.
5 ≤ H ≤ 10 (m) 1.4H > 10 (m) 1.7
Pipe-supported structure Type A 1.0 1.5 The pipeline is installed at the following space for each bridge as
Bracket type
Inside ofgirder
Out ofgirder
Suspensiontype
Out of girder
Out of girder
Suspension type
Support-by-beam type
Inside of girder
Support-by-crossdeck type
Inside of girderBracket
type
Type B 1.2Type C 1.5
Pipe diameter D ≤ 300A 0.8 1.25 The small weight factor is given for the small inertia force. D is the diameter of the distribution pipeline.
D > 300A 1.0
Pipe material Arc-welded steel pipe
0.5 2.4 For the weight factor for the CIP, comparatively larger weight value is assigned, because the strength of CIP is lower than that of SP and DCIP.
Steel pipe with mechanical joint
1.2
Ductile cast iron pipe (DCIP)
0.5
Cast iron pipe (CIP) 1.2Piping configuration Straight 1.0 1.5 Since the straight pipe has small force, small
weight factor is assigned. Bending portion without any fixed point has the most severe force.
Bending with fixed point
1.2
Bending without fixed point
1.5
Abutment configuration Straight 1.0 1.5 The weight factor of the abutment and exposed bended pipe is the same as that of the pipe bridge of both fixed ends.
Bending with fixed point
1.2
Bending without fixed point
1.5
Fixed point of the pipe-supported bridge
Existing 1.0 1.5 The small weight factor is assigned for the bridge without any fixed point.None 1.5
Separation distance of expansion joint
L ≤ 100 (mm) 1.0 1.2 A long-span bridge receives larger forces, so the larger weight factor is assigned.L > 100 (mm) 1.2
(Continued)

304 Maintenance Technologies of Lifelines
14.3.2 Planning of Leakage Protection
14.3.2.1 target Value of Leakage Protection
The target valve of protective leakage volume is the most important matter in the leak protection plan-ning. This target value is called the effective ratio, which is defined as the ratio of the nonleakage flow volume per the total flow volume from the sources in the water network system. The effective ratio is recommended to be more than 98% for major water suppliers, and more than 95% for medium and minor water suppliers in Japan.
14.3.2.2 classification of Leakage Protection Measures
Leakage protection methods can be classified into the following three approaches: a basic approach, a makeshift approach, and a preventive approach. Table 14.13 provides details of these three approaches.
TABLE 14.12 (Continued) Diagnosis of Simplified Seismic Performance of Pipe-Supported Bridges
Item Condition Weight Range Remarks
Pipe joint
Expansion joint (steel pipe)
Closer (eccentric) 0.8 2.5 The joint of flexible bending capacity is estimated to have higher safety, while the joint of short displacement is estimated to have lower safety. Victaulic joint is equal to a mechanical joint.
Bellows (eccentric)Closer and bellows 1.0Dresser and sleeve 1.5Mechanical joint,
none2.0
Ductile cast iron pipe, cast iron pipe
Expansion type, restraint joint type
0.5 2.0 The joint of expansion type or restraint type is estimated to have higher safety. So small factor is assigned.Others 1.0
Seismic intensity of JMA V 1.0 3.6 It depends on the seismic intensity of Japan Meteorological Agency (JMA).VI 2.2
VII 3.6Criterion of seismic
assessmentHigh y < 14 No damage.Medium 14 ≤ y ≤ 28 Water service is possible even if there are any
damages.Low 28 < y Water service is impossible because of
significant damages.
Note: The range is calculated as the ratio of the maximum weight factor divided by the minimum weight factor.
TABLE 14.13 Practical Methods for Leakage Protection
Protection Work Item Practical Methods
Basic protection Preparation Establishment of construction schemeBasic investigation Preparation of documents, books, and equipmentTechnology development To obtain the service volume, leakage volume, and
pressureSymptomatic
protectionFlexible work (for leakage at the aboveground
should be repaired)Immediately repair
Periodic maintenance (for leakage from underground portion)
Early detection
Preventive protection
Attendance to the other installation work Patrol and site attendanceRetrofitting of the existing water distribution
pipelinesPipe replacement, prepare the emergent drinking
water, corrosion protectionControl the water pressure Prepare for water distribution networking,
blocking, installing of relief valves

305Water Supply System: Maintenance Technologies
14.3.3 Basic Measures
14.3.3.1 Analysis of Distribution Water Flow
The measurement items for the analysis of distribution water flow are shown in Table 14.4. In order to make accurate measurements, the following points must be kept in mind:
• The flow meter should be appropriate to measure the flow rate of the distribution flow volume in order to reduce the metering errors.
• Water meters should be installed at the public areas such as various types of parks.• Water used for fire-fighting should be measured by the flow meter equipped in the fire engine. If
the measurement is not possible, a calculation formula is prepared to predict this volume.• Water used in pipeline installation construction can be measured by the flow meter temporarily
equipped at the site. If not, a calculation formula can be prepared to predict this volume.• The insensitive flow volume should be minimized by installing a flow meter to detect the
passing through flow. The volume of the insensitive flow is measured by the site survey. However, the actual data on the metering type and also age of measuring equipment must be checked. If the actual situation is not clear, 2% of allowance is kept for the actual measurement of water flow.
14.3.3.2 estimation of Underground Leakage Water Volume
Leakage volume aboveground can be obtained by visible estimation based on personal experiences or by a simplified estimation of the water volume collected before repair work.
Leakage volume underground is estimated the following way:
14.3.3.2.1 Direct MeasurementDirect measurement can be carried out in the following steps:
• The whole area for leakage measurement is fixed.• All the valves surrounding the fixed area must be closed.• None of inflow and outflow that are flowed from the fixed area must be confirmed.• All the stop valves and hydrants must be closed.• Draining the pipe contents into a container (such as a fixed area). • Then the measure of the water flow is executed at the measuring points.• If certain amount of water is measured, this water flow can be estimated as the leakage flow.
When leakage is detected from the fixed area, there are two approaches in selecting the fixed area: the circulation method and the sample method. The circulation method is to adopt the whole area as a fixed area, whereas the sample method is to set up a small area as a fixed one. Since the circular method examines the whole area, the leakage measurement will be much more accurate than obtained from the sample method. In the sample method, an appropriately sized sample area must be selected in order to reduce the estimation error of leakage. Total stretch of the pipe elongation in the sample area is about 3%–5% of the total pipeline length.
14.3.3.2.2 Indirect MeasurementIn the direct measurement method, the measurement area is fixed, but all the stop valves and hydrants of all the houses in this fixed area are not closed. Instead, the minimum night flow is measured.
The minimum night flow is based on the assumption that non–water usage period (quiet time) will be found probabilistically at midnight. If any water flow is taken into tanks, or any continuous water flow is anticipated at night time, those amount of volume should be subtracted at the initial stage in order to obtain an accurate estimation of leakage volume. An automatic flow recorder is used to estimate the leakage flow volume. The two approaches for the selection of fixed areas are the same

306 Maintenance Technologies of Lifelines
as in the direct method. The size of the fixed area is 500 customers, and the total length of pipeline is about 2.5–3.0 km. Figure 14.21 is a schematic illustration for the minimum flow measurement method.
14.3.3.2.3 Other MethodsOne of the other methods in addition to the direct and indirect methods is to use a distribution flow analysis approach. This approach estimates the leakage volume as the difference between the distribu-tion water flow and the effective water flow.
14.3.3.3 cause Analysis of Leakage
When leakage protection is planned, it is necessary to grasp the actual situation of leakage and to ana-lyze the causes of the leakage. For this analysis, exact information about the pipelines and their sur-rounding areas must be collected and adequately managed.
When a leakage accident occurs, the data shown in Table 14.14 must be recorded for future analysis.
RecorderFlow meter
Sectionalflow meter
Measuring the section
flow
Section model
Sectionmodel
Leak
flow
Min.flow
Duration
Spare timeSpare time theory
A
A B
B
CC
Duration
FIGURE 14.21 Schematic illustrations of minimal flow measurement method.
TABLE 14.14 Leakage Analysis
Grouping Items Contents
Leakage type Leakage from aboveground, leakage from undergroundFacility Transmission pipelines, distribution mains, distribution pipelines, service lines, reservoirsCauses Natural leakage (pipe material, diameter, construction year, joint, crack, pull-out, packing
for valve, packing for hydrant, etc.)Leakage due to accident (pipe material, diameter, construction year, damage causes,
damage states, etc.)Areas Ground (corrosive soil, soft ground, reclamation sediment, others)
Traffic volumeRoad classification (national highway, prefecture roads, municipal roads, farm road,
private road, others)Pavement type (pavement thickness, gravel road, others)

307Water Supply System: Maintenance Technologies
14.3.4 Symptomatic Measures
14.3.4.1 Flexible Action
Flexible actions are carried out for rapid detection of aboveground leakage (including leakages from subways and underground streets), identification of leakage points, and repair.
Aboveground leakage is easily detected from reports of residents. But leakages in the valve vault or in a pipe-attached bridge are difficult to detect, so in this situation, periodic inspection is important for early detection. Once a leakage is detected, immediate repair must be executed.
It is possible that the leakage point aboveground is not always identical to the actual leakage location. This is especially true when a distribution pipeline is covered by a polyethylene sleeve or is buried under thick pavement such as asphalt or concrete. The leakage point in these cases can be detected by a leakage detector or by a boring inspection at the site.
14.3.4.2 Method for Leakage Judgment
The leakage material that is belonging to any water or to any others is checked by the following methods:
14.3.4.2.1 Residual Chlorine MethodBased on the water quality standard, drinking water is regulated to have more than 1.0 mg/L of chlorine. If the water has any chlorine, the residual chlorine will change to a pink color through the DPD method (diethyl-p-phenylene diamine emissions). By this method, the leakage flow can be identified whether the water is drinking water or not. But if the leakage occurred at a dead end in the supply area, the residual amount of chlorine is little, or the network is out of service due to the complete consumption during the leakage flow, the DPD method is not effective. So a combined approach using multiple testing methods is preferable.
14.3.4.2.2 Potential Hydrogen Method (pH)Drinking water has its own pH obtained from the original source or the purification method. From these facts, the leakage water can be identified. In general, the pH value of drinking water is between 6.7 and 7.5. Rainwater will usually be <6.0, underground water will be between 6.7 and 7.5, and sewerage water will be higher than 7.0.
14.3.4.2.3 Electrical Conductivity MethodDrinking water, sewerage water, and underground water have their own mutually different electric con-ductivities. In general, sewerage water, having many impurities, has a relatively higher electric conduc-tivity. From this fact, the electric conductivity of leakage water can be measured to determine if the water is drinking water or not.
The electric conductivity (μS/cm) of drinking water is 100–300, 40–90 for rain water, 300–1000 for underground water, and more than 500 for sewerage water.
14.3.4.2.4 Trihalomethane MethodBased on Japan waterworks code, chlorine should be injected to the drinking water; as a result, triha-lomethane will be produced by the chemical reaction with the water and chlorine. Using this method, drinking water can be identified.
14.3.4.3 Planning Work
Emergency action is used for aboveground leakage, whereas planning work is executed to find and repair the underground leakage with the periodic inspection in the following two methods: measure-ment method and simplified method.

308 Maintenance Technologies of Lifelines
Both methods can save costs by long intervals, whereas the leakage volume during this interval is increased. A short interval increases the working cost but decreases the leakage volume. The optimal interval can be obtained from inspection cost and water leakage cost.
14.3.4.3.1 Measurement MethodThe measurement method measures the leakage water flow using the direct or indirect method. Then the location of leakage is then detected and repaired.
14.3.4.3.2 Simplified MethodThe simplified method is to estimate the underground leakage without any measurement of leakage in the fixed area. The leakage detection is conducted by acoustic leak detection along the distribution pipe-lines, service lines, and the surface ground. It should be noted that the leakage pours into the sewerage, gutter, or waterways.
14.3.4.4 identification of Underground Leakage Point
The identification of underground leakage inspection is effectively conducted in the procedures given in Table 14.15.
14.3.4.5 Feedback to Leakage Analysis
The data obtained from the flexible action and planning works should be utilized for leakage analysis.
14.3.4.6 Leak Detection equipment
One type of leakage detection equipment is used to find the leak, whereas the other is used to identify the leakage location.
When an acoustic leak detection bar and detector are used for leak detection, the characteristics of leak flow sound must be known. Propagating characteristics of leakage sound is dependent upon the pipe material, the size of the leak, and the water pressure as shown in Table 14.16.
The pseudo leak sound is given in Table 14.17.
14.3.4.6.1 Leak Sound Detection BarThe leak sound detection bar (shown in Figure 14.22) is a steel bar attached to a metal plate. As shown in Figure 14.23, this bar is set on the stop valve, the control valve, or the hydrant to hear the vibration sound propagated on the pipe. By this vibration, the occurrence of a leakage can be detected, but the location of a leakage is very difficult to determine by this method.
TABLE 14.15 Detection Procedure for Underground Leakage
Procedures Contents
Planning Investigation plan for block area, method, content, grouping, and othersPreliminary investigation Comparison between the actual site condition and the drawings of
block area, housing, and pipingDoor-to-door leak sounding detection Detection work for water service line including water meter, curb valve,
and othersRoad surface leak sounding detection Detection work for service lines and distribution pipelines buried
under the roadsSite identification investigation Based on the sounding data, identify the leak locationData analysis Leakage analysis

309Water Supply System: Maintenance Technologies
TABLE 14.16 Propagation Characteristics of Leaking Noise
Condition
Distance
Remarks Long Short
Diameter Small Large Large-diameter pipes cannot vibrate easilyPipe material Cast iron pipe, lead pipe,
steel pipePolyvinyl chloride
pipe, asbestos pipeNonmetal pipes is not sensitive to
vibrationJoint type Socket type Rubber joint type Rubber can decrease the leaking noiseLeaking volume Large Small Very small leak makes small noiseWater pressure High Low Low pressure makes small noiseBuried depth Shallow Deep Pipe buried in deep soil can decrease the
leaking noiseSoil density Dense Coarse Coarse soil can decrease the leaking noise
TABLE 14.17 False Noise Similar to Leaking Noise
Types Characteristics
Noise when water is used Noise from a faucet when water is usedInlet noise of sewerage flow A similar leaking noise comes from inlet noise with a stuffy acoustic echoSound of the wind The wind speed of 4–6 m/s is similar to the leaking noise, and faster wind speed
erases the leaking noiseNoise of moving car A similar leaking noise comes from a fricative noise between tire and road
surface, which is produced far from 60 m distanceUrban noise A similar noise comes from the vibrating noise of buildings due to a wind or
noise produced inside the buildingsVibration noise of transformer Vibrating noise produced by magnetic motion in the transformerNoise of motor Rotating motor noise of air conditioners or vending machines
Upper portion of leak detection bar
FIGURE 14.22 Leak sound detection bar.

310 Maintenance Technologies of Lifelines
14.3.4.6.2 Electric Leakage Detection DeviceThe electric leakage detection device is shown in Figure 14.24, by which a leak sound propagating in the ground is amplified and easily detected. By moving this detector along a pipeline, the loudest sound can be identified at the exact location of leakage point.
14.3.4.6.3 Temporal Cumulative Leak Detection DeviceThe temporal cumulative leak detection device is shown in Figure 14.25.
This sensor is installed on the service lines beside the water meter of customers. The propagating sound should be measured on the pipe surface during the fixed time period of 10 s to 3 min. Since this
(a) (b)
FIGURE 14.23 Leakage detection work: (a) leak sound detection bar and (b) electronic leakage detection device.
FIGURE 14.24 Electric leakage detection device.

311Water Supply System: Maintenance Technologies
sound is continuous in the leakage occurrence, the leakage points must be located near here. No prior experience with leak detection is needed when this equipment is used.
14.3.4.6.4 Correlated Leak Detection DeviceThe correlated leak detection device is shown in Figure 14.26. Two sets of sensors are installed at both sides of the leak point. From the arrival time difference of the signals from both sides, the leakage loca-tion can be identified. More exact location analysis can be done with supporting data such as pipe mate-rial and diameter.
Connect to service line
FIGURE 14.25 Time cumulative leakage detector.
Amplifier with radio communication device
Sensor
Correlation analyzer
A (reference point) Leak point
Lb
L
La
Gate valve
B (reference point)
CC
FIGURE 14.26 Correlated leak detection device.

312 Maintenance Technologies of Lifelines
14.3.4.6.5 Permeating Leak Detection DeviceThe permeating leak detection device uses helium gas, which is harmless to the human body. Helium gas is comparatively small in its specific gravity and has a size small enough to pass through concrete and asphalt.
When a combined mixture of water and helium gas is poured into the network through the hydrant, the helium gas comes out from the point of leakage. The helium gas is diffused around the center of leakage point, so using the gas distribution profile, the leakage origin can be identified from the highest density point.
This device is used in places where the leak sound detection bar is difficult to be used.
14.3.4.7 Pipe Detecting equipment
The following equipment is used to detect a cavity under the road or to check for a water leakage:
1. Pipe detector: There are two types of pipe detectors: one type can detect metal pipes such as steel pipes or ductile iron pipes, whereas the other can detect nonmetal pipes such as rigid polyvinyl chloride pipes. The metal pipe detector can identify the location and depth of the buried pipelines using the principle of electromagnetic induction, which consists of direct and indirect methods. By detecting the sound transmitted from the hydrant, the nonmetal pipe detector can identify the location of the pipe, but cannot identify the depth of the pipe.
2. Ground-penetrating radar: Ground-penetrating radar can launch radio waves from an antenna above the ground, then pick up the radio wave reflected from pipe surface, soil, or air. By analyzing these arriving wave data, the buried condition and location of the cavity can be identified.
3. Leak detection devices: There are several devices to identify whether the leakage material is drinking water or not. Those are the residual chlorine analyzer, the pH analyzer, the conductance meter, and the water temperature meter.
14.3.5 Preventive Measures
A drastic measure to prevent leakages is to replace old pipes that could cause a leakage accident.
14.3.5.1 Retrofitting of transmission and Distribution Pipelines
Old transmission and distribution pipes should be replaced on the basis of Section 14.1.3. For pipes with a socket joint, a temporary measure to set the metal fittings for leakage prevention should be taken before a drastic retrofitting.
14.3.5.2 Retrofitting of Service Lines
There are several types of service lines that are buried under the street and in housing areas. These are various kinds of pipes such as a led pipe, screw-jointed steel pipe, rigid polyvinyl chlorine pipe with TS joints, and polyethylene pipe with a single layer. Unfortunately, these are vulnerable in the joint or in the body. Most leakage is caused by the failure of service lines.
The service line is the property of the customer, but leakage between the distribution pipe and the water meter is not charged to the user. As a result, the user may notice pressure drop due to a leakage, and water may be wasted until the repair is made. Even if all distribution pipelines are reinforced by the replacement of new pipes, remaining old service lines decrease the seismic retrofitting effect.
The water supplier must take the following preventive actions:
1. Change of type of service pipe, branching from the distribution pipeline: Service lines made from vulnerable pipe material or with a poor joint causing easy leakage should be replaced with new

313Water Supply System: Maintenance Technologies
flexible and anticorrosive resistance pipe. The branching portion from the distribution pipeline should adopt the cock with saddle to obtain an additional reinforcement at the branching portion.
2. Rearrangement of service lines: When several existing service lines are installed in a complicated pattern such as parallel laying or crossing the road as shown in Figure 14.27a, rearrangement of the distribution pipelines should be taken as shown in Figure 14.27b. Especially, when many service lines are installed along a private road, the owner’s acceptance on the usage of the private road is necessary for the rearrangement works.
3. Relocation of stop valve and water meter: Since a stop valve located on the road is often damaged by traffic loads, a leakage accident can occur from this valve. If possible, the stop valve should be relocated to the nearest point on the road inside the residential area.
14.3.5.3 Adjustment of Water Pressure
Leakage from the transmission and distribution pipelines is estimated by the following formula:
Q CAPn= (14.3)
where Q, C, A, P, n are leakage flow rate, coefficient of leakage outlet, cross-sectional area of the leakage outlet, water pressure, and an exponent, respectively.
An exponent of n = 0.5 means that the leakage outlet is a type of orifice, whereas an exponent of n = 1.15 means that the leakage outlet is a type of crack. This value of 1.15 is based on an experimental value that is measured from an invading flow in the soil ground.
Based on Equation 14.3, when a leakage is increased, water pressure from the transmission and dis-tribution pipelines should be adjusted to decrease the leakage flow. When water pressure adjustment is taken for the water service area, the present site investigation is necessary on the water supply service such as the direct water flow service and the indirect water flow service with water storage tank. The water pressure adjustment can be executed by considering the development planning of the direct water flow service area and of the water supply service level.
The detailed procedure for water pressure adjustment is given in Section 14.5.3.2.
Pedestrian Road Pedestrian Pedestrian Road Pedestrian
Distribution pipeline Distribution pipeline
(a) (b)
Servicelines Service lines
Dist
ribut
ion
Dist
ribut
ion
FIGURE 14.27 Reallocation of service lines running aside or crossing the road: (a) before reallocation and (b) after reallocation.

314 Maintenance Technologies of Lifelines
14.3.5.4 corrosion Protection for the external Surface of Pipes
The external surface corrosion often produces leakage in pipelines installed at the following sites:
1. Pipelines buried in corrosive soil, or acid and salty water invaded ground. 2. Macrocell corrosion, which occurs at the through hole with RC concrete and at the boundary area
between different soils or different metals. 3. Pipelines installed near railways or near cathodic protected plants: Although corrosion damage
may not have been predicted during construction, corrosion might be caused by environmental changes. So site investigations using the latest knowledge and adequate corrosion protection must always be carried out.
4. Measure for corrosive soils: There are various countermeasures for corrosive soil conditions, such as polyethylene sleeve coating, concrete lining, corrosion protective taping, and finally coating with asphalt, epoxy, and plastic materials. These materials are used to separate the pipeline from corrosive soils. Bolts and nuts of the joint should be made of stainless steel or low-alloy ductile cast iron, and coated with an oxide coating or a polyethylene coating. Polyethylene sleeve should be used for the joint portion.
Evaluation criterion of soil corrosion is given by ANSI/AWWA C 105/A21.5-82. According to this criterion, when the value of soil corrosion is more than 10, protective corrosion measure must be taken into account.
5. Corrosion by macrocell: Many reports on macrocell corrosion pointed out that corrosion damage occurs at the buried pipe near the through hole of RC concrete and at the damaged protective coating. Protective measures for macrocell corrosion are as follows:
a. Electric insulating treatment is necessary at the through hole of the RC concrete wall, pipe supports, and anchor bolts for the foundation of the plants.
b. The coating of the pipe surface must not be damaged, especially near the buried concrete structures.
c. Steel pipes must be separated with electric insulation joints in the corrosive area. 6. Measure for electrolytic corrosion protection: Electrolytic corrosion protection is necessary for
water pipelines that are located near the electric railway or cathodic protection equipment of other pipelines.
The electrolytic corrosion protection countermeasure must be prepared as the electricity dis-charging side and the pipeline receiving side:
a. If any leakage is predicted from the railway, negotiation with the railway company is neces-sary to minimize this leakage
b. The pipeline should be protected using the following methods: i. Impressed current protection method, selective drainage corrosion method ii. Forced electric drainage method iii. Sacrificial anode method iv. A special method that the insulation joints are installed at both sides of the pipeline sec-
tion in the corrosion area to disturb the stray current flow along the pipeline
14.3.5.5 corrosion Protection for the internal Surface of Pipes
Iron rust from the internal surface of pipes decrease pipe wall thickness, which can cause leakages.Langelier’s index (saturation index) is a criterion to estimate the corrosive characteristics of the water.
In the case of low Langelier’s index, iron is eluded from the cast iron pipe, which results in red water (rust-colored water) or the leakage or the deterioration of the internal lining. Especially, from galva-nized steel pipe, copper pipe, and lead pipe, zinc, copper, and lead materials are eluded. In order to improve this low Langelier’s index, calcium hydroxide and carbon dioxide or alkali mixture are poured in the purification process.

315Water Supply System: Maintenance Technologies
Langelier’s index can be estimated in the following way:
Langelier’s index = pH of water – pHs (14.4)
in which
pHs Ca
Ca mg/LCa mg/L
/
= − − +
=
+
++
8 313
40 1 2
2
22
. log[ ] log{ }
[ , ]( )
.
[
A S
A,, ](
mg/Ltotal alkalinity mg/L)
/=
100 2
where S is the correction factorIt is noted that Langelier’s index is affected by temperature. At the temperature of 25°, deviation of 1°
in temperature produces the deviation of 1.5 × 10⁻² in Langelier’s index.
14.3.5.6 Measure for other constructions
Buried pipelines might be damaged by the accidents by the third party’s constructions. So the prelimi-nary communication before construction by which the pipeline is located is necessary to check the exact location.
14.4 Retrofitting technology of Waterworks Facilities
14.4.1 Repair and Retrofitting Methods for external Pipe Surface
In order to rapidly stop leakage from the leakage or damaged point, various exterior repair methods have been developed and widely used.
14.4.1.1 Metal Fitting for corrosion Protection (for Socket and Spigot Joint)
Water pipelines have been widely constructed worldwide since the early 19th century, with most sys-tems using segmented pipe with socket and spigot (also termed bell and spigot) joints.
Since socket and spigot joints do not bend well, many leakage accidents occur from these joints. Before 1952, the repair of the socket and spigot joints was to replace the old hemp yarn with a new one and to caulk the joint again with lead and hemp yarn. In 1952, a new metal fitting for this type of joint was developed as shown in Figure 14.28.
Pressure ring
Tie bolt
Stopper ring
Socket portion
Lead YarnRubber packing
FIGURE 14.28 Structural detail of mechanical joint.

316 Maintenance Technologies of Lifelines
14.4.1.2 Special Joint for Asbestos Pipes
Asbestos cement pipes must be replaced because of its health concerns. Initially in 1932, asbestos pipe was corrosion-resistant, easily workable, and cheaper than metal pipes.
Since asbestos pipe is vulnerable in its body strength, many accidents due to other construction were reported. In 1959, a new leakage protection joint called ace joint was developed as shown in Figures 14.29 through 14.32.
14.4.1.3 Metal Fitting for Flange Reinforcement
Leakage from the flange joint is caused by pulsation pressure, by loose shielding due to aged rubber packing, or by the enlargement of corrosive flange bolts. Since the flange joint is often installed in a limited space, it is difficult to set fitting equipment. A new metal fitting for flange reinforcement was developed as shown in Figures 14.29 through 14.31.
14.4.1.4 other Materials for Repair Works
Recently, there are many types of pipes used as water pipelines. Those are cast iron pipes, polyvinyl chloride pipes, steel pipes, and polyethylene pipes. Repair equipment for these pipes has been developed.
Instead of the external repairing with rubber packing and metal equipment, a bypass water method was developed as shown in Figure 14.33.
FIGURE 14.29 Ace joint.
FIGURE 14.30 Flange reinforcing device.

317Water Supply System: Maintenance Technologies
FIGURE 14.31 External repair clamp.
Original pipe
Sleeve SS
Rubber ring
Bolt and nut
HousingFCD
FIGURE 14.32 External repair sleeve.
Bypass line
Main pipe
Branch joint possibly with nonstop operation
Nonstop valve
Leakage
FIGURE 14.33 Leakage repair work by nonstop method.

318 Maintenance Technologies of Lifelines
14.4.2 Repair Method for internal Pipe Surface
When an excavation is possible at the leakage site but water service suspension is difficult, the external repair method is used. But in the case where an excavation at the leakage site is difficult but it is possible to stop the water flow, the internal repair method is used.
14.4.2.1 internal Joint Reinforcement Method
This method is to repair and reinforce the pipe joint from the inside of the pipe. In this method, old packing is replaced by a new rubber packing, and an ordinary joint is changed to the seismic-resistant joint.
In this method, a workman has to work inside the pipe, so a diameter of more than 800 mm is neces-sary. Figure 14.34 shows the fitting equipment of the internal repair method.
14.4.2.2 Restoration Method of existing Pipes
This method is to remove the existing tuberculation in order to recover the flow capacity by preventing the red color water.
By this method, the pipe’s condition is not always restored to their initial condition. When the existing pipe body and joint are strong enough for future usage, this repair method may be applicable.
1. Cleaning: Cleaning the internal pipe surface is done by either the scraper method or the jet method. The scraper method is to remove the iron rust mechanically with a scraper, whereas the jet method is done by high-pressure jet flow of 9.8–14.7 MPa.
2. Lining: There are two lining methods: the pipe reverse method and hose lining method. The pipe reverse method is when a polyethylene pipe of a smaller diameter is inserted, and then the gap between the original pipe and the inserted pipe is filled and pressurized with cement milk. The hose lining method is when, after cleaning the internal surface of the original pipe, a new shield-ing hose painted with an adhesive material is crimped to the original pipe by air pressure. This lined pipe is easily followed and possibly adopted to the curved portion.
14.4.2.3 investigating camera of internal Pipe Surface
Cameras have been developed to investigate the internal pipe surface even when filled with water as shown in Figure 14.35. This camera is installed from an air valve or a hydrant.
Original pipe
Sleeve
Rubber ring
Rubber ring
Bolt and nut
FIGURE 14.34 Internal reinforcing device.

319Water Supply System: Maintenance Technologies
Recently, cameras not only observe and record the internal pipe surface but also identify the location of the camera in the three-dimensional location in the pipe. It can be identified by receiving the special signal that is oscillated from the camera head.
A submergible camera robot has been developed that can swim in every direction in a large-diameter pipeline. This machine is used for pipe investigation and leakage detection.
14.5 Measures for environmental conditions
14.5.1 Basic concept for environmental Load Reduction
In the water supply system, a huge amount of energy is consumed by pumping equipment in the puri-fication plants and water stations. So the effective operation of the water supply system is necessary to save energy and to reduce the environmental load.
In the distribution process, the environmental load can be reduced by the expansion of the direct water supply area due to water pressure or by the localization of the pressurized area for the direct water supply. Alternative methods for environmental load reduction are to use solar power generation at the filter basins or water reservoirs, and to use hydraulic generation by residual pressure of the main lines.
In the pipe replacement, constructing the shallow buried pipelines can reduce the excavated soil, and the reuse of the soil can reduce the waste dumps.
14.5.2 operation of transmission and Distribution Pipeline Facilities
In transmission and distribution pipelines, the operation management is based on the most stable water supply. In order to satisfy this requirement, the performance and function of the existing facili-ties must be assessed and evaluated for future maintenance management in the facilities and plant operations.
In order to change the operation method, the changes in water flow rate, pressure, quality, and opera-tional expenses should be compared before and after change. Then the revised amount is quantitatively measured, and these results can be reflected in the revised operational management.
Minimization of energy demand can be carried out by planning the future prediction of the water flow demand in the transmission and distribution pipelines, and by adequate monitoring of these facilities.
Horizontal moving screwLaser pointerfor measuring
CableVertical moving screw TV for side view
Stabilizing fin
Screw for axial motion Side lighting (LED)
Forward lighting (LED)
TV camera in front
FIGURE 14.35 Submergible camera robot. (Dimension of this robot is 730 mm in length, 80 mm in diameter. This robot can be applied for more than 800 mm in diameter.)

320 Maintenance Technologies of Lifelines
14.5.2.1 Prediction of transmission and Distribution Water Flows
When the operation plan of transmission and distribution pipelines is set, the demand prediction of the main flows is the most important issue. Environmental load reduction can be executed by the predic-tion of the main flows in the transmission and distribution pipelines and by minimizing unnecessary pumping and purification equipment operations.
The prediction of the water demand at a certain day is proceeded to obtain the basic data. The data can be obtained by collecting the water demand data on the past similar conditions or the nearest date among the existing database. Statistical analysis is applied to modify the characteristic effect to water demand deviation due to weekday, climate, temperature, and holiday.
The prediction method is established with the prediction model and operation planning method. An appropriate guidance and manuals for the operational staffs must be prepared, and also the manual operation system must be equipped for emergency use.
14.5.2.2 control of transmission and Distribution Water Flows
The water flow of the transmission and distribution pipelines is controlled to obtain the appropriate water volume and the adequate pressure.
14.5.2.2.1 Control of Transmission Water Flow and Operational Management of Water ReservoirsThe control of the conveying pump is closely related to the operation of the water reservoirs. In order to maintain the water level of the reservoirs within the designated ranges, the conveying pump is con-trolled based on the demand prediction and the daily gathered data.
The controlling method is classified into two types: unit control and revolution speed control. The unit control method is applicable to a system with comparatively lower pressure loss than that of the actual pump head, and with permissible small water flow or pressure deviation. The revolution speed control method is appropriate to a system with comparatively larger pressure loss than that of the actual pump head and with large flow deviational and continuous operations. In general, both methods are used together.
The basic operational method of the reservoirs aims to keep the water volume of the purification treat-ment capacity and transmission flow. In this method, reservoirs also should absorb the distribution water supply deviation by the reservoirs capacities as much as possible. For emergency use at pumping accidents or at disaster occurrences, the water level of the reservoirs should be kept to a higher level than the planned one.
14.5.2.2.2 Control of Distribution Water FlowThe purpose of the distribution water control is to keep the water pressure within the designated ranges, even during abrupt disturbances of distribution water flows. There are two types of approaches on this control: the constant discharge pressure control method and the constant end pressure control method. These two methods can control the number of in-service pumps, revolving speed, valve opening rate control, and their various combinations.
The constant discharge pressure control method must keep the constant pressures at the discharge point and the secondary point of the reduced valve, even if the demand flow is much deviated.
The constant end pressure control method is to keep the constant pressure at the end point of the distri-bution pipelines. This method is carried out by the direct and indirect control methods. The direct control can be done by using remote supervisory control, and the indirect control method is done by comparing between the monitored pressure loss and the analytically predicted pressure loss by using the flow equation.
14.5.3 control of Water Flow and Pressure by Distribution Flow Management
The distribution flow management means to keep water supply with a designated quality by controlling the flow rate and pressure just by using pump and valve operations when a distribution water demand is changed.

321Water Supply System: Maintenance Technologies
In order to maintain smooth operations, the water must be supplied in the service area with an ade-quate and uniform pressure. Especially, the minimum dynamic water pressure should be adjusted with the direct water supply plan in the local service area.
In the water flow and pressure management, the supply area is divided into several blocks based on the land conditions and the capacity of the plants. Furthermore, a smooth water supply and the minimal energy loss are required in this management.
14.5.3.1 Monitoring of Distribution Flow Situation
Water conditions such as water flow, pressure, and quality in the supply area are affected by land con-ditions, the time period, and the seasons. The water condition in the pipelines is also affected during pipe-laying constructions.
The following data should be collected to obtain the exact information on the distribution water sup-ply situation: water flow, pressure, and land elevation. Complaints that are received from the demand users on poor water service and dark water must be filed for the future maintenance activity.
Water pressure should be measured each season, and pressure distribution maps should be prepared. Using these maps, excessive energy consumption can be detected. Figures 14.36 and 14.37 show water pressure measurement equipment.
FIGURE 14.36 Auto recorder of water pressure.
FIGURE 14.37 Auto recording chart of water pressure.

322 Maintenance Technologies of Lifelines
14.5.3.2 Method of Distribution Flow Measurements
Distribution flow can be measured by three different patterns: continuous, periodic, and temporal.
1. Continuous measurement: Continuous measurement is done to monitor the water supply in the service area and to collect data on water supply conditions. The following information can be collected by automatic measurement equipment: water flow, pressure, residual chlorine density, chromaticity, darkness, water temperature, pH value, and electrical conductivity.
2. Periodic measurement: Periodic measurement is done to inspect the water flow condition and its aging effect on the distribution pipelines. Portable measurement equipment such as pressure meters, flow meters, and residual chlorine meter are used. Periodic inspection should be mea-sured at multiple points in each block of the distribution area simultaneously.
3. Temporal measurement: Temporal measurement is done to analyze special problems and to select the most appropriate countermeasures for this problem, when local water pressure drops or water flow is suspended. Portable equipment is also used for this measurement.
14.5.3.3 Adjustment by Valve operation
When a valve adjustment operation is done for water flow and pressure control management, long dura-tion before and after the valve operation is necessary to absorb the temporal deviation of the water con-ditions in order to obtain clear measurement results. The valve opening data must be recorded on the ledger. A clear indicating flag is necessary for the valves equipped at the site to be closed or be adjusted on its opening degree.
14.5.3.4 Adjustment by Distribution Pipeline improvement
If the distribution pipelines do not have enough performance in their pressures and flow volumes, their performance can be improved by using the larger diameter, connection of mutually dependent pipe-lines, multiple pipelines, and loop networking.
14.5.4 effective Usage of Distribution Flow Pressure
14.5.4.1 Distribution Flow by Gravity Profile
14.5.4.1.1 Adequate PressureJWWA recommends the hydraulic condition that the minimum dynamic pressure at the branch point of service pipe should be more than 0.15 MPa and the maximum static pressure should be <0.74 MPa.
14.5.4.1.2 Distribution Water Supply SystemsThe distribution water supply method has three different types of systems: the gravity flow system, the pumping up system, and the combined system.
14.5.4.1.2.1 Gravity Flow System The gravity flow water supply system is not dependent on an electric supply. Therefore, it is more practical and stable than the pumping-up system in the water supply ser-vice. If a higher elevated site for the storage tank is located in the distribution network, the gravity flow system is basically adopted on the basis of its construction and maintenance cost.
14.5.4.1.2.2 Pumping-Up Method The pumping-up method is used to control the water flow and pres-sure based on the demand changes in the distribution supply area. But for the abrupt electric suspen-sion, an emergency power generating system must be equipped.
When the water supply is requested at higher elevated points, the pumping-up method is effective in its energy consumption if the supply points are limited. But when the water supply is requested to the lower points, pumping-up method might damage service lines or create leakage. In this situation, the pressure-reducing valve must be used to control the water pressure.

323Water Supply System: Maintenance Technologies
14.5.4.1.2.3 Combined Method The combined method is used when the water distribution area has various land conditions. The gravity flow method should be supplied from reservoir tank located at the elevated point. For the area where the water pressure is insufficient, pumping-up equipment is furnished for the temporary increase in water demand in the daytime. If the nighttime demand is small in this area, the gravity flow method can be adopted instead of the pumping-up method, due its low energy consumption. Figure 14.38 shows a combined method.
14.5.4.2 Direct Water Supply and Pressurized Direct Water Supply
Water is supplied directly or through a tank. The appropriate method is determined by the pressure, elevation of the supplied area, demand water volume, demanding purpose, and ease of maintenance.
Since the direct water supply method does not have any storage function, this approach is not rec-ommended for buildings that might be heavily affected by water suspension. However, this method is widely adopted in middle- and high-rise buildings because of effective use of energy consumption.
If the direct water pressure method does not damage the existing distribution network, this method will be expanded in the service area.
This direct water supply method is classified into the direct water supply method and the pressurized direct water supply method. Figure 14.39 shows the three types of water supply methods.
1. Supply by direct pressure: This method can supply water to the end of the service line using the water pressure of the distribution pipeline. If the pressure and water flow are adequate to supply users in buildings higher than three stories, this method is cost and energy effective because of the lack of a water tank.
2. Supply by direct increased pressure: This method can supply water to users by additional pres-surization due to a pump that is installed in the service line. This method is applicable for higher buildings to which water cannot be supplied using the direct pressure method. Since this method does not need a water tank, the energy is effectively saved. When a water tank is installed at the top of a building, the tank space is required, and maintenance problems such as daily cleaning and sanitary inspection should be taken into account. These problems can be solved by the pres-surized direct supply method. To prevent strong backward pressure when the water supply is suspended, a check valve must be installed near the pump equipment.
No. 2 reservoir No. 1 reservoir
Pressurized route
Pressurized route
Direct route Inlet flow
Check valve
Bypass pipe
Outflow
P P P P
Outflow
FIGURE 14.38 Schematic example of the dual control system for pump-up and natural flows.

324 Maintenance Technologies of Lifelines
14.5.4.3 effective Use of energy at Water Supply Station
When one purification station supplies water to multiple demand stations, the pressure should be high enough to deliver water to the highest elevated point. Therefore, the intermediate nodes will be suffered by the unexpected higher pressure. In this situation, the local power generation by using the residual water pressure is possible. This approach will be effective for the energy cost saving and environmental conditions.
Power generated by the residual water pressure will be applicable for larger-diameter pipelines, such as aqueducts connecting to dams and purification plants.
14.5.5 Pipe Laying in Shallow Depth
The minimum bury depth is generally specified as 120 cm in Japan. If this depth cannot be obtained due to the presence of other structures, the bury depth can be reduced to 60 cm after negotiation with the road managers.
The guidelines [2] on minimum depth of all lifelines, including water pipelines, was issued in the Japan road management guideline in 1999, where the bury depth is larger than the pavement thickness plus 30 or 60 cm.
By this shallow installation, the waste dumps produced by the pipe excavation could be saved. As a result, CO2 and the environmental loads are reduced.
References
1. JWWA, The Guideline of Maintenance and Management for Water Supply System, JWWA, Tokyo, Japan, 2000 (in Japanese).
2. Japan Road Association, The Japan Road Management Guideline, Japan Road Association, Tokyo, Japan, 1999 (in Japanese).
Gate valve
Meter(a)
Tank
(b)
PumpTank
Gate valve
Meter
Gate valve
Meter
Pump
Pressurizedservice facility
Reverse flow protect device(c)
FIGURE 14.39 Water service method: (a) direct supply, (b) supply from water tank, and (c) pressurized supply.

325
15.1 operation and Maintenance of Sewers
15.1.1 objective
The purposes of sewer systems are water pollution control, improvement of sanitation, and flood con-trol. Figure 15.1 systematically shows objectives of operation and maintenance of sewer systems (O&M). Proper operation and maintenance of sewer systems ensures flow capacity in design and structural integrity not only now but also for the future. Without proper O&M, environmental problems such as water pollution, overflow, and odor take place. Furthermore, flying manhole covers, sinkholes, and floods endanger citizens’ life.
15.2 Water Pollution control
Improper operation and maintenance of sewer systems causes inflow and infiltration to sanitary sewer lines, leading to public water pollution. It also worsens combined sewer overflow (CSO) problems. Details of each problem are described as follows.
15.2.1 inflow and infiltration to Sanitary Sewer in Wet Weather
In separate sewer systems, sanitary wastewater and stormwater are accommodated in separate sewer lines. However, in many separate sewer systems, quite a lot of stormwater enters sanitary sewer line in wet weather as shown in Figure 15.2 [1,2]. The stormwater entering a sanitary line comes from poor house sewer, wrong connection of stormdrain to public sanitary line, and poor joints of public sanitary line with heightened groundwater level in wet weather (see Figures 15.3 and 15.4). Excessive inflow and infiltration (I/I: infiltration/inflow) as shown in Table 15.1 causes undercapacity of sewer leading
15Sewerage System:
Maintenance Technologies
15.1 Operation and Maintenance of Sewers .........................................325Objective
15.2 Water Pollution Control ..................................................................325Inflow and Infiltration to Sanitary Sewer in Wet Weather • Combined Sewer Overflows
15.3 Prevention of Overflow, Flood, Odor, and Flying Manholes .....330Prevention of Overflow and Flood • Prevention of Odor • Prevention of Flying Manhole
References ......................................................................................................333Masanori HamadaWaseda University

326 Maintenance Technologies of Lifelines
Extension of asset life
Ensuring flow capacity
Objective
Ensuring structural integrity
Pollution control
Flood control
Prevention of overflows
Prevention of flyingmanholes
Environmental issues
Odor control
Safety issuesPrevention of sinkholes
FIGURE 15.1 Objective of O&M.
Wet weather �ow
Dry weather �ow
Sanitary wastewater
Ground water in�ltration
In�ow and in�ltration
FIGURE 15.2 Breakdown of wet weather flow.
In�ow
Poor public cleanout
Wrong connection
Sanitary wastewater
Poor house sewer
Poor lateral
Poor manhole
Lateral
Manhole
In�ltration
Poor cover
Poor cover
Gutter
Public sewer House sewer
Catch basin
FIGURE 15.3 I/I route.

327Sewerage System: Maintenance Technologies
to overflows from manholes. Pumping stations and wastewater treatment plants (WWTPs) can also be overwhelmed as well. A survey in 1998 nationwide in Japan found these problems. To reduce the amount of I/I, maintenance work needs to identify wrong connection and poor joints efficiently while repairing them correctly.
15.2.2 combined Sewer overflows
In combined sewer system, sanitary wastewater and stormwater are accommodated in a single pipe as shown in Figure 15.5. Major cities in Japan employed combined system during the 1950s as it improves
Wet weather flow
I / IW
aste
wat
er fl
ow [m
3 /h]
Rain
fall
[mm
]
Time
Dry weather flow
Rainfall Dry weather flow Wet weather flow
0:00
3:00
6:00
9:00
12:0
0
15:0
0
18:0
0
21:0
0
0:00
30,000
0102030405060708090
25,000
20,000
15,000
10,000
5,000
0
FIGURE 15.4 Example of I/I.
TABLE 15.1 Identified Problems by I/I
Problems Number of WWTPs Ratio (%)
Primary effluent discharge 236 26.0Wastewater treatment
disturbance335 36.9
Flooded WWTPs 57 6.3Flooded PSs 59 6.5Overflows from manholes 182 20.0Overflows from cleanouts 103 11.3Customer complaints 127 14.0Flying manhole covers 58 6.4Warning from police and
health authorities2 0.2
Others 34 3.7No answer 334 36.7Total 909 —

328 Maintenance Technologies of Lifelines
flood and sanitation issues with relatively easy installation at low cost. In recent years, CSOs have been highlighted as pollution and sanitation problems [3–6]. Figure 15.6 shows one of the examples in com-bined system. This is partly because clean water has been achieved by expansion of sewer service leading to more people’s access to public waters for recreational purposes. Floatables and oil balls from CSOs are eyesores for those people on recreation. Oil ball is white objects made from fat, oil, and grease (FOG) as shown in Figure 15.7, and Figure 15.8 shows that FOG enters sewer line from houses and restaurants and solidifies in the sewer by sticking to sewer wall.
In wet weather flow, oil balls are removed from the wall and discharged to public waters. In combined sewer system, dry weather flow is much smaller than wet weather flow. Therefore, small flow causes FOG to form oil balls. Inverted siphons, traps of catch basin, flow channel of manholes, and poor condition sewers cause deposition of solid pollutants in dry weather, and they are flushed to public waters in wet weather. Frequent sewer cleaning is helpful to reduce the impact of the problem. It is not feasible to treat all the wastewater in the sewer in wet weather in combined system. Instead, interceptor is designed to treat the first flush of wet weather flow at WWTPs. The rest of wet weather flow is discharged to waters without treatment (see Figure 15.9). Weir type of overflow structures are placed to send first flush to
Storm water
Sanitary wastewater
CSO
WWTPWet weather
Over�ow structure
FIGURE 15.5 Combined sewer system.
(a) (b)
FIGURE 15.6 Outfall in combined system: (a) dry weather and (b) wet weather.

329Sewerage System: Maintenance Technologies
FIGURE 15.8 FOG in sewer.
FIGURE 15.7 Oil ball in CSOs.
Gravity over�ow
Public waters Primary clari�er
WWTP
CSO discharge
Secondary e�uent
Bioreactor
Primary e�uentSecondary clari�er
Disinfection
FIGURE 15.9 Schematic of CSOs.

330 Maintenance Technologies of Lifelines
WWTPs. Adjustment of height and width of weir is needed to send the design flow into interceptor as part of operation and maintenance of combined sewer. When interceptors receive smaller flow than design, part of first flush might be discharged to public waters, and when interceptors receive bigger flow than design, pumping stations and WWTPs could be overloaded. Hence, maintenance of weir is very important to control CSO pollution.
15.3 Prevention of overflow, Flood, odor, and Flying Manholes
15.3.1 Prevention of overflow and Flood
Sewers are designed with gravity flow in principle. Sewer without self-cleaning velocity due to poor conditions such as settlement face the risk of clogging and odor. Tree root intrusion, mortar, and FOG deposition also block sewer flow. With reduced flow capacity, overflows in dry and wet weather and flooding in wet weather happen. Poorly installed sewer by private developers is causing overflows in the downmost manhole of a developed land.
15.3.2 Prevention of odor
Sanitary wastewater contains a high concentration of organics. Short-time stagnation causes decay and releases odor. Clogging and poor gradient need to be corrected. Hydrogen sulfide is blamed for odor. It is produced when sanitary wastewater goes under anaerobic conditions in stagnant wastewater by the reduction of sulfate [7,8].
SO C 2H O H S 2HCO2 2 342 2− −+ + → + (15.1)
In urban areas, many buildings have basements. Sanitary wastewater generated in basements needs to be stored at tanks before it is pumped up to sanitary cleanouts. In some cases, wastewater decays in the tanks and releases odor through manholes and catch basins of combined system when wastewater is pumped and discharged to public sewer. Not only odor but also corrosion of pipes, cleanouts, and man-holes takes place. In addition, maintenance workers are killed in worst case. Structural defects of the tanks, long pump operation intervals, and low frequency of cleaning are blamed for odor development. Odor from fuel needs to be handled carefully as it is flammable.
15.3.3 Prevention of Flying Manhole
Manholes provide access for cleaning, inspection, repair of sewer lines, and water sampling. They are basically installed where different sewer lines meet, diameter and slope of the lines change, and some critical issues for sewer maintenance are expected.
When it rains heavily with the rainfall intensity above design level, manhole covers can be ejected due to the pressure of water and air inside. In some cases, pedestrians on streets are injured, and cars and properties are damaged. As shown in Figures 15.10 through 15.16, hydraulic explanation includes the following cases: water hammer, compressed air movement, backwater, high hydraulic gradient, head loss increase, and hydraulic jump. Figure 15.17 shows one of the examples of the relief manhole cover.
Considering the various phenomena given earlier, the fundamental solution to prevent flying man-holes is to increase the capacity of sewer network and pumps. Modification of pump operation may help to some degree to prevent ejected manholes, such as slow lowering at emergency gates. In addition, pressure release is also another solution, such as by installation of sewer chimney and pressure relief manhole cover.

331Sewerage System: Maintenance Technologies
Hydraulic gradient lineCover Air space Ground level
Sudden owinterruption
Gate
Pressure transmission
FIGURE 15.10 Water hammer.
Pressure �ow
Hydraulic gradient line
Ground level
Cover
Air space
FIGURE 15.11 Movement of compressed air.
Hydraulicgradient
CoverAir space
Sudden rise ofwater surface
FIGURE 15.12 Backwater.

332 Maintenance Technologies of Lifelines
Mild slope
Steep slope
Cover
Mild slope
Hydraulic gradient line
Cover
Pressure flowAir space
Movinghydraulic
jump
Hydraulicgradient
line
Up and downwater level
Pressure flow
FIGURE 15.14 Hydraulic jumps in sewer where compressed air gathers.
Hydraulicgradient
Cover Grandsurface
Pressure flow
FIGURE 15.15 High hydraulic gradient.
Cover
Hydraulic gradient line
Moving hydraulic jump
Steep slope
Mild slope
Pressureflow
Up and downwater level
Gravity flow
FIGURE 15.13 Hydraulic jumps at the junction of gravity flow and pressure flow.

333Sewerage System: Maintenance Technologies
References
1. R. Hinokimono (2001). All about Sewer. Issued by Environmental News Press, Tokyo, Japan (in Japanese).
2. Japan Institute of Wastewater Engineering and Technology (2007). Manual for Identifying Inflow and Infiltration by Computer Model, JIWET, Tokyo, Japan (in Japanese).
3. Japan Sewage Works Association (2007). Current Status and Challenge in 2007, JSWA, Tokyo, Japan (in Japanese).
4. Japan Sewage Works Association (2002). Guideline for CSO Control in 2002, JSWA, Tokyo, Japan (in Japanese).
5. Bureau of Waterworks, Tokyo Metropolitan Government (2004). Action Program for CSO Control, Tokyo, Japan (in Japanese).
Elevation ofwater level
Hydraulic gradient line
FIGURE 15.16 Head loss increase.
FIGURE 15.17 Pressure relief manhole cover.

334 Maintenance Technologies of Lifelines
6. Japan Sewage Works Association (2001). Guideline for Planning and Design of Sewerage System, Vol. I, JSWA, Tokyo, Japan (in Japanese).
7. Japan Sewage Works Association (2003). Guideline for Operation and Maintain of Sewerage, Vol. I, JSWA, Tokyo, Japan (in Japanese).
8. Japan Sewage Works Association (1999). Guideline for Safety of Sewer Manhole, JSWA, Tokyo, Japan (in Japanese).

335
16.1 Maintenance of Gas Pipelines and Distribution Lines
Gas companies shall preserve the integrity of gas distribution system to supply natural gas to customers at all times; therefore, they have to monitor the distribution system to maintain the system.
16.1.1 Key issues of System Maintenance
The maintenance of gas distribution system shall consist of preventive maintenance and corrective maintenance. The former shall be applied to ensure the integrity of gas distribution lines, and the latter shall be taken to restore damaged gas distribution lines.
Preventive maintenance involves the following issues: management of construction done by third parties, monitoring of ground settlement, maintenance of corrosion-protective devices, inspecting ser-vice connections to structures, inspection and pressure control of governors, and inspection of leakage.
Corrective maintenance consists of repair work and replacement of defects, shutting off of gas to prevent secondary damage, and removal of plug water.
16.1.2 Damage to Pipelines and the Preventive Maintenance
16.1.2.1 third-Party construction
Gas supply systems should not be damaged by third-party constructions such as road construction, water works, sewage works, civil works, and building construction works.
Gas companies are recommended to communicate third parties to collect appropriate information on construction plans, and gas companies should observe third-party construction to ensure the integrity of gas distribution lines during the construction. Necessary countermeasures should be provided before a third party starts construction, and a security patrol shall also be established during construction.
16Natural Gas Distribution
System: Maintenance Technologies
16.1 Maintenance of Gas Pipelines and Distribution Lines ...............335Key Issues of System Maintenance • Damage to Pipelines and the Preventive Maintenance • Corrective Maintenance • Maintenance of Database
16.2 Corrosion Inspection .......................................................................339Isolation Resistant Test • Inspection of Coating Damage • Corrosion Inspection Inside Pipe
References ......................................................................................................341
Nobuhisa SuzukiPIN Technologies
Hiroyuki HorikawaJFE Engineering Corporation

336 Maintenance Technologies of Lifelines
Lateral ground displacement and ground settlement induced by the effect of excavation, a jacking system, or a shield machine may deform gas distribution lines; therefore, gas companies shall recognize the effective zone of third-party construction. Figures 16.1 and 16.2 present schematic illustrations to estimate the effective zone where the ground can move due to the effect of construction works. The gas company has to protect or replace distribution lines when they are located in an affected zone of third-party construction.
Vertically installed steel bars, whose lower end is attached to the pipes and anchored to the ground, shall be useful to monitor the displacements of the distribution lines and the ground in the vertical direction when it seems to be difficult to predict the effect of third-party construction on distribution lines.
Both ends of the excavated portion of distribution lines shall be constrained by sheet piles or firm ground in order to minimize deformation. The exposed lines shall be protected with such appropriate devices as hanging supports, damage protectors, leak protectors, slide constraints, fixed supports, tem-perature absorbers, emergency shutdown, and damage protectors.
16.1.2.2 Management of corrosion Protection
The corrosion protection system shall be maintained for periodic monitoring of the electric current in order to ensure integrity of pipelines and distribution lines. In addition to the periodic monitoring of the pipelines and distribution lines, visual inspection and other inspection methods shall be conducted when the pipes are excavated. Damage to pipelines and distribution lines such as scratching and peeling shall
A0: Width of trench
(H tanθ)
H : Depth of trenchθ : Internal friction angle of soil
θH
A0
A
FIGURE 16.1 Affected area of excavation. (From Japan Gas Association. Design Code for High Pressure Gas Pipelines, 2014, p. 356.)
Subsidence
R : Radius of shield tunnelH : Cover depth of shield tunnelθ : Internal friction angle of soilR
A
H
θ
FIGURE 16.2 Affected area of a shield tunnel. (From Japan Gas Association. Design Code for High Pressure Gas Pipelines, 2014, p. 356.)
337Natural Gas Distribution System: Maintenance Technologies
be repaired by tape-wrapping. If corrosion of the pipelines and distribution lines is detected, the cause of corrosion should be investigated carefully, and possible repair methods should be performed.
In cases where pipelines and distribution lines are protected from corrosion by cathodic protection, the effectiveness of the cathodic protection shall be investigated measuring the potential between the pipe and the ground. Damaging potential differences can be caused by increasing stray current, metal contact, or electrical interference with structures constructed by other companies, malfunction of external power supply, termination of electric wires or bond, or insulation failure. Based on results of the investigation, the potential shall be confirmed to be in an appropriate range; otherwise, increase or repair of the external power supply and replacement of the bond wire shall be conducted. In order to avoid unexpected effects on other structures, liaison with other repair works shall be required between the companies.
16.1.2.3 Leak Detection
The Gas Business Act (Japan) requires that the leak detection of the gas distribution lines except plastic pipes shall be conducted with a proper method. Appropriate measures shall be conducted to ensure security around the pipelines after the detection of leakage. The leak detection can be performed by the following methods, which are a boring method, a gas detector, and a pressure integrity check.
16.1.2.4 inspection of Pipes Attached to Structures
Possible corrosion, damage, and leaks of structure-attached pipes shall be inspected, and the integrity of pipe and expansion joints shall be investigated. Corrosion of the clamps that support attached pipe and truss-type bridges for pipelines shall be inspected, and the integrity of the road bridges that the pipes are attached to shall also be inspected. Structure-attached pipes shall be inspected with respect to corrosion of and damage to and leakage from pipe. The integrity of mechanical joints and expan-sion joints shall also be inspected. Inspection shall be recommended with respect to the integrity of metal supports, corrosion and deformation of truss bridges for pipelines, and abnormality of attached road bridges.
16.1.3 corrective Maintenance
16.1.3.1 Repair of coating
Corrosion protection coating shall protect the steel pipe by covering the surface with materials such as plastics, which prevent electrochemical reaction. Corrosion protection coatings are effective to protect steel pipe from such electrolytes as soils and water and provide isolation from corrosive currents as well. Damaged coatings shall be repaired to maintain original condition with high-performance insulation sheets or plastic shrink tubes. A plastic sleeve is effective to protect cast iron pipes from corrosion.
16.1.3.2 Repair of Pipe
Distribution lines shall be repaired in cases where damage to the corrosion protection coatings has been left for a long time and the thickness reduction due to spontaneous corrosion is recognized and some defect that does not result in gas leakage occurs due to third-party construction. Those parts of high-pressure gas pipelines where damage and/or defects are detected shall be replaced by a new pipe.
The weld sleeve (see Figure 16.3) and the bead-on plate (see Figure 16.4) can be applied for the repair of the high-pressure gas pipelines in cases such that the remaining thickness of a scratched portion is recognized to still be sufficient compared to that required by the Gas Business Act, and the gas supply cannot be interrupted during the repair work of the scratched portion.
Steel repair bands (see Figure 16.5) can be used for the repair of damage of middle- and low-pressure distribution lines, where bands are attached by fillet-welding. Damage to cast iron pipes in middle- and

338 Maintenance Technologies of Lifelines
low-pressure distribution lines can be repaired with a pair of half-sleeves that shall be bolted up. Damaged portions of low-pressure plastic lines shall be cut off and replaced by a new pipe, and the heat-fusion repair saddle can be used.
16.1.4 Maintenance of Database
16.1.4.1 Maintenance of Pipelines
Maintenance of system drawings shall be a key issue for gas companies as drawings contain the most significant information of the gas distribution system with respect to the location of pipes and the
Nozzle for leak testFillet welding
Butt weldingWelding sleeve
(a) (b)
16
3.0 –1.0+1.5
+5° +5°–0°
26
19.5
12.73.
5
–0°30°
3.5
30°
1.0~
2.6
FIGURE 16.3 Welding sleeve: (a) setting and (b) details of welding. (From Japan Gas Association. Design Code for High Pressure Gas Pipelines, 2014, p. 381.)
Weld deposition repair
Pipe
FIGURE 16.4 Weld deposition repair. (From Japan Gas Association. Design Code for High Pressure Gas Pipelines, 2014, p. 379.)
1 in. plug with screw
SleeveSpacer
B
A
Detail of BDetail of A
FIGURE 16.5 Steel repair sleeve. (From Japan Gas Association. Design Code for Piping System—Volume of Maintenance, 1987, p. 267.)
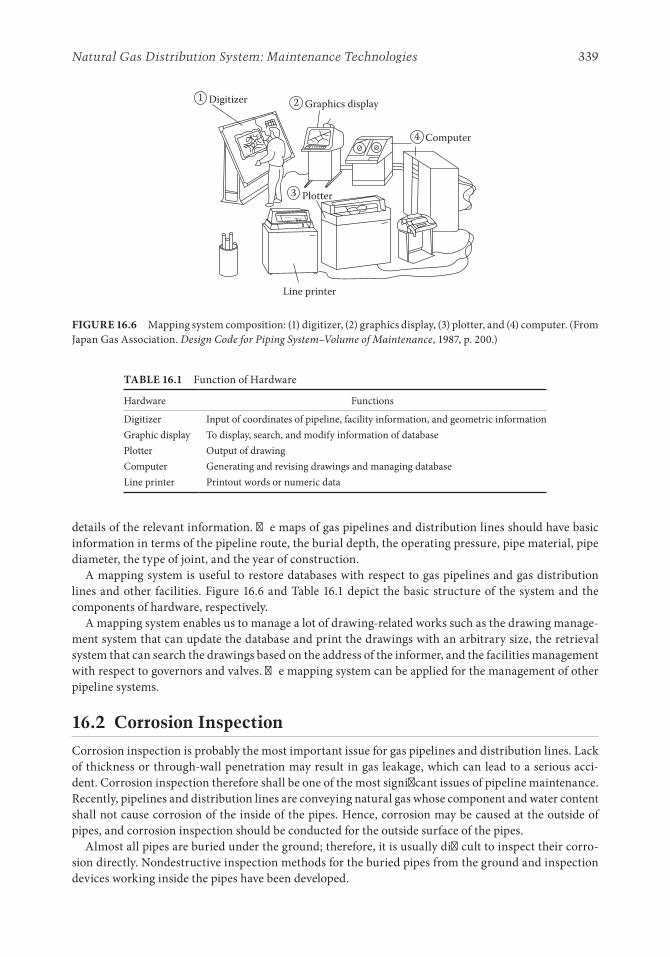
339Natural Gas Distribution System: Maintenance Technologies
details of the relevant information. The maps of gas pipelines and distribution lines should have basic information in terms of the pipeline route, the burial depth, the operating pressure, pipe material, pipe diameter, the type of joint, and the year of construction.
A mapping system is useful to restore databases with respect to gas pipelines and gas distribution lines and other facilities. Figure 16.6 and Table 16.1 depict the basic structure of the system and the components of hardware, respectively.
A mapping system enables us to manage a lot of drawing-related works such as the drawing manage-ment system that can update the database and print the drawings with an arbitrary size, the retrieval system that can search the drawings based on the address of the informer, and the facilities management with respect to governors and valves. The mapping system can be applied for the management of other pipeline systems.
16.2 corrosion inspection
Corrosion inspection is probably the most important issue for gas pipelines and distribution lines. Lack of thickness or through-wall penetration may result in gas leakage, which can lead to a serious acci-dent. Corrosion inspection therefore shall be one of the most significant issues of pipeline maintenance. Recently, pipelines and distribution lines are conveying natural gas whose component and water content shall not cause corrosion of the inside of the pipes. Hence, corrosion may be caused at the outside of pipes, and corrosion inspection should be conducted for the outside surface of the pipes.
Almost all pipes are buried under the ground; therefore, it is usually difficult to inspect their corro-sion directly. Nondestructive inspection methods for the buried pipes from the ground and inspection devices working inside the pipes have been developed.
Digitizer1 2
3
4
Graphics display
Computer
Plotter
Line printer
FIGURE 16.6 Mapping system composition: (1) digitizer, (2) graphics display, (3) plotter, and (4) computer. (From Japan Gas Association. Design Code for Piping System–Volume of Maintenance, 1987, p. 200.)
TABLE 16.1 Function of Hardware
Hardware Functions
Digitizer Input of coordinates of pipeline, facility information, and geometric informationGraphic display To display, search, and modify information of databasePlotter Output of drawingComputer Generating and revising drawings and managing databaseLine printer Printout words or numeric data

340 Maintenance Technologies of Lifelines
16.2.1 isolation Resistant test
Corrosion of steel is an electrochemical phenomenon, in which a current flows from the steel (the anode) to a cathode, providing a sacrificial anode diverts the current away from the steel, preventing its corro-sion. Cathodic protection is often appropriate to protect long-distance pipelines from corrosion. Those pipelines protected by cathodic protection shall be maintained to avoid generating excessive current, which shall be monitored periodically.
16.2.2 inspection of coating Damage
There are gas distribution lines, water distribution lines, electric lines, sewage lines, and telecommuni-cation lines that are buried in the underground, and they are constructed in a narrow zone where there is very high possibility that gas distribution lines may be damaged by the construction work by a third party.
Welded pipelines for gas distribution are protected by anticorrosion coatings on the surface to avoid damage or scratch. Once the coatings were damaged or scratched, they may result in the corrosion of pipeline.
16.2.3 corrosion inspection inside Pipe
16.2.3.1 Monitoring camera
There are some systems of cameras that can be applied to monitor the inside of the pipe; some cameras will be able to observe the pipe within a very narrow range; furthermore, some camera robots mount a video system and have a self-driven system. These camera systems are applicable to monitor the inside of pipe; however, they will not be able to inspect the inside of the pipe. Most self-driven camera systems do not have an explosion integrity system; therefore, the pipeline containments shall be purged and replaced by nitrogen before sending the cameras into the pipeline. A caterpillar drive system and a mag-netic wheel drive system are used for the camera maneuvering systems. The camera robot requires an umbilical cable, therefore, it will not be able to drive beyond several hundred meters due to its weight. While these camera system are applicable for observing the inside of pipe, some camera robots are able to measure the depth of a corroded pit or a mechanical flaw using projecting laser slits to the object. Some camera robots provides an ultrasonic thickness gauge to measure pipe thickness.
16.2.3.2 inspection Pig
Inspection pigs driven by gas pressure, which consist of a series of capsules in which measuring devices are installed, are generally used to measure the thickness loss along the entire length of high-pressure gas pipelines. Magnetic flux leakage (MFL) pigs have generally been used for inspection, which are able to detect the existence of other metals near the pipelines. The principle of the MFL system is schematically presented in Figure 16.7, where the disturbance of magnetic flux induced by
External metal loss External metal loss
Internal metal loss Internal metal loss
Steel pipe Steel pipe
Magnetic flux Magnetic flux
Primary sensor Secondary sensor
Detected
Not detectedMagnet
FIGURE 16.7 Corrosion inspection by magnetic flow leakage method.

341Natural Gas Distribution System: Maintenance Technologies
the thickness loss is measured with magnetic sensors. Very high skill on the operation is required to obtain the precise data.
The distance of inspection is measured with a roller gauge traveling on the pipe wall. If there are tee junctions in a pipeline to be inspected, a steel bar shall be attached to every tee junctions to guide the drive of the inspection pig. In addition to that, valves and other hazards shall be removed before the inspection. Furthermore, the radius of pipe bends shall be enough to allow the passage of inspec-tion pig.
References
1. Japan Gas Association. Design Code for High Pressure Gas Pipelines, Japan Gas Association, Tokyo, Japan, 2014, pp. 356, 379, 381.
2. Japan Gas Association. Design Code for Piping System—Volume of Maintenance, Japan Gas Association, Tokyo, Japan, 1987, pp. 200, 267.


343
17.1 Maintenance technologies of Underground transmission Facilities
Maintenance work is basically carried out in accordance with the standard procedure as shown in Figure 17.1 [1]. The procedure states the following steps: First, daily rounds and inspection are con-ducted to assess performance degradation and deterioration of facilities, then the identified facilities are evaluated to determine whether detailed inspection is necessary based on appropriate criteria. Second, the identified facilities that need to be inspected in detail are evaluated to decide whether remedial measures are needed or not. Finally, appropriate remedial measures are considered and implemented in the facilities that need to be restored.
17.2 Daily Rounds and inspection of Underground transmission Facilities
Daily rounds and inspection are intended to discover performance degradation and deterioration of facilities as early as possible, assessing the state, the function of the facilities, and the environmental conditions. They also aim at preventing accidents and any other trouble, assuring safety for third parties and workers, enabling stable power supply, and ensuring environmental preservation. The daily rounds are intended to obtain information on other utility constructions that may affect the performance of facilities, details of deterioration and damage, and events on the concerned routes. The daily rounds are based on visual observation to check damage and/or deterioration on the surface of facilities without using any apparatus. The inspection is mainly based on detailed procedures using apparatus to identify
17Electric Power System:
Maintenance Technologies
17.1 Maintenance Technologies of Underground Transmission Facilities ....................................................................343
17.2 Daily Rounds and Inspection of Underground Transmission Facilities ....................................................................343Daily Rounds • Inspection
17.3 Diagnosis of Underground Transmission Facilities ....................345Inner Condition of Conduits • Buried Position of Conduits • Detection of Used Steel Conduit
17.4 Remediation Measures of Underground Transmission Facilities ....................................................................345Pasting Repair Materials • Gap and Routing • Gap-Filling • Replacement of Conduits
Reference ...................................................................................................... 346
Keizo OhtomoCentral Research Institute of Electric Power Industry
Yoshiharu ShumutaCentral Research Institute of Electric Power Industry

344 Maintenance Technologies of Lifelines
damage and/or deterioration of members/segments of facilities. Periods of daily rounds and inspection are specified under safety standards authorized by individual utility companies.
17.2.1 Daily Rounds
It is impossible to detect damage or deterioration of members/segments of conduits by visual inspec-tion. Ordinary daily rounds collect information on other utility construction works on the concerned routes and check the ground surface deformation by visual observations. Ordinary daily rounds are car-ried out once or twice a year according to the safety standard/manual of an individual utility company. Extraordinary daily rounds are intended to identify as early as possible events that are likely to affect the concerned facilities. They are also based on visual observations to check unusual conditions encompassing the facilities similar to the ordinary daily rounds. The extraordinary daily rounds is carried out on an as necessary basis.
17.2.2 inspection
The purpose of periodic inspection is to check the continuity of conduits. The inspection is gener-ally performed by passing a mandrel (wooden tool) throughout the conduit. This method investigates whether the inside of conduits are blocked or not. It also identifies obstacles in conduits like soils, which
Start
Daily rounds and inspection
Likely of damage/deterioration?
Diagnosis
Yes
No
No
Yes
Necessary of remedial measures?
Determination of remedial method
Remedial measures
End
FIGURE 17.1 Flow of maintenance of underground transmission facilities.

345Electric Power System: Maintenance Technologies
may be attached on the mandrel. Periodic inspection is basically carried out every 6 years or every 12 years depending on the type of a conduit or past experiences of blockage. Extraordinary inspec-tion is carried out for the following cases: The inside of a conduit is blocked; mechanical damage of the conduit is detected; large-scale neighboring constructions are on-going. Extraordinary inspection is usually conducted using a television camera that sends visual information regarding the inner condition of the conduit. The frequency of extraordinary inspection is on an necessary basis unlike the periodic inspection.
17.3 Diagnosis of Underground transmission Facilities
Tests and surveying methods are employed to evaluate the damage and/or deterioration of facilities obtained by the periodic inspection results, to judge whether remedial measures are necessary or not, and to make the subsequent selection of appropriate remedial measures. The test and survey methods for conduits can be classified depending on what should be checked:
1. Investigation of the inner condition of a blocked conduit 2. Investigation of the embedded position of conduits 3. Detection of used steel conduits
17.3.1 inner condition of conduits
Methods to investigate the inner condition of a conduit include imaging, sound reflection measure-ments, and sensing measurements. The imaging directly checks damage and/or deterioration like crack-ing, separation, loss of partial section, opening of joints, dislocation, water infiltration, soil inflow, and obstacles based on the images obtained by a charge-coupled device (CCD) camera. The recently devel-oped sound reflection method aims to assess damage and/or deterioration of conduits by analyzing the reflection of sound waves. The sensing method measures the geometry of conduits, drawing appropriate contact sensors into the conduits. This method is intended to confirm effective inner diameters after remediation of the inner surface of conduits, making it possible to assess the spatial distribution of inner diameters along the longitudinal direction of the conduits.
17.3.2 Buried Position of conduits
Buried position of conduits can be investigated by an alignment survey. An alignment survey is per-formed when positioning errors are deemed to be serious between on the drawing and the on-site. A gyrocompass may be used for this purpose.
17.3.3 Detection of Used Steel conduit
Detection of used steel conduits is performed for conduits constructed several decades ago with uniden-tified materials. The investigation is mainly performed using a suitable sensor. If power cables are laid and electrified, the steel conduit may saturate the sensor due to large electric current. To avoid this situ-ation, the detection of a steel conduit is often carried out.
17.4 Remediation Measures of Underground transmission Facilities
Remediation is undertaken in buried transmission facilities based on comprehensive conclu-sions obtained from daily rounds, inspections, and testing and surveying results. It is important to select appropriate remedial measures depending on the state of damage and/or deterioration of the

346 Maintenance Technologies of Lifelines
members/segments of the concerned facilities. Remediation of conduits is generally implemented when the laying of power cables is undertaken or planned in the near future. Remediation technologies for conduits can be classified into local and global types with respect to the targeted remediation areas, as well as non-open-cut and open-cut methods depending on the construction works. The methods are further grouped into pasting repair materials, gap-filling, and replacement.
17.4.1 Pasting Repair Materials
Pasting repair materials fixes localized damage (cracking, partial loss of section, opening, dislocation, water leaking, etc.) by pasting materials on the inside of conduits. Repairing materials are usually com-posed of glass fiber and resin. Methods of pasting include compression, compression and thermal dry-ing, compression and mechanical, reverse compression, and ultraviolet ray drying.
17.4.2 Gap and Routing
Gap and routing removes foreign objects like roots of trees, gaps, and openings inside conduits using a cutter. Air- and powered-motor cutters are usually used.
17.4.3 Gap-Filling
Gap-filling repairs not only partial loss of conduits but also ground gaps encompassing conduits and volume loss of a concrete-wrapped conduit. Filling can be completed in the following manner: First, expanding packers that cut off and seal the inner space are placed at the back of the partial loss of con-duits, expanded by chemical feeding and sealing the location. Second, chemical feeding is performed to fill the inner space of the conduit as well as the location of partial loss of the conduit. Finally, the dried chemical is removed by a cutter, and then a lining is applied on the inner surface of the conduit.
17.4.4 Replacement of conduits
Replacement of conduits is executed to repair partial damage inside conduits. First, the location of partial damage is identified by removing overburden soils. Second, appropriate repair or replacement is performed. This method is employed if open-cut works are possible in the case where there are no options to repair from the inside of conduits.
Reference
1. Electric Technology Research Association. Maintenance technology of duct lines and utility tunnels for underground transmission lines. Electric Technology Research, 64(1), 52–75, 2008 (in Japanese).

347
18.1 Maintenance of telecommunications civil Facilities
18.1.1 current Status of telecommunications civil Facilities
18.1.1.1 conduits and Manhole Facilities
Conduits and manhole facilities are mostly situated in underground spaces, so they are required to have sufficient strength to withstand long-term external pressures caused by road surface loads, vehicle loads, and the like, and they must also have sufficient space for cable laying to facilitate the laying and removal of cables.
The NTT Group owns a very large amount of facilities, including some 630,000 km (about 390,000 miles) of conduits and about 690,000 manholes. Many of these facilities were built during Japan’s postwar economic growth period and are now showing signs of pronounced degradation due to their advanced age. Figure 18.1 shows the rate at which the number of conduit facilities has been growing year on year, and Figure 18.2 shows the corresponding trend in the number of manholes.
According to the results of conduit facility inspections performed so far, about 25% of conduits have defects that make it difficult to lay cables, and it has become clear that metallic pipes degrade at a higher rate than rigid polyvinyl chloride pipes. The causes of defects in metallic pipes are shown in Figure 18.3. In over half of all cases, it has become impossible for cables to pass through due to the formation of rust. Furthermore, the ratio of metallic pipes that fail duct rodding tests tends to be higher in facilities that are older.
18Telecommunication
System: Maintenance Technologies
18.1 Maintenance of Telecommunications Civil Facilities.................347Current Status of Telecommunications Civil Facilities • Maintenance and Administration of Telecommunications Civil Facilities • Preventing Facility Accidents • Cable Tunnel Management System
18.2 Inspection and Diagnosis Technologies for Telecommunications Civil Facilities .............................................355Technologies for Inspecting and Diagnosing Conduits and Manhole Facilities • Cable Tunnel Inspection and Diagnosis Technology
18.3 Repair and Reinforcement Technologies for Telecommunications Civil Facilities .............................................367Repair and Reinforcement of Conduits and Manhole Facilities • Repair and Reinforcement of Cable Tunnel Facilities
References ......................................................................................................380
Takanobu SuzukiToyo University
Fumihide SuginoNTT Access Network Service Systems Laboratories
Katsumi SakakiNTT Access Network Service Systems Laboratories

348 Maintenance Technologies of Lifelines
On the other hand, manholes can exhibit various different forms of deterioration, including wear of the iron lid, misalignment with the conduit facility, rattling, cracking of the pavement surface or edging concrete around the iron lid, vertical displacement, grade ring cracking, gaps, water leaks, framework cracking, exposed rebars, breakages, or deterioration of the duct parts. Of these, deterioration of the iron lid is the most common problem. As wear progresses, vehicles running over the top of the manhole are more likely to skid, and as the step between the iron lid and receiving frame becomes larger, there is not only more rattling and noise when vehicles pass over it, but also the resulting increase in impact loads can lead to the iron lid being knocked out or broken.
The increasing deterioration of facilities will impair the ability to respond promptly to demand for optical telephony services in the future, and will increase the costs of maintenance and administration. It is therefore essential to ensure that existing facilities are appropriately maintained, that problems are diagnosed in an efficient and timely manner, and that degraded facilities are repaired, regenerated, or renewed so that they can continue to be used into the future.
×10,00030
25
20
15
10
5
0
~1960~1980
~2000
FIGURE 18.2 Number of manholes constructed per year.
Thou
sand
km
Year
0
50
100
150
200
~1960~1980
~2000
Vinyl pipePolyethylene steel pipeJute covered steel pipeCast iron pipe
FIGURE 18.1 Number of conduits constructed per year.

349Telecommunication System: Maintenance Technologies
18.1.1.2 cable tunnel Facilities
Cable tunnels are facilities that accommodate large numbers of communication cables as trunk routes of the network inside urban areas, and the interiors of these structures are made large enough to enable the laying, maintenance, and management of cables. To support the development of an advanced infor-mation society, the NTT Group has a great deal of cable tunnel resources at its disposal (approximately 630,000 km nationwide). Most of these were built before 1985. Cable tunnels must be used as highly reliable facilities into the future to support the progress of the switch to optical communications, but with the passage of years after the construction of these facilities, deterioration due to various factors can become more pronounced, and, in particular, cases arise where it is necessary to perform repairs or reinforcement work on a large scale. Figure 18.4 shows the structure of cable tunnel facilities con-structed in different years.
To ascertain the state of degradation of the main body of a cable tunnel, periodic inspections are per-formed every 3–5 years. The characteristic degradation of open-cut tunnels includes flaking, cracking, and water leakage that occur as the concrete becomes progressively neutralized.
Joint failure4%Breaking
4%Bending
10%
Clogged with earth and sand
10%
Flattening20%
Rust52%
FIGURE 18.3 Causes of defects in metallic pipes.
~1960~1980
~2000
Year
km
0.0
20.0
40.0
60.0
80.0
100.0
120.0
140.0
160.0Open-cut tunnelCable tunnel constructedby the shield method
FIGURE 18.4 Number of cable tunnels constructed per year.

350 Maintenance Technologies of Lifelines
Tunnels constructed by the shield tunneling method are more recent than open-cut tunnels, but 8 out of 10 of these facilities were built by 1990 and are therefore expected to undergo progressive deteriora-tion in the future in the same way as open-cut tunnels. The typical forms of degradation in tunnels built by the shield tunneling method are water leakage in the vertical shaft attachment parts and from cracks in the shield itself.
18.1.2 Maintenance and Administration of telecommunications civil Facilities
18.1.2.1 conduits and Manhole Facilities
Breakages of conduits and manholes can not only interrupt communication services but can also cause roads to collapse, so any abnormalities discovered during inspections must be promptly repaired or renewed. However, as urban construction becomes more advanced, problems such as the growth in road installations and depletion of the space underneath roads are becoming more serious, and it is becoming difficult to repair and renew facilities by means of excavation. To respond to these problems and facilitate the effective use of facilities over longer lifetimes, efficient facility management and planned repairs and renewals are necessary. Figure 18.5 shows the workflow associated with the inspecting, diagnosis, repair,
Develop medium/long-term maintenance plan
Develop facility checking plan
Check facility
Decide if facility is good or poor
Manage state of facility
Clean out poor equipment
Prioritization
Develop plan for repairs and renewals
Annual equipment improvement plan
Indicate intentions at road coordinating council
Implement repairs and repairs and renewals
Manage history of repairs and renewals
Calculate management index, etc.
FIGURE 18.5 Maintenance workflow of conduit and manhole facilities.

351Telecommunication System: Maintenance Technologies
renewal, and management of conduits and manhole facilities. To resolve degraded facilities efficiently, planned measures are taken with priority given according to the degree of degradation and danger [1].
18.1.2.2 cable tunnel Facilities
Unlike a conduit facility, a cable tunnel can be inspected visually because the communication cables are laid and maintained inside a tunnel. In practice, the inspections are divided up as follows:
1. Routine inspections performed when entering a cable tunnel 2. Periodic inspections performed every 3–5 years 3. Detailed inspections performed to determine the state of degradation and its causes 4. Special inspections performed when it is necessary to understand the situation in an emergency
The results of these inspections are stored in a database together with the details of repair work and are used for history management in order to properly judge how the cable tunnels are deteriorating over time. By properly managing the process from inspections to repairs in this way, it should be possible to minimize the overall life cycle costs (LCCs).
To perform cable laying and maintenance inside a cable tunnel, it is essential to ensure the safety of workers and provide a safe working environment. For this purpose, various additional facilities are pro-vided inside the cable tunnels. These include hardware facilities for the installation of cables inside the tunnel, disaster prevention facilities for dealing with sudden disasters, adequate lighting for work inside the tunnel, electrical facilities such as ventilation equipment, and other facilities such as signage and water supplies. The basic concepts of inspections and maintenance are essentially the same as discussed in Section 18.1.2.1, except for items governed by relevant laws such as electrical facilities and disaster pre-vention facilities, in which case the inspections and maintenance are carried out according to these laws.
18.1.2.3 Life cycle cost and Service Life
Hitherto, when constructing new telecommunications civil facilities, most attention was focused on how to achieve the desired quality while suppressing the construction costs (initial investment), but in practice there are other costs incurred after construction in the maintenance, operation, repair, and disposal of these facilities. The total of all these costs is called the life cycle cost (LCC), and today it is important to evaluate the economics of a facility’s LCCs over a long service life when dealing with tele-communications civil facilities. The LCCs include the initial investment costs, depreciation, occupation fees, the cost of inspections, fixed asset management costs, tax, repair costs, and disposal costs.
However, there have so far been few studies that have actually considered the LCCs of these facilities. There are various reasons for this including the difficulty of quantitatively evaluating the deterioration of facilities, the difficulty of estimating the costs of repairs and renewal several decades into the future, the low precision of estimates of maintenance costs and renewal costs from the initial investment costs, and the bias toward evaluating economic efficiency based on the initial investment costs.
However, now that there are many facilities that were built at least 30 years ago, a large amount of data have been collected. As a result, it is now possible to perform a rational economic evaluation based on the LCCs and considering the facility’s life cycle as a time axis. Today, we are transitioning from an era of construction into an era of maintenance, and heuristics are needed to make rational decisions as to where it is better to renew these facilities instead of repairing them.
18.1.3 Preventing Facility Accidents
Like other lifeline facilities, most telecommunications civil facilities are constructed on land occupied by roads and the like. Therefore, when construction work is performed near telecommunications civil facili-ties, consultations are held between the service provider carrying out this work, the road administrators, the police, and other such organizations to discuss the state of the facilities, the scale of the work, and so on, so as to prevent accidents in the facility and avoid undesirable effects on communication services.

352 Maintenance Technologies of Lifelines
18.1.3.1 observation Work
To prevent facility accidents due to adjacent construction work, it is essential to gather information about construction work. When work is performed adjacent to telecommunications civil facilities, it is obligatory to perform site observation according to the related statutes (enforcement order 15, article 2 of Japan’s road law, and Chapter 5, item 15 of the summary of disaster prevention measures for public construction works). To obtain information about adjacent installations, an information gathering sys-tem must be set up.
Prior consultations are held to inspect whether or not there will be any effects on the telecommunica-tions civil facilities from adjacent installations, and what sort of observation or protection measures are needed, and a future observation plan is prepared. Observations are performed efficiently by taking each opportunity from the design stage of the adjacent facilities through to the completion of their installation.
18.1.3.2 consultation with neighboring construction
When there is a neighboring construction, the proximity of this construction is determined, and is categorized as lying either within the range where measures must be taken (the range where it is considered that harmful effects such as displacement or deformation will occur due to the neighbor-ing construction) or within the range where caution is required (where harmful effects may occur on rare occasions).
18.1.3.2.1 Conduit FacilitiesWhen excavation is performed adjacent to a conduit, the danger of being affected varies with criteria such as the soil, the scale of excavation, the backfilling method, and whether or not any left-over soil has to be removed. The affected range is determined by the excavation depth, the soil’s internal friction angle, and separation distance, but particularly in the case of open-cut installations, the protection measures are to be changed according to the separation distance.
As a result of studying the affected range, studies are made of protection methods where the conduit facility itself is exposed, and where the conduit is not exposed but work enters the affected range. Figures 18.6 and 18.7 show examples of how an exposed conduit can be protected.
18.1.3.2.2 Cable Tunnel FacilitiesDecision lines based on soil criteria (internal friction angle and cohesion) and the scale of the cable tunnel, and adjacent installation are drawn on plans, showing the positional relationship between the cable tunnel and the adjacent installation, and these are used to determine which region the adjacent construction encroaches into. Since cable tunnels can be difficult to recover if there is an accident,
1.5 m spacingSquare timberSquare timberClamp
Wire rope
Turnbuckle
Wire ropeor
steel wire
≥60 cm
FIGURE 18.6 Conduit protection example (hanging protection).

353Telecommunication System: Maintenance Technologies
an impact assessment is performed according to Table 18.1 in order to investigate the need for protec-tion by quantifying the effects of adjacent installations.
If adverse effects on the cable tunnel are expected as a result of this impact assessment, consulta-tions on suitable protective measures are held with the parties involved in the adjacent installation. Protective measures can include modifications to the construction method used by the adjacent instal-lation (including auxiliary methods) and protective measures implemented on the side of the telecom-munications civil facilities. Furthermore, the measurements are managed to inspect if any behavior predicted from the impact analysis results is actually occurring, or if the protective measures are hav-ing the desired effect, for example. Ordinary measurement items include the amount of subsidence (as measured by settlement gauges, marker sticks, ground level measurements, or the like), the ground slope (as measured by clinometers, transit measurements, or the like), and the amount of displacement in the interior space (measured by displacement gauges, pipe scale measurements, or the like).
18.1.4 cable tunnel Management System
18.1.4.1 System overview
18.1.4.1.1 Purpose of Introducing a Management SystemAs cable tunnels get longer and are incorporated into the mesh of networks, the need arises for disaster prevention measures inside tunnels, safety measures for pit workers, and measures for making manage-ment work smoother and more energy-saving. Cable tunnel management systems are being developed to meet these needs.
The principal functions for disaster prevention include the prompt detection of fire, flammable gas, oxygen depletion, and flooding inside cable tunnels, and allowing an observer to accurately monitor the conditions inside the tunnel so that disasters can be kept to the bare minimum.
Crosstie
Support pile
1.5 m spacing
FIGURE 18.7 Conduit protection example (bearing protection).
TABLE 18.1 Procedures for Investigating the Effects of Adjacent Construction Work on Cable TunnelsInput to cable tunnel as
ground deformationBeams on an elastic floor in the cable tunnel are modeled, and the cross-sectional
forces in the cable tunnel are derived by inputting the calculated earth deformation as a forced deformation in parts where the cable tunnel is in contact with the ground.
Cable tunnel and ground treated as an integral whole
An overall solution is obtained by investigating the characteristics of elements partitioned by modeling the cable tunnel with beams and the like and the ground with an elastic material or the like.
Applying loads to the cable tunnel
The model used when designing the cable tunnel is recalculated using loads based on the changes in ground stress associated with adjacent construction.

354 Maintenance Technologies of Lifelines
Functions aimed at ensuring the safety of workers include constantly monitoring the number of workers inside the tunnel and inspecting on the safety of workers by providing suitable evacuation guid-ance to these workers when a disaster occurs. Functions aimed at making management work smoother and more energy-saving include reducing the workload of maintenance work by centralizing the man-agement of ancillary facilities installed inside the cable tunnel.
18.1.4.1.2 System ConfigurationThe cable tunnel management system includes various sensors that constantly monitor the conditions inside the cable tunnel, an integrated monitoring center that monitors the information from these sen-sors around the clock, and a monitoring response center that monitors the stats of the cable tunnel by receiving information from the integrated monitoring center. The configuration of the cable tunnel management system is shown in Figure 18.8.
18.1.4.2 Monitoring and control Functions
1. Disaster-sensing function: When fire, flammable gas, oxygen depletion, a high water level, or flooding has been detected inside a cable tunnel, this function displays information about the problem such as its type and location on alarm display equipment and operating terminals at the integrated monitoring center and monitoring response center.
2. Facility management function: This monitors the status of ventilation, drainage, and electrical equipment inside the cable tunnel, sends reports in real time to the integrated monitoring center on the occurrence, cancellation of equipment faults, and the operation/stoppage of equipment, and controls the facilities inside the cable tunnel according to instructions from equipment at the center. It also includes a function for performing automatic control operations such as operating and stopping ventilation equipment and issuing alerts when a disaster has occurred.
TCE
DSUDSU
DSUDSU
Integrated monitoring center
Line switchingequipment
Operator terminal S
Operator terminal W
Broadcast equipment
Monitoring response center
Alarm display equipment
Operator terminal W
NTT building
Monitoring and control equipment
Electronic lock
Inside cable tunnelEquipment for counting workers in tunnel
Ventilation facilities, etc.
Evacuation guidance lights
Speakers Sensors (disasters, equipment malfunction, etc.)
FIGURE 18.8 Configuration of cable tunnel management system.

355Telecommunication System: Maintenance Technologies
3. Access management function: This function makes it possible to inspect people entering and leav-ing a cable tunnel by installing electronic locks that can be operated by magnetic card readers and push buttons. By mounting devices such as video cameras and phones at points of access and using them in combination with ID cards (ID terminals), it is possible to unlock the doors remotely after inspecting the identity of people entering the cable tunnel. By installing people-counting machines, it is also possible to inspect the number of people inside the tunnel and their locations within it.
4. Broadcasting and communication function: By using ordinary telephones on public phone lines together with broadcast devices on dedicated lines and microphones attached to the main equip-ment, this function supports broadcasting and two-way communication with people inside the cable tunnel via speakers installed inside the tunnel.
5. System inspecting function: This function stops the broadcast of disaster information to the center by providing device inspection notifications from the equipment at the center.
6. Fail safe function: This function collects information directly from the terminal control equip-ment (TCE) without going through the equipment at the monitoring center, and is therefore able to display information regardless of whether or not the equipment at the monitoring center is functioning properly. This function is able to ensure the system’s overall safety regardless of whether or not there are faults in the system.
7. Operational management function: This function records and updates constants needed for the operation of the system, such as TCE information, operator terminal records, and I/O allocation information.
18.2 inspection and Diagnosis technologies for telecommunications civil Facilities
18.2.1 technologies for inspecting and Diagnosing conduits and Manhole Facilities
18.2.1.1 Ascertaining the State of Degradation
Routine maintenance work is performed for the management of resources and the like, and to keep telecommunications civil facilities operating into the future. This prevents problems such as curtail-ment of communication services, maintenance difficulties, and disruption of social activities from occurring due to deterioration of the facilities. The key requirements of routine maintenance are elimination of degraded states promptly through the accurate identification of degraded facilities and timely inspections and diagnosis. Table 18.2 illustrates the inspections performed to identify degraded equipment.
The functions required of telecommunications civil facilities include protecting the existing cables, ensuring the availability of vacant ducts for cable leading-in, securing a favorable work envi-ronment, and maintaining the strength and structure of the facilities so that they do not impede pedestrians or vehicles or disturb local residents or the like. Various factors must be considered at each step toward completion of the facilities (planning, design, and construction), and at each step in the maintenance of these facilities after they have been built. Figure 18.9 shows the maintenance management PDCA.
18.2.1.2 inspecting and Diagnosing conduit Facilities
Currently, the equipment used for inspections and diagnosis of conduit facilities includes passage inspection rulers to check how easy it is to install communication cables, and pipe cameras for visually inspecting the conditions inside pipes. Pipe cameras are used for preliminary checks before installing cables, and for preventative maintenance inspections.

356 Maintenance Technologies of Lifelines
ReliabilityMaintainabilitySupply and demand properties
Safety promotionFacility improvementImprovement of management efficiency
Maintenance division Business plan
Facility maintenance (checks, repairs, attendance, etc.) Facility operation (specify which duct to use)Management (facility management, process management, etc.)
Construction division
DevelopmentDesign and calculation
Inspection
Construction
Delivery
Evaluation of maintenance activities
Improvement plan for maintenance activities
Day-to-day maintenance work
FIGURE 18.9 Maintenance PDCA.
TABLE 18.2 Inspection Work
Work Item Detail of Checks
Patrol Patrol underground lines for environmental monitoringInspection of iron lid • Cracks, rattling, and edge breakage in iron lid
• Breakage of pavement around iron lid• Surface discontinuity between the edge of iron lid and road surface• Rust, locking/unlocking action of locking devices in manholes, and
so onInspection of manhole • Water leakage due to cracks in manhole, etc.
• Accessory equipment, noxious gasesInspection of conduits Use a mandrel or the like to check that cables are able to pass through, and
use a pipe camera or water jet or the like to check the state of degradation, find the causes of defects, devise suitable repair methods, and determine the repair period.
Inspection of lifting-up pipes Riser position, attachment conditions, whether or not repainting is requiredInspection of conduits attached
to bridge/private bridge• Facilities attached to bridges and private bridges• Fire protection, solar shielding, vibration prevention, access
prevention fences, etc.• Whether or not repainting is required
Inspection of high reliability conduits
This is a facility with improved maintainability where the jacking pipe and inner pipe (thin polyvinyl chloride pipe) form the main pipe as an integral structure, and where no checks are required. However, when laying cables, checks are performed as per check conduit mentioned earlier.
Minor repair Various types of repair, protection, and reinforcement can be performed on facilities at the same time as the checks for poor equipment.

357Telecommunication System: Maintenance Technologies
18.2.1.2.1 Passage Inspection RulersAt the completion of construction inspections on conduit facilities, passage check rulers (mandrels) are used to perform conduit passage tests to inspect that the conduit has enough space to allow cables to be passed through it, and to inspect that the conduit span length and alignment do not impair the cable’s mechanical characteristics or transmission characteristics. The mandrel structure is shown in Figure 18.10. If the mandrel can be pulled through with a prescribed tension, then it is possible to install a communication cable without any problems.
18.2.1.2.2 Pipe CamerasWhen mandrel passage tests have confirmed that it is not possible to pass through a conduit, detailed inspections with a pipeline camera are needed. The repair method is chosen after using a high perfor-mance pipe camera to clarify the problem inside the conduit (breakage, flattening, puncture, corrosion, joint secession, clogging with earth and sand, etc.). Also, when performing multicable laying, a pipe camera with a miniaturized camera part at the tip is used. Figure 18.11 shows an overview of a pipe cam-era. Also, Figure 18.12 shows an example of conduit facility diagnosis performed using a pipe camera.
18.2.1.3 inspection and Diagnosis of conduits Attached to Bridges
Conduit facilities attached to bridges and to private bridges are liable to be damaged by weather and human activity, and since these are places where routes are configured with a concentration of highly important cables, they must be inspected at suitable times, repainted and repaired when necessary, and constantly maintained in good working order. The occurrence of rust, corrosion, and the like not only impairs the outward appearance of the facility but is also thought to cause problems
Pipe camera
Monitor, video
FIGURE 18.11 Pipe camera.
(3,4 type)
φ73 L = 300 (3 type)L = 600 (4 type)
(Unit; mm)
10
FIGURE 18.10 Mandrel structure.

358 Maintenance Technologies of Lifelines
such as cable failures and damage to third parties, so it is important that it is properly inspected and appropriate measures are implemented.
The work of inspecting conduit facilities attached to bridges and to private bridges is basically per-formed visually and by means of simple tools and the like, but conduits attached to bridges over large rivers, valleys, highways, or the like can be difficult to inspect without special scaffolding or other such measures, in which case the inspections are performed using a bridge-attached facility inspection device with a video camera that allows inspections to be performed from the bridge. Figure 18.13 shows an overview of the inspections performed using a device that uses a video camera to inspect facilities attached to bridges.
18.2.1.4 inspecting and Diagnosing Manhole Facilities
A manhole facility can be broadly divided into the main body of the manhole, the grade ring, and the iron lid. Manholes used for telecommunications civil facilities must be capable of accommodating con-nections in communication cables in a favorable condition, and must be capable of ensuring that work can be carried out safely. Almost all manholes are situated in roads, where they are constantly subjected to external forces including earth loads, ground water pressure, and vehicle loading, so it is important to perform planned inspections and repairs.
The iron lids can be inspected visually for signs of wear, cracks, breakages, and the like, and can also be inspected by iron lid degradation diagnosis methods that use measuring instruments to measure the amount of degradation. Since cracks are difficult to inspect visually, the degree of degradation is determined by hammering vibration analysis using iron lid degradation diagnosis, and the remaining lifetime of the iron lid is estimated from the age of the installation. A checklist for manholes is shown in Table 18.3.
Pipe is very rusted and severe roughness is clearly visible
FIGURE 18.12 Example of diagnosis with a pipe camera.
Video check unit
Video cameraJoint use facility
Bridge
FIGURE 18.13 Checks performed using a device that checks facilities attached to bridges.

359Telecommunication System: Maintenance Technologies
When inspecting manhole facilities, it is important to implement adequate measures to prevent acci-dents from being caused by a build-up of flammable gases, oxygen depletion, toxic gases, or the like, and to prevent traffic accidents due to vehicles entering manholes or other such problems.
18.2.2 cable tunnel inspection and Diagnosis technology
18.2.2.1 Basic concepts of inspection and Diagnosis
18.2.2.1.1 AimConcrete structures are generally said to have excellent durability, but in some cases they can undergo pronounced deterioration from an early stage due to the use of improper materials, incorrect procedures while casting or curing the concrete, or harsh installation environments.
NTT owns a huge number of concrete structures, including approximately 630,000 km of cable tun-nels and approximately 840,000 manhole and handhole structures. Of these, about half of the cable tunnels are at least 20 years old, and are expected to become increasingly decrepit in the future. The maintenance and administration costs are trending upward each year, so there has recently been a need for efficient and effective maintenance investment in order to reduce these maintenance and adminis-tration costs. To allow these cable tunnels and manholes to be continued to be used in the future, it is necessary to assess the harmful degradation phenomena that reduce the lifetime of concrete structures, and to formulate an optimal maintenance and administration plan that takes factors such as the choice of repair times and methods into consideration from the viewpoint of LCC.
TABLE 18.3 Manhole Inspection Items
Part Manhole Structure,
Inspection Part Inspection Items
Main body Cast-in-place manhole Width, length, and position of cracks, etc.Water leakage from cracks, etc.Concrete peelingCracking/peeling of repairs/reinforcements
Cement block or resin block Width, length, and position of cracks, etc.Water leakage from cracks, etc.Concrete peelingCracking/peeling of repair materialsImproper adhesion between blocksWater leakage from joint surfaces
Grade ring Stacked-block grade ring Cracks in the main body of blocksGaps between blocks or between blocks and receiving frameGap from the manhole main bodyWater leakage from cracks and the like
Brickwork grade ring Cracks and water leakageMortar peelingGap between manhole main body and receiving frame
Concrete grade ring Cracks and water leakageGap between manhole main body and receiving frame
Iron lid Iron lid Iron lid wear, cracking, breakageInstallation of waterproof inner cover
Receiving frame Gap between iron lid and receiving frame, rattlingSurface discontinuity between receiving frame and surrounding
road pavementReceiving frame wear, cracks, and breakage
Locking device Key part of locking device rusted or clogged with earth and sandOpening/closing functionality of key part

360 Maintenance Technologies of Lifelines
18.2.2.1.2 Overview of Inspections and Inspecting MethodsThe business of inspecting cable tunnel includes daily inspections, periodic inspections, special inspec-tions, and detailed inspections (see Table 18.4). Inspections and diagnosis are ranked as upstream pro-cesses in the maintenance and management of facilities, and by accurately ascertaining the degradation phenomena in cable tunnels, the factors causing this degradation, and the soundness of these struc-tures, they play a vital role in devising suitable repair and reinforcement plans and reflecting them in the maintenance management policy for the entire cable tunnel.
18.2.2.2 Study items and Study Methods
NTT’s cable tunnels can be broadly divided into tunnels built by the open-cut method and tunnels built by the shield method. Open-cut cable tunnels are reinforced concrete structures with a rectangular cross section, and cable tunnels constructed by the shield method have a two-layer structure consisting of segments (made of steel or concrete) with a concrete inner lining. These are described separately as they have different structural forms and degradation mechanisms.
1. Periodic inspection of open-cut cable tunnels: Table 18.5 shows the main checklist for open-cut cable tunnels.
2. Periodic inspection of cable tunnels constructed by the shield method: Table 18.6 shows the check-list for cable tunnels constructed by the shield method.
3. Detailed inspections: For open-cut tunnels and tunnels constructed by the shield method, detailed inspections should be based on an accurate understanding of the relationship between degrada-tion phenomena and their causes.
TABLE 18.4 Inspection Type and Summary
Type of Inspection Inspection Cycle Summary
Normal inspection When entering tunnels
Cracks, water leaks, exposed rebar, flaking, peeling, discontinuity, gaps, and cable
Accommodation state/environment checked visually and with simple tools
Periodic inspection Every 3–5 years
Special inspection At any time Checks are performed in response to reports, disaster events, and internal or external requests
Detailed inspection At any time Detailed study of phenomena where degradation and its causes need to be clarified (and cannot be clarified by visual checks), such as the occurrence of voids, deformation or step discontinuities, and when judging the need for radical countermeasures
TABLE 18.5 Periodic Inspection Items and Details for Open-Cut Cable Tunnels
Inspection Items, Parts Detail
Cracking Maximum width, length, shapeWater leakage Degree of water leakage, and whether or not the water is rustyRebar The number of exposed rebars, exposed length, degree of corrosionFlaking, peeling Circumference, depthSurface discontinuity Step heightAperture Maximum widthDeformation DeformationOther(s) Presence or absence of water puddles, condensation, and deposits,
flowed-in soil from pit duct

361Telecommunication System: Maintenance Technologies
18.2.2.3 inspections and Diagnosis technology
This section describes the study methods used to ascertain the situation regarding pronounced damage to concrete surfaces, changes in the shape of concrete structures, the environmental surroundings of these structures, and so on [2].
18.2.2.3.1 Visual StudyA visual study can be used to appraise the state of degradation from the position and scale of damage occurring in the surface of a concrete structure such as cracks, peeling, and exposed rebars, deforma-tion of the overall concrete structure such as tilting and subsidence, and the surrounding environment in which the structure is placed. This is one of the most important sources of information that can be obtained for the diagnosis of concrete structures. In combination with impact acoustics methods, this can be used to ascertain the state of concrete flaking and peeling.
18.2.2.3.2 Digital CamerasA digital camera uses a charge coupled device (CCD) as an image sensor that electronically records the image projected onto it by the camera’s optical system. Such a camera can be used to produce visual records of the state of deterioration in concrete surfaces, and the changes in this state as time passes.
18.2.2.3.3 Internal Electro-Optical Measurement of Crack ScaleBy incorporating a crack scale into an electro-optical measuring device and lining it up against cracks, it is possible to remotely gather information about the width and three-dimensional coordinates of cracks simultaneously. These can be automatically joined together and expanded on a CAD system for the rapid preparation of drawings. This method is effective in ascertaining information such as the shape of cracks behind cables, which is difficult to inspect by ordinary visual means.
18.2.2.3.4 Electromagnetic Wave Method (Espar)This method can be used to nondestructively measure the current positions of reinforcement bars, con-crete coverings, cavities, and the like in concrete structures. These measurements are based on the prin-ciple that electromagnetic waves emitted from a transmitting antenna are reflected back at interfaces between concrete and other materials such as rebars and voids that have different electrical properties (dielectric coefficient, etc.). These reflected waves are received by a receiving antenna, and the depth of objects is calculated from the round trip delay between the transmitted and received waves and the speed at which these waves travel through concrete as shown in Figure 18.14.
The probe equipment comprises an antenna unit and a computer unit (display unit), and during measurements, a signal cable that transmits the signals from the antenna is connected to the computer unit. An example of this sort of equipment is shown in Figure 18.15.
TABLE 18.6 Periodic Inspection Items and Details for Shield Cable Tunnels
Inspection Items, Parts Detail
Cracking Maximum width, length, shapeWater leakage Degree of water leakage, and whether or not the water is rustyRebar, bolt, nut The number of exposed rebars, exposed length, degree of corrosionFlaking, peeling Circumference, depthSurface discontinuity Step heightAperture Maximum widthDeformation DeformationOther(s) Presence or absence of water puddles, condensation, and deposits

362 Maintenance Technologies of Lifelines
18.2.2.3.5 Electromagnetic Induction MethodWith the electromagnetic induction method, it is possible to estimate the positions of rebars and their depth and diameter. Other characteristics include its ability to estimate the positions of rebars even when there are voids or rock pockets in the concrete. When a magnetic flux is generated in a circular coil of wire, the magnetic flux density changes when the coil approaches magnetic objects such as rebars, so this change can be detected as a change in the electrical signal.
Direction of movement
Distance D
Buried object
Tim
e T
FIGURE 18.14 Principle of the electromagnetic wave method.
FIGURE 18.15 Example of an electromagnetic wave radar device.

363Telecommunication System: Maintenance Technologies
18.2.2.3.6 Repulsion Degree System and Repulsion Hardness MethodWhen a concrete surface is struck by a rebound hammer with fixed energy, there is a correlation between the hammer’s rebound height (repulsion) and the concrete’s hardness (Brinell hardness) and strength. This correlation can be used to estimate the compression strength of the concrete.
18.2.2.3.7 Macroscopic Ultrasonic MethodIn this method, ultrasound is applied to the concrete, and the conditions inside the concrete are diag-nosed by measuring the transmitted waves that propagate through the concrete and the reflected waves that are reflected from different materials. Previously, the received ultrasound waves contained large amounts of noise caused by the scattering of incident sound waves by water, air bubbles, and gravel inside the concrete. This made it difficult to identify the target reflected waves from features such as rebars or the bottom of the concrete, and made accurate diagnosis impossible.
A macroscopic ultrasonic method has therefore been developed whereby the signals are averaged together several thousand times while moving the ultrasound probe, after which the noise can be elimi-nated by using a frequency filter capable of detecting arbitrary frequency components, allowing the target reflected waves to be detected with high precision in around 10 s as shown in Figure 18.16. Here, macroscopic means that the target reflected waves are not found with pinpoint accuracy, but that all the reflected waves (including scattered waves and other noise) are received. The RC degradation diagnosis system developed by NTT is a nondestructive inspection device that uses the macroscopic ultrasonic method. The overall system is shown in Figure 18.17, and the measurement conditions are shown in Figure 18.18. The parameters measured by the RC degradation diagnosis system include crack depth, concrete thickness, and the location and depth of peeling and voids.
18.2.2.3.8 Milliwave Imaging SystemWhen concrete structures such as tunnels are left unattended with interior defects such as cracks and peeling, the strength of the structure is liable to decrease over time. To prevent this reduction in strength, it is essential to detect and repair these defects at an early stage, but in many cases the surfaces of concrete walls are covered with lining materials or other coatings after repairs have been made, mak-ing it impossible to observe small surface cracks after repairs have been made.
A milliwave imaging system is a measurement technology that uses electromagnetic waves called millimeter waves to see through surface layers with a reflection imaging method. When millimeter
Probe
Concrete (composite material)
Reflected wave
AveragingClear peak
Thickness
Reflected waves (scattered waves)
all received
Averaging frequency filter
Measured wave becomes clearly
visible
tt
0 0
FIGURE 18.16 Overview of the macroscopic ultrasonic method.

364 Maintenance Technologies of Lifelines
waves encounter a crack in the concrete, they are absorbed by the gaps formed by cracks, or scattered randomly by the unevenness of cracks. This property can be used to distinguish them from normal flat surfaces.
18.2.2.3.9 Brillouin Optical Time Domain ReflectometerThere are a number of optical fiber sensing technologies. A Brillouin optical time domain reflectometer (BOTDR) is one such technology that has been developed and put to practical use by NTT. In this technology, the frequency distribution of a type of backscattered light called Brillouin backscattering that occurs when a pulse of light is sent down an optical fiber exhibits a shift that is proportional to the fiber’s axial strain. This phenomenon is used to perform continuous strain measurements along the length of the fiber [3].
Unlike other technologies, this approach has various advantages, including
1. The ability to perform continuous measurements over distances of 10 km or more 2. Immunity to thunderstorms 3. No need for sensor power supplies
Main unit Probe
FIGURE 18.17 Reinforced concrete degradation test system.
Probe
FIGURE 18.18 Measurement situation.

365Telecommunication System: Maintenance Technologies
This technology has a wide range of applications such as monitoring equipment for landslides or embankment deformation in roadside embankments or river levees where there is a need for measure-ments to be made outdoors over a wide area, and measurements of the effects of subway construction work close to cable tunnels. BOTDR is used for purposes such as measuring the deformation of cable tunnels by nearby construction work as a replacement for conventional electrical sensing technology as shown in Figure 18.19.
18.2.2.3.10 Chipping InspectionAscertaining the actual position and state of rebars and the state of chipping and rebar corrosion provides essential basic data for the diagnosis and prediction of a structure’s soundness. In general, a structure’s outer layer of concrete is subjected to chipping tests as a way of checking visually for chipping, the type, diameter and condition of rebars, the state of corrosion, the concrete neutralization depth, and so on.
18.2.2.3.11 Self-Potential MethodThe self-potential method is an electrochemical method for diagnosing corrosion in steel rebars from the electrical potential at the rebar surface, which changes as it corrodes. This method was first used in the 1950s to survey the state of corrosion in the floor slabs of the Golden Gate Bridge in the United States, and in 1977 it was standardized by the American Society for Testing and Materials (ASTM).
18.2.2.3.12 Polarization Resistance MethodThis is an electrochemical method that estimates the rate of corrosion in internal rebars by obtaining the polarization resistance from changes in current or electrical potential that occur when a small electrical current or a potential difference is applied to an internal rebar from external electrodes in contact with the concrete surface.
18.2.2.3.13 Ultrasonic Thickness GaugesIn a cable tunnel built by the shield tunneling method, the residual thickness and the amount of corro-sion are diagnosed by measuring the wall thickness of tunnel segments. Measurements are performed after removing the secondary shield coating until the segment surface is exposed. Ultrasound waves are input into the steel places from a transmitter probe, and the reflected waves are picked up by a receiver probe. Depth measurements (plate thickness, internal crack locations, etc.) are obtained based on the propagation delay between the transmitted and received ultrasound waves and the propagation speed of ultrasound waves inside the steel plate.
Optical fiberIncident light pulse
Scat
tere
d op
tical
pow
er
Distance Optical frequency
Frequency shift of Brillouin scattered light is proportional
to strain
Strain distance
Detect Brillouin scattered light
Optical fiber strain measurement device
(BOTDR)Measurement process
Displacement and deformation of structure
Displacement/strain conversion mechanism
neededDistortion of optical fiber
Frequency measurement
Frequency shift
FIGURE 18.19 Overview of the BOTDR system.

366 Maintenance Technologies of Lifelines
18.2.2.3.14 Neutralization TestAn aqueous solution of phenolphthalein is sprayed onto a bore sample of the covering material to mea-sure the degree of harmful concrete neutralization with respect to corrosion of the steel material.
18.2.2.3.15 Chloride Content TestThe content of chloride ions in the concrete next to rebars due to rusting of the rebars can be ascertained by performing tests on pulverized core samples, or by extracting the salt components and measuring the concentration of chlorine ions in an aqueous solution, which is converted into an overall chloride quantity. The likelihood of rebar corrosion due to salt damage or infiltration paths is evaluated from the quantity of chlorine ions and their distribution state obtained in this way.
18.2.2.3.16 Strength TestSamples obtained by boring or other means are tested to measure parameters such as their unit weight, water absorption, ultrasound propagation velocity, uniaxial compressive strength, and elastic coeffi-cient. This is the most reliable and standard way of estimating the strength of existing concrete struc-tures, and can be widely applied.
18.2.2.3.17 Measurement of Mix Proportion of ConcreteTo ascertain the material composition of cast concrete and whether or not it corresponds to the intended composition, composition (mix) tests are performed on the hardened concrete. The most common test method for this purpose is the method proposed by the Japan Cement Association’s concrete special-ist committee, and other methods include using inductively coupled plasma emission spectrochemical analysis (ICP), or sodium gluconate.
18.2.2.4 examples of inspections
18.2.2.4.1 Open-Cut TunnelThis section describes the detailed inspection of an open-cut cable tunnel with advanced rebar corrosion and signs of peeling concrete. This structure was 37 years old at the time of these inspections, and was built approximately 1 km from the coast on ground comprising a mixture of marine silt and clay layers interspersed with sea shells. From the change in outward appearance, it was inferred that there was insuf-ficient concrete covering the rebars, and that salt damage and neutralization were the main causes of the degradation. The items to be studied were set based on this information. From the results of this study, it was found that the neutralization depth was greater in the side walls than in the ceiling. The depth of concrete covering the rebars at the side parts where the rebars were exposed was smaller than the aver-age depth of the overall structure. The chloride ion content was slightly above the rusting threshold of 1.2 kg/m3 near the surface, but was lower than the rusting threshold in the vicinity of the rebar covering. In parts where the rebars were exposed, pronounced defects were observed in the cross section, but the compressive strength was greater than the specified design strength as shown in Figure 18.20. As a result of detailed inspections, it was judged that the degradation was caused by rebar corrosion resulting from a lack of rebar covering and the advancement of neutralization, so repairs were made by conducting cross-sectional remedial work on all the degraded regions.
18.2.2.4.2 Tunnel Constructed by the Shield MethodThis section describes the detailed inspection of a cable tunnel constructed by the shield method, where there was water leaking from the ceiling part of the secondary coating. This cable tunnel was 31 years old at the time of these inspections. The tunnel consists of steel segments with concrete cast around the inside. The cause of the deterioration was thought to be either a void space between a segment and its secondary coating leading to corrosion of the primary coating, or an imperfection or hole in the segment’s shield material. The items to be studied were set based on this information. From the results of void measure-ments performed using the electromagnetic wave method, the presence of a layer of water (a void filled

367Telecommunication System: Maintenance Technologies
with water) was inferred from the characteristic probe waveform that was observed over the entire studied area. As a result of using the macroscopic ultrasonic method to measure the thickness of the secondary coating, it was confirmed that this coating was thin. Thickness measurements were performed using an ultrasound flaw detection method to investigate the state of corrosion of the segment, from which it was found that the skin plates and main girders were relatively sound. To ascertain the void’s extent and the location of the water leak into it, an additional study was performed over a wider range, on the basis of which a plan was devised for filling the void and fixing the problem as shown in Figure 18.21.
18.3 Repair and Reinforcement technologies for telecommunications civil Facilities
18.3.1 Repair and Reinforcement of conduits and Manhole Facilities
18.3.1.1 Faults in conduit Facilities
Existing conduits are almost all buried underneath roads, so it can become difficult to install or remove communication cables for a variety of reasons, including damage caused by ground deformation or
FIGURE 18.20 Cross section through a defective rebar.
FIGURE 18.21 Leakage state.

368 Maintenance Technologies of Lifelines
other construction work, or deterioration over the passage of time (e.g., rusting or corrosion of the inte-rior surface). In particular, very old facilities that are classed as decrepit and weak conduits (concrete pipes, ceramic pipes, reinforced concrete pipes, troughs, fiber pipes) have poor strength at the joints and elsewhere. This makes them vulnerable to secession, bending, or breakage, which can not only cause cable faults in the future but also make it impossible to draw new cables through the conduit. Furthermore, in lifting conduits and conduits attached to bridges, which are situated above ground and subjected to a harsher environment, the outside of the conduit can undergo pronounced degradation such as rusting, corrosion, and damage as shown in Figure 18.22. Table 18.7 lists the principal causes of defects in different types of pipe [4].
At NTT, pipes exhibiting the phenomena categorized in Table 18.7 are defined as poor conduit lines, and planned repairs are carried out on conduits where installations will be needed in the future, and conduits that are at risk of impaired stability and safety.
18.3.1.2 Repair and Reinforcement technologies for Vacant Ducts
Poor conduit lines that do not contain any cables are dealt with by open-cut partial repairs, or by non-excavating repair technologies. Various such technologies are the pipe washing method, vinyl pipe cor-recting technology, partial coating technology, super-thin film lining, and TM lining.
18.3.1.2.1 Pipe Washing MethodA forward-facing or rearward-facing spray nozzle is attached to the end of a high-pressure water hose, and high-pressure water is used to clear away earth, sand, and slurry from inside the conduit as shown in Figures 18.23 and 18.24.
18.3.1.2.2 Vinyl Pipe Correcting TechnologyA flat straightener is inserted into the vinyl pipe in a flat part of the conduit, and electricity is applied to a heater while hydraulically expanding the pipe’s internal surface to push the flat part of the internal space toward the outside and restore the ability of the conduit to accept the passage of cables as shown in Figures 18.25 and 18.26.
Sound pipe Corroded conduit
FIGURE 18.22 Sound and defective conduits.
TABLE 18.7 Main Fault Phenomena in Different Types of Conduits
Type of Pipe Main Failure Phenomena
Polyvinyl chloride pipe Flat, broken, clogged with earth and sandCast iron pipe Corrosion, breakage, poor joints, clogging with earth and sandSteel pipe Corrosion, perforations, flatness, curvature, bends, clogging with earth and sandDecrepit and weak conduits Insufficient strength

369Telecommunication System: Maintenance Technologies
Equipment composition
Water tankPump
High waterpressure
hose
FIGURE 18.23 Equipment for a pipe washing method.
Water truckHigh water
pressure hose
Pump
Tension side
Conduit
Cleaning equipment
Water tank
FIGURE 18.24 Pipe washing method.
Flat point
Reinforcementsleeve
Heater
FIGURE 18.25 Flat straightener for vinyl pipes.

370 Maintenance Technologies of Lifelines
18.3.1.2.3 Pipe Inner-Surface Painting TechnologyTo repair partial rusting and corrosion inside a metallic pipe, a coating is applied to the internal surface of the pipe in order to prevent the recurrence of rusting after the rust has been removed as shown in Figure 18.27.
18.3.1.2.4 Super-Thin Film LiningIf the interior of a metallic pipe has undergone widespread rusting or corrosion, a resin coating approxi-mately 0.3 mm thick is applied to the pipe’s internal surface after removing the rust in order to prevent the rust from recurring as shown in Figure 18.28.
18.3.1.2.5 TM LiningWhen laying a cable in a decrepit and weak conduit, a thick membrane lining (TM lining) is used to rein-force the conduit before inserting the cable. The TM lining technology involves inserting a resin-based lining material into the interior of an existing decrepit and weak conduit to form a thick (approximately 3 mm) resin film as shown in Figure 18.29. This makes it possible to secure space for laying optical cables and the like at low cost by reusing decrepit and weak conduits that were hitherto unusable. This technology is an application of general technology used for the repair and regeneration of sewer pipes and involves
Pass rod
Air hose
Compressor
Paint hose
Paint pump
Expansion joint
Centrifugal spray painting device
FIGURE 18.27 Pipe inner-surface painting technology.
Tensioning wire drum
Hydraulic pump
Hydraulic hose reel Heater cord
Heater controllerbox
Hoister cord
Vinyl tube flat straightener
Flat location
FIGURE 18.26 Vinyl pipe correcting technology.

371Telecommunication System: Maintenance Technologies
using pneumatic or hydraulic pressure to insert an inside-out hose or pulling a flattened hose with shape memory through the interior of the conduit and then curing it with hot water or steam or the like.
18.3.1.3 cable conduit Repair technologies
With the aim of making effective use of existing conduits in the expansion of optical communication services, it is becoming routine to use multicable laying methods whereby two or more cables are laid in a single conduit. Currently, about 3000 km of multicable installations are performed in an average year. However, as with vacant conduits, the conduits in which these cables are being laid are becoming increasingly defective due to their advancing age, and require appropriate repair work. Hitherto, con-duits containing cables have not been repaired by nonexcavating technologies due to the risk of damag-ing cables that are already in place [5,6].
18.3.1.3.1 High-Pressure Water Washing Technology for Cable Laying ConduitsAs a result of inspection and diagnosis performed on conduits that are scheduled to be used for mul-ticable laying, it was found that almost all the defects were due to rust and corrosion. High-pressure water washing technology for cable laying conduits has been developed as a method that can eliminate earth and sand and remove rust by using an ultra-high-pressure spray of water from a cleaning device.
Winch
Pig Wire
Resin film
FIGURE 18.28 Super-thin film lining.
Reversal devicePressure gauge
Lining material Existing conduit
Film thickness 3.0 mm
Cured lining material
ReversalCompressed air
FIGURE 18.29 TM lining (reverse insertion method).

372 Maintenance Technologies of Lifelines
By achieving the right balance in the performance, water pressure and flow rate of the pump that sup-plies high-pressure water to the cleaning device, it is possible to completely remove rust from the entire inner surface of the conduit.
Construction methods based on this technology are used in the delicate environment of existing conduits that contain cables and where most of the construction materials needed for cable pulling have previously been used in multicable laying methods as shown in Figures 18.30 and 18.31. The parameters related to work efficiency—such as the cleaning speed and the number of people required to perform the job—are roughly the same as for the cleaning of vacant conduits.
18.3.1.3.2 Renovation Technology for Cable Laying ConduitsIn conduits with rust or corrosion, the base material can become exposed when removal is performed using high-pressure water washing technology for cable laying conduits, and this can allow rust to start
Rope for pulling back(8 traction rope) Water truck
Negative pressure suction machine
Water supply hose
Opt-puller
High-pressure pump
Pulling directionConduit
Cleaning equipment
Feeding sideMH
Tension sideMH
Cable already accommodatedinside conduit
FIGURE 18.31 Overview of construction.
Cable through-hole
Ultra-high pressure water injection hole Existing
cable
FIGURE 18.30 External view of a washing device and a high-pressure water spray device.

373Telecommunication System: Maintenance Technologies
forming again. For this reason, conduit regeneration is required. Cable conduit regeneration is a tech-nology for re-forming and repairing a conduit by forming a new resin conduit with enough strength to support itself. A newly formed resin conduit is not at risk of corrosion and can therefore be used semi-permanently without the need for maintenance.
18.3.1.4 Repair technologies for conduits Attached to Bridges
A metallic conduit attached to a bridge can corrode due to the harsh conditions such as repeated rainfall and exposure to salt from sea spray or road gritters during the winter.
A conduit that has deteriorated due to corrosion is defective because it can adversely affect the cables inside it and can even pose a risk to third parties by falling off the bridge. It is therefore important to have a safe, simple, and inexpensive repair technology for corroded conduits that ensures they can be used effectively in perpetuity.
The main components used for repairs to conduits attached to bridges are fiber reinforced plastic (FRP) divided pipe, FRP insertion sockets, FRP divided insertion sockets, and PV divided joints as shown in Figure 18.32. Sockets are used by inserting them into the conduit on the abutment side after cutting away the corroded parts when performing repairs conduits on the abutment side. The differ-ence between insertion sockets and divided insertion sockets is that one is used for vacant conduits and the other is used for conduits that already contain cables. FRP divided pipes and FRP insertion sock-ets both consist primarily of unsaturated polyester resin and glass fibers, and are therefore strong and lightweight. Since their linear expansion coefficients are similar to that of steel pipes, they are almost completely unaffected by changes in temperature.
18.3.1.5 Repair technologies for Manhole Facilities
When the main body of a manhole is left to deteriorate, it is liable to cause accidents such as road sub-sidence and cable damage, so it is important to perform prompt repairs in a proper fashion according to the state of degradation. Repairs can be made by working only from the inside of the manhole, or by excavating around them and working from both sides. The choice of method depends on the state of deterioration and the part that needs to be repaired. Table 18.8 shows the repair methods for the main body of manholes. Repairs to the grade rings of manholes can be made by replacing the entire grade ring, or by making partial repairs by such means as filling gaps with mortar. The manhole duct parts are directly involved with laying and accommodating cables, and can also lead to cable failures, so they should be repaired as soon as possible. When repairs can be made by simple methods such as by coordi-nating the cable protection measures, these repairs are performed in conjunction with the inspections. Table 18.9 shows the repair methods for manhole grade rings and duct parts.
Divided insertion socket (insertion socket)
FRP divided pipe PV divided joint
Bridge girder
AbutmentExisting conduit
FIGURE 18.32 Overview of technology for conduits attached to bridges.

374 Maintenance Technologies of Lifelines
18.3.1.6 others
A cable removal technology has been developed whereby cables that cannot be removed by ordinary methods from a conduit that has become clogged with earth and sand are gripped by a strong clamping force and pulled out by a strong traction force (196 kN).
18.3.2 Repair and Reinforcement of cable tunnel Facilities
18.3.2.1 Basic Repair and Reinforcement concepts
18.3.2.1.1 AimThe repair and reinforcement of degradation in cable tunnels is generally known to resemble medical treatment for humans in that degraded states of lesser severity can be treated at lower cost. The repair and reinforcement of cable tunnels is performed with the aim of restoring the defective location (or region) to the prescribed functionality and durability and being able to continue using the cable tunnel permanently by applying suitable measures. Repairs are performed with the aim of recovering functions
TABLE 18.8 Repair Method of Manhole Main Body
Structure Type Results of Check Repair Method
Cast-in-place concrete block made
• Contains cracks of less than 0.4 mm thickness with large water leakage
V-cut method I (nonshrink quick-setting cement)
• Water leakage is concentrated in one crack location, and the amount of leakage is small
• Contains cracks of 0.4 mm thickness or greater V-cut method II (nonshrink quick-setting cement and urethane resin injection)
Exposed rebar Extract by chippingResin block
structure• Cracks in the upper and lower floor slabs• Cracks emanating from small holes in the upper
and lower floor slabs and side walls• Installed on a bridge frequently used by heavy
vehicles leading to cracks in side walls and peeling of adhered parts
• Cracks are found to be growing upon observation
• Steel plate bonding method• Resin plate crimp method• Epoxy putty method
TABLE 18.9 Repair Method of Manhole Grade Ring and Duct
Part Structure Type Results of Check Repairing Methods
Grade ring Stacked-block grade ring
• Contains cracks of 0.4 mm thickness or greater• Offset of at least 2 cm between the grade rings or
between the upper floor slap and the head part• Large amount of water leaking from a crack
Replace grade ring
Brickwork grade ring
Repointing
Brickwork grade ring
Peeling of mortar parts in the main part of the grade ring, brickwork directly visible
Replace grade ring
Concrete grade ring
Corresponds to a defective state of the main body of a cast-in-place manhole or handhole
Ducts Conduit projecting into the interior of a manhole or handhole
• Conduit system• Tapering
Mortar pushed out around the periphery of the duct opening, and liable to damage the cables
Repointing
Defects/deformation of the duct socket and duct sleeve liable to damage the cables
Re-form/replace
Water leaking from the duct opening Install water blocking plug

375Telecommunication System: Maintenance Technologies
other than strength that have been impaired due to deterioration (e.g., durability, water tightness), and reinforcement is performed with the sole aim of restoring the strength of a structure.
Degradation countermeasures have hitherto mostly involved finding and repairing phenomena that become more pronounced over the passage of time, but recently a surface repair design method has been introduced in an effort to reduce the future maintenance and administration costs by predicting degradation based on the results of inspections performed before pronounced deterioration occurs, and by calculating and investigating the LCCs from these predicted results.
18.3.2.1.2 Basic ConceptsA cable tunnel is a space that accommodates a large number of cables, and since it is deeply buried and cannot be renewed easily, it is important to find defects at an early stage and make repairs within a suitable period of time based on the diagnosis results. Also, when the defect location is reducing the strength of the structure, reinforcement measures should be immediately considered, and measures should be taken to recover the strength of the structure. When selecting repair and reinforcement meth-ods, multiple proposals are compared and evaluated in terms of the scope of the repair, the effect of the repair or reinforcement, the workability, maintainability, and economy (initial outlay and LCCs) of the repair/reinforcement work, and so on.
In particular, when considering reinforcement, since the space inside the cable tunnel may become narrower depending on the choice of reinforcement technology, consideration is given to preserving the space inside the cable tunnel as a valuable resource, if at all possible, while taking the balance of cost and ease of maintenance into account. If this sort of repair and reinforcement technology is to continue achieving the performance originally expected of an installation, it is essential that the work is done properly and with adequate supervision, based on the characteristics of the repair and reinforcement technology being used, and that the soundness of the cable tunnel is ensured by performing periodic follow-up studies (monitoring) after the construction work has been completed.
18.3.2.2 Surface Repair Design Method
The surface repair design method is a method for not only repairing exposed rebars that can be visu-ally confirmed, but also performing preventative surface repairs in places where the loss of rebar mass is predicted to exceed a set value within the structure’s design lifetime. The process flow of the surface repair design method is shown in Figure 18.33. It should be noted that this method is applied to cable tunnels constructed using the open-cut technology.
The surface repair design method aims to reduce the LCC (including the anticipated costs of long-term maintenance and administration) by performing preventative maintenance repairs in places where it is thought that deterioration will occur in the future. After performing inspections to obtain the necessary data (referred to as surface inspections in the following), the deterioration is predicted based on this data.
From the predicted deterioration results, the deterioration levels are divided into separate zones, and suitable repair and reinforcement methods are selected for each zone. When selecting a reinforcement method according to a surface repair design method, the following criteria are considered for the pur-pose of reducing the LCCs by performing preventive maintenance repairs:
1. It is possible to evaluate LCCs. 2. The repair method is highly reliable, and it is possible to quantitatively indicate the guarantee
period or expected effective lifetime of a repair. 3. The temperature conditions are stable and unaffected by ultraviolet light, but work can be per-
formed even if the repair surface is wet, and it is possible to achieve stable repair performance. 4. There must be a system in place whereby people making repairs are able to take responsibility for
their work. 5. It must be possible to perform follow-up studies at regular intervals.

376 Maintenance Technologies of Lifelines
18.3.2.3 Repair technologies
18.3.2.3.1 Repairing Cracks and Water LeaksBased on the results of inspections, a repair technology is basically selected by considering the repair technologies shown in Table 18.10 at positions where water must be stopped from the viewpoint of struc-tural performance and durability.
18.3.2.3.2 Repairing Rusted RebarsRepairs to rusted rebars are performed by applying repair technologies suited to the extent of dete-rioration. Basically, repairs are made by a combination of technologies such as cross-sectional repairs, surface coatings, and rebar rust prevention, but it is essential to take measures to block the infiltration of substances like air and water that cause the deterioration, and to make it difficult for them to reach the rebars.
For example, when there is insufficient concrete covering the rebars, the concrete is built up to a greater thickness to ensure the rebars are properly covered, and a surface coating is applied to physically
Surface checks
Predict degradation
Zoning
LCC evaluation
Choose repair policy
Checks aimed at acquiring diversedata needed for prediction of
degradation
Predict degradation based on the dataacquired in these checks
Divide degradation levels intoseparate zones
Evaluate repair methods/time scalesand LCC based on zoning results
Determine optimal repair methodand repair period based on
LCC evaluation
FIGURE 18.33 Flowchart of the surface repair design method.
TABLE 18.10 Overview of Repair to Crack and Water Leak
State of Cracking Water Leakage State Repair Method
Planar Small leak Gluing Apply adhesive (sometimes accompanied by an auxiliary injection water blocking agent).
Large leak Back injection Cut a rectangular hole (through-hole) and perform water blocking from outside.
Linear Small leak Injection Close off the path of the water leak directly with a water blocking agent.
Large leak Injection, filler, and spreading
Close off the path of the water leak directly with a water blocking agent and apply gel filling to air pores.

377Telecommunication System: Maintenance Technologies
block out or suppress the infiltration of air and water. When making repairs, it must also be kept in mind that repairs are made not just to the exposed parts of the rebars but also to spot rust locations before and after the exposed rebars, assuming recurrence of deterioration by macrocell corrosion.
18.3.2.4 Reinforcement technologies
Since an open-cut tunnel is made of reinforced concrete, a reinforcement policy is established and the methods and materials are selected so as to satisfy the target performance with reference to previous criteria or guidelines.
For cable tunnels built by the shield tunneling method, reinforcement methods are basically chosen according to the same reinforcement design as for open-cut tunnels. From previous cases, technologies that are used relatively frequently involve wrapping a material such as fiber reinforced concrete around the inside of the secondary coating, or reinforcing with a tertiary coating as shown in Figure 18.34.
18.3.2.5 cable tunnel Repair/Reinforcement examples
18.3.2.5.1 Waterproof Reinforcement of a Cable Tunnel Constructed by the Shield MethodIn this case, in a circular tunnel consisting of steel segments and a secondary coating of unreinforced concrete, ground water appeared continuously from near the concrete flooring. If left untreated, this could have led to corrosion of the steel segments and may have induced the formation of a void underneath the road surface, so detailed inspections were performed and suitable countermeasures were investigated.
An investigation of possible countermeasures revealed that there was a high likelihood of ground water entering the joints between the vertical shafts and segments, so the decision was made to stop the water by an injection method in which the flooring concrete is injected with cement crystallization pro-moter materials in the areas affected by chipping and cracks through which the water had been entering. The possibility of water finding another way in through other cracks after this waterproofing work was also considered, so the same waterproofing was also performed on other cracks in the surrounding area.
18.3.2.5.2 Cross-Sectional Reinforcement of Cable Tunnels Built by the Open-Cut MethodIn this example, there were many chlorine ions in the concrete to start with, and it was feared that the strength of the cable tunnel might be reduced by the exposure and advancing corrosion of rebars, so detailed inspections were performed while investigating a plan of action.
FIGURE 18.34 Overview of tertiary coating reinforcement.

378 Maintenance Technologies of Lifelines
As a result of investigating countermeasures, it was found that the reduction of strength caused by rebar corrosion was significantly beyond the tolerable stress value, and that adding reinforcements by a secondary coating of RC on the inside of the cable tunnel was a more economical scenario than mak-ing repeated repairs to the tunnel. The state of degradation in this case is shown in Figure 18.35 and an overview of the reinforcements is shown in Figure 18.36.
18.3.2.5.3 Example of the Surface Repair Design MethodThis section introduces an example where the surface repair design method was applied to an open-cut tunnel, where as a result of detailed inspections it was considered that a complex degradation was taking place due to a combination of neutralization and salt damage. Figure 18.37 shows an example of the zoning of degradation levels according to predictions of degradation based on the results of sur-face inspection. In this figure, the degradation locations and latent degradation locations are shown visually over the whole surface, thereby clarifying all the regions requiring repairs or reinforcement, which is a characteristic of the surface repair design method. To evaluate the LCCs the following three maintenance management scenarios were proposed [7]. Table 18.11 shows the repair and reinforcement methods corresponding to each zone, and Figure 18.38 shows an example of the LCC evaluation results.
FIGURE 18.35 Degraded state.
Reinforced concrete casting
FIGURE 18.36 Overview of RC secondary coating reinforcement.

379Telecommunication System: Maintenance Technologies
TABLE 18.11 Repair and Reinforcement Method in Each Zone
Zoning Rebar
Exposure Repair Method Expected Service
Life (Years)
Zone I Yes Cross-sectional repair with sheet reinforcement 30Zone II-1 Yes Cross-sectional repair with sheet reinforcement 30Zone II-2 No Surface impregnation 30Zone III No Not treated —Partial repair Yes Section repair 5
Case 1: Surface repair 1Case 2: Surface repair 2Case 3: Partial repair
Time (year)
5,000
0
10,000
15,000
20,000
25,000
1990 2010 2030 2050 2070 2090
Cost
(×10
,000
yen)
FIGURE 18.38 Results of LCC evaluation.
(2)
(1)
16 m (only part of the left-side wall shown here)
11
11
1 1 11
23 8 9 3
Zone I
Zone II-2
Zone II-1
Zone III
FIGURE 18.37 Example of zoning results: (1) rebar exposure state (numerals indicate the number of exposed rebars) and (2) zoning results.

380 Maintenance Technologies of Lifelines
1. In every section, zones I through II-2 are repaired and reinforced in the same period (surface repair 1).
2. If zones I and II-1 are present in the same section, then zones I through II-2 are repaired and rein-forced in section units. Sections containing only zones II-2 and III are repaired and reinforced in section units as zones I through II-2 when zones II-2 have become zone I and II-1.
3. Repairs are performed only at the locations of exposed rebars in all sectors (partial repair).
From the results of an evaluation, it was judged that repairs should be performed according to the surface repair approach of case 1, which was the most desirable in terms of maintenance management.
References
1. Information Infrastructure Research Association. The Telecommunication Civil Technology Supporting Information Infrastructure. The Telecommunication Association of Japan, Tokyo, Japan, 2000 (in Japanese).
2. H. Irie, Y. Yoshida, Y. Sakurada, and T. Ito. Non-destructive-testing methods for concrete structures. https://www.ntt-review.jp/archive/ntttechnical.php?contents=ntr200805le3.pdf&mode=show_pdf. (Accessed August 6, 2014.)
3. H. Uehara, S. Baba, K. Tanaka, and T. Deguchi. Disaster prevention and security technolo-gies contributing to safe and secure networks. https://www.ntt-review.jp/archive/ntttechnical.php?contents=ntr200606041.pdf. (Accessed August 6, 2014.)
4. Japan Society of Civil Engineers. Handbook of Civil Engineering, 4th edn. Gihodo Publishing, Tokyo, Japan, 1989 (in Japanese).
5. F. Sugino. R&D trends in communications infrastructure to achieve safe and secure access networks. NTT Technical Review, 11(6), 8–13, 2013.
6. Y. Yamazaki, T. Korekuni, T. Inamura, and K. Shibata. Technique for repairing bridge-supported conduits. https://www.ntt-review.jp/archive/ntttechnical.php?contents=ntr200810le2.pdf&mode= show_pdf. (Accessed August 6, 2014.)
7. N. Segawa, T. Kashiwagi, S. Shibata, T. Yamada, Y. Iriyama, A. Ogiwara, S. Maeda, and N. Fujikura. Increasing the level of infrastructure facilities management. https://www.ntt-review.jp/archive/ntttechnical.php?contents=ntr200606017.pdf. (Accessed August 6, 2014.)

381
IVDisaster Prevention and Mitigation Technologies of Lifelines
19 General Takeshi Koike ........................................................................................................... 383Common Characteristics in the Disaster Damage Modes of Urban Lifelines • Common Problems in Preventive Measures and Technology for Urban Lifelines • Acceleration of Functional Recovery at a Disaster • References
20 Water Supply System: Mitigation Technologies Takeshi Koike ................................... 401Seismic Damage of Water Supply Systems • Disaster Preventive Measures (Before Earthquake, Planning) • Seismic Disaster Preventive Measures for Pipelines (Reinforcement of Existing Facilities) • References
21 Sewerage System: Mitigation Technologies Junichi Koseki and Reiko Kuwano ........ 439Case Histories of Earthquake-Induced Damage to Sewer Facilities and Their Rehabilitation Works • Aseismic Measures for Sewer Pipes • Relevant Researches on Seismic Behavior of Sewer Pipes • References
22 Natural Gas Distribution System: Mitigation Technologies Nobuhisa Suzuki and Hiroyuki Horikawa ............................................................................................................485Damage to Gas Pipelines due to Past Earthquakes • Seismic Provision for Gas Pipelines • Emergency Provision for Seismic Integrity of Pipeline • Emergency Provision of Gas Pipelines • References

382 Disaster Prevention and Mitigation Technologies of Lifelines
23 Electric Power System: Mitigation Measures Keizo Ohtomo and Yoshiharu Shumuta .................................................................................................................. 497Seismic Damage Reduction Technologies for Electric Power Systems • Seismic Performance of Electric Power Facilities during the 2011 Tohoku Earthquake off the Pacific Coast • Earthquake Damage Reduction Measures for Overhead Transmission Facilities • Earthquake Damage Reduction Measures for Underground Transmission Facilities • Earthquake Damage Reduction Measures for Substation Equipment • References
24 Telecommunication System: Mitigation Measures Takanobu Suzuki, Fumihide Sugino, and Katsumi Sakaki ..............................................................................519Examples of Damage in Telecommunication Facilities • Basics of Disaster Measures of Telecommunication Buildings • Disaster Measures for Telecommunication Civil Facilities • Earthquake-Proof Reliability Evaluation of Underground Facilities • References

383
19.1 common characteristics in the Disaster Damage Modes of Urban Lifelines
Urban lifelines are network systems such as water, sewerage, gas, power, and telecommunication, which can be buried or aboveground network systems. Each lifeline has source nodes and demand nodes. It supplies service such as water, gas, electric power, information, and materials through its links. When a lifeline has been affected by a disaster, network elements of the lifeline are structurally damaged and its network system is also functionally damaged.
In this chapter, the structural damage of nodes and links, as well as the functional damage of the lifeline system, is described from the viewpoint of disaster prevention and mitigation measures.
19.1.1 Basic characteristics of Disaster Damage Modes
19.1.1.1 network System
The links of a lifeline network are composed of buried pipelines, aerial power cables, or highway roads. The node is a symbol to express various structural elements, from a manhole to large-scale facilities such as pumping stations, purification facilities, and power generation plants.
The configuration of a lifeline network system is shown in Figure 19.1, in which (a) is a general profile of the network, while (b) and (c) show a series system and tree-type system, respectively.
Figure 19.2 is an illustration of one link that is composed of several pipe segments joined with several types of joint elements.
19.1.1.2 Structural Damage
Structural damage can occur at the link or the node, and its damage severity is measured by different methods for nodes and links.
When a node is defined as one structural system, the node damage can be counted as a single failure event. On the other hand, since a link is composed of several pipe segments, the number of damage per
19General
19.1 Common Characteristics in the Disaster Damage Modes of Urban Lifelines .............................................................................383Basic Characteristics of Disaster Damage Modes • Kinds of Disaster Damage • Disaster Damage Specific to a Lifeline
19.2 Common Problems in Preventive Measures and Technology for Urban Lifelines ......................................................388Disaster Preventive Measures before and after the Disaster • Spatial Preventive Measures
19.3 Acceleration of Functional Recovery at a Disaster ......................398References ......................................................................................................399
Takeshi KoikeKyoto University

384 Disaster Prevention and Mitigation Technologies of Lifelines
the total length is the most usable criterion to measure damage severity of the single-link system. This damage criterion is called the link damage rate.
In the case of seismic damage, structural damage is quantitatively estimated in the following way:The damage rate of one link that has been investigated with the water pipeline damage data in 1995
Kobe Earthquake is estimated by the following formula [1]:
ν α α( ) ( )=C C C C Rp d g l (19.1)
in which α, R(α), Cp, Cd, Cg, Cl are ground acceleration, damage rate in the standard condition for the acceleration α, and modification factors for pipe types, diameters, geological conditions, and liquefac-tion severity, respectively.
It is noted that Equation 19.1 can be applied for the condition of the water pipeline system in Kobe or a similar type of network system under the same seismic hazard as the 1995 Kobe Earthquake. If the seismic hazard condition, the network configuration, or the geological condition is different from the earlier conditions, direct application of this formula to any other water network systems will not be applicable.
In order to reflect the local characteristics of the network system, a more theoretical approach is rec-ommended, as shown in the following equation:
ν ν( ) ( )x P Z x EQ= <⎡⎣ ⎤⎦0 1 0 (19.2)
(a)
(b)
(c)
FIGURE 19.1 Network configuration of lifelines: (a) general profile of network, (b) series system, and (c) tree-type system.
A single elementJoint
FIGURE 19.2 Components of a link system.

385General
in which ν0, x, EQ are occurrence number of potential damage points per unit length, location of the potential damage to be detected, and seismic load, respectively. The function Z1(x) is a performance function of one link in the unit length for damage mode 1, which means the minor damage state. This performance function is given by the following equation:
Z x R t x S EQ1( ) ( , ) ( )= − (19.3)
whereR(t, x) is a residual strength of the pipe at the location of x and the time of tS(EQ) is a seismic response of the pipe element due to the seismic load EQ
The function of P[Z1(x)<0|EQ] in Equation 19.2 shows a probability of failure at the potential damage point for the seismic load of EQ. This function provides the fragility curve [2] of the potential damage point for seismic response of S(EQ).
When a pipeline shows one series link, the probability of the link failure is given by the following formula under the assumption of Poisson process [3] of the potential damage occurrence:
p x dxf
L
= − −⎡
⎣
⎢⎢
⎤
⎦
⎥⎥∫1
0
exp ( )ν (19.4)
where L is a stretch of the link.If the link is deteriorated, the probability of failure is increased for the same seismic load. If the link is
reinforced for the future seismic load on the other hand, the probability of failure will be decreased. The effect due to the disaster preventive measure can be evaluated by taking the deteriorating and reinforc-ing effects into consideration. These effects can be reflected by the revised performance functions in the following formula:
Z x t R t x S EQ
Z x t R t x S EQ
2
3
( ) ( , ) ( )
( ) ( , ) ( )
= ( ) −
= ( ) −
⎧⎨⎪
⎩⎪
ψ
φ (19.5)
where ψ(t) and ϕ(t) are the deteriorating function and the reinforcing function, respectively. These func-tions can provide the deviated ratio from the standard strength of the link at the location of (t,x).
Figure 19.3 shows a schematic illustration of the fragility curves for the link in the cases of deterio-rated, standard, and reinforced states, respectively.
19.1.1.3 Functional Damage
The functional damage of urban lifelines can be defined as the loss of service at demand nodes. It should be noted that the lifeline has a hierarchy system that has several layers of network systems. These net-works are mutually interconnected at the connecting nodes. Lifeline services such as water, gas, and power supplies can be conveyed from source nodes at the highest layer to the demand nodes at the lowest layer.
In the case of water transmission pipelines, functional damage occurs when the water service can-not be transmitted to the demand nodes with the required hydraulic conditions of pressure and flow rate. Those functionally damaged nodes can be estimated with a flow analysis of the damaged net-work. On the other hand, in distribution network systems where some portion of the network is dam-aged, there are two approaches to calculate the performance damage. One approach is to evaluate the damage states in terms of water service loss for all the demand nodes, and the other is to evaluate the damage state as a representative value of water service loss for the distribution network system.

386 Disaster Prevention and Mitigation Technologies of Lifelines
Since the distribution network system generally has a large number of demand nodes, the second approach is often adopted.
In a water distribution network system, the structural damage of the pipelines is estimated with the pipe damage rate ν, whereas the functional damage of the system is evaluated as the rate of loss of water service of the whole distribution system. This loss of water service rate ξ is given in the following simpli-fied formula [4]:
ξ
ν=
+1
1 h( ) (19.6)
in which the function h(ν) is estimated on the damage data basis of 1995 Kobe Earthquake in the fol-lowing way [5]:
h( ) . .ν ν= −0 0473 1 61 (19.7)
Figure 19.4 shows a schematic illustration of a typical restoration curve of a water distribution system. In this figure, a rapid recovery of water supply is achieved by a temporary pipeline installation or by
Prob
abili
ty o
f fa
ilure
Seismic intensity in JMA scale7.06.56.05.55.04.54.0
0
0.2
0.4
0.6
0.8
1.0
DeterioratedStandard Reinforced
FIGURE 19.3 Schematic illustration of fragility curves.
Seism
ic p
erfo
rman
ce
Restoration curve
Period in days0
1.0
FIGURE 19.4 Schematic illustration of a restoration curve.

387General
replacing the damaged pipes with new pipes. This restoration curve reflects the whole recovery state of damaged pipes and facilities in the network system.
There are many examples of restoration curves [6] of water network systems in many earthquakes in Japan. The most appropriate restoration curve should be selected for the target distribution network system from those curves obtained in similar network and seismic conditions.
The disaster prevention measures in the restoration stage should be considered in the daily activity by water companies that must develop the rapid establishments of restoration teams and equipment in the disaster occurrence.
19.1.2 Kinds of Disaster Damage
Damage modes of lifelines vary with the kind of disaster. The most significant disasters that affect life-lines are earthquake, strong wind, fire, flood, thunderstorm, ice, snow, and salt damage. Earthquake damage especially can cause secondary damage such as the spread of fire or blockage and flooding due to landslides in river embankments.
When an earthquake occurs, a lifeline suffers from ground shaking and permanent ground dis-placement. In buried pipelines, pipe joints are often vulnerable to seismic ground motions. Permanent ground displacement, such as liquefaction-induced lateral spreading and fault movement, produces significant damage to buried lifelines. Especially in reclamation areas or coastal zones, liquefaction produces vertical settlement in sandy ground, horizontal spreading near quays, or large displacements in slope areas. In these areas, buried pipelines are deformed as much as several meters proportional to the ground displacement. Pipelines with seismically vulnerable joints will be significantly damaged.
Figures 19.5 and 19.6 are schematic illustrations [7] of large pipeline deformation in liquefied ground. Figure 19.5 shows the case in a slope area, whereas Figure 19.6 is the case in a quay area. When a pipe-line crosses a fault line, the pipeline will be deformed as shown in Figure 19.7. Figure 19.7a is a case of a normal fault in which the pipeline will be placed in tension, and Figure 19.7b is a case of a reverse fault where a buckling failure will be produced by the compression load [8].
Table 19.1 shows three cases of typical failure modes for lifelines in different disasters. Case 1 shows that a single disaster event brings seismic damage to all the lifelines, but the second case suggests that a single disaster event produces node damage to one lifeline and link damage to another lifeline. In the third case, damage to one lifeline does not produce any damage to the other lifelines. These results sug-gest that seismic damage modes are not always the same for all lifelines.
FIGURE 19.5 Deformation profiles of pipelines that are in the liquefaction-sensitive slope ground before and after the earthquake.

388 Disaster Prevention and Mitigation Technologies of Lifelines
19.1.3 Disaster Damage Specific to a Lifeline
19.1.3.1 interdependence in the Hierarchy of the Lifeline
As shown in Figure 19.8, a lifeline network system is composed of several hierarchical layers [9].When seismic damage occurs in the upper network system, the lower system connected to the upper
system through a single node faces loss of service. In order to prevent this damage, the lower system must be connected to the upper system through multiple nodes.
19.1.3.2 interdependence and Damage Sharing among Different Lifelines
Table 19.2 shows the interdependence among various lifeline systems. This table is rearranged and sim-plified from the data prepared by Goto et al. [9]. This table shows that each lifeline is mutually connected to multiple lifelines interdependently.
19.2 common Problems in Preventive Measures and technology for Urban Lifelines
Disaster preventive measures are classified based on their implementation period, and include preven-tive work before the disaster, emergency repair work immediately after the disaster, long-term restora-tion, and reconstruction work.
FIGURE 19.6 Deformation profiles of pipelines that are in the liquefaction-sensitive quay ground before and after the earthquake.
Pipeline(a)
(b)
Ground deformation
FIGURE 19.7 Pipeline deformations crossing the normal fault and reverse fault: (a) pipe in tensile mode along the normal fault crossing and (b) pipe in buckling mode along the reverse fault crossing.

389General
TABL
E 19
.1
Typi
cal D
amag
e M
odes
of L
ifelin
e Sy
stem
s due
to N
atur
al D
isas
ters
and
Acc
iden
ts
Dam
age
Mod
e Ty
pe
Life
lines
Wat
erSe
wer
age
Gas
Pow
erTe
leco
mm
unic
atio
nsC
ondu
it
Nat
ural
di
sast
ers
Eart
hqua
keFa
ilure
of p
ipes
and
pi
ping
conn
ectio
ns,
leak
age
Failu
re o
f pi
pes
Failu
re o
f pip
es a
nd
pipi
ng co
nnec
tions
, ga
s lea
kage
Dam
age
of el
ectr
ic
faci
litie
sD
amag
e of
te
leco
mm
unic
atio
n fa
cilit
ies
Failu
re o
f pip
es a
nd
pipi
ng co
nnec
tions
, le
akag
eVo
lcan
ic a
ctiv
ity
Wat
er sh
orta
geLi
mita
tion
of w
ater
su
pply,
rust
-col
ored
w
ater
by
valv
e op
erat
ion
Dec
line
of
grav
ity fl
ow
capa
city
Non
eLi
mita
tion
of p
ower
ge
nera
tion
Non
eN
one
Stor
m a
nd fl
ood
dam
age
Inflo
w o
f dirt
y w
ater
, pi
pe d
amag
e by
slop
e fa
ilure
Inflo
w o
f dirt
y w
ater
, pip
e da
mag
e by
slo
pe fa
ilure
Pipe
dam
age
due
to
slope
failu
reSn
ow-c
appe
d da
mag
e of
tr
ansm
issio
n ca
bles
and
ae
rial w
ires,
dam
age
by
snow
slid
es
Pipe
dam
age
due
to
slope
failu
reFu
nctio
nal d
amag
es
of st
ored
faci
litie
s by
wat
er in
vasio
n
Thun
derb
olt
Stop
page
of p
umpi
ng
oper
atio
nSt
oppa
ge o
f pu
mpi
ng
oper
atio
n
Dam
age
of
tele
com
mun
icat
ion
and
elec
tric
faci
litie
s
Dam
age
of el
ectr
ic a
nd
tele
com
mun
icat
ion
faci
litie
s
Dam
age
of
tele
com
mun
icat
ion
and
elec
tric
faci
litie
s
Non
e
Snow
dam
age
Col
laps
e of
abo
vegr
ound
fa
cilit
ies
Col
laps
e of
ab
oveg
roun
d fa
cilit
ies
Col
laps
e of
ab
oveg
roun
d fa
cilit
ies
Col
laps
e of
abo
vegr
ound
fa
cilit
ies
Col
laps
e of
ab
oveg
roun
d fa
cilit
ies
Non
e
Salt
dam
age
Cor
rosio
nC
orro
sion
Cor
rosio
nC
orro
sion,
elec
tric
le
akag
eC
orro
sion
Cor
rosio
n
Acc
iden
tPo
wer
failu
reSt
oppa
ge o
f pum
ping
op
erat
ion,
rust
-col
ored
w
ater
by
valv
e op
erat
ion
Stop
page
of
pum
ping
op
erat
ion
Stop
page
of e
lect
ric
equi
pmen
tSt
oppa
ge o
f pum
ping
op
erat
ion
Stop
page
of p
umpi
ng
oper
atio
nSt
oppa
ge o
f pum
ping
op
erat
ion
Fire
Fire
acc
iden
t in
the
tunn
elFi
re a
ccid
ent
in th
e tu
nnel
Fire
acc
iden
t by
leak
age
gas i
n th
e tu
nnel
Fire
acc
iden
t in
the
tunn
elFi
re a
ccid
ent i
n th
e tu
nnel
Stop
page
of e
lect
ric
equi
pmen
t in
the
tunn
elW
ater
qua
lity
acci
dent
Lim
itatio
n of
wat
er
supp
ly, ru
st-c
olor
ed
wat
er b
y va
lve
oper
atio
n
Out
flow
of
toxi
c su
bsta
nce
Non
eN
one
Non
eN
one
Terr
orism
Lim
itatio
n of
wat
er
supp
ly, ru
st-c
olor
ed
wat
er b
y va
lve
oper
atio
n
Out
flow
of
toxi
c su
bsta
nce
Lim
itatio
n of
gas
su
pply
Dam
age
of el
ectr
ic
equi
pmen
tD
amag
e of
te
leco
mm
unic
atio
n eq
uipm
ent
Dam
ages
of p
ipe
and
rela
ted
faci
litie
s, fir
e of
cab
les,
and
inje
ctio
n of
toxi
c su
bsta
nce

390 Disaster Prevention and Mitigation Technologies of Lifelines
When disaster prevention measures are planned, retrofitting a single facility cannot always assure the safety of the whole lifeline system. Restoration works should be completed for all vulnerable structures in a long-term program taking into account priority. It should be noted that old vulner-able elements and newly replaced elements are often used spatially in an ordinary lifeline. Based on these conditions, an appropriate restoration plan should be established in order to obtain the optimal disaster prevention investment.
19.2.1 Disaster Preventive Measures before and after the Disaster
19.2.1.1 Preventive Measure before the Disaster
Seismic design in Japan introduces two types of seismic loads that are called Level 1 ground motion and Level 2 ground motion. Level 1 ground motion is used for seismic risk assessment for serviceability limit state, and Level 2 ground motion is for ultimate limit state. So disaster prevention measures should account for these two ground motions. These two types of load for serviceability and ultimate limit states are a basic approach in the disaster prevention planning in Japan. This approach [10] will be com-monly applied to other disaster cases.
The disaster prevention measures for lifeline systems must be composed of
• Structural reinforcement for link and node elements• Improvement in the operational management of network systems• Training of operational personnel• Co-sharing of disaster prevention manuals• Establishment of an alarm system
19.2.1.2 emergency Repair and Restoration
Rapid rescue action at the disaster-affected area can be carried out based on daily preparation and training. Before the disaster, mutual assistance by all water companies must be prepared. These companies always cooperate with neighboring municipalities [11] in their disaster prevention training.
Lifelines have to provide social benefit to customers; therefore, the operating company should coordinate with local residents, companies, and self-governments in disaster prevention activities.
Supply sources
Transmission lines
Distribution network
FIGURE 19.8 Hierarchy structure of a lifeline system.

391General
TABL
E 19
.2
Dam
age
Exte
nsio
n Im
med
iate
ly a
fter t
he O
ccur
renc
e of
Dis
aste
r
Affe
cted
Life
lines
A
ffect
ed C
ityBi
g C
ities
Wat
erSe
wer
age
Gas
Pow
erTe
leco
mm
unic
atio
nC
ondu
it
Affe
ctin
g lif
elin
esW
ater
Dam
age
of p
ipel
ines
at
tach
ed o
n th
e br
idge
s
Shor
tage
of w
aste
w
ater
supp
lied
to
the
purifi
catio
n fa
cilit
y
Low
erin
g of
gas
te
mpe
ratu
re
due
to
stop
page
of
ther
mal
sy
stem
Stop
page
of
desu
lfuriz
atio
n eq
uipm
ent d
ue
to in
dust
rial
wat
er sh
orta
ge
Dam
age
of el
ectr
ic
cabl
e by
wat
er
inva
sion
Sew
erag
ePi
pe d
amag
eG
as p
ipel
ine
failu
re
due
to m
anho
le
uplift
ing
Dam
age
of el
ectr
ic
cabl
e by
wat
er
inva
sion
Traffi
c diffi
culty
and
ou
tflow
of d
irty
wat
er b
y pi
pelin
e up
liftin
gSt
oppa
ge o
f wat
er
supp
ly d
ue to
se
wer
age
wat
er
leak
age
Stop
page
of
gray
-wat
er sy
stem
Gas
Stop
page
of g
as-fi
red
pow
er p
lant
(s
topp
age
of
coge
nera
tion
syst
em a
nd
purifi
catio
n pl
ants
)
Stop
page
of g
as-fi
red
pow
er p
lant
(s
topp
age
of
coge
nera
tion
syst
em p
lant
)
Stop
page
of
gas-
fired
po
wer
pla
nt
(sto
ppag
e of
co
gene
ratio
n sy
stem
pla
nt)
Stop
page
of
gas-
fired
po
wer
pla
nt
(sto
ppag
e of
co
gene
ratio
n sy
stem
pla
nt)
Tem
pora
l sto
ppag
e of
bas
e fa
cilit
ies
due
to st
oppa
ge o
f ga
s-fir
ed p
ower
pl
ant (
stop
page
of
coge
nera
tion
syst
em p
lant
)
Stop
page
of h
otel
se
rvic
es d
ue to
st
oppa
ge o
f ga
s-fir
ed p
ower
pl
ant (
stop
page
of
coge
nera
tion
syst
em p
lant
)In
flow
of l
eaka
ge g
as
into
the
sew
erag
e lin
es
Stop
page
of
ther
mal
pow
er
gene
ratio
nD
elay
of s
ludg
e ha
ndlin
g du
e to
la
ck o
f fue
l for
bu
rnin
g pl
ant
(Con
tinue
d)

392 Disaster Prevention and Mitigation Technologies of Lifelines
TABL
E 19
.2 (C
ontin
ued)
D
amag
e Ex
tens
ion
Imm
edia
tely
afte
r the
Occ
urre
nce
of D
isas
ter
Affe
cted
Life
lines
A
ffect
ed C
ityBi
g C
ities
Wat
erSe
wer
age
Gas
Pow
erTe
leco
mm
unic
atio
nC
ondu
it
Stop
page
of w
ater
qu
ality
test
(b
ecau
se h
ot w
ater
fo
r the
test
is n
ot
supp
lied)
Pow
erSt
oppa
ge o
f sup
ply
syst
em (e
.g.,
pum
ping
faci
lity)
, st
oppa
ge o
f wat
er
serv
ice
in th
e el
evat
ed m
ansio
n
Stop
page
pum
ping
eq
uipm
ent i
n th
e pu
rifica
tion
plan
t
Dam
age
of
gove
rnor
st
atio
ns d
ue to
po
le co
llaps
es
Dam
age
of
aeria
l wire
sSt
oppa
ge o
f bas
e st
atio
ns fo
r cel
lula
r ph
one
Stop
page
of r
elat
ed
faci
litie
sD
amag
e of
faci
litie
s an
d po
wer
supp
ly
poin
ts d
ue to
fire
Stop
page
of
pum
ping
up
equi
pmen
t
Stop
page
of
pum
ping
eq
uipm
ent i
n th
e m
anho
le
Lack
of s
ervi
ce at
pa
y ph
one
Dam
age
of u
pper
eq
uipm
ent o
f the
tr
unk
syst
em
Out
-of-
cont
rol
rese
rvoi
rsSt
oppa
ge o
f te
leph
one
circ
uit
due
to la
ck o
f po
wer
supp
ly to
the
tele
phon
e sw
itchb
oard

393General
Out
-of-
cont
rol w
ater
in
take
Stop
page
of
mon
itorin
g co
ntro
l sys
tem
Stop
page
of t
he
Inte
rnet
due
to
pow
er su
pply
st
oppa
ge at
the
acce
ss p
oint
sSt
oppa
ge o
f GIS
sy
stem
sD
elay
of i
nfor
mat
ion
colle
ctio
n in
the
cent
er d
ue to
po
wer
stop
page
Stop
page
of
GIS
syst
emSt
oppa
ge o
f te
leco
mm
unic
atio
n du
e to
uns
ervi
ce o
f di
sast
er p
reve
ntio
n w
irele
ss
com
mun
icat
ion
syst
emM
anua
l ope
ratio
n of
m
otor
-ope
rate
d va
lve
in th
e re
serv
oirs
Man
ual o
pera
tion
of
mot
or-o
pera
ted
valv
e in
the
rese
rvoi
rs
Stop
page
of
tele
phon
e sw
itchi
ng b
oard
an
d tr
ansm
issio
n eq
uipm
ent d
ue to
lo
wer
vol
tage
of
batte
rySt
oppa
ge o
f au
tom
atic
cont
rol
syst
em, m
anua
l op
erat
ion
of
chem
ical
gro
utin
g
Stop
page
of
auto
mat
ic co
ntro
l sy
stem
, man
ual
oper
atio
n of
ch
emic
al g
rout
ing
Out
-of-
serv
ice
of
tele
phon
e op
erat
ed
in A
C10
0V
Tele
com
mun
icat
ion
Inad
equa
cy o
f da
mag
e in
form
atio
n du
e to
te
leco
mm
unic
atio
n m
alfu
nctio
n
Inad
equa
cy o
f da
mag
e in
form
atio
n du
e to
te
leco
mm
unic
atio
n m
alfu
nctio
n
Dam
age
of
rem
ote
cont
rol d
ue to
tr
ansm
issio
n ca
ble
failu
re
Stop
page
of m
obile
ph
one
base
stat
ion
due
to
tele
com
mun
icat
ion
cabl
e fa
ilure
Diffi
culty
of
com
mun
icat
ion
on
man
agem
ent
info
rmat
ion
(Con
tinue
d)

394 Disaster Prevention and Mitigation Technologies of Lifelines
TABL
E 19
.2 (C
ontin
ued)
D
amag
e Ex
tens
ion
Imm
edia
tely
afte
r the
Occ
urre
nce
of D
isas
ter
Affe
cted
Life
lines
A
ffect
ed C
ityBi
g C
ities
Wat
erSe
wer
age
Gas
Pow
erTe
leco
mm
unic
atio
nC
ondu
it
Part
ial s
topp
age
of
wat
er m
anag
emen
t sy
stem
due
to
mal
func
tion
of
info
rmat
ion
tele
com
mun
icat
ion
Stop
page
of O
A
equi
pmen
t du
e to
in
unda
tion
abov
e flo
or
leve
l, ou
t-of
-ser
vice
of
tele
phon
e du
e to
sw
itchb
oard
fa
ilure
Tele
phon
e ca
ll co
nges
tion
to b
e co
ncen
trat
ed b
y 50
tim
es m
ore
than
da
ily c
alls
Out
-of r
emot
e co
ntro
l for
eq
uipm
ent i
n th
e pu
mpi
ng st
atio
n
Stop
page
of e
lect
ric
com
mun
icat
ion
equi
pmen
t due
to
extr
eme i
nund
atio
nSt
oppa
ge o
f te
leph
ones
due
to
inun
datio
n ab
ove
floor
leve
lC
ondu
itPi
pe d
amag
ePi
pe d
amag
ePi
pe d
amag
eTr
ansm
issio
n ca
ble
dam
age
Tele
com
mun
icat
ion
cabl
e dam
age
Big
citie
sD
amag
e of
elec
tric
po
les a
nd c
able
s du
e to
bui
ldin
g co
llaps
e in
the
cong
este
d ar
ea
Exte
nded
dam
age o
f te
leco
mm
unic
atio
n du
e to
cabl
e fai
lure
by
fire
Exte
nded
dam
age
of
tele
com
mun
icat
ion
due
to c
able
failu
re
by fi
re

395General
19.2.1.3 Permanent Measures after the Disaster
Permanent measures after an earthquake should concentrate on two items:
• First, the existing system should have sufficient resistance against future disasters based on expe-rience in disasters.
• When should preparation for disaster prevention measures must be completed?
A damaged system is vulnerable even to loads smaller than its initial design load. An unexpectedly large load might be applied to the structure for which it was not designed. So retrofitting of the existing system is not enough for reinforcement to its initial level. Extremely large design levels for future loads will be required in the current situation in Japan.
For example, buildings constructed prior to several decades ago cannot resist Level 2 ground motion, because those structures were not designed for Level 2 ground motion. But if one of those structures has not been retrofitted, in this special case, the structure must be used even if it is not reliable. Figure 19.9 shows such a situation. In the mean time, vulnerable structures should be retrofitted so that they are strong enough to withstand Level 2 ground motion. It is difficult for engineers to set the order of priority for retrofitting because of budget limitation.
All lifelines will follow their own guidelines for retrofitting as shown in Table 19.3, which shows that the target seismic reinforcement is roughly the same.
19.2.2 Spatial Preventive Measures
Lifeline systems can utilize a characteristic approach of system redundancy as a seismic disaster preven-tion measure, because lifeline systems have a network configuration. In general, system redundancy can be achieved by a dual system of trunk lines for links or by a dual system of purification plants for nodes. But, as shown in Figure 19.10, actual lifelines exhibit complicated network configurations that have hierarchical layers in their transmission, distribution, and service networks. The retrofitting of the whole system is a difficult task and takes a long time because of its size and complexity.
When a future disaster cannot be easily predicted, it is difficult to set the priority among all the ele-ments of retrofitting and reinforcing works.
Not only companies but also residential houses are supported by a stable supply system of lifelines as shown in Figure 19.11. When a disaster occurs and several lifelines are suspended, the restoration period for residential people and industrial production systems will be increased. But modern com-mercial as well as residential activities have their core functions supported by urban lifelines. In order
Improved strength
Revised lower limit
Initial strengthRepair
Periodic repair
Allowable lower limit
Period in years
Deteriorating process
FIGURE 19.9 Deterioration of existing structures and effect of repair works.

396 Disaster Prevention and Mitigation Technologies of Lifelines
TABL
E 19
.3
Seis
mic
Des
ign
Gui
delin
es fo
r Var
ious
Life
line
Syst
ems
Item
Life
lines
Wat
erSe
wer
age
Gas
Pow
erTe
leco
mm
unic
atio
nC
ondu
it
Stan
dard
and
gu
idel
ine
Gui
delin
es o
f sei
smic
de
sign,
stru
ctur
al d
esig
n,
and
mai
nten
ance
m
anag
emen
t for
wat
er
faci
litie
s
Gui
delin
es o
f se
ismic
des
ign,
se
ismic
disa
ster
pr
even
tion
man
ual
for s
ewer
age
faci
litie
s
Gui
delin
es o
f sei
smic
de
sign
for h
igh-
pres
sure
gas
pip
elin
es
for g
roun
d-sh
akin
g an
d liq
uefie
d ar
ea
WG
repo
rt u
nder
grou
nd
tran
smiss
ion
faci
litie
s, re
port
for s
eism
ical
ly
stro
ng el
ectr
ic fa
cilit
ies
(age
ncy
of n
atur
al
reso
urce
s and
ene
rgy)
Seism
ic sa
fety
ass
essm
ent
and
its d
isast
er p
reve
ntio
n te
chno
logy
for
unde
rgro
und
faci
litie
s ag
ains
t Lev
el 2
gro
und
mot
ion
(NTT
Tec
hnica
l Jo
urna
l)
Gui
delin
e fo
r co
ndui
t des
ign,
se
ismic
des
ign
of
open
-cut
tunn
el
(JSC
E)
Typi
cal f
acili
tyTr
ansm
issio
n lin
e, di
strib
utio
n lin
es, s
ervi
ce
line,
cont
rol f
acili
ties,
dist
ribut
ion
netw
ork,
co
ntro
l fac
ilitie
s, re
serv
oirs
, pu
rifica
tion
plan
t, ot
her
rela
ted
faci
litie
s
Sew
erag
e pi
pe,
man
hole
, pum
ping
st
atio
n, tr
eatm
ent
plan
t
Hig
h-pr
essu
re p
ipel
ine,
mid
dle-
pres
sure
pi
pelin
e, ga
s hol
der,
cont
rol f
acili
ties,
othe
r re
late
d fa
cilit
ies
Subs
tatio
n, to
wer
, un
derg
roun
d ca
ble
faci
lity,
elec
tric
pol
e
Tunn
el, u
nder
grou
nd p
ipes
, m
anho
le, e
lect
ric p
ole,
aeria
l cab
le, r
adio
ant
enna
, an
d te
leco
mm
unic
atio
n bu
ildin
g
Con
duit,
cond
uit
for e
lect
ric c
able
s (C
CBO
X)
Typi
cal s
eism
ic
dam
age
mod
eO
ut-o
f-se
rvic
e of
wat
er
supp
ly, w
ater
leak
age
Lack
of g
ravi
ty fl
ow,
leak
age
Out
-of-
serv
ice,
gas
leak
age
Stop
page
of p
ower
su
pply
Con
gest
ion
of
tele
com
mun
icat
ion
and
tele
phon
e sy
stem
Cutti
ng o
ff of
ca
bles
Targ
et o
f se
ismic
des
ign
1.
For L
evel
1 g
roun
d m
otio
n, a
n im
port
ant
faci
lity
shou
ld n
ot b
e da
mag
ed
1.
For L
evel
1
grou
nd m
otio
n,
desig
n do
wnfl
ow
func
tion
mus
t be
kep
t for
an
impo
rtan
t fa
cilit
y
1.
For L
evel
1 g
roun
d m
otio
n, a
n im
port
ant f
acili
ty
shou
ld n
ot sh
ow
any
dam
age
1.
For o
rdin
ary
grou
nd
mot
ion,
all
the
faci
litie
s of
tran
smiss
ion
syst
em
shou
ld n
ot sh
ow a
ny
signi
fican
t dam
age
1.
For t
he se
ismic
inte
nsity
of
7 in
JMA
scal
e, bu
ildin
gs a
nd to
wer
s m
ust e
scap
e fr
om
colla
pse
1.
For L
evel
1
grou
nd
mot
ion,
no
dam
age
is ex
pect
ed

397General
2.
For L
evel
2 g
roun
d m
otio
n, h
uman
loss
sh
ould
not
be
acce
pted
, an
impo
rtan
t fac
ility
sh
ould
show
min
or
dam
age,
and
can
mai
ntai
n th
e fu
nctio
nal
perf
orm
ance
2.
For L
evel
2
grou
nd m
otio
n,
any
dow
nflow
fu
nctio
n m
ust
be o
btai
ned
2.
For L
evel
2 g
roun
d m
otio
n, h
uman
lo
ss sh
ould
not
be
acce
pted
, an
impo
rtan
t fac
ility
sh
ould
show
min
or
dam
age,
and
can
mai
ntai
n th
e fu
nctio
nal
perf
orm
ance
2.
For h
igh-
leve
l gr
ound
mot
ion,
lo
ng a
nd w
ide
susp
ensio
n of
pow
er
supp
ly m
ust b
e es
cape
d. S
yste
m
redu
ndan
cy a
nd
mul
tiple
circ
uit
syst
em sh
ould
be
equi
pped
to k
eep
the
com
preh
ensiv
e sy
stem
per
form
ance
2.
For t
he se
ismic
inte
nsity
of
6, t
he p
lant
faci
lity
in
the
fact
ory
mus
t kee
p m
inor
dam
age
and
func
tiona
l cap
acity
2.
For L
evel
2
grou
nd
mot
ion,
no
loss
of h
uman
lif
e an
d m
inor
da
mag
e fo
r fa
cilit
y ar
e ex
pect
ed
3.
For t
he se
ismic
inte
nsity
of
7, t
he p
lant
faci
lity
in
the
fact
ory
mus
t kee
p m
oder
ate
dam
age
and
early
nor
mal
izat
ion
4.
The
plan
t out
of t
he
fact
ory
mus
t hav
e no
da
mag
e fo
r the
seism
ic
inte
nsity
of 6
and
acc
ept
part
ial d
amag
e an
d no
da
mag
e fo
r cab
le
prot
ectio
n fo
r the
se
ismic
inte
nsity
of 7

398 Disaster Prevention and Mitigation Technologies of Lifelines
to prevent the abrupt suspension of lifelines due to a disaster, many companies are preparing a business continuity plan [12] for future risks. When all lifelines are fully restored, the company activity will be completely recovered. So the recovery level of the company activity depends on the functionality of restored lifelines.
19.3 Acceleration of Functional Recovery at a Disaster
When an earthquake occurs, lifeline systems sustain structural damage as well as loss of function. Functional damage of a single lifeline that is mutually interdependent on several other lifelines extends the loss of function to other lifelines too. As a result, commercial as well as residential activities are dis-turbed, emphasizing the importance of understanding the mutual interdependency of several lifelines.
In a retrofitting scheme where one lifeline is reinforced to a higher seismic resistance, interdependent lifelines may fail to support the seismic performance of the single lifeline, if these other lifelines con-tinue to have lower seismic resistance. These other lifelines need to be retrofitted to obtain their own
Distribution network
Transmission line
FIGURE 19.10 Illustration of a lifeline network system.
BCP
Power, informationand transportation
Sewerage and common conduit
Water and gas
FIGURE 19.11 Business continuity plan supported by various lifelines.

399General
higher seismic resistance. Therefore, lifeline operators must not only provide adequate retrofitting but also keep coordinate with other lifelines.
References
1. Isoyama, R., Ishida, E., Yune, K., and Hiromizu, Y. Research on seismic damage prediction of water pipelines, Journal of Japan Water Works Association, JWWA, 67(2), 25–40, 1998 (in Japanese).
2. American Lifeline Alliance. Seismic Fragility Formulations for Water System, Part 2—Appendices, ASCE, 2001.
3. Ang, A.H.-S. and Tang, W. Probabilistic Concepts in Engineering Planning and Design, Vol. I, Basic Principles, John Wiley, New York, 1975.
4. Kawakami, E. Seismic damage observations of buried lifelines and their seismic design, Journal of Pipeline Technology, H09-08, 65–71, 1996 (in Japanese).
5. Scientific Engineering Research Laboratories for Disaster Prevention. Report on disaster mitigation based on informative collaboration for risk managements in 2007, 2007 (in Japanese).
6. Takada, S., Kitaura, M., Kawakami, E., Noda, S., Nojima, N., Ando, T., and Koike, T. Earthquake and Urban Lifelines, Publishing Company of Kyoto University, 1998 (in Japanese).
7. Suzuki, T., Takada, S., Koike, T., Ogawa, Y., and Matsumoto, M. Plastic hinge analysis of buried pipelines for lateral load spreading due to liquefaction, Journal of JSCE, 710.I-60, 79–90, 2002 (in Japanese).
8. Jones, S.L., O’Rourke, T.D., Stewart, H.E., and Billington, S.L. Large displacement soil-structure interaction facility for lifeline system, Proceedings of the Sixth US Conference and Workshop on Lifeline Earthquake Engineering, TCLEE Monograph No. 25, Long Beach, CA, pp. 936–945, 2003.
9. Goto, Y., Suzuki, T., Suetomi, I., Koji, Y., Tsuruta, M., Kataoka, S., and Suzuki, M. Investigation on damage of important infrastructures and their mutual interdependency, Journal of Earthquake Engineering, JSCE, 2003, 1344–1357 (in Japanese).
10. Shimizu, Y. Rapid alert system for seismic damage prediction system (SIGNAL), Journal of Measurement and Control, 11(11), 42–46, 1991 (in Japanese).
11. Special Committee for Report on Hanshin/Awaji Seismic Disaster. Damage and restoration of lifeline systems in Hanshin/Awaji Disaster, Report on Hanshin/Awaji Seismic Disaster, 1997 (in Japanese).
12. Watanabe, K. Business Continuity Plan for companies suffered by damages of supply chains, Journal of BCP/BCM Research, 1, 44–47, 2007 (in Japanese).

401
A water system is threatened by many risks such as natural hazards, including earthquake, drought, and storm and flood damage, as well as man-made hazards like water pollution and electric power loss. Once one of these hazards occurs, daily civic life and urban activities will be significantly affected. Table 20.1 shows a hazard table in which the relationship between hazards and water system facilities are described.
Almost one-sixth of earthquakes in the world occur in Japan. The 1995 Kobe, 2005 Niigata, 2007 Noto and Offshore of Niigata, 2008 Iwate, and 2011 Tohoku earthquakes resulted in seismic intensity stronger than 6.5 on the Japan Metrological Agency (JMA) scale. In these seismic disasters, water sys-tems were damaged over the entire service area and stopped water services for several months. This long duration of water supply stoppage is different from other accidents such as leakage or water pollution in normal daily condition. In this chapter, seismic damage to water systems and their restoration processes will be described.
20.1 Seismic Damage of Water Supply Systems
20.1.1 1995 Hyogoken–nanbu earthquake (Kobe earthquake)
This earthquake occurred at 5:46 on January 17, 1995. The depth of the seismic source is about 14 km under Akashi Channel. The magnitude of this earthquake was 7.2 on the JMA magnitude scale, and the largest seismic intensity of JMA scale of 7.0 was recorded in some zones of Kobe city, Ashiya city,
20Water Supply System:
Mitigation Technologies
20.1 Seismic Damage of Water Supply Systems....................................4011995 Hyogoken–Nanbu Earthquake (Kobe Earthquake) • 2004 Niigata Chuetsu Earthquake • 2011 Pacific Coast Tohoku Earthquake (Tohoku Earthquake)
20.2 Disaster Preventive Measures (Before Earthquake, Planning) ......414Basic Concept of Seismic Disaster Preventive Measures • Seismic Performance Requested by the Ordinances in Japan • Scenario Earthquakes and Damage Estimation • Planning of Earthquake Resistance Measures
20.3 Seismic Disaster Preventive Measures for Pipelines (Reinforcement of Existing Facilities) ...........................................433Seismic Performance of the Pipeline and Its Related Equipment for Seismic Levels • Planning of Pipeline Configurations • Seismic Reinforcement Methods
References ......................................................................................................438Takeshi KoikeKyoto University

402 Disaster Prevention and Mitigation Technologies of Lifelines
TABL
E 20
.1
Impa
ct o
f Nat
ural
Dis
aste
r and
Acc
iden
t to
Wat
er S
ervi
ce F
acili
ties
Type
C
ause
s
Wat
erw
orks
Fac
ility
Inta
ke T
ower
and
Aqu
educ
tD
amPu
rifica
tion
Plan
tPi
pelin
esSe
rvic
e Li
nes
Nat
ural
di
sast
erEa
rthq
uake
Dam
age
of p
ipel
ine
and
stru
ctur
esD
amag
e of
dam
leak
age
Dam
age
of re
serv
oirs
, pi
pelin
es, a
nd fa
cilit
ies
Dam
age
of p
ipel
ines
and
re
late
d fa
cilit
ies
Dam
age
of se
rvic
e lin
es
Volc
anic
ac
tivity
Leak
age
Acc
umul
atio
n of
deb
ris fl
owFl
ow-o
ut o
f filte
r san
d,
leak
age
of ch
emic
al p
rodu
cts
Leak
age
Leak
age
Wat
er sh
orta
geLi
mit
of in
take
wat
erLo
wer
stor
ed w
ater
, out
brea
k of
wat
erw
eed
Incr
ease
in tu
rbid
ityLi
mit
of w
ater
supp
ly b
y co
ntro
l of p
ress
ure
low
erin
g an
d va
lves
, rus
t-co
lore
d w
ater
by
valv
e op
erat
ion
Diffi
culty
of w
ater
flow
, sto
p of
wat
er su
pply,
rust
-co
lore
d w
ater
gen
erat
ion
Stor
m a
nd
flood
dam
age
Flow
-in o
f floa
ting
timbe
r an
d so
il, sc
our,
clos
ing
with
sc
reen
, cut
ting
of c
able
s, flo
w-in
of s
eaw
ater
Dam
age o
f dam
, ac
cum
ulat
ion
of d
ebris
flow
, co
llaps
e of t
ower
, cut
ting
of
cabl
es, fl
ow-in
of s
eaw
ater
Incr
ease
in tu
rbid
ity, fl
ow-in
of
sew
erag
e w
ater
, col
laps
e of
tow
er, c
uttin
g of
cab
les,
flow
-in o
f sea
wat
er
Flow
-in o
f sew
erag
e w
ater
, da
mag
e of
pip
e du
e to
slop
e fa
ilure
Diffi
culty
of w
ater
flow
, sto
p of
wat
er su
pply
Thun
derb
olt
Stop
of p
umpi
ngSt
op o
f pum
ping
Stop
of p
umpi
ng, t
hen
gene
ratio
n of
rust
-col
ored
w
ater
and
wat
er h
amm
er
Diffi
culty
of w
ater
flow
, sto
p of
wat
er su
pply,
rust
-co
lore
d w
ater
gen
erat
ion
Snow
dam
age
Dec
reas
e in
inta
ke
cros
s-se
ctio
nal a
rea
due
to
ice
free
zing
and
snow
, di
fficu
lt op
erat
ion
of g
ate,
colla
pse
of to
wer
, cut
ting
of
cabl
es
Dec
reas
e in
inta
ke
cros
s-se
ctio
nal a
rea
due
to
ice
free
zing
and
snow
, di
fficu
lt op
erat
ion
of g
ate,
colla
pse
of to
wer
, cut
ting
of
cabl
es
Col
laps
e of
tow
er, c
uttin
g of
ca
bles
Col
laps
e of
tow
er, c
uttin
g of
ca
bles
Failu
re o
f ser
vice
line
s due
to
free
zing
Salt
dam
age
Flow
-in o
f sea
wat
er, c
orro
sion
and
neut
raliz
atio
n, d
amag
e of
pow
er eq
uipm
ent
Flow
-in o
f sea
wat
er, c
orro
sion
and
neut
raliz
atio
n, d
amag
e of
pow
er eq
uipm
ent
Cor
rosio
nC
orro
sion
Cor
rosio
n
Acc
iden
tPo
wer
failu
reSt
op o
f pum
ping
Stop
of p
umpi
ngSt
op o
f pum
ping
, the
n ge
nera
tion
of ru
st-c
olor
ed
wat
er a
nd w
ater
ham
mer
Diffi
culty
of w
ater
flow
, sto
p of
wat
er su
pply,
rust
-co
lore
d w
ater
gen
erat
ion
Wat
er q
ualit
y ac
cide
ntSt
op o
f wat
er in
take
, use
of
chem
ical
pro
duct
s and
ac
tivat
ed c
arbo
n
Flow
-in o
f tox
ic su
bsta
nce
and
oil
Cha
nge
of p
urifi
catio
n m
etho
d, u
se o
f act
ivat
ed
carb
on
Con
trol
of w
ater
del
iver
y, ge
nera
tion
of ru
st-c
olor
ed
wat
er
Diffi
culty
of w
ater
flow
, sto
p of
wat
er su
pply,
rust
-co
lore
d w
ater
gen
erat
ion
Faci
lity
and
pipe
lines
Stop
of w
ater
inta
ke o
r tr
ansp
orta
tion
Low
er p
rodu
ctio
n of
pur
ified
w
ater
Con
trol
of w
ater
del
iver
y, ge
nera
tion
of ru
st-c
olor
ed
wat
er
Diffi
culty
of w
ater
flow
, sto
p of
wat
er su
pply,
rust
-co
lore
d w
ater
gen
erat
ion

403Water Supply System: Mitigation Technologies
Takarazuka city, and Awaji Island. Other areas experienced a seismic intensity of more than 6.0 on the JMA scale.
20.1.1.1 Seismic Damage of Water Facilities (Structures)
Significant damage occurred in major facilities such as dams, intake facilities, purification facilities, and pumping stations.
In the case of dams, the Nishinomiya city small dam was damaged, and its body was completely col-lapsed as shown in Figures 20.1 and 20.2. The other water reservoir in the same city was partially dam-aged in the lip flap, but total functional damage was prevented.
In the case of intake facilities, one plant in the city Ashiya was damaged by sand failure. Also a deep well was damaged in the city Akashi.
FIGURE 20.2 Damage of embankment of the lower reservoir in Niseko.
FIGURE 20.1 Collapse of embankment between middle and lower reservoirs in Niseko.

404 Disaster Prevention and Mitigation Technologies of Lifelines
In the case of purification plants, concrete jointing lines were opened, and then a large amount of water leakage started from this gap as shown in Figure 20.3. In all the purification plants, many inclined plates, piping, and washing pipes were damaged as shown in Figure 20.4. The side wall of the effluent treatment facility collapsed at another plant.
In the case of pumping stations, pipelines in Nishinomiya pump station were damaged at 12 loca-tions, resulting in a long period to recover water services.
In the reservoir tanks, outlet pipes connected to a low-level tank were broken and separated. Another precast concrete tank had circumferential cracks, whereas another tank was deformed at its wall plate. This tank was finally replaced by a new one.
20.1.1.2 Seismic Damage of Water Pipelines
The modern cities Kobe, Ashiya, Nishinomiya, Takarazuka, Amagasaki, Osaka, and Old Hokutan Cho were seriously damaged by Kobe earthquake in 1995. Table 20.2 shows the statistics of those cities
FIGURE 20.3 Crack opening at the bottom of setting basin in Inagawa purification plant of Nishinomiya city.
FIGURE 20.4 Pipe damage in the settling basin in Sameike purification plant of Nishinomiya city.
405Water Supply System: Mitigation Technologies
that were completely recovered in their water supply performance as of March 31, 2007. Table 20.3 summarizes the damage modes for typical water pipes such as ductile cast iron pipe, cast iron pipe, polyvinyl chloride pipe, steel pipe, and asbestos pipe.
20.1.1.3 Photos of Seismic Damage
Figures 20.5 through 20.7 show areas of liquefaction and damage. Figures 20.8 through 20.10 show the pipe damage at the quay at coastal areas. The rigid VP damage is shown in Figures 20.11 and 20.12 at the slope area and at the flat area, respectively. Figure 20.13 shows pipe damage connected at the bridge. Figure 20.14 is pipe damage due to the embankment collapse. Figures 20.15 through 20.19 show the damage points of attachment equipment.
20.1.2 2004 niigata chuetsu earthquake
The Niigata Chuetsu earthquake occurred on October 27, 2004, at 17:56 with a magnitude of MW = 6.8 at a depth of 13 km. A seismic intensity of 7 JMA (Japan Meteorological Agency) was recorded at Kawaguchi town municipality, a seismic intensity of 6.5 JMA was observed at Ojiya city, Yamakoshi village, and Oguni town, and a seismic intensity of 6.0 JMA was reported at 12 other cities, towns, and villages.
20.1.2.1 Seismic Damage of Water Facilities
Major structural damage of the water facilities were as follows.In the case of purification facilities, one purification facility settled over its whole area, so that many
expansion joints connected to the concrete body, attached structures, and equipment were damaged as shown in Figures 20.20 through 20.23.
The air drying bed on the building was cracked as shown in Figure 20.24.Similar damage occurred at the Ojiya purification plant as shown in Figures 20.25 and 20.26.The other purification plant in the same city was hit by a landslide, resulting in settlement and lateral
movement of the ground as shown in Figures 20.27 and 20.28.In the case of pumping stations, the first relay pumping station collapsed as shown in Figure 20.29
and buried by sand and rocks, so that the water supply stopped. In a small-scale water system in the same village, the fifth relay pumping station slipped along a slope and stopped the water supply as shown in Figures 20.30 and 20.31.
In the water reservoirs of Yamakoshi village, two reservoir tanks were inclined one way, so that the water supply was suspended as shown in Figure 20.32.
TABLE 20.2 Statistics of Water Services in the Cities Damaged in 1995 Kobe Earthquakea
Cities Seriously Damaged by 1995 Kobe Earthquake
Item Kobe Ashiya Nishinomiya Takarazuka Amagasaki Osaka Old Hokutan Cho
Population of the water supply area
15,25,833 91,567 4,27,833 2,21,101 4,60,749 26,37,115 7628
Population who are supplied water
15,22,548 91,567 4,27,833 2,21,015 4,60,744 26,37,115 6658
Diffusion rate of water supply (%)
99.8 100 100 100 100 100 91.6
Water supply volume (mm3)
199.927 11.669 11.66 25.376 62.411 475.577 1.232
Total length of the distribution pipelines (km)
4621 229 52 666 965 5073 152
a As of March 31, 2007.

406 Disaster Prevention and Mitigation Technologies of Lifelines
TABL
E 20
.3
Dam
age
Mod
es o
f Wat
er P
ipel
ines
in th
e C
ities
Dam
aged
in 1
995
Kob
e Ea
rthq
uake
Citi
es S
erio
usly
Dam
aged
by
1995
Kob
e Ea
rthq
uake
Item
Kobe
Ash
iya
Nish
inom
iya
Taka
razu
kaA
mag
asak
iO
saka
Old
Hok
utan
Cho
Num
ber o
f da
mag
ed p
oint
s17
5736
282
422
513
023
597
Duc
tile
cast
iron
pi
pe
Alm
ost a
ll da
mag
e po
ints
w
ere
at th
e pi
pe jo
ints
. D
CIP
with
seism
ical
ly
stro
ng jo
ints
wer
e no
t da
mag
ed
Alm
ost a
ll da
mag
e po
ints
wer
e at
the
pipe
join
ts. D
CIP
w
ith se
ismic
ally
st
rong
join
ts w
ere
not d
amag
ed
Alm
ost a
ll da
mag
e po
ints
wer
e at
the
pipe
join
ts
Alm
ost a
ll da
mag
e po
ints
wer
e at
the
pipe
join
ts
Alm
ost a
ll da
mag
e po
ints
wer
e at
the
pipe
join
ts
Alm
ost a
ll da
mag
e po
ints
wer
e at
th
e pi
pe jo
ints
Alm
ost a
ll da
mag
e po
ints
wer
e at
th
e pi
pe jo
ints
Cas
t iro
n pi
pe
Pipe
bod
ies w
ere
colla
psed
and
pip
e jo
ints
wer
e pu
lled
out
Pipe
bod
ies w
ere
colla
psed
Pipe
bod
ies w
ere
colla
psed
and
pi
pe jo
ints
wer
e pu
lled
out
Alm
ost a
ll ge
omet
ric p
ipin
gs
wer
e da
mag
ed
Alm
ost a
ll ge
omet
ric p
ipin
gs
wer
e da
mag
ed
Alm
ost a
ll da
mag
e po
ints
wer
e at
th
e pi
pe jo
ints
Non
e
Rigi
d po
lyvi
nyl
chlo
ride
pipe
Pi
pe b
odie
s wer
e co
llaps
ed a
nd p
ipe
join
ts w
ere
pulle
d ou
t
Pipe
bod
ies w
ere
colla
psed
and
pi
pe jo
ints
wer
e pu
lled
out
Pipe
bod
ies w
ere
colla
psed
and
pi
pe jo
ints
wer
e pu
lled
out
Pipe
bod
ies w
ere
colla
psed
for p
ipes
le
ss th
an 1
50 m
m
in d
iam
eter
Pipe
bod
ies w
ere
colla
psed
for p
ipes
le
ss th
an 1
50 m
m
in d
iam
eter
Non
ePi
pe jo
ints
wer
e da
mag
ed
Stee
l pip
eW
elde
d jo
ints
wer
e da
mag
ed a
nd p
ipe
bodi
es w
ere
colla
psed
, w
hich
occ
urre
d al
mos
t in
all
the
pipe
brid
ges
Non
ePi
pe b
odie
s wer
e co
llaps
ed fo
r pi
pes l
ess t
han
75 m
m in
di
amet
er
Non
eSt
eel b
ody
and
join
ts w
ere
dam
aged
Non
eN
one
Asb
esto
s pip
eN
one
Non
ePi
pe b
odie
s wer
e co
llaps
edPi
pe b
odie
s wer
e co
llaps
edPi
pe b
odie
s wer
e co
llaps
edN
one
Pipe
bod
ies w
ere
colla
psed

407Water Supply System: Mitigation Technologies
20.1.2.2 Seismic Damage of Water Pipelines
Seismic damage to water pipelines in this event is shown in Figures 20.33 through 20.40.The 2004 Niigata Chuetsu Earthquake caused severe damages to Nagaoka city, Ojiya city, and
Yamakoshi village. The basic statistics of these waterworks are given in Table 20.4 and the seismic dam-ages in Table 20.5.
20.1.3 2011 Pacific coast tohoku earthquake (tohoku earthquake)
An M9.0 mega-thrust earthquake occurred off the coast of Miyagi Prefecture on March 11, 2011, with the hypocenter being 24 km deep [1]. Water facilities suffered damage from the earthquake as well as
FIGURE 20.6 Pulling out of mechanical joint of a ductile cast iron pipe of 300 mm diameter.
FIGURE 20.5 Digging of mechanical joint of a ductile cast iron pipe of 900 mm diameter.

408 Disaster Prevention and Mitigation Technologies of Lifelines
the resulting tsunami. One hundred and eighty-seven cities suffered deficient water supply, leaving 2.3 million households without water.
The water suspension and restoration process of the Tohoku earthquake in the affected Japanese prefectures is summarized in Figure 20.41. Water suspension occurred in 19 prefectures that are located in eastern Japan. The total number of households affected by the water suspension was more than 2.2 million. Water suspension in the other 4.8 million householders was due to the tsunami.
In Sendai city, which uses 30% of the water from Sen’nan and Sen’en Water Supply System, 230,000 households lost their water supply due to damaged water pipes and leakage in distribution water pipes at approximately 900 locations.
FIGURE 20.8 Pulling out of mechanical joint in a ductile cast iron pipe of 350 mm diameter.
FIGURE 20.7 Damage of welded joint in a steel pipe of 600 mm diameter.

409Water Supply System: Mitigation Technologies
The damage points in Sendai city can be seen in Figure 20.42 in which the pipe damage is relatively small, and the damage rate of the pipe is approximately 0.03/km. Figure 20.42 is a location map of the damaged pipes, which are shown by circle (DIP) and triangular (SP) in Sendai city. Table 20.6 shows number of damage points in Sendai city for various pipelines and facilities related with pipe joining accessories in 2011 Tohoku Earthquake.
Sen’nan and Sen’en water supply system in southern Miyagi prefecture takes water from the Abukuma river at Shichikawashuku dam and supplies drinking water to 17 municipalities from a water purification plant in Shiroishi city. No significant damage was reported to these facilities and their major pipes.
FIGURE 20.10 Buckling of 200 mm diameter steel pipe.
FIGURE 20.9 Broken tee junction of 250 mm × 150 mm in a cast iron pipe.

410 Disaster Prevention and Mitigation Technologies of Lifelines
FIGURE 20.13 Broken cast iron pipe of 200 mm diameter.
FIGURE 20.11 Leakage from a rigid polyvinyl chloride pipe of 75 mm diameter at the slope area.
FIGURE 20.12 Gap in the rigid polyvinyl chloride pipe of 75 mm diameter at the flat area.

411Water Supply System: Mitigation Technologies
Figure 20.43 shows the flood like leakage of water flow from the expansion joint of a high-pressure water pipe (2400 mm OD), whereas in Figure 20.44, a leakage flow occurred from the K-shaped joint made of DIP joint. Figure 20.45 shows the damage location map in Miyagi prefecture. Also, damage to water pipe bridges was observed due to the failure of supports, anchor bolts, leakage of flexible pipe, and the leakage of air valves.
Some water supply systems near coastal areas took on ground water inundated by tsunami, which caused trouble in purification plants. Water supply to Miyako Island was cut off for a long period of time due to the failure of the road and the bridge near Nobiru Coast, which was affected by tsunami.
FIGURE 20.14 Pulling out of cast iron pipe of 450 mm diameter.
FIGURE 20.15 Loosening of flange bolt of gate valve.

412 Disaster Prevention and Mitigation Technologies of Lifelines
Table 20.7 compares the mean damage rate of pipes among recent big earthquakes in Japan includ-ing the Kobe, Niigata Chuetsu, Noto, Niigata Chuetu-oki, and Tohoku earthquakes. According to this table, the damage rate of the Tohoku earthquake is 0.07, which is the minimum among them. In Table 20.8, the damage rate per km of three types of pipes are compared with that of the Kobe earthquake.
Figures 20.46 and 20.47 show the collapse of the concrete cylinder of a water reservoir tank. This tank was broken at the connected portion of the PC wall and RC wall as shown in Figure 20.47.
FIGURE 20.16 Damage of flange of a gate valve.
FIGURE 20.17 Broken body of air valve.

413Water Supply System: Mitigation Technologies
FIGURE 20.18 Broken nut of air valve.
FIGURE 20.19 Loosening at a flange of hydrant.
FIGURE 20.20 Settlement of an office.

414 Disaster Prevention and Mitigation Technologies of Lifelines
20.2 Disaster Preventive Measures (Before earthquake, Planning)
20.2.1 Basic concept of Seismic Disaster Preventive Measures
When a large-scale earthquake occurs, the water supply system may be damaged across a wide area, where many pipelines and their related facilities are installed. Thus, the provision for earthquake disas-ter is one of the most important measures.
In order to minimize seismic damage and to decrease the restoration period, various earthquake preventive measures, such as reinforcement of the important water facilities and emergency procedures immediately after the earthquake, are definitely necessary.
Figure 20.48 shows steps to be carried out: (1) to estimate earthquake damage of the water supply system, (2) to carry out the reinforcement of the water facilities to minimize the damage and their pre-vailing effects based on the damage estimation, and (3) to establish the rapid restoration for emergency water supply immediately after the earthquake.
FIGURE 20.21 Settlement of related structures.
FIGURE 20.22 Pipe connection to the building.

415Water Supply System: Mitigation Technologies
Furthermore, in order to maintain a stable water supply after an earthquake, cooperation between the relevant water suppliers must be established along with the coordination of widely spread water users.
20.2.2 Seismic Performance Requested by the ordinances in Japan
The ordinance on water supply facilities in Japan requires the following seismic performance [2]:
1. Water supply facilities must be designed for seismic force as well as the liquefaction-induced settlement and lateral spreading. These seismic load levels depend on the importance of the facility.
2. Two types of seismic ground motions are considered for the seismic design of the water supply facil-ities. Level 1 ground motion is defined as a ground motion excited by earthquakes possibly occur-ring during the service period, whereas Level 2 ground motion is defined as the maximum ground motion predicted at the site. The seismic performance for Level 1 ground motion is intended to
FIGURE 20.24 Damage of expansion joint on the wall surface in the sun dry.
FIGURE 20.23 Uplifting of foundation of pipe bridge.

416 Disaster Prevention and Mitigation Technologies of Lifelines
maintain the function of water supply, whereas the seismic performance for Level 2 ground motion is intended to prevent significant damage to the facility although slight damage are allowed.
3. The following facilities must follow the requirements for Level 1 and Level 2 ground motions: a. Intake tower, storage dam and pond, conduit, purification facility, and transmission pipelines. b. Distribution pipelines, that can result in significant malfunction to the water supply. c. Distribution pipelines other than (b): i. Water main pipelines without any branches. ii. Pumping station connected to the water main. iii. Water reservoirs connected to the water main. iv. Water reservoirs of the maximum capacity that do not have any water main in the distri-
bution network. 4. Other facilities except for the structures given earlier are considered not capable of any significant
damage to the facility although slight damage is allowed for Level 1 ground motion.
FIGURE 20.25 Ground settlement around the filter basin.
FIGURE 20.26 Cracks at the bottom of sludge basin.

417Water Supply System: Mitigation Technologies
20.2.3 Scenario earthquakes and Damage estimation
Earthquake damage estimation of water supply facilities is necessary to prepare disaster prevention plan-ning and to establish emergency and restoration action schemes. In order to estimate earthquake damage, the first step is to review existing earthquake histories and possible earthquake magnitudes. For the next step, the ground and soil conditions must be checked to evaluate the damage of the purification facility and pipelines. Based on these damage estimations, the water suspension area and its number of people can be predicted. Figure 20.49 is a flow chart for earthquake damage estimation.
It should be noted that slope failures can occur, which depend on the site characteristics of the topography, ground, and soil conditions. These characteristics must be taken into consideration in seismic hazard estimation.
FIGURE 20.28 Ground displacement due to landslide in the purification plant.
FIGURE 20.27 Landslide near the purification plant.

418 Disaster Prevention and Mitigation Technologies of Lifelines
20.2.3.1 Scenario earthquake
In general, a scenario earthquake is estimated based on geological data and the record of historical earthquakes. This scenario earthquake should be consistent with the local municipal office scenario that has been established for the disaster prevention planning.
20.2.3.2 Seismic Assessment for Scenario earthquakes
Structural damage of network components depends on their seismic design method, material type, and retrofitting situation. Recent development of technologies in the seismic design methods and pipeline materials has been reflected in the construction period, and many structural components have been replaced by the new ones.
FIGURE 20.29 No. 1 pumping station buried due to ground collapse.
FIGURE 20.30 No. 5 pumping station slipping down due to slope failure.

419Water Supply System: Mitigation Technologies
It should be noted that water pipelines are composed of series and parallel systems in the network configuration. Therefore, the structural damage need not lead directly to loss of function. Given these characteristics, the seismic assessment should be done for each structure.
20.2.3.2.1 Structures and FacilitiesIn the comprehensive damage assessment for structures and facilities, the following points should be taken into consideration: the resisting strength of the facility, availability of backup facility, effect of the water supply system and function given facility damage, ease of restoration, and secondary damage potential, such as flooding or fire following earthquake. Special care must be paid to the connection points between pipes and buildings, which are often damaged in previous earthquakes.
FIGURE 20.31 Landslide at No. 5 pumping station.
FIGURE 20.32 Inclined Ikeya/Okubo reservoir.

420 Disaster Prevention and Mitigation Technologies of Lifelines
FIGURE 20.33 Deformations of expansion joint and ring support.
FIGURE 20.34 Pulling out of mechanical joint (A type) of ductile cast iron pipe.
FIGURE 20.35 Situation of road collapse.

421Water Supply System: Mitigation Technologies
Since the water supply system has been constructed over a long period, there are different kinds of structures with different resisting strengths. Therefore, the seismic performance of a network system is not always homogenous over the whole system. For seismic assessment of a water supply system, this type of variety in structural resistance must be taken into consideration.
The effective assessment steps are as follows:
1. Collect the completion documents and site survey of the water supply system 2. Select the important facilities necessary for the seismic assessment 3. Assess the structural performance of the facilities based on the seismic design guidelines 4. Estimate the seismic safety evaluation of the structural elements of facilities 5. Estimate the seismic safety evaluation of the whole water supply system due to the scenario earth-
quake by using the results of the earlier steps
FIGURE 20.36 Pulling out of mechanical joint (K type) of ductile.
FIGURE 20.37 Pulling out of mechanical joint (K type) of ductile cast iron pipe.

422 Disaster Prevention and Mitigation Technologies of Lifelines
Water supply stoppage due to facility damage will depend on the decentralized arrangement of the main facilities, availability of backup functions such as mutual connections among the neighbor-ing water suppliers, and preparation of alternative water supply measures. The restoration period can be estimated by the number and location of damage points, the difficulty of locating dam-age points following an event, the difficulty of restoration work, and the availability of restoration equipment.
The following is considered secondary damage: collapse of the embankment, water leakage from the reservoirs or pipelines installed at the slope portion, poisonous gas leakage such as chlorine gas, and the collapse of the buildings.
Broken
FIGURE 20.39 Broken pipe body of RR joint of rigid polyvinyl chloride pipe.
FIGURE 20.38 Broken pipe body of polyethylene pipe.

423Water Supply System: Mitigation Technologies
FIGURE 20.40 Joint failure of polyethylene pipe covered by coated steel plate.
TABLE 20.5 Damage Modes of Water Pipelines in the Cities Damaged in 2004 Niigata Chuetsu Earthquake
Cities Seriously Damaged by 2004 Niigata Chuetsu Earthquake
Item Nagaoka Ojiya Yamakoshi
Number of damaged points
328 328 56
Ductile cast iron pipe Almost all damage points were at the pipe joints
Almost all damage points were at the pipe joints with A-type joint
Almost all damage points were at the pipe joints
Cast iron pipe None Pipe bodies were collapsed and pipe joints were pulled out
None
Rigid polyvinyl chloride pipe
Pipe bodies were collapsed and pipe joints were pulled out
Pipe bodies were collapsed and pipe joints were pulled out
Pipe bodies were collapsed and pipe joints were pulled out
Steel pipe Pulled out coupling joint and tearing of the screw-type joints
Tearing of the screw-type joints None
Polyethylene pipe None Leakage from the flange Pipe body and fusion joints were collapsed
Asbestos pipe None None None
TABLE 20.4 Statistics of Water Services in the Cities Damaged in 2004 Niigata Chuetsu Earthquakea
Cities Seriously Damaged by 2004 Niigata Chuetsu Earthquake
Item Nagaoka Ojiya Yamakoshi
Population of the water supply area 2,76,924 38,194 1720Population who are supplied water 2,76,370 38,156 1720Diffusion rate of water supply (%) 99.8 99.90% 100Water supply volume (mm3) 37.382 5.941 0.00064Total length of the distribution pipelines (km) 1939 296 60
a As of March 31, 2007.

424 Disaster Prevention and Mitigation Technologies of Lifelines
2.23 million households
2013
Aftershock of seismic intensity of 6—on April 7th
Aftershock of seismic intensity of 6—on April 11thAftershock of seismic intensity
of 6—on April 12th
No.
of h
ouse
s
No. of cities and towns (right-hand axis)No. of prefectures (right-hand axis)No. of houses in out of service (left-hand axis)No. of houses in restored stage (left-hand axis)
(1000 households)2400
2200
2000
1800
1600
1400
1200
1000
800
600
400
200
0
Mar
ch 1
2M
arch
14
Mar
ch 1
6M
arch
18
Mar
ch 2
0M
arch
22
Mar
ch 2
4M
arch
26
Mar
ch 2
8M
arch
30
Apr
il 1
Apr
il 3
Apr
il 5
Apr
il 7
Apr
il 9
Apr
il 11
Apr
il 13
Apr
il 15
Apr
il 17
Apr
il 19
Apr
il 21
Apr
il 23
Apr
il 25
Apr
il 27
May
2M
ay 9
May
13
May
18
May
23
May
27
June
3
200
180
160
140
120
100
80
60
40
20
0
FIGURE 20.41 Restoration process of water service systems in the 2011 Pacific coast Tohoku earthquake.
0 2 4 8 12 16 20 km
-Legend -Damage locations
DIPSPAdministrative districtWater streamRoad networkRailway
FIGURE 20.42 Damage locations in Sendai city.
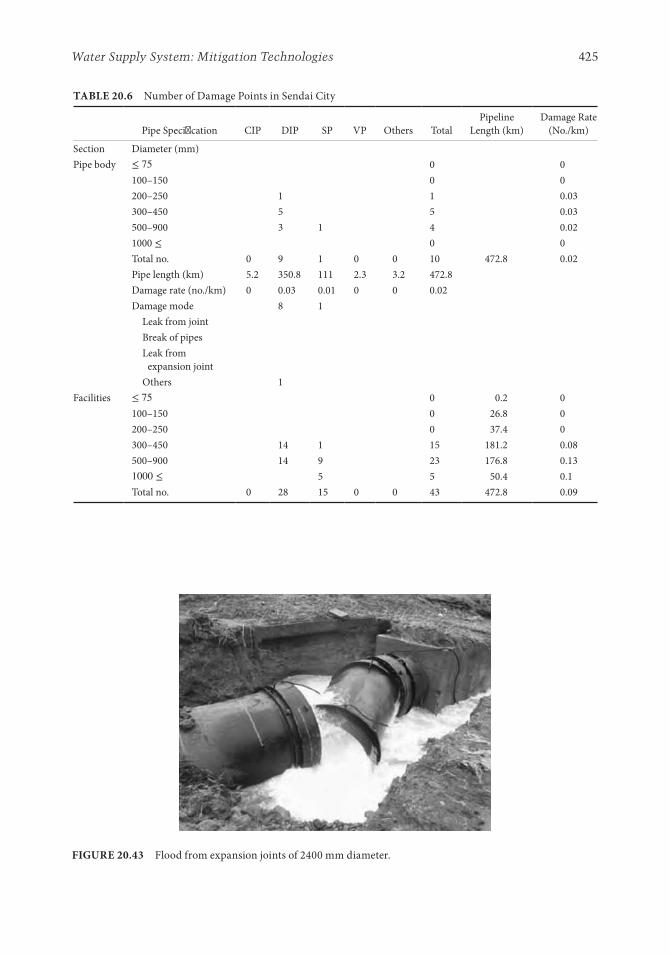
425Water Supply System: Mitigation Technologies
FIGURE 20.43 Flood from expansion joints of 2400 mm diameter.
TABLE 20.6 Number of Damage Points in Sendai City
Pipe Specification CIP DIP SP VP Others Total Pipeline
Length (km) Damage Rate
(No./km)
Section Diameter (mm)Pipe body ≤ 75 0 0
100–150 0 0200–250 1 1 0.03300–450 5 5 0.03500–900 3 1 4 0.021000 ≤ 0 0Total no. 0 9 1 0 0 10 472.8 0.02Pipe length (km) 5.2 350.8 111 2.3 3.2 472.8Damage rate (no./km) 0 0.03 0.01 0 0 0.02Damage mode 8 1
Leak from jointBreak of pipesLeak from
expansion jointOthers 1
Facilities ≤ 75 0 0.2 0100–150 0 26.8 0200–250 0 37.4 0300–450 14 1 15 181.2 0.08500–900 14 9 23 176.8 0.131000 ≤ 5 5 50.4 0.1Total no. 0 28 15 0 0 43 472.8 0.09

426 Disaster Prevention and Mitigation Technologies of Lifelines
20.2.3.2.2 PipelinesIn order to estimate seismic damage to pipelines, one should collect the following data: pipe types, diameters, joint systems, geological features, topographical characteristics, ground conditions, and ground motions likely to occur at the site.
The adequate condition for the seismic assessment can be established based on the following data: damage data of pipe types and diameters, length data of the pipelines, and the soil environmental data that include soft and/or liquefaction-sensitive ground.
FIGURE 20.44 Leakage from expansion joint of 150 mm diameter.
-Legend -Damage locations
DIPSPAdministrative districtWater streamRoad networkRailway
0 5 10 30 40 50 km20
FIGURE 20.45 Damage locations (Miyagi prefecture).

427Water Supply System: Mitigation Technologies
(a) (b)
FIGURE 20.46 Reservoir tank collapse in Ichinoseki city: (a) before collapse (March 18, 2011), (b) after collapse (April 9, 2012).
TABLE 20.7 Mean Damage Rate of Pipelines in the Past Earthquakes
Earthquakes Water Authority Pipelines Damage
No. Pipe Length
(km) Damage Rate
(No./km)
1995 Hyogoken–Nanbu earthquake
Kobe city Aqueduct, transmission, distribution pipelines
1264 4002 0.32
Ashiya city Aqueduct, transmission, distribution pipelines
297 185 1.61
Nishinomiya city Aqueduct, transmission, distribution pipelines
697 966 0.72
2005 Niigata Chuetsu earthquake
Nagaoka city Aqueduct, transmission, distribution pipelines
328 1080 0.30
2007 Noto earthquake Monzen city Aqueduct, transmission, distribution pipelines
56 175 0.32
2007 Niigata Chuetu-oki earthquake
Kashiwazaki city Aqueduct, transmission, distribution pipelines
518 949 0.55
2011 Pacific coast Tohoku earthquake
Sendai city Aqueduct, transmission, distribution main, distribution pipelines
264 3761 0.07
TABLE 20.8 Damage Rate for Various Types of Pipelines
Types
Sendai City Kobe City Ratio
Damage Rate (No.)
Pipe Length (km)
Damage Rate (No./km)
Damage Rate (No./km)
Sendai/Kobe (%)
Ductile cast iron pipe DIP 108 2722.3 0.04 0.49 8Steel pipe SP 9 134.9 0.07 0.47 14Rigid polyvinyl chloride pipe VP 147 881.1 0.17 1.43 12

428 Disaster Prevention and Mitigation Technologies of Lifelines
When a pipe bridge and undercrossing pipes are assessed, one must investigate the original design con-ditions, expansion joint capacity, and pipe support system. For the connection point between the pipeline and accessory equipment (gate valves, hydrants, and air valves), the performance of expansion joints and relative displacement between the pipeline and the valve vault must be taken into consideration.
When an earthquake occurs, electric power might be suspended by direct damage and other interdependent damaged lifelines. Therefore, the capacity of the water supply system is reduced because of the power suspension. Especially, the damage of the electric power can be expanded to a wide-scale disaster that leads to the water supply system damage. When the purification plant or water supply station is stopped due to electric power suspension, the water supply capacity is decreased. It also can damage the management system for the whole water distribution controls as well as the telemeter control system.
In order to prevent accidental and seismic damage of important facilities such as purification plants and water supply stations, back-up power is necessary. For operation of transmission and distribution pipelines, the control managing center must be equipped with an emergency power supply and an unin-terruptable power supply. The restoration period of the water supply system must be predicted taking the seismic damage assessment of the other interdependent lifelines into consideration.
20.2.3.3 examples of Damage estimation
The Tokyo Metropolitan Bureau announced a seismic disaster estimation in May 2006. The report has described the seismic damage due to a significant large-scale near-field earthquake for Metropolitan Tokyo. Table 20.9 shows the scenario earthquake. The procedure of the damage prediction method is given in Figure 20.50 as follows:
PC structure
RC structure
10,000
15,400
200
180
1,0001,500
1,500
1,800
1,000
500
200
200
600
200 10,000
10,14
07,6
50 7,250
12,50
01,3
60
7,500 6,5
001,0
00
Lighting window
t = 200 mm
FIGURE 20.47 Structural profile of reservoir tank in Ichinoseki city.

429Water Supply System: Mitigation Technologies
1. The water suspension rate is evaluated from the damage rate of the distribution pipelines, which is estimated based on the ground motion velocity and the liquefaction hazard map (Tables 20.10 and 20.11).
2. Once the power supply station is damaged and power suspended in wide areas, the water supply at the base facilities is also stopped on a temporary basis. But since the immediate system switching operation is going to be conducted, the electric power supply will be rapidly recovered. Then, the water supply services will also be recovered.
Scenarioearthquake
Seismicassessment
Damageprediction
Select the scenario earthquake(epicenter, magnitude, seismic intensity)
(1) Assessment of existing structures(2) Identify the damaged facilities
Damaged facility (damage level)Functional damage to customers(period of water service stoppage)
FIGURE 20.49 Flow chart of the earthquake damage estimation.
Seismic disaster preventionmeasures
Seismic proofcounter-measure
for facilities
Control of seismicdamage
Seismic strengtheningfor source facility
Seismic strengthening for source facilitySeismic strengthening for structuresSeismic strengthening for mechanical and electrical equipmentsSeismic strengthening for pipelinesSeismic strengthening for pipeline-related facilitiesSeismic strengthening for special pipingSeismic strengthening for service linesSeismic strengthening for in-house service linesSpecial attention for the pipe laying constructionPreparation of backup facilitiesPreparation of block systemPreparation of loop systemRemoval of obstacles for constructionsPreparation of valvesOperation of valvesObtaining of water for fire fightingDisaster prevention measure for slope failureMeasure for water pollution
Identification of damage pointExecution of publicityEmergency measuresExecution of emergent restoration Restoration of block systemsObtaining of man powerPreparation for supportersStandardization of material specificationsObtaining of waterStock of equipmentOrganization of emergent water supplyLocation of standpoint for water supplyMaintenance of distribution networksSeismic storage tankWater supply at sheltersWater delivery to temporal housingWater supply to hospitals
Seismic strengtheningfor pipelines
Seismic strengtheningfor service lines
Seismic strengthening for pipeline construction
Seismic strengthening for pipeline system
Remove the obstaclesValve setting andoperation
Protection forsecondary disaster
Collection and publicity of information
Speedup of emergency restoration
Water supply by conveying at site
Water supply atthe supply station
Water supply ata temporal station
Make use of manpower and preparednessfor supporters
Minimize theseismic affect
Speedup ofrestoration
Preparedness for emergency
water supply
Emergencymeasure
FIGURE 20.48 System of seismic disaster prevention measures.

430 Disaster Prevention and Mitigation Technologies of Lifelines
3. The water damage ratio is estimated by the following formula:
Water damage ratio the next day of the disaster
The pip
( )
. (=
+ ×1
1 0 307 ee damage rate) .−1 17 (20.1)
4. The water damage rate per unit length is given by the following formula:
Damage rate of the water distribution pipelines (locations/km)
No=
.. of the pipe damages
The total distribution pipeline length (20.2)
Distribution pipelinespipe type, length of
each pipeline
Ground motion distribution(surface ground velocity) Standard damage rate
Liquefaction distribution(PL value)
Modification coefficientfor liquefaction
Modification coefficient for pipe type and diameters
Damage rate of distribution pipelines
Rate of water suspension
FIGURE 20.50 Damage estimation flow.
TABLE 20.9 Scenario Earthquakes
Items Scenario Earthquake
Type Tokyo Bay North earthquake
Tama local earthquake(Plate boundary type)
Epicenter Northern part of Tokyo BayMagnitude M6.9 or M7.3Focal depth 30–50 km
TABLE 20.10 Modification Coefficient for Liquefaction Hazard RankingRank of PL value PL = 0 0 < PL ≤ 5 5 < PL ≤ 15 15 < PLCoefficient 1 1.2 1.5 3.0

431Water Supply System: Mitigation Technologies
in which
Damage rate of the water distribution pipelines The standard damag= ee rate
Coefficient of liquefaction hazard
Coefficient of the pip
×
× ee type and diameters
Total length×
(20.3)
The standard damage rate locations/km
Ground s
( )
.= × ×−2 24 10 3 uurface velocity cm/s[ ].
−( )201 51 (20.4)
Figure 20.51 and Table 20.12 are given for the damage rate and the restoration days.
20.2.4 Planning of earthquake Resistance Measures
Construction of future water supply system must comply with the code requirement. The code requires that structures must be immediately recovered with the moderate damage for the predicted maximum ground motion (Level 2) at the site.
For existing structures, the code is not applied until the structure is completely retrofitted. Of course, it is necessary to reinforce these existing structures as soon as possible to keep within the moderate damage for the future earthquakes.
TABLE 20.11 Modification Coefficients for Types and Diameters of Pipes
Types
Diameters (mm)
75 100–200 300–450 500–900 More Than 1000
Restricted ductile cast iron pipe New DCIP 0.00Unrestricted DCIP Old DCIP 0.60 0.30 0.90 0.05Cast iron pipe CIP 1.70 1.20 0.40 1.15Steel pipe SP 0.84 0.42 0.24Rigid polyvinyl chloride pipe VP 1.50 1.20Asbestos pipe AP 6.90 2.70 1.20
Note: Based on the 1995 Hyogoken–Nanbu earthquake.
Water suspension rate (%)
40–30–4020–3010–205–100–5
FIGURE 20.51 Distribution of water suspension rate (north of Tokyo Bay Earthquake M7.3).

432 Disaster Prevention and Mitigation Technologies of Lifelines
The retrofitting work is a long-term project, and water supply should be continued during this project. Therefore, it is important to grasp the seismic performance and to set the priority for the retrofitting procedures.
20.2.4.1 target of Retrofitting Planning
Since the retrofitting project of water supply system needs much money and also takes long time, sys-tematic planning is important. Based on the seismic damage estimation, the target for emergency and restoration works must be clearly set, and systematic action plan should be prepared.
The prediction of seismic damage for water suspension can be predicted as follows:
1. Based on the seismic damage estimation of the water supply facilities, the location and boundary of the water suspension area immediately after the earthquake is determined. From this informa-tion, the population in the area can be predicted.
2. At first, the starting time of the restoration work and restoration speed should be evaluated. The structural damage and pipeline damage points must be collected. Then the population in the water supply suspension area can be estimated.
The emergency and restoration period must be finished in less than 4 weeks, because the people in this area will be seriously affected by a longer water supply suspension. The water bureau company that is responsible for emergency water supply must restore the supply within 1 week.
20.2.4.2 Selection of Seismic Resistance Methods
In order to minimize seismic damage and the duration of the restoration work back-up facilities should be furnished.
Based on the seismic assessment of the facilities, sufficient measures for the improvement and replacement of facilities should be applied based on the design requirements and retrofitting guidelines as follows:
1. Strengthen the back-up system for the water supply areas through the connecting pipelines to neighboring water suppliers
2. Strengthen mutual aid between purification plants or between the reservoirs in the water distri-bution mains
3. Adopt the loop system in the water transmission system or distribution main system 4. Develop the network redundancy by parallel pipelines, setting a bypass pipeline, increased capac-
ity of storage tanks, and multiple loops 5. Prepare the stoppage areas of the water network system when the water distribution area is very
wide and is surrounded by various elevation gaps in the water supply area
20.2.4.3 Disaster Prevention Planning
In disaster prevention planning, the priority of seismic retrofitting methods must be taken into consid-eration in the following way:
TABLE 20.12 Water Suspension Rate and Restoration Period
Earthquake Magnitude (M) Suspension
Rate
Trend of Suspension Rate Restoration
Period (Days) 1 Day 4 Days 1 Week 1 Month
Northern part of Tokyo Bay
6.9 24.5 24.5 5.0 3.9 0.0 217.3 34.8 34.8 7.0 5.7 0.0 30
Tama local earthquake
6.9 17.7 17.7 3.5 1.8 0.0 117.3 29.1 29.1 5.8 4.1 0.0 16

433Water Supply System: Mitigation Technologies
20.2.4.3.1 Local CharacteristicsThe seismic retrofitting method should be selected from the most effective methods that are appropriate to the ground condition, geological condition, and site development condition.
20.2.4.3.2 Priority of the Seismic Resisting MethodsA high priority should be placed on the following facilities:
1. Important facilities for temporary evaluation shelters or rescue operations 2. Water supply facilities supplying hospitals and social welfare houses 3. Seismically vulnerable facilities or old facilities 4. Important facility to produce affective damage to the vital function of the local area 5. Important facilities that are effective to maintaining urban serviceability and to carry out rapid
restoration 6. Facilities that will be difficult to restore
Based on earlier-mentioned points, multiple plans for seismic loss reduction should be prepared, in which the target objectives and financial aspects must be discussed.
20.3 Seismic Disaster Preventive Measures for Pipelines (Reinforcement of existing Facilities)
In general, a concrete structure can be retrofitted by reinforcement. But retrofitting pipelines is typically best accomplished by replacing old pipes to seismically strong pipes, so seismically vulnerable pipelines should preferably be replaced.
20.3.1 Seismic Performance of the Pipeline and its Related equipment for Seismic Levels
Tables 20.13 through 20.17 provide guidance for seismic disaster reduction methods for pipelines.
20.3.2 Planning of Pipeline configurations
Emergency restoration works and rapid water supplies are expected in seismic disaster prevention planning.
20.3.2.1 Route Plan
It is preferable to locate the pipeline route along good ground conditions. However, if the pipeline will be installed at a special site that is predicted to have a large ground displacement, seismically strong pipe and joints should be used.
20.3.2.2 Selection of Pipelines for Reinforcement
In order to make a rapid recovery of the whole water supply system, priority for the reinforcement of pipelines should be placed on transmission pipelines and distribution main lines. Disaster shelters, hos-pitals, and emergency water supply stations should be preferentially reinforced.
Old pipes such as cast iron pipes, rigid VPs, asbestos pipes, and concrete pipes are seismically vulner-able, so these pipes should be replaced as soon as possible.
20.3.2.3 improvement of the Reliability of the Water network System
Each pipeline should be reinforced, whereas the whole water supply system must be improved using several methods such as affordable networking by multiple lines and/or looping, improving the back-up system by mutual connection to the neighboring water suppliers, and minimizing the damaged area by blocking the existing network system. The detail is described in the following way:

434 Disaster Prevention and Mitigation Technologies of Lifelines
TABLE 20.13 Seismic Adaptability of Ductile Cast Iron Pipes
Pipe Type Joint Type
Adaptability for Distribution Pipelines Adaptability for Main Pipelines
For Level 1 Ground Motion
For Level 1 Ground Motion
For Level 2 Ground Motion
DCIP NS O O OK O O $A O # x
CIP x x x
Notes: O, Adaptive; x, not adaptive; #, partially adaptive; $, K-type joint was damaged in reclamation area, but was not damaged in hard soil ground in the 1995 Hyogoken–Nanbu earthquake. It might be concluded that this type of joint has a seismic capacity for Level 2 ground motion in a hard soil ground.
TABLE 20.14 Seismic Adaptability for Steel Pipes
Pipe Type Joint Type
Adaptability for Distribution Pipelines Adaptability for Main Pipelines
For Level 1 Ground Motion
For Level 1 Ground Motion
For Level 2 Ground Motion
Steel Welded O O O
Notes: O, Adaptive: can be used.
TABLE 20.15 Seismic Adaptability of Polyethylene Pipes
Pipe Type Joint Type
Adaptability for Distribution Pipelines Adaptability for Main Pipelines
For Level 1 Ground Motion
For Level 1 Ground Motion
For Level 2 Ground Motion
Polyethylene Fusion jointing, $
O O &
Polyethylene double coating pipe
Cold jointing O # x
Notes: O, Adaptive: can be used; x, not adaptive: must not be used; #, partially adaptive: cannot be rejected to use for level 1 ground motion; $, can be used only for K-type joint, which is installed in a hard soil.
TABLE 20.16 Seismic Adaptability of Rigid Polyvinyl Chloride Pipes
Pipe Type Joint Type
Adaptability for Distribution Pipelines Adaptability for Main Pipelines
For Level 1 Ground Motion
For Level 1 Ground Motion
For Level 2 Ground Motion
Rigid polyvinyl chloride pipe
RR long joint (a) O (b)RR joint O # xTS joint x x x
Notes: (a) RR long joint is estimated to have higher seismic capacity than that of RR joint. But there are not enough data of RR long joint in actual earthquake damage observations; (b) there are not any obser-vation data on the damage of RR long joint used in the main pipelines under Level 2 ground motion. More data are necessary to obtain a rational evaluation on this joint O, Adaptive: can be used; x, not adap-tive: must not be used; #, partially adaptive: cannot be rejected to use for level 1 ground motion.

435Water Supply System: Mitigation Technologies
20.3.2.3.1 Multiple LinesEven if one line is damaged, other lines can maintain the water supply by immediately changing the supply route. The detailed procedures are as follows:
1. Prepare two lines, each of which can supply the designated demand flow. 2. Prepare two lines, each of which can supply half of the designated demand flow. 3. Prepare a main line and an auxiliary line, in which the main line can supply the designated
demand flow and the auxiliary line can supply the minimum requirement of the flow in an emer-gency situation. Figure 20.52 is a schematic illustration of multiple lines.
20.3.2.3.2 Loop SystemImportant pipelines such as transmission pipelines and distribution mains should be looped, and con-trol valves should be installed at reservoir points for the distribution networks. If one portion of the main pipelines is damaged, the other route can still supply water in the looped system. Figure 20.53 is a schematic illustration of a looped system.
20.3.2.3.3 Mutual ConnectionMutual connection is carried out by connecting a pipeline to the neighboring water suppliers. When an accident or seismic disaster affects the water system, the water supply can be maintained through the mutual pipelines. Figure 20.54 is a schematic illustration of a mutual connection.
Main Q
Q¢< Q(c)
Backup pipeline Q¢
(b)
Multiplexing of main pipe
21 Q
21 Q
Main Q
(a)
Backup pipeline Q
FIGURE 20.52 Concept of multiplexing for water network (Q: design flow). (a) Backup pipe has 100% capacity Q, (b) main and backup pipe each have 50% capacity Q, and (c) backup pipe has capacity Qʹ < Q.
TABLE 20.17 Seismic Adaptability for Asbestos Pipes
Pipe Type
Adaptability for Distribution Pipelines Adaptability for Main Pipelines
For Level 1 Ground Motion
For Level 1 Ground Motion
For Level 2 Ground Motion
Asbestos x x x
Note: x, not adaptive.

436 Disaster Prevention and Mitigation Technologies of Lifelines
20.3.2.3.4 Division of Several Blocks for the Network SystemBlocking is when the water distribution network is subdivided into smaller networks in order to prevent water suspension from affecting the whole network. The blocking procedures are as follows:
1. The water distribution network is divided into subnetworks from the hydraulic and geotechnical conditions. Each subnetwork is connected to the distribution mains as shown in Figure 20.55.
2. Each subnetwork has many gate valves to control the water flow, to minimize the affected area of water suspension.
20.3.3 Seismic Reinforcement Methods
Table 20.18 shows examples of seismic reinforcing methods for various facilities such as aqueducts, tun-nels, buried pipelines, riser towers, shield tunnels, and water bridges.
Reservoir tank
Service station A
Loop pipe
Service station B
FIGURE 20.53 Concept of looped network.
Purification plant Purification plant
Interconnectionpipeline
Reservoir Reservoir
Distributionnetwork
Distribution network
FIGURE 20.54 Concept of mutual interconnection.

437Water Supply System: Mitigation Technologies
TABLE 20.18 Examples of Seismic Disaster Prevention Methods
Structures Parts Seismic Reinforcing Method Remarks
Tunnel Body 1. Additional concrete 1. For increasing the seismic capacity2. Lining of carbon fiber 2. To protect leakage3. Reduced cross section in the original duct
Joint 1. Concrete lining 1. To protect leakage2. Replacing by an expansion joint 2. To add flexibility
Basement 1. Installing a cast-in site diaphragm wall or steel sheet piles near the structure
1. To increase the ground resisting capacity
2. Ground improvement 2. For liquefaction hazardBuried pipelines 1. Install expansion joints, if necessary 1. To protect the relative
displacement2. Replacing the original pipelines to the new
location (including small pipe installing method)2. To increase the seismic capacity
3. Replacing the backfilling materials and ground improvement
3. For liquefaction hazard
Riser Body 1. Additional concrete for lining 1. To increase the seismic capacity2. Setting bracing members
Underground Ground improvement 2. Increase the foundation supporting force
Joint 1. Setting an expansion joint 3. To protect the relative displacement
2. Reinforcing the existing jointsShield segment 1. Setting expansion joints at the connection of
the building1. To protect the relative
displacement2. Reinforcing the existing joints 2. To increase the resisting strength3. Ground improvement of required portion 3. For liquefaction hazard
Water bridge
Above ground
1. Change the supporting device to the rubber one 1. To diverse the stresses2. Change to isolated laminated rubber bearing3. Setting a prevention device for bridge falling4. Replacing the expansion joint
Abutment, piers
1. Additional reinforcing with concrete 2. To increase the axial force2. Additional reinforcing with steel plate 3. To increase the ductility3. Additional reinforcing with carbon fiber
Foundation Similar method used for the intake tower
B2
B3
B1
(b)(a)
Water service source A
Connection to neighboring systems B1
Large block A1 A2 A3
B1Interconnectedpipe
FIGURE 20.55 Concept of block system: (a) large block interconnected with other large blocks, (b) interconnected with small blocks.

438 Disaster Prevention and Mitigation Technologies of Lifelines
References
1. JWWA. Investigation report on seismic damage of water supply systems in 2011 East Japan Great Earthquake, JWWA, 2011 (in Japanese).
2. Ministry of Health, Labor and Welfare. Report on seismic disaster prevention methods of pipelines, 2007 (in Japanese).

439
21.1 case Histories of earthquake-induced Damage to Sewer Facilities and their Rehabilitation Works
In this section, case histories of earthquake-induced damage to sewer facilities, in particular sewer pipes that were affected by liquefaction of the backfill soils, and their rehabilitation works are described on the following earthquakes in Japan:
1993 Kushiro-Oki earthquake1994 Hokkaido-Toho-Oki earthquake1994 Sanriku-Haruka-Oki earthquake2003 Tokachi-Oki earthquake2004 Niigataken-Chuetsu earthquake2007 Niigataken-Chuetsu-Oki earthquake2011 off the Pacific Coast of Tohoku earthquake
The other past major earthquakes in Japan that induced damage to sewer pipes, include the following ones on which detailed descriptions are given elsewhere [1–7].
1923 Kanto earthquake1964 Niigata earthquake
21Sewerage System:
Mitigation Technologies
21.1 Case Histories of Earthquake-Induced Damage to Sewer Facilities and Their Rehabilitation Works ....................................4391993 Kushiro-Oki Earthquake • 1994 Hokkaido-Toho-Oki Earthquake • 1994 Sanriku-Haruka-Oki Earthquake • 2003 Tokachi-Oki Earthquake • 2004 Niigataken-Chuetsu Earthquake • 2007 Niigataken-Chuetsu-Oki Earthquake • 2011 off the Pacific Coast of Tohoku Earthquake • Summary of Lessons Learned from Earthquake-Induced Damage to Sewer Facilities and Their Rehabilitation Policies
21.2 Aseismic Measures for Sewer Pipes ...............................................462Fundamental Policies of Aseismic Measures for Sewer Facilities • Seismic Design of Sewer Pipes
21.3 Relevant Researches on Seismic Behavior of Sewer Pipes ......... 468Behavior of Sewer Pipes and Their Surrounding Ground in Model Shaking Tests • Effects of Countermeasures against Liquefaction on Sewer Pipes • Effects of Countermeasures against Liquefaction on Sewer Manholes • Summary of Lessons Learned from Model Tests
References ......................................................................................................482
Junichi KosekiUniversity of Tokyo
Reiko KuwanoUniversity of Tokyo

440 Disaster Prevention and Mitigation Technologies of Lifelines
1978 Miyagi-Ken-Oki earthquake1983 Nihonkai-Chubu earthquake1993 Hokkaido-Nansei-Oki earthquake1995 Hyogoken-Nanbu earthquake2007 Noto-Hanto earthquake
Among others, it should be noted that, in the 1995 Hyogoken-Nanbu earthquake, failure of pipes and damage to their connections were caused by residual deformation of the surrounding ground; a second-ary lining of a shield tunnel suffered from longitudinal cracking due to excessive response displacement; and even a large-diameter concrete pipe was damaged by the lateral spreading of liquefied ground.
21.1.1 1993 Kushiro-oki earthquake
The January 15, 1993, Kushiro-Oki earthquake induced damage to sewer pipes in Kushiro city, Kushiro town, Shibetya town, Shibetsu town, and Bekkai town, Hokkaido, Japan, and the total length of the damaged pipes was about 22 km [1]. In Kushiro city, for example, sewer pipes for a total length of about 8 km were damaged out of a total length of about 947 km [8]. In Kushiro town, sewer pipes for a total length of about 11 km were damaged out of a total length of about 84 km [9].
Herein, some features of damage to sewer pipes observed in Kushiro city [8] and an outline of the survey results on the sewer manholes and pipes that uplifted largely in Kushiro town [9] are introduced.
21.1.1.1 Damage to Sewer Pipes in Kushiro city
Figure 21.1 shows an estimated ground profile with the location of damaged sewer pipes at Musa 4-chome, Kushiro city [8]. As shown by shaded notation in the figure, the pipes constructed by the jacking method in an original soil consisting of peat (or organic soft soil) were not damaged, while those constructed by the cut-and-cover method suffered from uplift damage. Based on boring survey
14 mL = 25 m
Estimated ground water level
F
Ap
Asf
Am2
Am1
Am1
: Precast-concrete pipe by open-cut method(φ 250 mm with gravel mat, t = 100 mm)
: Precast-concrete pipe by jacking method
SK-TN(soft rocks)
No. H5-17SPT N-value
No. H5-11SPT N-value
No. 15-113SPT N-value
Elevation(m) No. 15-365 SPT N-value 0 20 40 0 20 40
0
–5
–10
–15
42 m 43 m 38 m
0 20 40 0 20 40
FIGURE 21.1 Estimated ground profile at Musa 4-chome, Kushiro city, and location of sewer pipes damaged by the 1993 Kushiro-Oki earthquake. (From Koseki, J. et al., Soils Found., 40(1), 99, 2000.)

441Sewerage System: Mitigation Technologies
conducted at site No. H5-11 along the latter sections constructed by the cut-and-cover method, it is verified that the backfill soil consisted of loose fine sand layers with mean diameter d50 of 0.18 mm, fines content Fc of 10%, and gravel content of 2%, exhibiting SPT N values of 3–4. It is therefore inferred that the backfill of sewer pipes consisted of saturated sandy soils liquefied by the earthquake motion and induced the uplift damage to the pipes.
Figure 21.2 shows an estimated ground profile with the location of damaged sewer pipes at Mihara 2-chome, Kushiro city. The pipes were constructed by the cut-and-cover method, and preloading had been applied to the original soil consisting of peat layers. By the earthquake motion, the pipes that were buried at shallower elevations as shown on the right-hand side of the figure were not damaged, while those that were buried at deeper elevations as shown on the left-hand side of the figure suffered from uplift damage. Such different performance was possibly caused by the different thicknesses of liquefiable layers (i.e., saturated sandy soil layers below the ground water table) in the backfill. When the pipe was buried at deeper elevation below the ground water table (or when the ground water table was located at higher elevation), the thickness of the liquefiable layers in the backfill increased, causing more exten-sively the uplift damage to the pipe.
Figure 21.3 shows an estimated ground profile with the location of damaged sewer pipes at Midorigaoka 6-chome, Kushiro city. The pipes were constructed by the cut-and-cover method at a boundary between a hilly region and a lowland region, where the hilly region had been developed into a residential area by cutting the hills and filling the valleys. It can be seen from the figure that only the pipes at the embank-ment sections were damaged, while those at the cut sections were not. Such different performance was possibly caused by different degrees of the earthquake motion amplification, by which the embankment sections with relatively lower stiffness were shaken more severely than the cut sections with higher stiff-ness, inducing liquefaction of the backfill only in the embankment sections.
21.1.1.2 Sewer Manholes and Pipes that Uplifted Largely in Kushiro town
In Kushiro town, as shown in Photo 21.1, sewer manholes that had been constructed along the national highway route No. 44 suffered from uplift damage [9]. The maximum uplift displacement amounted to 150 cm. After the earthquake, boring surveys, open-cut investigation during the reconstruction works, and laboratory tests on in situ retrieved samples were conducted and revealed the following aspects:
1. The typical sewer manhole uplifted nearly vertically, without suffering any structural dam-age. The soils that were retrieved at the location immediately below the bottom of the uplifted manholes were similar to those that had been employed for the backfilling works. Most of the lattice foundations of the uplifted manholes were found in the intact position. The sewer pipes
Elevation No. S51-4SPT N-value
SPT N-valueSPT N-value SPT N-valueNo. H5-9No. H5-1
No. H5-1(backfill soil) (m)
5
0
B
Gravel mat(t = 100 mm)
1.1 mPrecast-concrete pipe
(φ = 250 mm)+
–5
Ap
F0 4020
0 4020 0 4020 0 4020
Asf
Ag
L = 29 m L = 40 m
Ap
F
Asf
Ag
Estimated ground water levelNo. S51-3
FIGURE 21.2 Estimated ground profile at Mihara 2-chome, Kushiro city, and location of sewer pipes damaged by the 1993 Kushiro-Oki earthquake. (From Koseki, J. et al., Soils Found., 40(1), 99, 2000.)

442 Disaster Prevention and Mitigation Technologies of Lifelines
that were connected to the uplifted manholes also suffered from uplift damage. Even with the manholes that were not subjected to uplift damage, some of the pipes in between them suffered from uplift damage.
2. The original soil layers consisted of a filled soil near the surface, a peat soil, and a sandy soil. Most of the manhole bottoms were at the elevation of the original sandy soil layer.
(m)25
20
15
10
5 No.15-116 No.15-179 No.15-175
No.15-181
No. 15-129*
No.15-10*SPT N-valueSPT N-value4040
2020
00
Wave-like extensivedeformation
of road surface
F
Slope failure
Crack on road surface
F*: Boring survey results transferredfrom adjacent sites for reference
Horizontal residual displacementof pipes exceeding 1.3 m caused
by slope failure
Crack onroad surface
4 m
Dg 2 m
4 m6 m
DcDs2
Dg
SPT N-value SPT N-valueSPT N-value
SPT N-value
0Am1
ApF0 20 40
0 20 400 20 40
0 20 40
–5
–10
–15Type A Type AType B
Precast-concrete pipe (φ = 250 mm)
SK ~ TN (soft rocks)
x: Breakage of pipesy: Cracking of pipesz: Opening of jointsII: Separation of jointsEstimated ground water levelBending
of pipes
Bendingof pipes
Am2
Polyvinyl chloride pipe (φ=200 mm)
Type A: wooden ladder foundationType B,B¢: sand mat (t = 100 mm)i: longitudinal inclination of pipes
Type B¢65 m88 m58 m
i = 0.61% 0.49% 5.57% –6.80% 14.85% –15.15%L = 6 m
Elevation
6 m
FIGURE 21.3 Estimated ground profile at Midorigaoka 6-chome, Kushiro city, and location of sewer pipes dam-aged by the 1993 Kushiro-Oki earthquake. (From Koseki, J. et al., Soils Found., 40(1), 99, 2000.)
PHOTO 21.1 Uplifted sewer manhole in Kushiro town caused by the 1993 Kushiro-Oki earthquake. (From Koseki, J. et al., Soils Found., 40(1), 99, 2000.)

443Sewerage System: Mitigation Technologies
For backfilling of the manholes, a sandy soil with limited amounts of fines had been employed. After the earthquake, no disturbance could be found at the interface between the backfill and the original soils, and no direct evidence of liquefaction, such as the traces of sand boiling, could be observed, either.
3. The resistance of the backfill soil against liquefaction was lower than that of the original sandy soil. When the horizontal seismic coefficient exceeded 0.25, the safety factors against uplift of the manhole, which were evaluated based on the liquefaction resistance of the original soil, became less than one. The computed uplift displacements, which were evaluated under the condition that the manhole would uplift when the safety factor is less than one, were equal to or larger than the observed uplift displacements.
The aforementioned aspects suggest that, as schematically illustrated in Figures 21.4 and 21.5, there could be two types of damage mechanisms that would induce uplift of manholes. The mechanism shown in Figure 21.4 corresponds to the case with liquefiable backfill, in which a part of the liquefied backfill would move toward the bottom of the manhole and the connecting pipes, and thus push them up. The mechanism shown in Figure 21.5, on the other hand, corresponds to the case with both the liquefiable backfill and the liquefiable original soil, in which the liquefied backfill would be squeezed by the lique-fied original soil, inducing additional mode of residual deformation. As a consequence of these different types of failure modes, only the backfill would exhibit residual settlement due to liquefaction in the former case (Figure 21.4), while both of the backfill and the original soil would undergo residual settle-ment in the latter case (Figure 21.5).
Uplift of manhole
Back
fill
Lattice foundation
Orig
inal
soil
Settlement of backfill
Deformation of liquefied backfilltoward bottom of manhole
FIGURE 21.4 Uplift of sewer manhole caused by liquefaction of backfill. (From Koseki, J. et al., Soils Found., 37(1), 109, 1997.)
Uplift of manhole
Lattice foundation
Orig
inal
soil
Back
fill
Deformation of liquefied original soilcausing squeezing of backfill
Deformation of liquefied backfilltoward bottom of manhole
Settlement of backfilland original soil
FIGURE 21.5 Uplift of sewer manhole caused by liquefaction of backfill and original soil layer. (From Koseki, J. et al., Soils Found., 37(1), 109, 1997.)

444 Disaster Prevention and Mitigation Technologies of Lifelines
The uplift damage to manholes in Kushiro town may have been caused predominantly by the lique-faction of the backfill. In addition, different conditions of the original soil layers, as listed in the follow-ing, may have affected the extent of the damage.
1. The manholes that underwent extensive uplift were constructed in original soil layers that included a clean sand layer having fines content <20% and with a thickness larger than 1 m at the elevation of the manhole bottom.
2. When the total thickness of the less permeable original soil layers consisting of peat and silt that were underlain by the clean sand layer became larger than 1 m, the uplift displacement of the manhole was enlarged accordingly.
21.1.2 1994 Hokkaido-toho-oki earthquake
The October 4, 1994, Hokkaido-Toho-Oki earthquake induced damage to sewer pipes in Kushiro city, Nemuro city, Kushiro town, Nakashibetsu town, Shibetsu town, Bekkai town, Shari town, and Akan town, Hokkaido, Japan. In Shibetsu city, sewer pipes for a total length of about 11 km were damaged among those that had been constructed at the time of the earthquake for a total length of about 19 km [10]. In Kushiro city, based on full survey on all of the manholes, the total damage length of sewer pipes was reported to be about 8 km [8], which may include past damage that had been already induced by the 1993 Kushiro-Oki earthquake. After this earlier earthquake, due to time limitation, not all of the manholes could be surveyed to detect even minor damage. Consequently, statistical analyses of the seismic per-formance of sewer pipes in Kushiro city were made on the damage induced by the two earthquakes. The results from the analyses have been reported elsewhere [8].
Herein, some features of damage to sewer pipes observed in Shibetsu town [10], are introduced.
1. A hard-PVC pipe was mainly used as the sewer pipes. In particular, small pipes having a diameter in the range of 200–250 mm suffered several types of damage, which include uplift, bending, gap opening, and breakage of connection. The maximum uplift displacement of the pipes was 150 cm, while the uplift displacement of manholes was in general smaller than that of pipes.
2. More frequent damage to sewer pipes was observed in back-marsh regions. As shown in Figure 21.6, the damaged pipes had been constructed in original soils consisting of peat layer, Holocene clay layer, or Holocene sand layer. On the other hand, the undamaged pipes had been constructed in original soils consisting mainly of coastal sandy gravel layer.
3. As shown in Figure 21.7, a linear relationship could be found between the thickness of liquefiable backfill soil and the maximum uplift displacement of pipes. In addition, the following conditions of the original soil seem to have affected the extent of the damage; a correlation between the thick-ness of liquefiable soil layers in the original soil below the pipe elevation and the maximum uplift displacement of pipes was observed, as shown in Figure 21.8; and another correlation between the thickness of less permeable soil layers in the original soil above the pipe elevation and the maxi-mum uplift displacement of pipes was also observed, as shown in Figure 21.9. Regarding the latter condition of the original soil, with the less permeable original soil layers having larger thickness, the excess pore pressured generated in the liquefiable backfill soil dissipated more slowly, and thus the extent of liquefaction became higher.
The aforementioned features suggest that the uplift damage to sewer pipes in Shibetsu town was pre-dominantly caused by the liquefaction of backfill, while the existence of liquefiable or less permeable layers in the original soil accelerated the damage.
It should be noted that the pipes damaged by the 1993 Kushiro-Oki earthquake were reconstructed using the same methods and backfill materials as had been employed to construct

445Sewerage System: Mitigation Technologies
them originally, while most of them were again damaged by the 1994 Hokkaido-Toho-Oki earth-quake. In reconstructing the pipes damaged by the latter earthquake, therefore, a countermeasure against liquefaction was adopted by using gravelly (i.e., highly permeable or less liquefiable) soils for the backfilling works and compacting them extensively to a degree of compaction equal to or exceeding 90%.
100: Damaged 100 sections
Clayeysoil
: Undamaged 49 sections
Peat
Type of original soil at the pipe depth
Sandysoil
Gravellysoil
80
60
40
Rela
tive r
atio
(%)
20
0
FIGURE 21.6 Effects of original soil type on damage to sewer pipes in Shibetsu town caused by the 1994 Hokkaido-Toho-Oki earthquake. (From Public Works Research Institute, Survey of damage to sewer pipe systems induced by the 1994 Hokkaido-Toho-Oki earthquake, Technical Note of PWRI, No. 3628, 58pp, 2000 [in Japanese].)
2.0
H5
1.5
1.0
0.5
0.0
Upl
ift o
f pip
e, H
5 (m
)
–1 0 1Pipe depth belowground water table
(= thickness of liquefiable backfill), H4 (m)
2 3 4 5 6 7
: Clayey soil: Sandy soil: Peat: Gravelly soil
Type of original ground at the pipe depth
H4
FIGURE 21.7 Effects of liquefiable backfill thickness on uplift damage to sewer pipes in Shibetsu town caused by the 1994 Hokkaido-Toho-Oki earthquake. (From Public Works Research Institute, Survey of damage to sewer pipe systems induced by the 1994 Hokkaido-Toho-Oki earthquake, Technical Note of PWRI, No. 3628, 58pp, 2000 [in Japanese].)

446 Disaster Prevention and Mitigation Technologies of Lifelines
21.1.3 1994 Sanriku-Haruka-oki earthquake
The December 28, 1994, Sanriku-Haruka-Oki earthquake induced damage to sewer pipes in Hachinohe city, Towada city and the vicinity of Towada Lake, Aomori prefecture, Japan [11].
Among them, Towada city suffered from damage to sewer pipes for a total length of about 1.5 km [11], which consisted of a variety of pipe types including PVC, concrete, and pottery pipes. In addition, most of them had been backfilled by gravelly sands, which are in general considered as less liquefiable soils, while they underwent uplift damage.
2.0
1.5
1.0
0.5
0.0
Upl
ift o
f pip
e, H
5 (m
)
0 1�ickness of lique�able original soil
below pipe, H2 (m)
2 3 4 5
H2Sandy soil (original)
H5
Type of original ground at the pipe depth
: Clayey soil
: Peat: Gravelly soil
: Sandy soil
FIGURE 21.8 Effects of liquefiable original soil thickness on uplift damage to sewer pipes in Shibetsu town caused by the 1994 Hokkaido-Toho-Oki earthquake. (From Public Works Research Institute, Survey of damage to sewer pipe systems induced by the 1994 Hokkaido-Toho-Oki earthquake, Technical Note of PWRI, No. 3628, 58pp, 2000 [in Japanese].)
2.0
1.5
1.0
0.5
0.0
Upl
ift o
f pip
e, H
5 (m
)
0.0 0.5Thickness of less-permeable original soilsin-between pipe and water table, H7 (m)
1.0 1.5 2.0 3.02.5
H7
Peat (or clay)
Clay (or peat)
H5
Type of original ground at the pipe depth
: Peat
: Clayey soil: Sandy soil
: Gravelly soil
FIGURE 21.9 Effects of less permeable original soil thickness on uplift damage to sewer pipes in Shibetsu town caused by the 1994 Hokkaido-Toho-Oki earthquake. (From Public Works Research Institute, Survey of damage to sewer pipe systems induced by the 1994 Hokkaido-Toho-Oki earthquake, Technical Note of PWRI, No. 3628, 58pp, 2000 [in Japanese].)

447Sewerage System: Mitigation Technologies
Figure 21.10 shows standard cross sections of the sewer pipe installation in Towada city. As the back-fill material, a sandy gravel with a mean diameter of 4.5 mm, fines content of 4%, and gravel content of 70%, was employed, since it was available at relatively lower cost. In addition, in order to protect the pipes from any possible damage during the compaction works of the backfill, a sandy soil with a mean diameter of 0.7–1.2 mm, fines content of 5%, and gravel content of 15%–40% was also employed as a cushion layer around the pipe. The original soil consists of a surface soil layer, which is underlain by a volcanic ash-origin organic soil called Kuroboku, a Holocene sandy soil, and a Pleistocene volcanic ash-origin soil.
After the earthquake, a survey of the residual displacement of sewer pipes in both vertical and hori-zontal directions was made, as typically shown in Figure 21.11. The PVC pipes having a relatively small value of apparent unit weight suffered from uplift damage, amounting up to 80 cm at largest, and even the concrete and pottery pipes having relatively large apparent unit weights suffered from uplift damage as well, amounting up to 50 cm at largest. With all the pipe types, the uplifted pipe location could reach the upper backfill soil layer consisting of the sandy gravel. As shown in Photo 21.2, the surface of the backfill soil subsided by about 30 cm at largest, while no disturbance of the surrounding original soil could be observed.
Based on the earlier observations, it can be inferred that only the backfill soil underwent exten-sive liquefaction, which induced the uplift damage to the sewer pipes. In particular, though the upper backfill soil layer was sandy gravel, it liquefied due possibly to its low density and small permeability. The latter condition can be attributed to its higher contents of sand and fines as compared to those of more uniform gravelly soils. In addition, the impermeable sheet that had been installed at the interface between the backfill and the original soil to prevent the outflow of backfill soil seems to have increased
(unit: mm)
G
S
740 ~ 910
(width of excavation)
Type A
300
150
G
G
S
S740 ~ 910
450890
Type B
Type C
Ladderfoundation
Crushed stone(Dmax = 40 mm)
300
300
150
G: gravelly sand as upper backfillS: sand as lower backfill
Crushed stone (Dmax = 40 mm)
Impermeable sheet to preventoutflow of backfill soil
FIGURE 21.10 Standard cross sections of sewer pipes in Towada city affected by the 1994 Sanriku-Haruka-Oki earthquake. (From Koseki, J. et al., Soils Found., 40(1), 99, 2000.)

448 Disaster Prevention and Mitigation Technologies of Lifelines
PHOTO 21.2 Settlement of sewer pipe backfill in Towada city caused by the 1994 Sanriku-Haruka-Oki earth-quake. (From Koseki, J. et al., Soils Found., 40(1), 99, 2000.)
65.1Site no. 11,RC
(φ300 mm)65.0
64.9
64.8
64.7 Upperbackfillsandygravel
Lowerbackfillsand
64.6
64.5
64.4
64.3
64.2
Elev
atio
n of
pip
es (m
)
0.2
0.1
0.0
–0.1
–0.2
Longitudinal distance (m)0 10 20
Longitudinal distance (m)0 10 20
: Before earthquake
Hor
izon
tal a
lignm
ent
of p
ipes
(m)
: After earthquake
: Before earthquake: After earthquake
FIGURE 21.11 Residual displacement of sewer pipe in Towada city measured after the 1994 Sanriku-Haruka-Oki earthquake. (From Koseki, J. et al., Soils Found., 40(1), 99, 2000.)

449Sewerage System: Mitigation Technologies
the extent of its liquefaction during the earthquake, in such a manner as has been discussed previously in Section 21.1.2 on the effects of less permeable layers in the original soil.
21.1.4 2003 tokachi-oki earthquake
The September 26, 2003, Tokachi-Oki earthquake induced damage to sewer pipes in Kushiro city, Kushiro town, Atsukeshi town, Hamanaka town, Akan town, Onbetsu town, Shibetya town, Toyokoro town, Urahoro town, Ikeda town, Niikappu town, and Urakawa town, Hokkaido, Japan [12]. In addi-tion, the backfill soil of sewer pipes in Ukawa town suffered from residual settlement, which amounted up to 50 cm at largest, which consisted of upper gravelly soil layer and lower sandy soil layer [12], as was the case with those of Towada city as mentioned before.
In Toyokoro town, for example, sewer pipes for a total length of about 8 km were damaged among those that had been constructed at the time of the earthquake for a total length of about 29 km, where the damage concentrated into regions with the original soils consisting of either a peat layer or alterna-tive layers of silt and sand [13].
Photo 21.3 shows a sewer manhole that was subjected to uplift damage. This manhole, which had been constructed by the cut-and-cover method with an excavation depth of about 5 m, uplifted by about 100 cm, while the backfill soil subsided by about 50 cm at its surface. At adjacent sections where the excavation depth was about 3 m, on the other hand, the extent of damage in terms of uplift displace-ment of the manhole and the settlement of the backfill soil was reduced, as typically shown in Photo 21.4. In addition, when the excavation depth became smaller than about 2 m, no damage was induced. These different performances are consistent with the observation made in Section 21.1.2 on the effects of the thickness of the liquefiable backfill soil. It should be noted that, as was the case with case histories described in Section 21.1.3, a gravelly soil (with a maximum diameter of 120 mm) and a sandy soil had been employed as the upper and lower backfill soil layers, respectively, both of which seem to have lique-fied by the earthquake load.
In Onbetsu town, sewer pipes for a total length of about 4 km were damaged among those that had been constructed at the time of the earthquake for a total length of about 16 km [13]. At one site, the backfilling works had been executed by using a light-weight soil (with a unit weight of about 11 kN/m3) consisting of a mixture of an in situ excavated silty soil, an expanded polystyrene bead, and a cement to reduce the consolidation settlement of the original soil consisting of a peat, where no damage to the sewer manholes and pipes was induced, as shown in Photo 21.5. On the other hand, the adjacent
PHOTO 21.3 Uplift of sewer manhole and settlement of its backfill with excavation depth of about 5 m in Toyokoro town caused by the 2003 Tokachi-Oki earthquake.

450 Disaster Prevention and Mitigation Technologies of Lifelines
site where the backfilling works were made by using an ordinary sandy soil suffered from extensive uplift of sewer manholes, as shown in Photo 21.6. The former backfill material was effective in prevent-ing the liquefaction-induced damage to sewer manholes and pipes.
In contrast to the previous policy by which the damaged manholes and pipes had been reconstructed into the original conditions at the time of the initial construction, countermeasures against liquefaction of the backfill soil were adopted in the reconstruction work of this damage. Instead of using an ordinary sandy soil as the backfill, the excavated soil and the borrowed soil that were treated by mixing cement by 5% in weight were employed as the backfill [13].
21.1.5 2004 niigataken-chuetsu earthquake
The October 23, 2004, Niigataken-Chuetsu earthquake induced damage to sewer manholes and pipes in a wide region that covers 6 cities, 12 towns, and 3 villages in Niigata prefecture, Japan. In total, pipes for a
PHOTO 21.4 Settlement of sewer pipe backfill with excavation depth of about 3 m in Toyokoro town caused by the 2003 Tokachi-Oki earthquake.
PHOTO 21.5 No damage to sewer manhole and its backfill treated with expanded polystyrene bead and cement in Onbetsu town.

451Sewerage System: Mitigation Technologies
length of about 152 km and 2719 manholes were damaged [14]. In Nagaoka and Ojiya cities, for example, sewer pipes were damaged for a total length of about 63 and 31 km, respectively, which corresponded to about 5% and 17% of the pipes that had been constructed at the time of the earthquake [14]. Photo 21.7 shows a typical uplift damage to manhole in Ojiya city, while Photo 21.8 shows how the residual settle-ment at the road pavement surface concentrated into the region of the backfill soil.
Since the damage to other infrastructures such as embankments, tunnels, and natural slopes was also extensive in this earthquake, the Japan Society of Civil Engineers conducted an extensive sur-vey on the damage and compiled recommendations. They include the following contents on the sewer pipes [15]:
1. Social effects of damage to different types of lifeline facilities were not independent of each other but interacted with each other. For example, there was a case where a drinking water supply could be recovered rather rapidly, while it could not be used due to the delay of the recovery of the
PHOTO 21.6 Uplift of sewer manhole and settlement of untreated backfill in Onbetsu town caused by the 2003 Tokachi-Oki earthquake.
PHOTO 21.7 Uplift of sewer manhole in Ojiya city caused by the 2004 Niigataken-Chuetsu earthquake.

452 Disaster Prevention and Mitigation Technologies of Lifelines
sewer system. It is, therefore, important to establish and share a common database on the damage to different types of lifeline facilities and their rehabilitation planning in a synthesized manner.
2. Uplift of sewer manholes that had been buried along the car lanes of highways reduced capacity of the vehicle traffic. It was also followed by residual settlement of the backfill, and these poor per-formances badly affected the traffic of emergency cars immediately after the earthquake, and the rescue and rehabilitation activities executed after the earthquake. Not only the countermeasures on newly constructed facilities, but also those on existing facilities at low costs shall be developed, together with a proposal of more rational evaluation procedures of the liquefaction susceptibility of the backfill soil and the uplifting potential of the manholes.
3. Damage to small-scale facilities that had been constructed in mountainous areas was severe. Due measures shall be taken not to cause long-term intermission of lifeline service, including prepara-tion of alternative service.
In reconstructing the damaged sewer manholes and pipes, countermeasures were taken not to allow liquefaction of the backfill soil, following the new policy as has been described in Section 21.1.4. It was made preferable to adopt one of the three countermeasures as listed in Table 21.1. In Nagaoka city, for example, the excavated soil was reused after adding cement by the ratio of 20 kg/m3 for the backfill-ing works [16]. Photo 21.9 shows a plant facility that was constructed newly for the mixing work.
PHOTO 21.8 Settlement of sewer pipe backfill in Ojiya city caused by the 2004 Niigataken-Chuetsu earthquake.
TABLE 21.1 Proposed Countermeasures against Backfill Liquefaction
Countermeasures Backfill Material Quality Control
With compacted backfill
Borrowed sandy soil or excavated sandy soil suitable for backfilling and compaction works
Degree of compaction, Dc, shall be equal to or larger than 90%*
With highly permeable backfill
Gravelly soil with d50 > 10 mm and d10 > 1 mm Degree of compaction, Dc, shall be equal to or larger than 90%
With solidified backfill
Cement- or lime-treated soil with unconfined compression strength, qu, of specimens prepared in the laboratory in the range of 100–200 kPa
Unconfined compression strength, qu, of in situ retrieved specimens shall be in the range of 50–100 kPa
Source: Ministry of Land, Infrastructure, Transport and Tourism, Committee report on aseismic measures of sew-erage systems—Summary of damage induced by the 2004 Niigataken-Chuetsu earthquake and proposals on future aseismic measures, http://www.mlit.go.jp/kisha/kisha05/04/040826_.html (accessed on June 4, 2013), pp. I-6–I-20, 2005 (in Japanese).
*Depending on local soil conditions, the backfill may liquefy even with Dc > 90%.

453Sewerage System: Mitigation Technologies
Details of the damage to sewer pipes and results from the analyses on the influential factors have been reported elsewhere [14–18].
21.1.6 2007 niigataken-chuetsu-oki earthquake
The July 16, 2007, Niigataken-Chuetsu-Oki earthquake affected the sewer pipes that had been rehabili-tated after their damage caused by the 2004 Niigataken-Chuetsu earthquake. According to the results of investigation conducted in the areas that were shaken severely (i.e., recording the Japanese seismic intensity equal to or larger than level 6), the ratio of occurrence of repeated damage to sewer pipes was as low as 0.41% [19]. The extent of the repeated damage to the pipes was even minor, and the sewer man-holes suffered from no repeated damage.
Photo 21.10 shows a typical case where the countermeasure to the backfill soil by mixing cement was proved effective, which had been executed in the reconstruction works after the 2004 Niigataken-Chuetsu earthquake. At the adjacent site as shown in Photo 21.11, on the other hand, tentative repair had to be conducted on the road pavement that underwent residual settlement induced by liquefaction of the untreated backfill.
21.1.7 2011 off the Pacific coast of tohoku earthquake
The 2011 off the Pacific coast of Tohoku earthquake took place on March 11, 2011, with a moment magni-tude Mw of 9.0 and a fault rupture region of 400 and 200 km, respectively, for north–south and east–west directions. It caused a gigantic tsunami, which induced huge casualties and extensive structural damage in the coastal areas. Operation of many sewage treatment facilities that had been constructed along these areas was suspended due to the tsunami-induced damage. The outline of the damage and its rehabilita-tion works presented in this section has been originally prepared by Japan Sewage Works Association in Japanese.
Sewer pipes in Tokyo and 10 prefectures were damaged by this earthquake and tsunami. Total length of the damaged pipes was 642 km, which is about 1% of the total length of the sewer pipes (=65,001 km) that had been constructed in the affected areas. This extent of damage is far above those recorded in the past large earthquakes in Japan.
PHOTO 21.9 Cement-treatment plant facility in Nagaoka city constructed after the 2004 Niigataken-Chuetsu earthquake.

454 Disaster Prevention and Mitigation Technologies of Lifelines
21.1.7.1 Liquefaction-induced Damage and its countermeasures
Damage to sewer pipes and manholes was predominantly induced by liquefaction. The liquefaction-induced damage occupied 90% and 70% of the total damage to sewer pipes and manholes, respectively. As typically shown in Photo 21.12, extensive liquefaction of reclaimed soils took place along coastal areas and old river beds, inducing damage to not only sewer pipes and manholes but also to other underground structures, road pavements, houses, and electric poles. The major patterns of the damage to sewer pipes and manholes consisted of uneven residual horizontal displacements of the manhole segments (as shown in Figure 21.12), structural failure of the manhole segments, ejection of connecting pipes, opening of pipe joints, and clogging of pipes due to intrusion of surrounding soils.
PHOTO 21.10 No damage to sewer manhole and its backfill treated with cement in Kashiwazaki city (recon-structed after the 2004 Niigataken-Chuetsu earthquake). (From Sasaki, T. et al., Found. Eng. Equipment (Kisoko), 36(9), 25, 2008 [in Japanese].)
PHOTO 21.11 Tentative repair of road pavement damage by liquefaction of sewer pipe backfill in the 2007 Niigataken-Chuetsu-Oki earthquake. (From Sasaki, T. et al., Found. Eng. Equip. (Kisoko), 36(9), 25, 2008 [in Japanese].)

455Sewerage System: Mitigation Technologies
In addition, most of the damage to sewer pipes and manholes in Tohoku districts, such as in Miyagi prefecture, was due to liquefaction of backfill soils, which induced uplift of manholes, settlement of road surface above backfill soils, and residual bending deformation of pipes. In some cases, effects of coun-termeasures against liquefaction of backfill soils could be confirmed, as typically shown in Photo 21.13. In other cases, on the other hand, the following issues on the quality control of construction works were highlighted: insufficient compaction in case of the compaction method, and unexpected strength reduc-tion in case of the solidification method, which was caused by insufficient mixing work and/or improper temporary storage executed after adding cement to backfill soils.
The lessons learned from the earlier case histories are as follows. Against extensive liquefaction of surrounding soil layers, more flexible and extensible pipe joints shall be developed as well as effective measures against the uneven residual horizontal displacements of the manhole segments and the intru-sion of surrounding soils. Against liquefaction of backfill soils, proper execution of the construction works and their quality control shall be mandated explicitly, while summarizing the issues on which due attention shall be paid.
PHOTO 21.12 Liquefaction in Shin-Kiba, Koto ward, Tokyo, caused by the 2011 off the Pacific coast of Tohoku earthquake. (Courtesy of Japan Sewage Works Association, Tokyo, Japan.)
FIGURE 21.12 Damage to sewer manholes due to uneven residual horizontal displacements caused by the 2011 off the Pacific coast of Tohoku earthquake. (Courtesy of Japan Sewage Works Association, Tokyo, Japan.)
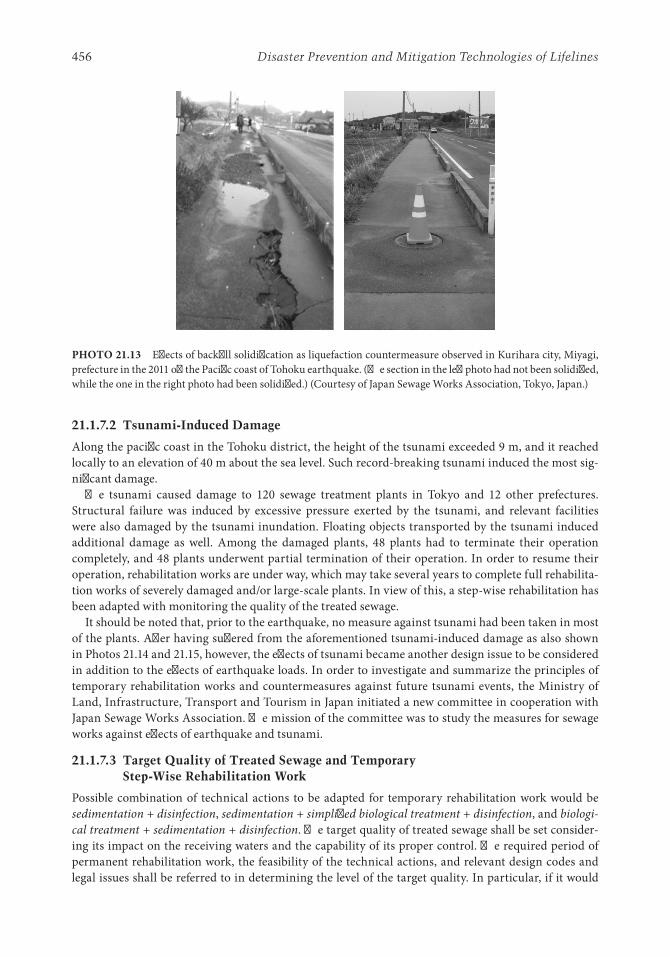
456 Disaster Prevention and Mitigation Technologies of Lifelines
21.1.7.2 tsunami-induced Damage
Along the pacific coast in the Tohoku district, the height of the tsunami exceeded 9 m, and it reached locally to an elevation of 40 m about the sea level. Such record-breaking tsunami induced the most sig-nificant damage.
The tsunami caused damage to 120 sewage treatment plants in Tokyo and 12 other prefectures. Structural failure was induced by excessive pressure exerted by the tsunami, and relevant facilities were also damaged by the tsunami inundation. Floating objects transported by the tsunami induced additional damage as well. Among the damaged plants, 48 plants had to terminate their operation completely, and 48 plants underwent partial termination of their operation. In order to resume their operation, rehabilitation works are under way, which may take several years to complete full rehabilita-tion works of severely damaged and/or large-scale plants. In view of this, a step-wise rehabilitation has been adapted with monitoring the quality of the treated sewage.
It should be noted that, prior to the earthquake, no measure against tsunami had been taken in most of the plants. After having suffered from the aforementioned tsunami-induced damage as also shown in Photos 21.14 and 21.15, however, the effects of tsunami became another design issue to be considered in addition to the effects of earthquake loads. In order to investigate and summarize the principles of temporary rehabilitation works and countermeasures against future tsunami events, the Ministry of Land, Infrastructure, Transport and Tourism in Japan initiated a new committee in cooperation with Japan Sewage Works Association. The mission of the committee was to study the measures for sewage works against effects of earthquake and tsunami.
21.1.7.3 target Quality of treated Sewage and temporary Step-Wise Rehabilitation Work
Possible combination of technical actions to be adapted for temporary rehabilitation work would be sedimentation + disinfection, sedimentation + simplified biological treatment + disinfection, and biologi-cal treatment + sedimentation + disinfection. The target quality of treated sewage shall be set consider-ing its impact on the receiving waters and the capability of its proper control. The required period of permanent rehabilitation work, the feasibility of the technical actions, and relevant design codes and legal issues shall be referred to in determining the level of the target quality. In particular, if it would
PHOTO 21.13 Effects of backfill solidification as liquefaction countermeasure observed in Kurihara city, Miyagi, prefecture in the 2011 off the Pacific coast of Tohoku earthquake. (The section in the left photo had not been solidified, while the one in the right photo had been solidified.) (Courtesy of Japan Sewage Works Association, Tokyo, Japan.)

457Sewerage System: Mitigation Technologies
require a rather long period to complete the permanent rehabilitation work, due attention shall be paid in determining the respective treatment level for step-wise rehabilitation work on the environmental impacts such as odor and landscape, domestic and industrial waters, fisheries and aquaculture indus-tries, tourism, recreational activities such as swimming, while considering as well the status on how the water usage in the receiving waters is resumed.
Figure 21.13 illustrates schematically the temporary rehabilitation work and the target quality of treated sewage. In planning the temporary rehabilitation work, it is required to make an effective reuse of the newly introduced facilities even for the permanent rehabilitation work. If it would take too long period to achieve the target quality of treated sewage that is similar to the one assigned for the permanent
PHOTO 21.14 Damage to South Gamo sewage treatment plant in Sendai city, Miyagi, prefecture induced by tsunami inundation after the 2011 off the Pacific coast of Tohoku earthquake. (Courtesy of Japan Sewage Works Association, Tokyo, Japan.)
PHOTO 21.15 Damage to wall of South Gamo sewage treatment plant in Sendai city, Miyagi, prefecture induced by tsunami force after the 2011 off the Pacific coast of Tohoku earthquake. (Courtesy of Japan Sewage Works Association, Tokyo, Japan.)

458 Disaster Prevention and Mitigation Technologies of Lifelines
rehabilitation work, possible restriction of the water usage in the receiving waters, such as prohibiting swimming there, shall be studied, in addition to the efforts to improve the quality as quick as possible.
21.1.7.4 Principles of Measures against effects of earthquake and tsunami
Sewage systems are one of the essential lifelines, and thus its quick and efficient measures need to be taken in order to minimize the possible damage during future disasters. Against future earthquake events, however, these measures have not been well investigated in many of the organizations in charge of operating the sewage system. In addition to promoting such aseismic measures, execution of mea-sures against future tsunami events shall be initiated in a prompt manner.
In order to provide sustainable sewage service, therefore, existing sewage facilities shall adapt the measures against effects of earthquake and tsunami with a first priority under the following principles:
1. Disaster prevention measures based on structural reinforcement against effects of earthquake and tsunami shall be combined with disaster reduction measures that are executed to minimize the damage.
2. The sewage facilities shall be designed to save human life during earthquake and tsunami events. Depending on the degrees of necessity and emergency, priority shall be explicitly given to each of the required performances. Feasible actions such as step-wise execution of aseismic measures shall be taken whenever they are available.
3. A new technical code for taking measures against effects of tsunami shall be specified. These measures shall be executed while considering the simulated inundation by tsunami, which is pub-lished by the local governors assuming the maximum credible tsunami.
4. Business continuity planning (BCP) of sewage service shall be initiated in order to minimize the social impacts of the damage to sewer facilities and to enable quick rehabilitation. Soft (or nonstruc-tural) measures such as specifying the regulations to be adapted for mutual assistance between dif-ferent organizations shall be developed and combined with hard (or structural) measures.
Temporaryrehabilitation (1st step):Sedimentation +disinfection
200
Emergentaction
BOD(mg/L)
120
60
15
Temporaryrehabilitation (2nd step):Sedimentation + simplifiedbiological treatment + disinfection
Quality oftreated sewage
Permanentrehabilitation
Achievedby addingflocculantand filters
Temporaryrehabilitation (3rd step):Biological treatment + sedimetation + disinfection
FIGURE 21.13 Schematic illustration of temporary step-wise rehabilitation work and target quality of treated sewage. (From Ministry of Land, Infrastructure, Transport and Tourism, Committee report on the measures for sewage works against earthquake and tsunami, http://www.mlit.go.jp/mizukokudo/sewerage/crd_sewerage_tk_000170–1.html, [accessed on June 4, 2013], 2012 [in Japanese].)

459Sewerage System: Mitigation Technologies
Short-term, midterm, and long-term target levels of executing step-wise measures against effects of earthquake and tsunami on existing sewage facilities shall be defined, while considering the degree of necessity and emergency of each of the performance required for them. The short-term target levels of damage prevention shall include the following:
1. Against the effects of earthquake, sewage treatment plants and pumping stations shall secure their pumping, sedimentation, and disinfection capacities, and sewer pipes and manholes shall secure their flow capacity between the treatment plants and the hub facilities against disasters, such as the headquarters for disaster control and large-scale evacuation sites. Due reinforcements of each of the facilities shall be made to improve their seismic performance.
2. Against effects of tsunami, sewage treatment plants and pumping stations shall secure their pumping and disinfection capacities by improving their water tightness and locating their facili-ties at higher elevations. In areas that may be inundated by tsunami and outlet gates around that may be directly affected by tsunami, sewer pipes and manholes shall secure their capacity to pre-vent inverse flow by installing a flap gate and a remote control system to close the gate. Evacuation route and space shall also be secured from a viewpoint of saving human life.
In principle, these target levels of damage prevention against effects of earthquake and tsunami shall be satisfied. Before completion of the measures for damage prevention, however, the sewage facilities may undergo damage. In order to prepare for such circumstances, measures for damage reduction shall be taken by specifying the BCP of sewage service, while considering step-wise completion of the measures for damage prevention. They shall make it possible to execute emergency and temporary actions after undergoing the damage and to fulfill the minimum level of required performance. The short-term target levels of damage reduction shall include the following:
1. Damage prediction and seismic performance evaluation shall be promptly executed on existing facilities, and priorities of measures against effects of earthquake and tsunami shall be studied.
2. BCP of the sewage service shall be promptly made. 3. In order to take immediate actions following the BCP, practice shall be made on a regular basis,
while storing movable pumps and generators and securing an emergency supply route to be implemented after possible damage.
4. Information on the sewage facilities shall be saved electrically, while making its backup data. 5. Agreements of mutual assistance between relevant organizations shall be made, and planning for
accepting the assistance smoothly shall be established. 6. Assistance to develop a hazard-map showing the current status of executing measures against the
effects of earthquake and tsunami and possible extents of the damage shall be given. 7. From a viewpoint of saving human life, emergency evacuation planning shall be established, and
evacuation practice shall be conducted on a regular basis.
21.1.7.5 Design concept of Sewage Facilities considering Measures against effects of tsunami
General concepts to be newly adapted in securing the required performances of sewage facilities against maximum credible tsunami (refer to Table 21.2) are described herein.
The performances of the sewage service shall be classified into primary ones (category 1) to be always secured even after undergoing possible tsunami-induced damage and nonfundamental ones. The latter performances shall be further classified into those which should be restored immediately after tem-porary shutdown caused by the maximum credible tsunami (category 2) and those which should be restored quickly (category 3).
In selecting the measures for each of the earlier three performance categories, due attention shall be paid on the importance, the cost–performance ratio, and the feasibility (refer to Table 21.3 and Figure 21.14).

460 Disaster Prevention and Mitigation Technologies of Lifelines
In securing the primary performance (category 1), it is preferable to avoid risk by adapting structural measures to prevent inundation by tsunami. If such measures are not feasible, the risk shall be reduced by adapting structural measures to ensure firm water-tightness. In securing the secondary performance (category 2), the risk shall be admitted (i.e., possible inundation shall be accepted) while taking soft (or nonstructural) measures in principle.
If the location (such as the elevation) and structural details of the facility do not allow one to adapt the aforementioned measures, soft measures shall be taken while linking them to the BCP, and thus, the risk shall be eventually avoided or reduced.
It is expected that a variety of public and private sectors will take measures against the effects of tsunami, based on the lessons learned from the 2011 off the Pacific coast of Tohoku earthquake. In case of sewage facilities, the first priority shall be placed on saving human life, as has been described earlier, and then mea-sures shall be taken depending on the necessity and emergency of their performances to be secured, from two kinds of viewpoints: to prevent the disaster and to reduce the disaster. In executing such measures against the effects of tsunami, it is required to establish detailed design principles and their procedures.
21.1.8 Summary of Lessons Learned from earthquake-induced Damage to Sewer Facilities and their Rehabilitation Policies
The lessons learned from the case histories on damage to sewer facilities, in particular sewer manholes and pipes, and their rehabilitation works can be summarized as follows.
1. Sewer pipes that were buried below the ground water table by the cut-and-cover method are prone to damage caused by liquefaction of saturated backfill soil (as illustrated in Figure 21.4).
TABLE 21.2 Typical Required Performances of Sewage Facilities against Maximum Credible Tsunami
Type of Facility
Sewer Pipes and Manholes
Pumping Stations Sewage Treatment Plants
Functional type
Overall functionsPrimary functions Other functionsPrevention of
inverse flow Pumping
capacity Pumping and
disinfection capacities Sedimentation and
dewatering capacities Functions not listed
in the left columns Required
performanceCategory 1: to be always secured Category 2: to be
restored immediately Category 3: to be
restored quickly
Source: Ministry of Land, Infrastructure, Transport and Tourism, Committee report on the measures for sewage works against earthquake and tsunami, http://www.mlit.go.jp/mizukokudo/sewerage/crd_sewerage_tk_000170–1.html (accessed on June 4, 2013), 2012 (in Japanese).
TABLE 21.3 Protection Level and Measures for Different Required Performances against Maximum Credible Tsunami
Performance Category 1: To Be Always Secured Category 2: To Be
Restored Immediately Category 3: To Be Restored Quickly
Protection level High Moderate Low Avoid the risk (or reduce the risk if it is unavoidable) Reduce the risk Accept the risk
Measures Structural measures not to be inundated (or those to ensure firm water-tightness if inundation is unavoidable)
Structural measures to ensure firm water-tightness
Accept inundation
Source: Ministry of Land, Infrastructure, Transport and Tourism, Committee report on the measures for sewage works against earthquake and tsunami, http://www.mlit.go.jp/mizukokudo/sewerage/crd_sewerage_tk_000170–1.html (accessed on June 4, 2013), 2012 (in Japanese).

461Sewerage System: Mitigation Technologies
Even the backfill soil consisting of gravelly soils, which are in general considered to be less liquefi-able, may liquefy, depending on its density and permeability.
2. The conditions of original soil layers affect the extent of damage. Existence of thick liquefiable lay-ers aside or below the pipe (as illustrated in Figure 21.5) and/or existence of less permeable layers at the side of the saturated backfill soil tend to induce larger extent of damage.
3. Initially, the damaged pipes were reconstructed to the original conditions. After the 2003 Tokachi-Oki earthquake, however, the policy of reconstruction has been changed to one where countermeasures are taken not to allow liquefaction of the backfill soil. Good performance of the improved backfill was observed in the 2007 Niigataken-Chuetsu-Oki earthquake.
4. The 2011 off the Pacific coast of Tohoku earthquake along with subsequent tsunami induced exten-sive and severe damage to the sewerage system in Tohoku and Kanto districts, Japan. Damage to sewer pipes and manholes was predominantly induced by liquefaction of reclaimed soils and/or backfill soils, while damage to sewage treatment plants, including structural failure and inunda-tion, was mostly induced by tsunami.
5. After the 2011 off the Pacific coast of Tohoku earthquake, a concept of temporary step-wise reha-bilitation work has been introduced to restore the sewage service. In order to provide sustainable sewage service, principles of measures against effects of earthquake and tsunami, which will be applied to existing sewage facilities, have also been summarized. In addition, general concepts to be adapted in securing the required performances of sewage facilities against maximum credible tsunami have been newly compiled.
High protection :
Constructionof barrier wall
SP with RW andwater-tight E&M
Backup
Placement ofwhole structureat high elevation
SP with RW andplacement of openings
at high elevation
Alternative measureswith backup system
for E&M
LegendOpenings:a. without measures
Electrics & machinery (E&M):Indoorinundation
a. without measuresb. with water-
tightnessb. with water-
tightness
Tsunamiheight
(schematic)
Soft (or nonstructural)measure
SP with RW andwater-tightopenings
Structural protection(SP) with reinforced
wall (RW) andplacement of E&M
at high elevation
Moderate protection:(ensure firm water-
tightness)
Low protection:(accept inundation)(should not be
inundated)
FIGURE 21.14 Examples of measures for different protection levels. (From Ministry of Land, Infrastructure, Transport and Tourism, Committee report on the measures for sewage works against earthquake and tsunami, http://www.mlit.go.jp/mizukokudo/sewerage/crd_sewerage_tk_000170–1.html [accessed on June 4, 2013], 2012 [in Japanese].)

462 Disaster Prevention and Mitigation Technologies of Lifelines
21.2 Aseismic Measures for Sewer Pipes
As described in the previous section, sewer pipes and manholes have been damaged in many past earthquakes, inducing several effects as summarized in Table 21.4. From performance point of view, excessive displacement of pipes and stacking of broken pipes with surrounding soils cause suspension of the sewage collection and thus affect daily life directly. In addition, reduced capacity of rainwater drainage may cause flooding damage in the affected area, and flow-out of the sewage water from the broken pipes may induce environmental problems. Residual settlement of road surface and ejection of manhole above the road surface may also jam the traffic through the road, affecting badly the emer-gency rescue and repair operations.
In view of this, fundamental policies to prevent or reduce the damage to sewer facilities, seismic design procedures of sewer pipes, and countermeasures against the backfill liquefaction are described in this section.
21.2.1 Fundamental Policies of Aseismic Measures for Sewer Facilities
Based on the lessons learned from the damage to sewer facilities caused by the 1995 Hyogoken-Nanbu earthquake, the seismic design guideline of sewer facilities was revised in 1997 [1]. Two lev-els of design earthquake motions were introduced, and the facilities were designed to fulfill the required performance for each of them. As has been described in Section 21.1, on the other hand, sewer facilities suffered from earthquake-induced damage that was frequently associated with the backfill liquefaction. In addition, it was pointed out that it would take in general extremely long time to improve the seismic resistance of the vast amounts of sewer facilities in Japan from the structural point of view.
21.2.1.1 General Policies of Aseismic Measures
As mentioned earlier, aseismic measures for sewer facilities are made by conducting their seismic design to ensure sufficient structural performance, while considering two levels of design seismic motions. Based on the lessons learned from the damage induced by the 2004 Niigataken-Chuetsu earthquake, countermeasures against backfill liquefaction are also mandated in designing sewer pipes. In addition, the required seismic performance to secure the function even after undergoing structural damage is enhanced by adopting measures as a system, such as adding auxiliary pipes to the main pipes and con-structing a network of pipes in the sewage treatment plants. Some details of seismic design of sewer pipes will be described later in Section 21.2.3.
21.2.1.2 Fundamental Policies of Aseismic Measures for existing Sewer Facilities
Considering that it would take long time to complete the retrofitting works on existing sewer facilities to improve their seismic performance, the following fundamental policies are adopted.
TABLE 21.4 Effects of Earthquake-Induced Damage to Sewer Pipes
Issues Major Cause Effects of Damage
Sewage use Breakage of pipes Limited usage of sewage, limited usage of water caused by reduction of sewage treatment capacity
Traffic Residual settlement of liquefied backfill, uplift of manholes, inflow of surrounding soils into broken pipes
Suspension of traffic, obstacle to evacuation and snowplow works, cave-in of pavement
Public sanitary Breakage of pipes, outflow of sewage due to breakdown of manhole pumps
Contamination of ground water and water for public use

463Sewerage System: Mitigation Technologies
A priority shall be given in taking aseismic measures for existing facilities, while considering the importance of the facility, presumed damage pattern, extent of the damage, and effects of damage on others. The measures shall be taken in the following stages: emergency stage, intermediate stage, and long-term stage, by which some facilities are retrofitted urgently, while others are upgraded by taking the opportunity of reconstruction or renewal. They include inserting a flexible joint at the connection between the manhole and the pipe, conducting a renewal work by employing a method that has been proven to be effective in improving the seismic performance, adopting countermeasures against backfill liquefaction, and networking the pipe system. As a result, for example, development of seismic design procedures for renewed pipes is under way [24].
At the emergency stage, in addition to taking structural measures to maintain minimal function against large earthquake loads, their combination with other measures, such as stockpiling por-table pumps and temporary lavatories to be used after the earthquake, is recommended to prevent inducing fatal secondary damage. These structural and physical measures shall also be combined with measures from the planning point of view, including the development of mutual support sys-tems among different organizations and execution of practical training by simulating earthquake occurrence.
Following these policies, a new project that promotes taking important aseismic measures at emergency stage [25] was initiated in 2006. A new regulation on the mutual assistance system during disasters among organizations that spread over a wide area was also established to enable quick actions of damage survey and recovery work, which was later revised [26] based on the les-sons learned from the 2011 off the Pacific coast of Tohoku earthquake and subsequent tsunami. Conducting in-advance simulation of earthquake-induced damage to sewer pipes and utilizing its results [27] are recommended as well. In addition, introduction of BCP into the management of sewer facilities is studied [19].
21.2.2 Seismic Design of Sewer Pipes
Herein, while referring to the relevant design guidelines [22], the seismic design of sewer pipes in Japan is briefly introduced.
21.2.2.1 Fundamental Policies of Seismic Design
In the relevant seismic design guideline in Japan [22], level 1 earthquake motion is defined as the one that is expected to occur once or twice during the service life of the facility to be designed. In addition, level 2 earthquake motion is defined as the maximum possible one that may take place during the ser-vice life though the occurrence probability is extremely low.
Table 21.5 summarizes the policies in conducting seismic design of sewer pipes. Their required per-formances are assigned depending on the level of the design earthquake motion and the importance of the line. The important lines are defined as follows, from different viewpoints such as ensuring the capacity of sewage flow, securing the road traffic above the pipe, and preventing the secondary damage:
1. Trunk lines in the basin 2. Trunk lines directly connecting to pumping station or treatment plant 3. Lines crossing rivers or railways, which may induce secondary damage, or trunk lines that require
long time until they are rehabilitated 4. Lines that are buried below highways assigned for emergency transportation, which may cause
serious effects on the traffic 5. Trunk lines directly connecting to outlet that covers significantly large drainage area 6. Lines to collect sewage from facilities such as the disaster prevention center, the evacuation space,
and the facilities that are assigned based on relevant rules for disaster prevention 7. Lines that are indispensable in the sewer system

464 Disaster Prevention and Mitigation Technologies of Lifelines
In the seismic design of pipes along important lines, the design capacity of sewage flow is ensured against level 1 earthquake motion, and the minimum flow capacity is ensured against level 2 earth-quake motion. In the seismic design of other pipes, the design capacity of sewage flow is ensured against level 1 earthquake motion, only when the pipes are constructed newly. It is also required to secure the road traffic performance, when the pipes are buried below highways assigned for emer-gency transportation.
21.2.2.2 Seismic Design of Sewer Pipes
The seismic design of sewer pipes in Japan is conducted as follows, considering the importance of the pipe:
1. In designing the pipe and manhole bodies along important lines, allowable stress design or limit state design considering the serviceability limit state shall be employed against level 1 earthquake motion, and limit state design considering the ultimate limit state shall be employed against level 2 earthquake motion.
2. In designing the connection parts between the pipes and those between the pipe and manhole, their expected residual deformation against level 2 earthquake motion shall be small enough to maintain the minimum flow capacity.
3. Due countermeasures against liquefaction shall be taken not to cause uplift damage of sewer pipes and/or settlement of road surface, which would obstruct the traffic for emergency transportation.
Table 21.6 summarizes the policies for each of the components consisting of sewer pipes, which are employed to maintain the required performances against level 2 earthquake motion.
TABLE 21.5 Fundamental Policies on Seismic Design of Sewer Pipes
Pipes To Be Designed
Design Earthquake Motion Required Performance
Level 1 Level 2 Level 1 Level 2
Along important lines
1. Trunk lines in the basin 2. Trunk lines connecting directly to
pumping station or treatment plant 3. Lines crossing rivers or railways
that may induce secondary damage, or trunk lines that require long time until they are rehabilitated
5. Trunk lines connecting directly to outlet that covers significantly large drainage area
6. Lines to collect sewage from facilities such as the disaster prevention center, the evacuation space, and the facilities that are assigned based on relevant rules for disaster prevention
7. Lines that are indispensable in the sewer system
x x Maintain design flow capacity of sewage
Secure minimum flow capacity of sewage (gravitational flow from upstream to downstream)
4. Lines that are buried below highways assigned for emergency transportation, which may cause serious effects on the traffic
x x Maintain design flow capacity and emergency traffic capacity
Secure minimum flow capacity and emergency traffic capacity
Along other lines
x — Maintain design flow capacity
—

465Sewerage System: Mitigation Technologies
It should be noted that, in designing the pipe and manhole bodies along the lines that are not catego-rized as important ones, the design capacity of sewage flow is ensured against level 1 earthquake motion. This is because of the following factors:
1. The effects of their damage are comparatively small. 2. They can be in general more easily rehabilitated than the pipes along important lines. 3. The total length of existing sewer pipes is so large that it is not practical to secure high seismic
performance for all of them.
As the seismic design procedure of the pipe bodies, the connections between pipes, and the connections between pipes and manholes, the seismic deformation method is in general adopted. When the original soil layer and the backfill are liquefiable, additional design is made on measures to prevent liquefaction-induced uplift or settlement.
21.2.2.3 countermeasures against Liquefaction
As has been described in Section 21.1, most of the damage to sewer pipes in the past earthquakes was caused by soil liquefaction. Uplift, settlement, and/or excessive deformation of the pipes were induced by liquefaction of original soil and/or backfill that was constructed by the cut-and-cover method. In checking the seismic performance of the pipes, therefore, liquefaction potential of the original soil layer and the backfill shall be evaluated, and countermeasures against liquefaction shall be taken if needed. The evaluation procedures of liquefaction potential and typical methods of liquefaction countermea-sures are briefly described in the following text.
21.2.2.3.1 Evaluation of Liquefaction Potential of Original Soil LayerFollowing the seismic design guidelines of highway bridges in Japan [28], the liquefaction potential of the original soil layer is evaluated. As the design load, level 2 earthquake motion (type II) is employed, and if necessary level 1 earthquake motion is also assigned by setting khc = 0.15 × Cz, where Cz is a cor-rection factor to account for the difference in the local seismicity.
If the results from the earlier evaluation suggest liquefaction occurrence, the following effects of liq-uefaction shall be considered in the seismic design:
1. Reduction of soil strength and stiffness 2. Lateral spreading 3. Permanent deformation 4. Residual settlement 5. Buoyancy force
TABLE 21.6 Seismic Design Policies for Sewer Manholes and Pipes Constructed by Cut-and-Cover Method
Component Policy to Maintain Required Performance
Connection between manhole and pipe The bending angle and the pullout displacement at the connection shall be within the values that would not induce inflow of surrounding soils. Connection between pipes
Manhole body RC (reinforced concrete) and precast concrete manholes shall not exceed the ultimate limit state.
Uplift damage shall not be induced by backfill liquefaction, which may affect the traffic.
The opening at the interface between the precast concrete manhole blocks shall be within the values that would not induce inflow of surrounding soils.
Pipe body Uplift damage and/or residual settlement shall not be induced by backfill liquefaction, which may affect the traffic.
Source: Japan Sewage Works Association, Guideline for aseismic measures of sewage facilities (2006 version), 2006, pp. 144–145 (in Japanese).

466 Disaster Prevention and Mitigation Technologies of Lifelines
21.2.2.3.2 Evaluation of Liquefaction Potential of BackfillIn the past earthquakes as described in Section 21.1, liquefaction of backfill induced settlement of road surface above the backfill and the uplift of manholes. In order to prevent liquefaction-induced damage, therefore, liquefaction potential of not only the original soil layer but also the backfill shall be evaluated. In particular, if the original soil layer consists of soft clayey soils and/or peat, which are not liquefiable themselves, the backfill may liquefy under the condition that the ground water table is high, including the case where the ground water table is raised temporarily during and after rainfall events. On the other hand, if the original soil layer consists of gravelly soils and/or dense sandy soils, or if the saturated region of the backfill is to a limited extent (i.e., the pipe is buried at a shallower location or the ground water table is sufficiently deep), the liquefaction potential of backfill may be relatively low.
The procedures to evaluate if the backfill liquefaction induces damage to sewer pipes or not are not yet fully established. Based on past case histories, therefore, the damage is expected to take place when the site fulfills all of the following conditions:
1. The ground water table is shallower than 3 m below the ground surface. 2. The pipe is buried at deep locations (i.e., the overburden soil thickness is larger than 2 m, and the
pipe is below the ground water table). 3. The pipe is buried in a soft original soil layer, such as the cases with loose sandy soil layer (with
typical SPT N value <15) or soft clayey soil layer (with typical SPT N value <7).
In addition, rough evaluation of the liquefaction potential of the original soil layer and the backfill can be made based on the classification of microtopography.
21.2.2.3.3 Countermeasures against LiquefactionIn the construction works of sewer pipes executed at sites where backfill liquefaction would induce their damage, one of the following countermeasures shall be taken in principle, while considering original soil layer property, workability, type of pipes, and allowable construction period among other conditions:
1. Compaction of backfill 2. Use of backfill material such as crushed stones with high permeability 3. Use of backfill material that solidifies by itself
Table 21.7 summarizes the material used, the quality control adopted, and the features of the three kinds of countermeasures provided earlier. It is preferable to determine properly the area within which the countermeasure is taken, while considering ground water table and possible effects of removing the sheet piles used as temporary soil retaining walls. In addition, an appropriate measure shall be selected, while considering liquefaction potential of the original soil layer, construction cost, and applicability of reusing the excavated soil. Herein, some details on each of the three measures are described.
21.2.2.3.3.1 Compaction of Backfill By compacting the backfill sufficiently into a dense state that would mobilize high resistance against liquefaction, the occurrence of liquefaction and liquefaction-induced damage to sewer pipes can be prevented. It is in general required that the backfill shall be compacted to exhibit the degree of compaction equal to or higher than 90% in order not to induce the damage. In the 2007 Niigataken-Chuetsu-Oki earthquake, for example, no damage to sewer pipes is reported at sites that meet the aforementioned criterion in terms of the degree of compaction [19]. To meet this criterion, the quality control during the construction work shall be ensured by keeping the water content of the backfill close to the optimum condition for compaction and executing a thorough compaction with a tamper, while considering the possible ground loosening induced by the removal of the sheet pipes.

467Sewerage System: Mitigation Technologies
If needed, another measure can also be taken in the cases where the aforementioned countermeasures may not be effectively applicable, in such cases as that with high ground water table that may be accom-panied by large amount of water leakage, with extremely soft original soil layer condition, and with the use of problematic soils such as volcanic ashes as the backfill material.
Based on case histories in 2007 Niigataken-Chuetsu-Oki earthquake, some notes are compiled on the construction and its quality control, such as the lift of backfill, the compaction method employed, and the quality control of compaction [19].
21.2.2.3.3.2 Use of Backfill Material Such as Crushed Stones with High Permeability By backfilling with a geomaterial having high permeability such as crushed stones, the excess pore water pressure gener-ated during earthquakes is dissipated, and thus the occurrence of liquefaction and liquefaction-induced damage to sewer pipes can be prevented. It is essential to select the backfill material with sufficient permeability, while avoiding less permeable materials having larger amounts of sand and fines contents.
In order to secure space where the pore water would be drained out, backfilling works using the earlier material shall be made to an elevation that is higher than the ground water table. In order to maintain good workability, backfilling works around the pipe (in the region up to about 30 cm above the pipe) can be made by using sandy soils.
In Table 21.7, some characteristic values for the cases with crushed stones are shown as a reference, which were assigned based on the type of soils that are not potentially liquefiable as described in the design specification of highway bridges in Japan [28]. As the backfill materials, those which are used for the drainage method in general, such as crushed stones, and/or proven to exhibit sufficient drainage effects can be employed. When the original soil layer consists of sandy soils, a proper backfill material shall be chosen, while paying due attention to possible clogging caused by the movement of sand par-ticles accompanied with the pore water flow into the drainage. The clogging may also induce sudden settlement of surrounding ground and reduce the drainage effects. In the backfilling works, they should be compacted sufficiently with tampers or their equivalents, while following the relevant guidelines specified by the road management authority in charge.
21.2.2.3.3.3 Use of Backfill Material Which Solidifies by Itself By adding solidifying agents to the backfill soils, the occurrence of liquefaction and liquefaction-induced damage to sewer pipes can be prevented. In general, cements or their associated products are added to both excavated soils and borrowed soils, and limes are also added to excavated soils.
The amounts of the solidifying agents are determined considering the requirements on the liquefac-tion resistance and the re-excavation property. The required liquefaction resistance is in general set
TABLE 21.7 Countermeasures against Backfill LiquefactionMeasures a. Compaction of backfill b. Use of backfill material such
as crushed stones with high permeability
c. Use of backfill material that solidifies by itself
Outline Groundwater
Highlypermeable Solidified
Backfill material
Borrowed sandy soil or excavated soil that is suitable for backfilling works
Highly permeable material (e.g., crushed stones with d10 > 1 mm or their equivalents)
Excavated soil or borrowed soil
Qualitycontrol
The degree of compaction, Dc, shall be equal to or larger than 90%*.
The specifications by the road management authority shall be ensured. (e.g. Dc > 90%)
Liquefaction resistance and re-excavation property shall be confirmed (e.g., the average value of on-site unconfined compression strengths shall be in the range of 50–100 kPa)
*The backfill may liquefy even with Dc > 90%, if the original soil layer is soft.

468 Disaster Prevention and Mitigation Technologies of Lifelines
at 0.4, in terms of the cyclic stress ratio employed in undrained cyclic triaxial tests. Sufficient compac-tion during the backfilling works is also essential in achieving the required liquefaction resistance.
In the cases with cement-treated soils, they are considered as nonliquefiable if they exhibit unconfined compression strength in the range of 50–100 kPa. Thus, the required amount of cement can be assigned so that, after curing for 28 days, the treated soils would exhibit the unconfined com-pression strength, on the average, within the earlier-mentioned range. When the cement-mixing is made on site by using a backhoe, the target strengths to be achieved in the laboratory are doubled to the range of 100–200 kPa, accounting for their possible reduction on the site due to heterogeneity of the mixed soils.
In addition to cement-treated soils, lime-treated soils are also effective in preventing liquefac-tion as well as improving the strength property, consistency, and trafficability, among others. They can also contribute to the effective reuse of excavated soils. Similar to the cases with cement-treated soils, it is in general required to achieve the on-site unconfined compression strength in the range of 50–100 kPa on average with the lime-treated soils. It is, however, preferred that the required amount of lime is assigned based on results from trial construction, since the on-site unconfined compres-sion strength can vary largely, depending on the original soil type and the procedures of adding and mixing the lime.
As has been described in Section 21.1, the sites with sewer pipes that had been damaged by the 2004 Niigataken-Chuetsu earthquake and thereafter rehabilitated with the backfill solidification method using cement-treated soils suffered from almost no damage by the 2007 Niigataken-Chuetsu-Oki earth-quake [19]. Thus, this method has been proven to be effective. Based on the investigation results into the very limited damage case histories at some of the earlier sites, in addition, some notes are also compiled on their design and construction issues [19], including the effects of ground water outflow during the pipe installation and backfilling works and those of temporary storing of the treated soils prior to the backfilling works.
21.3 Relevant Researches on Seismic Behavior of Sewer Pipes
In this section, results from relevant model tests on the uplift damage to sewer pipes induced by lique-faction of backfill soils are described, focusing on the damage mechanism, influential factors, and the effects of several types of countermeasures.
21.3.1 Behavior of Sewer Pipes and their Surrounding Ground in Model Shaking tests
Herein, results from model shaking tests on the behavior of sewer pipes and their surrounding ground, which were conducted under normal gravity field, are briefly introduced [8,29–31].
21.3.1.1 test Procedures and conditions
Figure 21.15 shows a cross section of the tested models. The model dimension was reduced from the prototype scale by a factor of about 1/6, while no adjustment was made on the similitude with respect to dynamic and consolidation/seepage phenomenon.
Original soil layer was prepared by pluviating Toyoura sand particles through air from a hopper, and it was subsequently saturated by providing de-aired water. In cases B, C, and 9–11, the relative density of the original soil layer was adjusted to 60% to simulate liquefiable condition. On the other hand, in cases A, 7, 8, and 12–14, the relative density of the original soil layer was raised to 90% or even larger by applying shaking histories in advance.
After placing lattice, ladder, or concrete foundation (except for cases 9, 11, 12, and 14 where no foun-dation was employed), PVC pipes with a diameter of 5 and 15 cm were installed as the models of sewer pipe and manhole, respectively, after adjusting their apparent unit weight to 11 and 6 kN/m3.

469Sewerage System: Mitigation Technologies
Backfill soil layer was prepared under a condition as loose as possible by pluviating clean fine sand (Silica sand #7) particles through air or water. In case 11, the upper part of the backfill soil layer was pre-pared by using gravelly sand, which was retrieved from an actual backfill layer in Towada city, where the sewer pipes suffered from uplift damage by the 1994 Sanriku-Haruka-Oki earthquake (refer to Section 21.1.3) and sieved to adjust its maximum diameter to 26.5 mm as shown in Figure 21.16. In cases 7, 8, and A, a vinyl sheet was placed at the side of the backfill to prevent transmission of excess pore pressures. For the same purpose, rubber sheets were placed at the central part of the original soil layer in cases 9–11, and at the bottom and side of the backfill in cases 12–14.
Cross sectionCase 7 Case 9
Pipe (φ = 5 cm)
Rubber sheet (in box shape)
Fine silica sand (Dr 50%)Toyoura sand (Dr = 98%)
40 20 27.5 27.5 20 27.5 27.5 20 40250
(cm)
Case 12 Case 13 Case 14
15
30
50
35
Ladder foundation with gravel mat
Case 10
Fine silica sand (Dr 20%)Rubber sheet Toyoura sand (Dr = 60%)
Case 11 Gravelly sandCase A
ManholePipe
40
Case B
Dr = 61%
Plan
75 100 75
Coloredsand
250(cm)
15 15
5
60
504010
60 30 30Dr = 92%
70
555 20 2019
30 6819
15 15Toyourasand (water)
(Dr 30%)
Case CFinesilicasand
Dr =91%
Vinylsheet
205
50
7.5
30 50 20 40
1535
1040
1535 30
5050
Case 8
: Ladder foundation: Lattice-shaped foundation: Concrete foundation
FIGURE 21.15 Model of sewer pipes and manholes. (From Koseki, J. et al., Soils Found., 38(3), 75, 1998.)
Fine silica sand
TowadaCity
100908070605040302010
Perc
ent f
iner
by w
eigh
t
00.001 0.01 0.1
Grain size, D (mm)
1 10
Sand as lowerbackfill
Sandy gravelas upper backfill
100
Toyoura sand
Gravelly sand asupper backfill for
Case 11
Model tests
FIGURE 21.16 Gradation curves of backfill and original soil materials employed for model tests. (From Koseki, J. et al., Soils Found., 38(3), 75, 1998.)

470 Disaster Prevention and Mitigation Technologies of Lifelines
The models were subjected to horizontal shaking steps by using 20 or 100 cycles of sinusoidal waves at a frequency of 5 Hz, where the amplitude of input acceleration was increased step by step as listed in Table 21.8.
21.3.1.2 Uplift Behavior of Model Pipe and Response of Surrounding Ground
Figure 21.17 shows a relationship between the cumulative uplift displacement of pipe and input acceleration. It can be seen from Figure 21.17a that, under relatively low levels of input acceleration, the uplift displacements of the model manhole in cases B and C with liquefiable original soil layer were larger than those in case A with less liquefiable original soil layer. At the last shaking step, on the other hand, the uplift displacement of the model manhole in case A increased significantly, and its cumulative uplift displacement became larger than those in cases B and C. A similar trend of behavior can also be seen from Figure 21.17b, where the uplift displacements of the model pipe were larger in cases 9–11 with liquefiable original soil layer than in cases 12–14 with less liquefiable
TABLE 21.8 Test Conditions on Model Pipes and Manholes
Input Accelerationa Case Model Foundation Dr of Original Soil (%)
166, 212, 262, 310, 407 gal 7 Pipe Ladder 918 ConcreteA Manhole + pipe LatticeB Lattice 60–61C Latticeb
200, 306, 410 gal 9 Pipe —10 Ladder11 —c
12 — 9813 Ladder14 —d
Source: Koseki, J. et al., Soils Found., 38(3), 75, 1998.a 5 Hz, 20 cycles (100 cycles in the last shaking step).b With dense original soil (Dr = 92%) below foundation.c With upper half of backfill made of sandy gravel.d With extended backfill region in vertical direction.
Case ACase BCase CCase 7Case 8
0
Cum
ulat
ive u
plift
of m
odel
man
hole
and
pipe
(mm
)
0
20
40
60
80
100
100 200(a) Input acceleration (gal)
300 400 500 100Cum
ulat
ive u
plift
of m
odel
pip
e (m
m)
0
20
40
60
80
100
120
200
Input acceleration (gal)
(20)(20)(20)
(20)
(Number of cycles)(20)
(100)
(b)
(20)(100)
(Number of cycles)
300 400 500
Case 9Case 10Case 11Case 12Case 13Case 14
FIGURE 21.17 Relationship between uplift of pipe and manhole and input acceleration: (a) Cases A, B, C, 7, and 8 and (b) Cases 9 through 14. (From Koseki, J. et al., Soils Found., 38(3), 75, 1998.)

471Sewerage System: Mitigation Technologies
original soil layer, while at the last shaking step, the latter cases exhibited more extensive uplift than the former cases.
Figure 21.18 shows time histories of response acceleration of the model pipe in cases 9–14 at the last shaking step with an input acceleration of about 400 gal. In cases 9–11 with liquefiable original soil layer, the response acceleration of the model pipe was decreased significantly by the occurrence of liquefaction, while in cases 12–14 with less liquefiable original soil layer, such de-amplification was not observed. In the former cases, both of the original soil and backfill layers liquefied, inducing a kind of base isolation effect at large levels of input acceleration. In the latter cases, on the other hand, the lique-fied backfill layer was subjected to cyclic shear deformation even at large levels of input acceleration, following the response of the nonliquefied original soil layer.
Figure 21.19 shows time histories of response acceleration of the original soil layer in cases 9–14 at the last shaking step. Not only the model pipe but also the original soil layer exhibited different response characteristics, which affected different performances of the model pipe in terms of the uplift displacements as mentioned earlier. Figure 21.20 summarizes how the response characteristics of the original soil layer in cases 9–10 were different from those in cases 12–14 from the first shaking step to the last.
It can be also seen from Figure 21.17a that, in cases 7 and 8, the uplift displacement of the model pipe was to a limited extent even at the last shaking step. Rather, slight settlement of the model pipe was observed in case 8 due possibly to the effects of concrete foundation that was glued to the model pipe, inducing their apparent unit weight, which was larger than that of the backfill soil. The testing conditions of case 7 with ladder foundation were similar to those of case 13, while the cumulative uplift displacements of the model pipe were different from each other by a factor of 10 or even larger. Such different performances may be affected by different degrees of densification of the backfill soil due to the previous shaking histories and the existence of the impermeable sheet at the bottom of the backfill in case 13 that may have increased the extent of the backfill liquefaction.
When the test results in cases 7 and A that were conducted under otherwise similar condition are compared (Figure 21.17a), the model manhole exhibited larger uplift displacement than the model pipe. This is not consistent with the field observation made after the 1993 Kushiro-Oki earthquake as has been described in Section 21.1.1. In the model tests, the ground water table was at the ground surface, while it was not the case in the earlier case history. Existence of partially saturated zone near the ground
(gal)
1000
0–1000
1000
Case 9
Case 10
Case 11
(gal)
Case 12
Case 13
Case 14
(accelerometer tilted)
0–1000
1000
0
0 10Time (s) Time (s)
20 0 10 20–1000
1000
0–1000
1000
0–1000
1000
0–1000
FIGURE 21.18 Time histories of response acceleration of model pipe. (From Koseki, J. et al., Soils Found., 38(3), 75, 1998.)

472 Disaster Prevention and Mitigation Technologies of Lifelines
surface that does not liquefy seems to reduce the uplift displacement of manhole by mobilizing frictional resistance, while it may not affect the uplift behavior of pipe as long as the pipe does not uplift into the partially saturated zone.
Figure 21.21 shows the residual deformation of the backfill that was observed after the final shaking step. In cases 9–11 with liquefiable original soil layer, not only the backfill but also the surrounding original soil layer deformed, and the original soil layer underwent larger extent of settlement at the surface than the backfill. In cases 12–14 with less liquefiable original soil layer, on the other hand, only the backfill deformed, which underwent larger extent of surface settlement as well. The latter trend of behavior is consistent with the observation made on the uplifted sewer pipes in Towada city by the 1994 Sanriku-Haruka-Oki earthquake (refer to Section 21.1.3). In addition, such different trends of behav-ior in terms of surface settlements may be used to detect whether or not the original soil layer lique-fied. In cases with manholes with liquefiable original soil layer, the backfill may undergo larger surface
: Case 9: Case 10: Case 11
1000
1
2
3
4
5
200
Max
imum
resp
onse
acce
lera
tion
in o
rigin
al so
il (a
t dep
th o
f 40
cm)
norm
aliz
ed b
y inp
ut ac
cele
ratio
n
300
(20) (20)
(Number of cycles)
(100)
Input acceleration (gal)400 500
: Cases 12 and 13: Cases 13 and 14
FIGURE 21.20 Change in response characteristics of original soil layer with input acceleration. (From Koseki, J. et al., Soils Found., 38(3), 75, 1998.)
(gal)2000
500In-between cases 12 and 13
In-between cases 13 and 14
0
–500
0 10Time (s)
20
0 10Time (s)
20
500
0
–500
0
–2000 Case 9
Case 10
Case 11
2000
0
–2000
2000
0
–2000
(gal)
FIGURE 21.19 Time histories of response acceleration of original soil layer. (From Koseki, J. et al., Soils Found., 38(3), 75, 1998.)

473Sewerage System: Mitigation Technologies
settlement than the original soil layer, since the total volume of the manhole that is buried in the backfill will be reduced with the uplift displacement (refer to Section 21.1.2).
In case of manhole models, as typically shown in Photo 21.16, the surrounding ground deformed not only in the transverse section but also in the longitudinal section, where the backfill soil on the side of the pipes that are connected to the manhole moved laterally to the space below the manhole.
21.3.1.3 Safety Factor against Uplift of Model Pipe and its Uplift Displacement
Figure 21.22 shows a relationship between the maximum excess pore water pressure that was measured in the backfill immediately below the model pipe and the input acceleration. In cases 9–11 with liquefi-able original soil layer, from the first shaking step, the maximum excess pore water pressure became equal to or larger than the initial effective overburden stress ʹσv0 that was computed one dimensionally at the centerline of the pipe considering its apparent unit weight. Similar response was observed in the second shaking step in cases 12–14 with less liquefiable original soil layer. Since the initial effec-tive overburden stress at the same depth was larger without the pipe than with the pipe, the values of the maximum excess pore water pressure could become larger than the earlier ʹσv0 value. Under such circumstances, the equilibrium of forces acting on the pipe in the vertical direction could not be main-tained, and thus the pipe started to uplift.
By considering the vertical forces acting on the model pipe as schematically shown in Figure 21.23, the safety factor of the pipe against uplift was defined as shown in the figure and computed based on the measured response. In evaluating the buoyancy force Ud due to excess pore water pressure, the value measured at the bottom of the pipe in the central section was employed. Due to incorrect measurement in case 10, this case was excluded from the evaluation. Since the backfill liquefied fully from the first
Case 9
Backfill
Case 12 Case 13
: Silica sand (#7): ditto (colored): Gravel mat for ladder foundation: Gravelly sand: Model sewer pipe
Case 14
Case 10 Case 11
Original soil : Before shaking: After shaking(Toyoura sand)
FIGURE 21.21 Residual deformation of backfill after final shaking step. (From Koseki, J. et al., Soils Found., 38(3), 75, 1998.)

474 Disaster Prevention and Mitigation Technologies of Lifelines
PHOTO 21.16 Deformation of backfill in longitudinal direction toward bottom of uplifted model manhole. (From Koseki, J. et al., Soils Found., 38(3), 75, 1998.)
: Case 9: Case 10: Case 11
: Case 12: Case 13: Case 14
100
(20)
(20)
(number of cycles)
(100)
σvo¢
0
1
2
3
4
5
200Max
imum
exce
ss p
ore w
ater
pre
ssur
eim
med
iate
ly b
elow
mod
el p
ipe (
kN/m
2 )
300
Input acceleration (gal)
400 500
FIGURE 21.22 Relationship between excess pore water pressure and input acceleration. (From Koseki, J. et al., Soils Found., 38(3), 75, 1998.)

475Sewerage System: Mitigation Technologies
shaking step, the frictional resistance Q mobilized along the vertical interfaces was assumed to be zero. The upward force F due to the seepage effect was not considered, either, based on the measurement of the excess pore water pressures at different depths below the pipe.
Figure 21.24 shows a relationship between the safety factor against uplift and the uplift displacement of the model pipe in cases 9, 11–14. In the first shaking step as shown in Figure 21.24a, the pipes in cases 9 and 10 with liquefiable original soil started to uplift when the safety factor became less than unity. On the other hand, the values of the safety factor did not become less than unity in cases 12–14 with less liquefiable original soil, causing no uplift. In the second shaking step as shown in Figure 21.24b, the values of the safety factor even in cases 12–14 with less liquefiable original soil became less than unity, inducing the uplift of the pipe. Further, in the third shaking step as shown in Figure 21.24c, the pipes underwent extensive uplift displacements exceeding 20 mm. The uplift continued until the safety factor recovered to be larger than unity, due to the dissipation of excess pore water pressure after the shaking. It was followed by slight settlement, which was possibly caused by reconsolidation of the liquefied backfill.
Figure 21.25 shows a relationship for cases 9, 11–14 between the residual uplift measured after each shaking step and the minimum safety factor that was achieved during shaking. When the minimum safety factor became less than unity, the uplift damage was triggered. The residual uplift displacement was, however, not clearly linked to the minimum safety factor. Rather, at similar values of the minimum safety factor, it became larger with increased number of shaking waves. Such trend of behavior can be explained by assuming that the liquefied soil behaves as viscous fluid [32].
21.3.2 effects of countermeasures against Liquefaction on Sewer Pipes
Herein, results from dynamic centrifuge tests on the effects of countermeasures against liquefaction on sewer pipes are briefly introduced [33–36].
21.3.2.1 Drainage Method
In the model tests described in Section 21.3.1, the uplift displacement of the model pipe in case 11, where the upper backfill layer was made using gravelly sand, could be reduced to nearly half as compared to case 9, which was conducted under otherwise similar conditions without using the gravelly sand. On the other hand, another series of model tests revealed that no uplift of the model pipe was induced when the upper backfill layer was made using uniform gravel particles made of crushed stones [1]. These different trends of behavior are possibly caused by the difference in the permeability of the gravelly soils, suggest-ing that due attention shall be paid in using gravelly soils on their permeability.
Assumedvertical slip
surface
Safety factoragainst uplift:
Fs =W + Q
Q/2 Q/2
Us Ud
F
W: Weight of pipe and overburden soilQ: Frictional resistance along slip surfaceUs,Ud: Buoyancy force due to hydrostatic and excess pore pressureF: Upward force due to seepage effect
W
Us + Ud + F
FIGURE 21.23 Vertical forces acting on pipe. (From Koseki, J. et al., Soils Found., 38(3), 75, 1998.)

476 Disaster Prevention and Mitigation Technologies of Lifelines
In order to investigate into the effects of the backfill permeability, a series of dynamic centrifuge tests were conducted [33,34], where the similitude in terms of not only the stress and strain states but also the seepage properties can be satisfied.
Figure 21.26 shows one of the models tested with a geometrical scale of 1/25, on which sinusoidal horizontal shaking with 20 cycles was conducted while applying a centrifugal acceleration of 25 g. The amplitude of the input shaking acceleration was 10 g at a frequency of 25 Hz, which corresponded to 400 gal with a frequency of 1 Hz in prototype scale. By using methyl-cellulose solution as pore fluid, which was 25 times as viscous as water, the similitude in terms of the seepage properties was satisfied.
In modeling the ground around the sewer pipe, the original soil layer was replaced with a synthetic rubber to simulate its cyclic shear deformation during earthquakes, and backfill soils with different permeability were employed to evaluate its effect on the seismic performance of the sewer pipe. As the backfill soils, three types of granular materials made from crushed glass with different grada-tion (2.0–4.75 mm with a mean diameter of 3.4 mm, 0.85–4.75 mm with a mean diameter of 2.0 mm,
At first shaking step
: Case 9: Case 11: Case 12: Case 13: Case 14
: Case 9
Start of
: Case 11: Case 12: Case 13: Case 14
22201816141210
86
Upl
ift o
f mod
el p
ipe (
mm
)
420
–20.8
(a)1.0
Safety factor against uplift, Fs Safety factor against uplift, FsU
plift
of m
odel
pip
e (m
m)
1.2 1.4 1.6 1.8 2.0 0.8(b)
–202468
10121416182022
1.0 1.2 1.4 1.6 1.8 2.0 2.2
(200 cm/s2, 20 cycles)At second shaking step(306 cm/s2, 20 cycles)
Start ofshaking shaking
Safety factor against uplift, Fs0.8
(c)
120110100
(over scale)
908070605040302010
0–10
Upl
ift o
f mod
el p
ipe (
mm
)
1.0 1.2 1.4 1.6 1.8 2.0
At final shaking step(410 cm/s2, 100 cycles)
2.2 2.4 2.6
Start ofshaking
: Case 9: Case 11: Case 12: Case 13: Case 14
FIGURE 21.24 Relationship between safety factor and uplift displacement of model pipe: (a) First shaking step, (b) second shaking step, and (c) third shaking step. (From Koseki, J. et al., Soils Found., 38(3), 75, 1998.)

477Sewerage System: Mitigation Technologies
and 0–4.75 mm with a mean diameter of 1.5 mm) were compacted into a common degree of compaction at 91%, which will be hereafter denoted as glass material 1, 2, and 3, respectively. As the sewer pipe, an acrylic pipe having a diameter of 2.1 cm (52.5 cm in prototype scale) was used, and its apparent unit weight was adjusted to be 5 kN/m3.
Under sinusoidal shaking, as shown in Figure 21.27, sewer pipes backfilled with glass materials 1, 2, and 3 underwent residual uplift displacements of −4, −7, and 2 cm, respectively, where negative values correspond to settlement. This good performance with limited amount of residual uplift displacement may suggest the applicability of these materials in using them as countermeasure against liquefaction of backfill, while one needs to pay attention to the fact that the similitude in terms of grain size was not satisfied in the earlier centrifuge tests. The mean diameters of the glass materials were equivalent to 37–85 mm in prototype, which were too large as compared to the prototype width of the backfill at the side of the sewer pipe that was equal to 500 mm.
In order to reduce the prototype grain size of the backfill, much finer materials were used in the second series of the centrifuge tests with smaller centrifugal acceleration of 15 g, where Toyoura sand
5 Hz sinusoidal excitation: Case 9: Case 11: Case 12: Case 13: Case 14
80
100
60
40
20
0
0.75
Resid
ual u
plift
of m
odel
pip
e (m
m)
1.0
*100 cycles(otherwise 20)
1.25Minimum safety factor against uplift, Fsmin
1.5
FIGURE 21.25 Relationship between minimum safety factor and residual uplift displacement of model pipe. (From Koseki, J. et al., Soils Found., 38(3), 75, 1998.)
DV1
A17
Rubber
P11 P12 P13
Unit in mm (in model scale)800
170Gravel(t = 10 mm) 160 140 14060
A1 60 170
Silica sand (#7)(Dr = 100%)
Centrifugal acceleration: 25 g
160
8010
014
024
0
3030
4030
5060
A18 A19 A20Backfill 1 Backfill 3Backfill 2
DV2 DV3
FIGURE 21.26 Model of sewer pipes in centrifuge. (From Sasaki, T. et al., Centrifuge tests on effects of recycled materials for remedial measures for liquefaction induced damage of pipeline, Proceedings of 42nd Japan National Conference on Geotechnical Engineering, Nagoya, Japan, CD-ROM, 2007 [in Japanese].)

478 Disaster Prevention and Mitigation Technologies of Lifelines
with a mean diameter of 0.18 mm, glass material 4 with a mean diameter of 0.32 mm, and nonplastic silt (called fine sand hereafter) with fines content as large as 97% were employed. By using less viscous pore fluid with viscosity three times as large as that of water, the effects of using finer materials on the seepage properties are compensated.
As a result of the second series of tests, as also shown in Figure 21.27, sewer pipes backfilled with glass material 4 and the fine sand underwent significant residual uplift displacements exceeding 15 cm in prototype scale. Such poor performances can be attributed to less degree of compaction (=85%) in case of the glass material 4 and too small permeability in case the fine sand.
All of the earlier centrifuge test results together with relevant tests are summarized in Figure 21.28, where the residual uplift displacements of the sewer pipe model are plotted versus the permeability of the backfill soil in prototype scale [36]. It can be seen that the uplift displacement depends not only on the permeability of backfill soil but also on its degree of compaction. Under a condition that the degree of compaction is equal to 90%, an approximated curve between the uplift displacement and the backfill permeability could be drawn as shown in the figure. It suggests that sewer pipes may suffer from uplift damage when the backfill permeability is less than about 0.1 cm/s. In adopting the drainage method as a countermeasure against liquefaction-induced uplift of sewer pipes, therefore, the backfill permeability shall be larger than 0.1 cm/s, and it shall be compacted sufficiently to reach the degree of compaction equal to or larger than 90%.
21.3.2.2 Solidification Method
In Figure 21.27, results from dynamic centrifuge tests on model sewer pipes backfilled with a solidified soil are also shown. The solidified soil was prepared by adding incinerated sludge ash and lime to an ordinary waste soil retrieved from an excavation site at a ratio of 70 and 30 kg/m3, respectively [33]. No uplift damage was induced for the two cases with a degree of backfill compaction equal to 90% and 80%.
0.3
0.25
0.2
0.15
0.1
0.05
0
–0.05
–0.1RG
(type 1)RG
(type 2)RG
(type 3)RG
(type 4)
Backfill material
Upl
ift o
f mod
el p
ipe (
m)
Toyourasand
RG: granular materialmade from recycled
glass
Finesand
Mountainsand
Improved(Dc = 90%)
Soils(80%)
FIGURE 21.27 Residual uplift displacement of model pipe. (From Sasaki, T. et al., Centrifuge tests on effects of recycled materials for remedial measures for liquefaction induced damage of pipeline, Proceedings of 42nd Japan National Conference on Geotechnical Engineering, Nagoya, Japan, CD-ROM, 2007 [in Japanese].)

479Sewerage System: Mitigation Technologies
The unconfined compression strength of the solidified backfill for each of the cases was 239 and 66 kPa, satisfying the requirement made in relevant design guideline (=50–100 kPa, refer to Section 21.2.3) [22]. In adopting the solidification method as a countermeasure against liquefaction-induced uplift of sewer pipes, therefore, the strength property of the solidified backfill shall meet this requirement. In addition, due attention shall be also paid not to solidify the backfill too much, since it would reduce the work-ability during future possible re-excavation work.
21.3.2.3 compaction Method
Figure 21.29 shows results from a series of dynamic centrifuge tests on model sewer pipes backfilled with several types of soils that were employed in actual construction works. The degree of backfill
RG: Granular material made from recycled glass
Fine sand(Dc = 87.5%)
RG (type 4)(Dc = 84.6%)
RG (type 3)(Dc = 91.2%)
RG (type 1)(Dc = 91.3%)
RG (type 6)(Dc = 89.9%)
RG (type 5)(Dc = 89.9%)
RG (type 4)(Dc = 89.9%)
Toyoura sand(Dc = 96.6%)
400
300
200
100
0
–100
Upl
ift o
f mod
el p
ipe (
mm
)
Permeability (cm/s)
RG (type 2)(Dc = 91.3%)
0.1 1 100.010.001
FIGURE 21.28 Relationship between residual uplift displacement of model pipe and permeability of backfill in prototype scale. (From Mikami, T. et al., Effects of permeability and compaction degree on performance of back-fill soils as countermeasure against liquefaction, Proceedings of 63rd Annual Conference of Japan Society of Civil Engineers, Section 3, CD-ROM, 2008 [in Japanese].)
Backfill
Model pipe
201816141210
86420
–2–4
75Degree of compaction, Dc (%)
80
Sinusoidal excitation (300 gal)Nara*
Original soil condition*Liquefiable
**Nonliquefiable
Fukuoka 1*Fukuoka 2*Fukuoka 3**Fukuoka 4**
85 90 95 100
Upl
ift o
f mod
el p
ipe (
cm)
(d = 48 mm)
320 120 250 120 120250 320
248
3410
0
Unit in mm (in model scale) Centrifugal acceleration: 10 g
Originalsoil
FIGURE 21.29 Relationship between uplift displacement of model pipe and degree of compaction of backfill. (From Sasaki, T. et al., Civil Eng. J., PWRC, 47(12), 2005 [in Japanese].)

480 Disaster Prevention and Mitigation Technologies of Lifelines
compaction was changed in some cases, and horizontal excitation with 20 cycles of sinusoidal waves at a frequency of 1 Hz and amplitude of 300 gal in prototype scale was conducted under a centrifugal accel-eration of 10 g [35]. Test results on two types of original soil layers, that is, liquefiable and less liquefiable cases, were also compared.
Under the testing conditions adopted earlier, consequently, the model pipe with less liquefiable original soil layer did not suffer from uplift damage, while the model pipe with liquefiable original soil layer underwent uplift damage when the degree of backfill compaction was equal to or smaller than 87%.
Figure 21.30 shows results from another series of dynamic centrifuge tests on model sewer pipes with different original soil conditions under a common backfilling condition using a sandy soil with fines content equal to 10% [35]. The residual uplift displacement was plotted versus the amplitude of shear strain mobilized in the original soil layer, which was evaluated based on image analysis on the data recorded by a high-speed camera during shaking. As a result, the uplift displacement became larger with the increase in the shear strain amplitude of the original soil layer. It was also the case with the decrease in the degree of backfill compaction. For example, with a degree of backfill compaction equal to 90%, no uplift damage was induced under the shear strain amplitude of the original soil layer equal to or smaller than 3%. When the shear strain amplitude exceeded 3%, the uplift displacement started to increase rather rapidly. These trends of behavior suggest that, even when the backfill is compacted into the degree of compaction equal to 90%, it may not be sufficient to prevent the uplift damage in soft original soils such as peat and unconsolidated young clay deposits. Therefore, the relevant design guide-line [22] specifies to pay due attention in constructing sewer pipes by the cut-and-cover method in soft original soils (refer to Section 21.2.3).
21.3.3 effects of countermeasures against Liquefaction on Sewer Manholes
Manholes are one of the important components of the sewer systems constructed by the cut-and-cover method, which have suffered from uplift damage in past earthquakes in Japan (refer to the case histories described in Section 21.1).
In order to prevent or reduce uplift damage of sewer manholes, several attempts have been made by not only using the countermeasures against backfill liquefaction [37] (as described in Section 21.2.3) but also adopting special measures not to induce the uplift even after the back liquefaction.
Shear strain amplitude of original soil (%)0 2 4 6 8
Upl
ift o
f mod
el p
ipe (
m)
Backfill
Dc=70%Dc=80%Dc=90%
Original soilsand/rubber
0.00
0.25
0.50
0.75
1.00
FIGURE 21.30 Relationship between uplift displacement of model pipe and shear strain amplitude of original soil layer. (From Sasaki, T. et al., Civil Eng. J., PWRC, 47(12), 2005 [in Japanese].)

481Sewerage System: Mitigation Technologies
Figure 21.31 shows, for example, the test models on a measure to resist against the uplifting force by attaching concrete blocks in a hollow cylindrical shape around the top part of the manhole [38], which were subjected to horizontal excitation using 20 cycles of sinusoidal waves at a frequency of 2 Hz under a normal gravity field. They were prepared in a simple shear box at a geometrical scale of 1/10. The origi-nal soil layer was modeled by a clayey soil, and Toyoura sand at a relative density of 40% and a gravelly soil made from crushed stones were used as the lower and upper backfill layers, respectively. Table 21.9 summarizes the test conditions. The apparent unit weight of the model manhole was adjusted to be 8.6 or 9.1 kN/m3, and the ground water table was set at a depth of 100 mm below the surface.
Figure 21.32 shows a relationship between the cumulative uplift of the model manhole and the input acceleration. In case 1 with relatively deep backfill, the model manhole without the measure uplifted largely at the shaking step of 100 gal, while no uplift was induced with the model manhole with the measure. In cases 2-1 and 2-2 with relatively shallow backfill, the model manhole without the measure underwent gradual uplift with the increase in the input acceleration, while the one without it exhibited a tendency to settle down slightly.
The different performances given earlier were consistent with the corresponding safety factors that were computed by assuming that the backfill soil below the ground water table liquefied completely.
Withoutcountermeasure
Gravel
50
Clay
100
540~440
100 Sand 100
1200
1000
(unit in mm)
Sand
Gravel
Withcountermeasure
FIGURE 21.31 Model of sewer manholes. (From Yasuda, S. et al., Shaking table tests to demonstrate the effec-tiveness of a measure with a concrete ring to prevent liquefaction-induced uplift of a manhole, Proceedings of 42nd Japan National Conference on Geotechnical Engineering, Nagoya, Japan, CD-ROM, 2007 [in Japanese].)
TABLE 21.9 Test Conditions on Model Manholes
Case* Depth of Manhole (mm) Ground Thickness (mm) Depth of Backfill (mm)
1 440 540 5402-1 340 440 4402-2 340 540 440
Source: Yasuda, S. et al., Shaking table tests to demonstrate the effectiveness of a measure with a concrete ring to prevent liquefaction-induced uplift of a manhole, Proceedings of 42nd Japan National Conference on Geotechnical Engineering, Nagoya, Japan, CD-ROM, 2007 (in Japanese).
*Excitation by sinusoidal waves (2 Hz, 20 cycles).

482 Disaster Prevention and Mitigation Technologies of Lifelines
The safety factors of the model manholes without the measure were in the range of 0.45–0.48, while those of the model manholes with it were in the range of 1.04–1.28, which took into account the over-burden load exerted from the upper backfill gravelly soil above the concrete blocks.
21.3.4 Summary of Lessons Learned from Model tests
The lessons learned from model tests on uplift behavior of sewer pipes and manholes and effects of mea-sures against the uplift damage can be summarized as follows:
1. The uplift damage is induced by the movement of liquefied backfill toward the bottom of sewer pipes and manholes. During the process of uplift, the safety factor against uplift that was computed based on the force equilibrium in the vertical direction remains to be less than unity.
2. When the original soil layer liquefies, its surface as well as the surface of the liquefied backfill undergoes residual settlement. When it does not liquefy, on the other hand, only the surface of the liquefied backfill suffers from settlement. In the latter case, the uplift displacement starts to accumulate rapidly after the earthquake excitation exceeds a certain limit level.
3. Effects of several measures against the uplift damage have been confirmed based on model tests, which include the countermeasures against backfill liquefaction using drainage, solidification, or compaction method, and the measures to prevent the uplift or reduce the uplift displacement even after the backfill liquefaction.
References
1. Japan Sewage Works Association, Manual for aseismic measures of sewerage systems (1997 ver-sion), pp. 280–308, 1997 (in Japanese).
2. Public Works Research Institute, Survey of damage to sewerage systems induced by the 1983 Nihonkai-Chubu earthquake (part 2), Technical Note of PWRI, No. 2237, 76pp, 1985 (in Japanese).
3. Japanese Geotechnical Society, Report on damage induced by the 1993 Hokkaido-Nansei-Oki earthquake, pp. 379–393, 1997 (in Japanese).
4. Tohda, J., Yoshimura, H., and Li, L., Characteristic features of damage to the public sewerage sys-tems in the Hanshin area, Special Issue of Soils and Foundations, 1, 335–347, 1996.
5. Public Works Research Institute, Survey report of damage induced by the 1995 Hyogoken-Nanbu earthquake, Report of PWRI, No. 196, pp. 405–423, 1996 (in Japanese).
Input acceleration (gal)100
150
100
50Cu
mul
ativ
e upl
ift (m
m)
0
150 200
Case 1 (without countermeasure)Case 1 (with)Case 2-1 (without)Case 2-1 (with)Case 2-2 (without)Case 2-2 (with)
FIGURE 21.32 Relationship between uplift displacement of model manhole and input acceleration. (From Yasuda, S. et al., Shaking table tests to demonstrate the effectiveness of a measure with a concrete ring to prevent liquefaction-induced uplift of a manhole, Proceedings of 42nd Japan National Conference on Geotechnical Engineering, Nagoya, Japan, CD-ROM, 2007 [in Japanese].)

483Sewerage System: Mitigation Technologies
6. Japanese Geotechnical Society, Report on damage induced by the 1995 great Hanshin-Awaji earth-quake disaster (commentary), pp. 365–374, 2006 (in Japanese).
7. Sasaki, T., Sugita, H., and Mizuhashi, M., Damage to sewer pipes during the 2007 Noto-Hanto earthquake, Proceedings of 43rd Japan National Conference on Geotechnical Engineering, CD-ROM, Hiroshima, Japan, pp. 1679–1680, 2008 (in Japanese).
8. Koseki, J., Matsuo, O., Sasaki, T., Saito, K., and Yamashita, M., Damage to sewer pipes during the 1993 Kushiro-Oki and the 1994 Hokkaido-Toho-Oki earthquakes, Soils and Foundations, 40(1), 99–111, 2000.
9. Koseki, J., Matsuo, O., Ninomiya, Y., and Yoshida, Y., Uplift of sewer manholes during the 1993 Kushiro-Oki earthquake, Soils and Foundations, 37(1), 109–121, 1997.
10. Public Works Research Institute, Survey of damage to sewer pipe systems induced by the 1994 Hokkaido-Toho-Oki earthquake, Technical Note of PWRI, No. 3628, 58pp, 2000 (in Japanese).
11. Japanese Geotechnical Society, Report on damage induced by the 1994 Sanriku-Haruka-Oki earth-quake, pp. 199–212, 1996 (in Japanese).
12. National Institute for Land and Infrastructure Management, Field survey report on damage induced by the 2003 Tokachi-Oki earthquake, pp. 38–46, 2004 (in Japanese).
13. Japanese Geotechnical Society, Report on damage induced by the 2003 Tokachi-Oki earthquake, pp. 111–120, 2004 (in Japanese).
14. Ministry of Land, Infrastructure, Transport and Tourism, Committee report on aseismic measures of sewerage systems—Summary of damage induced by the 2004 Niigataken-Chuetsu earthquake and proposals on future aseismic measures, http://www.mlit.go.jp/kisha/kisha05/04/040826_.html (accessed on June 4, 2013), pp. I-6–I-20, 2005 (in Japanese).
15. Japan Society of Civil Engineers, Survey report of damage induced by the 2004 Niigataken-Chuetsu earthquake, CD-ROM, 2006 (in Japanese).
16. Yasuda, S., Damage to lifeline system and concept of its rehabilitation, The Foundation Engineering and Equipment (Kisoko), 33(10), 53–57, 2005 (in Japanese).
17. Japanese Geotechnical Society, Committee report on damage survey induced by the 2004 Niigataken-Chuetsu earthquake, pp. 111–120, 2007 (in Japanese).
18. Japan Society of Civil Engineers, Project report of “Earthquake damage in active-folding areas: Creation of a comprehensive data archive for remedial measures for civil-infrastructure systems” (2007 version), http://active-folding.iis.u-tokyo.ac.jp/ (accessed on June 3, 2013), 2007.
19. Ministry of Land, Infrastructure, Transport and Tourism, Committee report on aseismic measures of sewerage systems—Summary of damage induced by the 2007 Noto-Hanto and Niigataken-Chuetsu-Oki earthquakes and concepts for maintaining sustainable sewage service, http://www.mlit.go.jp/common/000026846.pdf (accessed on June 4, 2013), 2008 (in Japanese).
20. Sasaki, T., Matsuo, O., and Sugita, H., Rehabilitation of sewage facilities damaged by earthquake, The Foundation Engineering and Equipment (Kisoko), 36(9), 25–28, 2008 (in Japanese).
21. Ministry of Land, Infrastructure, Transport and Tourism, Committee report on the measures for sewage works against earthquake and tsunami, http://www.mlit.go.jp/mizukokudo/sewerage/crd_sewerage_tk_000170–1.html (accessed on June 4, 2013), 2012 (in Japanese).
22. Japan Sewage Works Association, Guideline for aseismic measures of sewage facilities (2006 version), pp. 144–145, 2006 (in Japanese).
23. Japan Sewage Works Association, Manual for aseismic measures of sewerage systems (2006 version), 2006 (in Japanese).
24. Japan Sewage Works Association, Draft of seismic design procedures for renewed pipes and design examples, 2008 (in Japanese).
25. Ministry of Land, Infrastructure, Transport and Tourism, Handbook for Planning of Projects to Promote Aseismic Measures at Emergency Stage, http://www.mlit.go.jp/crd/city/sewerage/info/jisin/060428.html (accessed on June 4, 2013), 2006 (in Japanese).

484 Disaster Prevention and Mitigation Technologies of Lifelines
26. Japan Sewage Works Association, Regulations to implement mutual assistance of sewage works dur-ing disasters, http://www.jswa.jp/saigai/pdf/all/all_rule_h24.pdf (accessed on June 4, 2013), 2012 (in Japanese).
27. Ministry of Land, Infrastructure, Transport and Tourism, Committee report on “Manual for estima-tion procedures of damage induced by large earthquakes and utilization of the estimated results,” http://www.mlit.go.jp/crd/city/sewerage/info/jisin/061113/00.pdf (accessed on June 4, 2013), 2006 (in Japanese).
28. Japan Road Association, Specifications of highway design (part V, seismic design), 2002 (in Japanese).
29. Koseki, J., Matsuo, O., and Koga, Y., Uplift behavior of underground structures caused by liquefac-tion of surrounding soil during earthquake, Soils and Foundations, 37(1), 97–108, 1997.
30. Koseki, J. and Matsuo, O., Liquefaction-induced uplift damage of sewer pipes during earthquakes, Proceedings of 44th Geotechnical Engineering Symposium, Japanese Geotechnical Society, Tokyo, Japan, pp. 287–296, 1999 (in Japanese).
31. Koseki, J., Matsuo, O., and Tanaka, S., Uplift of sewer pipes caused by earthquake-induced liquefac-tion of surrounding soil, Soils and Foundations, 38(3), 75–87, 1998.
32. Sasaki, T. and Tamura, K., Study on evaluation procedures of uplift displacement of underground structures, Proceedings of 11th Japan Earthquake Engineering Symposium, Tokyo, Japan, CD-ROM, pp. 1065–1070, 2002 (in Japanese).
33. Sasaki, T., Sugita, H., and Mizuhashi, M., Centrifuge tests on effects of recycled materials for reme-dial measures for liquefaction induced damage of pipeline, Proceedings of 42nd Japan National Conference on Geotechnical Engineering, Nagoya, Japan, CD-ROM, pp. 1629–1630, 2007 (in Japanese).
34. Public Works Research Institute, Centrifugal model tests on backfilling of sewer pipes using geo-materials made of recycled glass, Technical Note of PWRI, No. 4110, 2008 (in Japanese).
35. Sasaki, T., Sugita, H., and Ishihara, M., Aseismic measures of sewer pipe facilities, Civil Engineering Journal, PWRC, 47(12), 40–43, 2005 (in Japanese).
36. Mikami, T., Koseki, J., and Sato, T., Effects of permeability and compaction degree on performance of backfill soils as countermeasure against liquefaction, Proceedings of 63rd Annual Conference of Japan Society of Civil Engineers, Section 3, CD-ROM, Sendai, Japan, pp. 83–84, 2008 (in Japanese).
37. Nakano, M., Sasaki, Y., Yoshikawa, M., and Hattori, H., An experimental study on the manhole stabilizing technique against liquefaction, Journal of JSCE, 410, 415–424, 1989 (in Japanese).
38. Yasuda, S., Hara, N., Takigawa, H., Mayuzumi, S., and Inoue, T., Shaking table tests to demonstrate the effectiveness of a measure with a concrete ring to prevent liquefaction-induced uplift of a man-hole, Proceedings of 42nd Japan National Conference on Geotechnical Engineering, Nagoya, Japan, CD-ROM, pp. 1631–1632, 2007 (in Japanese).
485
22.1 Damage to Gas Pipelines due to Past earthquakes
Gas supply is sometimes interrupted following earthquakes in order to avoid subsequent damage to the distribution areas. The damage to gas distribution systems is presented in the following sections.
22.1.1 1995 Southern Hyogo Prefecture earthquake (Hanshin–Awaji Great Disaster)
The 1995 Southern Hyogo Prefecture Earthquake caused severe damage to structures and lifeline sys-tems on Awaji Island, Hyogo Prefecture, and its surrounding areas, as presented in Tables 22.1 and 22.2 [1]. The city of Kobe in particular was heavily damaged due to the earthquake. Figure 22.1 shows a large deformation of a middle-pressure gas line in a liquefied zone. The middle-pressure line fortunately survived in spite of the collapse of Karumo bridge.
All high-pressure gas pipelines survived the 1995 earthquake even in areas where maximum ground acceleration exceeded 400 gal and liquefied areas where sand volcanos, ground fissures, and ground settlement were observed.
A total of 106 pipes and fittings were damaged among the middle-pressure gas distribution network of Osaka Gas Corporation, and most of them experienced damage to dresser joints as shown in Figure 22.2. A total of 14 welded joints with imperfect penetration were damaged as presented in Table 22.3.
22Natural Gas
Distribution System: Mitigation Technologies
22.1 Damage to Gas Pipelines due to Past Earthquakes .....................4851995 Southern Hyogo Prefecture Earthquake (Hanshin–Awaji Great Disaster) • 2007 Niigata–Chuetsu Offshore Earthquake • 2011 Tohoku Earthquake off the Pacific Coast
22.2 Seismic Provision for Gas Pipelines ...............................................490Mitigations against Earthquakes • Countermeasures against Tsunami • Countermeasures to Withstand Earthquakes and Tsunamis
22.3 Emergency Provision for Seismic Integrity of Pipeline ..............492Purpose and Basic Concept of Emergency Provision • Suspension of Gas Supply
22.4 Emergency Provision of Gas Pipelines ..........................................493SI Value and SI Sensor • Judgment Criteria for Suspension of Gas Supply • Lessons Learned from the East Japan Disaster
References ......................................................................................................496
Nobuhisa SuzukiPIN Technologies
Hiroyuki HorikawaJFE Engineering Corporation

486 Disaster Prevention and Mitigation Technologies of Lifelines
Gas pipeline
FIGURE 22.1 Pressure integrity of a medium-pressure gas line was ensured in spite of the collapse of Karumo bridge. (From METI, Report of the seismic provision workshop for gas facilities, pp. 77–84, 118–139, January 1996.)
TABLE 22.2 Damage to Pipeline of Osaka Gas Corporation
Pressure Distribution
Section Number of Service Suspension Areas
Number of Service Continuity Areas
Middle-pressure A Main pipe 33 2Middle-pressure B Main pipe 62 9Low-pressure Main pipe 503 80
Branch pipe 3937 670Service pipe 5309 875External pipe 3178 799Internal pipe 8720 2388
Source: METI, Report of the seismic provision workshop for gas facilities, pp. 77–84, 118–139, January 1996.
TABLE 22.1 1995 Southern Hyogo Prefecture Earthquake
Terms Description
Date January 17, 1995, 5:46 amHypocenter 16 km depth at Hokudan-cho, Tsuna-gun,
Hyogo prefectureMagnitude 7.3Maximum seismic intensity 7 (at Suma-ku and Nagata-ku, Kobe city)Number of seismic suspensions 857,440 customers of Osaka Gas CompanyRecovery period 94 daysManpower of recovery operation Maximum 9,700 in the short term; total
about 720,000 workers
Source: METI, Report of the seismic provision workshop for gas facilities, pp. 77–84, 118–139, January 1996.

487Natural Gas Distribution System: Mitigation Technologies
The abutments of Karumo bridge and the surrounding embankments became severely inclined due to the effect of liquefaction. However, the middle-pressure gas pipeline suspended from the bridge maintained pressure integrity.
The number of damaged low-pressure distribution lines was 26,459 and most of the breaks were found at screw joints. The average number of breaks per kilometer was estimated to be 0.90 in the zones where gas was shut off; however, the number of damaged screw joints was 2.09/km and that of cast iron pipes connected with GM-type joints was 0.06/km. A total of 142 pipes and fittings in the low-pressure gas distribution lines were reported from 12 gas companies other than Osaka Gas Corporation. The number of damaged screw joints was as large as 131; however, plastic pipes fortunately survived the great earthquake.
Joint of holding ring
BoltStopper
Holding ring
Sealing rubber
FIGURE 22.2 Dresser joint.
TABLE 22.3 Uranami Welding and Partial Penetration Welding
General Description Schematic Illustration
Uranami welding
Weld reinforcement built on internal surface full penetration
Outside
Inside
Partial penetration welding
Deposit metal partially fused to based metal and do not reach internal surface
Outside
Inside

488 Disaster Prevention and Mitigation Technologies of Lifelines
22.1.2 2007 niigata–chuetsu offshore earthquake
The 2007 earthquake presented in Table 22.4 caused extensive damage to roads, railways, and power plants in Kashiwazaki city and Kariwa village [3]. It is observed that severe damage in Kashiwazaki city was caused by the strong ground shaking for 1–2 s on the thick alluvial layer. Moreover, liquefaction of sandy soils was seen at the sand hills in the Sabaishi River Basin and near the shore.
The average pipe length per customer of Kashiwazaki city and Kariwa district were 21 and 55 m, respectively, which were long compared to the national average length of 7 m. Hence, the total number of restoration workers was relatively large compared to that in past earthquakes in spite of the small area of suspension as presented in Table 22.4.
This earthquake damaged middle-pressure gas pipelines due to the amplified ground motion in a soft surface layer accumulated above the base rock as presented in Table 22.5. In addition, the damage might have been induced by the sudden change in the thickness of the surface layer and liquefaction of sandy soils.
Upheaval buckling of the 100 mm high-pressure Yoshii-Myohouji gas pipeline shown in Figure 22.3 occurred at two points. The high-pressure gas pipeline transported natural gas from the scattered gas fields in Niigata prefecture. The upheaval buckling occurred along two straight portions longer than 100 m, and the longitudinal compressive stress generated by the seismic excitation was high enough to develop upheaval buckling. On the other hand, the gray cast iron pipes retrofitted by a tube insertion method fortunately survived the earthquake.
TABLE 22.4 2007 Niigata Prefecture Chuetsu Offshore Earthquake
Terms Description
Date July 16, 2007, 10:13 amHypocenter 17 km depth at Niigata prefecture Chuetsu offshore areaMagnitude 6.8Maximum seismic intensity 6+ (at Kashiwazaki city and Nagaoka city)Number of seismic suspensions 34,000 customers of Kashiwazaki cityRecovery period 42 daysManpower of recovery operation Maximum 1,323 in the short term; total about 60,000
workers
Source: METI. Draft report on the seismic provision workshop for gas business and gas distribution system damaged by the Niigata Chuetsu Offshore Earthquake, pp. 3–20, March 2008.
TABLE 22.5 Damage to Pipelines due to the 2007 Niigata Prefecture Chuetsu Offshore Earthquake
Pressure Pipeline Section Number of Damages Remarks
High Trunk line 2 Upheaval bucklingMedium Main pipe 27Low Main pipe 67 Dominated by screw-type damage
Branch pipe 99 Polyethylene pipe is not damaged
Service pipe and external pipe 1636
Internal pipe 1450
Source: METI. Draft report on the seismic provision workshop for gas business and gas distribution system damaged by the Niigata Chuetsu Offshore Earthquake, pp. 3–20, March 2008.

489Natural Gas Distribution System: Mitigation Technologies
Most of the damage to low-pressure gas pipelines occurred in the plains, the mountainous areas, and the boundaries around the sand hills, where the damage was mainly leakage from the broken screw joints. The plastic pipes fortunately survived the earthquake; however, extensive damage to the pipes was reported in the liquefied areas of Matsunami and Hashiba districts. In the same year that the earthquake occurred, a research on upheaval buckling was started by the Ministry of Economy, Trade, and Industry (METI).
22.1.3 2011 tohoku earthquake off the Pacific coast
The 2011 Tohoku earthquake claimed the largest number of lives since 1950 for a natural disaster in Japan due to the strong ground shaking and the tsunami caused thereby [4]. The magnitude of the earth-quake, the height of the tsunami, the areas invaded by the tsunami, the magnitude of ground settlement destruction, the loss of lives, and the damage to structures were far beyond prediction.
Date: March 11, 2011, 14:46 Hypocenter: 38.1°N′, 142.9°E′ Depth of hypocenter: 24 km Moment magnitude: 9.0 Maximum seismic intensity: 7 Maximum height of tsunamis: 9.3 m
22.1.3.1 Damage to Gas Pipelines
22.1.3.1.1 Damage to High-Pressure Gas PipelinesSome parts of high-pressure gas pipelines that were 950 km long experienced strong ground shaking with a seismic intensity of 5 or more; however, they could survive the strong ground shaking.
22.1.3.1.2 Middle-Pressure Gas PipelinesThe middle-pressure gas pipelines with a total length of 12,500 km experienced strong ground shaking with a seismic intensity of 5 or more. Damage to the pipelines was reported at 22 locations, among which 13 were leakages from flange joints and 4 were damage to the girth weld that had imperfect penetra-tion. Other damage to 2 m pipes and a flexible pipe was reported; however, there was no damage to the pipelines due to liquefaction.
Gas pipelines connected to the gas-generating plants were not damaged during the earthquake and continued to convey natural gas to the power plant even after undergoing strong ground shaking with an intensity of 400 gal.
FIGURE 22.3 Damage to high-pressure pipeline (Chuetsu offshore earthquake). (From METI. Draft report on the seismic provision workshop for gas business and gas distribution system damaged by the Niigata Chuetsu Offshore Earthquake, P. 162, March 2008.)

490 Disaster Prevention and Mitigation Technologies of Lifelines
22.1.3.1.3 Low-Pressure Gas PipelinesThere were low-pressure gas pipelines with a total length of 83,000 km in the distribution areas that experienced strong ground shaking with a seismic intensity of 5 or more. The pipelines suffered from ground shaking and damage was reported at 773 locations. Moreover, damage to 7132 pipes was reported within the housing estate of customers.
Plastic pipes were damaged at two locations. One was local deformation at a T junction that was caused by insufficient fusion bonding of the joint. The other failure was at a connection between a plastic pipe and a steel pipe which might not have had enough flexibility to withstand the ground deformation. The low-pressure pipes were damaged at 103 locations among which the slip-out resistant mechanical joints were broken at 79 locations.
22.2 Seismic Provision for Gas Pipelines
22.2.1 Mitigations against earthquakes
Gas facilities are currently classified into two groups and have been required to provide sufficient seis-mic integrity in compliance with the Basic Disaster Prevention Plan amended in July 1995. Facility group 1 includes liquefied natural gas (LNG) tanks and high-pressure gas pipelines, which should pro-vide seismic integrity to continue with operations during small and medium-level earthquakes and should withstand high-level earthquakes without affecting the surrounding structures and without loss of lives. Facility group 2 includes all the facilities except those included in Facility group 1 and they should provide sufficient seismic integrity to resume operations immediately after small and medium-level earthquakes and ensure basic function employing a backup system and the redundancy after high-level earthquakes (Table 22.6).
22.2.2 countermeasures against tsunami
The Basic Disaster Prevention Plan, which was issued by the Central Disaster Prevention Council in accordance with the Disaster Prevention Fundamental Law, was amended in December 2011 and requires effective countermeasures to prevent damage from tsunamis.
22.2.2.1 Requirements of the Basic Disaster Prevention Plan
The amended Basic Disaster Prevention Plan focuses on “Construction of Tsunami-Resistant Cities” and requires that lifeline facilities be provided proper mitigation against tsunamis in order to reduce the effect on and damage to the people. The mitigation can be prepared with redundancy of lifeline systems
TABLE 22.6 Required Performances of Gas Supply Facilities against Earthquake Based on the Basic Disaster Prevention Plan
Ground Motion Level A Ground Motion Level B
Facility classification 1
Damage with large consequence
(e.g., tank, high-pressure pipeline, etc.)
Subsequent damage should be prevented
No functional loss and possible to resume operation
Subsequent damage should be prevented
Leakage or collapse resulting in injury and casualty should be prevented
Facility classification 2
Other facilities(e.g., gas generator,
low-pressure pipeline, etc.)
Subsequent damage should be prevented
No or small functional loss, and main functions are sustained
Subsequent damage should be prevented
Damage should be minimized when facility function is lost
Level A: General seismic wave; one or two occurrences during the whole service period.Level B: Strong seismic wave; very low probability of occurrence during the whole service period.
491Natural Gas Distribution System: Mitigation Technologies
and decentralization of key stations and preparedness of backup systems. Damage to facilities induced by tsunami should be simulated to take into account the results and build mitigation measures for the respective facilities and provide effective recovery systems after a disaster.
22.2.2.2 classification of tsunamis in Accordance with the Basic Disaster Prevention Plan
The new Basic Disaster Prevention Plan classifies tsunamis into two design levels and presents proper countermeasures based on the lessons learned from the massive tsunamis caused by the 2011 Tohoku earthquake (Table 22.7).
22.2.2.3 Application to Gas Facilities
The height of a tsunami that should be considered for structural design has not been determined yet; however, the basic concept of the countermeasures against tsunamis in accordance with the Basic Disaster Prevention Plan is described in Table 22.8.
22.2.3 countermeasures to Withstand earthquakes and tsunamis
Most of the damage to low-pressure gas pipelines during the 2011 Tohoku earthquake was due to breaking of screw joints and slip-out of mechanical joints, similar to that observed after previous earthquakes. The seismic integrity of low-pressure pipelines should be improved using plastic pipes. Effective mitigation for pipes against tsunamis should comprise prevention from floating objects. Plastic pipes were damaged at seven locations due to slope failure and two locations due to other effects. Emergency measures should be employed taking into account the survey results, which may clarify the location of possible slope failures.
TABLE 22.7 Fundamental Concept for Countermeasures against Tsunamis in Compliance with the Basic Disaster Prevention Plan
Class A Class B
Magnitude of tsunami
High probability with low tsunami wave height
Low probability with high tsunami wave height, which results in severe damage
Countermeasures Improvement of shore facilities to prevent loss of life, to protect personal properties, to sustain economic activity, to keep production site
Loss of life should be prevented preferentially.Integrated countermeasures with a focus on escape from tsunami.
• Careful consideration of disaster prevention method• Facility improvement• Improvement of refuge area, escape way, etc.
TABLE 22.8 Required Performances for Gas Facilities to Withstand Tsunamis in Compliance with the Basic Disaster Prevention Plan
Class A Class B
Facility classification 1
Damage with large consequence
(e.g., tank, high-pressure pipeline, etc.)
Subsequent damage should be prevented
Severe functional loss should be prevented
Subsequent damage should be prevented
Multiplying systems, separating facility bases, and alternatives should be prepared against functional lossFacility
classification 2Other facilities(e.g., gas generator,
low-pressure pipeline, etc.)
Subsequent damage should be prevented
Functional loss should be prevented as much as possible

492 Disaster Prevention and Mitigation Technologies of Lifelines
22.3 emergency Provision for Seismic integrity of Pipeline
22.3.1 Purpose and Basic concept of emergency Provision
The purpose of establishing an emergency provision to ensure seismic integrity of pipelines is to prevent any subsequent damage caused by leaking natural gas. Installing a microcomputer meter with every customer, segmentation of the gas distribution systems, setting seismometers to monitor the ground shaking, and placing emergency valves are all effective measures to reduce secondary or subsequent damage to customers and other facilities located near the gas distribution systems.
22.3.2 Suspension of Gas Supply
22.3.2.1 Block Segmentation and Suspension of Gas Supply
Natural gas supply to customers should be suspended quickly in case a number of gas leakages are discovered after an earthquake and the gas company is not able to repair the leakages with their own emergency crews. The suspended area of gas distribution should be localized and isolated and the resto-ration work should start immediately after an earthquake. Therefore, the distribution networks should be segmented into some small blocks as presented in Figure 22.4. In case serious damage to the distribu-tion lines is reported, the small blocks should be isolated in order to prevent any subsequent damage to the customers and the surrounding structures.
The distribution lines should be segmented into several blocks and some of these may consist of only low-pressure distribution lines while others may be a combination of low- and middle-pressure distri-bution lines. Most of the damage may occur in the old low-pressure gas distribution lines; therefore, the low-pressure lines should be segmented into several blocks. The block formation is required so that gas flow into a block can be terminated and, simultaneously, gas flow into a block from adjacent blocks can be prevented.
A low-pressure governor will be the gas supply source to a block that consists of low-pressure lines. On the other hand, in case a block contains low- and middle-pressure lines, a governor or a gas produc-tion facility operated with middle-pressure may be the gas supply source.
Emergency shutdown systems should be installed in the governor stations and production facilities in order to cease the operation of the gas sources. The shutdown systems can be operated manually, by a telemeter-controlled system, or by a seismometer-linked automatic operation system. The threshold to activate the system to terminate gas supply depends on gas companies.
Unit block approx. 50 km2Gas leakage block
Governor Governor
Shutdown
Integrated block approx. 200 km2
Medium-pressure pipeline
Low-pressure pipeline Customers Block Seismometer Shutdown valve
Unit block approx. 50 km2
FIGURE 22.4 Example of blocks. (From Japan Gas Association, Guidelines for Seismic Disaster Prevention, pp. 32–39, March 2007.)

493Natural Gas Distribution System: Mitigation Technologies
A boundary valve is installed at a block boundary to quickly shut down flow-in of gas from an adjacent block. Otherwise, emergency cumbersome excavation of the road may be necessary to find the pipe, which is required to shut down the gas flow, and this may waste time. The emergency valve is operated remotely as presented in Figure 22.5; however, valves that do not prevent the usual operation of gas supply can always be closed.
22.4 emergency Provision of Gas Pipelines
1. The network system consists of unit blocks and integrated blocks [5]. 2. The unit block is the minimum frame that covers the unit area of about 50 km2. The integrated
block consists of several unit blocks to terminate the gas supply and covers an area of about 200 km2.
The integrated and unit blocks have been designed for primary and secondary emergency shutdowns, respectively, based on the lessons learned from the 1995 Kobe earthquake [6]. Further lessons learned from the 2004 Niigata–Chuetsu earthquake proved that the unit block could also be effective for the pri-mary emergency shutdown; therefore, the usage of the integrated and unit blocks became almost the same. The integrated block should be shut down when the extent of damage is deemed to be wider than a unit block. This operation should be conducted quickly to minimize any secondary effect to the surrounding structures.
22.4.1 Si Value and Si Sensor
Gas companies have established a new system to terminate the gas supply to blocks conforming to seismic intensity (SI) values. Hence the SI sensors and SI values will be explained before describing the actions taken for suspension of gas supply. The SI value proposed by Housner in 1960 is a signifi-cant parameter to express the relationship between the ground motion and dynamic motion of average buildings and is calculated by Equation 22.1 [7].
SI = ( )∫S h T dTv ,
.
.
0 1
2 5
(22.1)
Valve actuator
Control unit
Valve pit
Pipeline
Boundary valve
Antenna
Antenna pole
FIGURE 22.5 Remote control system of a boundary valve.

494 Disaster Prevention and Mitigation Technologies of Lifelines
Where, Sv, h, and T express spectrum of velocity response, damping factor, and period of seismic wave, respectively and SI value expresses the ground velocity and, therefore, kine (cm/s) is used as the unit. Gas companies must install at least one SI sensor in a large block as shown in Figure 22.6 [5]. SI sensors are generally installed in the headquarters, sales branches, gas production facilities, and gov-ernors. It is recognized that the SI value has good correlation with the seismic intensity as presented in Equation 22.2 [8].
SI = − +10 1 16 0 5. . I (22.2)
where, I expresses the instrumental seismic intensity.The following empirical formula is presented to express the relationship between the SI value and the
peak ground velocity (PGV):
SI = 1.18 × PGV (22.3)
Using this simple relationship, PGV can become an effective indicator to terminate gas distribution; therefore, some companies install a seismometer to measure PGV instead of an SI sensor.
22.4.2 Judgment criteria for Suspension of Gas Supply
There is a two-step decision process to determine suspension of gas supply, based on the primary and secondary judgment criteria [5]. The primary judgment criteria should be applied immediately after an earthquake to prevent subsequent damage to or effects on the environment. The primary judgment criteria depend on the gas companies. The general primary judgment criteria of gas companies for the suspension of gas supply are as follows:
• An SI value of 60 kine and higher is recorded by a seismometer.• An unexpectedly large amount of gas discharge is detected from a production plant or a gas holder.• Pressure fluctuation of a main governor is observed, which results in problems of gas supply.
In case several seismometers are installed in a block, gas companies have to decide in advance how to calculate the average SI value. Gas companies have established a new criterion for the emergency shutdown of gas supply after the 1995 Kobe earthquake where the SI value is the key parameter.
FIGURE 22.6 SI sensor. (From Japan Gas Association, Guidelines for Seismic Disaster Prevention, pp. 32–39, March 2007.)

495Natural Gas Distribution System: Mitigation Technologies
A conservative value of 60 kine was accepted tentatively as the criterion for suspension of gas supply. The validity of the criterion was to be discussed after collecting useful data on the suspension of gas supply [6].
The background of this tentative decision can be explained as follows:
• The seismometers installed in the areas where gas distribution was terminated recorded SI values larger than 80 kine.
• The relationship between the SI value and the damage rate of pipes confirmed that damage occurs at SI values of 30–60 kine.
• Damage tended to increase in cases where the SI value was higher than 80 kine.• Damage was observed in areas with an SI value of 30–60 kine.
Pipeline damage depends on the strength of the pipe; therefore, the decision for the suspension of gas supply should be quickly judged based on the SI value in order to prevent subsequent damage indepen-dent of the actual damage to a gas distribution system.
It was for the first time that six gas companies immediately suspended gas supply using the pri-mary judgment criteria after the 2004 Niigata–Chuetsu earthquake. The primary judgment criteria were determined after the 1995 Hanshin–Awaji disaster and were based on the judgment conducted after the 2004 Niigata–Chuetsu earthquake. These criteria have been recognized to be appropriate for the pri-mary judgment. On the other hand, it has been found that the SI value significantly depends on the site where the SI sensor is placed; therefore, there is high possibility of data scattering between the damage to the pipe and the SI value. Hence, it has been agreed that the primary judgment should be conserva-tively shifted to the secondary judgment in the following two cases where SI values higher than 60 kine are observed but damage may not trigger subsequent effects on the customers and the surrounding structures [9]:
• In the case that a small gas company is able to investigate damage to the gas facilities in the blocks where the SI sensors indicate SI values higher than 60 kine.
• In the case that an SI value higher than 60 kine is observed and the roads and structures have suffered little damage in a block where seismic integrity of the gas distribution lines has been ensured using plastic pipes or other pipes sufficient to survive seismic effects.
Suspension of gas supply was conducted after the 2007 Niigata–Chuetsu offshore earthquake based on the primary judgment criteria and some additional information. The secondary judgment criteria should be applied in a block where SI values higher than 30 kine and less than 60 kine are reported and the following subsequent effects can be anticipated:
• Level of damage to gas supply systems can easily be predicted based on the damage to the road and surrounding structures.
• In case the maximum restoration capacity is not enough to deal with the extent and modes of failure of the pipes that have been informed by emergency calls from customers to notify gas leakage.
22.4.3 Lessons Learned from the east Japan Disaster
A review of the judgment for the suspension of gas supply emergency provision is required to mini-mize damage to facilities and ensure integrity of lives and properties of people. The primary emergency judgment for the suspension of gas supply was conducted promptly compared to action taken after past earthquakes, and this prevented subsequent effects on the surrounding structures. Therefore, it can be said that the judgment was appropriately performed immediately after the earthquake.
The criteria for the primary judgment for the suspension of gas supply was determined according to the Committee Report of Seismic Mitigation Measures published in January 1996. The committee

496 Disaster Prevention and Mitigation Technologies of Lifelines
report requires that gas supply should be suspended when an SI value larger than 60 kine is recorded, or a lot of gas discharge from production plants and supply terminals is found, or unexpected malfunction of a main governor results in the disruption of gas distribution. Gas companies provide the require-ments in their own maintenance rules.
The possibility of subsequent damage is considered to be low in the following two cases in accordance with “the Investigation Report on Seismic Effects on Gas facilities by the 2007 Chuetsu Offshore Earthquake.” The special consideration in the following two cases allows gas companies to directly refer to the criteria of the secondary emergency shutdown skipping the primary emergency shutdown judgment criteria:
1. Minor damage to the roads and the structures is detected within a block where SI values slightly larger than 60 kine are recorded during an earthquake.
2. Damage to the roads and the structures is deemed to be minor in a block where most of the low-pressure gas pipelines have sufficient seismic integrity in spite of observing SI values higher than 60 kine.
Some gas companies witnessed minor damage to their gas supply system in spite of observing SI values higher than 60 kine during the 2011 Tohoku earthquake. Consequently, the gas companies could con-tinue gas supply to the customers based on the secondary judgment, which they are allowed to apply in compliance under the previously mentioned special considerations.
References
1. METI, Report of the seismic provision workshop for gas facilities, pp. 77–84, 118–139, January 1996. 2. METI, Report of the seismic provision council for Niigata–Chuetsu Earthquake, pp. 19–33, July 2005. 3. METI, Draft report on the seismic provision workshop for gas business and gas distribution system
damaged by the Niigata Chuetsu Offshore Earthquake, pp. 3–20, March 2008. 4. METI, Report on disaster prevention methods based on lessons learned from the Great East Japan
Earthquake, 2012. 5. Japan Gas Association, Guidelines for Seismic Disaster Prevention, pp. 32–39, March 2007. 6. METI, Report of seismic provision workshop on gas facilities, pp. 7–37, Gas Business News,
March 1996. 7. Osaki, Y., New Edition of Introduction of Spectral Analysis of Ground Motion, pp. 146–149, Kajima
Publication, Tokyo, Japan, 1994. 8. Tong, H. and Yamazaki, F., Relationship of intensity indexes and JMA intensity, Production Research,
48(11), 31–44, 1966. 9. METI, Report of the seismic provision workshop on the Niigata Chuetsu earthquake, pp. 35–36,
July 2005.

497
23.1 Seismic Damage Reduction technologies for electric Power Systems
23.1.1 Seismic Performance objectives
23.1.1.1 Basic ideas to Maintain Seismic Performance of Structures and Facilities
The basic ideas to maintain the seismic performance of structures and facilities were initiated in the Disaster Management Plans authorized by the Central Disaster Management Council in July 1995, as many structures and facilities suffered from severe damage during the 1995 Hyogoken–Nanbu earth-quake. These ideas are described as follows:
23Electric Power System:
Mitigation Measures
23.1 Seismic Damage Reduction Technologies for Electric Power Systems ...................................................................................497Seismic Performance Objectives • Basic Idea of Restoration Operation
23.2 Seismic Performance of Electric Power Facilities during the 2011 Tohoku Earthquake off the Pacific Coast ......................499Earthquake Damage to Facilities and Prospective Policies for Damage Reduction • Tsunami Damage to Facilities and Prospective Policies for Damage Reduction • Facts and Prospective Policies for Restoration Works
23.3 Earthquake Damage Reduction Measures for Overhead Transmission Facilities ....................................................................501Earthquake Damage to Overhead Transmission Towers • Measures to Maintain Seismic Performance • Response and Restoration Operation
23.4 Earthquake Damage Reduction Measures for Underground Transmission Facilities ...........................................506Earthquake Damage to Underground Transmission Facilities • Measures to Maintain Seismic Performance • Response and Restoration Operation
23.5 Earthquake Damage Reduction Measures for Substation Equipment ..........................................................................................510Earthquake Damage to Substation Equipment • Basic Idea of Aseismic Measures • Examples of Aseismic Measures • Priority Policies for Seismic Strengthening and Replacement of Existing Equipment • Example of Restoration-Supporting Technologies
References ......................................................................................................517
Keizo OhtomoCentral Research Institute of Electric Power Industry
Yoshiharu ShumutaCentral Research Institute of Electric Power Industry

498 Disaster Prevention and Mitigation Technologies of Lifelines
1. Frequent earthquake ground motions that may occur once or twice during the service period of infrastructures as well as rare ground motions with strong tremors caused by a plate or inland earthquakes should be taken into account for seismic designs of structures and facilities.
2. Structures and facilities should be designed to maintain crucial functions during the frequent ground motions and to avoid casualties during the rare ground motions with strong tremors. Maintaining earthquake resistance capacity also includes measures to secure system performance with alternations and redundancies of power grids in addition to earthquake-resistant designs of individual structures or facilities.
23.1.1.2 Basic ideas to Maintain earthquake Resistance
The Agency of Natural Resource and Energy discussed measures to reduce the impact of earthquake disasters on electrical installations by securing power supply during disasters as a lesson learned from the severe damage to substations, transmission lines, and distribution facilities during the 1995 Hyogoken–Nanbu earthquake. As a result, the following policies to maintain seismic performance of electrical instal-lations were released in accordance with the basic ideas discussed in the Disaster Management Plans:
1. Electric power facilities should be operational during the frequent ground motions. 2. System performance of electric power facilities should be achieved with alternations and redun-
dancies of power grids to avoid extensive power loss during the rare ground motions with strong ground shaking.
23.1.2 Basic idea of Restoration operation
Because many electric power transmission and distribution equipments are installed over a wide area, it is difficult to completely prevent damage due to natural disasters. Thus, not only physically strong measures, but also knowledge-oriented measures for reasonable restoration activities are needed. Electric power com-panies have some guidelines including mutual transmission of electric power, as well as human and material resources as designated public cooperation regulated by the “Basic Act on Disaster Control Measures” [1].
So far, many guidelines related to disaster mitigation countermeasures against large-scale disasters have been discussed. Practical and detailed restoration manuals have been prepared for every division of electric power facilities including the thermal plant, substation, transmission line, distribution equip-ment, communication equipment, information process facility, load-dispatching center, power control station, and other facilities used for the service. The logistical support strategies associated with general affairs, announcing to public, customer service, personnel management, accounting, material and fuel securing, community life, and accommodating electric power and resources from other electric power companies have also been discussed [2].
In general, the restoration of electric power transmission and distribution equipment is divided into emergency and permanent restoration. The main purpose of emergency restoration is to restore power. The purpose of permanent restoration is to return damaged facilities to their former physical state before the damage occurred. Because permanent restoration is highly affected by the asset management and maintenance strategy of target facilities, damaged equipment is sometimes replaced to upgrade equipment that has large rate capacity or better earthquake-resistant capacity.
Furthermore, emergency restoration consists of (1) information collection, (2) system switching, and (3) physical repair.
23.1.2.1 information collection
When a natural disaster occurs, the emergency response headquarters are established to collect information on the disaster, including earthquake and weather information, using the radio, telephone, and facsimile. The collected information is immediately transferred to all intra-office facilities. The estab-lished headquarters tries to analyze the disaster information and make decisions for quick restoration.

499Electric Power System: Mitigation Measures
23.1.2.2 System Switching
When power failure occurs in an electric power system due to a natural disaster, the load-dispatching office and load control office try to minimize the power outage areas using system switching. System switching indicates that the damaged substations, as well as the transmission and distribution lines, which are usually used to transfer electric power, are quickly separated from the main electric power system and the lines are changed to transfer electric power as soon as possible based on the network redundancy of the target electric power system.
23.1.2.3 Physical Repair
Based on the restoration guidelines, damaged facilities to be physically repaired are prioritized to mini-mize the negative impact of power failure on customers. The physical restoration is usually prioritized based on the importance of customers. Table 23.1 shows the basic idea of restoration prioritization for every division. For example, the electric power distribution division prioritizes customers with a high public profile including members of the police, fire station, hospital, railway, and news media. If these high-profile customers face power outage, electric power is provided as soon as possible using vehicle-mounted electricity generators as a priority.
23.2 Seismic Performance of electric Power Facilities during the 2011 tohoku earthquake off the Pacific coast
The Mw9.0 Tohoku-oki earthquake of March 11, 2011 (also known as the Great East Japan earthquake) and the Tohoku tsunami inflicted substantial damage on many coastal communities in Japan, including their critical port facilities, residential and commercial buildings, and infrastructure. Electric power
TABLE 23.1 Basic Idea of Restoration Priority of Electric Power Facilities
Facility Name Restoration Priority
Thermal power plant: nuclear power plant
1. Power plant for securing emergency power source in the plant 2. Power plant that has a large influence on the entire electric power system 3. Power plant with substation that directly supplies power to customers 4. Others
Hydropower plant
1. Power plant that has a large influence on the entire electric power system 2. Power plant that causes power outage to customers 3. Power plant whose restoration becomes difficult if it is not restored at the early stage after a disaster 4. Others
Transmission 1. Main transmission lines in which all circuits are damaged 2. Other transmission lines in which all circuits are damaged 3. Main transmission lines in which a part of the circuits is damaged 4. Other transmission lines in which a part of the circuits is damaged
Substation 1. Primary substation 2. Secondary substation 3. Distributing substation
Distribution 1. Distribution facilities to supply power to hospital, transportation, communication, media, water, gas, public institution such as government and municipal offices, safety evacuation area, and other important customer facilities
2. Other distribution facilitiesCommunication 1. Communication facilities for load-dispatching office, control station, monitoring station, and
protecting relay 2. Communication for safeguard circuit
Source: Shumuta, Y. and Tohma, J., Plan for restoring electric power system damaged by earthquake, CRIEPI Research Report, U91063, April 1992 (in Japanese).

500 Disaster Prevention and Mitigation Technologies of Lifelines
facilities suffered extensive damage in the operation areas of Tohoku and Tokyo electric power compa-nies. Major findings and lessons learned from these disasters are described in the following sections.
23.2.1 earthquake Damage to Facilities and Prospective Policies for Damage Reduction
Substation facilities suffered from minor to major damage like oil leaks, loss of body of transformer bushings, porcelain breakages of circuit breakers, and porcelain breakages of disconnecting switches. A fraction of this damage was predominant in 275 and 154 kV-transformers; 275 kV-circuit breakers; and 500, 275, and 154 kV disconnecting switches among other types of equipment. Most of the affected facilities continued to be operational.
With regard to overhead transmission facilities, no steel towers were subjected to seismically induced collapse and/or breakages, which would cause loss of transmission function. In fact, only one steel tower collapsed due to landfill failure surrounding the tower. There was no major damage that led to long hours of power outage.
Underground transmission facilities performed well, with minor damage like dislocation of cables from supporting racks in utility tunnels. No damage related to power disruption was reported.
Seismic performance objectives to be maintained for transmission and substation facilities proved to be valid, since the electric power facilities affected by the earthquake showed good performance. Indeed, power was almost completely restored on March 18 and 19, although about 4.66 and 4.05 mil-lion customers lost power immediately after the earthquake on March 11 in the respective supply areas of Tohoku and Tokyo electric power companies. Lessons learned from the earthquake-induced damage should be employed for the seismic design of newly constructed or replaced facilities to enhance earth-quake resistance of power facilities in the future.
23.2.2 tsunami Damage to Facilities and Prospective Policies for Damage Reduction
Substations located in the coastal area suffered considerable damage such as unusability of facilities due to inundation, loss of partial body of equipment due to inflow of debris nearby structures and vehicles, and washing away of facilities. As for overhead transmission towers, several steel towers aligned along the coastal line collapsed, possibly due to the impact of drifts. Some underground transmission facilities were affected by drift-induced damage of the aboveground facilities.
The Disaster Council stated that tsunami disaster measures should be established based on two types of tsunami hazard: frequent tsunamis with one or two occurrences during the service periods of shore protection facilities and possible massive tsunamis with a rare occurrence rate. It also recommended that the frequent tsunamis should be considered for the design of shore facilities while the possible mas-sive tsunamis should be evaded with evacuation of hazardous areas.
The following basic ideas of antitsunami policies for electric power facilities are laid out for the respective tsunami hazards:
1. Frequent tsunamis: tsunami inundation to customers in residential and industrial areas is expected to be handled by shore protection facilities. In this respect, facilities that may result in serious casualties if they lost their function must be prepared to stay operational even with little mechanical damage to an individual facility.
2. Possible massive tsunamis: It is unrealistic for facilities to withstand possible massive tsunamis in view of engineering and cost aspects. Appropriate measures, localizing structural damage or easing restoration works, are essential to reduce the effects of tsunamis on electric power facilities. Important issues that should be discussed are how structural damage of particular facilities could affect power supply based on damage caused by previous tsunamis and restoration figures from previous earthquakes.

501Electric Power System: Mitigation Measures
23.2.3 Facts and Prospective Policies for Restoration Works
In the operation area of the Tohoku electric power company, about 4.66 million customers lost power supply immediately after the earthquake. Cooperative restoration work with generation, network, and distribution divisions as well as other utilities restored 80% of total power in 3 days and 94% in 8 days after the earthquake. In the supply area of the Tokyo electric power company, power outage extended to 4.05 million customers. Similar to the case of the Tohoku electric company, power was restored to about 600,000 customers the next day and to 7,300 customers 4 days after the earthquake. Finally, power sup-ply returned to its normal state 7 days after the earthquake.
The findings obtained from actual restoration work are as follows:
1. The lessons learned from the Great Hanshin–Awaji earthquake were effectively utilized (i.e., allo-cating 50/60 Hz generation vehicles).
2. Several devices such as usage of mobile, temporary, alternative, and cleaning equipment were employed to promptly restore function of power generation stations.
3. Helicopter patrolling was effective for overhead transmission facilities extending to widely affected areas.
4. Indices of oil leaks and dislocations of transformer bushings helped to judge whether operation was safe or not.
5. Finding the locations of distribution poles on a GPS axis enabled foreign rescue teams to reach the concerned locations promptly.
The following issues were identified to enhance restoration work for any future disaster in electric power companies:
1. Strong ties with other utilities and related bodies should be promoted in coordination with a. Giving emergency gate pass to rescue teams organized by affiliated companies. b. Ensuring vehicle fuel. c. Ensuring industrial water supply. 2. Utilization of satellite images available on the Internet is highly recommended. 3. Private manuals for disaster response should be critically reviewed and revised appropriately for
the purpose of early recovery on a practical basis.
23.3 earthquake Damage Reduction Measures for overhead transmission Facilities
23.3.1 earthquake Damage to overhead transmission towers
Examples of earthquake-induced damage to steel towers like overturning, breakage, tilting, and defor-mation of members are listed in Table 23.2.
TABLE 23.2 Earthquake Damage to Steel Transmission Towers
Earthquake JMA
Magnitude
Number of Damaged Towers
Collapse BreakTilting or Member
Deformation
The 1964 Niigata earthquake M7.5 0 0 63The 1968 Ebino earthquake M6.1 0 0 1The 1968 Tokachi-oki earthquake M7.9 0 0 36The 1978 Izu–Oshima-kinkai earthquake M7.0 0 0 7The 1995 Hyogoken–Nanbu earthquake M7.3 1 0 19The 2000 Tottori earthquake M7.3 0 0 46The 2004 Niigataken–Chuetsu earthquake M6.8 1 0 52

502 Disaster Prevention and Mitigation Technologies of Lifelines
Indirect effects of earthquake ground motions associated with ground deformation such as heaving, subsidence, and ground opening have contributed to this damage. Direct effects of earthquake ground motion, that is, dynamic response, played no role in the superstructure section of steel towers. Another mode of damage, except to a tower body, includes mechanical and electrical power cable damage due to short circuit as a result of large displacement during an earthquake and porcelain damage due to seismic-induced inertial moment. Minor damage like soil disturbance or fissure in the tower yard may also occur during a moderate earthquake.
23.3.2 Measures to Maintain Seismic Performance
23.3.2.1 Design
Steel transmission towers are currently designed to resist wind loads equivalent to mean wind veloci-ties of 40 m/s stipulated in the Technical Standards for Electrical Installations [3] in Japan. The towers are also designed in accordance with two design systems: JEC-127-1965 [4] and JEC-127-1979 [5]. In addition to these design recommendations, utilities practiced reinforcement designs for large transmis-sion towers or towers resting on vulnerable sites for seismic action on an unwitnessed basis with refer-ence to JEC-127-1979. In fact, transmission steel towers designed on the basis of Technical Standards for Electrical Installations are believed to perform well during an earthquake; therefore, earthquake-resistant designs are unnecessary in general, with no documentations of seismic loads available in the Technical Standards for Electrical Installations, JEC-127-1965, and JEC-127-1979.
Earthquake-resistant designs may be applied to steel towers over 100 m in height or to relatively slender shape presumed to be affected by seismic loading on an unwitnessed basis of utility compa-nies. Table 23.3 tabulates earthquake-resistant design methods currently used for transmission steel towers.
23.3.2.2 Apparatus
The basic idea is to strengthen members when earthquake-resistant measures are required for a steel transmission tower. Since major effects of earthquakes on steel transmission towers are ground deforma-tion, construction sites are selected to avoid landslide areas and liquefaction-susceptible areas. Control works and/or prevention works for landslide areas (see Figure 23.1) and mat and lacing foundations (see Figure 23.2) are employed under the restrictions for site selection.
Types of electrical insulator are a suspension insulator (see Figure 23.3), a long rod insulator (see Figure 23.4), and a supporting insulator (see Figure 23.5). Earthquake damage is concentrated on parts of long rod insulators or supporting insulators. This can be explained because a long rod insula-tor is sensitive to seismic-induced moment load due to its rigid structure while a suspension insulator is insensitive to seismic loads with free parts brought about by multiple combined structures. Thus, replacing long rod insulators with suspension insulators improves earthquake resistance of electrical insulators.
Inserting countersunk springs to fasten bolts of supporting insulators enables the structure to absorb and suppress seismic-induced displacement (see Figure 23.5), and this technique may therefore be uti-lized as a measure to prevent damage to supporting insulators.
23.3.3 Response and Restoration operation
In general, a single line disruption (see Figure 23.6) may give trouble like voltage drops. The disruption may be secured by installation of transmission power facilities with redundant and alternative route. Scattered installation of overhead transmission towers also localizes physical damage of facilities during an earthquake. In addition, utilizing a switching operation and temporary restoration work for facilities that have survived restores power within a relatively short time if there has been a certain amount of sustained seismic-induced damage.

503Electric Power System: Mitigation Measures
About 2.6 million customers lost power immediately after the strong ground shaking induced by the 1995 Hyogoken–Nanbu earthquake. A step-by-step switching operation reduced the number of customers affected from 2.6 million to 1.0 million 2 h after the earthquake. It also contributed to rees-tablishing the power supply system, which sends electric power to all the substations about 26 h after the earthquake. This example validates that a switching operation and prompt temporary restoration work are effective to ensure auxiliary power supply routes within a relatively short time. Therefore, the function of a power supply system is well maintained through current maintenance and operation practices.
TABLE 23.3 Earthquake-Resistant Designs for Steel Transmission Towers
Methods of Earthquake-Resistant
Design Description Target
Steel tower Dynamic–seismic coefficient method
Design based on distributed seismic coefficient with respect to height in reflection of dynamic response
General steel towers
Dynamic analysis Time domain analysis: design based on time histories of dynamic response calculated by solving the equation of dynamic force balance under given time history of ground motion
Frequency domain analysis: solving the equation of dynamic force balance in frequency domain under Fourier spectrum of a ground motion
Steel towers with particular structural profile
Steel towers that may be excited by resonance with ground response
Seismic coefficient method
Calculating inertia force multiplied by seismic coefficient and weight of a structure and imposing the force on a structure
Inverse T-type foundationsPile and caisson foundations
resting on good grounds
Foundation Ground deformation method
Calculating ground displacement based on estimated horizontal seismic coefficient and imposing the displacement on a structure via soil springs
Pile and caisson foundations resting on poor grounds
Dynamic analysis The same as for steel towers Foundations resting on weak grounds or steep ridges
Foundations with particular structural profile
Steel towers that may be excited by resonance with steel tower response
Prevention
Sliding surface
FIGURE 23.1 Prevention work for landslide.

504 Disaster Prevention and Mitigation Technologies of Lifelines
Tie beam
FIGURE 23.2 Lacing foundation.
FIGURE 23.3 Suspension insulator.
FIGURE 23.4 Long-rod insulator.

505Electric Power System: Mitigation Measures
Center guide
φ195Installation plate for tower
Flange of supportinginsulator
Installation bolt (M16)
φ155
Flat washerCountersunk spring
Tap washer (B)
Tap washer (C)
Flat washerHard rock nutSplit pin
FIGURE 23.5 Supporting insulator (countersunk spring).
Powerstation
Powerstation
Substation Substation Substation
SubstationSubstation
Distributionsubstation
Distributionsubstation
Distributionsubstation
Route C Route A Route B
First circuit Second circuit
FIGURE 23.6 Redundancy and alternation for power line.

506 Disaster Prevention and Mitigation Technologies of Lifelines
23.4 earthquake Damage Reduction Measures for Underground transmission Facilities
23.4.1 earthquake Damage to Underground transmission Facilities
Table 23.4 tabulates damage descriptions for respective events chronologically from the 1964 Niigata earthquake to the 2005 Fukuokaken-Seihou-oki earthquake. These results indicate that major dam-age to underground transmission facilities is prominent during the 1964 Niigata earthquake and the 1995 Hyogoken–Nanbu earthquake. Findings obtained from the 1995 Hyogoken–Nanbu earthquake are described in the following sections.
The 1995 Hyogoken–Nanbu earthquake (M7.2) caused severe damage to lifeline systems around Kobe-shi like power outages and cutoff of water as well as city gas. It also inflicted soil liquefaction in coastal areas and reclaimed low lands, which caused moderate to major damage to conduits.
The conduit types include an asbestos–cement pipe (AP) wrapped with concrete (see Figure 23.7) and a plastic–fiber pipe (PFP) (see Figure 23.8), showing different earthquake damage modes. The AP con-duits sustained much severe damage like breakage, dislocation, opening of conduit bodies, and influx of soil due to body failure, since it is essentially difficult for them to adapt to seismic-induced ground
TABLE 23.4 Earthquake Damage to Underground Transmission Facilities
Earthquake Description
The 1964 Niigata earthquake • Major damage like breakages and compression failures of conduits due to soil liquefaction
• Disruption of electricity on six routesThe 1968 Tokachi-oki earthquake • Minor damage like separation of mortars on joints of utility tunnelsThe 1978 Off-Miyagi earthquake • Minor damage like hairline cracks of manholesThe 1995 Hyogoken–Nanbu earthquake • Major damage like breakages and compression failures of conduits due
to soil liquefaction• Disruption of electricity on three routes
The 2004 Niigataken–Chuetsu earthquake • Minor damage like cracks on manholes and conduits attached to bridgesThe 2005 Fukuokaken–Seihou-oki
earthquake• Minor damage like cracks and separation on manholes and utility
tunnels
FIGURE 23.7 AP conduit.

507Electric Power System: Mitigation Measures
displacement. On the other hand, the PFP conduits suffered from minor damage, unlike the damage to AP conduits, because they have flexible conduit joints. They, however, suffered from severe damage like pullout of a joint, conduit body breakage, and influx of soil at certain sites where they could not adapt to large differences in settlement arising from soil liquefaction observed in coastal areas and reclaimed lowlands. Typical damage modes are illustrated in Figures 23.9 and 23.10.
Although conduits were severely damaged like breakage, dislocation, and cracks of conduit bodies, the flexibility of power cables helped to stay the damaged conduits with minor problems. As a result, only three underground transmission routes were unable to send power during the earthquake. This finding reveals that structural damage of a conduit has no effect on an electrical accident unless it is caused by large ground deformation induced by soil liquefaction, fault, and ground fissure.
23.4.2 Measures to Maintain Seismic Performance
It is preferable to avoid sites susceptible to ground deformation while selecting underground transmission routes. It is necessary to conform to some measures suitable to soil conditions under the restrictions of route selection. AP conduits wrapped with concrete to reinforce the conduit body were widely employed before the 1980s. PFP conduits with sufficient material strength have been developed and are mainly used for constructing underground transmission facilities. PFP conduits can resist overburden earth pressures without concrete wrapping and some extent of ground displacement with a flexible conduit joint. They will show, therefore, relatively higher earthquake resistance capability against seismic ground motions except for large permanent ground displacement. Thus, employing PFP conduits is the basic measure against an earthquake ground motion. An advanced conduit joint (see Figure 23.11) is also employed to adapt to abrupt ground displacement, which likely occurs in soft ground.
Ground improvement is also preformed to reduce effects of soil liquefaction on underground trans-mission facilities. Gravel drain works constructed with gravel layers that have higher permeability can dissipate excess pore water pressure to suppress soil liquefaction and may be sometimes utilized in con-cerned underground facilities.
FIGURE 23.8 PFP conduit.

508 Disaster Prevention and Mitigation Technologies of Lifelines
23.4.3 Response and Restoration operation
The first step to be executed immediately after an earthquake is to identify locations of accidents along damaged routes. This action is summarized in Table 23.5 for power cables and conduits. In general, it is impossible to assess damage patterns of underground transmission facilities from aboveground inspec-tions. Thus, visible observation inside the manhole and engineered inspection using a television camera are carried out to identify locations and degrees of damage followed by early restoration of temporary
No settlement around former revetment
Settlement 15–20 cm
Concrete-wrapped conduit Traversing former revetment
Crack
Settlement 15–20 cm
Overburden depth 2.0 mbefore earthquake
Reclaim land (weak ground)
Differential movement 14 cm
Concrete-wrapped conduit
Former revetment
FIGURE 23.9 Damage to AP conduit.
FIGURE 23.10 Damage to PFP conduit.

509Electric Power System: Mitigation Measures
power supply and remediation of facilities. Types of remediation are selected in accordance with the degree of damage. Table 23.6 lists representative remediation measures for underground transmission facilities. Naturally, many labors and man-hours are required to repair the damage that has occurred in the facilities. Thus, partial remediation and redrawing of damaged power cables are conducted first, with a priority of temporary power supply. Priority is also given to cases where the damage may affect the power supply to and pose a hazard for third parties.
Manhole
Conduit
FIGURE 23.11 Advanced flexible joint.
TABLE 23.6 Description of Remedial Measures
Target Methods of Repair Description
Cable Partial repair Repair of oil leakage pointsRefixing displaced cables
Re-laying Laying undamaged cables against partial losses, which is impossible to fix using partial repairs
Conduit Repair of inner surface Cutting the inner surface or pasting mending materials without excavation works
Replacement Removing damaged sections of conduits and replacing with new conduits with excavation work
TABLE 23.5 Inspection and Checking Methods to Identify Earthquake Damage to Underground Transmission Facilities
Inspection Method Target Description
Visual inspection along the route from above the ground
Underground facilities
Checking unusual conditions that may affect facilities like road carvings or fissures
Visual observation from a manhole or conduit tunnel
Manholes or conduit tunnels
Cables
Checking partial losses of conduit surfaces like cracks
Checking laying conditionContinuity check using mandrill Conduits Checking blockages inside conduits arising
from influx or differential movementsVisual observation through a television camera Cables Assessing the degree of damage to conduits

510 Disaster Prevention and Mitigation Technologies of Lifelines
23.5 earthquake Damage Reduction Measures for Substation equipment
23.5.1 earthquake Damage to Substation equipment
Past large-scale earthquakes have caused heavy damage to many substation equipment [6,7]. Figure 23.12 shows the classification of four structural types of substation equipment. As for their earthquake-resisting capacity, particular attention should be paid to equipment that is (1) top heavy type and (2) towering type.
Top heavy–type equipment includes equipment with heavy components on its upper part. Towering-type equipment consists of porcelain elements including supporting insulator and insulator pipes. Because these structural types of equipment have natural frequencies within the typical range of the dominant frequency of earthquakes, the seismic damage is concentrated on these types of structures.
Table 23.7 shows the typical seismic damage modes of substation equipment. Seismic damage occurs predominantly to insulator pipes with percolation materials, anchor bolts of transformer, and support-ing structures of equipment. Other seismic damage of substation equipment may be caused by the lead wire’s tension in short wires that are used for electrical connections installed between equipments.
23.5.1.1 causes of equipment Damage
The causes of damage to substation equipment listed in Table 23.7 are summarized as follows:
1. Insufficient strength due to static design instead of dynamic design 2. Insufficient earthquake-resistant guidelines and standards 3. Excessive seismic force on special ground condition 4. Resonance of equipment to seismic ground motion 5. Phenomenon not considered by earthquake-resistant guides such as interference with lead wire
(a)
Line switch2Circuit breakerwith porcelain
1
(b)Transformer2Arrester1
(c)
Tank typeCircuit breaker
2Transformer1
(d)
Aluminum pipebusbar
2Gas insulatedswitch
1
FIGURE 23.12 Classification of structural types of substation equipment: (a) top heavy type; (b) towering type; (c) rigid body + towering type; and (d) framed, long-span type.

511Electric Power System: Mitigation Measures
6. Inappropriate structural design such as space for an anchor section on the foundation 7. Insufficient strength of an anchor bolt 8. Insufficient verification 9. Indirect damage due to land subsidence
23.5.2 Basic idea of Aseismic Measures
In a standard aseismic design concept, it is recommended to raise the natural frequency of the equip-ment to avoid resonance due to the earthquake’s ground motion. However, even if such a measure is adapted, it is difficult to completely prevent the seismic damage because the substation equipment con-sists of vulnerable materials including supporting insulators and insulator pipes for electric insulation. Thus, the following three measures are applied as earthquake-resistant countermeasures for substation equipment [8]:
1. Seismic base isolation: The natural frequency of the equipment is moved to 1 Hz or less by install-ing accumulating rubber or some such material at the bottom of the equipment.
2. Active vibration control: The amplification of the vibration response of the equipment is efficiently reduced by damping the vibration and absorbing the vibration energy by utilizing the swing of the pendulum or adding a tuned mass damper (TMD).
3. Stiffness: In order to move the natural frequency of the equipment to a range that is higher than that of the earthquake’s ground motion, the rigidity of the equipment’s element is increased and the equipment is retrofitted.
Seismic base isolation has seldom been adopted for substation equipment with a connecting lead because the displacement becomes large in the lower frequency range. Few substation equipments use active vibration control because some extra devices such as dampers or other active control devices are
TABLE 23.7 Typical Seismic Damage Modes for Structural Types of Substation Equipment
Structure Type Substation Equipment Damage Mode
1. Top heavy Air circuit breaker Crack, inclination, breakage of insulator pipeLine switch Crack, inclination, breakage of insulatorSwitch Breakage of supporting insulatorReactor Breakage and falling of supporting insulator
2. Towering Arrestor Breakage of insulator pipe and supporting insulatorBushing
3. Rigid + towering Transformer Falling of bushingBreakage of bushingBreakage of connection part of pipeInclination and differential settlement of foundationOil leakage of bushingMovement and breakage of anchor volt
Oil circuit breaker Oil leakage and strike slip of center-clamp bushingDeformation of foundation
Condenser Breakage of supporting insulatorBreakage of anchor volt
4. Framed, long span Aluminum pipe bus bar Crack of joining terminalGas insulated switch Bus falling due to breakage of supporting insulatorBus bar Oil leakage of bushing
Source: Shumuta, Y., J. Jpn. Soc. Civil Eng., 584/I-37, 249, October 1996 (in Japanese).

512 Disaster Prevention and Mitigation Technologies of Lifelines
needed. On the other hand, stiffness of equipment is widely employed because it is technically easy and cost-effective to apply to existing equipment.
23.5.3 examples of Aseismic Measures
Examples of aseismic measures for substation equipment are listed as follows [9].
23.5.3.1 circuit Breaker with Porcelain elements
• Retrofitting by the stay insulator• Replacing supporting insulator by a stronger one• Retrofitting the trestle• Vibration control by a friction dumper
Figures 23.13 and 23.14 demonstrate some examples.
23.5.3.2 Arrester
• Reinforcing the trestle by attaching the brace• Changing to a gapless type (a standard type is installed in a series gap part in the main body of the
arrestor for discharging but this structure is complicated and the total weight becomes heavy; as an alternative, a small light gapless type consisting of zinc oxide may be installed)
• Attaching the top plate to the upper side of the trestle
Figure 23.15 shows some examples.
Friction dumper
FIGURE 23.14 Vibration control by a friction dumper.
Supporting insulator Stay
insulator
Beforeretrofitting
Afterretrofitting
FIGURE 23.13 Reinforcement with stay insulators.

513Electric Power System: Mitigation Measures
23.5.3.3 Line Switch
• Reducing the top weight• Enhancing the rigidity of the supporting insulator• Replacing the supporting insulator by a stronger one• Retrofitting the trestle
23.5.3.4 transformer
• Retrofitting a bushing pocket • Eliminating the gap between the main body and the foundation Figure 23.16 shows an aseismic
measure that can eliminate the gap [10]. In order to avoid the vibration from the transformer to the outer facilities through the concrete foundation or the building foundation, an antivibration rubber is sometimes installed in the gap between the main body and the upper side of the founda-tion. Figure 23.16 also illustrates the damage modes to the transformer including the breakage of bolts and the crack of the concrete foundation caused by the earthquake, in the case where the main body is fixed by the concrete foundation and the bending moment is affected to the target bolt. As an appropriate measure against such damage modes, the gapless design is recommended.
• Installing a gasket cushion in the center clamp-type bushing in order to avoid the deviation from a reference position
The center clamp-type bushing fully charged with oil is usually installed in the circuit breaker and transformer. Oil leakage due to the deviation and the deformation called “Kuchibiraki” was reported due to past earthquakes. As an appropriate measure against oil leakage, the use of a gasket is recom-mended as shown in Figure 23.17 [10].
Anchorbolt Main
body
Antivibration rubberAnchorsocket
Anchor plateWith antivibration
rubberWithout antivibration
rubber
FIGURE 23.16 Aseismic measure for anchor fixation part of a transformer.
Attachment of top plate to upper side of the trestle
Attachment of brace
Before retrofitting
After retrofitting
FIGURE 23.15 Reinforcement of the trestle for an arrestor.

514 Disaster Prevention and Mitigation Technologies of Lifelines
23.5.3.5 connecting Lead
Figure 23.18 shows a connecting lead installed between substation equipment. When two equipments located on both sides of a connecting lead are vibrated with a different phase, it causes excessive tension in the connecting lead. In order to reduce this excessive tension, the following appropriate measures are recommended as the threshold for the marginal length of the connecting lead [11]:
• 1.5 times the displacement of the top part of the equipment caused by the three sinusoidal waves of 0.3 G
• 5% of span length between the equipment and the connecting lead• 70 mm of total length of the connecting lead
23.5.3.6 Foundation
Seismic measures associated with not only the equipment but also the foundation are very important to improve the seismic resisting capacity of substation equipment. The following seismic measures for the foundation are recommended:
Expansion chamberBinding springCenter conductor
Upper insulator Cleat
Condenser
Lower insulator
Upper insulator
Gasket (cushion)
Sleeve �ange
Gasket (seal)
FIGURE 23.17 Example of a center-clamp bushing. (From The Institute of Electrical Engineers of Japan, The Japanese Electronically Committee: Design Standards on Structures for Transmissions JEC-127-1965, 1966.)
Connectinglead
FIGURE 23.18 Connecting lead between substation equipment.

515Electric Power System: Mitigation Measures
• Piling or a plat-like foundation is adapted.• A foundation with heavy-weight upper equipment should be installed on cut soil or original
ground, not on piled soil.• The construction method for the anchor bolt should be changed from a block-out method to a
direct-laying method.
23.5.4 Priority Policies for Seismic Strengthening and Replacement of existing equipment
Substation equipment has a uniform design standard [10] to effect reasonable and quick supply of a large number of equipment in Japan. The seismic design guideline for substation equipment, JEAG 5003, has changed from a static design method (seismic intensity coefficient method) to a dynamic design method (resonance three sinusoidal waves method) since 1980. However, a large number of substation equipment installed before 1980 are still operational although the 1995 Hyogoken–Nanbu earthquake caused significant damage to such old substation equipment [12]. On the basis of this background, technologies that prioritize retrofitting or replacement of such equipment are needed in Japan [13].
Table 23.8 shows four indices to evaluate the seismic performance of substation equipment. These indices were proposed to determine the priority of substation equipment to be retrofitted. Level 1 is a deterministic proof stress evaluation index. To estimate the generated bending moment, a seismic force based on an earthquake scenario is applied. Level 2 is a stochastic proof stress evaluation index that stochastically treats Level 1. The earthquake resistance of an equipment and the seismic force are stochastically evaluated. On the basis of the stochastical relationship between the equipment’s resis-tance and the seismic force, the probability of failure of the equipment is evaluated as the performance index of Level 2. Level 3 is a stochastic system performance evaluation index of the entire power sys-tem in an earthquake scenario. Level 4 is a cost evaluation index, which pays attention to the cost-effectiveness of the upgrading. These performance indices enable equipment managers to specify the equipment to be upgraded from the four points of view including the earthquake resistance of the equipment (Levels 1 and 2), system performance (Level 3), and cost-effectiveness (Level 4).
TABLE 23.8 Performance Indices for Aseismic Retrofitting and Replacement of Substation Equipment
Basic Concept for Aseismic Retrofitting and Replacement Model Performance Index Discussion Point
Physical performance such as aseismic capacity
Level 1: Deterministic proof stress evaluation index
Safety margin of equipment resistance in an earthquake scenario
Prioritization of equipment located in high seismic hazard area
Level 2: Proof stress evaluation index
Safety margin of stochastic resistance of equipment
Consideration of uncertainty
System performance Level 3: Stochastic system performance index
Supply power capability of the entire power system in an earthquake scenario
Consideration of earthquake resistance capacity of equipment, system redundancy, and restoration speed
Level 4: Cost evaluation index
Cost-effectiveness of upgraded equipment against multihazards including earthquake
Consideration of multihazards including earthquake from life cycle viewpoint
Source: Shumuta, Y., State of the art of earthquake disaster prevention system for electric power system, Proceedings of the First Real-Time Earthquake Disaster Prevention Symposium, pp. 25–29, Subcommittee of Real-Time Earthquake Disaster Prevention, Earthquake Engineering Committee, JSCE, 1992 (in Japanese).

516 Disaster Prevention and Mitigation Technologies of Lifelines
23.5.5 example of Restoration-Supporting technologies
Substation equipment is usually designed to prevent damage in an earthquake scenario, which indi-cates that earthquake ground motions have a high possibility of occurrence at places where substation equipment is installed, judging from the relationship between the recurrence intervals of earthquake ground motions and the design working life of the equipment concerned. However, it is extremely difficult to prevent damage. As an example, past earthquakes including the 1995 Hyogoken–Nanbu earthquake caused a lot of damage to substation equipment. Thus, some post-earthquake damage mitigation measures are discussed. When a major earthquake occurs, the damage conditions of sub-stations is supposed to be quickly assessed by damage point display devices, surveillance monitors used in a substation, and inspection. After that, the emergency restoration work is started. In the emergency restoration work for the electric power system, the following system control devices are useful to minimize power failure in an entire electric power system.
23.5.5.1 Power Failure Minimization by a Protective Relay System
A protective relay system (PRS) is usually installed in every substation [14]. The major functions of the PRS are to continuously maintain a protective function and to achieve a quick response in system protection. When a major earthquake occurs, some flow conditions including that of electric current change from stable to abnormal. In such conditions, a PRS cuts out the electric flow and isolates the damaged parts of the electric power system using circuit breakers. For example, when a short-circuit occurs, the PRS tries to protect the power supply system connected to a load device where the short-circuit has occurred, and prevents the short-circuit from affecting the load device where no short-circuit fault has occurred. As a result, the damaged part, element, and equipment installed in a substation are automatically separated or connected by the PRS.
Note that because the PRS is an automatic control device, its requirement is limited. When a major earthquake occurs, there is high possibility that it will cause a lot of damage in an electric power sys-tem. In such a condition, the power flow control and system switching are often manually conducted by system operators instead of a PRS. In this case, the system operators have to quickly consider many issues including the judgment to stop all function of a target substation. For example, when the power supply is restarted after stopping the power supply in the event of an earthquake, a system operator has to control the power flow considering the system’s frequency, voltage, and power supply margin. However, it is usually difficult for the system operator to understand just after the occurrence of an earthquake the condition of the damaged system, including load capacity, ground fault points, and short-circuit fault points within a short period. In this case, an appropriate experience-based judg-ment of the system operator is needed while collecting damage information including that from the demand side.
23.5.5.2 Blocking Automatic Action of PRS
There are some cases where malfunctioning of the PRS may occur during a seismic event [14]. The malfunction indicates that the power supply is automatically shut off by the PRS, though the substation element and equipment experience no damage due to seismic force. In order to avoid power failure due to such malfunctioning of the PRS, some substations install seismometers to block the PRS’s automatic operation. The seismometer is used to prevent automatic shutoff of the PRS due to only substation vibra-tion without any damage of substation element and equipment during a seismic event.
The seismometer for power flow control, which is installed in important power facilities including primary substation equipment, has no standard trigger related to seismic force to block the shutoff operation of the PRS. The basic trigger value depends on the maintenance policy of the local power company.

517Electric Power System: Mitigation Measures
References
1. Agency for Natural Resources and Energy. For Electric Power Facilities to Withstand Earthquakes: Denryoku, ShipoSya, 1996 (in Japanese).
2. Y. Shumuta and J. Tohma. Plan for restoring electric power system damaged by earthquake, CRIEPI Research Report, U91063, April 1992 (in Japanese).
3. Nuclear and Industrial Safety Agency, Ministry of Economic, Trade and Industry. Interpretation of Technical Standards for Electric Installations, 13th edn., 2008.
4. The Institute of Electrical Engineers of Japan. The Japanese Electronically Committee: Design Standards on Structures for Transmissions JEC-127-1965, 1966.
5. The Institute of Electrical Engineers of Japan. The Japanese Electronically Committee: Design Standards on Structures for Transmissions JEC-127-1979, 1980.
6. The Japan Electric Association, Special Committee of Power Plant and Substation Equipment. Seismic Design Guide of Substation Equipment, JEAG 5003-2010, Appendix 5, pp. 130–236, 2010. (in Japanese).
7. Y. Shumuta. Characteristics of substation facilities’ damage caused by recent earthquakes and their seismic countermeasures, Journal of the Japan Society of Civil Engineering, 584/I-37, 249–260, 1996 (in Japanese).
8. The Japan Society of Mechanical Engineers. Seismic Design and Structural Dynamics, Japan Industrial Publishing, Tokyo, Japan, 1985 (in Japanese).
9. Electric Technology Research Association, Special Committee of the Seismic Design for Substation Equipment. Seismic design of substation equipment, Electric Technology Research, 34(3), 111–115, 1978 (in Japanese).
10. The Japan Electric Association, Special Committee of Power Plant and Substation Equipment. Seismic Design Guide of Substation Equipment, JEAG 5003-2010, 2010 (in Japanese).
11. Electric Technology Research Association, Special Committee of the Seismic Design for the Connecting Lead of Substation Equipment. Seismic design of the connecting lead of substation equipment, Electric Technology Research, 38(3), 131–133, 1982.
12. Kansai Electric Power Company. The Restoration Report of the Hanshin Great Hanshin-Awaji Earthquake Disaster, 1995 (in Japanese).
13. Y. Shumuta. Practical seismic upgrade strategy for substation equipment based on performance indices, Earthquake Engineering & Structural Dynamics, 36(2), 209–226, 2007.
14. Y. Shumuta. State of the art of earthquake disaster prevention system for electric power sys-tem, Proceedings of the First Real-Time Earthquake Disaster Prevention Symposium, pp. 25–29, Subcommittee of Real-Time Earthquake Disaster Prevention, Earthquake Engineering Committee, JSCE, 1992 (in Japanese).


519
24.1 examples of Damage in telecommunication Facilities
Disaster measures for water damage, wind damage, fire, and earthquakes have been strengthened for telecommunication facilities year after year. New disaster measures have been introduced drawing les-sons from past disasters, and various measures have been incorporated so as to minimize social confu-sion during disasters.
When disasters strike telecommunication buildings, the effect on society is large, and the leading telecommunication companies decide and announce disaster prevention business plans for smoothly and appropriately executing measures related to disaster as a “designated public institution” based on the “Disaster Measures Basic Act.” In order to ensure communication services during a disaster, govern-ment organizations and regional autonomous bodies are linked, and various approaches are taken [1]. In Table 24.1, past disaster examples and the history of the introduction of countermeasure technology are summarized, and the following sections describe these disasters [2].
24Telecommunication System: Mitigation
Measures
24.1 Examples of Damage in Telecommunication Facilities ..............519Earthquakes before 1995 • Kobe Earthquake (January 17, 1995) • Tohoku Earthquake (2011) • Natural Disasters besides Earthquakes
24.2 Basics of Disaster Measures of Telecommunication Buildings .........................................................................................533Fire Prevention Measures for Telecommunication Buildings • Basic Disaster Measures
24.3 Disaster Measures for Telecommunication Civil Facilities .......543Disaster Measures for Telecommunication Civil Facilities • Procedures for Disaster Measures • Disaster Measures for Cable Tunnel Facilities • Earthquake-Proof Measures for Conduit Facilities • Earthquake-Proof Measures for Manholes • Earthquake Measures for Special Facilities
24.4 Earthquake-Proof Reliability Evaluation of Underground Facilities..............................................................................................551Outline of Reliability Evaluation Technology • Calculation Procedure • Evaluation Examples of Telecommunication Civil Facilities
References ......................................................................................................555
Takanobu SuzukiToyo University
Fumihide SuginoNTT Access Network Service Systems Laboratories
Katsumi SakakiNTT Access Network Service Systems Laboratories

520 Disaster Prevention and Mitigation Technologies of Lifelines
TABL
E 24
.1
Past
Dam
age
Exam
ple
and
Mea
sure
s
Year
N
ame
Dam
age
Mea
sure
s of T
elec
omm
unic
atio
n Fa
cilit
ies
Mea
sure
s of T
elec
omm
unic
atio
n C
ivil
Faci
litie
s
1964
Niig
ata
eart
hqua
keA
bout
30,
000
lines
wer
e da
mag
edIm
prov
emen
t of j
oint
s of m
etal
lic co
ndui
ts19
68To
kach
i ear
thqu
ake
Abo
ut 4
,500
line
s wer
e da
mag
edTe
leco
mm
unic
atio
n be
twee
n H
onsh
u an
d H
okka
ido
was
di
srup
ted
Mak
ing
the
city
tran
smiss
ion
rout
es d
oubl
e/m
ultip
leM
akin
g tr
ansm
issio
n ro
utes
for t
elev
ision
redu
ndan
tRa
dio
for p
reve
ntio
n of
isol
atio
n (T
Z-60
)
Putti
ng b
are
burie
d lin
es in
to co
ndui
ts
1975
Cen
tral
offi
ce fi
re18
,900
line
s wer
e da
mag
edIn
stal
ling
halo
n fir
e-ex
tingu
ishin
g eq
uipm
ent
A h
igh-
capa
city
tran
spor
tabl
e te
leco
mm
unic
atio
n st
atio
nA
hig
h-ca
paci
ty tr
ansp
orta
ble
batte
ry19
78M
iyag
i ear
thqu
ake
4,00
0 lin
es w
ere
dam
aged
Rein
forc
emen
t of r
acks
in m
achi
ne ro
om, a
nd fr
ee a
cces
s floo
rsIm
prov
emen
t of c
onne
ctio
n m
etho
d of
coax
ial c
able
Impr
ovem
ent o
f the
cond
uit j
oint
s (du
ct sl
eeve
s, ex
pans
ion
join
ts, s
topp
er jo
ints
)19
82N
agas
aki h
eavy
rain
Abo
ut 2
0,00
0 lin
es w
ere
dam
aged
Mea
sure
s for
long
-ter
m p
ower
failu
re, i
mpr
ovem
ent o
f cap
acity
of
bat
terie
s, in
stal
ling
mor
e m
otor
s19
82U
raka
wa
eart
hqua
ke50
0 lin
es w
ere
dam
aged
Prev
entio
n of
falli
ng c
able
s in
tunn
els,
mea
sure
s ag
ains
t une
ven
settl
emen
t aro
und
abut
men
t19
83Sh
iman
e he
avy
rain
Abo
ut 1
2,00
0 lin
es w
ere
dam
aged
Expa
nsio
n of
sate
llite
util
izat
ion,
a tr
ansp
orta
ble
digi
tal
switc
hing
equ
ipm
ent,
deve
lopm
ent o
f an
optic
al c
able
for
wid
e-ar
ea d
isast
er19
84C
able
tunn
el fi
re89
,000
line
s wer
e da
mag
edIn
nova
tion
of fi
repr
oof c
able
sFi
re w
all
Impr
ovem
ent f
or w
ork
in c
able
tunn
els
1984
Sea
of Ja
pan
eart
hqua
keA
bout
2,4
00 li
nes w
ere
dam
aged
Mea
sure
s of u
nder
grou
nd co
ndui
t aga
inst
liq
uefa
ctio
n19
90Ky
usyu
hea
vy ra
inA
bout
18,
000
lines
wer
e da
mag
edD
evel
opm
ent o
f tra
nspo
rtab
le w
irele
ss m
etho
d, d
igiti
zatio
n of
an
tidisa
ster
equ
ipm
ent
1993
Hok
kaid
o ea
rthq
uake
Abo
ut 1
,450
line
s wer
e da
mag
edIm
prov
emen
t of m
obili
ty o
f ant
idisa
ster
equ
ipm
ent,
deve
lopm
ent o
f a p
orta
ble
sate
llite
aga
inst
disa
ster
1995
Kobe
ear
thqu
ake
300,
000
lines
wer
e da
mag
edD
evel
opm
ent o
f mes
sage
dia
l for
Japa
n, e
xpan
sion
of sa
telli
te
utili
zatio
n, d
evel
opm
ent o
f inf
orm
atio
n ne
twor
k in
the
disa
ster
-str
icke
n ar
ea
Mak
ing
join
ts o
f cab
le tu
nnel
s flex
ible
, re
info
rcem
ent t
echn
olog
y on
duc
ts o
f man
hole
s, m
akin
g bu
ildin
g le
ad-in
cond
uits
flex
ible
, ea
rthq
uake
-pro
of e
valu
atio
n te
chno
logy
2004
Chu
etsu
ear
thqu
ake
Elec
tric
ity fa
ult (
59 ce
ntra
l offi
ces)
, 4,
500
lines
wer
e da
mag
edC
ount
erm
easu
res a
gain
st p
ower
failu
re o
f wire
less
bas
e st
atio
nC
ount
erm
easu
res o
f priv
ate
brid
ge co
llaps
e, ea
rthq
uake
-pro
of e
valu
atio
n te
chno
logy
(e
stim
atio
n of
und
ergr
ound
cab
le d
amag
e)20
07C
huet
su o
ffsho
re
eart
hqua
ke83
0 lin
es w
ere
dam
aged
Eart
hqua
ke-r
esist
ant m
easu
res o
n pi
pe b
ridge
s

521Telecommunication System: Mitigation Measures
24.1.1 earthquakes before 1995
Learning from disasters caused by earthquakes, earthquake-proof planning has advanced for commu-nication facilities such as central offices, antennas for wireless communications, overhead and under-ground facilities, and so on. In particular, the 1964 Niigata earthquake and the 1978 Miyagi earthquake were disasters that were turning points for drastically overhauling earthquake-proof measures due to the scale of the disasters.
24.1.1.1 niigata earthquake (1964)
On June 16, 1964, in Niigata prefecture, an earthquake that had a magnitude of 7.5 occurred with an epi-center 40 km offshore south of Awa Island. The damage affected nine prefectures located on the side of the Sea of Japan, such as Niigata prefecture, Yamagata prefecture, and Akita prefecture. Fifteen minutes after the earthquake, a tsunami with a height of 4 m hit Niigata city. The ground liquefied over a wide area along the Shinano River, and great damage was caused to bridges, buildings, and lifelines. Damage such as the collapse of the Showa Bridge and the burning of oil tanks was shocking. This earthquake triggered the beginning of the study of ground liquefaction.
The state of disaster of communication facilities included about 30,000 lines from the Niigata tele-phone exchange getting interrupted, immense damage occurring to the telecommunication civil facil-ities due to the liquefaction phenomenon, and 56% of the conduits and 41% of the manholes being damaged. Basic studies of conducting earthquake observation and earthquake-proof construction methods for communication equipment and outdoor facilities were started.
24.1.1.2 Miyagi earthquake (1978)
On June 12, 1978, an earthquake with a magnitude of 7.4 occurred with an epicenter offshore east of Miyagi prefecture. There was great damage particularly to Sendai city, where 28 people died, and about 10,000 people suffered severe to light injuries. Damage to communication facilities, centered in Sendai city, included about 4000 fixed phone lines becoming interrupted. The lesson drawn from this earth-quake was to implement reinforcement of modules and create free floor access in machine rooms. In addition, reinforcement of outdoor facilities, such as overhauling joint structures for conduits and over-hauling joints for bridge-attaching conduits, was implemented.
24.1.2 Kobe earthquake (January 17, 1995)
24.1.2.1 outline of the Damage
General damage of communication facilities included, first, the disruption of the exchange function of about 300,000 lines due to the outage of commercial power sources and the failure of standby power sources. In addition, service for about 200,000 lines was interrupted due to damage to subscriber cables (the general term for underground and overhead cables distributed to the home), but service to 100,000 lines was restored by January 31. Moreover, emergency communication was ensured by installing 3000 free public telephones in the evacuation centers where the disaster was concentrated by using in-vehicle satellite wireless applications and similar methods.
With respect to congested telephone lines, the number of telephone calls to the Kobe area on January 17 was 50 times more than in a normal peak time, and on the January 18, calls recorded 20 times the number of a normal peak time. In addition to carrying out telephone call control in order to secure emergency communication in disaster areas and crucial communication from around the country, more than 5000 lines were added. However, the overload of telephone calls exceeded even this. Moreover, congestion was further increased due to receivers falling off the telephone instruments immediately after the earthquake and the concentration of telephone calls to emergency organizations, thereby not resolving the situation until after January 22. With respect to outdoor facilities that provide connec-tions between the central offices and user homes, there was collapse of roofs due to the earthquake and

522 Disaster Prevention and Mitigation Technologies of Lifelines
the severing of overhead cables and lead-in wires due to fire. In civil facilities, damage to underground cables occurred due to damage and breakage of conduits and damage to manhole ducts, but the amount of damage to underground cables that led to service interruptions was small compared to the damage to overhead cables that led to service interruptions.
Damage to manholes and conduits increased in areas with increasing liquefaction, and the older the conduit standards, the more was the damage that occurred to the conduits. Almost no damage was observed in conduits that complied with current standards because these were built according to earthquake-proof standards that were introduced based on past earthquake disaster experience. An outline of the damage to conduits, manholes, and other facilities in eight areas of the Nippon Telegraph and Telephone Corporation (NTT) branch office that suffered severe damage is shown in Figure 24.1. About 6% of the conduit facilities, 10% of the manholes, and 28% of the bridge-attaching conduits suf-fered damage. With respect to cable tunnels, almost no damage occurred in cables constructed by the shields built deep underground, and while damage was found in connecting portions (expansion por-tions) in open-cut tunnels built at comparatively shallow locations, there was no damage to the cables.
24.1.2.2 outline of Damage to conduit Facilities
In this earthquake, damage to telecommunication civil engineering facilities that use duct sleeves or secession prevention joints was minor, and their earthquake-proof quality was proven. It has been reported that there are differences in the disaster tendencies of these civil facilities based on the three conditions: the newness, the ground conditions, and the degree of shaking of the facility.
When comparing facility damage in areas with a seismic intensity of 7, areas with a seismic intensity of 6, and liquefaction and nonliquefaction areas, differences were observed in the degree of damage to various facilities. In the case of similar facility structures, the severity of damage increased in the following order: areas with a seismic intensity of 6, areas with a seismic intensity of 7, and liquefac-tion areas. With respect to the types of damage to facilities, breakage of joints and breakage of rigid
Damaged line 19,000 Line
Underground cable length: 26 km
damage rate: 0.23%Underground pipeline
length: 217 km damage rate: 5.9%
High reliabilityconduit
MH
HH
Cable tunnel
conduits
Conduits attached to bridgeDamaged bridge: 72 sites
Damage rate: 28%
Damaged utility pole: 3613sDamage rate: 1.5%
Damaged Manhole: 2650(s)damage rate: 10%
Aerial cable length: 335%damage rate: 1.7% Aerial cable
Utility pole
FIGURE 24.1 Damage of outside facilities (Kobe earthquake).

523Telecommunication System: Mitigation Measures
polyvinylchloride pipes, which appeared to be caused by the ground deformation that accompanies liquefaction, were frequent in liquefaction compared to nonliquefaction areas.
In this earthquake disaster, in addition to the severe jolts caused by a seismic intensity of 7, large-scale liquefaction occurred mainly on reclaimed land in the vicinity of the port island and the beaches, and civil facilities such as conduits that house communication cables, manholes, and other facilities were subjected to damage that locally influenced communication service. However, the scale of damage was small in proportion to the number of underground cables in the disaster areas, and the conduits can therefore be said to have exhibited a sufficient cable-protecting ability.
24.1.2.3 outline of Damage to Manholes and Handholds
At that time, about 14,000 manholes were mounted on the disaster areas of Kobe, Ashiya, and Nishimiya cities among others, and there was some impact on about 10% of the manholes. Most of the damage was due to separation of the neck, and fractures in a portion of the main structure, which required renova-tion. In addition, in the areas in which liquefaction occurred, there were level differences between the manhole and the ground around the manhole.
24.1.2.4 Disaster State of Buried conduits
The state of disaster of buried conduits covered the entire span, and many among these had joint secession. It is believed that the clogging with earth and sand between conduits was due to joint secession. Examples of damage that also frequently occurred to handholds include the collapse of frameworks and damage to side surfaces. Although there was no concern that these would lead to a cutoff in communication service, disasters were frequently seen in which maintaining the security of the function as a structure was impos-sible. With respect to the state of the damage to lead-in conduits, about 70% of the damage was to rigid polyvinylchloride pipes, and only a little more than 10% of the flexible pipes unique to construction were damaged, which is extremely low. Examining the damage by pipe type, more than 40% of metal pipes and rigid polyvinylchloride pipes were damaged, whereas no damage to flexible pipes was confirmed. It was concluded that flexible pipes are extremely effective against ground deformation.
24.1.2.5 Damage State of Bridge-Attaching conduits, Private Bridges, and other Facilities
In regions recording an earthquake magnitude of 6 or greater, there were 264 bridge-attached pipes and private bridges. Among these, damage to joint-use conduits and abutments, as well as abutment reverse conduits, could be seen in 72 bridges (28%), damage only to abutments in 33 bridges (12%), and damage to cables in 5 bridges (2%), and there were three collapsed bridges as shown in Figure 24.2.
In bridge-attaching conduits and private bridges, there was little damage that affected commu-nication service, but because there were many old facilities, the damage was concentrated in the
Breakage, separation, flat, deflection
Separation, flat, sharp curveCrack, peel
Protection concrete
Abutment
MH MH
AbutmentConduits
FIGURE 24.2 Damage of conduits attached to the bridge (Kobe earthquake).

524 Disaster Prevention and Mitigation Technologies of Lifelines
deteriorating facilities that did not have an expansion function. In addition, a characteristic of the Kobe area is that there are many narrow rivers, and thus, there were many conduit-type bridges that did not have an expansion function. In these facilities, damage such as bending of pipes and breakage of abutments was seen as shown in Figure 24.3.
24.1.2.6 Damage State of overhead Line Facilities
Although overhead line facilities were also severely damaged, the basic cause was not only the seismic ground motion, but secondary damage due to collapsed houses and the disintegration of the ground in which telegraph poles are erected as shown in Figure 24.4. Most damage to telegraph poles was due to the involvement of collapsed houses and the overhead cables that were caught in them, which caused the telegraph poles to tilt. Thus, areas that had wide roads with sufficient distance between the houses and overhead line facilities had low rates of damage to telegraph poles in comparison to the damage to the houses. Concrete poles that had been erected in the ground sank due to liquefaction caused by the strong tremors. In the earthquake in the southern Hyogo prefecture, telegraph poles frequently sank in the beach areas (in particular, reclaimed land) of the disaster. Telegraph poles sank as much as 3 m, and generally sank by 50 cm. In addition, the strength of the concrete poles and steel pipe columns that got burned was severely compromised. Because of widespread fire that occurred in Nagata and Minatogawa wards in Kobe, many concrete poles and steel pipe columns were damaged.
24.1.2.7 Damage State of Underground cables
Although the damage to underground cables was minor in comparison to overhead lines, in areas where liquefaction occurred, destruction of cables accompanying the damage to conduits and manholes was seen. This damage included cable destruction due to breakage of conduits and detachment of manhole ducts, collapse of telegraph poles that held up the cables, destruction of lead-in wires due to fire and sink-ing, and severing of cables due to breakage of the building’s lead-in conduits that was caused by liquefac-tion. In addition, cable movement and destruction of cable coverings were also confirmed by inspection of manholes after the emergency repairs had been completed as shown in Figure 24.5.
FIGURE 24.3 Damage to a private bridge.

525Telecommunication System: Mitigation Measures
24.1.2.8 Damage State of Buildings
When viewing the state of damage of the buildings in the disaster areas, the collapse of the middle sto-ries could be seen everywhere—a characteristic that did not occur in past earthquakes. Buckling of the middle stories and destruction of earthquake-proof walls was seen in a portion of the NTT buildings as
FIGURE 24.4 Damage and restoration of aerial cables.
FIGURE 24.5 Damaged underground cables.

526 Disaster Prevention and Mitigation Technologies of Lifelines
well. In addition, breakage of conduits at the interface between a building and the outside was frequently seen, as well as other characteristics identical to those of the general disaster areas. Wireless steel tow-ers that were installed on the roofs of central offices were also destroyed due to the strong force of the earthquake as shown in Figure 24.6.
24.1.2.9 Damage State of exchanges and Power Sources
Although the loosening of base bolts and upper reinforcements caused damage and breakage occurred in portions of the exchanges, there was no damage that affected functionality. However, because of commercial power source outages, battery failure, electrical discharge, and backup engine destruction occurred simultaneously, as well as outage of power supply to the exchanges (7 units) and the stoppage of exchanges due to severing of shared lines (4 units). Although complete service was restored on the morning of January 18, because of these impacts, both intercity and intracity signal transmission and reception became impossible for a total of 285,000 lines.
24.1.2.10 Damage State of Mobile telephones
Among the 448 base stations in Hyogo prefecture belonging to mobile telephone companies such as NTT DOCOMO and Tu-Ka Phone Kansai Corporation (now KDDI), 145 stations were damaged. This consisted mostly of damage to fiber-optic cables that connect base stations and exchange stations, and functional stoppage of base stations due to power outage; only one of the base stations and exchanges experienced damage themselves. The power outage of the base stations continued for a protracted time, and many base stations became inoperable because they were unable to maintain operations using a battery power source.
24.1.3 tohoku earthquake (2011)
24.1.3.1 outline of Damage to communication Facilities
On March 11, 2011, the Tohoku earthquake with a magnitude of 9.0, the largest in recorded history in Japan, occurred and a giant tsunami was generated, causing an unprecedented disaster in which
Bolt falling o�
Tower plinth damage
Window glass breakage
Tile peeling
Frame buckling
Crack, breakage
Ground settlement
FIGURE 24.6 Typical damage of a building (Kobe earthquake).

527Telecommunication System: Mitigation Measures
20,000 people were dead or missing. Damage to lifeline facilities due to the original quake and tsu-nami, the frequent aftershocks, and liquefaction was tremendous.
Examples of the effects on communication services include power outage over a wide area for long periods of time and difficulty in procurement of fuel for backup power sources. Hence, large-capacity batteries and household generator fuel were exhausted, and from March 13, 2 days after the earthquake, services to about 1.5 million lines were affected on a large scale. Subsequently, besides the restoration of communication facilities, almost all of the communication services to the residential areas had been restored due to the restoration of electric power and the stable availability of fuel by the end of April. In addition, telephone calls and mails to the disaster area increased, and due to congestion, large-scale communication restrictions were implemented.
Examples of damage to communication facilities generally included complete central office collapse and flooding at 28 locations due to the tsunami, about 28,000 telegraph poles being washed away or broken, and damage to 2,700 km of overhead cables. In repeated transmission routes, about 90 routes were severed.
The disaster affected a wide area across five prefectures, specifically, Iwate, Miyagi, Fukushima, Ibaraki, and Chiba, as well as the capital Tokyo. In particular, in Iwate prefecture, Miyagi prefecture, Fukushima prefecture, and Ibaraki prefecture, the damage due to the tsunami and the earthquake was significant. In contrast, damage due to liquefaction in the Tone River basin in Ibaraki prefecture and the coastal reclaimed lands of the city of Tokyo and Chiba prefecture was striking.
The damage to the bridge facilities due to the outflow of the tsunami was tremendous. Similar to the observations of past earthquakes, the damage to underground conduit facilities increased along with the degree of liquefaction in the area, and the older the facility, the greater is the damage. In a portion of built-up land where bridge fixtures are installed, damage due to erosion and exposure to the tsunami could be seen. With respect to cable tunnel facilities, only a partial detachment of concrete at several places was confirmed but otherwise there was almost no damage. There was no damage to the highly reliable conduit facilities.
In addition to the earthquake and ground deformation in the East Japan Earthquake, damage due to the tsunami and liquefaction were characteristic. Tables 24.2 and 24.3 describe the outcome of the damage [3].
24.1.3.2 Damage due to tsunami
In addition to the bridge-attaching facilities being washed away and destroyed as a result of the bridges themselves being washed away, many manholes and conduits were washed away and broken due to
TABLE 24.2 Damage State of Communication Services in Telecommunication Companies
Company
Damage State
Maximum Number of Damaged Lines (10,000 Lines)
Maximum Transmission Restriction (%)
Fixed phones NTT EAST About 152 90KDDI About 39 90SoftBank About 3 80
Damaged Base Stations (s) Maximum Transmission Restriction for Voice (%)
Mobile communication
NTT DOCOMO 6,720 90KDDI Mobile 3,680 95SoftBank Mobile 3,786 70EMOBILE 704 0WILLCOM 13,760 Restriction on communication
to other providers implemented for several hours

528 Disaster Prevention and Mitigation Technologies of Lifelines
erosion. In contrast, even in portions where there was no erosion, the steel lids of manholes were dis-placed, and earth, sand, and floating wreckage was flowing into the open manholes. For conduits that are underground facilities and manholes, disaster due to the tsunami comprised nearly all outflow, exposure, breakage, and secession that accompany erosion, and these exhibited a damage rate of 1%–2%. In contrast, in bridge-attaching overhead facilities, in addition to outflow and breakage that accompanies the outflow of bridges due to the tsunami, destruction due to floating wreckage was confirmed, exhibiting a dam-age rate of 58%. Similarly, overhead telegraph poles experienced a damage rate of 44%, with an increas-ing damage rate in the sequence of Iwate prefecture, Miyagi prefecture, and Fukushima prefecture. It is believed that the tsunami’s forceful impact on the deeply indented coastline was related to the high dam-age rates. In addition, in comparison with the damage to telegraph poles, it is believed that the damage rate for bridge-attached facilities was high because the tsunami penetrated through the rivers and the vicinity of rivers with great force. In general, in disasters due to tsunamis, the damage rate for underground facili-ties is an order of magnitude higher than for overhead facilities. Table 24.4 shows the state of damage after the tsunami and Figure 24.7 shows examples of damage caused by the tsunami.
24.1.3.3 Damage due to Liquefaction
Damage to conduits was mainly due to the breakage of joints, secession, and the inflow of earth and sand, and the damage rate was about 4%. Damage to manholes due to neck separation, duct opening, conduit ejection, and cracks in side walls were confirmed, but there was no report of loss of strength in the main structures. The damage rate was about 4%, which is about the same as that of conduits. No damage to bridge-attaching facilities was confirmed. Table 24.5 describes the state of damage by liquefaction and Figure 24.8 shows examples of damage caused by liquefaction.
24.1.3.4 Damage due to Seismic Ground Motion and Ground Deformation
Damage to conduits due to seismic ground motion and road deformation, excluding tsunami areas and liquefaction areas, consisted mainly of secession and breakage of joints, and the damage rate was about 1%. The damage to manholes consisted of duct opening, conduit ejection, and cracks in side walls. There was almost no separation of necks, which was frequently seen in liquefaction areas, and no loss of
TABLE 24.3 Damaged State of Main Communication Facilities in NTT
Company
Damage State
Damaged Object Number
NTT EAST Buildings Completely destroyed: 16 buildingsSubmerged: 12 buildings
Telegraph poles Washed away, broken: about 28,000Overhead cables Washed away, damaged: 2,700 km
NTT DOCOMO Base stations object of restoration 375 stations
TABLE 24.4 Damaged State of Tsunami Area
Object Facility
Number of Facilities in
Tsunami Area Number of Inspections
Number of Damaged Facilities
Due to Tsunami Damage
Ratio (%)
Underground facility
Conduit (km) 250 53 5.0 2.0
Manhole (number) 1,481 215 14 0.9Overhead
facilityConduits attached
to bridge (s)141 141 82 58
Telegraph poles (s) About 63,000 About 63,000 About 28,000 44
529Telecommunication System: Mitigation Measures
strength in the main structures was reported. Damage to bridge-attaching conduits consisted mainly of joint secession, breakage, and buckling of the pipe body; joint secession, breakage, and collapse of con-duits; and destruction around the abutment; the damage rate was as high as 17%. Past earthquakes are also reported to have had high damage rates for bridge-attaching conduits. Unlike underground facili-ties, the bridges and bridge-attaching facilities are caused to freely vibrate due to seismic ground motion and the bridges cannot withstand the extent of movement of the seismic ground motion. According to current standards, joints for bridge-attaching conduits that have expansion and rotation functions are installed, but because most facilities were built according to old standards, this results in a high damage rate. Table 24.6 described the state of damage caused by a seismic wave and Figure 24.9 shows examples of the damage caused by a seismic wave.
In addition, in the Tohoku earthquake disaster, there were striking differences in road levels over a wide area due to the sinking of built-up ground at the rear surface of the bridge abutments. At such locations, in segments having a fixed distance from the rear surface of the bridge abutments, protective concrete was poured in the vicinity of the conduits. Although the original form was frequently maintained in these
(c)
(a) (b)
FIGURE 24.7 Representative damaged state due to tsunami: (a) eroded conduits and manholes; (b) conduits attached to the bridge that are washed away; and (c) destruction of conduits due to floating wreckage.
TABLE 24.5 Disaster State in Liquefaction Area
Object Facility Number of Facilities
Number of Inspections
Number of Damaged Facilities
Damage Ratio (%)
Conduit (km) 188 37 6.8 3.6Manhole (s) 5967 607 259 4.3

530 Disaster Prevention and Mitigation Technologies of Lifelines
segments, the deformation of the ground caused by the sinking of the built-up ground near the protec-tive concrete exceeded the tolerated shifting level of the conduit, and many cases of separation at joints were confirmed. Currently, joints that are equipped with an expansion function, a rotation function, and a secession prevention mechanism are being installed, but there are many old existing facilities, which resulted in the high damage rate. Table 24.7 gives the number of damaged cases around the abutment caused by a seismic wave and Figure 24.10 shows examples of damage around the abutment.
24.1.3.5 comparison of the State of Damage between Facilities complying with Present Standards and those complying with old Standards
Insertion joints, which comply with present standards, were introduced after 1985 for conduit facili-ties. Insertion joints are characterized by their flexibility including an expansion function and a rota-tion function, which absorb the shaking and ground deformation during an earthquake. In addition,
(c)
(a) (b)
FIGURE 24.8 Representative damaged state due to liquefaction: (a) inflow of earth and sand into conduits; (b) separation of the grade ring of a manhole; and (c) damage to the duct portion of a manhole.
TABLE 24.6 Damaged State due to Seismic Wave and Road Deformation
Object Facility Number of Facilities
Number of Inspections
Number of Damaged Facilities
Damage Rate (%)
Conduit (km) 4,461 268 40 0.9Manhole (s) 13,808 1,288 38 0.0Conduits attached to bridge (s) 2,445 545 403 17

531Telecommunication System: Mitigation Measures
at locations where significant ground deformation is assumed to occur, such as liquefaction areas and built-up segments at the rear surface of bridge abutments, session-preventing joints are installed, and at attachment points of protective concrete and manholes, expansion joints are installed. In addition, at bridge attachment sections, bridge-attaching expansion joints, which can accommodate a certain amount of movement of the bridge, will be installed.
The damage rate for facilities complying with present standards is low compared to facilities comply-ing with old standards, and the effective functioning of earthquake-proof measures can be confirmed. Table 24.8 shows the damage rate of present standards and old ones.
Among the conduits complying with old standards, surveys were carried out on (1) weakened and degraded conduits and (2) socket joint cast iron pipes installed before 1964, in which the strength had particularly deteriorated. These are weak earthquake-proof facilities, and their use is limited. However, even in environments where no road deformations could be seen and the impact of earthquakes was comparatively small, it was confirmed that there is a high probability that these facilities would be
(a) (b)
FIGURE 24.9 Representative damaged state due to seismic ground motion or ground deformation: (a) secession of conduits and (b) secession of bridge-attaching conduits (without expansion joints).
(a) (b)
FIGURE 24.10 Representative damaged state around abutment surface: (a) sinking around abutment surface and (b) side view of the same site.
TABLE 24.7 Damaged State of Conduits around Abutment
Number of Facilities (km)
Number of Inspections (km)
Number of Damaged Facilities (km)
Damage Ratio (%)
203 57 23 11
532 Disaster Prevention and Mitigation Technologies of Lifelines
damaged. Table 24.9 shows the damage rate of these conduits. The strength of the conduits complying with old standards is insufficient, and when there are barriers during the removal or laying cables, a lining that forms a new resin pipe is applied to the inside of the existing conduit facilities. The lining is independent even if the existing conduit facilities disappear, and thus, for the first time, no examples of damage have been currently confirmed. Moreover, in the same segment and same pipe type, there have been examples of damage to conduits in which a lining has not been applied, whereas conduits with a lining are completely sound.
24.1.3.6 Damage State of communication cables Accommodated in telecommunication civil Facilities
Cable damage in tsunami areas can be broadly classified into damage to overhead facilities and dam-age to underground facilities. In overhead facilities, the overhead cables were cut off and wash away simultaneously with the breakage and washing away of utility poles. In underground facilities, the underground cables were destroyed and washed away accompanying the breakage and washing away of manholes due to the washing away of bridges to which facilities were attached and also to the breakage, washing away, and erosion of bridge-attaching conduit facilities. Underground cables that are accom-modated in conduits or bridge-attaching conduits have a low damage rate of about one-tenth in com-parison to overhead cables that join utility poles. The high degree of reliability of underground facilities is described in Table 24.10.
24.1.4 natural Disasters besides earthquakes
24.1.4.1 Water Damage
In the past, when inundation occurred in an urban area, the functions of communication center build-ings stopped. In addition, it caused power outage and cables were severed.
TABLE 24.8 Comparison of Damage Ratio for Present Standard and Old One
Conduit Facilities
Damage Rate for Facilities Complying with Present
Standards (%)
Damage Rate for Facilities Complying with
Old Standards (%)
Liquefaction area 0 4Around abutment 1 12
TABLE 24.9 Damage Ratio for Particular Old Standard Conduits in No Road Deformation
Pipe Type Number of
Inspections (km) Extent of
Damage (km) Damage
Ratio (%)
Weak, degraded conduits 3.3 1.2 36Socket joint cast iron pipes
built before 19645 0.4 8
TABLE 24.10 Cable Damage State for Underground Cable and Aerial One
Overhead Cable Underground Cable (Including Bridge
Attachment Segments)
Number of Facilities (km)
Number of Damaged
Facilities (km) Damage
Ratio (%) Number of
Facilities (km)
Number of Damaged
Facilities (km) Damage
Ratio (%)
About 5900 About 2700 46 About 1350 56 4.1

533Telecommunication System: Mitigation Measures
Power outage measures and the development of other disaster countermeasures that were triggered by the damage caused by heavy rains in Nagasaki in 1982, Shimane in 1983, northern Kyushu in 1990, and water damage in Niigata in 2004 (Sanjo) are now being implemented.
24.1.4.2 Wind Damage
Central offices and antennas have a wind-resistant design, and although significant damage to them has not been reported to date, damage to telegraph poles and overhead cables due to strong winds has occurred. In particular, in typhoon 19 in 1991, telegraph poles and subscriber cables were damaged due to lightning and strong winds, and about 300,000 subscribers could not use their telephones.
24.1.4.3 Fire
Currently, when firefighting facilities and preventive measures against fire are insufficient, accidents occur in which communication center buildings and cable tunnels are burnt. In addition, overhead cables are burnt, for example, due to residential fires.
In the Asahikawa–Toko telephone exchange fire that occurred in 1976, a telephone facility at a station was burned due to a fire that spread from a machine room, and this became the trigger for installing haloid fire-extinguishing equipment. In addition, in the Setagaya station cable fire that occurred in 1984, the fire was ignited while working on cables in a cable tunnel, and the station lead-in wires were completely burned. Triggered by this fire accident, the improvement of fireproofing of cables and cable connection methods, and the installation of cable tunnel firewalls was carried out.
24.1.4.4 Volcanic eruptions
A large-scale pyroclastic flow that accompanied the eruption of Mount Unzen occurred in June 1991. Although the damage to telecommunication buildings due to the severing of cables was minor, mea-sures were taken to prevent communication isolation in the southern part of the Shimabara penin-sula. As the cables were severed due to pyroclastic flow and landslides, communication was ensured by changing the installation routes for cables and installing wireless equipment.
24.2 Basics of Disaster Measures of telecommunication Buildings
24.2.1 Fire Prevention Measures for telecommunication Buildings
24.2.1.1 Data communication as a Lifeline
A data communication service is a lifeline that supports current economic activity and the life of citi-zens, and service stoppages severely affect the society and industry. Telecommunication buildings, which have been constructed over a span of many years, are a mixture of new and old facilities, and thus, damage due to flooding, earthquakes, and other natural disasters is most conspicuous in functionally impaired portions that develop along with deterioration over the years. In addition, because the service is provided over a network, damage even to a portion of the facility may affect other locations [4].
24.2.1.2 Basics of Disaster Measures
Considering the overall lifeline, it can be said that the details of disaster measures, and in particular, large-scale earthquake measures, differ depending on the content of the service, and the basics of the measures can be divided into three main pillars: earthquake-proof strengthening of the facilities, mea-sures by systematization, and speeding up restoration.
Earthquake-proof strengthening is a countermeasure that increases the earthquake-proof performance of the structure itself, and consists of evaluating examples of past damage and reviewing the earthquake-proof design. Countermeasure according to systematization denotes improving the reliability by using facilities that can be backed up and network architecture that reduces the effects of damage to a minimum.

534 Disaster Prevention and Mitigation Technologies of Lifelines
In data communication services, providing redundancy for routes is advancing by taking into consider-ation reliability during normal operation, and making a network in which damage at a particular location does not immediately interrupt service. Speeding up restoration assumes a necessary number of people, items, and amount of money that are resources used during the restoration after a disaster, and restoration systems and methods are examined before a disaster. An image of the effects of the measures is shown in Figure 24.11. When the amount of damage is used as a measure of reliability and the damage time is used as a representative measure of soundness, the triangular area represents the scale of the effects of the damage. Strengthening a facility reduces the amount of damage, which means that the damage time that accompanies this is also reduced. In contrast, in restoration measures, although the amount of damage does not change, one can expect the disaster time to be shortened. In addition, on the point that in the measures by systematization, the occurrence of damage is not directly linked to service outages, an effect similar to strengthened facilities can be expected. The smaller the area of the triangle, the larger are the effects of the countermeasure.
24.2.2 Basic Disaster Measures
24.2.2.1 overall
Large-scale telecommunication companies have announced disaster prevention operation plans as des-ignated by public organizations under the “Basic Law for Disaster Measures.” Using the NTT group as an example, various measures have been incorporated into the basic disaster measures, such as prepar-ing for unexpected large-scale disasters, increasing the reliability of communication networks, ensuring crucial communication, and restoring services quickly. Considering the public nature of the data com-munication business, it is necessary to cooperate with the business of national and regional autonomous organizations, to maintain data communication services to the extent possible during a disaster, and to mutually understand crucial communication, and thus, efforts are being made to promote disaster measures under each of the following items and establish a disaster prevention system:
1. Continuously physically strengthening the facilities themselves and constructing communica-tion facilities that are disaster-resistant and highly reliable.
2. Planning improvements in reliability so that damage to a portion of a data communication system does not significantly affect other parts.
3. Securing communication means for mutually understanding crucial communication during a disaster.
Effect of reliability improvement
Dam
age q
uant
ity
Effect of restore measure
Damage time
FIGURE 24.11 Effect of disaster prevention measures.

535Telecommunication System: Mitigation Measures
4. Restoring communication facilities involved in a disaster as quickly as possible. 5. Linking users, the country, regional autonomous organizations, lifeline operators, and news
media organizations to the disaster restoration and information flow in disaster areas.
24.2.2.2 improving the Reliability of communication networks
Preparations are ongoing to make facilities that are highly resistant to earthquake, fire, and wind; mul-tiple routes are being implemented in communication transmission channels; network monitoring and control are being carried out 24 h a day, 365 days a year; and communication services will continue even when unforeseen events such as a disaster occur.
24.2.2.2.1 Improving Reliability by Multiroute Configurations for Communication Transmission ChannelsIn the case that a transit exchange has been damaged, not only are telephone lines in that area cut off, but transit exchanges also cease to function, and thus, disorder occurs over the entire network. In order to prevent such trouble, transmission channels are being provided with multiple routes. In the worst case, if a cable is severed in a disaster or one route is damaged, the communication channel instantly switches auto-matically to another route, and service is provided through the different route as shown in Figure 24.12.
24.2.2.2.2 Decentralization of Crucial Communication CentersWhen a crucial communication center in which transit exchanges are installed has been damaged, com-munication through this center is completely cut off. Thus, crucial communication centers are decen-tralized and danger avoidance is implemented.
24.2.2.2.3 Strengthening Disaster Resistance of Facilities (Earthquake, Fire, Wind, and Water Damage Measures)
In order to minimize the effects of disasters by making telecommunication buildings and other facilities more reliable, disaster prevention designs for telecommunication buildings and their associated facili-ties are being implemented as listed in Table 24.11.
Communication flow at the time of damaged
Can communicate by otherchannel when damaged
Exchange
Exchange
Exchange
ExchangeExchange
IC
Central office
Distributed danger to multiple route
Can communicate by other transit exchange when damaged
Distributed danger to multiple locations
Distributed danger to multiple route
Central office
Central office 2
1
FIGURE 24.12 Redundant configuration of the communication channel.

536 Disaster Prevention and Mitigation Technologies of Lifelines
Telecommunication buildings and other facilities in areas where there is a concern for heavy rains, flooding, high tides, and tsunamis are being provided with better waterproof structures. As a specific measure, in order to prevent inundation by high tides, tsunamis, or flooding, flood gates and tidal walls are installed depending on the conditions of the location, and efforts are being made to prevent the inundation of communication machine rooms. In addition, in the case of smaller buildings, measures such as positioning the site itself at a higher location are also being implemented.
Structures are being made more wind- and snow-resistant in telecommunication buildings and other facilities that are situated in areas where there is a concern for violent winds and heavy snow. As a spe-cific measure against wind damage, starting with wireless steel towers that are always exposed to wind and rain, the NTT buildings overall are being structured to resist large-scale typhoons and to withstand wind speeds of 60 m/s.
In preparation for earthquakes and fires, the structures of major telecommunication buildings and other facilities are being made more earthquake- and fire-resistant.
As an earthquake countermeasure, the NTT buildings, wireless steel towers, and cable tunnels are designed to withstand an earthquake with a magnitude of 7. In addition, exchanges, electrical power facilities, and other facilities are securely fastened so as not to move due to vibration. Like firefighting countermeasures, structures that prevent fires from inside and outside a building are used.
In order to prevent a fire from spreading, the machine rooms for exchanges have few windows, and fire prevention shutters and fire prevention doors are installed at necessary locations. Furthermore, in order to prevent the occurrence of fire from inside a communication center building, measures are also implemented to always have smoke detectors and fire-extinguishing equipment and to block cable holes in flooring surfaces and wall surfaces by incombustible materials.
Furthermore, even when a large disaster has occurred, in order to ensure communication, measures for increasing the reliability of communication networks are implemented in the following manner:
1. Construction of cable tunnel (including common conduits) networks in large cities 2. Promoting buried communication cables 3. Installing necessary backup power supplies for major telecommunication buildings
24.2.2.2.4 Network Monitoring and Control for a 24 Hour SystemThe national communication network is monitored 24 h a day, 365 days a year, with an immediate response to a failure or damage. In addition, in order to make a more exhaustive response, efforts are
TABLE 24.11 Disaster Prevention Standards of Telecommunication Facilities
Central Office Inside Facilities
Outside Facilities
Tunnel Cable
Earthquake-proof Seismic scale 5:No damage
Seismic scale 5:No damage
Seismic scale 6:No damage
Seismic scale 6:Minor damageSeismic scale 7:Avoid collapse
Seismic scale 6:Minor damageSeismic scale 7:Some damageImportant facilities
early recovery
Seismic scale 7:Some damageNo damage of cable
protection function
Fire protection Fireproof structureCompartmentationFire-extinguishing
equipment
Flame-retardant materials
FirewallTunnel monitoring
system
Flame-retardant cable
Wind and flood damage protection
High placeWater barrierRaising the building
Power failure countermeasure
Water barrierTunnel monitoring
system
Prevent flooding of the cable connection point

537Telecommunication System: Mitigation Measures
being made to upgrade the system. The following monitoring control was implemented by establishing a network operation center as shown in Figure 24.13:
1. National network control Networks all over the country are integrated and traffic control is performed.
2. Network operation Network system facilities and access system network facilities are monitored and controlled, and disaster measures are supported on-site.
3. IP network operation Commercial IP systems and intra-office IP systems are monitored and controlled.
24.2.2.3 ensuring crucial communication
During a disaster, data communication services are maintained as far as possible, and because cru-cial communication must be mutually understood and ensured, it is planned to promote the following items: to prepare for disaster, to develop a database related to crucial communication, to manage a state of continuous mutual understanding, to operate communication resources efficiently during a disaster, to monitor the state of facilities, to control traffic as necessary, to promote mutual understanding of data communication, and to ensure crucial communication.
24.2.2.3.1 Telephone Congestion during a DisasterExchanges are not designed assuming that all users will call simultaneously, and therefore, when a certain volume is exceeded, the function significantly deteriorates, resulting in a congested state in which communication is impossible. In particular, when a disaster has occurred, due to the concen-tration of telephone calls to the disaster area to confirm the safety of people and other matters, traffic exceeds the processing capacity of the exchanges, and telephones connect with difficulty. In such a case,
FIGURE 24.13 Network operation center.

538 Disaster Prevention and Mitigation Technologies of Lifelines
communication control is carried out in order to prevent these effects on the communication network because of damage to the exchange system as shown in Figure 24.14.
The method of communication control distinguishes preferred phone calls during a disaster from general calls at the exchanges. A method is employed in which crucial communication is ensured by restricting communication requests from general users to a fixed proportion of communication. A disaster emergency message dial service is prepared for carrying out safety confirmation using a general use telephone as shown in Figure 24.15.
24.2.2.3.2 Preferred Phone during a DisasterTelephone calls concentrated to a disaster area from the entire country are controlled during a disaster, and emergency communication and crucial communication are maintained by using the emergency numbers 110 and 119. Preferred phones during disasters are installed at organizations related to disaster rescue, restoration, and maintaining public order; these telephones are designated in advance based on the law.
These telephones can be used with priority provided that the telephone facility has not been dam-aged. Organizations that can use preferred phones during a disaster include weather, flood prevention, fire prevention, and disaster rescue organizations; foreign or regional public groups; organizations that are directly related to support order, defense, secure transportation, electricity supply, water supply, and gas supply; and organizations of newspaper companies, communication companies, and broadcast companies.
24.2.2.3.3 Free Public TelephonesWhen there has been a request from an autonomous organization such as a town or village that has suffered a disaster, public telephones that are free of charge (specially installed public tele-phones) are installed in evacuation areas. Disaster victims can convey disaster emergency messages dialing (171) or communicate with friends without charge by using these specially installed public telephones.
Exchange Exchange
ExchangeExchange
Exchange
Exchange
Pass Pass PassBlock Block
Normal call Normal call
Disaster area Disaster area
Priority phonePublic phoneEmergency call
Priority phonePublic phone
Emergency call
FIGURE 24.14 Traffic control at the disaster site.

539Telecommunication System: Mitigation Measures
24.2.2.3.4 Disaster Emergency Message Dialing (171)The disaster emergency message dialing is a voice message board, and this service is provided when communication to an area has increased due to the occurrence of a disaster such as an earthquake, a volcanic eruption, or some other natural disaster, but a state occurs where making connections become difficult. When a disaster such as an earthquake has occurred, communication due to concerns about the safety of people in the disaster area increases, and when telephoning the disaster area becomes diffi-cult (congestion), this service is provided quickly. Telephones that can use the service include subscriber telephones, INS nets, public telephones, optical IP telephones, and, during a disaster, the telephones that the NTT has specially installed in disaster areas. The service can also be used from cellular telephones and personal handyphone systems (PHSs).
24.2.2.3.5 Disaster Broadband Message Board (web171)The disaster broadband message board (web171) uses the Internet to confirm the safety of people in the disaster area. Considering the spread of broadband in recent years, in addition to the disaster emergency message dialing using a telephone (voice), a disaster broadband message board that enables registration and browsing of message information (text, voice, image) has been developed that is suitable for the new broadband era. With this service, a resident of a disaster area (including evacuation locations) can access a message site via the Internet during a disaster such as a fire, and can record a message information (text, voice, image) using a telephone number or another code as a key. The recorded message informa-tion can be browsed or additional messages recorded from anywhere in the country (or overseas) by using a telephone number or another code as a key. The service commences depending on the provision of disaster emergency message dialing.
24.2.2.3.6 Disaster Emergency Message Board ServiceCommunication requests increase due to safety confirmation with cellular phones immediately after an earthquake, and this leads to a state where connections become difficult. In preparation of such
Upload message
Capacity: 8 million messagesDuration: 48 h
Download message
Download message
https://www.web171.jp
Message service (fixed phone)
Voice message Voice message
Message service (Internet)
Upload message (Web)
Upload message (Web)File upload(text, sound, image)
Message service (cell phone)
Upload message
Upload message
ID: cell phone number
Storage
Fixed network
ID: phone number
Message replay(Voice message)
Capacity: 500 million messagesDuration: 48 h
ID: phone number (fixed, mobile, IP) Internet
(NTT Docomo)Capacity: 40 million text mailsDuration: 72 h
Storage
Storage
Storage
Storage
Storage
FIGURE 24.15 Safety confirmation systems.

540 Disaster Prevention and Mitigation Technologies of Lifelines
a situation, a cellular “disaster emergency message board” that uses Internet technology is provided. This service is a highly convenient service in which information from anywhere in the world can be confirmed via the Internet by persons in the vicinity of a disaster area registering their own safety information.
24.2.2.4 early Recovery of Services
When a facility has suffered damage due to a disaster, the early restoration of services is advanced by utilizing disaster countermeasure equipment, and by procuring the restoration materials and securing restoration personnel from around the country.
24.2.2.4.1 Disposition of Disaster Countermeasure Equipment and VehiclesIn order to ensure communication and quickly repair damage when a disaster occurs, the location and number of repositories is determined in advance, and the following equipment and vehicles are pre-positioned as necessary:
1. Emergency satellite communication equipment Portable satellites provide a type of communica-tion system that is carried around by people. During a disaster, mobility and readiness are para-mount. These advantages are utilized in setting up temporary lines and specially installed free public telephones when there is a traffic blockage, a mountain disaster, or any other disaster. Ultrasmall satellites are positioned in cities, towns, and villages when there is a concern that com-munication may be interrupted or that an area will be isolated due to damage. They are used in order to ensure emergency calls as shown in Figure 24.16.
2. Portable wireless base stations When a disaster occurs, in addition to emergency contacts and safety confirmation, usage related to media news reporting also adds to the number of telephone calls centered at the disaster areas. Thus, there is a concern that the rush of telephone calls may not
FIGURE 24.16 Portable satellite communication systems.

541Telecommunication System: Mitigation Measures
be handled properly, resulting in congestion. In such a case, portable wireless base station vehicles and moving power source vehicles are deployed to great advantage. A service area that is suitable for speedy information gathering and planning proposals is quickly established, and efforts are made to restore communication early. Portable wireless base station vehicles are positioned in all areas of the country, and along with the mobile gas turbine electric generators, they are useful in ensuring stable communication services as shown in Figure 24.17.
3. Emergency exchanges Portable digital exchanges are alternative apparatus that can be used when exchanges that connect telephones have been damaged. By emergency transportation of emer-gency exchanges, an emergency central office can be constructed in about 10 days as shown in Figure 24.18.
4. Emergency power source apparatus If a power source stops when a disaster strikes in the vicinity of exchanges or wireless base stations, this may bring about a significant failure in communica-tion services even if there is no direct damage to the system itself. Preparing for such a case, power source measures having several stages have been devised. At an exchange station, when an abnor-mality occurs in a power source, first, the backup batteries are activated, and then, if a power outage continues, power sources are backed up by utilizing household generators. In addition, as a counter-measure to prevent the prolonged outage of power or remedial measures for wireless base stations, large and small mobile gas turbine electric generators are provided as shown in Figure 24.19.
5. Miscellaneous Emergency transmission apparatus, emergency cables, disaster countermeasure command vehicles, snowmobiles, specialized vehicles, cellular telephone service cars, and other emergency repair apparatus are prepared.
24.2.2.4.2 Securing and Preparing Disaster Countermeasure MaterialsAlong with disaster countermeasure equipment, disaster countermeasure materials are also prepared during normal times:
1. Securing disaster countermeasure materials In order to implement disaster emergency measures and disaster restoration, during normal times, restoration materials, tools, implements, disaster prevention materials, and consumables are secured.
FIGURE 24.17 Movable wireless network base station.

542 Disaster Prevention and Mitigation Technologies of Lifelines
2. Transportation of disaster countermeasure materials When a disaster occurs or there is a con-cern that a disaster will occur, in order to smoothly carry out transportation of disaster counter-measure equipment, materials, and resources, a transportation plan is determined in advance. The transportation plan includes, for example, transportation routes, the types and amounts of vehicles, ships, helicopters, and other equipment that should be secured, and communication methods when relying on transportation provided by other companies.
3. Preparation and inspections of disaster countermeasure materials With respect to disaster coun-termeasure materials, with an understanding of the amounts required, necessary preparation and inspections are carried out to prepare for emergency situations.
4. Wide-area deployment of disaster countermeasure materials In order to plan efficient deployment of necessary disaster countermeasure materials and equipment that have been developed locally and nationally, adjustments of their placement and other logistics are planned between compa-nies as necessary with respect to matters related to movement and communication
FIGURE 24.18 Movable exchanges.
FIGURE 24.19 Movable power unit.

543Telecommunication System: Mitigation Measures
5. Storage of daily-life necessities such as food and pharmaceuticals and other provisions In prepara-tion for an emergency situation, inventories of food, drinking water, pharmaceuticals, clothes, and daily-life equipment are determined and secured.
6. Temporary locations for disaster countermeasure materials There may be difficulty in negotiations for borrowing temporary locations to store disaster countermeasure materials in an emergency situation; thus, efforts are made to gain the cooperation of regional disaster assemblies in advance for securing candidate sites, such as public lands.
24.3 Disaster Measures for telecommunication civil Facilities
24.3.1 Disaster Measures for telecommunication civil Facilities
Telecommunication civil facilities are the foundation that supports communication services, which can be said to be the nerve system of a society. In order to ensure function as a network for communication, telecommunication civil facilities must have a structure that has the strength and durability to resist all types of load to which they are subjected, and must be constructed so that they are reliably resistant to physical and chemical effects caused by neighboring construction and damage, as well as environmental conditions and natural disasters.
Because the design of conduits and manholes is standardized, damage resistance is ensured by a combination of parts, but making a design by appropriately estimating the impact of the damage is important.
In addition, cable tunnels are facilities that house numerous communication cables as a trunk route within a city, and must be designed as facilities that are even safer than conduits or manholes. Currently, various electronic communication services are being developed that assume the reliability of telecom-munication civil facilities, and the disaster prevention design of telecommunication civil facilities is a requirement for restoration measures by systemization during disasters.
In order to attain the object of safely and inexpensively housing communication cables, various structural types have been developed for telecommunication civil facilities. These include underground structures that are buried either horizontally or vertically and structures that deform along with the movement of the ground. Underground cables that are buried in the earth are protected by various types of structures such as cable tunnels and conduits, and are spread vertically and horizontally.
When telecommunication civil facilities and other buried objects are compared, the following char-acteristics emerge:
1. Safety of the communication cable, which is the housed object, is required. 2. There are many structures that house cables, and these are used from shallow locations to deep
locations. 3. In manholes, cables branch in different directions. 4. Cables are routed in a vertical direction by a pile or shaft structure. 5. In the case of conduits, cables are laid in a multigrooved and multistaged system.
A disaster prevention countermeasure that reflects such special characteristics is necessary.The assumed damage includes movement due to earthquakes, ground deformation due to earth-
quakes, landslides, breakdown of artificially built-up land areas, sinking, and fire. It is necessary to determine the countermeasure targets for each item and then carry out disaster measures.
24.3.2 Procedures for Disaster Measures
24.3.2.1 Ground Surveys
Because telecommunication civil facilities are readily influenced by the ground, a survey of the instal-lation ground is important. Surveys include general surveys and detailed surveys. Normally, a general
544 Disaster Prevention and Mitigation Technologies of Lifelines
survey of the topography and ground is performed along a train track at which a telecommunication civil facility is built, and a simplified design study is carried out so as to ensure a prescribed earthquake-proof performance. In the case where a decision cannot be based only on a general survey of the topog-raphy and the ground, or in the case of a highly important facility, a detailed survey is also conducted.
The following must be identified in a general survey: the history of liquefaction at the location, whether the micro topography at the location indicates ready liquefication, whether the location is built-up land or reclaimed land, whether the location has soft ground, and whether the underground struc-ture changes in a complex matter.
When only a general survey is insufficient, a detailed survey must be conducted, and examination for earthquake-proof conditions must be clarified. In the case of very important facilities that require par-ticularly high earthquake-proofing, detailed designs for each structure, based on the detailed surveys, are necessary.
24.3.2.2 Procedures for Analysis and Design
Three conditions must be clarified in disaster measures: assumed external force levels, the mechanism by which an external force is transmitted to a structure, and the deformation characteristics of the structure.
Based on an analysis of past damage and the results of empirical and analytic studies, a safety theory must be completed.
An external force that causes destruction to a building is quantized based on past damage and mea-sured data, and this must be done objectively. Rather than metaphorical quantities such as “withstands the Kanto earthquake” or “withstands the high tide of the Ise Bay typhoon,” the external force must be objectively represented by using measured physical quantities. Next, a cause and effect relationship about how earthquakes and high tides affect structures must be formalized.
In the case of an underground structure, an examination of impacts on items that change due to the environment in which the structures have been placed, such as the movement of the ground, distortion, changes in groundwater, and changes in the ground support capacity, is necessary. Finally, a determina-tion of the safety cannot be made without understanding the deformation properties of the structure itself. In particular, with respect to whether external forces such as earthquakes will occur during the service life of a structure, the deformation characteristics up to the point that a structure collapses must be understood, and a rational safety inspection is necessary.
If a structure has been individually designed, the three conditions described earlier may be examined in sequence. However, in the case of a telecommunication civil facility, there is a large amount of con-struction, and efforts are being made to standardize and simplify the construction. However, in the case where a simplified design is not applicable, rules for individual designs apply.
24.3.3 Disaster Measures for cable tunnel Facilities
24.3.3.1 Waterproofing Measures
As water damage measures for cable tunnel facilities, in the connection between a manhole in a station and a cable tunnel, in the connection between common conduits, and in the portions that cross rivers, waterproof walls are installed, and as far as water levels are concerned, water pressure caused by water at the highest level must be considered among the following: dangerous water levels due to high tide, water level that covers a road surface, and water level in consultation with river managers or designed river water level.
A waterproof wall is constructed from a shelf duct, a waterproof door, support pillars, or a duct block installed at the upper portion or the bottom of a wall, or in shelf ducts, and the design must be made taking into consideration the shape of the cable tunnel, the arrangement of the housed cables, and the water pressure.

545Telecommunication System: Mitigation Measures
In addition, a waterproofing apparatus for a ventilation opening or an automatic door opening and closing apparatus (disaster prevention wall apparatus) for a ventilation opening is installed in the following cases: when the position of the ventilation intake–discharge opening is lower than a dangerous water level due to high tide or when there is a concern for a road being covered by water due to topography, and water penetration into the cable tunnel from the ventilation opening is anticipated.
24.3.3.2 Fire Measures
As fire measures for cable tunnels, a firewall is installed at the joint between a communication center and a cable tunnel and at the boundary between a cable tunnel and a common conduit. A firewall is constructed from shelf ducts, fire doors, and an upper wall and a lower wall, and is installed after taking into consideration the shapes of station manholes and common parts of conduits, as well as the arrangement of the housed cables, and the expansion joints at the communication center building.
In addition, during a fire, prevention measures of fire spreading must also be applied to the communi-cation cables, power cables, and water supply and drainage pipes that pass through the firewall.
When the installation locations for waterproof walls and firewalls overlap, a waterproof and fire-proof wall is installed. This is built with waterproof and fireproof ducts as well as waterproof doors, and designed so as to enable both waterproofing and fireproofing functions. A disaster prevention wall (a generic term that includes a waterproof wall, a firewall, and a waterproof firewall) and ventilation openings can ensure ventilation by remaining open during normal times, and are automatically closed when an abnormality occurs and is traced by detectors. The firewall apparatus is constructed from an automatic firewall door opening–closing apparatus, an automatic ventilation door opening–closing apparatus, and an operation control panel. The automatic ventilation door opening–closing apparatus is a structure that receives an activation signal from a water penetration sensor or a water level sensor during the occurrence of an abnormal situation such as heavy rain, flooding, and sewage pipe breakage, and the ventilation door automatically closes.
As a fire prevention countermeasure for a cable tunnel or a cable tunnel base station, portable fire extinguishers used for early-stage fire extinguishing are placed in station manholes, cable tunnels, near the entrance opening to a cable tunnel base station, and electrical transformer installation locations. The number of placed fire extinguishers is set taking into consideration the operational configuration so as not to hinder safety or operation.
24.3.3.3 earthquake-Proof Measures
24.3.3.3.1 Earthquake-Proof Evaluations of Cable Tunnel FacilitiesExaminations and evaluations of earthquake-proof measures of the cable tunnels are conventionally performed individually. Although there has been no standard examination flow for this evaluation, currently, a standard evaluation system and evaluation flow have been prepared referring to each type of earthquake-proof standard. The earthquake evaluation outline flow for a cable tunnel is shown in Figure 24.20. According to the outline flow, earthquake-proof evaluation is performed having as objects open-cut tunnels in weak ground, shallow cable tunnels constructed by shields, and comparatively deep cable tunnels constructed by shields.
Generally, for open-cut tunnels that have a shallow construction depth, in which case an L2 seismic ground motion is assumed, the generated distortion may exceed the yield strain. Because a particularly large strain is generated at a fixed point line, steel-reinforced concrete can be destroyed.
In contrast, with respect to a cable tunnel constructed by a shield, in which case an L2 seismic ground motion is assumed, it is believed that cracks occur in the secondary lining and fixed point lines, but there is no danger of complete collapse. The shift amount at a fixed point line is estimated to be several centimeters to several tens of centimeters.

546 Disaster Prevention and Mitigation Technologies of Lifelines
24.3.3.3.2 Earthquake-Proof Measures for Cable Tunnel FacilitiesIn the 1995 southern Hyogo prefecture earthquake, in areas that liquefied due to the earthquake, an open-cut cable tunnel moved considerably with respect to the communication center building that was supported by foundation piles, and underground water penetrated into the building from open joint units causing damage. In addition, in the earthquake-proof analysis results for open-cut cable tunnels, it was confirmed that large distortion was generated in the installation portion of the cable tunnel and piles. As a countermeasure for this, flexible rubber pipe joints with shift-tracking and water-blocking properties have been installed, and simultaneously, a construction method for efficiently installing these joints in existing cable tunnels is being developed as shown in Figure 24.21.
Middle earthquakeLarge earthquake
Floating by liquefaction
ModelingAxis direction: Beam on elastic floor
Cross-sectional direction: Rahmen structureSpecial section: Modeled individually (considering joint,
stiffness, ground condition)
Start
Transfer function
AnalysisResponse displacement method
Flame analysis
Safety verificationMiddle earthquake: allowable stress
Large earthquake: floating, Yield load
Earthquake setting
FIGURE 24.20 Seismic design of cable tunnel flow.
200 mm
FIGURE 24.21 Flexible joint (open-cut cable tunnel).

547Telecommunication System: Mitigation Measures
Similarly, in the southern Hyogo prefecture earthquake, although there was no hindrance to com-munication services, the cable tunnel constructed by a shield protruded toward the pile, there was concrete separation, and cracks occurred. Based on a structural analysis, it was confirmed that pile lines were a weak point, and thus, a countermeasure was taken in which cross-sectional Ω-shaped annular rubber joints with flexibility and water-blocking characteristics were installed. The required capacities for a rubber joint are set as an axial tolerated shift amount of ±100 mm and a basic water pressure resistance capacity of 0.3 MPa. The tolerated shift amount is set taking into consideration past disaster examples and earthquake-proof evaluation results. The water pressure resistance capac-ity is based on the installation depth of the cable tunnels. The installation of rubber joints is shown in Figure 24.22.
24.3.4 earthquake-Proof Measures for conduit Facilities
24.3.4.1 earthquake-Proof Measures for conduits
24.3.4.1.1 Insertion JointsSince 1985, the joint structure in conduits was changed to an insertion structure, and efforts have been made to improve the earthquake-proofing and efficiency of the construction operation. Rigid polyvinyl-chloride pipes, steel pipes, and cast iron pipes are materials used for the conduits, and in the ground that underwent liquefaction, efforts were made to improve reliability by a combination of steel pipes and secession prevention joints. The structure of rigid polyvinylchloride pipe insertion joints is shown in Figure 24.23.
Rubber joint
Vertical shaft
Primary lining
Secondary lining
±100 mm
Rein
forc
ed
FIGURE 24.22 Rubber joint of vertical shaft (shield tunnel).
FIGURE 24.23 Insertion joint.

548 Disaster Prevention and Mitigation Technologies of Lifelines
24.3.4.1.2 Secession Prevention JointsIn liquefied ground, bridge abutments, and built-up areas, efforts have been made to improve reliability by adding a separation-resisting function because large ground shifts are anticipated as shown in Figure 24.24. Due to the secession prevention mechanism, the integrity of conduits is ensured, and in combina-tion with the cable’s excess length countermeasure, their reliability during earthquakes can be improved.
24.3.4.1.3 Duct SleevesBy using duct sleeves, which are expansion joints at the connection between a manhole and a conduit, relative shifting between a manhole and a conduit that occurs during an earthquake is absorbed, and safety is improved as shown in Figure 24.25.
24.3.4.1.4 Building Access ConduitsBy using a flexible pipe structure for the lead-in portion from a conduit facility to a building, a structure is attained in which large relative shifts due to uneven sinking are absorbed, and relative shifts during earthquakes are absorbed as shown in Figure 24.26.
FIGURE 24.25 Duct sleeve.
FIGURE 24.24 Stopper joint.

549Telecommunication System: Mitigation Measures
24.3.5 earthquake-Proof Measures for Manholes
Manholes are box-shaped steel-reinforced concrete structures that are buried in the ground. They are designed by taking into account a predetermined seismic force. Duct sleeves, which have an expan-sion function, are used in the connection with the conduit. In addition, particular measures are imple-mented depending on the installation conditions of the manhole.
24.3.5.1 Gravel Drain construction
When manholes are installed in areas where liquefaction due to earthquakes is anticipated, gravel drains made of heavy-weight cement concrete are utilized in the vicinity of the manholes. Gravel drains comprise a water passage (crushed stone grade 5) that relieves water pressure in the vicinity of the manhole from below, a filter layer (crushed stone grade 7) that prevents clogging thereof, and a water drainage system that is connected to the lower-level road bed. An installation example is shown in Figure 24.27.
24.3.5.2 Steel Fiber–Reinforced concrete Used in the Duct
Because a manhole duct is a connection point with a conduit, there are cases in which a large relative shift occurs due to ground deformation during an earthquake, and detachment of chunks of concrete and destruction of communication cables occur. Efforts are being made to improve the load-bearing capacity by using steel fiber–reinforced concrete as shown in Figure 24.28.
Hand holeFlexible conduits Building
FIGURE 24.26 Flexible conduits of mounting portion.
Drain section
Hydrographic
A
B
Plane Plane
SideFilter
Surface
RoadbedA΄
A–A΄ B–B΄
B́Filter: Gravel 7th (Japanese standard, over 10 cm)Hydrographic: Gravel 5th (Japanese standard, over 30 cm)
FIGURE 24.27 Example of a gravel drain.

550 Disaster Prevention and Mitigation Technologies of Lifelines
24.3.6 earthquake Measures for Special Facilities
24.3.6.1 earthquake Measures for Private Bridges
A private bridge is a bridge dedicated to communication cables that is used when an NTT communica-tion cable crosses a river, for example, and there are now approximately 4200 such bridges nationwide. The length of the bridges ranges from several meters to several hundred meters, and there are various types of bridges, such as rolled steel beam bridges and truss bridges. Private bridges are structures that form telecommunication civil structures along with conduits, manholes, and cable tunnels, but because they are aboveground, unlike other telecommunication civil facilities, they are easily affected by seismic ground motion, and there is a possibility that they will be the weak point in telecommunication civil facilities. In past earthquakes, impairment of support sections, buckling of main beams, and collapse of the rear side of a bridge abutment have occurred as shown in Figure 24.29.
Compared to the characteristics of a roadway bridge, the beams in a private bridge are light in order to make the supported load small and the widths of the bridge beams are narrow as they are dedicated
: Steel fiber
FIGURE 24.28 Steel fiber–reinforced concrete of a duct.
Conduits
Main beam buckling Bearing break Abutment
Near abutment depression
FIGURE 24.29 Damage to a private bridge.

551Telecommunication System: Mitigation Measures
to communication cables. Based on this, separate measures from those for road bridges, such as the prevention of a widthwise bridge collapse, are required.
In order to effectively and efficiently implement earthquake-proof measures, the necessary earth-quake-proof capacity of private bridges are ranked based on the possibility of secondary fire damage and the importance of the facility, for instance, and it is decided whether or not measures are necessary. In particular, in the case where there is a danger of secondary fire damage due to a collapsed bridge, prevention measures are implemented as a fail-safe.
24.3.6.2 investigation of earthquake-Proof evaluation and Application Areas of Stic
The Shield Tunnel Interfaces with Conduits (STIC) system consists of conduit facilities wherein, in order to provide high functionality and effective utilization of cable tunnels, cable tunnels and manholes are connected by a shaft at an intermediate point between piles, and a small number of cables are branched. As a result of evaluating the earthquake-proof capacity of STIC for L2 seismic ground motion and liquefaction by establishing a number of ground models, it was clarified that the pipe’s main body and joints would be safe in all cases of L2 seismic ground motion. With respect to liquefaction, as a result of carrying out an examination by distinguishing the case where lateral flow occurs and the cases where ground sinking occurs, it was confirmed that in the latter case, the generated strain on STIC pipes fell significantly below the evaluation standard values for ground sinking of 15–75 cm. However, depending on the ground conditions, measures such as reinforcing cable tunnel crowns and improving the expan-sion function of manhole junctions may be necessary.
In contrast, in all cases where lateral flow occurred, results showed that the STIC stress limit was reached at the point where the ground had shifted by about 10–30 cm, and the possibility of applying a countermeasure is decided according to the ground conditions.
24.4 earthquake-Proof Reliability evaluation of Underground Facilities
24.4.1 outline of Reliability evaluation technology
During the Kobe earthquake, time was required to grasp the state of disaster, and this became a large obstacle during reconstruction. Based on lessons from this event, the underground facility for earth-quake-proof evaluation technology (referred later as “earthquake-proof evaluation AP”) was developed [5,6].
This system performs earthquake-proof evaluation of conduits beforehand based on information about earthquakes, the ground, and the facilities. It identifies the locations at which earthquake damage is assumed before the occurrence of a disaster, and is useful in drawing up facility ground designs and facility renewal plans. At the same time, this system has the objective of being useful in macro-estimating dam-age states of telecommunication civil facilities and underground cables, grasping the amount of damage, searching for disaster locations, calculating reconstruction costs, and investment planning for resources based on earthquake information about the epicenter and the scale after the disaster. In addition, the use of map display functions make it possible to implement, for example, recovery plan proposals that con-form to the plans of other corporate entities having underground facilities, and efficient reconstruction. Earthquake-proof evaluation AP is an application that calculates the seismic ground motion based on various types of data, such as facility data, ground quality data, and microtopography data; liquefaction danger degree maps, which are publicly available materials; and earthquake information that assumes that an earthquake will occur in this area, and implements liquefaction determination. In addition, based on a damage probability calculating table for facilities that has been calculated in advance (disaster probability by ground acceleration and ground liquefaction), a calculation of the number of damaged facilities and the approximate reconstruction costs are simulated, and the results are displayed in the form of maps. By using earthquake-proof evaluation AP, implementing a disaster assumption simulation that takes into

552 Disaster Prevention and Mitigation Technologies of Lifelines
consideration the ground characteristics in a certain area and the earthquake generation environment is possible. An operation of the earthquake-proof evaluation AP is shown in Figure 24.30.
In the future, further aging of telecommunication civil facilities that were built in large quantities during the period of rapid growth is expected. Efficient facility renovation and implementation of rein-forcement has become necessary. In order to implement reinforcement of facilities and earthquake-proof measures effectively using a limited budget, efficiently evaluating the earthquake-proof capacity of large telecommunication civil facilities is important, and earthquake-proof evaluation AP can be used as a tool for achieving this. The earthquake-proof evaluation AP can use existing facility databases and map databases by adding functions to planning systems for NTT’s telecommunication civil facili-ties, and efforts can be made to reduce the costs of the initial investment. The basic functions of the earthquake-proof evaluation AP are shown in Figure 24.31.
24.4.2 calculation Procedure
The following is an outline of the calculation procedure.
24.4.2.1 initial Settings
In the initial settings, input and processing of topographical data and drilling data for evaluating the ground is carried out. In addition, microtopography information of land classification maps, and earth-quake and liquefaction information that are made public by autonomous organizations are input.
24.4.2.2 earthquake information input
Anticipated earthquakes, epicenter positions (longitude and latitude), and magnitudes are input. In the case where previous facility earthquake-proof evaluation has been carried out, various types of
Study of reinforced measures
Study of restore measures
Important lineEquipment reinforced
Important lineRestore, top priority
Same time restore gas, power, water
Change to duct sleeveLining methodRoute change
Restore prioritizationCreate a recovery scenario
Create a same time recovery plan with other
lifeline company
Average damage rate0.00 ≤ X < 0.050.05 ≤ X < 0.100.10 ≤ X < 0.150.15 ≤ X < 0.200.20 ≤ X < 1.00
FIGURE 24.30 Seismic assessment software.
553Telecommunication System: Mitigation Measures
earthquake information are input that the regional autonomous organization where this facility build-ing is located has assumed during its disaster prevention plan drafting.
24.4.2.3 Seismic Ground Motion and Seismic intensity estimation
In the case where previous earthquake-proof evaluations have been carried out, taking decisions that are in line with public materials becomes possible by combining seismic intensity distribution maps and liquefaction maps, which have been prepared by the national and regional public bodies, with facility data. In areas that cannot access public data, based on earthquake information (magnitude, epicenter location, depth), the maximum surface acceleration can be estimated by using a distance attenuation formula, and the calculation of the anticipated magnitude for each distribution area access network and the determination of liquefaction can be performed. In the case where damage estimation is conducted after an earthquake has occurred, data announced by the Meteorological Agency is input.
24.4.2.4 Liquefaction Determination
In the earthquake-proof evaluation AP, liquefaction determination is done by aggregating liquefaction danger degree maps, decisions that used microtopographical classifications, and decisions that used drilling data. In the case of a determination based on microtopographical classification, the earthquake-proof evaluation AP automatically classifies liquefaction into a high possibility of liquefaction, a pos-sibility of liquefaction, a low possibility of liquefaction, and nonliquefaction according to the maximum surface acceleration found by the distance attenuation formula and the microtopography. In the case of a determination based on drilling data in ground information databases, a factor in liquefaction (FL) value and a probability of liquefaction (PL) value are calculated after conducting the necessity judg-ments of liquefaction determination, and the liquefaction determination is automatically carried out.
24.4.2.5 Facility evaluation
There are seven types of facilities that are the objects of evaluation in earthquake-proof evaluation AP: underground cables, manholes, handholds, building lead-in conduits, bridge-attaching conduits, main-line conduits, and wiring conduits. Each facility is included in several classifications depending on the structure type and construction year, and the damage rate can be estimated by combining the presence or absence of liquefaction and the seismic intensity.
Facility data
Ground data
Earth-quakedata
Underground cable
Infrastructure
Liquefaction hazard map
Microtopography map
EpicenterMagnitude
other information
Damage decision of infrastructure
Damage data of past earthquake
Damage probability sheet
Earthquake estimateDecision of liquefactionDecision of damage rate for each facilities
Damage decision of cable
Ground settlement data
Experimental data of cable test
Damage probability sheet
Decision of damage rate for each cableDecision of damage rate for connecting point
Cable simulation
Infrastructure simulation
FIGURE 24.31 Basic function of seismic assessment software.

554 Disaster Prevention and Mitigation Technologies of Lifelines
Damage rates are found by disaster analysis of past large-scale earthquakes that include the southern Hyogo prefecture earthquake, and these values estimate the percentage that damage will occur between manholes, pipe types in one span, and in pipes built in a certain year. Moreover, the construction year is classified according to the introduction year of the main earthquake-proof countermeasure, which was the renovation of the joint structure.
24.4.2.6 evaluation of communication cables
Damage determination of cables that are housed in conduits can be implemented by using the earth-quake-proof evaluation AP. As for underground cables, they are subjected to localized shear due to ground sinking in divisions that significantly vary across geologic strata or other buried objects, and cases have been reported where lateral pressure and shear forces acted on the cables and destroyed them due to breaking and separation. In the Niigata–Chuetsu earthquake of 2004 and the Niigata–Chuetsu–Oki earthquake of 2007, cases were reported where, due to surface destruction in built-up areas, compression forces acted on entire cables, which were severed by the bracket metal of cases and manholes, causing loss of transmission over long spans.
The damage to cables occurred due to the following processes, as shown in Figure 24.32:
Step 1. An earthquake occurs, the telecommunication civil facility oscillates along with the ground, and lateral flow and ground sinking occur due to liquefaction.
Step 2. Expansion and bending of conduits occur following the deformation of the ground at loca-tions where there are many degraded facilities and much ground deformation, and breakage and separation of joint portions occur.
Step 3. Compression, bending, and shear forces act on the cables that are housed in the conduits, and communication failure occurs.
Such a damage process is replicated by model experimentation and the damage rate determination can be performed based on cable damage rate calculating tables that have been produced.
Earthquake
Ground
General area: Seismic motionLiquefaction area, soft ground: ground
settlement
Infrastructure
MH: float, tilt, grade ring movementConduits: joint break, secession, breakage
Loss of cable protectionfunction
Cable
Fiber strain by cable movement and pull forceDisconnection by sheer force
FIGURE 24.32 Cable damage mechanisms.

555Telecommunication System: Mitigation Measures
24.4.3 evaluation examples of telecommunication civil Facilities
Examples of implementing facility evaluation assuming an earthquake event in Tokyo will be intro-duced. Figure 24.33a is an example that shows the damage rate for conduits displayed on a map. In central Tokyo, because telecommunication civil facilities were built long ago, there are many dilapidated facilities, and therefore it shows an overall high damage rate. In addition, by examining the details of facilities that have a high damage rate, it can be determined that the proportion of damaged seal case connection cast iron pipes built before 1964 is high.
Figure 24.33b is an example that shows the maximum damage rate for cables housed in conduits using a map. By evaluating the damage rate for communication service levels in this manner, in com-parison to the first example (Figure 24.33a), further focusing on weak locations becomes possible, and the priority of areas in which earthquake prevention measures are necessary is clearer. Detailed infor-mation for each cable can be seen by clicking the cable sector on the screen, and thus, this can be used for applying a further priority by incorporating the importance of the cables.
Examples of triggers for implementing reform and renovation reinforcement of a telecommunication civil facility include, in addition to earthquake-proof measures, various types of information, such as information related to the degradation of a facility, information related to capacity insufficiency of a facility, intensive planning for a number of routes, cooperative construction planning with other com-panies, and obstacle movement information. Combining these and taking into account the future, there is a necessity to implement more effective measures by using a general evaluation that takes into account reliability, economy, constructability, and environmental safety.
In the earthquake-proof evaluation AP, in addition to an underground cable evaluation function, the reliability of a communication facility can be evaluated for each user by the reliability evaluation linear display function from the user’s building to the communication center building.
References
1. Japan Society of Civil Engineers. Handbook of Civil Engineering, 4th edn., Gihodo Publishing, Tokyo, Japan, 1989 (in Japanese).
2. Telecommunication Research Association. Outline for Telecommunication, Ohmsha, Tokyo, Japan, 2011 (in Japanese).
(a) (b)
xxMHStructure: concrete blockConstruction year: 19xxDamage rate: xx%
Damage rate Damage rateLow
High
Liquefaction
NoYes
Low
High
Liquefaction
NoYes
Private bridgeConstruction year: 19xxDamage rate: xx%
Seismic scale 7 area
Seismic scale 7 area
Refin
e equ
ipm
ent
Damagerate11%12%7%
xxMH~yyMHCable
IDSubscriber
Trunk 1Feeder 1
Cabletype
1000 Fibers140 Fibers
11800 pairs
xxMH~yyMHConstruction
year196019601970
Damagerate50%50%30%
Conduittype
Cast ironCast iron
steel
FIGURE 24.33 Cable damage simulation. (a) Map view of damage rate of infrastructure. (b) Map view of damage rate of cable.

556 Disaster Prevention and Mitigation Technologies of Lifelines
3. Y. Yamazaki, N. Segawa, N. Ishida, and T. Suzuki. Consideration on damages of telecommunication infrastructure facilities due to the Great East Japan Earthquake, Journal of Japan Association for Earthquake Engineering, 12(5), 2012, 55–68. Special Issue: The 2011 Great East Japan Earthquake (2) (in Japanese).
4. Information Infrastructure Research Association. The Telecommunication Civil Technology Supporting Information Infrastructure, The Telecommunication Association of Japan, Tokyo, Japan, 2000 (in Japanese).
5. Y. Yamazaki, S. Baba, K. Tanaka, T. Okazawa, and T. Kishimoto, Seismic evaluation technology for underground communication facilities, NTT Technical Review, https://www.ntt-review.jp/archive/ntttechnical.php?contents=ntr200801le1.pdf&mode=show_pdf. Accessed August 6, 2014.
6. H. Uehara, S. Baba, K. Tanaka, and T. Deguchi. Disaster prevention and security technologies con-tributing to safe and secure networks, NTT Technical Review, https://www.ntt-review.jp/archive/ntttechnical.php?contents=ntr200606041.pdf. Accessed August 6, 2014.

w w w . c r c p r e s s . c o m
K20543
CIVIL ENGINEERING
6000 Broken Sound Parkway, NW Suite 300, Boca Raton, FL 33487711 Third Avenue New York, NY 100172 Park Square, Milton Park Abingdon, Oxon OX14 4RN, UK
an informa business
w w w . c r c p r e s s . c o m
Critical Urban Infrastructure
Handbook
Critical Urban Infrastructure
Handbook
Critical Urban Infrastructure Handbook
Critic
al U
rba
n In
frastru
ctu
reH
an
db
oo
k
JSCE•
Hamada“This handbook provides a comprehensive overview of the design, construction, and management of critical infrastructures that underpin economic and socioeconomic activities in urban cities. All major infrastructures are covered: water supply, sewerage, gas, electricity, and telecommunication. The contributors of the handbook have profound knowledge and experience in individual fields and discuss the key essentials of infrastructure engineering and risk management in a concise manner. A unique aspect of this handbook is the disaster prevention and mitigation section, which is based on a long history of learned lessons dealing with the past disasters in Japan. This is a handy technical and professional book.”
—Katsu Goda, University of Bristol, UK
“This is an excellent handbook written by experts in the fields of water pipeline systems, sewerage systems, natural gas distribution systems, electric power systems, and telecommunication systems. The collaborative work by the contributors has produced a reference material that can be of practical use to engineers, practitioners, and stakeholders involved in the construction, maintenance, disaster prevention, and mitigation of urban lifeline systems. ... Senior undergraduate and graduate students will also benefit from this excellent reference material.”
—Lessandro Estelito O. Garciano, De La Salle University, Manila, Philippines
Represents the State of the Art in Urban Lifeline Engineering Urban lifelines are buried or aboveground network systems used for water, sewerage, gas, power, and telecommunications. Dedicated to preserving the functions of lifeline systems against natural disasters, the Critical Urban Infrastructure Handbook is a vital compilation of urban utility management. This text utilizes the input of leading experts with extensive experience in natural disasters and provides a better understanding of the technical and legal framework of infrastructure construction and operation.
Examine the Damage Data of Urban Lifelines Suffered by Seismic Disasters The book addresses water supply and sewerage, power, gas, telecommunications joint utility corridor lifeline facilities, and other critical civil infrastructure lifelines. It emphasizes the importance of the resilience of lifeline systems against natural disasters in protecting human lives and supporting survivors of disasters as well as in promptly recovering and reconstructing the affected areas. It describes the structural damage of nodes and links as well as the functional damage of the lifeline system from the viewpoint of disaster prevention and mitigation measures.
The Critical Urban Infrastructure Handbook comprehensively describes common issues of lifeline systems and provides practical information to engineers and industry professionals involved in the planning, construction, and maintenance of lifeline systems.
Japan Society of Civil EngineersCritical Urban Infrastructure Committee
M. Hamada, Editor-in-Chief
