cross-disciplinary consultancy to enhance predictions of
TRANSCRIPT

Cross-Disciplinary Consultancyto Enhance Predictions of Asthma
Exacerbation Risk in BostonThe Harvard community has made this
article openly available. Please share howthis access benefits you. Your story matters
Citation Reid, M., J. Gunn, S. Shah, M. Donovan, R. Eggo, S. Babin, I. Stajner,et al. 2016. “Cross-Disciplinary Consultancy to Enhance Predictionsof Asthma Exacerbation Risk in Boston.” Online Journal of PublicHealth Informatics 8 (3): e199. doi:10.5210/ojphi.v8i3.6902. http://dx.doi.org/10.5210/ojphi.v8i3.6902.
Published Version doi:10.5210/ojphi.v8i3.6902
Citable link http://nrs.harvard.edu/urn-3:HUL.InstRepos:31731653
Terms of Use This article was downloaded from Harvard University’s DASHrepository, and is made available under the terms and conditionsapplicable to Other Posted Material, as set forth at http://nrs.harvard.edu/urn-3:HUL.InstRepos:dash.current.terms-of-use#LAA

Cross-Disciplinary Consultancy to Enhance Predictions of Asthma Exacerbation Risk in Boston
1 Online Journal of Public Health Informatics * ISSN 1947-2579 * http://ojphi.org * 8(3):e199, 2016
OJPHI
Cross-Disciplinary Consultancy to Enhance Predictions of Asthma Exacerbation Risk in Boston Margaret Reid1, Julia Gunn1, Snehal Shah1,2, Michael Donovan1, Rosalind Eggo3, Steven Babin4, Ivanka Stajner5, Eric Rogers5, Katherine B. Ensor6, Loren Raun6, Jonathan I. Levy7, Ian Painter8, Wanda Phipatanakul9, Fuyuen Yip10, Anjali Nath1, Laura C. Streichert11, Catherine Tong11, Howard Burkom4
1. Boston Public Health Commission, Boston, MA
2. Boston University School of Medicine, Dept. of Pediatrics, Boston, MA
3. London School of Hygiene & Tropical Medicine
4. Johns Hopkins University Applied Physics Laboratory, Laurel, MD
5. National Oceanographic and Atmospheric Administration, National Weather Service
6. Department of Statistics, Rice University, Houston, TX
7. Boston University School of Public Health, Dept. of Environmental Health, Boston, MA
8. University of Washington School of Public Health, Dept. of Health Services, Seattle, WA
9. Boston Children’s Hospital, Harvard Medical School, Boston, MA
10. Centers for Disease Control and Prevention, National Center for Environmental Health, Division of Environmental Hazards and Health Effects, Atlanta, GA
11. International Society for Disease Surveillance, Boston, MA
Abstract
This paper continues an initiative conducted by the International Society for Disease Surveillance with funding from the Defense Threat Reduction Agency to connect near-term analytical needs of public health practice with technical expertise from the global research community. The goal is to enhance investigation capabilities of day-to-day population health monitors. A prior paper described the formation of consultancies for requirements analysis and dialogue regarding costs and benefits of sustainable analytic tools. Each funded consultancy targets a use case of near-term concern to practitioners. The consultancy featured here focused on improving predictions of asthma exacerbation risk in demographic and geographic subdivisions of the city of Boston, Massachusetts, USA based on the combination of known risk factors for which evidence is routinely available. A cross-disciplinary group of 28 stakeholders attended the consultancy on March 30-31, 2016 at the Boston Public Health Commission.
Cross-Disciplinary Consultancy to Enhance Predictions of Asthma Exacerbation Risk in Boston
2 Online Journal of Public Health Informatics * ISSN 1947-2579 * http://ojphi.org * 8(3):e199, 2016
OJPHI
Known asthma exacerbation risk factors are upper respiratory virus transmission, particularly in school-age children, harsh or extreme weather conditions, and poor air quality. Meteorological subject matter experts described availability and usage of data sources representing these risk factors. Modelers presented multiple analytic approaches including mechanistic models, machine learning approaches, simulation techniques, and hybrids. Health department staff and local partners discussed surveillance operations, constraints, and operational system requirements. Attendees valued the direct exchange of information among public health practitioners, system designers, and modelers. Discussion finalized design of an 8-year de-identified dataset of Boston ED patient records for modeling partners who sign a standard data use agreement.
Keywords: asthma exacerbation, predictive model, environmental risk factor, asthma surveillance.
Abbreviations: International Society for Disease Surveillance (ISDS), Defense Threat Reduction Agency (DTRA), Biosurveillance Ecosystem (BSVE), emergency department (ED), Boston Public Health Commission (BPHC), Boston Public Schools (BPS), Centers for Disease Control and Prevention (CDC), influenza-like illness (ILI), National Weather Service (NWS), numerical weather prediction (NWP), Community Multi-scale Air Quality (CMAQ), Tropical Rainfall Measuring Mission, Moderate Resolution Imaging Spectrometer (MODIS), United States Geological Survey (USGS), Normalized Difference Vegetation Index (NDVI), Enhanced Vegetation Index (EVI), National Oceanic and Atmospheric Administration (NOAA), Hybrid Single Particle Lagrangian Integrated Trajectory (HYSPLIT), Bayesian Network (BN), Business Use Agreement (BUA), conditional probability tables (CPTs), Artificial Neural Network (ANN), Time Lagged Recurrent Networks (TLRN), Physiologically Equivalent Temperature (PET)
Correspondence: [email protected]
DOI: 10.5210/ojphi.v8i3.6902 Copyright ©2016 the author(s) This is an Open Access article. Authors own copyright of their articles appearing in the Online Journal of Public Health Informatics. Readers may copy articles without permission of the copyright owner(s), as long as the author and OJPHI are acknowledged in the copy and the copy is used for educational, not-for-profit purposes.
Introduction
This paper continues a previously reported initiative to connect near-term analytical needs of public health practice with technical expertise in academia, industry, and government for the purpose of enhancing the awareness and investigation capabilities of those who monitor population health and respond to significant public health issues on a daily basis. This initiative is being conducted by the International Society for Disease Surveillance (ISDS) with funding from the Defense Threat Reduction Agency (DTRA) to complement the mission of the Biosurveillance Ecosystem (BSVE) [1]. A prior paper described the formation of consultancies bringing together stakeholders for requirements analysis and dialogue regarding costs and benefits of feasible and sustainable analytic approaches [2]. The first use case, driven by the North Carolina Department of Health, was the detection of clusters of emergency department (ED) visits of potential concern without classifying patient records into preconceived syndrome groups.
The current paper reports the efforts and findings of a consultancy focused on the use case of improving public health response to asthma exacerbations. A key objective is to supply enough information to aid other jurisdictions in replicating the legal, data-related, and sociotechnical requirements of building similar collaborations.

Cross-Disciplinary Consultancy to Enhance Predictions of Asthma Exacerbation Risk in Boston
3 Online Journal of Public Health Informatics * ISSN 1947-2579 * http://ojphi.org * 8(3):e199, 2016
OJPHI
The goal of the consultancy was to assess the feasibility and functional requirements of a predictive tool to discern periods of increased exacerbation risk in order to improve the timeliness and targeting of preventive actions by the Boston Public Health Commission (BPHC). To facilitate identification and adoption of policy, system or programmatic efforts, BPHC and ISDS invited leaders of key city agencies, Massachusetts Department of Public Health, asthma and environmental researchers and clinicians at Boston’s pediatric hospitals. Discussions were informed by the knowledge that Boston’s lower income residents are disproportionately affected, as are residents of color and those in specific neighborhoods. This disparity must inform the nature of the interventions adopted.
Asthma Burden
Asthma is a chronic inflammatory disease of children and adults in which the airways in the lower respiratory tract are hypersensitive to certain stimuli and react by tissue swelling and bronchial constriction. Most people presenting with asthma to health care providers have symptoms of cough, dyspnea, and wheezing. Presenting signs can include tachypnea, tachycardia, and diaphoresis. Severe asthma exacerbations occur in about 10% of asthma patients, and prevention efforts and early intervention are essential. Even in less than severe cases, permanent structural changes in the airways may occur and result in progressive loss of respiratory function over time.
Asthma affects approximately 24 million Americans, including 6.2 million children of ages 17 years and under [3]. Controlling asthma requires a combination of medication and avoiding exposures that make asthma worse, often referred to as asthma ‘triggers’. Asthma can have significant consequences on the health, and social, and economic well-being of affected individuals and their families. In 2013, asthma was associated with nearly 14 million missed school days nationwide[3]. As a major cause of parental work absenteeism, childhood asthma results in loss of productivity estimated at USD $719.1 million [4]. In 2011, there were 1.8 million ED visits with a primary diagnosis of asthma, and the annual direct health care cost of asthma has been estimated to be $50 billion [5].
Racial/ethnic and geographic differences in the prevalence of asthma are well documented. In 2014, asthma prevalence was higher among Non-Latino Black Americans (9.9%) than Non-Latino White (7.6%) and Latino Americans (6.7%), which reflects a persistent disparity [3]. In 2010, Black Americans had higher asthma hospitalizations (29.9 per 10,000) than Whites (8.7 per 10,000). While Latino youth ages 18 and under have similar rates of asthma to White youth, rates of asthma hospitalizations, ED visits and deaths among Latino youth are higher than their White counterpart rates [6]. Currently, the Northeastern United States, which includes Boston, Massachusetts, has the highest regional pediatric asthma rate at 10.9% compared with the Midwest (8.4%), South (8.9%), and West (6.9%) [7].
From 2008-2012 in Boston, the age-specific asthma ED visit and hospitalization rates for children aged 3-5 years was persistently higher for Black, Latino, and Asian children when compared to White children [8]. In 2012, the ED visit rate for Black children aged 3-5 years was 3.5 times that of White children, and hospitalization rates for Black children aged 3-5 years was 4 times their White counterpart rates [8]. In addition, Boston neighborhoods with

Cross-Disciplinary Consultancy to Enhance Predictions of Asthma Exacerbation Risk in Boston
4 Online Journal of Public Health Informatics * ISSN 1947-2579 * http://ojphi.org * 8(3):e199, 2016
OJPHI
disproportionately more Black and Latino residents have higher asthma ED and hospitalization rates [8].
These differences in asthma health care utilization may reflect, in part, differential exposure to determinants of health that may prevent or trigger asthma exacerbations. These determinants include a wide range of factors from access to medical care and medications to environmental exposures related to housing and the built environment. Efforts to reduce these disparities must consider the role of these determinants in primary and secondary prevention efforts.
This consultancy was designed to identify methods to use existing health care and environmental data to inform the design of collaborative interventions to reduce asthma exacerbations among children in Boston. Given that potential interventions would require multi-sector collaboration and may include policy, systems, and environmental change beyond the scope of the local public health department, it was critical to include a wide range of stakeholders to initiate a discussion of viable and acceptable surveillance methods and requirements. The consultancy included the local public health agency, clinicians, public health practitioners, academic partners, and other city agencies. While the group recognized the need for broad representation, some stakeholders were unable to participate due to scheduling conflicts. Additionally the group size was limited to ensure effective communication, and therefore not all stakeholders could be included.
Current and potential public health responses
Boston has had a robust, multi-sector response to pediatric asthma for over 15 years. While taking a comprehensive approach to asthma prevention and control, Boston has targeted resources to those residents, populations, and geographic areas at higher risk. Many interventions across multiple sectors have been implemented. Community health workers who reflect the racial and ethnic make-up of those most affected by asthma provide in-home asthma education and coordination with city infrastructure to improve housing conditions that affect asthma. Boston’s major public housing providers have changed the design, construction, and maintenance of affordable and public housing to reduce and eliminate asthma triggers. These housing-related initiatives include the introduction of smoke-free housing policies, modifications in pest control practices, and removal of carpeting which collects dust and dust mites (https://www.hsph.harvard.edu/hphi/). The Boston Public Schools (BPS), which served 57,100 students in 2015, of which 78% were low income and 77% were Black or Hispanic, have policies addressing tobacco use, chemicals use, and pest control practices. They have also retrofitted their school buses to reduce diesel exhaust, and have nurse leaders who are trained to manage asthma [9,10]. The BPHC has among the most rigorous regulations addressing youth access to tobacco products and tobacco smoke exposure in the nation.
The City’s Environmental and Energy Department and Transportation Department have decreased traffic-related pollution through anti-idling policies, incentivized low emission vehicles, and continued to promote walking, biking and public transportation as viable alternatives to driving. The BPHC works with pediatric hospitals and Boston’s community health centers to improve clinical management systems and practices and to create a network of community-based services for asthma, particularly addressing the home environment.

Cross-Disciplinary Consultancy to Enhance Predictions of Asthma Exacerbation Risk in Boston
5 Online Journal of Public Health Informatics * ISSN 1947-2579 * http://ojphi.org * 8(3):e199, 2016
OJPHI
Yet, clearly there is more to be done. The efforts of the extensive partnerships in place regarding asthma in Boston position BPHC to identify and implement policy, system, and programmatic efforts to reduce environmental risk factors for asthma exacerbation. Through this consultancy, Boston is exploring the potential public health benefit of developing an advanced warning system for factors that contribute to asthma exacerbations on a population level including respiratory infections, weather, and air quality conditions. Through this partnership, Boston is seeking to develop an actionable, feasible, acceptable, and cost efficient system that utilizes existing syndromic surveillance data quantifying conditions such as asthma, influenza, and common cold syndromes, and environmental data, such as fine particulate matter (PM2.5) and ozone levels, to predict whether individuals with asthma are at elevated risk for experiencing an exacerbation on a given day.
Potential responses discussed include:
• Developing an alert system with guidance to notify individuals with asthma or parents.
• Developing an alert system to notify clinicians and local pharmacies to ensure that patients have adequate medication and guidance in advance of events.
• Developing prevention strategies for infection with BPS and Head Start programs, as considered in other settings [11].
• Developing notification and response for weather or air quality factors, including increased nursing availability, preventive medication for activity, and reduced outdoor time.
• Identifying alternative spaces to the home environment, which may be affected by poor indoor environmental quality when air quality or weather conditions require staying indoors.
• Using geographically specific air quality information to target traffic-related public messaging or other interventions to discourage commuters from driving into the city.
As the process moves forward, areas for intervention will be prioritized. These are bold policy and system interventions and have associated costs. Full engagement of city and other public agencies, clinical partners, academics and others will be required in the planning of such interventions.
Health Data Sources: Boston’s Syndromic Surveillance System
Boston has a source of near-real-time ED data. In 2004, the BPHC, in collaboration with the US Centers for Disease Control and Prevention (CDC), developed and implemented an electronic ED-based syndromic surveillance system. The system was developed between December 2003 and June 2004, and was implemented in July 2004. A city reporting regulation [12] was passed by BPHC, requiring all emergency departments to submit a limited data record for each patient visit. The regulation was updated in 2011 to include data elements for meaningful use.
Since 2004, all nine acute care hospitals, which include ten emergency departments, have electronically submitted data to the BPHC. Data submitted by emergency departments include visit date, age, gender, race/ethnicity, zip code of residence, and chief complaint. The diagnostic codes were excluded from this initiative because they are usually not available within 24 hours
Cross-Disciplinary Consultancy to Enhance Predictions of Asthma Exacerbation Risk in Boston
6 Online Journal of Public Health Informatics * ISSN 1947-2579 * http://ojphi.org * 8(3):e199, 2016
OJPHI
of a visit. Chief complaints are parsed and mapped to various symptom or syndrome groups. Asthma syndrome includes the terms asthma, wheezing, and reactive airway disease and known associated abbreviations and misspellings. Influenza-like illness (ILI) is defined as flu or (fever and (cough or sore throat)). A common cold syndrome was also recently developed that includes the terms for colds and upper respiratory infections excluding hypothermia and related terms. Asthma syndrome identified increased visits primarily in the spring and early autumn. During the summer months, visits associated with asthma decreased. This yearly cycle was seen in all eight years’ data.
Asthma Exacerbation Risk Factor Evidence Assessment
Risk factors for asthma include genetic and environmental variables. Increases in asthma incidence over the past few decades have brought increased emphasis on environmental factors [13]. According to the US National Institutes of Health Expert Panel Report on Diagnosis and Management of Asthma [13], “Atopy, the genetic predisposition for the development of an immunoglobulin E (IgE)-mediated response to common aeroallergens, is the strongest identifiable predisposing factor for developing asthma.” Furthermore, the report states that “Viral respiratory infections are one of the most important causes of asthma exacerbation and may also contribute to the development of asthma.” The patient’s atopy may affect their response to viral infections, and viral infections may influence the development of allergic sensitization [13]. Accordingly, a review by Gern and Busse [14] described biological and statistical evidence that asthma exacerbations are often triggered by respiratory viral infections that commonly occur during the fall cold season. Asthma exacerbations can further increase as a result of rhinovirus transmission in crowded classrooms in combination with poor respiratory etiquette and hand washing practices. Exposure to certain outdoor and indoor air pollutants (e.g., particulate matter, ozone, tobacco smoke) has been consistently found to result in asthma exacerbations (e.g., see the review by Fu et al. [15]). Environmental exposure to risk factors for asthma exacerbations may be a result of occupation, socioeconomic variables, and urban characteristics. Kimes et al. [16] described how socioeconomic variables and urban characteristics could explain 95% of the variation in hospital admission rates for pediatric asthma.
Kimes et al. [16] further emphasized that any study finding a relationship between asthma exacerbations and socioeconomic, urban, or environmental variables must provide evidence beyond gross statistical tests of significance before a cause and effect relationship can be proposed. For example, some people have misinterpreted the lack of seasonal correlation between air pollution peaks and asthma exacerbations as evidence that air pollution plays little, if any, role in asthma exacerbations. However, this lack of agreement between peaks is due to strong seasonal effects associated with other factors that obscure, but don’t eliminate, the relationship between pollutants and asthma exacerbations [17]. Because of this complexity, more advanced statistical analysis is required to uncover the effects of air pollutants, especially ozone and PM2.5 [17, 18]. Jamason et al. [19] took a synoptic approach to studying overnight asthma hospitalizations and demonstrated that weather could be considered a primary factor for asthma exacerbations during the fall and winter, while air pollution was a primary factor during the spring and summer. Based on these studies and many others (e.g., review by Brunekeef and Holgate [20]), there is ample evidence to consider air pollution a significant risk factor for asthma exacerbations.

Cross-Disciplinary Consultancy to Enhance Predictions of Asthma Exacerbation Risk in Boston
7 Online Journal of Public Health Informatics * ISSN 1947-2579 * http://ojphi.org * 8(3):e199, 2016
OJPHI
Several studies have suggested that very low or very high ambient temperature, as well as humidity, may be associated with asthma exacerbations. Higher temperatures occur when there is more sunlight, and sunlight is necessary for certain emissions to be converted to ground-level ozone [20]. Cold, dry air primarily results in exercise-induced asthma exacerbations [19, 21] because the normal physiological response to cold air inhalation (e.g., nasal humidification and heating of inhaled air) may become overwhelmed by the isocapnic hyperventilation during exercise.
Aeroallergens, such as pollen and mold, may trigger allergy-induced asthma symptoms [13, 22]. Seasons for various aeroallergens differ by geography because of variations in species and habitat and weather patterns [19, 23]. Changes in these seasons may also be impacted by climate change [e.g., 24]. Solomon [25] explained that pollen is only released during the dry phase after a cycle of wetting and drying. Pollen transport is also facilitated because wind is often increased following a rain event. Most windborne pollen grains travel about 100 meters, but some have been measured at much longer distances [25]. The prevalence of pollen in a particular area depends on the season, the abundance of plants, the wet-dry cycle, and the winds.
Both aeroallergens and air pollutants are facilitated by certain weather conditions that include sunlight, rainfall, humidity, temperature, and wind. During temperature inversions (warmer temperatures aloft and cooler temperatures below), outdoor air pollutants and aeroallergens may be concentrated closer to the surface and thus increase the exposure of susceptible patients with asthma. Weather conditions also impact the presence of upper respiratory viral infections [26], which are primary factors in asthma exacerbations [14, 15].
Available Data Sources for Asthma Exacerbation Risk Factor Modeling
For the Boston area, certain environmental data are available to help predict the presence of many of these risk factors. Unfortunately, there are no aeroallergen measurement stations in the area certified by the National Allergy Bureau of the American Academy of Allergy, Asthma, and Immunology. Thus, aeroallergen data are not readily available. The following sections describe sources of data that are available for the Boston area.
Respiratory Virus Infection Data
“Common cold” infections are the result of infection by one of a large collection of respiratory viruses, and usually cause a mild syndrome lasting a few days. In asthmatics, infections are not always mild, and have been implicated in up to 80% of exacerbations in children [15]. Seasonal common cold and ILI syndrome prevalence and incidence data are available from local public health agencies’ biosurveillance data, along with school calendar and holiday schedules.
From 2008-2015, a total of 4,240,067 ED visits were reported to the Boston Syndromic Surveillance System. Individuals who reported a Boston zip code of residence accounted for 2,253,372 emergency visits (53% of total ED visits). Of visits by individuals who reported a Boston zip code, the asthma syndrome accounted for 37,731 visits, the ILI syndrome for 31,966 visits, and the common cold syndrome for 24,208 visits. Boston residents 18 years of age or younger accounted for 368,061 of all Boston resident visits, 14,965 of asthma syndrome visits, 10,810 of ILI syndrome visits and 4,589 of all cold syndrome visits. A dataset was created

Cross-Disciplinary Consultancy to Enhance Predictions of Asthma Exacerbation Risk in Boston
8 Online Journal of Public Health Informatics * ISSN 1947-2579 * http://ojphi.org * 8(3):e199, 2016
OJPHI
specifically for this use case to be shared with solution developers through a Business Use Agreement (BUA) with BPHC. Information regarding the data set and BUA is available by contacting [email protected].
Field name Value
ID Integer
Asthma Integer 1 (yes) or 0 (no)
Influenza-like-Illness (ILI) Integer 1 (yes) or 0 (no)
Common cold Integer 1 (yes) or 0 (no)
Visit Date Date (yyyy-mm-dd)
Gender Single Letter F = Female M=Male
Age (years) Integer (998=<1 year old)
Race/ethnicity Integer 2=Asian 3=Black or African American 4=Latino 6=White 9=Other 10=Unknown
Zip Code 5 Characters
Surface and Rawinsonde Measurements of Atmospheric Data
Surface weather measurements are available from airports such as Boston’s Logan Airport. Data are collected and recorded according to standards established by the US National Weather Service (NWS). Surface data include air temperature, humidity, pressure, wind speed and direction, rainfall amounts, etc. In addition to these hourly surface measurements, rawinsondes (balloons carrying weather sensors) are launched twice daily to obtain vertical profiles of atmospheric variables such as temperature, winds, etc. Vertical measurements are important because temperature inversions (i.e., when a higher temperature layer lies over cooler temperatures near the surface) act like a lid and serve to concentrate pollutants and aeroallergens near the surface. Also, winds typically change both speed and direction with altitude. Both vertical and horizontal atmospheric measurements are also used as input
Air quality measurements, including ozone and particulates, are available from stations at Boston’s Logan Airport and nearby towns. For usage in models, the utility of these data for neighborhood-level modeling should be determined as a function of measurement type.
Cross-Disciplinary Consultancy to Enhance Predictions of Asthma Exacerbation Risk in Boston
9 Online Journal of Public Health Informatics * ISSN 1947-2579 * http://ojphi.org * 8(3):e199, 2016
OJPHI
Satellite Measurements of Atmospheric and Land Use Data
Satellite sensors measure land surface temperatures, rainfall, vegetation, and biomass burning. Using the Moderate Resolution Imaging Spectrometer (MODIS) instrument, satellite measurements of daily daytime and nighttime temperature data with 0.05-degree resolution are available from the United States Geological Survey (USGS) Land Processes Distributed Active Archive Center using their website: US Geological Survey: Land Processes Distributed Active Archive Center (https://lpdaac.usgs.gov/data_access)
Rainfall data with 0.25-degree resolution was available from the NASA Tropical Rainfall Measuring Mission satellite measurements from 1997 until the end of its mission in 2014, when it was replaced by the current Global Precipitation Measurement mission. Data are available from: http://pmm.nasa.gov/data-access
Satellite MODIS measurements also included leaf area indices, including the Normalized Difference Vegetation Index (NDVI) and the Enhanced Vegetation Index (EVI). NDVI seasonal variations closely follow human-induced patterns, such as landscape disturbance and biomass burning. EVI is calculated similarly to NDVI, but is considered to be more responsive than NDVI to canopy structural variations. Together, NDVI and EVI provide a surrogate assessment of green leaf biomass, photosynthetic activity, and the effects of seasonal rainfall. NDVI and EVI data with 0.05-degree resolution available from the USGS Land Processes Distributed Active Archive Center: US Geological Survey: Land Processes Distributed Active Archive Center: https://lpdaac.usgs.gov/data_access
Numerical Weather Prediction (NWP) Models
The U.S. NWS develops and runs several NWP models to provide short, medium, and long-term guidance over the U.S., North America, and the globe. NWP models are computer programs that use measured weather data, interpolate them to a regular grid, and then digitally solve equations of variables in space and time. The measured weather data include surface measurements (typically at airports) and vertical measurements (twice daily rawinsonde launches).
These modeling systems can be classified as either deterministic (i.e., a single forecast is run) or probabilistic (in which an ensemble of many forecasts are run at the same time with slightly varying initial conditions and/or model configurations). The advantage of a deterministic forecast is that it is only one forecast model execution, so it can be run at the highest resolution possible, allowing for a better depiction of local weather features. The highest resolution deterministic forecast is 3 km for the Continental US. At this resolution, forecasts can be made 15-48 hours in advance. An ensemble system consists of many forecasts run at the same time, so it will generally run at lower horizontal resolution, but will provide a range of possible model solutions which can be used to provide probabilistic forecasts (e.g., the percentage chance that measurable precipitation will occur at a given location). The maximum resolution is 16 km for forecasts made up to 87 hours in advance. In addition, short-term forecasting of thunderstorms can provide input to plant wetting and drying cycles that are precursors to pollen releases.

Cross-Disciplinary Consultancy to Enhance Predictions of Asthma Exacerbation Risk in Boston
10 Online Journal of Public Health Informatics * ISSN 1947-2579 * http://ojphi.org * 8(3):e199, 2016
OJPHI
Operational Air Quality Predictions
Based upon these NWP model results for weather variables, the NWS also provides operational air quality prediction for the US [27]. Operational predictions of the following air pollutant concentrations are issued for the contiguous 48 US states: ozone, wildfire smoke, and airborne dust. Ozone and dust predictions are produced twice daily, once per day for smoke predictions, at hourly resolution for 48 hours in the future at 12 km spatial resolution. Maps and tabulated values of these air pollutant predictions are available at http://airquality.weather.gov/, and binary files with predicted values in GRIB format are available at ftp://tgftp.nws.noaa.gov/SL.us008001/ST.opnl/DF.gr2/DC.ndgd/GT.aq/
Historical predictions of ozone, smoke and dust are archived at the National Oceanic and Atmospheric Administration's (NOAA’s) National Climatic Data Center and can be requested at:
http://www.ncdc.noaa.gov/has/HAS.StationYearSelect?datasetname=9950_01&subqueryby=STATION&applname=&outdest=FILE&dtypesort=dtypeord&stationsort=id.
PM2.5 predictions are publicly available at http://nomads.ncep.noaa.gov/pub/data/nccf/com/aqm/
Predictions of ozone and PM2.5 combine the NOAA National Centers for Environmental Prediction (NCEP) operational North American Mesoscale (NAM) weather predictions with inventory based emission estimates from the EPA and chemical processes within the Community Multi-scale Air Quality (CMAQ) model [27, 28]. Intermittent sources of windblown dust and of particulate emissions from wildfires based on U.S. Forest Service BlueSky system are included as well. In order to reduce prediction bias, a post-processing algorithm is applied to PM2.5 predictions [29]. Separate predictions of smoke from wildfires and dust from dust storms use the Hybrid Single Particle Lagrangian Integrated Trajectory (HYSPLIT) model. Verification of ozone and PM2.5 predictions relies on AIRNow compilation of observations from surface monitors. Verification of smoke and dust predictions uses satellite retrievals of smoke and dust. See http://www.weather.gov/sti/stimodeling_airquality for more information about NOAA NWS air quality products.
Modeling Approaches
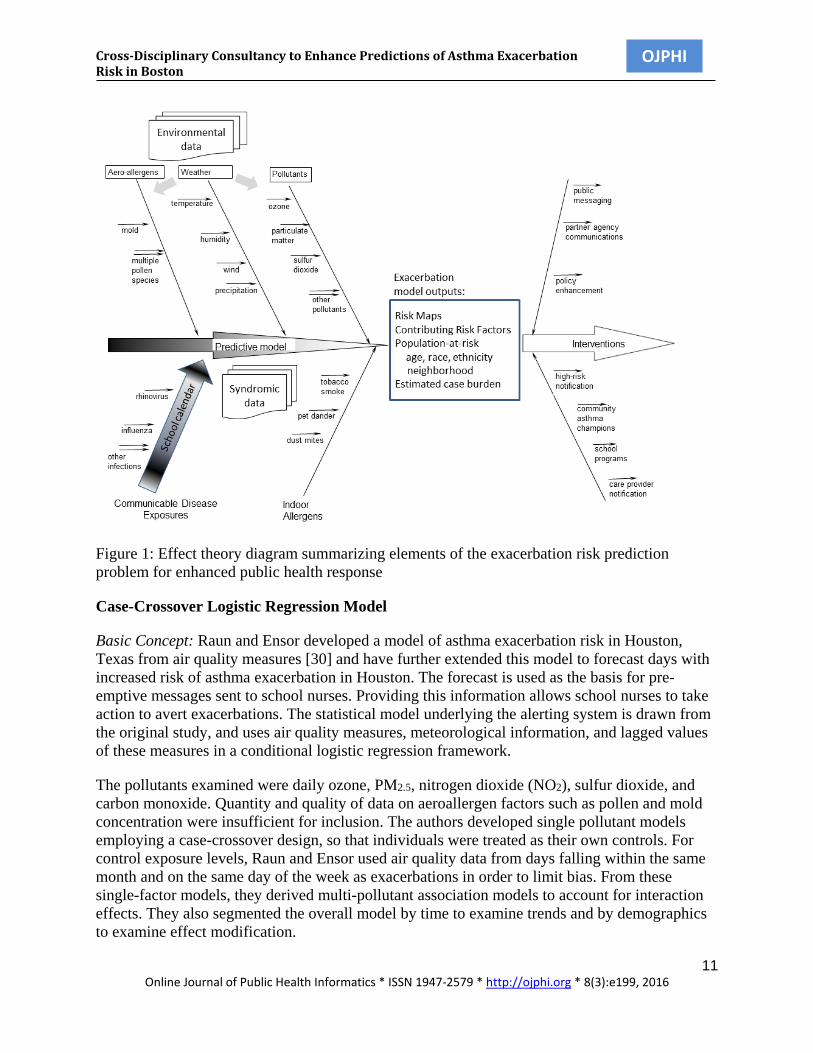
The previous sections provide public health, biological, and environmental context for the modelling capability sought for exacerbation risk prediction. Figure 1 schematically summarizes the risk factors, data environment, and public health operations in an effect theory diagram. This summary view is followed by descriptions of several published model approaches, each addressing at least some of the risk factors listed.
Cross-Disciplinary Consultancy to Enhance Predictions of Asthma Exacerbation Risk in Boston
11 Online Journal of Public Health Informatics * ISSN 1947-2579 * http://ojphi.org * 8(3):e199, 2016
OJPHI
Figure 1: Effect theory diagram summarizing elements of the exacerbation risk prediction problem for enhanced public health response
Case-Crossover Logistic Regression Model
Basic Concept: Raun and Ensor developed a model of asthma exacerbation risk in Houston, Texas from air quality measures [30] and have further extended this model to forecast days with increased risk of asthma exacerbation in Houston. The forecast is used as the basis for pre-emptive messages sent to school nurses. Providing this information allows school nurses to take action to avert exacerbations. The statistical model underlying the alerting system is drawn from the original study, and uses air quality measures, meteorological information, and lagged values of these measures in a conditional logistic regression framework.
The pollutants examined were daily ozone, PM2.5, nitrogen dioxide (NO2), sulfur dioxide, and carbon monoxide. Quantity and quality of data on aeroallergen factors such as pollen and mold concentration were insufficient for inclusion. The authors developed single pollutant models employing a case-crossover design, so that individuals were treated as their own controls. For control exposure levels, Raun and Ensor used air quality data from days falling within the same month and on the same day of the week as exacerbations in order to limit bias. From these single-factor models, they derived multi-pollutant association models to account for interaction effects. They also segmented the overall model by time to examine trends and by demographics to examine effect modification.

Cross-Disciplinary Consultancy to Enhance Predictions of Asthma Exacerbation Risk in Boston
12 Online Journal of Public Health Informatics * ISSN 1947-2579 * http://ojphi.org * 8(3):e199, 2016
OJPHI
Building from the multi-pollutant association models, the next objective was to identify as simplistic a model as possible to adequately forecast days with high risk of asthma exacerbation. A logistic regression model was used to classify days as high, medium, and low risk for asthma exacerbations. High-risk days are defined as days representing an increased relative risk of asthma exacerbation of ten percent or higher. Alerts are issued at 6 a.m. on days predicted to be high risk.
During model comparison, the pollutants found to best identify high-risk days for increased risk of asthma exacerbation were ozone and NO2. Figure 2 demonstrates the aggregate relationship between these key variables. Summary pollutant measures important for predicting these days in Houston were the level of the eight-hour maximum ozone the day before a high-risk day, and the night-time level of NO2 leading up to the high risk day. Wind speed the day of a high-risk day is also a key variable. Essentially, on days of low wind speed in Houston, the air is stagnant and pollution becomes a greater problem for the region. To incorporate wind speed, Raun and Ensor use forecasted wind speeds from weather underground.
Figure 2: Temporal relationship of Ozone and NO2 measurements to volume of 911 calls for which asthma rescue medications were administered
Raun and Ensor also found a seasonal relationship and account for this relationship by focusing on months of the year for which there is a high risk of an asthma exacerbation. A post-analysis of this seasonal relationship indicated that it might be influenced by the level of pollen present, as well as other aeroallergens.
Past Applications: The model and alerting system has been applied in Houston, Texas. Data were drawn from emergency calls for which an ambulance was dispatched and rescue medications were administered. Data show decreased ambulance dispatch rates during June and July, and considerable spatial heterogeneity in dispatch rates within the city of Houston. There is also a

Cross-Disciplinary Consultancy to Enhance Predictions of Asthma Exacerbation Risk in Boston
13 Online Journal of Public Health Informatics * ISSN 1947-2579 * http://ojphi.org * 8(3):e199, 2016
OJPHI
differential impact, up to a factor of five, on children in schools across the city [31]. The training time period was from January 2004 through March 2013, which includes 14,300 Emergency Medical Services (EMS) ambulance-treated asthma cases in the study population (aged above 2 years). In this study period, 106 days were identified as high-risk days. The alerting system was piloted in 2015 through Houston Independent School District (HISD) [31] and will be deployed more fully through Houston Health Department in the fall of 2016. During the pilot period, alerts were issued on two days, and appropriate action was taken by nurses within the Houston Independent School District to limit asthma exacerbations.
Benefits and Drawbacks: A key benefit of the study is the direct feedback to health practitioners who could affect change in dispatch rate. It also provides these front-line health workers with situational awareness of the risk to children in Houston. Raun and Ensor used EMS call data for outcome measures. In Boston, asthma-related ED visit records include persons transported by EMS and those who arrive via other means (taxi, car) and are representative and useful as an outcome measure. Furthermore, evaluation of the intervention on hospitalization rates or severe outcomes in Houston would be beneficial in order to prove that the system is effective, and would secure buy-in by stakeholders. A potential drawback is that the significance and degree of influence of risk factors related to air quality in Boston may differ from analogous findings in Boston; the quantitative findings should not be assumed transferrable. This model did not explicitly account for respiratory viral transmission, whose influence could be considered by developers for the Boston use case.
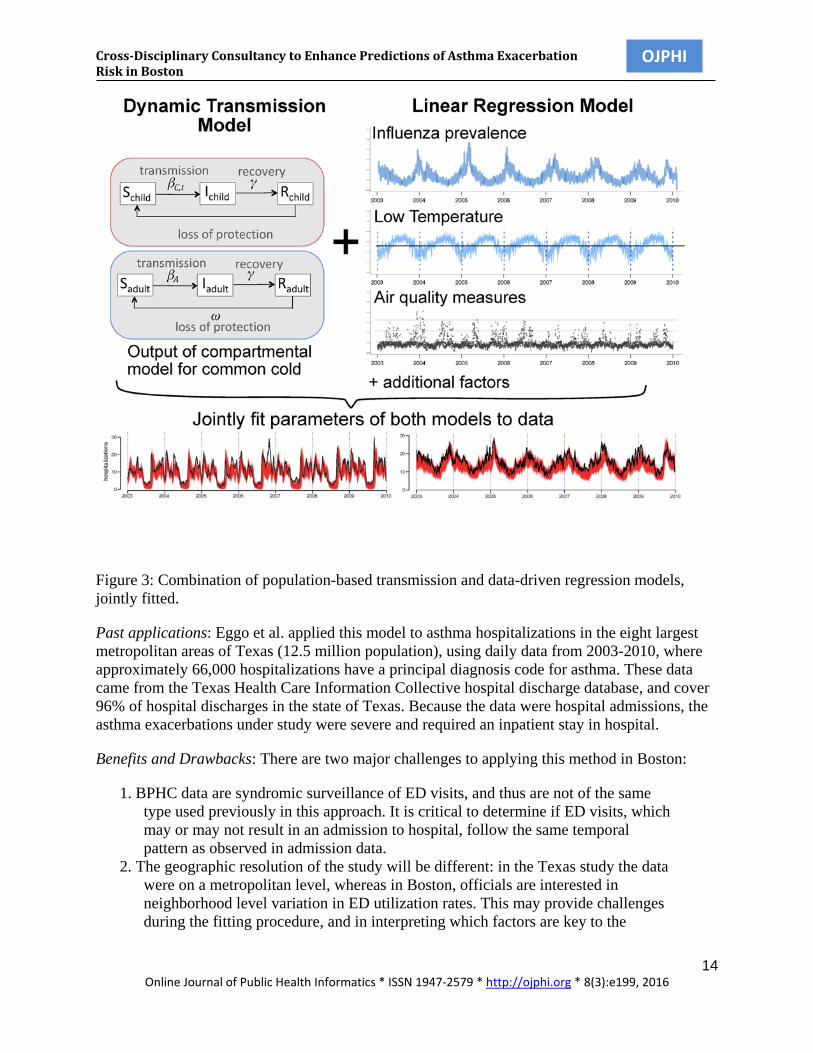
Joint Modeling Approach: Population Transmission and Data-driven Regression
Basic Concept: Eggo et al. developed a transmission model for common colds to assess the contribution of infection prevalence in asthma hospitalization patterns [32]. The model is a Susceptible-Infectious-Recovered compartmental model, and thus represents transmission of infectious agents from person to person. The transmission model was used to simulate the prevalence of common cold infections in the population, where the population was stratified into adults and children. The behavioral parameters that governed mixing between adults and children were fitted, as well as biological parameters of viral transmission. The real school calendars for each city were inputted because children have lower contact rates when they are out of school. The model estimated a different rate of transmission of viruses on days when school was in session. These differences in contact rates impacted infection prevalence in the transmission model, and gave rise to waves of high and low infection prevalence through the year.
In addition to generating and fitting the common cold model, Eggo et al. fitted linear predictors of the asthma hospitalization rate to determine their impact on the target variable: daily asthma hospitalization rate. These variables included influenza prevalence, day of week, and some measures of air quality, although those variables were excluded by Bayesian model comparison. By jointly fitting a model for infectious and non-infectious triggers of severe asthma exacerbations, as illustrated in Figure 3, the model was able to quantify the effect of common cold infections in a novel way.
Cross-Disciplinary Consultancy to Enhance Predictions of Asthma Exacerbation Risk in Boston
14 Online Journal of Public Health Informatics * ISSN 1947-2579 * http://ojphi.org * 8(3):e199, 2016
OJPHI
Figure 3: Combination of population-based transmission and data-driven regression models, jointly fitted.
Past applications: Eggo et al. applied this model to asthma hospitalizations in the eight largest metropolitan areas of Texas (12.5 million population), using daily data from 2003-2010, where approximately 66,000 hospitalizations have a principal diagnosis code for asthma. These data came from the Texas Health Care Information Collective hospital discharge database, and cover 96% of hospital discharges in the state of Texas. Because the data were hospital admissions, the asthma exacerbations under study were severe and required an inpatient stay in hospital.
Benefits and Drawbacks: There are two major challenges to applying this method in Boston:
1. BPHC data are syndromic surveillance of ED visits, and thus are not of the same type used previously in this approach. It is critical to determine if ED visits, which may or may not result in an admission to hospital, follow the same temporal pattern as observed in admission data.
2. The geographic resolution of the study will be different: in the Texas study the data were on a metropolitan level, whereas in Boston, officials are interested in neighborhood level variation in ED utilization rates. This may provide challenges during the fitting procedure, and in interpreting which factors are key to the

Cross-Disciplinary Consultancy to Enhance Predictions of Asthma Exacerbation Risk in Boston
15 Online Journal of Public Health Informatics * ISSN 1947-2579 * http://ojphi.org * 8(3):e199, 2016
OJPHI
observed hospitalization rate on that day. In addition, lower level data results in smaller numbers, and therefore a greater impact of stochastic effects.
Despite these challenges it is critical to apply a model including respiratory infection in Boston because public health officials need to better understand the reasons for the patterns in their data. In addition, the benefit of including a variable of common cold prevalence is two-fold: in order to quantify the effect of interventions against other exacerbation triggers, the underlying baseline of risk and the changes to that baseline must be quantified, and respiratory viruses are a key part of that risk; and secondly we must determine whether common cold transmission or infection is a modifiable factor for asthma control, so that interventions can be developed to protect asthmatic patients from exacerbations that result from infection.
Population-level Bayesian Networks
Basic Concept: The Bayesian Network (BN) is often represented as a directed acyclic graph, a diagram with nodes and directed edges. These nodes represent hypotheses that can be true or false based on conditional probability tables (CPTs) and nodal inputs. The connected nodes are linked by conditional dependencies that can be based on expert reasoning and/or data-derived inference. Bayesian Networks thus incorporate data history and expert knowledge. They have been applied to use disparate types of evidence to determine likelihoods of significant target events. Figure 4 from Lin et al. [33] gives an example.
Figure 4: Bayesian Network structure for asthma detection through fusion of syndromic and environmental data.
The network structure is determined by probabilistic relationships inferred among leaf nodes representing data inputs and higher level inference nodes. The figure’s structure was formed using guidance from the literature with partial data confirmation. The leaf node data were not raw data streams but were filtered by calibrated algorithms for scalability. For example, a leaf node for viral infections in school-age children might be implemented as algorithmic outputs for streams of counts of pediatric ED visits with chief complaints of wheezing or asthma diagnosis codes. Combinations of leaf node levels are results weighted by CPTs to derive an overall degree
Cross-Disciplinary Consultancy to Enhance Predictions of Asthma Exacerbation Risk in Boston
16 Online Journal of Public Health Informatics * ISSN 1947-2579 * http://ojphi.org * 8(3):e199, 2016
OJPHI
of concern, based on the evidence sources that are available at the time; e.g. increased weighting for high pollen levels during high wind-speed measurements.
Past Applications: These networks have been widely applied in physical science and individual patient applications, including the context of algorithm-aided asthma diagnosis [34]. Scalability concerns have limited their application for population health surveillance, but researchers have used them to emulate human evidence-based decision-making by shifting the computational burden of filtering primary evidence to other analytic methods, by using simplified node structures guided by domain expertise, and by using generic probability tables [35]. They were applied to fuse human care-seeking data with drinking water quality data to monitor for waterborne disease outbreaks [36] and in related applications.
Benefits and Drawbacks: Bayesian Networks can accommodate both continuous and discrete data, multiple data rates, and missing or sparse values. By virtue of their graphical nature, BNs can provide the user with a transparent visualization of the basis for a derived anomalous output. They can also serve for high-level decision support, combining the results of component analytic methods such as control charts, regression models, or less transparent machine learning methods.
Nodal structure depends on dependencies among subnodes. Examples are risk factor interactions such as the school calendar and low temperatures or combinations of wind speed and pollen levels. Such dependencies may not be derivable from data alone and may depend on domain expertise that is difficult to validate. Even contributions of single risk factors may be challenging to quantify without sufficient training data at useful spatial resolution.
Discrete Event Simulation Modeling
Basic Concept: Simulating the joint influence of multiple stressors on health care utilization is challenging, especially for a complex multi-factorial disease like asthma. Predicting the influence of interventions on health outcomes of interest is even more challenging, given that some interventions will reduce multiple exposures (e.g., availability of air conditioned spaces reducing exposure to heat and air pollution) and others will involve tradeoffs (e.g., decreased exposure to outdoor air pollution but increased exposure to indoor air pollution) or complex feedback loops. Discrete event simulation modeling has been recommended [37] when simulating diseases where there are interactions between individuals and their environments, when individuals are influenced by multiple risk factors, when past history can influence future outcomes, when disease processes involve a series of associated events, and when it is of interest to evaluate multiple subpopulations. Urban asthma meets all of these criteria, and discrete event simulation is therefore an appealing platform for testing candidate interventions and evaluating their consequences.
Past Applications: Discrete event simulation modeling has been used for an array of health policy analyses, with more recent application of the first discrete event simulation model of asthma and the physical environment [38–40]. Briefly, this model simulated the joint influence of PM2.5, NO2, indoor mold, and cockroach allergen on pediatric asthma exacerbation. The model was developed for a notional population representative of low-income residents of Boston, and was used to evaluate the health implications of multiple interventions in the indoor environment (such as smoke-free housing, repairing broken exhaust fans, or integrated pest
Cross-Disciplinary Consultancy to Enhance Predictions of Asthma Exacerbation Risk in Boston
17 Online Journal of Public Health Informatics * ISSN 1947-2579 * http://ojphi.org * 8(3):e199, 2016
OJPHI
management), although the model platform could easily accommodate other types of interventions and evaluate their implications. For each intervention, one million children were simulated for ten years, providing adequate sample size to evaluate changes in hospitalizations and other infrequent outcomes as a function of incremental changes in exposure. The final analyses allowed for comparisons across individual interventions as well as their combination, with quantification of the public health benefits of the measures.
Benefits and Drawbacks: Discrete event simulation provides a modeling platform that can synthesize available epidemiological evidence and syndromic surveillance information and help to prioritize among candidate interventions. If parameterized appropriately, it can incorporate the latest scientific understanding regarding exposures and health outcomes, and it can be adapted over time to accommodate new information. Aside from aggregate benefits, the model could also help identify the characteristics of high-risk days or the days for which candidate interventions might yield the largest benefits, information of interest to BPHC and other stakeholders. While the model is computationally intensive, it could provide key foundational information and could be run rapidly to evaluate the influence of forecasted stressor exposures on health outcomes, as a way to dynamically inform decisions about interventions.
One major challenge relates to the accuracy of the model, which depends considerably on accurate characterization of the multivariable exposure patterns across individuals and subpopulations. Moving from a stylized analysis to an analysis of the at-risk population of interest would require efforts such as constructing a synthetic population database of individuals within Boston, as done previously by linking microdata from the American Community Survey with census tract population attributes and regression models to predict behaviors as a function of sociodemographic information [41]. The syndromic surveillance data and associated datasets could potentially be the foundation for such an analysis, in combination with publicly available population datasets. Similarly, the model would need to be able to accurately characterize associations like behavioral responses to interventions or how medication adherence would be influenced by community-scale interventions. Some of these associations could be empirically derived from information in the syndromic surveillance system or electronic health records, but some considerable upfront analyses would be required to incorporate all of the associations of interest. Ultimately, if epidemiological analyses were conducted or exposure models were developed with a discrete event simulation application in mind, the information value of the analyses would be maximized and the simulation model would be most meaningful.
Artificial Neural Network approach
Basic Concept: An Artificial Neural Network (ANN) is a tool meant to emulate the brain’s biological process for learning to combine multiple, weighted streaming inputs to obtain useful outputs. Separate inputs are represented as interactive neuron-like nodes whose results are weighted, combined, and passed to other nodes for further processing. The perceptron, the simplest and most common form of ANN, applies trial weights to the input nodes, sums their weighted values, and applies a transfer function to the weighted sum to obtain an output. In supervised training mode, the output is compared to observed or desired values, errors are calculated and fed back to the network, nodes are reweighted, and the process is repeated until the errors are acceptably small. After sufficient testing and cross-validation, the ANN is applied to new data inputs to aid in classification or decision tasks.

Cross-Disciplinary Consultancy to Enhance Predictions of Asthma Exacerbation Risk in Boston
18 Online Journal of Public Health Informatics * ISSN 1947-2579 * http://ojphi.org * 8(3):e199, 2016
OJPHI
This structure cannot represent the range of complex learning problems, and in practice, designers generalize the perceptron with an input layer, one or more hidden layers, and an output layer working in parallel. Weightings and appropriate transfer functions are applied in each layer for the feed-forward Multi-Layer Perceptron model, one of the most common forms of ANN.
While the basic perceptron is mainly a static classifier, modelers have used several approaches to enable ANNs to learn from combinations of recent past values and outcomes. In particular, the Time Lagged Recurrent Networks (TLRN) extends the basic feed-forward model with short-term memory structures. Thus, the ANN is an approach, based on current knowledge of recursive human learning, to represent a system with complex, nonlinear behavior that is difficult to model explicitly. As such, ANNs have been used to aid in complex medical decision-making [42,43].
Past Applications: Moustris et al. used the TLRN extensions of ANNs for prediction of pediatric hospital admissions for asthma exacerbations in Athens, Greece [44]. Inputs included hourly weather data and pollution data obtained from seven metropolitan measurement sites. For training and evaluation, outputs were daily counts of pediatric asthma admissions collected from three main children’s hospitals. Elemental weather variables were air temperature, wind speed, relative humidity, cloudiness, sunshine, and global radiation. From these variables, the authors derived the Physiologically Equivalent Temperature (PET) and formed ANN inputs from recent PET values. Elemental pollutant elements were measurements of surface ozone, PM2.5, carbon monoxide, NO2, and sulfur dioxide. From these variables, the authors derived the summary European Regional Pollutant Index and formed ANN inputs from recent values of this index.
The TLRN structure adopted by Moustris et al. was determined by trial and error in search of the best and simplest network for predicting pediatric asthma admissions, and the authors settled on a structure with one input layer, one hidden layer, and one output layer. They built ANNs with this structure to predict admissions for three age groups: 0-4 years, 5-14 years, and the combined 0-14 years. For ANN development and learning, they used environmental and admissions data from 2001-2003 for training, and data from 2004 for testing and evaluation. Comparison of predicted and actual pediatric admissions yielded “fairly good” agreement, with Index of Agreement above 0.83 and adjusted R2 values above 0.5 for both the 0-4-year and combined age groups, but with weaker agreement for ages 5-14.
Benefits and Drawbacks: A principal benefit of ANNs is that they are appropriate to treat problems with variables that a) are difficult to express mathematically, b) have nonlinear relationships to the outcome of interest, and c) do not fit known theoretical distributions.
The complexity of such problems is a challenge to overcoming the main drawback of ANNs, as stated in Moustris et al.: “[ANNs] cannot explain in an intelligible form the relative importance of the various input variables used in the model and the procedure through which the answer to the problem was given”. This obstacle is common to many machine-learning approaches and must be overcome through a combination of validation, education, and historical experience before ANNs and related approaches can be adopted for routine prospective use.

Cross-Disciplinary Consultancy to Enhance Predictions of Asthma Exacerbation Risk in Boston
19 Online Journal of Public Health Informatics * ISSN 1947-2579 * http://ojphi.org * 8(3):e199, 2016
OJPHI
Development and implementation of practical modeling capability
Distinguishing features of the Boston Asthma Exacerbation Risk Use Case
The development and implementation of practical tools to improve the public health management of asthma exacerbations depend on routinely available data representing known risk factors. For this use case, known risk factors are upper respiratory virus transmission, particularly in school-age children, harsh or extreme weather conditions, and poor air quality.
The practicality of a risk prediction tool depends on the available data and technological resources, but also on the operations and response mechanisms intended to benefit from the tool. For the asthma risk response in Boston, response measures are multi-level communications with neighborhood and community programs, with high-risk patients and their families, and with care providers ranging from school nurses to hospital emergency staff. Through these measures, improved and timely understanding of exacerbation risk can promote increased awareness without excessive caution, enabling continuity of school attendance and other daily activities, reduction of the number of resulting episodes, and clinical preparedness. A key feature of this use case is captured in the regression of the known dependence of both asthma prevalence and exacerbation risk on attributes such as race, age group, ethnicity, and neighborhood of residence.
Translation into modeling requirements
The main requirement of the desired prediction tool is notification of enhanced exacerbation risk soon enough to improve the interventions described above. Necessary improvement features are timeliness, population-at-risk indications, and reason(s) for enhanced risk. Models should allow as much stratification as possible by risk group for targeted interventions.
Based on the public health resources and operations presented, these requirements broadly translate into:
• Risk predictions on a geographic scale finer than city level: A practical scale would be neighborhood level, with predictions specific to 15 regions characterized by distinct racial and ethnic concentrations. Even finer resolution may be useful for some entities and outcomes.
• Predictions with a lead time of at least 48 hours: Depending on the type of intervention, both staffing and response-time limitations limit the utility of shorter warning times. Longer warning times are dubious because of the volatility of environmental risk factors and the nature of the interventions.
• Justification for increased risk: Public health practitioners and clinical care stakeholders have made it clear that model outputs must include the risk factors or combinations responsible for heightened risk.
• Likelihood and severity details: For enhanced utility and credibility, the predicted risk results should explain the degrees of uncertainty and concern as clearly as possible, analogous to weather forecasts. The degree of concern could be expressed in terms of a locally relevant measure of illness burden, such as number of asthma-related ED visits by subpopulation.

Cross-Disciplinary Consultancy to Enhance Predictions of Asthma Exacerbation Risk in Boston
20 Online Journal of Public Health Informatics * ISSN 1947-2579 * http://ojphi.org * 8(3):e199, 2016
OJPHI
In initial implementation at least, the model or other prediction tool(s) are to be used at the BPHC, not at multiple distributed locations, and results are then to be forwarded to community groups, schools, and care providers and other agencies and organizations determined by the needed action. Whether the means of communication will be by instantaneous electronic message, by email, or by telephone will depend on the type of partner and intervention.
Analytic tools must be incorporated without impact on daily operations, into a working syndromic system implemented with no supercomputers or networked cluster processing, including daily patient records from ten emergency departments. Any climatic or other environmental model inputs must be available as data streams for routine electronic ingestion, also without operational impact.
Information system requirements
Modeling requirements need to take into consideration the capabilities of the information systems the model is to be deployed on. During the import process all data feeds needed by the model must be made available electronically. Climactic and environmental data can be large and system intensive. File sizes and whether the data is to be received in real time, near real time, or intermittently are all factors that will impact the abilities of the system to ingest information. Network transmission requirements also play a role.
Workforce resources should also be considered in system design. Properly trained staff must be available on a regular basis to respond when notifications (emails, text messages, etc.) indicating system issues are received. The data import system should send notices when there is a problem with the feed and no data arrives; when automatic sanity checks on the data fail; and when the database encounters an error. These staff must be ready and prepared to fix local errors and to liaise with the data providers when the issue is off site.
Pre-processing is a possible technique that can be used to ease the burden on the system as a whole. Any processing that can be moved away from the main model’s processes and done during down times can be of great value in creating an efficient system; a staggered electronic ingestion of large data files and associated preparation for use in the model may prevent system overload, as illustrated in Figure 5. Circumstances where partial data analysis can be pre-formed, outside of the main model’s process and at more convenient times, should be sought out to alleviate the burden on the model.
The model’s processing time and the availability of the results is critical. Practical models may not have ideal results but are timely and support population health interventions. Computing power and processing needs may determine internal vs. external (cloud) hosting. The error checking processes must also be implemented at this stage. Offsite/cloud hosting has its own set of possible error conditions that must be accounted for with error checking and adequate staffing.
The output of the model must be user friendly. It should include tables, maps, and other visualizations to make the results end-user friendly. Results can range from static documents to dynamic web pages that update in near real time at the user’s request. As the model matures, the findings may be exposed to the other agencies or the public. Processes for continuous training for the model will be needed to maintain timeliness and validity of the model.

Cross-Disciplinary Consultancy to Enhance Predictions of Asthma Exacerbation Risk in Boston
21 Online Journal of Public Health Informatics * ISSN 1947-2579 * http://ojphi.org * 8(3):e199, 2016
OJPHI
Figure 5: Technical schema to support analytic asthma exacerbation prediction tool
The BPHC technology workforce will be responsible for the system sanity check. This includes data and system quality metrics, system maintenance and repair, and liaison with data providers. Privacy and security requirements will need to be vetted for each component information system along with cost considerations.
Modeling challenges: problem-driven, not method-driven
Multiple analytic methods were discussed in the Modeling Approaches Section, and a primary decision is whether to apply a mechanistic model, a machine learning approach, or a hybrid or other modeling approach. One determinant of the analytic approach is the amount and quality of data support for potential modeling methods. Sufficient historical data are required for model development and testing, and then ongoing data streams are required for updated implementation. Eight years of historical ED patient records, including the data fields identified above, will be available to researchers who sign the BUA.
One attendee asserted that restrictions of these data might limit candidate data mining approaches. As explained in the Risk Factor Evidence Assessment section, some aeroallergen variables such as pollen and mold measurements are unavailable for Boston, but historical weather data, ozone, PM2.5 and other air quality measures and predictions are freely available from NOAA at 12-km resolution or better, and so will be available to BPHC as inputs for prospective modeling. Another challenge is determining the spatial data resolution of each data source, and determining what level is necessary to stratify model outputs by subdivision, such as neighborhood, and if possible, to apply appropriate interpolation methods to approximate the necessary resolution.
An important modeling challenge is to provide predictive value beyond obvious triggers such as increased risk at the height of cold season or during extreme temperature days. Such predictions require accurate weighting of risk factors and treatment of their interactions. Regardless of

Cross-Disciplinary Consultancy to Enhance Predictions of Asthma Exacerbation Risk in Boston
22 Online Journal of Public Health Informatics * ISSN 1947-2579 * http://ojphi.org * 8(3):e199, 2016
OJPHI
analytic approach, trust in predictions requires both validation using historical information and clear, prospective explanation of which factor(s) are responsible for alerts. A final consideration is the type and frequency of maintenance that a chosen model will require.
Translation challenges
After a prediction tool is developed and tested, successful translation into the investigation and response process requires a) credible evaluation, b) relevant, concise, and user-friendly visualization, and c) adequate training in its use reinforced by prospective implementation experience. Each of these components presents challenges.
Evaluation should demonstrate the ability to predict increased exacerbations resulting from multiple risk factors in all seasons. The evaluation of a prediction tool should not be confused with technology gaps in the chain of data acquisition to obtain model inputs or with gaps in steps to communicate model outputs. For example, in the end-to-end public health surveillance process, various agency links may be through automated electronic transmission, by email, or by telephone, reflecting infrastructure issues beyond the scope of analytic model development.
Visualizations should be developed in consideration of user workflow and several layers of response to exacerbation risk. Technology translation may be no one’s formal task, and developers and users must allocate time and effort to determine and refine useful output presentations and/or screens, whether in terms of stoplight indicators, expected ED visit counts, hospitalization rates per 1,000, or otherwise. Similarly up-to-date training in the use of prediction tools requires input from both modelers and system administrators.
The BPHC environmental surveillance and response staff anticipated helpful byproducts of successful translation. First, the understanding that timely and accurate information are available can strengthen the incentive to improve communication technology. Second, timely and shareable risk predictions can inform internal and external operations policies. The effectiveness of technical solutions and modified interventions can be monitored at the health department in several ways: by tracking asthma-related ED visit trends, examining customary correlations between ED visits with respiratory infections and asthma exacerbations, and monitoring asthma-related ED visits from ethnic, race, or neighborhood groups known for elevated risk. More detailed metrics such as asthma-attributable missed school days or non-transported EMS calls are harder to track using available data but may be inferable from partner group communications. The health department model implementation must also be evaluated with metrics involving the quality and reliability of risk factor data sources, processing speed and other performance characteristics of the model, and its impact on the surveillance system. Regarding enhanced interventions that could result from the model findings, measures to track and evaluate these enhancements will be needed. Additionally, the health department must identify mechanisms to gather and incorporate feedback from relevant stakeholders.
Cross-Disciplinary Consultancy to Enhance Predictions of Asthma Exacerbation Risk in Boston
23 Online Journal of Public Health Informatics * ISSN 1947-2579 * http://ojphi.org * 8(3):e199, 2016
OJPHI
Discussion
Overview
Predictive modeling is underutilized for public health surveillance and response. This consultancy brought together a diverse group of subject matter experts, modelers, computer scientists and local decision makers to explore the development of a predictive modeling capability for asthma exacerbations in Boston. Exacerbations present a complex problem involving environmental factors, circulating viruses, and medical management. The process fostered information sharing across domains and provided insights into factors influencing models and useful outputs.
The multidisciplinary consultancy was challenged to combine medical, epidemiological, environmental, computer science, and statistical expertise to promote development of models that can predict exacerbation increases in Boston with 48-hour lead time. Such a model must use routinely available electronic data feeds and conduct analysis within the computational capacity of BPHC. Presentations and discussion suggested that the acquisition rates of syndromic and environmental data are sufficient for the required analysis. To be determined is the spatial resolution of predictions afforded by the spatial granularity of the various data sources. Model development and implementation experience will be required to determine both the effectiveness of developed models and their benefits for public health response and communication among BPHC, its partner agencies, and the public.
Effectiveness of consultancy: benefits and lessons learned
The BPHC consultancy hosts felt that the event “surpassed expectations”, and multiple attendees cited the useful exchange of information on public health needs and practices, availability and quality of data sources, and modeling possibilities. Beyond anecdotal reactions, an email survey on the effectiveness of the consultancy was administered. The 12 responses reflected the in-person discussion after the event—that useful information was exchanged on the public health burden of asthma in Boston, local investigation and response mechanisms, risk factors and the available environmental and ED data for tracking those factors, and candidate analytic approaches for the required predictions. For both the description of the asthma burden and surveillance problem in Boston and the discussion of risk factors and available environmental data sources, 75% of attendees said that objectives were “fully met,” the rest evaluated them as “partially met”. Responses related to translating models for public health benefit were less clear. Only 5 of 12 respondents felt that the objective of describing “strategies for translating a model for asthma” was fully met. The same limited number felt that the objective of describing “functional requirements for operationalizing a model in Boston” was met. These response options depend on the results of the model, which were unknown at the time of the consultancy. These limited responses highlight the difficulty of working across disciplines to define analytic requirements and to clarify the public health benefits of prediction tools for a complex health issue with multiple seasonal risk factors, especially in the short time available for the consultancy. Overcoming this difficulty requires individuals who:
• grasp the public health business process and interagency relationships well enough to elicit relevant modeling requirements;

Cross-Disciplinary Consultancy to Enhance Predictions of Asthma Exacerbation Risk in Boston
24 Online Journal of Public Health Informatics * ISSN 1947-2579 * http://ojphi.org * 8(3):e199, 2016
OJPHI
• have sufficient knowledge of the data and networking environments to know what streaming input processes are feasible; and
• understand analytic tools and evaluation methodologies well enough to know what results are realistic.
Limitations
We consider limitations of the consultancy process, the available data, practical models, and the resultant effects on interventions. The budget of the in-person consultancy was limited to 1.5 days and two-dozen participants, so activities were restricted to BPHC model requirements analysis (data, informatics, and asthma response mechanisms/relationships), risk factor and data discussion, and presentation of model approaches.
Data available in near-real time do not represent all possible risk factors. Sufficiency of the spatial resolution of these data for neighborhood-level modeling is unclear, especially for pollutant data. A developer of data mining models suggested that the available eight years of historical syndromic data from one city might be too short for training of some methods. However, modeling with lengthy data history may be problematic because the health care system is evolving. For example, patients who may have been admitted in prior years are now managed in observation units. Such changes may compromise the value of training with years of patient data.
Another limitation is that the outcome data for prospective modeling are limited to free-text chief complaints and demographic fields in ED patient records. Diagnosis codes are available in historic data for model validation, but they are not available in time for prospective use. Other asthma outcomes, such as days of school or work missed specifically because of asthma, are difficult to quantify, and the corresponding data are not available in a timely way.
The BPHC staff noted that the effect of potential model results on response activities is uncertain because current and novel interventions at different levels depend on multiple city departments and agencies. These activities may require building new communication networks, leveraging community resources, and potential policy changes. This progress will require full engagement of decision makers from multiple sectors. The actionable information resulting from the models developed will provide a foundation for engagement of these decision makers.
Conclusions
Public health practice is evolving with the increasing availability of electronic data and technology systems capable of processing, analyzing, and visualizing data results. The models presented at the consultancy offer various approaches to the development of a prospective predictive asthma model for Boston. Some models may be better suited to retrospective data mining for risk factor characterization or evaluating new electronic data streams. These methods may inform the development of a practical predictive model for asthma.
A practice-oriented model that operates within the technical requirements for end-user acceptance would be considered a success. This definition of success differs from an academic research perspective. The design of the consultancy and the subsequent process was end-user
Cross-Disciplinary Consultancy to Enhance Predictions of Asthma Exacerbation Risk in Boston
25 Online Journal of Public Health Informatics * ISSN 1947-2579 * http://ojphi.org * 8(3):e199, 2016
OJPHI
driven by both local decision makers who need to use the output and the workforce who support these systems. While working across disciplines can be a challenge, understanding the various system requirements (data sources, model, technology and end user needs) is essential to operationalize the methods.
Ongoing collaboration is a dynamic process as environmental data sources, clinical management of asthma, and the urban landscape change. System end-users also contribute to the continuous development of the technology. This approach may develop a road map for the expanded use of models for public health practice and response and ongoing evolution of the model and system with changing environments.
Acknowledgements
We thank the Boston Public Health Commission and particularly Executive Director Monica Valdes Lupi JD, MPH for hosting and leading the consultancy. We also acknowledge support of Dr. Lauren Ancel Meyers of the University of Texas at Austin, and of the Biosurveillance Ecosystem group at the Defense Threat Reduction Agency and the advice of Karen Stark, technical BSVE lead at DigitalInfuzion, Inc.
Financial Disclosure
The organization, preconference calls, and the consultancy itself were supported and funded by the Defense Threat Reduction Agency, and under grant NIH K24 106822. Contents of this report are solely the responsibility of the authors and do not necessarily represent the official view of the Defense Threat Reduction Agency.
References
1. Kiley C, Hannan J. The Biosurveillance Ecosystem (BSVE) [Internet]. 2015 [cited 2016 Jul 29]. Available from: http://www.dtra.mil/Portals/61/Documents/CB/BSVE%20Fact%20Sheet_04282015_PA%20Cleared.pdf
2. Faigen Z, Deyneka L, Ising A, Neill D, Conway M, et al. 2015. Cross-Disciplinary Consultancy to Bridge Public Health Technical Needs and Analytic Developers: Asyndromic Surveillance Use Case. Online J Public Health Inform. 7(3), e228. PubMed http://dx.doi.org/10.5210/ojphi.v7i3.6354
3. US Centers for Disease Control and Prevention. Most Recent Asthma Data [Internet]. 2016 [cited 2016 Jun 12]. Available from: http://www.cdc.gov/asthma/most_recent_data.htm
4. Weiss KB, Gergen PJ, Hodgson TA. 1992. An Economic Evaluation of Asthma in the United States. N Engl J Med. 326(13), 862-66. PubMed http://dx.doi.org/10.1056/NEJM199203263261304
5. Barnett SBL, Nurmagambetov TA. 2011. Costs of asthma in the United States: 2002-2007. J Allergy Clin Immunol. 127(1), 145-52. PubMed http://dx.doi.org/10.1016/j.jaci.2010.10.020
Cross-Disciplinary Consultancy to Enhance Predictions of Asthma Exacerbation Risk in Boston
26 Online Journal of Public Health Informatics * ISSN 1947-2579 * http://ojphi.org * 8(3):e199, 2016
OJPHI
6. Akinbami L. The state of childhood asthma, United States, 1980-2005 [Internet]. National Center for Health Statistics; 2006 Dec [cited 2016 Jul 29]. Report No.: 381. Available from: http://www.cdc.gov/nchs/data/ad/ad381.pdf
7. US Centers for Disease Control and Prevention. Summary Health Statistics: National Health Interview Survey, 2014 [Internet]. [cited 2016 Jul 29]. Available from: http://ftp.cdc.gov/pub/Health_Statistics/NCHS/NHIS/SHS/2014_SHS_Table_C-1.pdf
8. Boston Public Health Commission. Health of Boston 2014-2015 [Internet]. [cited 2016 Jul 29]. Available from: http://www.bphc.org/healthdata/health-of-boston-report/Documents/HOB-2014-2015/FullReport_HOB_2014-2015-MSPDFforWeb.pdf
9. Boston Public Schools Communications Office. Boston Public Schools at Glance 2014-2015 [Internet]. 2015 [cited 2016 Jul 29]. Available from: http://www.bostonpublicschools.org/cms/lib07/MA01906464/Centricity/domain/187/publications/At%20a%20Glance/BPS%20at%20a%20Glance%2014-1030.pdf
10. Lemanske R, Kakuman S, Shanovich K, Antos N, Cloutier M, et al. The creation and implementation of SAMPRO: a school-based asthma management program [Accepted]. J Allergy Clin Immunol. (In press).
11. Gerald LB, Gerald JK, Zhang B, McClure LA, Bailey WC, et al. 2012. Can a school-based hand hygiene program reduce asthma exacerbations among elementary school children? J Allergy Clin Immunol. 130(6), 1317-24. PubMed http://dx.doi.org/10.1016/j.jaci.2012.08.031
12. Boston Public Health Commission. Disease surveillance and reporting regulation [Internet]. 2013 [cited 2016 Jun 12]. Available from: http://www.bphc.org/boardofhealth/regulations/Documents/Disease_Surveillance_and_Reporting_Regulation.pdf
13. National Asthma Education and Prevention Program, Third Expert Panel on the Diagnosis and Management of Asthma. Expert Panel Report 3: Guidelines for the Diagnosis and Management of Asthma. Bethesda (MD): National Heart, Lung, and Blood Institute (US); 2007 Aug. Section 2, Definition, Pathophysiology and Pathogenesis of Asthma, and Natural History of Asthma. Available from: http://www.ncbi.nlm.nih.gov/books/NBK7223/
14. Gern JE, Busse WW. 1999. Association of rhinovirus infections with asthma. Clin Microbiol Rev. 12(1), 9-18. PubMed
15. Fu L-S, Tsai M-C. 2014. Asthma exacerbation in children: a practical review. Pediatr Neonatol. 55(2), 83-91. PubMed http://dx.doi.org/10.1016/j.pedneo.2013.07.004
16. Kimes D, Ullah A, Levine E, Nelson R, Timmins S, et al. 2004. Relationship between pediatric asthma and socioeconomic/urban variables in Baltimore, Maryland. Health Place. 10, 141-52. PubMed http://dx.doi.org/10.1016/S1353-8292(03)00054-6

Cross-Disciplinary Consultancy to Enhance Predictions of Asthma Exacerbation Risk in Boston
27 Online Journal of Public Health Informatics * ISSN 1947-2579 * http://ojphi.org * 8(3):e199, 2016
OJPHI
17. Babin SM, Burkom HS, Holtry RS, Tabernero NR, Stokes LD, et al. 2007. Pediatric patient asthma-related emergency department visits and admissions in Washington, DC, from 2001–2004, and associations with air quality, socio-economic status and age group. Environ Health. 6, 9. PubMed http://dx.doi.org/10.1186/1476-069X-6-9
18. Babin S, Burkom H, Holtry R, Tabernero N, Davies-Cole J, et al. 2008. Medicaid patient asthma-related acute care visits and their associations with ozone and particulates in Washington, DC, from 1994-2005. Int J Environ Health Res. 18(3), 209-21. PubMed http://dx.doi.org/10.1080/09603120701694091
19. Jamason PF, Kalkstein LS, Gergen PJ. 1997. A synoptic evaluation of asthma hospital admissions in New York City. Am J Respir Crit Care Med. 156(6), 1781-88. PubMed http://dx.doi.org/10.1164/ajrccm.156.6.96-05028
20. Brunekreef B, Holgate ST. 2002. Air pollution and health. Lancet Lond Engl. 360(9341), 1233-42. PubMed http://dx.doi.org/10.1016/S0140-6736(02)11274-8
21. Davis MS, Malayer JR, Vandeventer L, Royer CM, McKenzie EC, Williamson KK. Cold weather exercise and airway cytokine expression. J Appl Physiol Bethesda Md 1985. 2005 Jun;98(6):2132–6.
22. Ito K, Weinberger KR, Robinson GS, et al. 2015. The associations between daily spring pollen counts, over-the-counter allergy medication sales, and asthma syndrome emergency department visits in New York City, 2002-2012. Environ Health. 14, 71-82. PubMed http://dx.doi.org/10.1186/s12940-015-0057-0
23. Emberlin J, Mullins J, Corden J, Jones S, Millington W, et al. 1999. Regional variations in grass pollen seasons in the UK, long-term trends and forecast models. Clin Exp Allergy J Br Soc Allergy Clin Immunol. 29(3), 347-56. PubMed http://dx.doi.org/10.1046/j.1365-2222.1999.00369.x
24. Ariano R, Canonica GW, Passalacqua G. 2010. Possible role of climate changes in variations in pollen seasons and allergic sensitizations during 27 years. Ann Allergy Asthma Immunol Off Publ Am Coll Allergy Asthma Immunol. 104(3), 215-22. PubMed http://dx.doi.org/10.1016/j.anai.2009.12.005
25. Solomon WR. 2002. Airborne pollen: a brief life. J Allergy Clin Immunol. 109(6), 895-900. PubMed http://dx.doi.org/10.1067/mai.2002.125556
26. Eccles R. 2002. An explanation for the seasonality of acute upper respiratory tract viral infections. Acta Otolaryngol. 122(2), 183-91. PubMed http://dx.doi.org/10.1080/00016480252814207
27. Stajner I, Davidson P, Byun D, McQueen J, Draxler R, et al. US National Air Quality Forecast Capability: Expanding Coverage to Include Particulate Matter. In: Steyn DG, Castelli ST, editors. Air Pollution Modeling and its Application XXI [Internet]. Springer Netherlands; 2011 [cited 2016 Jul 29]. p. 379–84. (NATO Science for Peace and Security
Cross-Disciplinary Consultancy to Enhance Predictions of Asthma Exacerbation Risk in Boston
28 Online Journal of Public Health Informatics * ISSN 1947-2579 * http://ojphi.org * 8(3):e199, 2016
OJPHI
Series C: Environmental Security). Available from: http://link.springer.com/chapter/10.1007/978-94-007-1359-8_64
28. Otte TL, Pouliot G, Pleim JE, Young JO, Schere KL, et al. 2005. Linking the Eta Model with the Community Multiscale Air Quality (CMAQ) Modeling System to Build a National Air Quality Forecasting System. Weather Forecast. 20(3), 367-84. http://dx.doi.org/10.1175/WAF855.1
29. Djalalova I, Delle Monache L, Wilczak J. 2015. PM2.5 analog forecast and Kalman filter post-processing for the Community Multiscale Air Quality (CMAQ) model. Atmos Environ. 108, 76-87. http://dx.doi.org/10.1016/j.atmosenv.2015.02.021
30. Raun LH, Ensor KB, Persse D. 2014. Using community level strategies to reduce asthma attacks triggered by outdoor air pollution: a case crossover analysis. Environ Health Glob Access Sci Source. 13, 58. PubMed
31. Raun L, Campos L, Stevenson E, Ensor K, Persse D, et al. 2016. Analyzing who, when and where: data to better target resources for school-based asthma interventions. J Sch Health. (Forthcoming).
32. Eggo RM, Scott JG, Galvani AP, Meyers LA. Respiratory virus transmission dynamics determine timing of asthma exacerbation peaks: Evidence from a population-level model. Proc Natl Acad Sci U S A [Internet]. 2016; Available from: http://www.scopus.com/inward/record.url?eid=2-s2.0-84959248642&partnerID=40&md5=54125168c1532dfab1829aa13c753c84
33. Lin J, Burkom H, Murphy S, Elbert Y, Hakre S, et al. Life Science Data Mining. Hackensack: World Scientific Publishing, Inc; 2006. (Science, Engineering, and Biology Informatics).
34. Sanders DL, Gregg W, Aronsky D. 2007. Identifying asthma exacerbations in a pediatric emergency department: a feasibility study. Int J Med Inform. 76(7), 557-64. PubMed http://dx.doi.org/10.1016/j.ijmedinf.2006.03.003
35. Mnatsakanyan ZR, Burkom HS, Coberly JS, Lombardo JS. 2009. Bayesian information fusion networks for biosurveillance applications. J Am Med Inform Assoc. 16(6), 855-63. Epub Aug 2009. doi:http://dx.doi.org/10.1197/jamia.M2647. PubMed
36. Burkom HS, Ramac-Thomas L, Babin S, Holtry R, Mnatsakanyan Z, et al. 2011. An integrated approach for fusion of environmental and human health data for disease surveillance. Stat Med. 30(5), 470-79. PubMed
37. Karnon J, Stahl J, Brennan A, Caro JJ, Mar J, et al. 2012. Modeling Using Discrete Event Simulation A Report of the ISPOR-SMDM Modeling Good Research Practices Task Force–4. Med Decis Making. 32(5), 701-11. PubMed http://dx.doi.org/10.1177/0272989X12455462
Cross-Disciplinary Consultancy to Enhance Predictions of Asthma Exacerbation Risk in Boston
29 Online Journal of Public Health Informatics * ISSN 1947-2579 * http://ojphi.org * 8(3):e199, 2016
OJPHI
38. Fabian MP, Adamkiewicz G, Stout NK, Sandel M, Levy JI. 2014. A simulation model of building intervention impacts on indoor environmental quality, pediatric asthma, and costs. J Allergy Clin Immunol. 133(1), 77-84. PubMed http://dx.doi.org/10.1016/j.jaci.2013.06.003
39. Fabian MP, Stout NK, Adamkiewicz G, Geggel A, Ren C, et al. 2012. The effects of indoor environmental exposures on pediatric asthma: a discrete event simulation model. Environ Health Glob Access Sci Source. 11, 66. PubMed
40. Fabian P, Adamkiewicz G, Levy JI. 2012. Simulating indoor concentrations of NO(2) and PM(2.5) in multifamily housing for use in health-based intervention modeling. Indoor Air. 22(1), 12-23. PubMed http://dx.doi.org/10.1111/j.1600-0668.2011.00742.x
41. Levy JI, Fabian MP, Peters JL. 2014. Community-wide health risk assessment using geographically resolved demographic data: a synthetic population approach. PLoS One. 9(1), e87144. PubMed http://dx.doi.org/10.1371/journal.pone.0087144
42. Frize M, Ennett CM, Stevenson M, Trigg HCE. 2001. Clinical decision support systems for intensive care units: using artificial neural networks. Med Eng Phys. 23(3), 217-25. PubMed http://dx.doi.org/10.1016/S1350-4533(01)00041-8
43. Leegon J, Jones I, Lanaghan K, Aronsky D. Predicting hospital admission in a pediatric Emergency Department using an Artificial Neural Network. AMIA Annu Symp Proc AMIA Symp AMIA Symp. 2006;1004.
44. Moustris KP, Douros K, Nastos PT, Larissi IK, Anthracopoulos MB, et al. 2012. Seven-days-ahead forecasting of childhood asthma admissions using artificial neural networks in Athens, Greece. Int J Environ Health Res. 22(2), 93-104. PubMed http://dx.doi.org/10.1080/09603123.2011.605876