cross-enhancement of angptl4 transcription by hif1 alpha and ppar beta/delta is the result of the...
TRANSCRIPT

RESEARCH Open Access
Cross-enhancement of ANGPTL4 transcription byHIF1 alpha and PPAR beta/delta is the result ofthe conformational proximity of two responseelementsTsuyoshi Inoue1,2, Takahide Kohro3, Toshiya Tanaka2, Yasuharu Kanki2, Guoliang Li4, Huay-Mei Poh5,Imari Mimura1,2, Mika Kobayashi2, Akashi Taguchi2, Takashi Maejima6, Jun-ichi Suehiro2, Akira Sugiyama2,Kiyomi Kaneki2, Hirofumi Aruga7, Shoulian Dong7, Junko F Stevens7, Shogo Yamamoto2, Shuichi Tsutsumi2,Toshiro Fujita2, Xiaoan Ruan5, Hiroyuki Aburatani2, Masaomi Nangaku1, Yijun Ruan4, Tatsuhiko Kodama2
and Youichiro Wada2,8*
Abstract
Background: Synergistic transcriptional activation by different stimuli has been reported along with a diverse arrayof mechanisms, but the full scope of these mechanisms has yet to be elucidated.
Results: We present a detailed investigation of hypoxia-inducible factor (HIF) 1 dependent gene expression inendothelial cells which suggests the importance of crosstalk between the peroxisome proliferator-activated receptor(PPAR) β/δ and HIF signaling axes. A migration assay shows a synergistic interaction between these two stimuli,and we identify angiopoietin-like 4 (ANGPTL4) as a common target gene by using a combination of microarray andChIP-seq analysis. We profile changes of histone marks at enhancers under hypoxia, PPARβ/δ agonist and dualstimulations and these suggest that the spatial proximity of two response elements is the principal cause of thesynergistic transcription induction. A newly developed quantitative chromosome conformation capture assay showsthe quantitative change of the frequency of proximity of the two response elements.
Conclusions: To the best of our knowledge, this is the first report that two different transcription factors cooperatein transcriptional regulation in a synergistic fashion through conformational change of their common target genes.
BackgroundThe vascular system sits at the center of oxygen delivery inmammals, and its inner layer endothelial cells play an es-sential role in network formation. In addition to thephysiological angiogenesis that occurs in wound healingand during aerobic exercise, hypoxia is involved in variouspathological conditions, for example, cardiovascular dis-ease, diabetic complications, inflammatory diseases andcancer. Poor perfusion of vital organs, including the brain,heart, liver and kidney, can result in hypoxia and critical
loss of function. In the core of solid tumors, oxygen de-mand surpasses the capacity of feeding arteries and thecells are exposed to hypoxia, sometimes with deleteriouseffects on the progress of the disease. In both contexts, theendothelium is the first cell layer that senses hypoxia aswell as changes in hemodynamic forces and blood-bornesignals, and this evokes the first step in response to hyp-oxia, namely angiogenesis [1]. Responding to a demand formore oxygen, endothelial cells migrate and proliferate toform solid endothelial cell sprouts into the stromal spacethrough the induction of a series of gene transcriptionalevents required for an increased oxygen supply [2].In the gene regulation that takes place under hypoxia,
hypoxia-inducible factor (HIF)1 is regarded as one of themaster gene regulators [3] and we previously reported
* Correspondence: [email protected] Center for Advanced Science and Technology, The University ofTokyo, 4-6-1, Komaba, Meguro-ku, Tokyo 153-8904, Japan8Radioisotope Center, The University of Tokyo, 2-11-16, Yayoi, Bunkyo-ku,Tokyo 113-0032, JapanFull list of author information is available at the end of the article
© 2014 Inoue et al.; licensee BioMed Central Ltd. This is an Open Access article distributed under the terms of the CreativeCommons Attribution License (http://creativecommons.org/licenses/by/2.0), which permits unrestricted use, distribution, andreproduction in any medium, provided the original work is properly credited.
Inoue et al. Genome Biology 2014, 15:R63http://genomebiology.com/2014/15/4/R63

genome-wide analysis of HIF1α location in endothelialcells [4]. Angiogenesis is enhanced by HIF, and it is fur-ther orchestrated by various other angiogenic factors, in-cluding vascular endothelial growth factor (VEGF) [5],basic fibroblast growth factor (bFGF) [6], angiopoietinsand angiopoietin-like (ANGPTL) proteins [7]. In additionto HIF1, another transcription factor (TF), peroxisomeproliferator-activated receptors (PPAR)β/δ is reported toparticipate in angiogenesis [8,9]. PPARs are known to beimportant in the regulation of numerous biological pro-cesses, including lipid metabolism [10], adipocyte differenti-ation [11,12], cell proliferation [12] and inflammation [13].To date, three PPAR isotypes have been identified, PPARα,PPARβ/δ and PPARγ. PPARα and PPARγ play a crucial rolein lipid metabolism [10], and reports from various groups,including ours, have shown that PPARβ/δ, as well as theother isotypes, also regulate lipid metabolism [14]. In arecent study it was reported that the PPARβ/δ agonistGW501516 stimulated human umbilical vein endothelialcell (HUVECs) proliferation dose-dependently [9], pro-moted endothelial tube formation, and increased angi-ogenesis [8]. Another PPARβ/δ agonist, GW0742, ormuscle-specific overexpression of PPARβ/δ, also promotedangiogenesis in mouse skeletal muscle [15]. Additional evi-dence further suggested that PPARβ/δ is one of the im-portant TFs participating in the angiogenic network inendothelial cells [16,17]. These lines of evidence arestrongly suggestive of a role for PPARβ/δ in angiogenesis.Although several key TFs have been shown to be in-
volved in angiogenesis, the detailed underlying hierarch-ical or mutual interaction of multiple cascades is onlypartially understood [16]. To dissect the molecular mech-anism of crosstalk in angiogenesis, we selected two im-portant angiogenic stimuli, hypoxia and PPARβ/δ agoniststimulation, and investigated the molecular mechanism bywhich these two signals in concert are able to enhance acommon angiogenesis-related target gene.In this study, we are focusing on the new molecular
mechanism where conformational change could contributeto the co-operative transcriptional regulation of a commontarget by two different TFs. It was previously reportedthat synergistic transcription could be achieved by differentTFs through enhanceosomes [18,19], which are complexesmade from proteins binding to regulatory elements ofgenes. Apart from the enhansceosome concept, which em-phasizes the diversity of TF specificity, our findings on syn-ergistic transcription suggest that chromatin structuralchanges are inseparable from the transcription machinery.
ResultsEndothelial cell migration is synergistically enhanced byhypoxic and PPARβ/δ agonist stimuliTo confirm the physiological effect of hypoxia and thePPARβ/δ agonists, and to evaluate the physiological
crosstalk of these angiogenic stimuli in endothelial cells,we applied PPARβ/δ and hypoxia to HUVECs and stud-ied the effect on cellular migration function by using amonolayer-wound healing assay. Figure 1A shows thedistribution of the cells before and after the stimuli.Quantification of the endothelial cell migratory area (thered area in Figure 1A) is shown in Figure 1B. To avoidthe effect of VEGF in the media, the assay was per-formed using endothelial culture media without anygrowth factors or fetal bovine serum (FBS). PPARβ/δand hypoxia individually tended to be associated withgreater recovery in HUVECS than normoxia and DMSO,but this was not statistically significant. However, simul-taneous application of both stimuli resulted in a signifi-cant increase in migration of endothelial cells comparedto untreated control. This finding suggested that this ex-perimental motif could be applied to elucidate the syner-gistic activation that is exerted through PPARβ/δ andHIF1α in endothelial cell function. Therefore, we fo-cused on dissecting the molecular mechanism under-lying the synergistic effect of the two stimuli.
Genome-wide analysis of PPARβ/δ and/or hypoxia-induced genes in endothelial cells identified ANGPTL4 asthe common target geneTo estimate the possible interaction of the PPARβ/δ andHIF1α signaling pathways in a more comprehensive man-ner, we performed transcriptome analysis using microar-rays after 24 hours of treatment with a PPARβ/δ-selectiveagonist (GW501516, 100 nM) and/or hypoxic (1% O2)stimulation. After normalization and filtering, gene ex-pression change against the normoxia-DMSO sample wascalculated. A scatter plot of normalized intensity values ofall genes under two conditions is shown in Figure S1A,Bin Additional file 1. The PPARβ/δ agonist-induced genes(Figure S1A in Additional file 1) were compared with thehypoxia-induced genes (Figure S1B in Additional file 1).In general, the number of genes induced by hypoxiawas much larger than that induced by the PPARβ/δagonist. To extract the genes responsive to either of thestimuli, genes that had a fold change ≥2.0 were selected;288 genes remained. Hierarchical cluster analysis was per-formed on these, and the genes were classified into threeclusters (Figure 2A; Figure S2 in Additional file 1). Genesthat exhibited induction under hypoxia are in cluster 1(Figure 2A; Figure S2 in Additional file 1). This clusterwas then subclustered into four conditions (cluster 1-1to 1-4), and the genes that also exhibited up-regulationby the PPARβ/δ agonist were classified into cluster 1-4(Figure S2 in Additional file 1). Likewise, the genes in-duced by the PPARβ/δ agonist, but not hypoxia, wereplaced into cluster 2 (Figure 2A; Figure S2 in Additionalfile 1). As illustrated by the Venn diagram in Figure 2B,208 out of 288 genes exhibited induction by hypoxia, and
Inoue et al. Genome Biology 2014, 15:R63 Page 2 of 17http://genomebiology.com/2014/15/4/R63

9 genes were induced by GW501516, with an overlap of3 genes (fold change ≥1.5). As shown in Table S1 inAdditional file 2, the overlapped genes were angiopoietin-like 4 (ANGPTL4), arrestin domain-containing 4 (ARRDC4)and leucine rich adaptor protein 1-like (LURAP1L),exhibiting 35.3-, 2.5-, 2.2-fold induction under PPARβ/δagonist treatment and hypoxia compared to no stimula-tion, respectively (Table S1 in Additional file 2). All ofthese three genes were placed in cluster 1-4 (Figure 2A,right upper panel).Genes (fold change ≥1.5, shown in the Venn diagram in
Figure 2B) up-regulated by the PPARβ/δ agonist are listedin Table S1 in Additional file 2, and the gene most highlyinduced by the PPARβ/δ agonist was also ANGPTL4,which displayed a 7.0-fold induction compared with ve-hicle treatment. The genes induced by the PPARβ/δ agon-ist but not hypoxia were included in cluster 2 (Figure 2A,the lower right panel). In addition, ANGPTL4 was thegene most highly induced by hypoxia, having a 20.1-foldinduction compared to normoxia (Tables S1 and S2 inAdditional file 2). A scatter plot of the fold change valuesinduced by the PPARβ/δ agonist or hypoxia comparedwith no treatment is shown in Figure S3 in Additionalfile 1, again showing that no other genes responded tothe same level as ANGPTL4 under the treatments. Up-regulation of ANGPTL4 by PPARβ/δ agonist treatmentand hypoxic stimulation were confirmed by quantitativeRT-PCR (qRT-PCR), with the result showing synergisticactivation (Figure 2C). ANGPLT4 transcription was mea-sured by amplifying nascent transcript with primers rec-ognizing intron-exon junctions (Figure S4 in Additionalfile 1) and similar results were obtained (the primersfor qRT-PCR are shown in Table S3A in Additionalfile 2). Western blotting indicated that ANGPTL4 was
also synergistically generated by the dual stimulation(Figure S5 in Additional file 1). Increased amounts ofrecombinant ANGPTL4 protein were confirmed to enhancemigration of endothelial cells (Figure S6 in Additionalfile 1). Taking these data into account, we focused onANGPTL4 as a key motif in the elucidation of the mo-lecular crosstalk mechanism.
Whole genome analysis of PPARβ/δ and HIF1α bindingsites in endothelium confirmed ANGPTL4 as the commontarget geneTo extract the genes that are directly regulated by PPARβ/δ, we carried out chromatin immunoprecipitation (ChIP)using a PPARβ/δ antibody in HUVECs treated withPPARβ/δ agonist stimulation for 24 hours, followed bydeep sequencing (ChIP-seq). In total 38,936,258 readswere aligned and 77.6% of the total reads were aligneduniquely to the non-repeating human genomic sequence.Next, we calculated the enrichment of the PPARβ/δChIP DNA fragments compared with the input, and de-termined the significant PPARβ/δ binding sites accord-ing to the QuEST algorithm [20]. In total, 364 bindingregions were identified as PPARβ/δ enrichment sites underPPARβ/δ agonist treatment (Figure S7A in Additionalfile 1). To investigate the correlation of the PPARβ/δ bind-ing regions and the nearest known transcripts, we dividedthe regions into five sections based on the distance fromthe transcription start site (TSS) of the correspondinggenes. As shown in Figure S7A in Additional file 1, 82%were positioned in intergenic regions under PPARβ/δagonist treatment, 6% were located upstream (25 kbp to 1kbp upstream of the TSS), and 3% were located on theTSS (within a range of 1 kbp upstream of the TSS to thefirst intron).
0.6
0.8
1
1.2
1.4
1.6
Normoxia
DMSO
Normoxia
agonist
Hypoxia
agonist
Hypoxia
DMSO
*
B
Normoxia
DMSO
Normoxia
agonist
Hypoxia
DMSO
Hypoxia
agonist
0 h 8 hoursA
Mig
rate
d a
rea
Figure 1 Endothelial cell migration is synergistically enhanced by hypoxia and the PPARβ/δ agonist. (A) Images acquired for eachstimulus at 0 hour and 8 hours. HUVECs were treated with the PPARβ/δ agonist (GW501516 100 nM) and/or hypoxia (1% O2) for 8 hours. Thevertical lines indicate the edge of the scratch and the red colored regions at 8 hours show the cell migratory area. Representative images areshown. (B) Quantification of the area of endothelial cell migration. The area colored in red (Figure 1A) was measured and the size relative tothe untreated condition is indicated. Data (mean ± standard deviation) are representative of three independent experiments with similar results.*P < 0.05 compared with the untreated condition.
Inoue et al. Genome Biology 2014, 15:R63 Page 3 of 17http://genomebiology.com/2014/15/4/R63

To validate the ChIP-seq data for PPARβ/δ, we per-formed a motif search of PPARβ/δ binding sites (FigureS7A in Additional file 1, right panel), and the generatedsequences perfectly matched the known PPAR bindingmotifs. The qRT-PCR and ChIP-seq data for representa-tive genes responsive to PPARβ/δ or hypoxia are shownin Figure S7B,C in Additional file 1. Pyruvate dehydrogen-ase kinase, isozyme 4 (PDK4), carnitine palmitoyltransfer-ase 1A (CPT1A) and solute carrier family 25, member20 (SLC25A20), all listed in Table S1 in Additional file 2,are well-known PPARβ/δ target genes. In terms of thehypoxia-induced genes, the genes expressed more thantwo-fold under hypoxia compared with normoxia are shown
in Table S2 in Additional file 2. The qRT-PCR andChIP-Seq data for three representative genes are shownin Figure S7B,C in Additional file 1. Vascular endothelialgrowth factor (VEGFA), solute carrier family 2, member 1(SLC2A1) and adenylosuccinate synthase like 1 (ADSSL1)are hypoxia induced genes, showing 3.3-, 6.5- and 4.3-foldinduction compared with normoxia, respectively (Table S2in Additional file 2). Using previously obtained data onHIF1α binding sites, the commonly bound genes were ex-tracted, and the binding of PPARβ/δ and HIF1α at theANGPTL4 locus was confirmed (Figure 3A,C). ChIP-seqanalysis revealed that ANGPTL4 is the only gene boundby PPARβ/δ and HIF1α among the common target genes
AB
C
Figure 2 Genome-wide analysis of PPARβ/δ and/or hypoxia-induced genes in endothelial cells identified ANGPTL4 as the commontarget gene. (A) Left panel: clustering analysis performed using the selected genes. Right upper panel: genes with their expression profilesplaced into the cluster 1-4, which included the genes that responded to both PPARβ/δ agonist and hypoxia. Right lower panel: genes and theirexpression profiles in cluster 2, which contained the genes induced by the PPARβ/δ agonist, but not hypoxia. (B) Venn diagram of the PPARβ/δagonist and/or hypoxia-induced genes. Based on microarray analysis, after normalization and filtering, gene expression under PPARβ/δ agonist(GW501516 100 nM) or hypoxia (1% O2) stimulation (24 hours) in HUVECs was compared with no stimulation (DMSO + normoxia), and then genesthat had a fold change ≥1.5 were selected. (C) Quantitative RT-PCR analysis of ANGPTL4 for both types of stimulation. HUVECs were stimulatedwith the PPARβ/δ agonist (GW501516 100 nM) and/or hypoxia (1% O2) for 24 hours. Data (mean ± standard deviation) are representative of twoindependent experiments with similar results. *P < 0.001 compared between the indicated conditions.
Inoue et al. Genome Biology 2014, 15:R63 Page 4 of 17http://genomebiology.com/2014/15/4/R63
identified by microarray analysis. In addition, the genemost highly induced by the two different regulators wasANGPTL4.
ANGPTL4 is regulated by both PPARβ/δ and HIF1αsignaling cascadesTo determine whether ANGPTL4 was induced throughPPARβ/δ and HIF1α signaling, we performed a seriesof experiments using small interfering RNA (siRNA)against PPARβ/δ and/or HIF1α. As shown in FigureS8A,B in Additional file 1, the efficiency of the siRNA-mediated knockdown of PPARβ/δ was over 80% at themRNA level with or without its agonist. The efficiency
of the knockdown of HIF1α was over 90% (Figure S8C,Din Additional file 1). Almost complete inhibition ofANGPTL4 induction by the agonists was achieved bythe siRNA against PPARβ/δ (Figure S9A in Additionalfile 1). ANGPTL4 mRNA levels were reduced by over70% under hypoxia using either of the two siRNAsagainst HIF1α (Figure S9B in Additional file 1). Whenboth stimuli were applied, ANGPTL4 mRNA levels werereduced by over 60% using a combination of si-PPARβ/δoligo1 and si-HIF1α oligo 1 (Figure S9C in Additionalfile 1). These data confirmed that the up-regulation ofANGPTL4 by the PPPAβ/δ agonist and/or hypoxia isdependent on both PPARβ/δ and HIF1α.
A
B
C
D
E
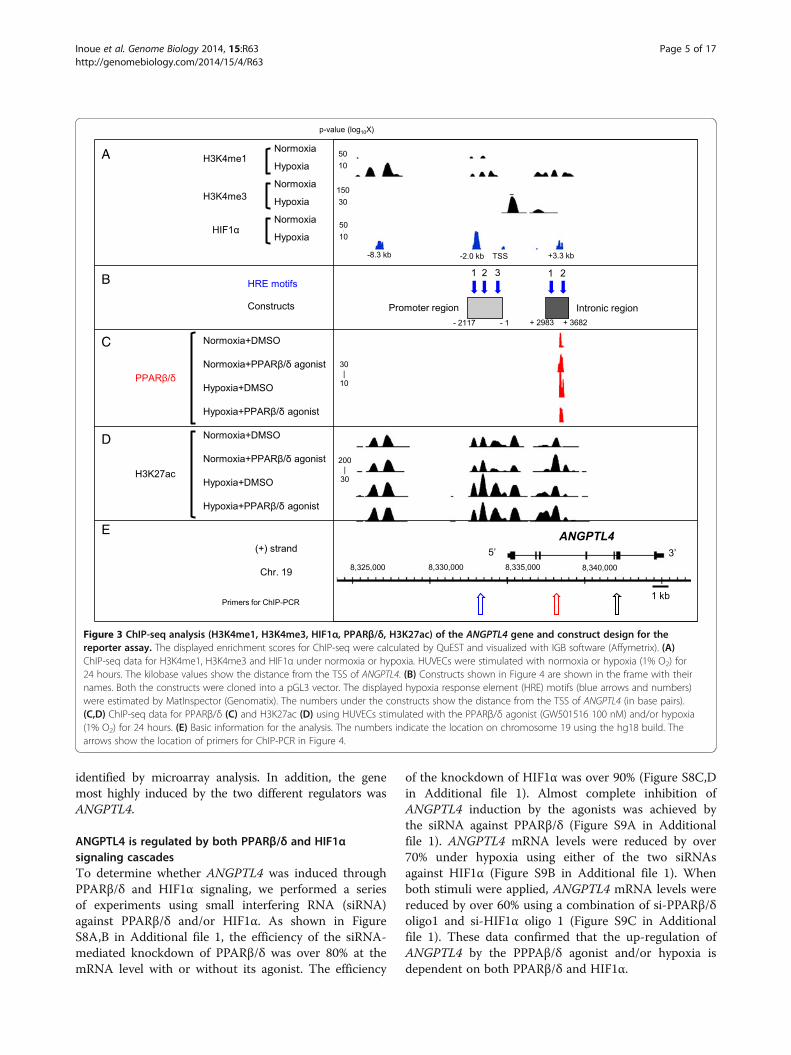
Figure 3 ChIP-seq analysis (H3K4me1, H3K4me3, HIF1α, PPARβ/δ, H3K27ac) of the ANGPTL4 gene and construct design for thereporter assay. The displayed enrichment scores for ChIP-seq were calculated by QuEST and visualized with IGB software (Affymetrix). (A)ChIP-seq data for H3K4me1, H3K4me3 and HIF1α under normoxia or hypoxia. HUVECs were stimulated with normoxia or hypoxia (1% O2) for24 hours. The kilobase values show the distance from the TSS of ANGPTL4. (B) Constructs shown in Figure 4 are shown in the frame with theirnames. Both the constructs were cloned into a pGL3 vector. The displayed hypoxia response element (HRE) motifs (blue arrows and numbers)were estimated by MatInspector (Genomatix). The numbers under the constructs show the distance from the TSS of ANGPTL4 (in base pairs).(C,D) ChIP-seq data for PPARβ/δ (C) and H3K27ac (D) using HUVECs stimulated with the PPARβ/δ agonist (GW501516 100 nM) and/or hypoxia(1% O2) for 24 hours. (E) Basic information for the analysis. The numbers indicate the location on chromosome 19 using the hg18 build. Thearrows show the location of primers for ChIP-PCR in Figure 4.
Inoue et al. Genome Biology 2014, 15:R63 Page 5 of 17http://genomebiology.com/2014/15/4/R63

Identification of the functional hypoxia response elementof ANGPTL4Since ANGPTL4 is downstream of the two transcriptioncascades and is commonly activated, we tried to dissectthe molecular mechanism of the dual enhancement.We therefore set out to identify a functional hypoxiaresponse element (HRE) in ANGPTL4. HUVECs werestimulated with hypoxia (1% O2) and incubated for24 hours, followed by identification of histone modifica-tions (monomethylated histone 3 lysine 4 (H3K4me1),trimethylated histone 3 lysine 4 H3K4me3, and acety-lated histone 3 lysine 27 (H3K27ac)) and HIF1α bindingsites by ChIP-seq. As shown in Figure 3A, no binding ofHIF1α was observed under normoxia in the ANGPTL4gene locus, but five HIF1α binding sites appeared underhypoxia. H3K4me3, known as a promoter marker [21],was only observed for ANGPTL4 under hypoxia, sug-gesting that the ANGPTL4 locus became activated underhypoxia. Three out of the five potential HIF1α bindingsites were also accompanied by two markers of enhanceractivity, H3K4me1 [22] and H3K27ac [23-25]. As theresolution of ChIP-seq is about 100 bp [26], to narrowthe binding locus, HRE motifs were predicted inboth the promoter and intron regions (blue arrows inFigure 3B) using MatInspector software (Genomatix).Based on co-localization of HIF1α binding, histonemarks, and HRE motifs, we named these enhancer/promoter regions the 'promoter region' and the 'intronicregion', from 5′ upstream, respectively (Figure 3B). Con-sidering this classification, we made a series of con-structs for a subsequent reporter assay. From the 5′ end,we named the HRE motifs 'Pro-HRE1' to 'Pro-HRE3',and 'Int-HRE1' and 'Int-HRE2' (Figure 3B).After luciferase activity was up-regulated in the pres-
ence of the promoter region under hypoxia (data notshown), we made a further series of deletion mutantconstructs and HRE motif-mutated constructs to iden-tify the hypoxia responsive sites (Table S3B in Additionalfile 2). Using these mutated constructs and the promoterand intronic regions, a luciferase assay was performed inHUVECs under hypoxia (Figure 4A). The luciferase ac-tivity of the promoter and intronic regions (shown inthe first line) was unchanged compared to the pro-moter construct (shown in the second line) (Figure 4A).Thus, the intronic region did not play an essential roleunder hypoxia. Among the six constructs, the luciferaseactivity under hypoxia was not significantly differentexcept for two constructs; the Pro-HRE1 deletion con-struct and the HRE mutation 1 construct. However, theHRE mutation 2 construct and HRE mutation 3 con-struct were up-regulated to some extent. Thus, Pro-HRE1 in the promoter region, which is located 2.0 kbupstream of the TSS, was important for hypoxia re-sponsive induction.
Synergistic activation of ANGPTL4 transcription byhypoxia and PPARβ/δ agonist in HUVECs andidentification of the functional PPAR-response elementAs shown in Figure 2C, the induction of ANGPTL4 withboth stimuli was approximately five times higher thanthat of hypoxia or the PPARβ/δ agonists alone, suggest-ing that there is a synergistic activation mechanism be-tween the two stimuli in HUVECs. Based on the findingthat the PPARβ/δ binding site was identified by ChIP-seq at the third intron of ANGPTL4 (Figure 3C), wherefunctional HIF1α binding sites had already been identified(Pro-HRE1 in Figure 3B), a reporter assay was carried outusing constructs containing the two essential units, the pro-moter region, which is important for HIF1α stimulation,and the intronic region, which is utilized for PPARβ/δ sig-naling. As shown in Figure 4B, the activity of this constructwas greater than up-regulation from a single stimulus.Thus, we considered the constructs shown in Figure 4B tocontain the units essential for synergistic activation, and wemade each of the mutated PPAR-response element (PPRE)constructs shown in Figure 4C to identify the functionalPPRE. Reporter activity induction was compared to a non-mutated control construct (Figure 4C, top), under four dif-ferent conditions in three kinds of mutation construct.Among them, the induction activity of the PPRE mutation2 construct was suppressed significantly, and the inductionby PPARβ/δ agonist under normoxia was canceled. Evenunder hypoxia, the effect of the PPAR agonist was dimin-ished in this construct. These results suggested that allof the three PPREs contributed to some extent to thetranscriptional enhancement, but PPRE 2 at the third in-tron had the most profound effect on the regulation ofANGPTL4 through PPARβ/δ agonist stimulation.
Stimuli induce the histone acetylation level of theresponse elements and not the quantity of PPARβ/δbinding to the third intron of ANGPTL4As in the case of HIF1α recruitment, we originally hy-pothesized that PPARβ/δ binding might be increasedin the course of the synergistic activation. Thus, we ana-lyzed PPARβ/δ binding by ChIP-seq under four condi-tions: no stimulation (DMSO+normoxia), PPARβ/δ agoniststimulation (GW501516 + normoxia), hypoxia (1% O2 +DMSO), and both PPARβ/δ agonist and hypoxia (GW501516 + 1% O2) for 24 hours. Unexpectedly, the locationsand distribution patterns of the PPARβ/δ binding (shownin red) to ANGPTL4 did not change under the four condi-tions (Figure 3C). Furthermore, the quantity of PPARβ/δbinding to ANGPTL4 was compared by ChIP-PCR usingprimers of the PPARβ/δ binding site at the third intronof ANGPTL4 (Figure 3C; the primers for ChIP-PCRare listed in Table S3C in Additional file 2), and thelevel of PPARβ/δ binding under the four conditionswas equivalent (Figure 4D).
Inoue et al. Genome Biology 2014, 15:R63 Page 6 of 17http://genomebiology.com/2014/15/4/R63

A B
C D
E F
Figure 4 (See legend on next page.)
Inoue et al. Genome Biology 2014, 15:R63 Page 7 of 17http://genomebiology.com/2014/15/4/R63

Thus, we speculated that PPARβ/δ might be activatedwithout any distribution change, and to test this notion,we determined whether the activity of the enhancer wasaffected. Previously, CBP/p300-mediated H3K27 acetyl-ation in PPARβ/δ-dependent transcription was reported[25], so we evaluated the intensity of H3K27ac, a markerof enhancer activity. First, ChIP-seq analysis using ananti-H3K27ac antibody was performed under the fourconditions and its distribution patterns on a genome-wide scale were analyzed. In general, the number ofacetylation sites was increased by any of the forms ofstimulation by 12 to 13%, but its whole genome distribu-tion patterns did not change significantly under the dif-ferent conditions (Figure S10 in Additional file 1).Approximately 70% of the H3K27ac was found at thegenes under all the conditions. In detail, 4% of H3K27acwas located in an upstream region, 7% at the TSS, 6 to7% in the 5′ UTR, 15 to 16% in the first intron, 23 to24% in other introns, 5% in exons, 1% in the 3′ UTRand 4 to 5% in downstream regions.In terms of ANGPTL4, consistent with the general ten-
dency, the binding distribution of H3K27ac in ANGPTL4did not change depending on the conditions (Figure 3D),but the intensity of H3K27 acetylation did change withthe different types of stimulation. To compare this quan-titatively, we performed ChIP-PCR using the primers de-signed for the HRE and PPRE sites (the primers forChIP-PCR are listed in Table S3C in Additional file 2).The level of H3K27 acetylation around the functionalPPRE (the site indicated with the open red arrow inFigure 3E) was 3.7 times more enhanced by the PPARβ/δagonist, which is consistent with the ChIP-seq data(Figure 4E). Surprisingly, however, even with hypoxicstimulation, the acetylation level around PPRE was3.0-fold up-regulated, and 5.3-fold induction was ob-served with a combination of hypoxia and PPAR agon-ist (Figure 4E). The same phenomenon was observedaround the functional HRE (Figure 4F). The level ofH3K27 acetylation around the HRE (the site indicated
with the open blue arrow in Figure 3E) was 4.2 timesmore enhanced under hypoxia. In addition, the acetyl-ation around HRE was 2.3 times increased even withthe PPARβ/δ agonist alone, and 6.4 times with thecombination of stimuli (Figure 4F). These results sug-gest that hypoxia and PPARβ/δ together cross-enhancethe intensity of the TF-bound enhancer sites.
HIF1α and PPARβ/δ change the chromatin conformationin the ANGPTL4 locusTo dissect the molecular mechanism by which the twodifferent signaling cascades communicate with each other,and with the intention of providing a physical basis for thephenomenon, we considered the possibility that a changein chromatin conformation might participate in the cross-talk, since the main role of the enhancer is to form a chro-matin loop through spatial proximity with the TSS [4,27].To evaluate the proximity frequency of the two responsesites (HRE and PPRE) under the four different conditions,quantitative chromatin conformation capture (3C) assaywas performed. As shown in Figure 5A, the functionalHRE (blue arrow) and PPRE (red arrow) are separated byapproximately 5.3 kb, and to perform the 3C assay, wechose Sau3AI, a four base pair cutter, for DNA fragmenta-tion. The primers and TaqMan probes for the 3C targetanalysis were designed using both of the fragments con-taining the functional HRE or PPRE (Figure 5A; and TableS3D in Additional file 2). Figure 5B shows the results ofthe TaqMan-3C assay, including the target locus shownwith the red circle in Figure 5A. Except for the target re-gion, no increased interaction was observed. In the case ofeither stimulation, compared with the control condition ofnormoxia and DMSO (green versus red or blue lines inFigure 5B), the frequency of crosslinking between theHRE and PPRE was increased. The same crosslinking fre-quency was observed for the combination of hypoxia andPPARβ/δ agonist (Figure 5B, black line). These resultssuggest that both of the single stimulations brought oneresponsive site into proximity of the other responsive site.
(See figure on previous page.)Figure 4 Identification of the functional HRE and PPAR-response element on ANGPTL4, the quantity of PPARβ/δ binding to the thirdintron of ANGPTL4 and histone acetylation level of the response elements. (A) Reporter assay with HRE mutations in intronic regions inHUVECs. HUVECs were transfected and stimulated as shown in Material and methods. The reported HREs in the promoter and intronic regionlocated in constructs and shown by the blue arrows with numbers. (B) HUVECs were transfected with the construct containing knownPPAR-response elements (PPREs; red arrows in upper panel) and were stimulated with the PPARβ/δ agonist GW501516 (100 nM) and/or hypoxia(1% O2) for 24 hours. Comparison was done between the indicated conditions. (C) Reporter assay for PPRE mutations. Cells were transfected witheach construct and stimulated with the PPARβ/δ agonist and/or hypoxia for 24 hours (as above). The reported PPREs are shown by the redarrows with numbers. Comparison was with the untreated condition, and #P < 0.05 compared to the hypoxic condition. (D) ChIP-PCR of PPARβ/δunder the four conditions. Location of primers is shown in Figure 3C. (E) ChIP-PCR of H3K27ac under the four conditions around the PPARβ/δbinding site. Primers were designed for an upstream region close to the PPARβ/δ binding site at the third intron of ANGPTL4 (Figure 3E). (F)ChIP-PCR of H3K27ac under the four conditions around the HIF1α binding site. Primers were designed for a downstream region close to theHIF1α binding site 2 kbp upstream of the TSS (blue open arrow in Figure 3E). Primers for ChIP-PCR are listed in Table S5 in Additional file 2.Comparison was with normoxia-DMSO sample or between indicated pairs. Data (mean ± standard deviation) are representative of three (A to C),or two (D and F) independent experiments with similar results. ***P < 0.001, **P < 0.01, *P < 0.05; n.s., not significant.
Inoue et al. Genome Biology 2014, 15:R63 Page 8 of 17http://genomebiology.com/2014/15/4/R63

To validate the reliability of the 3C assay, PCR prod-ucts were directly sequenced and the conjunction ofthe HRE and PPRE fragments mediated by the restric-tion site was confirmed (Figure S11 in Additional file 1).To see the specificity of the looping between HREand PPRE, we also performed a TaqMan-3C assay withtwo different control anchor primers (blue circles inFigure 5A). Figure 5C shows the results with the anchorprimer at the fragment located -4 kb from the TSSof ANGPTL4, and Figure 5D shows these using the
primers 6 kb downstream of the TSS of ANGPTL4.In Figure 5C, the relative crosslinking frequencies be-tween P2 (TSS-8 kb) and control anchor region 1 (C1;TSS-4 kb) were slightly increased under the stimula-tions, but no looping was observed between C1 and thePPRE (P5). Similarly, no increased relative crosslinkingfrequency was observed between control anchor region2 (C2) and the PPRE (P5), as expected. These resultssupport that the looping between the HRE and PPREspecifically occurs upon stimulation.
A
B
D
F
C
E
Figure 5 Chromatin conformation was changed at the ANGPTL4 locus by HIF1α and PPARβ/δ. (A) Schematic diagram of the ANGPTL4gene locus and 3C experimental settings. The colored circles show the position of anchor primers and TaqMan probes (red for target anchor,blue for control anchor). Arrowheads show the positions of primers. The digestion sites of Sau3AI are shown with the generated fragmentsbelow. The distance from the TSS of ANGPTL4 is shown at the bottom with the primer name. The functional HRE and PPRE are shown with blueand red arrows. The genomic location on the chromosome based on the hg18 build is shown at the top. (B) 3C assays based on HRE fragment.Anchor primer and TaqMan probe were designed on HRE fragment and the other primers were designed for analyzing the crosslinkingfrequency of the HRE and the other fragments (Figure 5A). HUVECs were treated with four conditions, then the relative frequencies werecompared among them. (C,D) 3C assays based on the control 1 (C) and control 2 (D) fragments. Anchor primer and TaqMan probe weredesigned on the fragment located 4 kb upstream of the TSS (C1), and on the fragment located 6 kbp downstream of the TSS (C2). The otherprimers are the same as in (B). To compare the data properly, the relative frequency data under dual stimulations in (B) are shown by the dottedline. Primers for 3C experiments (B-D) are shown in Table S3D in Additional file 2 and the locations of primers are shown in Figure 5A. (E) 3Cassay of the target motif (HRE and PPRE) using siRNA against HIF1α and/or PPARβ/δ. HUVECs were transfected with siRNAs and, 48 h later,stimulated for 24 hours. (F) ChIP-seq analysis (RNA polymerase II) of ANGPTL4. Data (mean ± standard error of the mean) are representative ofthree independent experiments with similar results (B-E).
Inoue et al. Genome Biology 2014, 15:R63 Page 9 of 17http://genomebiology.com/2014/15/4/R63

To determine whether HIF1α or PPARβ/δ binding re-quires the observed chromatin conformational change atthe ANGPTL4 locus, we treated cells with siRNA againstHIF1α and/or PPARβ/δ and performed quantitative 3Cassays under stimulation with both hypoxia and thePPARβ/δ agonist (Figure 5E). Though the effect of hyp-oxia plus the PPAR agonist was measurable (1 versus 2in Figure 5E), the frequency was changed by a reductionof either PPARβ/δ (2 versus 3 in Figure 5E) or HIF1α (2versus 4 in Figure 5E) or of a combination of both fac-tors (2 versus 5 in Figure 5E), supporting the notion thatHIF1α and/or PPARβ/δ are involved in chromatin loopformation at the HRE and PPRE of the ANGPTL4 locus.
Additive effect on active RNA polymerase II recruitmentby HIF1α and PPARβ/δThe 3C data (Figure 5B-E) strongly suggest that a higherfrequency of spatial proximity of two response elements isbeneficial to synergistic induction of ANGPTL4 by hyp-oxia and the PPARβ/δ agonist in HUVECs (Figure 2C).The luciferase activity result for the ANGPTL4 construct(Figure 4B) also supports this notion. To confirm the con-formation change is associated with more efficient recruit-ment of active RNA polymerase II (Pol II), ChIP-seqanalysis using anti-phospho C-terminal domain (CTD) ofPol II under the four conditions was performed. As shownin Figure 5F, more Pol II was recruited to the TSS ofANGPTL4 with either hypoxic (second line in Figure 5F)or PPARβ/δ agonist stimulation (third line in Figure 5F).Furthermore, the highest degree of Pol II distribution inANGPTL4 was observed under the dual stimulation(fourth line in Figure 5F) and this phenomenon was con-firmed by ChIP-PCR of Pol II (Figure S12 in Additionalfile 1). These findings confirm that the conformationalchange caused by the dual stimulation resulted in additivelocalization of Pol II in the target motif.
DiscussionThe angiopoietin/angiopoietin-like gene family encodes aglycosylated, secreted protein with a fibrinogen carboxy-terminal domain. In vascular cells, the angiopoietins act asmajor regulators of angiogenesis and vascular permeabilitythrough binding to the Tie-2 receptor [7]. Angiopoietin-like proteins (ANGPTL1 to 7) share structural and func-tional properties with angiopoietins, but do not bind tothe Tie-2 receptor [28]. This study shows that, under hyp-oxia and PPARβ/δ stimulation, ANGPTL4 was intenselyexpressed (Figure 2C; Table S1 in Additional file 2). Theseresults confirm the previous finding that ANGPTL4 ishighly induced by hypoxia in endothelial cells [29,30]. Fulllength ANGPTL4 exists as an oligomeric complex, and itcan be cleaved in vivo to release the two domains, result-ing in the presence of both the full-length and cleavedforms in plasma. The amino-terminal coiled-coil domain
inhibits lipoprotein lipase (LPL) activity and increasesplasma triglycerides [31], while the carboxy-terminalFBG-like domain (cANGPTL4) is associated with theintegrity of endothelial cells [32]. Since migration ofHUVECs was synergistically enhanced by the two stimuli(Figure 1), which induced ANGPTL4, our findings implythat increased carboxy-terminal domain activity mightparticipate by disrupting endothelial junctions by an effecton integrins, as was reported previously [33]. In contrast,however, ANGPTL4-deficient mice displayed decreasedvascular integrity in the retina [34] and heart [35]. Fur-thermore, administration of recombinant ANGPTL4 waseffective as a treatment for acute myocardial infarctionbecause it counteracts the increase in permeability ob-served in re-perfused acute myocardial infarction [35].Although leukocyte immunoglobulin-like receptor B2(LILRB2) was identified as an agonist for other membersof the ANGPTL family, the agonist for ANGPTL4 is stillunidentified [36]. Furthermore, the PPARβ/δ-ANGPTL4pathway was shown to be involved in tumor cell invasion[37]. Therefore, the role of ANGPTL4 in the inflammatoryresponse in vivo needs to be interpreted, taking into con-sideration communication with other cell types involvedin angiogenesis or wound healing.One of the transcriptional regulators of ANGPLT4 is
HIF1α, and this TF is known to be recruited to targetgenes immediately after hypoxic stimulation [4]. Anothertranscription regulator of ANGPTL4 is PPARβ/δ, whichbelongs to the nuclear receptor superfamily as a subclassof TFs. In general, gene induction by nuclear receptorsonly happens when a ligand (agonist) is present. PPARligands (agonists) change the PPARs’ structures, result-ing in modulation of receptor properties [38]. However,an agonist-independent high basal activity of PPARs hasalso been reported [39]. In addition, DNA binding of thethyroid receptor, which belongs to the nuclear receptorfamily (type II nuclear receptor), was reported to not beagonist-dependent [40]. Thus, the recruitment of nuclearreceptors is not strictly essential to agonist-dependentgene induction. PPARs are also type II nuclear receptors,and fatty acids, triglycerides, prostacyclin, and retinoicacid are known as endogenous agonists for PPARβ/δ[41]. In our results, the quantity of PPARβ/δ binding atthe ANGPTL4 locus was not changed under the fourconditions we tested (Figure 4D), confirming the notionthat PPARβ/δ binds to DNA irrespective of the presenceof its exogenous agonists. In the absence of agonists,nuclear receptors function by utilizing co-repressors,which maintain the nuclear receptors in a repressedstate, and these co-repressors are dismissed when theco-activators are recruited following agonist stimulation[25,42]. Co-activators have been reported in the case ofcertain TFs, including HIF1α [43], and the involvementof CBP/p300 was linked to histone acetylation [44]. As
Inoue et al. Genome Biology 2014, 15:R63 Page 10 of 17http://genomebiology.com/2014/15/4/R63

reported previously, PPARβ/δ-dependent transcriptionwas also linked to CBP/p300-mediated H3K27ac [25].Taken together, the generation of H3K27ac is a commonhistone modification shared by the PPARβ/δ and HIF1αsignaling cascades, and analyses of the H3K27ac distri-bution profile allowed us to trace the activity of thesetwo transcriptional regulators.We compared the ChIP-seq data for HIF1α and PPARβ/
δ with those for H3K4me3 as a marker of promoter activity[21], and H3K4me1 [22] in addition to H3K27ac [23-25] asmarkers of enhancer activity (Figure 3A,D). The potentiallyactive enhancers based upon the co-localization of bothTFs and histone modifications were validated by luciferaseassays (Figure 4). The PPAR binding region observablenear ANGPTL4 by ChIP-seq in HUVECs was consistentwith those reported previously in myofibroblasts [42]. Thefunction of the binding region as an enhancer was sup-ported by reporter assay in endothelial cells, as was re-ported previously in adipocytes [45] and myofibroblasts[46]. To confirm this, we performed more assays usingPPRE deletion constructs. The intensity of H3K27ac at thefunctional PPRE was enhanced by PPAR agonist addition,but also cross-enhanced by hypoxia (Figure 4E). H3K27acat the HRE was increased not only by hypoxia, but also bythe PPAR agonist (Figure 4F). These findings led us to thenotion that the two elements might be located in spatialproximity of one another. Since H3K27ac is acetylatedmainly by CBP/p300 [25], histone acetyltransferases mightbe recruited to both the HRE and PPRE following eachstimulus. However, there is no known mechanism to bringCBP/p300 to PPREs or vice versa after hypoxia. One ex-planation for this may be co-instantaneous chromatin con-formational change, which could bring about a closerspatial proximity of the HRE and PPRE, and this wasindeed shown to be the case by TaqMan-3C assay(Figure 5B-E). As reported previously, this can result inloop formation between the two elements [47]. Therefore,our data suggest the existence of complexes composed ofTFs and histone acetyltransferases.In yeast [48] and mammalian cells [49,50], a mediator
complex connects enhancers and core promoters throughchromatin conformational changes in combination withcohesin. Further conceptualization of the complexity oftranscription initiation postulates the existence of 'tran-scription factories' [51-53] containing a variety of compo-nents, including active Pol II, histone variants, and histonemodifiers. As was shown in the context of inflammatorystimulation, specialized factories are supposed to containappropriate TFs, in this case NF-κB [45]. Likewise, special-ized factories for hypoxia might contain HIF1α and forthe PPAR agonist might contain PPARβ/δ, which connectsfactories and enhancers. Therefore, it is plausible that theHIF1α-driven factory would come into contact with theHRE in the 5′ upstream region of the TSS and then
change chromatin conformation to bring the HRE closerto the transcribed region of ANGPTL4 (Figure 5B). Thiswould result in spatial proximity of CBP/p300 and thePPRE, causing histone acetylation of the PPRE (Figure 4E).In contrast, acetylation of the HRE upon PPARβ/δ agoniststimulation (Figure 4F) is difficult to explain unless thetranscription complex recruited to the PPRE changes thechromatin conformation such that the HRE and PPREcome into closer proximity. As shown in Figure 5B, thisspatial proximity between the HRE and PPRE was ob-served in the case of each stimulus individually or bothstimuli together using the 3C method. Considering thecross-acetylation of histone 3 lysine 27 (Figure 4E,F), thischromatin conformation change might suggest a special-ized transcription factory of HIF1α and agonist boundPPARβ/δ. Also, this conformational change might enableone enhancer to be activated by another stimulus, and thismay be the mechanism responsible for synergistic activa-tion of common target genes by two kinds of transcriptionregulators (Figure 6). Knocking down one factor (eitherPPARβ/δ or HIF1α) under the dual stimulation conditionresulted in greatly reduced interaction between the HREand PPRE, even though the other factor is still intact(Figure 5E). It could be speculated that a specializedfactory without a specific TF not only loses its functionbut also perturbs other native transcription complexes,presumably by taking over Pol II or by blocking appro-priate recruitment of another specialized factory, andthis model should be tested in the near future. Al-though the details of the components and dynamics ofPPAR-dependent factories needs to be elucidated, thesefindings might support the existence of specializedtranscription factories, as predicted.To the best of our knowledge, this is the first report of
two different TFs cooperating in transcriptional regula-tion through the conformational change of the targetgene. Nuclear receptors have the potential to crosstalkwith various other sequence-specific DNA-binding TFsat adjacent sites, resulting in a modification of gene ex-pression. The existence of crosstalk between differentTFs has already been reported, and some of the mecha-nisms have been elucidated [54]. 'Pioneer TFs' such asforkhead box A1 (FoxA1) and estrogen receptor alpha(ERα) provide an example of the interaction mechanisms[55]. The synergistic regulation of ANGPTL4 by trans-forming growth factor (TGF)β and PPARβ/δ was re-ported using a human prostatic stromal myofibroblastcell line (WPMY-1), and looping between the TGFβ re-sponse element enhancer and PPAR-response elementenhancer was in fact postulated previously, although itwas not confirmed [46]. The development of 3C tech-nology enabled us to demonstrate the conformationalproximity of the two response elements [26] under dif-ferent conditions. Our findings imply that a chromatin
Inoue et al. Genome Biology 2014, 15:R63 Page 11 of 17http://genomebiology.com/2014/15/4/R63

conformational change may underlie the synergistic geneactivation that takes place with different stimuli.
ConclusionsChromatin conformation capture and ChIP studies clearlyidentified that the mechanism of synergistic ANGPTL4 ac-tivation comprises DNA looping and histone modification.The mechanism of synergistic ANGPTL4 activation pro-vides an important clue to how different types of stimula-tion interact with each other.
Materials and methodsCell cultureCells were maintained at 37°C in a humidified 5% CO2 in-cubator. Primary culture of HUVECs was prepared andmaintained in EGM-2 MV (Lonza, Basel, Switzerland) con-taining 5% FBS. Experiments under hypoxic conditions
(1% O2) were performed in a hypoxic cultivation incubator(Juji Field Co. Ltd, Tokyo, Japan). The cells used in the ex-periments were from passage 6 or less.
Chemicals and antibodiesGW501516 (GlaxoSmithKline, London, UK) was used asa PPARβ/δ agonist at a concentration of 100 nM. Ananti-PPARβ/δ monoclonal antibody was produced in-house [56]. Mouse monoclonal IgG-Y9705 against humanPPARβ/δ was raised in our laboratory by immunizing micewith recombinant baculovirus displaying gp64-fusion pro-teins containing amino acids 2 to 41 of human PPARβ/δ.The anti-HIF1α (NB 100-134; Novus Biologicals, Littleton,CO, USA), anti-H3K4me3 (ab8580; Abcam, Cambridge,UK) antibodies and anti-ANGPTL4 (ab47046; Abcam)were purchased. The anti-H3K27ac, anti-H3K4me1 [57]and anti-panphospho Pol II antibodies were provided by
Figure 6 Schematic diagram of synergistic transcription induction mediated by spatial proximity. Upper part shows the ANGPTL4 locus,including the HRE, TSS, and PPRE. PPARβ/δ sits at the PPRE before stimulation. Left: under hypoxia, acetyltransferases approach the HRE locus byvirtue of HIF1α binding to the HRE. ANGPTL4 assumes a loop formation in order to bring the HRE closer to the PPRE. Although the PPRE is not adirect target of HIF1α, this conformation causes acetylation of the PPRE. Right: under PPAR ligand (agonist) stimulation, PPARβ/δ's location doesnot change but it is chemically modified to the active form. Presumably by virtue of a cofactor of PPAR, the PPRE comes closer to the HRE,resulting in acetylation of the HRE. Center: under dual stimulation, the HRE and PPRE move closer to each other, causing additive acetylation ofboth regions, and increased amounts of Pol II might be loaded at the TSS, possibly resulting in synergistic transcription activation and crosstalk.
Inoue et al. Genome Biology 2014, 15:R63 Page 12 of 17http://genomebiology.com/2014/15/4/R63

Dr Kimura of Osaka University (Maejima et al., PLoS Onein press). Recombinant ANGPTL4 (P01) was from Abnova(Taipei, Taiwan).
Chromatin immunoprecipitationTwo million HUVECs were plated on a 15-cm cultureplate. HUVECs were maintained in EGM-2 MV contain-ing 5% FBS and the cells were stimulated with hypoxiaand/or PPARβ/δ agonist for 24 hours. The cells werecrosslinked for 10 minutes using 1% paraformaldehyde atthe appropriate time thereafter. After neutralization using0.2 M glycine, cells were recollected, resuspended in SDSlysis buffer (10 mM Tris-HCl, 150 mM NaCl, 1% SDS,1 mM EDTA; pH 8.0) and fragmented by sonication(Branson, Danbury, CT, USA; 10 minutes). Samples werestored at -80°C before use. To perform ChIP, antibodiesagainst PPARβ/δ, H3K27ac and Pol II were used in com-bination with magnetic beads (Life Technologies/ThermoFisher Scientific, South San Francisco, CA, USA). Pre-pared DNA was quantified using Qubit (Life Technolo-gies/Thermo Fisher Scientific) and more than 10 ng ofDNA was processed, as described below. The ChIP primersequences are listed in Table S3C in Additional file 2.
ChIP-seqAll of the protocols for Illumina/Solexa sequence prep-aration, sequencing and quality control were providedby Illumina. Sequences were aligned using human gen-ome NCBI Builder 36 (UCSC hg18) as the referencegenome. Non-immunoprecipitated DNA (input DNA)was used as a negative control to define non-specificbinding. All uniquely mapped sequences were analyzedby Quantitative Enrichment of Sequence Tags (QuEST)2.4 software using the default parameters (KDE band-width = 30 bp, region size = 300 bp, ChIP seeding foldenrichment = 30, ChIP extension fold enrichment = 3,ChIP-to-background fold enrichment = 3 for PPARβ/δand HIF1α, KDE bandwidth = 60 bp, region size =600 bp, ChIP seeding fold enrichment = 30, ChIP exten-sion fold enrichment = 3, ChIP-to-background foldenrichment = 3 for Pol II, KDE bandwidth = 100 bp, re-gion size = 1000 bp, ChIP seeding fold enrichment = 30,ChIP extension fold enrichment = 3, and ChIP-to-background fold enrichment = 3 for H3K27ac, H3K4me1and H3K4me3) [20]. WIG files were generated withQuEST, which were subsequently used for visualizationpurposes and for obtaining the average signal profiles.These signals were visualized using Integrated GenomeBrowser software [58] with normalized profile wig filescalculated by QuEST.
Mapping of ChIP-seq readsAll ChIP-seq analyses were performed using a GAII(Illumina). We duplicated ChIP-seq procedures (Figure
S13). For PPARβ/δ, in total 36,607,827 and 36,864,223(normoxia-DMSO), 38,936,258 and 35,654,581 (normoxia-PPARβ/δ), 36,760,328 and 43,029,618 (hypoxia-DMSO),and 35,058,306 and 43,474,951 (hypoxia-PPARβ/δ) readswere aligned and 76.7% and 78.8% (normoxia-DMSO),77.6% and 53.7% (normoxia-PPARβ/δ), 74.0% and 79.0%(hypoxia-DMSO), and 78.8% and 79.4% (hypoxia-PPARβ/δ) of the total reads were aligned uniquely to the non-repeating human genomic sequence. For H3K27ac, out ofa total of 36,530,846 and 41,560,945 (normoxia-DMSO),37,346,766 and 44,268,585 (normoxia-PPARβ/δ), 38,316,199and 38,228,969 (hypoxia-DMSO), 36,900,687 and 41,208,985 (hypoxia-PPARβ/δ) sequence reads, 83.0% and 85.7%(normoxia-DMSO), 85.7% and 85.3% (normoxia-PPARβ/δ),85.8% and 84.2% (hypoxia-DMSO), and 84.6% and 84.8%(hypoxia-PPARβ/δ) were uniquely mapped. For Pol II,34,732,013 and 41,475,510 (normoxia-DMSO), 28,155,220and 42,030,082 (normoxia-PPARβ/δ), 31,755,951 and 43,544,244 (hypoxia-DMSO), and 31,015,638 and 41,895,797(hypoxia-PPARβ/δ) reads were totally aligned and 81.5%and 80.8% (normoxia-DMSO), 83.0% and 81.4% (nor-moxia-PPARβ/δ), 83.1% and 81.4% (hypoxia-DMSO), and83.3% and 81.5% (hypoxia-PPARβ/δ) of the total readswere aligned uniquely to the non-repeating human gen-omic sequence. Detailed information regarding HIF1α,H3K4me1, H3K4me3 was provided previously [4].
Motif searchA de novo motif search was performed using MEME(version 4.6.1) [59]. All the non-repetitive 100 bp se-quences calculated by QuEST were used and analyzed.The MEME parameters were 'distribution of motif oc-currences; any number of repetitions, minimum motifwidth; 6, maximum motif width; 30'. The Weblogo pro-gram [60] was used to indicate the motifs. The E-valueis an estimate of the expected number of motifs with thegiven log likelihood ratio for the random sequences.
Motif comparisonThe enriched sequence was compared to the knownconsensus TF motifs using TOMTOM (version 4.8.1)with the motif databases JASPAR and UniPROBE [61].The Tomtom web application compares an input DNAmotif to the elements of a database of known motifs(and their DNA reverse complements). A list of thematching motifs is shown, ranked by q-value. The q-value is the minimum false discovery rate at which theobserved similarity would be deemed significant.
DNA microarrayHUVECs maintained with EGM-2 MV containing 5%FBS were stimulated with hypoxia and/or the PPARβ/δagonist for 24 hours. Total cellular RNA was isolatedusing an RNeasy Micro kit (QIAGEN, Hilden, Germany).
Inoue et al. Genome Biology 2014, 15:R63 Page 13 of 17http://genomebiology.com/2014/15/4/R63

Preparation of the cRNA and hybridization of the probearrays were performed according to the manufacturer’s in-structions (Affymetrix, Santa Clara, CA, USA). AffymetrixGenechip Human Genome U133 plus 2.0 arrays contain-ing over 54,000 probe sets were applied. The expressionvalue for each mRNA was obtained by the robust multi-array analysis (RMA) method. To analyze the expressiondata at the genetic level, the intensity of the signal valueswas summarized using Entrez Gene ID (normalized tothe 75th percentile). Then the gene set probes were fil-tered on an expression (20.0 to 100.0) percentile. Genesexpressed at lower than the 20 percentile in all of the fourarrays were eliminated from the analyses. After excludingthe gene set probes that did not have gene symbols, theremaining 21,089 genes were used for further analysis.Hierarchical cluster analysis was performed using averagelinkage and Pearson correlation as a measure of similarity.All analysis was performed with GeneSpring GX 12.5(Agilent Technologies, Santa Clara, CA, USA). Annota-tion of the probe numbers and targeted sequences areshown on the Affymetrix web page.
Binding motif estimation in silicoMotif estimation for the binding sites of PPARβ/δ wasperformed using MatInspector, a software for identifica-tion of TF binding sites provided by Genomatix (Munich,Germany)
Luciferase reporter assayTransfections were performed with Fugene HD (Roche,Basel, Switzerland). Cells were transfected on 12-wellplates at 70 to 80% confluence in Opti-MEM (Life Tech-nologies/Thermo Fisher Scientific) with 0.5 μg of plas-mid. Cells were incubated for 24 hours in normalgrowth medium, then the stimulation was initiated. Lu-ciferase assays were performed 24 hours after stimula-tion. Luciferase activity was calibrated with the Renillaactivity. The primers for the site-directed mutagenesis ofthe HRE and PPRE motifs are shown in Table S3B inAdditional file 2.
Quantitative RT-PCRTotal cellular RNA was isolated using an RNeasy Microkit (QIAGEN). The cDNA was synthesized from 100 ngof RNA using oligo (dT) primers and the SuperscriptIII kit (Life Technologies/Thermo Fisher Scientific).qPCR was performed on a CFX96 real-time System(BioRad, Hercules, CA, USA) for 45 cycles at an anneal-ing temperature of 60°C. PCRs were carried out usingiQ SYBR Green Supermix (BioRad) and a primer con-centration of 200 nM, following the manufacturer’s in-structions. 18S rRNA was used as the normalizer. Thesequences of SYBR Green primers are listed in TableS3A in Additional file 2.
Western blottingProtein samples were separated by 10% SDS-PAGE andtransferred electrophoretically onto nitrocellulose membranes(Hybond-C; GE Healthcare UK Ltd, Buckinghamshire,England). Membranes were blocked with 5% (w/v) nonfatmilk in phosphate-buffered saline containing 0.1% Tweenfor 1 hour, incubated with antibodies for 1 hour, and de-tected by chemiluminescence using West Dura extendedduration substrate (Thermo Fisher Scientific, Waltham,MA, USA) according to the manufacturer’s protocol.
Quantitative chromosome conformation capture assayHUVECs were maintained in EGM-2 MV containing 5%FBS, then the cells were stimulated with hypoxia and/orPPARβ/δ agonist for 24 hours. The assay was performedutilizing the TaqMan 3C Chromosome ConformationKit (EcoRI; Life Technologies/Thermo Fisher Scientific)according to the manufacturer’s instructions, with cer-tain modifications. Briefly, HUVECs were crosslinkedwith 1% paraformaldehyde for 10 minutes. The reactionwas stopped by the addition of 125 mM glycine for 5 mi-nutes. Nuclei were re-suspended with restriction enzymebuffer. Samples were treated with 400 U of Sau3AI at37°C for 16 hours. After enzyme digestion, the sampleswere diluted with ligation buffer and treated with DNAligase at 16°C for 1 hour. Samples were finally reversecrosslinked and purified. All primers and TaqManprobes are shown in Table S3D in Additional file 2 andthe positions of the primers are shown in Figure 5A.We used 50 ng of DNA for the 3C assay. In addition, tonormalize template loading, an input normalizationassay in the 3C kit was used according to the reportedprotocol with some modification [62]. Two humanBAC clones (RP11-995 M24, RP11-978 J4) were used tonormalize the levels of 3C products that may have beenPCR amplified with different primer efficiencies, asmentioned previously [62,63].
Gene knockdown by siRNAEGM-2 MV used for HUVEC culture was replaced withOpti-MEM culture medium, and the cells were trans-fected with stealth RNA interference for HIF1α (LifeTechnologies/Thermo Fisher Scientific, HSS104774 andHSS104775) and PPARβ/δ (Life Technologies/ThermoFisher Scientific, HSS108293 and HSS108294) at a con-centration of 10 nM using Lipofectamine RNAiMax re-agent (Life Technologies/Thermo Fisher Scientific). After6 hours, the culture medium was changed back to EGM-2MV. After another 24 hours, cells were stimulated withhypoxia and/or the PPARβ/δ agonist. The knockdown ef-ficiencies of HIF1α and PPARβ/δ were validated by qRT-PCR (CFX96, BioRad) using the same primers describedabove (Table S3A in Additional file 2).
Inoue et al. Genome Biology 2014, 15:R63 Page 14 of 17http://genomebiology.com/2014/15/4/R63

Cell migration assayWe plated 150,000 HUVECs in a 35 mm type I collagen-coated culture plate (IWAKI, Asahi glass, Tokyo, Japan)and incubated the cells under usual conditions for 48 hours.After making a scratch in the cell monolayer using a 5 mlserological pipette, EGM-2 MV was replaced with EBM-2culture medium for Figure 1 or EGM-2 MV culturemedium for Figure S6 in Additional file 1, and then thestimulation was initiated or recombinant ANGPTL4 wasadded. The first image of the scratch was acquired at thistime. After 8 hours, an image was obtained at exactly thesame place as the first image. The images acquired for eachsample were analyzed quantitatively using the softwareImage J (NIH) and the migration areas were calculated.
Statistical analysisP-values were calculated using two-tailed unpaired Stu-dent’s t-test. P < 0.05 was considered significant.
Availability of dataData are available from the Gene Expression Omnibus[64]. The ChIP-seq datasets are available at accessionnumbers GSE38555 and GSE50144 and the microarrayanalysis is accession GSE50378.
Additional files
Additional file 1: Figure S1. Scatter plot of the genes affected byPPARβ/δ agonist or hypoxia treatment in endothelial cells. Figure S2.Classification of the hierarchical entity tree for the samples. Figure S3.Scatter plot of the genes induced by the PPARβ/δ agonist and/orhypoxia. Figure S4. Real time PCR of ANGPTL4 with primers recognizingintron-exon junctions. Figure S5. Western blotting of ANGPTL4 underthe four conditions. Figure S6. Endothelial cell migration is enhanced byANGPTL4. Figure S7. Genome-wide analysis of PPARβ/δ and/or hypoxiatarget genes. Figure S8. Efficiency of the siRNA-mediated knockdown ofPPARβ/δ and HIF1α. Figure S9. Real time PCR of ANGPTL4 with siPPARβ/δ under PPARβ/δ agonist stimulation, with siHIF1α under hypoxia, orwith siHIF1α and siPPARβ/δ under hypoxia and the PPARβ/δ agoniststimulations. Figure S10. Distribution of the H3K27ac binding regionsunder the four conditions. Figure S11. Sequence of the 3C product.Figure S12. ChIP-PCR of Pol II under the four conditions. FigureS13. ChIP-seq of PPARβ/δ, H3K27ac and Pol II in duplicate.
Additional file 2: Table S1. Common and PPARβ/δ agonist targetgenes. Table S2. Hypoxia target genes. Table S3. Primers used.
Abbreviations3C: chromatin conformation capture; ANGPTL: angiopoietin-like; ChIP: chromatinimmunoprecipitation; FBS: fetal bovine serum; HIF: hypoxia-inducible factor;HRE: hypoxia response element; HUVEC: human umbilical vein endothelialcell; PCR: polymerase chain reaction; Pol II: RNA polymerase II; PPAR: peroxisomeproliferator-activated receptor; PPRE: PPAR-response element; qRT-PCR: quantitativeRT-PCR; siRNA: small interfering RNA; TF: transcription factor; TGF: transforminggrowth factor; TSS: transcription start site; UTR: untranslated region;VEGF: vascular endothelial growth factor.
Competing interestsHirofumi Aruga, Shoulian Dong and Junko Stevens are employees of ThermoFisher Scientific, which supplied the materials for ChromosomeConformation Capture (3C) and qPCR assays. Takashi Maejima is anemployee of Kowa Company Ltd.
Authors’ contributionsTI designed the studies, carried out the molecular genetic studies, anddrafted the manuscript. TK, GL, HP, SY, ST, and XR analyzed genome-widedata. TT, YK, TF, HA, MN, YR, and TK designed the studies. IM, MK, AT, TM, JS,AS, KK, HA, SD, and JS prepared the reagents and performed the experiments.YW designed the studies and drafted the manuscript. All authors read andapproved the final manuscript.
Authors’ informationToshiya Tanaka partial correspondence for PPARβ/δ antibody.
AcknowledgmentsWe thank Dr Hiroshi Kimura of Osaka University for the H3K27ac and Pol IIantibodies, Mrs Kaori Shiina and Mrs Mai Miura of The University of Tokyo fordeep sequencing, Steve Moskowitz of Advanced Medical Graphics, Boston,USA for the illustration (Figure 6). Pacific Edit reviewed the manuscript priorto submission.
Author details1Division of Nephrology and Endocrinology, School of Medicine, TheUniversity of Tokyo, 7-3-1, Hongo, Bunkyo-ku, Tokyo 113-8655, Japan.2Research Center for Advanced Science and Technology, The University ofTokyo, 4-6-1, Komaba, Meguro-ku, Tokyo 153-8904, Japan. 3Department ofTranslational Research for Healthcare and Clinical Science, Graduate Schoolof Medicine, The University of Tokyo, 7-3-1, Hongo, Bunkyo-ku, Tokyo113-8655, Japan. 4Jackson Laboratory for Genomic Medicine, 400 FarmingtonAve, Farmington, CT 06032, USA. 5Genome Institute of Singapore, 60 BiopolisStreet, #02-01, Genome 138672, Singapore. 6Tokyo New Drug ResearchLaboratories, Kowa Company Ltd, 2-17-43, Noguchicho, Higashimurayamashi,Tokyo 189-0022, Japan. 7Thermo Fisher Scientific, 180 Oyster Point Boulevard,South San Francisco, CA 94080, USA. 8Radioisotope Center, The University ofTokyo, 2-11-16, Yayoi, Bunkyo-ku, Tokyo 113-0032, Japan.
Received: 12 November 2013 Accepted: 10 April 2014Published: 10 April 2014
References1. Weis SM, Cheresh DA: Tumor angiogenesis: molecular pathways and
therapeutic targets. Nat Med 2011, 17:1359–1370.2. Potente M, Gerhardt H, Carmeliet P: Basic and therapeutic aspects of
angiogenesis. Cell 2011, 146:873–887.3. Majmundar AJ, Wong WJ, Simon MC: Hypoxia-inducible factors and the
response to hypoxic stress. Mol Cell 2010, 40:294–309.4. Mimura I, Nangaku M, Kanki Y, Tsutsumi S, Inoue T, Kohro T, Yamamoto S,
Fujita T, Shimamura T, Suehiro J, Taguchi A, Kobayashi M, Tanimura K,Inagaki T, Tanaka T, Hamakubo T, Sakai J, Aburatani H, Kodama T, Wada Y:Dynamic change of chromatin conformation in response to hypoxiaenhances the expression of GLUT3 (SLC2A3) by cooperativeinteraction of hypoxia-inducible factor 1 and KDM3A. Mol Cell Biol 2012,32:3018–3032.
5. Fraisl P, Mazzone M, Schmidt T, Carmeliet P: Regulation of angiogenesis byoxygen and metabolism. Dev Cell 2009, 16:167–179.
6. Beenken A, Mohammadi M: The FGF family: biology, pathophysiology andtherapy. Nat Rev Drug Discov 2009, 8:235–253.
7. Augustin HG, Koh GY, Thurston G, Alitalo K: Control of vascularmorphogenesis and homeostasis through the angiopoietin-Tie system.Nat Rev Mol Cell Biol 2009, 10:165–177.
8. Piqueras L, Reynolds AR, Hodivala-Dilke KM, Alfranca A, Redondo JM, HataeT, Tanabe T, Warner TD, Bishop-Bailey D: Activation of PPARbeta/deltainduces endothelial cell proliferation and angiogenesis. ArteriosclerThromb Vasc Biol 2007, 27:63–69.
9. Stephen RL, Gustafsson MC, Jarvis M, Tatoud R, Marshall BR, Knight D,Ehrenborg E, Harris AL, Wolf CR, Palmer CN: Activation of peroxisomeproliferator-activated receptor delta stimulates the proliferation ofhuman breast and prostate cancer cell lines. Cancer Res 2004,64:3162–3170.
10. Lee CH, Olson P, Evans RM: Minireview: lipid metabolism, metabolicdiseases, and peroxisome proliferator-activated receptors. Endocrinology2003, 144:2201–2207.
Inoue et al. Genome Biology 2014, 15:R63 Page 15 of 17http://genomebiology.com/2014/15/4/R63

11. Barak Y, Nelson MC, Ong ES, Jones YZ, Ruiz-Lozano P, Chien KR, Koder A,Evans RM: PPAR gamma is required for placental, cardiac, and adiposetissue development. Mol Cell 1999, 4:585–595.
12. Wagner KD, Benchetrit M, Bianchini L, Michiels JF, Wagner N: Peroxisomeproliferator-activated receptor beta/delta (PPARbeta/delta) is highlyexpressed in liposarcoma and promotes migration and proliferation.J Pathol 2011, 224:575–588.
13. Duan SZ, Usher MG, Mortensen RM: PPARs: the vasculature, inflammationand hypertension. Curr Opin Nephrol Hypertens 2009, 18:128–133.
14. Tanaka T, Yamamoto J, Iwasaki S, Asaba H, Hamura H, Ikeda Y, Watanabe M,Magoori K, Ioka RX, Tachibana K, Watanabe Y, Uchiyama Y, Sumi K, Iguchi H,Ito S, Doi T, Hamakubo T, Naito M, Auwerx J, Yanagisawa M, Kodama T,Sakai J: Activation of peroxisome proliferator-activated receptor deltainduces fatty acid beta-oxidation in skeletal muscle and attenuatesmetabolic syndrome. Proc Natl Acad Sci U S A 2003, 100:15924–15929.
15. Gaudel C, Schwartz C, Giordano C, Abumrad NA, Grimaldi PA: Pharmacologicalactivation of PPARbeta promotes rapid and calcineurin-dependent fiberremodeling and angiogenesis in mouse skeletal muscle. Am J PhysiolEndocrinol Metab 2008, 295:E297–E304.
16. Abdollahi A, Schwager C, Kleeff J, Esposito I, Domhan S, Peschke P, HauserK, Hahnfeldt P, Hlatky L, Debus J, Peters JM, Friess H, Folkman J, Huber PE:Transcriptional network governing the angiogenic switch in humanpancreatic cancer. Proc Natl Acad Sci U S A 2007, 104:12890–12895.
17. Wang N: PPAR-delta in vascular pathophysiology. PPAR Res 2008, 2008:164163.18. Panne D, Maniatis T, Harrison SC: An atomic model of the interferon-beta
enhanceosome. Cell 2007, 129:1111–1123.19. Neerincx A, Rodriguez GM, Steimle V, Kufer TA: NLRC5 controls basal MHC
class I gene expression in an MHC enhanceosome-dependent manner.J Immunol 2012, 188:4940–4950.
20. Valouev A, Johnson DS, Sundquist A, Medina C, Anton E, Batzoglou S, MyersRM, Sidow A: Genome-wide analysis of transcription factor binding sitesbased on ChIP-Seq data. Nat Methods 2008, 5:829–834.
21. Barski A, Cuddapah S, Cui K, Roh TY, Schones DE, Wang Z, Wei G, ChepelevI, Zhao K: High-resolution profiling of histone methylations in the humangenome. Cell 2007, 129:823–837.
22. Kim TK, Hemberg M, Gray JM, Costa AM, Bear DM, Wu J, Harmin DA,Laptewicz M, Barbara-Haley K, Kuersten S, Markenscoff-Papadimitriou E, KuhlD, Bito H, Worley PF, Kreiman G, Greenberg ME: Widespread transcriptionat neuronal activity-regulated enhancers. Nature 2010, 465:182–187.
23. Creyghton MP, Cheng AW, Welstead GG, Kooistra T, Carey BW, Steine EJ,Hanna J, Lodato MA, Frampton GM, Sharp PA, Boyer LA, Young RA,Jaenisch R: Histone H3K27ac separates active from poised enhancersand predicts developmental state. Proc Natl Acad Sci U S A 2010,107:21931–21936.
24. Heintzman ND, Stuart RK, Hon G, Fu Y, Ching CW, Hawkins RD, Barrera LO,Van Calcar S, Qu C, Ching KA, Wang W, Weng Z, Green RD, Crawford GE,Ren B: Distinct and predictive chromatin signatures of transcriptionalpromoters and enhancers in the human genome. Nat Genet 2007,39:311–318.
25. Jin Q, Yu LR, Wang L, Zhang Z, Kasper LH, Lee JE, Wang C, Brindle PK,Dent SY, Ge K: Distinct roles of GCN5/PCAF-mediated H3K9ac and CBP/p300-mediated H3K18/27 ac in nuclear receptor transactivation. EMBO J2011, 30:249–262.
26. de Wit E, de Laat W: A decade of 3C technologies: insights into nuclearorganization. Genes Dev 2012, 26:11–24.
27. Kanki Y, Kohro T, Jiang S, Tsutsumi S, Mimura I, Suehiro J, Wada Y, Ohta Y,Ihara S, Iwanari H, Naito M, Hamakubo T, Aburatani H, Kodama T, MinamiT: Epigenetically coordinated GATA2 binding is necessary forendothelium-specific endomucin expression. EMBO J 2011,30:2582–2595.
28. Kadomatsu T, Tabata M, Oike Y: Angiopoietin-like proteins: emergingtargets for treatment of obesity and related metabolic diseases. FEBS J2011, 278:559–564.
29. Belanger AJ, Lu H, Date T, Liu LX, Vincent KA, Akita GY, Cheng SH, Gregory RJ,Jiang C: Hypoxia up-regulates expression of peroxisome proliferator-activatedreceptor gamma angiopoietin-related gene (PGAR) in cardiomyocytes: role ofhypoxia inducible factor 1alpha. J Mol Cell Cardiol 2002, 34:765–774.
30. Le Jan S, Amy C, Cazes A, Monnot C, Lamande N, Favier J, Philippe J, Sibony M,Gasc JM, Corvol P, Germain S: Angiopoietin-like 4 is a proangiogenic factorproduced during ischemia and in conventional renal cell carcinoma. Am JPathol 2003, 162:1521–1528.
31. Sukonina V, Lookene A, Olivecrona T, Olivecrona G: Angiopoietin-likeprotein 4 converts lipoprotein lipase to inactive monomers andmodulates lipase activity in adipose tissue. Proc Natl Acad Sci U S A 2006,103:17450–17455.
32. Cazes A, Galaup A, Chomel C, Bignon M, Brechot N, Le Jan S, Weber H,Corvol P, Muller L, Germain S, Monnot C: Extracellular matrix-boundAngiopoietin-like 4 inhibits endothelial cell adhesion, migration, andsprouting and alters actin cytoskeleton. Circ Res 2006,99:1207–1215.
33. Huang RL, Teo Z, Chong HC, Zhu P, Tan MJ, Tan CK, Lam CR, Sng MK,Leong DT, Tan SM, Kersten S, Ding JL, Li HY, Tan NS: ANGPTL4modulates vascular junction integrity by integrin signaling anddisruption of intercellular VE-cadherin and claudin-5 clusters. Blood2011, 118:3990–4002.
34. Perdiguero EG, Galaup A, Durand M, Teillon J, Philippe J, Valenzuela DM,Murphy AJ, Yancopoulos GD, Thurston G, Germain S: Alteration ofdevelopmental and pathological retinal angiogenesis in angptl4-deficientmice. J Biol Chem 2011, 286:36841–36851.
35. Galaup A, Gomez E, Souktani R, Durand M, Cazes A, Monnot C, Teillon J, LeJan S, Bouleti C, Briois G, Philippe J, Pons S, Martin V, Assaly R, Bonnin P,Ratajczak P, Janin A, Thurston G, Valenzuela DM, Murphy AJ, YancopoulosGD, Tissier R, Berdeaux A, Ghaleh B, Germain S: Protection againstmyocardial infarction and no-reflow through preservation of vascularintegrity by angiopoietin-like 4. Circulation 2012, 125:140–149.
36. Zheng J, Umikawa M, Cui C, Li J, Chen X, Zhang C, Hyunh H, Kang X,Silvany R, Wan X, Ye J, Canto AP, Chen SH, Wang HY, Ward ES, Zhang CC:Inhibitory receptors bind ANGPTLs and support blood stem cells andleukaemia development. Nature 2012, 485:656–660.
37. Adhikary T, Brandt DT, Kaddatz K, Stockert J, Naruhn S, Meissner W,Finkernagel F, Obert J, Lieber S, Scharfe M, Jarek M, Toth PM, Scheer F,Diederich WE, Reinartz S, Grosse R, Muller-Brusselbach S, Muller R: InversePPARbeta/delta agonists suppress oncogenic signaling to theANGPTL4 gene and inhibit cancer cell invasion. Oncogene 2012,32:5241–5252.
38. Chandra V, Huang P, Hamuro Y, Raghuram S, Wang Y, Burris TP, RastinejadF: Structure of the intact PPAR-gamma-RXR- nuclear receptor complexon DNA. Nature 2008, 456:350–356.
39. Molnar F, Matilainen M, Carlberg C: Structural determinants of the agonist-independent association of human peroxisome proliferator-activatedreceptors with coactivators. J Biol Chem 2005,280:26543–26556.
40. Flamant F, Baxter JD, Forrest D, Refetoff S, Samuels H, Scanlan TS,Vennstrom B, Samarut J: International Union of Pharmacology. LIX. Thepharmacology and classification of the nuclear receptor superfamily:thyroid hormone receptors. Pharmacol Rev 2006, 58:705–711.
41. Wagner KD, Wagner N: Peroxisome proliferator-activated receptor beta/delta (PPARbeta/delta) acts as regulator of metabolism linked to multiplecellular functions. Pharmacol Ther 2010, 125:423–435.
42. Adhikary T, Kaddatz K, Finkernagel F, Schonbauer A, Meissner W, Scharfe M,Jarek M, Blocker H, Muller-Brusselbach S, Muller R: Genomewide analysesdefine different modes of transcriptional regulation by peroxisomeproliferator-activated receptor-beta/delta (PPARbeta/delta). PLoS One2011, 6:e16344.
43. Semenza GL: Hypoxia-inducible factors in physiology and medicine.Cell 2012, 148:399–408.
44. Kasper LH, Lerach S, Wang J, Wu S, Jeevan T, Brindle PK: CBP/p300 doublenull cells reveal effect of coactivator level and diversity on CREBtransactivation. EMBO J 2010, 29:3660–3672.
45. Mandard S, Zandbergen F, Tan NS, Escher P, Patsouris D, Koenig W,Kleemann R, Bakker A, Veenman F, Wahli W, Muller M, Kersten S: The directperoxisome proliferator-activated receptor target fasting-inducedadipose factor (FIAF/PGAR/ANGPTL4) is present in blood plasma as atruncated protein that is increased by fenofibrate treatment. J Biol Chem2004, 279:34411–34420.
46. Kaddatz K, Adhikary T, Finkernagel F, Meissner W, Muller-Brusselbach S,Muller R: Transcriptional profiling identifies functional interactions of TGFbeta and PPAR beta/delta signaling: synergistic induction of ANGPTL4transcription. J Biol Chem 2010, 285:29469–29479.
47. Wang Q, Carroll JS, Brown M: Spatial and temporal recruitment ofandrogen receptor and its coactivators involves chromosomal loopingand polymerase tracking. Mol Cell 2005, 19:631–642.
Inoue et al. Genome Biology 2014, 15:R63 Page 16 of 17http://genomebiology.com/2014/15/4/R63

48. Ansari SA, He Q, Morse RH: Mediator complex association withconstitutively transcribed genes in yeast. Proc Natl Acad Sci U S A 2009,106:16734–16739.
49. D'Alessio JA, Wright KJ, Tjian R: Shifting players and paradigms incell-specific transcription. Mol Cell 2009, 36:924–931.
50. Kagey MH, Newman JJ, Bilodeau S, Zhan Y, Orlando DA, van Berkum NL,Ebmeier CC, Goossens J, Rahl PB, Levine SS, Taatjes DJ, Dekker J, Young RA:Mediator and cohesin connect gene expression and chromatinarchitecture. Nature 2010, 467:430–435.
51. Deng B, Melnik S, Cook PR: Transcription factories, chromatin loops, andthe dysregulation of gene expression in malignancy. Semin Cancer Biol2012, 23:65–71.
52. Papantonis A, Kohro T, Baboo S, Larkin JD, Deng B, Short P, Tsutsumi S,Taylor S, Kanki Y, Kobayashi M, Li G, Poh HM, Ruan X, Aburatani H, Ruan Y,Kodama T, Wada Y, Cook PR: TNFalpha signals through specializedfactories where responsive coding and miRNA genes are transcribed.EMBO J 2012, 31:4404–4414.
53. Papantonis A, Cook PR: Fixing the model for transcription: the DNAmoves, not the polymerase. Transcription 2011, 2:41–44.
54. Cheung E, Kraus WL: Genomic analyses of hormone signaling and generegulation. Annu Rev Physiol 2010, 72:191–218.
55. Carroll JS, Liu XS, Brodsky AS, Li W, Meyer CA, Szary AJ, Eeckhoute J, ShaoW, Hestermann EV, Geistlinger TR, Fox EA, Silver PA, Brown M:Chromosome-wide mapping of estrogen receptor binding revealslong-range regulation requiring the forkhead protein FoxA1. Cell 2005,122:33–43.
56. Tanaka T, Takeno T, Watanabe Y, Uchiyama Y, Murakami T, Yamashita H,Suzuki A, Aoi R, Iwanari H, Jiang SY, Naito M, Tachibana K, Doi T, ShulmanAI, Mangelsdorf DJ, Reiter R, Auwerx J, Hamakubo T, Kodama T: Thegeneration of monoclonal antibodies against human peroxisomeproliferator-activated receptors (PPARs). J Atheroscler Thromb 2002,9:233–242.
57. Kimura H, Hayashi-Takanaka Y, Goto Y, Takizawa N, Nozaki N: Theorganization of histone H3 modifications as revealed by a panel ofspecific monoclonal antibodies. Cell Struct Funct 2008, 33:61–73.
58. Integrated Genome Browser. [http://bioviz.org/igb/]59. Bailey TL, Williams N, Misleh C, Li WW: MEME: discovering and analyzing
DNA and protein sequence motifs. Nucleic Acids Res 2006, 34:W369–W373.60. Weblogo. [http://weblogo.berkeley.edu]61. Gupta S, Stamatoyannopoulos JA, Bailey TL, Noble WS: Quantifying
similarity between motifs. Genome Biol 2007, 8:R24.62. El Kaderi B, Medler S, Ansari A: Analysis of interactions between genomic
loci through Chromosome Conformation Capture (3C). Curr Protoc CellBiol 2012, Chapter 22:Unit22 15.
63. Hagege H, Klous P, Braem C, Splinter E, Dekker J, Cathala G, de Laat W,Forne T: Quantitative analysis of chromosome conformation captureassays (3C-qPCR). Nat Protoc 2007, 2:1722–1733.
64. The NCBI Gene Expression Omnibus. [http://www.ncbi.nlm.nih.gov/geo/]
doi:10.1186/gb-2014-15-4-r63Cite this article as: Inoue et al.: Cross-enhancement of ANGPTL4transcription by HIF1 alpha and PPAR beta/delta is the result of theconformational proximity of two response elements. Genome Biology2014 15:R63.
Submit your next manuscript to BioMed Centraland take full advantage of:
• Convenient online submission
• Thorough peer review
• No space constraints or color figure charges
• Immediate publication on acceptance
• Inclusion in PubMed, CAS, Scopus and Google Scholar
• Research which is freely available for redistribution
Submit your manuscript at www.biomedcentral.com/submit
Inoue et al. Genome Biology 2014, 15:R63 Page 17 of 17http://genomebiology.com/2014/15/4/R63