cross sectional survey on factors contributing to …
TRANSCRIPT
i
CROSS SECTIONAL SURVEY ON FACTORS CONTRIBUTING TO HOME
DELIVERIES IN RUNGWE DISTRICT, TANZANIA.
AUTHOR’S NAME: DR. ALLY SADIKI UREDI, MD (Havana- Cuba).
DEPARTMENT/SCHOOL: SCHOOL OF PUBLIC HEALTH, UNIVERSITY
OF THE WESTERN CAPE.
DEGREE: MASTERS IN PUBLIC HEALTH
SUPERVISOR: Prof. DEBRA JACKSON, RNC (Florida State),
MPH (San Diego State), DSc (Boston).
NOVEMBER 2009.
KEY WORDS:
Tanzania, Multiparous, Home delivery, Health facility delivery, Health services,
Access to health services, Socio-economic factors, Cultural factors, Knowledge
factors, Traditional birth attendants (TBAs).

ii
ACKNOWLEDGEMENT.
The successful compilation of this research proposal was made possible by the joint
efforts of a number of individuals that I would like to acknowledge with sincere
gratitude for their very assistance.
I would like to thank my supervisor Prof. Debora Jackson; Dr. Seif J. Uledi, of Mbeya
referral Hospital; Dr. Federick Mongi, (Obs. & Gyn. Specialist) from Medical
assistance Training centre Mbeya; Mr. Mwandepa and Mr. Meleck, the regional
health officers from Mbeya regional hospital, and Mrs. Kipitu from City Council
Mbeya. Dr. Sungwa Ndagabwene, the Rungwe District medical officer. The late Dr.
Simon Mshana of Iringa Institute of primary health care (PHC); and the late Dr.
Uwiso from Rungwe District,
DECLARATION:
I understand what plagiarism is. This Thesis is my own work, and all sources of
information have been acknowledged. I have taken care to cite/reference all sources as
set out in the SOPH Academic Handbook.

iii
TABLE OF CONTENTS
PAGE
i TITLE----------------------------------------------------------------- i
ii TABLE OF CONTENT-------------------------------------------- ii
iii ACKNOWLEDGEMENT iii
iv ABBREVIATION------------------------------------------------------ Iii
v ABSTRACT------------------------------------------------------------- iv
1 CHAPTER ONE 1
1.1.0 INTRODUCTION------------------------------------------------------ 1
1.1.1 PROBLEM STATEMENT------------------------------------------- 7-8
1.1.2 RATIONALE OF THE STUDY ------------------------------------ 8
2 CHAPTER TWO 9
2. LITERATURE REVIEW-------------------------------------------- 9
2.1 HOME DELIVERY IN DEVELOPING WORLD 9
2.2 MANY WOMEN LACK MATERNAL HEALTH CARE 9
2.3 WHY WOMEN DO NOT USE AVAILABLE SERVICES 10-18
2.4 PROGRAMMES TO ADRESS HOME DELIVERY 18-20
2.5 ANC AND HOME DELIVERY IN TANZANIA 20-22
2.6 MAIN AIM AND OBJECTIVE OF THE STUDY-------------- 23
2.6.1 STUDY AIM 23
2.6.2 RESEARCH QUESTIONS ------------------------------------------ 23
2.6.3 SPECIFIC OBJECTIVES ------------------------------------------- 23
3 CHAPTER THREE 24
3 METHODOLOGY 24

iv
3.1. STUDY SETTING 24
3.2 STUDY DESIGN ----------------------------------------------------- 25
3.3 STUDY (TARGET) POPULATION ------------------------------ 26
3.4 SELECTION CRITERIA FOR STUDY POPULATION 26
3.5 SAMPLE SIZE--------------------------------------------------------- 27
3.5 SAMPLING PROCEDURE------------------------------------------ 27
3.6 SAMPLING FRAME-------------------------------------------------- 28
3.7 QUESTIONNAIRES------------------------------------------------- 30
3.8 PILOT TESTING ----------------------------------------------------- 30
3.9 DATA COLLECTION----------------------------------------------- 30
3.10 VALIDITY AND RELIABILITY----------------------------------- 30
3.11 ANALYSIS AND PRESENTATION OF DATA---------------- 31
3.12 DISSEMINATION OF INFORMATION------------------------ 32
3.13 ETHICAL CLEARANCE 32-34
4 CHAPTER FOUR 35
4. RESULTS 35
4.1 DESCRIPTION OF SAMPLE 35-82
5 CHAPTER FIVE 84
5.1 DISCUSSION 84-93
5.2 STUDY LIMITATION---------------------------------------------- 93-94
5.3 CONCLUSION 95
5.4 RECOMMENDATION 96-103
6. REFFERENCES-------------------------------------------------------- 104-11
7 APPENDICES 112-17
8 QUESTIONNAIRE 118-130

v
ABBREVIATIONS
ANC ANTE NATAL CARE.
DMO DISTRICT MEDICAL OFFICER.
EOC EMERGENCY OBSTETRIC CARE
FGD FOCUS GROUP DISCUSION
MDGs MILLENNIUM DEVELOPMENT GOALS.
MMAM MPANGO WA MAENDELEO WA AFYA YA MSINGI (Swahlihi
version of PHSDP)
PHSDP PRIMARY HEALTH SERVICE DEVELOPMENT PROGRAMME
RAWG RESEARCH AND ANALYSIS WORKING GROUP
RMO REGIONAL MEDICAL OFFICER
TBAs TRADITIONAL BIRTH ATTENDANTS
TDHS TANZANIA DEMOGRAPHIC HEALTH SURVEY.
UNPF UNITED NATIONS POPULATION FUND.
WHO WORLD HEALTH ORGANIZATION.

vi
ABSTRACT
This is a cross sectional survey study that explored determinant factors contributing to
home child delivery and influence of traditional birth attendances on place of delivery
in Rungwe District, Tanzania.The study focussed on three main aspects namely
factors (socio-economic, cultural and knowledge) that influence women to deliver at
health facilities and those who deliver ta home. Reasons/factors associated with the
acceptability of health services and influence of traditional birth attendaces on place
of delivery and whether accessibility to health services and traditional birth attendants
influence women to decide the place of delivery.
The study was descriptive cross-sectional in nature where a multistage random
sampling procedure was used to select 8 wards and 16 villages. A systematic
sampling was used to determine household interval in each village. Only one woman
with at least one child was chosen in a household using a random sampling. In case of
the absence of a woman with at least one child in a house falling in the interval, then
the next house was considered. A total of 400 women with at least one child were
selected at random from household cluster sample from all four divisions in Rungwe
district. They were interviewed using semi-structured questionnaire. The participation
rate was 100 % in both divisions. The age of the women ranged from 19-49 years with
the mean age of 31 years (Std dev 7.5).
Data entry and analysis were done using the quantitative statistics with Epi Info 2002
software. Results were presented using descriptive statistics, figures and tables, and
analytical statistics, using Student’s t-test and chi-square.
vii
A total of 400 women were interviewed, among them, it showed that there were good
attendance for antenatal care 395 (98.75%) and only 5 (1.25%) did not attend
antenatal care. However, 243 (60.8%) of women interviewed had incidence of home
delivery and 157 (39.3%) had incidence of health facility delivery.
Home deliveries in a surveyed area are commonly assisted by unskilled persons, and
consequently carry increased risks to the mother and to the new-born baby.
Improvement of quality and accessibility of health care services by the health facility
should involve harmonic balance between health service provider and beneficiaries in
order to change the attitude towards minimizing the practice of home child delivery in
Rungwe district, in Mbeya region, in Tanzania as awhole and elsewhere in the world.
.
KEY WORDS:
Tanzania, Multiparous, Home delivery, Health facility delivery, Health services,
Access to health services, Socio-economic factors, Cultural factors, Knowledge
factors, Traditional birth attendants (TBAs).
viii
THESIS OUTLINE
BACKGROUND.
Various factors compel women to deliver at home, threatening their lives and that of
their newborn babies. Studies show that health facilities in Africa are often inadequate
and far apart. Pregnant women travel long distances to access such facilities where
available. Facilities are often ill-equipped and manned by semi-skilled attendants who
sometimes exhibit unprofessional conduct. Unaffordable costs of items that pregnant
women must bring with them at the time of delivery, and traditional beliefs are also
barriers to health facility delivery.
In Tanzania, women are encouraged to deliver in health facilities; however, the trend
of home deliveries is still on the increase.
OBJECTIVE:
This cross sectional survey study aims to determine factors that contribute to home
delivery and influence of traditional birth attendances on place of delivery in Rungwe
district in Tanzania.
Specifically, the study objectives were:
• To examine the factors (socio-economic, cultural and knowledge) that
influence women to deliver at health facilities and those who deliver at home.
• To assess whether the level of acceptability of the health services and
Traditional Birth attendant influence women’s choice on the place of delivery.
• To establish whether accessibility to health services and Traditional Birth
attendant influence women to decide the place of delivery.

ix
SETTING:
The study was conducted in Rungwe District –Mbeya Region of Tanzania.
METHODS:
The study was descriptive cross-sectional in nature. All the four divisions of the
district were chosen for the research related to the four research objectives. The four
divisions belong to Rungwe district in Mbeya region – Tanzania. Diverse
socioeconomic situations are represented in all four divisions. Multistage random
sampling procedure was used to select 8 wards and 16 villages. A systematic
sampling was used to determine household interval in each village. Only one woman
with at least one child was chosen in a household using a random sampling. In case of
the absence of a woman with at least one child in a house falling in the interval, then
the next house was considered. A total of 400 women with at least one child were
selected at random from household cluster sample from all four divisions in Rungwe
district. They were interviewed using semi-structured questionnaire. The participation
rate was 100 % in both divisions. The age of the women ranged from 19-49 years with
the mean age of 31 years (Std dev 7.5).
DATA COLLECTION, ANALYSIS AND PRESENTATION.
Data were collected using questionnaires. Data entry and analysis were done using the
quantitative statistics with Epi Info 2002 software. Results were presented using
descriptive statistics, figures and tables, and analytical statistics, using Student’s t-test
and chi-square. Recommendations are based on the findings of the study.

x
RESULTS:
In comparing the results across various sources of data in this study, similar and
different facts came into view. A total of 400 women were interviewed, among them,
it showed that there were good attendance for antenatal care 395 (98.75%) and only 5
(1.25%) did not attend antenatal care. However, 243 (60.8%) of women interviewed
had incidence of home delivery and 157 (39.3%) had incidence of health facility
delivery. Various socioeconomic and knowledge factors influenced the women’s
choice for place of delivery. Among the reasons that compel women to deliver at
home were:
• Long distance to health facility (28.5%)
• Labour started suddenly (12.5%)
• Decision made by family (9.2%)
• Lack of money and transport (4.8%)
• Traditional birth attendants were nearer and conducted normal delivery
services as well as nurses and they liked them and they were less expensive
(3.5%)
• Nurses were uncooperative/offered unfriendly delivery services (0.2%)
• There were not medicines at health facilities (0.5%)
• They feared to be operated (0.2%)
• High cost for delivery services at health facilities.
• Family member’s support.
Among reasons that influenced women to deliver at health facilities were:
• Good delivery service (58.4%)
• Short distance to health facilities (3.0%)
xi
• Home delivery is poor/dangerous and unsafe (35.2%)
Among reasons that influenced the women to attend antenatal care clinics were:
• To know the progress of their pregnancies (77.0%).
• Short distance to clinics (38.9%).
• Family support (37.6%).
• To get advice/counseling/health education concerning their pregnancies
(8.6%).
• To get treatment (7.8%).
• Easier in transport (7.6%).
• Fear from being neglected or chased by nurses at the time of delivery/labour
(6.6).
Among the reasons/barriers for not going to antenatal care clinics
• To minimize frequency for attending antenatal care clinics (38.0%).
• They did not know that they were pregnant until they started to feel foetal
movement (34.7%).
• Lack of transport (19.38%).
• Lack of money (16.46%).
• Long distance to clinics (14.1%).
• Bad treatment of health staffs (5.0%).
RECOMMENDATIONS/CONCLUSIONS
The findings from this thesis indicate that home deliveries are commonly assisted by
unskilled persons, and consequently carry increased risks to the mother and to the
new-born baby. Improvement of quality and accessibility of health care services by
the health facility should involve harmonic balance between health service provider

xii
and beneficiaries in order to change the attitude towards minimizing the practice of
home child delivery in Rungwe district, in Mbeya region, in Tanzania as awhole and
elsewhere in the world.

1
CHAPTER 1. Introduction
1.1 Background
Globally, delivery of women at home continues to be a major problem in developing
countries. Ackermann-Liebrich U, Vogeli T, Gunter-Witt K (1996), Sorensen et al
(2000), W Wagle RR, Sabroe S & Nielsen BB (2004) agle RR, Sabroe S & Nielsen
BB (2004) & Walraven et al (1995) found that although the debate about safety and
women’s right to choose between home or hospital delivery continues in the
developed world, an undesirable outcome of home delivery has been documented in
developing countries. Also, United Nations Population Fund (1999) points out that
women in the developing world are more likely to deliver at home than in medical
facilities. The range across countries is wide, from 10% or fewer in Bangladesh,
Cambodia, and Nepal to 62% in Vietnam. In sub-Saharan Africa, an estimated 40-
50% of women deliver at home. Home deliveries place women and newborns at risk.
Ganer P., Lai D & Baea M (1994) reported a high rate of obstetric complications
among apparently normal pregnancies delivering at home in Papua New Guinea.
According to National Bureau of Statistics & Macro International Inc (2005) and
Tanzania Demographic and Health Survey (2004-2005), in Tanzania it is estimated
that 53% of women deliver away from health facilities despite high coverage of
antenatal care (ANC) which is estimated to be 94%, and only 47% of birth occurs at
health facilities. In addition, of all deliveries occurring in health facilities, only 46%
were attended by skilled attendants. Walraven et al (1995) documented that home
birth without a trained attendant resulted in a three times higher perinatal mortality
than those in a health facility with trained attendants in rural Tanzania.

2
According to Primary Health Services development Programme PHSDP – MMAM
2007-2017 (May, 2007) generally the quality of health services in Tanzania, despite
remarkable improvement over the years of health sector reforms in the early 1990s, is
still unsatisfactory. The performance of the health sector has been negatively affected
by limited resources which have led to an unsatisfactory quality of health care
provision at all levels.
Under funding of the health sector has undermined the health infrastructure across the
country. The inputs to the sector in terms of equipment, supplies, transport and
communication remain insufficient.
As regards maternal health, data from the Tanzania Demographic and Health Survey
(TDHS) (2004-2005) show that pregnancy related mortality has not improved over the
last two decades. The maternal mortality ratio for the period 1995 to 2004 was 578
deaths per 100,000 lives births, not significantly different from the 1987 to 1996 ratio
of 529 per 100,000 live births. Also the data show that for the 1990s there were steady
declines of births taking place in a health facility, the decline was from 53% in 1991,
to 44% in 1999, with a slight improvement thereafter. By 2004, facility-based
deliveries had reverted to 1996 levels of 47%. Over 80% of the maternal deaths are
due to direct causes that include obstetric, haemorrhage, obstructed labour, pregnancy
induced hypertension, sepsis and abortion complications.
The majority of maternal deaths can be prevented if pregnant women can be assured
improved maternal health care such as of access to quality health care with skilled
attendant at childbirth and especially to emergency obstetric care services when
pregnancy related complications arise.
Major barriers to access delivery health services include long distance to a health
facility, lack of transport and unfriendly services. The high rates of home deliveries

3
are also attributed to poor geographical access to health facility, lack of a functioning
referral system, inadequate capacity at health facilities in terms of space, skilled
attendants, equipment and other socio-cultural aspects surrounding the pregnant
women. Additional factors include gender inequalities in decision-making and access
to resources at household level. (PHSDP – MMAM 2007-2017 May, 2007)
Furthermore, the referral system has serious challenges including limited number of
ambulances; unreliable logistics and communication system; and low community
based facilitated referral system. ACCESS (2004) explained that access to essential
referral care is perhaps the single most prominent barrier the health care for the poor;
in addition to direct health care costs, those associated with transport and subsistence
are prohibitive.
Primary Health Services Development Programme PHSDP – MMAM 2007-2017
(May, 2007) explains that in Tanzania currently there are 2,555 wards and 10,342
villages. Also, there are health facilities for both public and private which include
4,679 dispensaries, 481 health centres, and 219 hospitals distributed throughout the
country.
The dispensaries and health centres that are at a centre of primary health care facilities
were planned to serve an average population of 10,000 and 50,000 respectively.
However, there are 5,162 villages without dispensaries.
This is simply because of the increasing population and slow pace/stagnation of
construction of primary health facilities. The average population served by each
dispensary and health centre is more than the planned population, overstretching the
effective functioning of the current primary health care facilities. Also the problem is
compounded with shortage of staff, inadequate medical equipment and other supplies.

4
The geographic accessibility of the current primary health facilities is reported to be at
about 90% of people living within five kilometres. Nevertheless, there is great
variation among districts. Besides, land terrain and lack of reliable transport poses a
great danger to expecting mothers and very sick patients needing access health
services. These factors influence accessibility of primary health services PHSDP –
MMAM 2007-2017 (May, 2007)
On regard to health workers, Mliga, Mwakilasa & Mwakalukwa (2005) point out that
the most pressing problems facing the health system in Tanzania are a lack of health
personnel, sufficiently trained and appropriately deployed, and poor health worker
performance.
Also, a case study done by Kurowski et al (2003) showed that the total number of
active health workers in 2001/02 was estimated at 54,200, with unskilled workers
forming the largest group (31%), followed by the professional group of nurses and
midwives (24%). Between 1994/5 and 2001/02, the number of active health workers
per 100,000 population decreased by 35% from observed 294.4 to an estimated 162.1
per 100,000 populations. Shortage of health staff is even more acute when
differentiated by cadres, with significant deficits among skilled health professionals.
The estimated ratios of currently active professionals per 100,000 populations are 38.9
for nurses, 2.5 for physicians and 25.3 for other medical cadres (i.e. medical officers,
assistant medical officers and clinical officers). Kurowski et al (2003) continue to
explain that deployment of available health workers is highly imbalanced. Overall,
65% of the 54,200 health workers in 2002 were located in public sector, 22% in
private not-for-profit and 14% in private-for-profit. Roughly 84% of health workers,
mainly constituting low skilled cadres, and were employed in the rural areas.
Research and Analysis Working Group (RAWG) (2005) noted that the 16% who are
5
employed in urban areas represent a disproportionate level of high skilled cadres.
Even after corrections for infrastructure, regional variation in staff per population
remains significant, and the disparities are even greater at the district level. According
to Olsen OE, Ndeki S, and Northeim O F (2005) these disparities are also confirmed
by findings of recent facility-based survey of the current status of human resource
quality, availability and distribution in six districts of northern Tanzania. Kurowski et
al (2003) and Mliga, mwakilasa & Mwakalukwa (2005) point out that the barriers to
improving the human resource situation are many and imposing, in particular for
highly skilled workers in the public sector who are overburdened, poorly paid and
working under conditions that are demoralizing. Poor health worker motivation and
performance is commonly manifested in many of the documented issues faced by
patients: lack of courtesy to patients, illegitimate charging for drugs and equipment,
high levels of absenteeism, “dual practice”, and poor task performance such as failure
to conduct proper patient examinations. These problems among health staff not only
negatively affect quality of care, but also reduce the utilisation of health services and
ultimately impact negatively on health outcome.
In addition, Research and Analysis Working Group (RAWG) (2004), point out that
altogether, many poor women in rural areas fail to access quality primary care when
they need it most, and many more fail to obtain the necessary referral for more skilled
care. There appears to be absolute shortage of resources at the primary health facility
level, which in turn impacts negatively on the quality of care delivered.
To solve these problems, Emergency obstetric care (EOC) needs to be improved, and
access to antenatal care and delivery facilitated, including improved referral services,
especially for poor and rural women.

6
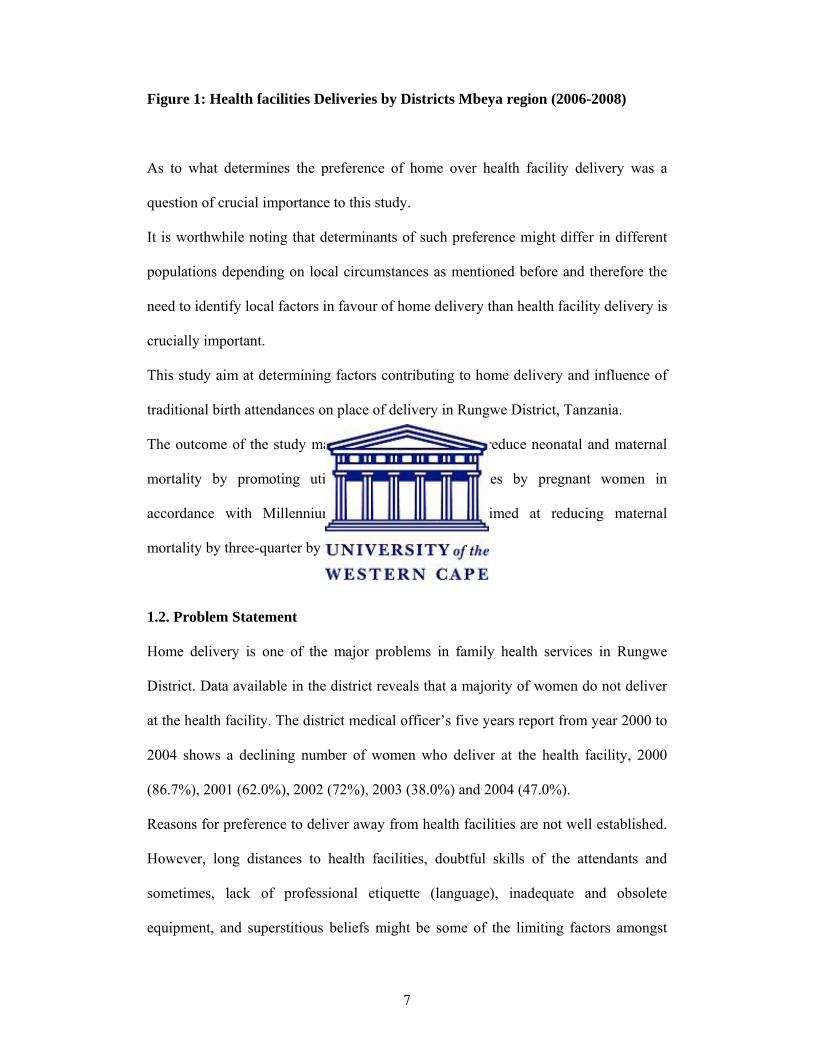
Like elsewhere in Tanzania, in Rungwe district statistics shows that there is high
incidence of home delivery which ranges from 13.3% to 62%, (Rungwe District
Medical Officer’s five year report, 2000-2004) and in addition, from the recent
Regional medical officer’s three years report (2006-2008), in Mbeya region statistics
show that there is very low incidence of health facilities delivery with an average
range of 53% to 46% i.e.2006 (53%), 2007 (45%) and 2008 (46%) (Mbeya region
medical officer’s three year report, 2006-2008) as well as by district in Rungwe
district range from 33% to 39% i.e. 2006 (39%), 2007(33%) and 2008(36%) (Mbeya
Region Medical officer’s three year report 2006-2008) contrary with an exception to
Mbeya Urban/City which show high incidence of health facility delivery which range
from 99.9% to 98% i.e. 2006(99.9%), 2007(99%) and 2008(98%) (Mbeya region
Medical officer’s three year report 2006 – 2008).
99.999 98
312028
393336
6957 60
4033
31
57 58 60
413737
4943 4453
4546
0102030405060708090
100
%
MBEYACITY
MBEYARURAL
RUNGWE CHUNYA ILEJE KYELA MBOZI MBARALI REGION
DISTRICTS
HEALTH FACILITY DELIVERIES BY DISTRICTS MBEYA REGION 2006 - 2008
200620072008
Source: Mbeya Region Medical officer’s three year report (2006-2008)
7
Figure 1: Health facilities Deliveries by Districts Mbeya region (2006-2008)
As to what determines the preference of home over health facility delivery was a
question of crucial importance to this study.
It is worthwhile noting that determinants of such preference might differ in different
populations depending on local circumstances as mentioned before and therefore the
need to identify local factors in favour of home delivery than health facility delivery is
crucially important.
This study aim at determining factors contributing to home delivery and influence of
traditional birth attendances on place of delivery in Rungwe District, Tanzania.
The outcome of the study may contribute to efforts to reduce neonatal and maternal
mortality by promoting utilization of health facilities by pregnant women in
accordance with Millennium Development Goals aimed at reducing maternal
mortality by three-quarter by year 2015.
1.2. Problem Statement
Home delivery is one of the major problems in family health services in Rungwe
District. Data available in the district reveals that a majority of women do not deliver
at the health facility. The district medical officer’s five years report from year 2000 to
2004 shows a declining number of women who deliver at the health facility, 2000
(86.7%), 2001 (62.0%), 2002 (72%), 2003 (38.0%) and 2004 (47.0%).
Reasons for preference to deliver away from health facilities are not well established.
However, long distances to health facilities, doubtful skills of the attendants and
sometimes, lack of professional etiquette (language), inadequate and obsolete
equipment, and superstitious beliefs might be some of the limiting factors amongst

8
others. Other factors could be costs for items that pregnant women must bring with
them at the time of delivery and age of the attendants in health facilities. It is true that
health facilities are below standard, but still they are a better option for child delivery
than elsewhere. Health facilities can recognize and prevent medical crises in case of
complications. Assistance by untrained attendants carries greater risks for both the
mothers and the newborn babies.
This study aim at determining factors contributing to home delivery and influence of
traditional birth attendances on place of delivery in Rungwe District, Tanzania.
1.3 Rationale of the Study
Health reports in Rungwe District indicate an increasing reluctance by expectant
mothers (pregnant women) to attend health facilities, yet, the negative effects of this
attitude are clearly felt in the community. Most women and newborn babies, who die
from childbirth complications, die in private homes, without professional assistance,
during and after deliveries. Also, mothers and their newborn babies can get infections
if they deliver at home under un-sterile conditions.
Other complications, such as ruptured uterus, severe haemorrhage during and after
delivery, etc may lead to maternal death. In addition, in the district, there is no
recorded report of any study ever done to determine factors that compel women to
deliver at home. Further more, premature death among women has an impact on the
mother, the newborn, family and the nation at large. Information obtained by this
study is crucial for planning interventions that will enhance and promote delivery in
health facilities. Preliminary discussions with community leaders revealed that there
was a need for this study, and there was an agreement for collaboration and
cooperation.
9
CHAPTER 2: Literature Review
2.1 Home delivery in the developing world
Home delivery is a problem in most of the developing countries.
Nirupan and Yuster (1995) and Barnes-Josiah et al (1998) pointed out that various
studies have found that access to essential obstetric services is limited in developing
countries. According to Abouzahr C. (1997) millions of women do not have access to
good quality health services during pregnancy and childbirth – especially women who
are poor, uneducated or who live in rural areas. Less than half of women in
developing countries get adequate health care during and soon after childbirth, despite
the fact that most maternal deaths take place during these periods. In contrast, use of
maternal health services is nearly universal in developed countries Abouzahr C
(1997).
Access means that services are available and within reach of women who need them.
Good quality services require that health care providers have adequate clinical skills
and are sensitive to women’s needs; that facilities have necessary equipment and
supplies; and that referral systems function well enough to ensure that women with
complications get essential treatment.
2.2 Many Women Lack Maternal Health Care
According to WHO (1997) at least 35% of women in developing countries receive no
antenatal care during pregnancy, almost 50% give birth without a skilled attendant
and 70% receive no postpartum care in the six weeks following delivery. This lack of
care is most life-threatening during, childbirth and the days immediately after
delivery, since these are the times when sudden, life-threatening complications are
most likely to arise.

10
Source: Abouzahr C (1997)
Figure 2. Maternity Care: The Percentage of Women
Most women in North America, Europe and Latin America & the Caribbean make at
least one antenatal visit and deliver with skilled attendant while in Africa and Asia
less than half deliver with skilled attendant
2.3 Why women do not use available services?
Accoring to Abouzahr C (1997), among the reasons it found that No physical access:
Most rural women (80%) live more than five kilometres from the nearest hospital.
Vehicle shortages and poor road conditions mean that walking is often the main mode
of transportation, even for women in labour. In addition, Biego G. et al (1995) point
out that in rural Tanzania, 84% of women who gave birth at home intended to deliver
at a health facility, but could not because of distance and the lack of transport.
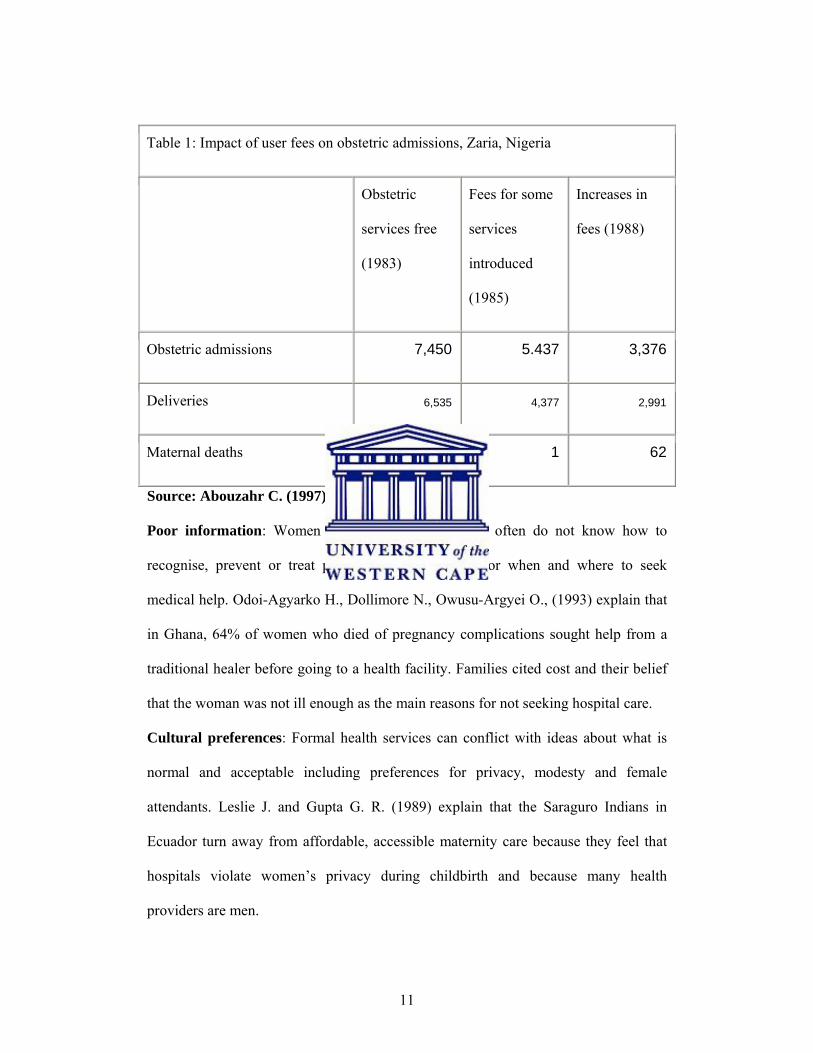
High costs: Even when formal fees are low or non-existent, women often face
expenses for transport, drugs, and food or lodging for the women or her family
members.
11
Table 1: Impact of user fees on obstetric admissions, Zaria, Nigeria
Obstetric
services free
(1983)
Fees for some
services
introduced
(1985)
Increases in
fees (1988)
Obstetric admissions 7,450 5.437 3,376
Deliveries 6,535 4,377 2,991
Maternal deaths 2 1 62
Source: Abouzahr C. (1997).
Poor information: Women and community members often do not know how to
recognise, prevent or treat pregnancy complications, or when and where to seek
medical help. Odoi-Agyarko H., Dollimore N., Owusu-Argyei O., (1993) explain that
in Ghana, 64% of women who died of pregnancy complications sought help from a
traditional healer before going to a health facility. Families cited cost and their belief
that the woman was not ill enough as the main reasons for not seeking hospital care.
Cultural preferences: Formal health services can conflict with ideas about what is
normal and acceptable including preferences for privacy, modesty and female
attendants. Leslie J. and Gupta G. R. (1989) explain that the Saraguro Indians in
Ecuador turn away from affordable, accessible maternity care because they feel that
hospitals violate women’s privacy during childbirth and because many health
providers are men.

12
Lack of decision-making power: In many parts of the world, women’s power to
make decisions is limited, even over matters directly related to their own health.
Safe motherhood (1997) point out that in Bangladesh, it is usually the mother-in-law
and husband who make the decision to seek (or not seek) care. They are often the least
likely to know about pregnancy-related complications and their possible fatal
consequences.
Health services are inadequate: Thaddeus and Maine (1994) explain that poor
quality of care is one of the most common reasons women give for choosing not to
use available maternal health services. Problems include that health facilities in
developing countries face chronic shortages of equipment, drugs and basic supplies,
including blood for transfusion. Families of women in labour may be forced to
purchase drugs and supplies to bring to the hospital, which can cause fatal delays.
Also, Abouzahr C. et al (1996) adds that health facility staffs are often poorly trained.
They may lack essential clinical skills, and may not observe hygienic practices.
Health workers may be rude, unsympathetic and uncaring, so women prefer to use the
services of traditional birth attendants and healers.
Other factors include: a lack of privacy; run-down physical facilities; inconvenient
operating hours; and restrictions on who can stay with a woman at the health facility.
Furthermore, Fawcus S. et al (1996) explain that delays in referring women from
community health facilities to hospitals are one of the most important barriers to life-
saving maternal care. A study of 718 maternal deaths in Egypt found that 92% of
them could have been avoided if good quality care had been provided Abouzahr C. et
al (1996).
Furthermore, according to Brieger, Luchok, Eng, & Earp (1994), Hoque & Selwyn
(1996), O’Mahoney & Steinberg (1995), Save the Children (2003) and WHO (1996)

13
around 80% of pregnant women on African continent attend antenatal care (ANC) on
a regular basis, whereas only on average 45% (6%-86%) seek skilled assistance
during childbirth. But, Hodgkin (1996), Van den Heuvel, De Mey, Buddingh, & Bots,
(1996) add that various barriers are perceived to prevent women in low-income
countries from seeking skilled care during labour, including midwives’ attitudes, lack
of confidence in services offered, socioeconomic conditions, as well as cultural beliefs
and traditions.
In Sub-Saharan Africa, an estimated 40-50 % of women deliver at home (United
Nations Population Fund UNPFA, 1999). This places women and newborns at risk.
Ganer et al. (1994) reported a high rate of obstetric complications among apparently
normal pregnancies delivering at home in Papua New Guinea.
The highest maternal mortality rates are found in Sub-Saharan Africa, where the
WHO estimates that less than 50% of women have access to skilled attendants, and
only 36% give birth in health facilities (WHO, 1997). Furthemore, Patricia B. M. et al
(1994) explained that according to surveys done in 37 countries during the 1990’s the
average percentage of women who delivered without skilled assistance remained
reasonably large.
A study done in Zimbabwe reported a high attendance to ANC clinics with a majority
of women (56%) delivering their children outside health facilities. Only 44% of ANC
clinic attendants delivered in a formal health care unit. Over the years, scholars from
various parts of the world have attempted to find out why women, especially those in
developing countries, seem to avoid using health facilities for delivery.
In a cohort study, Hodgkin (1996) cited distance to facilities, and family’s economy,
as factors that militate against women seeking services in health centres. Abouzahr
(1997) cited in Family Care International (1998) stated that poor and uneducated or

14
rural women lack access to good quality health services during pregnancy and
childbirth. He defined access as availability of services within reach of those who
need them, and good quality services as entailing health attendants with adequate
clinical skills, and who show concern for women’s needs, availability of equipment
and supplies in facilities, and efficient referral systems.
The author pointed out that most rural women live far from hospitals, and means of
transportation when available, is often inadequate. Odoi-Agyarko H., Dollimore N.,
and Owusu-Argyei O.(1993) cited in Family Care International (1998) highlighted
other constraints like the high costs associated with attending health facilities, poor
information on pregnancy complications, and how and where to get medical help.
Opuko et al (1997) pointed out that health facilities may also be shunned because they
are poorly equipped and their services are mediocre.
Walker et al (2000) established that despite of high maternal mortality rate most
women preferred to deliver at home because the services and conditions in public
facilities were poor. Thaddeus & Maine (1994) cited in Family Care International
(1998) reported poor and inadequate services, with inadequate equipment and basic
supplies, and poorly trained attendants who often exhibit unprofessional conduct.
Gilson (1997), Nahar and Costello (1998) raised the issue of health workers
demanding payment from their clients, and contend that such practice discourages the
women from using the health facilities.
A survey conducted in Malawi, Godfrey (1996) indicated that although many women
attended antenatal clinics, only 23% of them delivered in the clinics. Kaguna et al
(2000) discovered that in Rakai District of Uganda, 32% of the sampled population
used public health facilities, while 44% delivered at home, and 17% were attended by
traditional birth attendants. The reasons being the unprofessional ways of health
15
attendants, and social influences. Other scholars add that influence of traditional birth
attendants also discourage the use of health care facilities Chipfakacha V. (1994).
Okojie (1994) pointed out that other factors forcing women not to use health facilities,
like gender inequalities entailing restrictions on their movements and seclusion. Leslie
(1989) cited in Family Care International (1998), adds to the list factors of cultural
preference, when women may avoid using health facilities because the services there
seem to conflict with their cultural norms. The ENMMS (2000) cited in Clean and
Safe Mother Birth (2005) established that Egypt has a home delivery rate of over
50%, with 29% of maternal and 75% of neonatal deaths occurring at home. Reasons
for choosing home delivery are local traditions, customs, greater comforts, and
privacy and trust in traditional birth attendants.
Furthermore concerning factors that compel women to deliver at home rather than at
health facilities, Brieger et al (1994) found that factors such as absence of doctors
especially at night, bureaucracy, and disorganized referral systems discourage women
to deliver at health care facilities. They pointed out that in Nigeria for instance, that
despite adequate local provision of maternity services, 65% of women still delivered
at home. The authors pointed out that this was mainly because of fees for delivery
services, level of income, cultural beliefs and education.
McCord and Chowdhury (2003) explains that a study in rural India found that patients
have learned to determine when hospital care is needed, resulting in the effective and
efficient delivery of emergency obstetric services. The cost of these services, while
low on a per-capita basis, is a substantial barrier for many poor families. And Borghi
et al (2003) too explains that cost of services is also a barrier to use of hospital-based
delivery care in West Africa.

16
Ensor T. (2004), Raghupath S. (1996) and Hodgkin D. (1996) point out that distance
is known to negatively impact service utilisation and is also cited as a reason why
women choose to deliver at home rather than in a health facility. Given the cultural
context, the remarkable effect of distance on use of facility-based care is not
surprising.
Other study done in Ghana by Afful (2007) showed that ignorance due to observation
of various traditions and taboos, belief that God or the fetus decides place of delivery,
lack of knowledge of estimated date of delivery, poverty, poor health staff attitude,
unavailable means and cost of transport, cost of health care as well socio-cultural
beliefs on delivery were the outstanding constraints to utilization of health care
facilities in the district.
Also, Adapesa (2007) in Ghana identified similar factors such as lack of transport and
high cost of transport, poverty, low awareness about the benefits of facility delivery,
poor health worker attitude and influence from family members. Some demographic
characteristics which were prominent were mother's education, occupation and parity.
The results from the quantitative data show that 93% of the women attended antenatal
clinic with 61% of them delivering at the health facility.
Furthermore, as reasons for decision making, Bolam et al (1998) explain that in
Nepal, maternal education was among the important independent factors in
determining the place of delivery. Also, Yanagisawa et al (2006) documented that
woman who had at least 7 years of school attendance being six times more likely to
deliver babies at a health facility than those who did not attend.
Also according to Lazarus and Folkman (1984) awareness of obstetric complications
and possible consequences thereof, as well as, knowledge of modern technology is an
active coping strategy that assists the individual to make correct decisions. Toan

17
(2001) emphasizes the importance of education, as it increases women’s power of
decision and consequently their use of available services.
On another hand, the use of abusive language and lack of tolerance by the health
workers were felt to be discouraging the use of health facilities for delivery. Similar
experiences have been documented by D’Ambruoso et al (2005) for instance in
Ghana, where women changed their place of delivery, and recommended the same to
others when they experience degrading and unacceptable behaviour. Hence, staff
attitudes were an important component in deciding where to deliver.
Hodnett et al (2002) and Roosmalen et al. (2005) have shown that continuous
supportive care during childbirth, especially when the caregiver is not a member of
the hospital staff, improves the outcome of labour. However, Roosmalen et al. (2005)
has shown that in many of the delivery rooms of health facilities in sub-Saharan
Africa and Asia, women in labour are generally not allowed to bring a relative with
them into the labour ward. Samizi G. (1997) explain that among factors which keep
women away from utilizing health facilities are cost of hospital delivery, unfamiliar
practices and inappropriate restrictions of family members by health staff when
mothers are admitted to a health care unit.
Thind A. et al (2004) added that other factors include: bureaucracy, lack of drugs and
other supplies, non-functioning equipment, absence of doctors especially at night,
unfriendly attitude of health staff towards patients and negative perceptions of the
quality of care provider against cost. According to Walker D. et al (2002) in a study
done in Kalimantan Indonesia, preference of home delivery among pregnant women
was attributed to poor quality of care in the health facility and contributed
significantly to excessive maternal mortality. The situation is worsened by
disorganized referral system.
18
In addition to the above, Fantahum M. (1995) explains that accessibility of antenatal
care services which include uneven distribution of health facilities, cost of
transportation, bad condition of roads and travel time from home to a health facility
due to long distance have been shown to be important barriers to seeking health care,
particularly in rural areas.
Furthermore, WHO (1986) points out that social economic and cultural factor has
significant influences on the choice of place of delivery. Poverty is considered by
WHO as a high risk factor. It is known that poor women are less likely to have formal
education than wealthy women, and are less likely to be in good health and to seek or
receive medical care.
2.4 Programmes to Address Home Delivery
On how to solve this problem? Maine et al (1996) and Figa-Talamanca (1996) pointed
out that building a functional chain of referral to obstetric services can increase access
to essential obstetric services.
Furthermore, WHO (1996) added that one such system is provided by maternity
waiting homes that are linked to facilities offering essential obstetric care. Women
who are at increased obstetric risk, but who do not have access to essential obstetric
services, are referred to maternity waiting homes a few weeks prior to delivery. Once
a woman is in labour or in need of care, she is transferred to the hospital.
Furthermore, Gill and Ahmed (2004), Djan et al (1997), Ifenne et al (1997), Leigh et
al (1997), Mbaruku and Bergstrom (1995) state that improving the quality of care at
referral facilities can increase the use of essential obstetrical services and reduced case
fatality rates.

19
Abreu and Potter (2001) pointed out that this includes low-cost improvements in the
design and functioning of operating rooms. Also, Mavalankar (2002) added that
training to improve essential obstetric care skills of providers is a key to providing
quality obstetric care. Changing policies to enable existing medical staff to address
obstetric emergencies may also increase the use of essential obstetrical services and
reduce mortality in rural areas. Furthermore, Gohhou et al (204), Stekelenburg and
Roosmalen (2002) explained that maternal mortality/morbidity review meetings,
where each case of maternal death and/or severe obstetric morbidity and contributing
factors are discussed among health facilities/hospital staff, can be useful tools for
identifying problems and improving essential obstetric care services at the district
level. Filippi et al (2003), Weeks et al (2003) and Wagaarachchi et al (2001)
explained that criterion-based clinical audits can also be useful tools for measuring
and improving the quality of obstetric care in developing countries.
According to Ray and Salihu (2004), Minden and Levitt (1996), Bolam et al (1999)
the role of traditional midwives (TBAs)—medically unskilled birth attendants—in
improving maternal health has been studied in many communities. Furthermore,
Goldman and Glei (2003), Goodburn et al (2000), Hoff (1997) and Kamal (1998)
point out that researchers have examined the impact of training on TBAs' obstetric
knowledge and practices, as well as on maternal mortality and morbidity.
Bergstrom and Goodburn (2001) explain that the impact of training TBAs on maternal
mortality appears limited and the greatest benefit may be improved referral and
linkages with the formal health system. According to Sibley, Sipe and Koblinsky
(2004) results from a meta-analysis suggest TBA training may increase antenatal
attendance rates. But, Maimbolwa et al (2003) explain that in Zambia, traditional birth
assistants serve as culturally knowledgeable, social support for women during labour
20
and delivery, but have little accurate knowledge of appropriate management of labour
and delivery.
Paul and Rumsey (2002) explain that a study in rural Bangladesh suggests that
improving the timely referral of complicated deliveries to medical facilities or to train
TBAs could increase the utilization of health facilities and reduce maternal morbidity
and mortality. Also, Bultreys et al (2002) point out that with appropriate training and
supervision, TBAs may be helpful in preventing transmission of HIV. Hodnett et al
(2004) add that continuous one-to-one support of women during labour has been
shown to improve satisfaction and outcome.
2.5 ANC and Home delivery in Tanzania
In Tanzania, women are encouraged to deliver in health facilities. However, according
to National Bureau of Statistics & Macro International Inc (2005), and the Tanzania
Demographic and Health Survey (2004-2005) only 47% of women deliver in a health
facilities and 53% deliver at home. Of all deliveries occurring in health facilities, only
46% are attended by skilled attendants.
Family Care International (1998) shows that 84% of rural women in Tanzania, who
intended to deliver at health facilities, were unable to do so because of distance and
transportation problems. Different studies have been conducted to identify both the
causes and effects of this problem.
In addition, National Bureau of Statistics & Macro International Inc. (2005) show that
in Tanzania, although health facilities are closer to rural households than in many
African countries, more than half of children are delivered at home despite a high
coverage (94%) of antenatal care (ANC).
21
In Tanzania it is recommended that a pregnant woman attend antenatal clinic for a
minimum of four visits before delivery even if she does not have any pregnancy
related problems. At the clinic, health education is given as part of the antenatal care
package.
Moreover, Tanzania National Bureau of Statistics and Macro International Inc. (2000)
point out that despite high levels of access to antenatal care, trained medical personnel
attend only 44% of births.
Also, Otim-Adoi (1981), Hitimana-Lukanika (1988), Munaaba (1995), Amooti-
Kaguna & Nuwaha (2000), National Bureau of Statistics & Macro International
Inc.(2005) & Lugina et al (2004) point out that most previous studies in Tanzania and
elsewhere have shown that most mothers attend antenatal clinics at least once during
pregnancy, but that only a small proportion of them deliver in health facilities.
Elo (1992), Nwakoby (1994), Bolam et al (1998) and Yanagisawa et al (2006) explain
that socioeconomic variables and physical distance from health facility influence the
place of delivery. Also, Bicego et al (1995) point out that in rural Tanzania for
instance, 84% of women who gave birth at home intended to deliver at health
facilities but did not because of distance and transportation problems.
Amos (2004) in his community-based descriptive cross-sectional study in Karagwe
District, Tanzania, where focus group discussion (FGDs) and cross-sectional data
collection methods were used, showed that the utilization of antenatal care services
was very high. However, health facility deliveries were unacceptably low.
Furthermore, as regards to maternal health, data from the Tanzania Demographic and
Health Survey (TDHS) (2004-2005) show that pregnancy related mortality has not
improved over the last two decades. The maternal mortality ratio for the period 1995

22
to 2004 was 578 deaths per 100,000 lives births, not significantly different from the
1987 to 1996 ratio of 529 per 100,000 live births.
Also the data show that for the 1990s there were a steady decline of births taking
place in a health facility, as mentioned above, the declines were from 53% in 1991, to
44% in 1999, with a slight improvement thereafter. By 2004, facility-based deliveries
had reverted to 1996 levels of 47%. Over 80% of the maternal deaths are due to direct
causes that includes obstetric, haemorrhages, obstructed labour, pregnancy induced
hypertension, sepsis and abortion complications.
In addition, Walraven et al (1995) documented that home birth without a trained
attendant resulted in a three times higher perinatal mortality than those in a health
facility with trained attendants in rural Tanzania.
Like findings of other developing countries and in Tanzania as a whole, also in
Rungwe district, the Rungwe district medical officer report (2000-2004) shows that
health facility deliveries were equally unsatisfactory, only 38.8% to 48% of women
deliver in a health facilities. In addition, from the recent Mbeya Regional medical
officer’s three year report (2006-2008), statistics show that there is very low incidence
of health facilities delivery with an average range of 53% to 46% i.e.2006 (53%),
2007 (45%) and 2008 (46%) (Mbeya region medical officer’s three year report, 2006-
2008) as well as by district in Rungwe district range from 33% to 39% i.e. 2006
(39%), 2007(33%) and 2008(36%) (Mbeya Region Medical officer’s three year report
2006-2008) contrary with an exception to Mbeya Urban/City which show high
incidence of health facility delivery which range from 99.9% to 98% i.e.
2006(99.9%), 2007(99%) and 2008(98%) (Mbeya region Medical officer’s three year
report 2006 – 2008). As previously cited in Chapter 1 Figure 1 page 6.

23
2.6 Conclusion
From this cross sectional survey study findings it can be concluded that
socioeconomic, cultural, knowledge, inaccessbility to health facilities, poor health
services at health facilities, presence of traditional birth attendants, lack of women
decision-making power are among the factors that play a great role in determining
whether women use health facilities or not and where they deliver.
2.7 Aim and Objectives
2.7.1 Study Aim
The aim of this cross sectional survey study is to determine factors contributing to
home delivery and influence of traditional birth attendances on place of delivery in
Rungwe District Tanzania
2.7.2 Research Question
What are the factors contributing to home delivery in Rungwe District?
2.7.3 Specific Objectives
1. To examine the socioeconomic, cultural, and knowledge factors that influence
women to deliver at health facility and those who deliver at home.
2. To assess whether the level of acceptability of the health services and traditional
birth attendants influence women’s choice on the place of delivery.
3. To find out whether accessibility to health services and traditional birth attendants
influence women to decide the place of delivery.

24
CHAPTER THREE: METHODOLOGY
3.1 Study setting
The Tanzania mainland is located in eastern part of Africa, and is divided into 21
administrative regions which are further subdivided into 114 districts with 133
councils.
Mbeya region is located on the South-Western high land zone of Tanzania. Bordering
Malawi and Zambia on the southern part of the region, Rukwa region on the western,
Iringa region on the eastern, and Tabora and Singida regions on the north, it is situated
at an elevated land between 400-1700 metres above sea level.
Currently Mbeya region has a total of eight district councils within 7 districts, 25
divisions, 174 wards and 992 villages.
The region’s population is 2,330,665 with an urbanization growth rate of 14%. It has
population density of 37 people per square kilometre.
The health service infrastructure has 17 hospitals, 30 health centres and 318
dispensaries.
This study was conducted in Rungwe District, Mbeya region. Rungwe is one of the
eight districts in Mbeya region of Tanzania.
Rungwe District lies between 080–090 South of the Equator, and 330-340 East of
Greenwich. The district shares borders with Kyela District in the south, Makete
District (Iringa Region) in the east, Ileje District in the west, and Mbeya District in the
north. The Rungwe District headquarters is situated at Tukuyu town along Mbeya-
Malawi Highway, 72Km. away from Mbeya city.
25
The District has four (4) administrative divisions namely:
i.) Tukuyu,
ii.) Ukukwe,
iii.) Pakati and
iv.) Busokelo.
Divisions are headed by divisional secretaries and are subdivided into wards and
wards into villages. Wards and Villages are normally administered by Executive
Officers. A set of ten houses (ten cells) consisting of ten household leadership is the
smallest unit of government’s village administrative hierarchy (grass root government
unit). The District has 30 wards, 162 registered villages and 731 sub villages.
The district has an area of 2,811km2 which is 4% of the region. It has a total
population of 411,577 people according to the National Population and Household
Census carried out in 2002. The population grows at a rate of 0.9% and it has a
population density of 115 people per square kilometre. The number of women within
the childbearing age is approximated to be 62,953. Rungwe District has about 100,385
households, with an average household size of four (4) members.
Health facilities are unevenly distributed with 3 hospitals, 5 health centres and 55
dispensaries.
3.2 Study Design.
The study used a descriptive and analytical cross-sectional survey.
Descriptive studies: Descriptive studies concern simple descriptions of the health
status of a community, based on routinely available data, or on data obtained in
special surveys. They are limited to descriptions of occurrences of diseases in

26
communities, and do not show any relationship between exposures and effects
Varkevisser, et al. (1991)
Analytical studies: Analytical studies go further by analysing relationships between
health status and other variables (Beaglehole et al, 1997).
Beaglehole et al (1997) quoted in Flinders University Module guide (2006) asserted
that “Descriptive studies will establish the size and distribution of the problem, and
should be relatively easy to do within short space of time and will be relatively
inexpensive. However, it is difficult to identify causal risk factors that could assist in
designing an intervention. Analytical studies allow the identification of associated risk
factors between health status and other variables, but they will not evaluate the
effectiveness of any interventions that have been formulated”.
Cross-sectional studies: Cross-sectional studies, also known as prevalence studies,
aim to determine the frequency of disease. They are relatively easy and cheap to
conduct, but useful for investigating traits of individuals. They also help in
establishing the health care needs of communities. But it is difficult to establish the
reasons for the associations shown in cross-sectional studies (Beaglehole et al, 1997).
3.3 Study (Target) Population
This study was conducted in Rungwe District Tanzania. The study population
consisted of women aged between 19years and 49years have at least one child.
According to TDHS 2004–05, it found that about 52 percent of women aged 19 years
were already have one child or a pregnant for the first time in Tanzania
3.4 Selection Criteria for Study Population
Participants (women) for this study were those who had given birth to at least one
child in Rungwe District as it found in TDHS 2004–05, and have resided in the
district for a period of not less than one year.

27
3.5 Sample size
A sample is a small-scale representation- a kind of miniature model-of population
from which it is selected. Varkevisser (1991) stated that for quantitative studies,
calculations can be made to determine the optimum sample size.
In this study, the sample size was determined by a formula n= P (100-P)/e2
Where n = desired sample size
P = estimated prevalence of attribute under study
e2 = level of error accepted (Varkevisser, 1991)
Whereby P =53% as a prevalence of home deliveries, e =2.5 that is error accepted.
Thus the sample size was 398.5≈400
3.6 Sampling Procedure
The entire four divisions of Rungwe District were included in the study. Multistage
random sampling was applied. This is a procedure that is carried out in phases, and
usually involves more than one sampling method. Random sampling was used to
obtain wards according to specific division. Katzenellenbogen et al (1997) stated that
simple random samplings are easy to apply, but difficult to conduct, because they
entail a lot of travelling through a selected area to visit selected samples. Two wards
in each division were randomly selected, bringing the number of selected wards to 8.
According to Katzenellenbogen (1997), random sampling is a selection tool that is
used to select a representative sample in a population. It is also known as probability
sampling, as each individual in a study population has an equal chance of being
included in the sample. Each ward from a particular division was given a number.
Each number was written on small pieces of paper according to its division. Then
those pieces of paper from each division were folded separately, put in a basket, and

28
mixed vigorously. Someone was assigned to select two pieces of paper, one after
another to get two wards from each division while his/her eyes were closed.
Thereafter, selection of two villages was randomly done from each selected ward,
bringing all together to a total of 16 villages. The procedures to be used were the same
as above. Random sampling was used in order to minimize chances of bias.
Household: A systematic sampling was also used to determine household interval in
each village. This is a process whereby the first sample member is selected from the
list by a random number, and subsequent members are selected according to a fixed
sampling interval. Like simple random sampling, a systematic sampling gives every
member of a population the same chance of being selected into the sample
(Katzenellenbogen, 1997).
In addition Varkevisser, (1991), pointed out that systematic sampling is usually less
time consuming, and easier to perform. However there is a risk of bias, as the
sampling interval may coincide with a systematic variation in the sampling frame. In
this study, a systematic sampling was done by calculating the total number of
households in a particular village, divided by the number of household required to be
interviewed.
Only one (woman with at least one child) respondent was taken in a household. In
case of presence of more than one eligible woman in a household then random
sampling was used to get one. Also, in case of the absence of a woman with at least
one child in a house falling in the interval, the next house was considered.

29
3.6.1 Sampling frame
A sampling frame is (usually) a list of population elements from which a sample can
be drawn.
Table 6. Sampling frame showing number of respondents and place where they
will be obtained.
From the population data available in the district, a total of 400 pregnant women were
interviewed. As is the norm of systematic sampling and community surveys, it was
feasible to determine household interval in each village. The number of households to
be incorporated in the study were determined by the number of households available
in a particular village, in relation to the number of women with at least one
pregnancy/birth to be interviewed in that village, thus the household interval.
Information on the number of households is available from the 2002 census, and in
village government offices. In order to establish the starting point, the village
government offices were taken as the point of reference starting point for the
sampling. In case of absence of a woman with at least one child in a house falling
within the interval, the next house was considered.
Divisions Wards Villages Total Women with
at least one child
(19 –49years).To be
interviewed per
each village
Total Women with at least
one child (19–49years). To
be interviewed in all 16
villages.
4 8 16 25 400

30
3.7 Questionnaire
For interviews, questionnaires comprising open and close-ended questions were used.
Previously used questionnaires were adapted (Tlebere et al., 2007). For consistencies
of responses from the respondents, the questionnaire was translated into Kiswahili, the
native language in Tanzania.
3.8 Pilot Testing
The data collection tool was piloted in Katunduru village – Ilima ward to assure
understanding and use of the tool in this local context. Final adjustments were made
based on results of the pilot test. As the questionnaires were written in native language
- Kiswahili, it found that to be understandable and user - friendly. Thus, no changes
were made.
3.9 Data collection
Data were collected using structured and semi-structured (open-ended and closed-
ended questions) questionnaires. This maximizes the quality of data collected and
reduces the chance of bias.
Data were collected by the principal investigator, assisted by two research assistants.
3.10 Validity and Reliability
An already validated and established questionnaire was used (Mother’s Interview
Good Start Maternal and Neonatal Health Study - South Africa, 03/12/04 as reported
in Tlebere et al., 2007).
Training of data collectors was done.
For consistence of responses from the respondents, the questionnaires were translated
into Kiswahili, the native language in Tanzania.

31
Recall bias may be present, as some women were asked to recall events (births) that
may have occurred many years before the survey.
3.11. Analysis and Presentation of Data
The process of data analysis entailed screening of data to ensure that all relevant
responses are filled. Coding and sorting of the questionnaires were done on a daily
basis, and discrepancies resolved. Data entry was done after all data had been
collected, screened, coded and sorted. The researcher, a research statistician, and a
research assistant were responsible for data entry and final analysis. For analysis, a
single variable analysis and a scoring system for accessibility and acceptability were
used.
Information from the data collection tools were transferred to EpiInfo 2002 for
analysis. Primarily descriptive statistics were employed, including means and standard
deviation for continuous data, and frequencies and cross-tabulations for categorical
data. Socio-demographic data was obtained to give the description of the study
population. Analyses of the semi-structured interview focused around the four
objectives. Analytic data were compared using Students t-test or chi-square to
examine factors associated with home delivery. Alpha was set at 0.05. Results are
presented using descriptive statistics, e.g. means or percentages, in the form of tables,
pie charts, and bar charts.
3.12. Dissemination of Information.
The current study information will be disseminated to the full district Council
members. This is the setting where all representatives of the community members and
councillors meet. In addition, donors funding the study, as well as, regional medical
officers and health facility workers in the district will benefit from the knowledge
acquired. Implementing intervention plans that were resulted from the study findings

32
will further bring the benefits to the community. However, the latter will depend on
availability of funds from interested development partners. Some copies of the
dissertation are made available to the Faculty, and the Ministry of Health in Tanzania.
Copies of extracts will be sent to Journals for possible publication, and the material
may be used in relevant scientific conferences.
3.13 Ethical clearance:
Permission to conduct the study was obtained from the District Council Officer,
District medical officer, and from respective divisions and village leaders.
Respondents were asked for willingness to participate in the study, the respondents
were informed about the purpose, process and limits to confidentiality; also they were
be informed on how the data will be recorded, stored and processed. Varkevisser and
colleagues suggest, “As we develop our data collection techniques, we need to
consider whether our research procedures are likely to cause any physical or
emotional harm” (Varkevisser et al. 1991). Furthermore, Babbie (1995) points out
“ethical procedure involves accurately informing subjects or respondents about the
nature of the research and obtaining their verbal or written consent on willingness to
participate”. Thus the data obtained will be more valid and reliable.
Among methods for dealing with ethical issues as recommended by Varkevisser, et al.
1991 includes:
• Obtaining informed consent prior to the study and before the
interview begins.
• Not exploring sensitive issues before a good relationship has
been established with the informants
• Ensuring the confidentiality of data obtained, and

33
• Learning enough about the culture of informants to ensure it is
respected during the data collecting process.
In order to conduct this study, permission were obtained from the following
authorities:
i) The University of the Western Cape faculty board research committee.
ii) The University of the Western Cape Senate Research committees
(ethics clearance).
iii) The Rungwe district council.
iv) The Rungwe District Medical Officer.
v) The leaders from respective divisions, wards and villages.
The respondents/participants were asked for willingness to participate in the study, the
respondents were informed about the purpose, process, and the confidentiality of their
responses. Participants were clearly understood the information sheet (detailed
informed consent) prior to their interview. Also, they were informed on how the data
would be recorded, stored, processed and used. Participants were free to refuse to
participate or withdraw at any stage of the research without being affected in any way.
The data obtained from the research will be strictly used for the purpose outlined
before, but may be used for published or unpublished research at a later stage without
further consent. Any future analysis will maintain confidentiality of the data. Any
changes from agreement during the study with the participant were renegotiated.
Copies of the dissertation will be made available to the Faculty of Community and
Health Sciences, the University of the Western Cape (UWC), and in the Ministry of
Health headquarters in Tanzania. Extracts from the research may be used in relevant
scientific conferences. The principal investigator primarily conceived the idea for this
research after critically going through the Rungwe district medical officer’s five(5)

34
year report from year 2000 to 2004, which showed a declining number of women
delivering at health facility, year 2000(86.7%), 2001(62.0%), 2002(72.0%),
2003(38.0%) and 2004 (47.0%).
The financial support for this research is the principal investigator’s employer (The
Ministry of Health and Social Welfare in Tanzania).and the researcher himself.

35
CHAPTER 4 RESULTS
4.1 DESCRIPTION OF SAMPLE
The results presented in this section reflect data on all women who participated in the
study, from the semi-structured interviews. Detailed tables containing these data can
be seen in the appendices. Results giving an overview of the number of respondents,
number of divisions, number of wards, number of villages and households included in
the study, the demographic profile, socio-economic status, accessibility and
acceptability to health services/TBAs are as presented below.
Table 1: Study sites, households and sample Drawn in the district.
Divisions Wards Villages Households Women in Reproductive Age
Total number in a District
4 30 162 73200 62,953
Included in the study
4 8 16 400 400
Percentages 100 26.66 9.88 0.55 0.64
The table above shows that all four divisions out of four divisions in the district were
included in the study; 8 (26.66%) wards out of 30 wards were included in the study;
16 (9.88%) villages out of 162 villages were included in the study; 400 (0.55%)
households out of 73200 households were included in the study and 400 (0.64%)
eligible women out of 62,953 women in reproductive age were included in the study.

36
Table 2: Study sample Drawn from four sites/Divisions.
SITES/DIVISIONS UKUKWE TUKUYU
MJINI(URBAN) PAKATI BUSOKELO TOTAL
PARTICIPANTS TOTAL NUMBES (#)
100 100 100 100 400
(%) 100 100 100 100 100
The table above shows that 100 eligible participants were then drawn from each
division making a total sample of 400 eligible participants in the district.
Also it was found that the mean number of eligible women to be interviewed were
similar across all households i.e 1.09 with a Std. Dev. of 0.4544, except for Ukukwe
Division which had slightly more on average (mean 1.25, SD0.79; p-value 0.0012).
There were a minimum of one eligible woman and maximum of 6 eligible women in
households. By household, it found that there were 376 households with only one
eligible participant, 16 households each household had two eligible participants, five
households each had three eligible participants and three households each one of the
three household consisted of four, five and six eligible participants respectively.

37
Table 3: District Socio Economic Variables by Division
Socio Economic Variable Answer
Ukukwe #(%)
Tukuyu #(%)
Pakati #(%)
Busokelo # (%)
Total p-
Value
Type of Water source
Piped - inside house 3 (3%) 24(24%)
0 (0%)
1 (1%)
28 (7%)
0.00
Type of Water source Piped – yard 17(17%) 29(29%)
0 (0%)
5 (5%)
51 (12.8%)
Type of Water source
Piped – public 36(36%) 45(45%)
2 (2%) 52(52%)
135 (33.8%)
Type of Water source
Borehole/well 24(24%) 2(2%)
67 (67%) 28(28%)
121 (30.3%)
Type of Water source Rive/Stream 19(19%) 0(0%) 31(31%0 14(14%)
64 (16.0%)
Type of Water source
Water tanker 1(1%) 0(0%) 0(0%) 0(0%)
1 (0.3%)
Total 100 (100%)
100 (100%) 100(100%)
100 (100%)
400 (100%)
Type of toilet Flush toilet. 7(7%) 15 (15%) 0 (0%) 0 (0%)
22 (5.5%)
0.00
Type of toilet Pit latrine 92 (92%) 85 (85%)
100 (100%)
100 (100%)
377 (94.3%)
Type of toilet
Ventilated pit lat 1(1%) 0(0%) 0(0%) 0(0%)
1 (0.3%)
Total 100(100) 100(100) 100(100) 100(100)
400 (100%)
Type of Main fuel used for cooking Electricity. 6(6%) 1(1%) 0(0%) 0(0%)
7 (1.80%) 0.0
0 Type of
Main fuel used for cooking Charcoal 14(14%) 65(65%) 1(1%) 0(0%)
80 (20.00%)
Type of
Main fuel Wood 80(80%) 34(34%) 98(98%) 100(100%) 312

38
used for cooking
(78.00%)
Type of Main fuel used for cooking Other 0(0%) 0(0%) 1(1%) 0(0%)
1 (0.30%)
Total 100 (100.0%)
100 (100.0%)
100 (100.0%)
100 (100.0%)
400 (100%)
Type of the house Bricks 68(68%) 79(79%) 50(50%) 62(62%)
259 (64.80%)
0.0005
Type of the house Mud 32(32%) 20(20%) 46(46%) 33(33%)
131(32.80%)
Type of the house Wood 0(0%) 1(1%) 4(4%) 5(5%)
10(2.50%)
Total 100 (100.0%)
100 (100.0%)
100 (100.0%)
100 (100.0%)
400(100%)
Type of Religion Christian 95(95%) 92(92%) 100(100%) 98(98%)
385(96.2%)
0.0104
Type of Religion Muslim 3(3%) 8(8%) 0(0%) 1(1%)
12(3.0%)
Type of Religion Pagan 2(2%) 0(0%) 0(0%) 1(1%)
3(0.8%)
Total 100 (100.0%)
100 (100.0%)
100 (100.0%)
100 (100.0%)
400(100%)
Marital status
Single - Never mar 8(8%) 7(7%) 3(3%) 2(2%)
20(5.0%)
0.0383
Marital status
Married – monogamou
s 65(65%) 78(78%) 78(78%) 84(84%)
305(76.2%)
Marital status
Married - polygamous 7(7%) 6(6%) 10(10%) 4(4%)
27(6.8%)
Marital status Widowed 9(9%) 5(5%) 3(3%) 8(8%)
25(6.2%)
Marital status
Divorced/separated 11(11%) 4(4%) 6(6%) 2(2%)
23(5.8%)
Total 100 (100.0%)
100 (100.0%)
100 (100.0%)
100 (100.0%)
400(100%)
Education level
No formal Schooling 5(5%) 2(2%) 1(1%) 2(2%)
10(2.5%)
0.0060

39
Education level
Primary School 91(91%) 87(87%) 97(97%) 97(97%)
372(93%)
Education level
Secondary School 4(4%) 11(11%) 2(2%) 1(1%)
17(4.2%)
Total 100 (100.0%)
100 (100.0%)
100 (100.0%)
100 (100.0%)
400(100%)
Source of income
Currently employed
Yes 15(15.0%) 16(16.0%) 6(6.0%) 6(6.0%)
43(10.8%)
0.0238
No 85(85.0%) 84(84.0%) 94(94.0%) 94(94.0%)
357(89.3%)
Total 100(100.0%)
100(100.0%)
100(100.0%)
100(100.0%)
400(100.0%)
Source of income
Regular employment
Yes 14(14.0%) 15(15.0%) 5(5.0%) 5(5.0%)
39(9.8%)
0.0161
No 86(86.0%) 85(85.0%) 95(95.0%) 95(95.0%)
361(90.3%)
Total 100(100.0%)
100(100.0%)
100(100.0%)
100(100.0%)
400(100.0%)
Source of income
Irregular employment
Yes 3(3.0%) 2(2.0%) 1(1.0%) 1(1.0%)
7(1.8%)
0.6595
No 97(97.0%) 98(98.0%) 99(99.0%) 99(99.0%)
393 (98.3%)
Total 100(100.0%)
100(100.0%)
100(100.0%)
100(100.0%)
400(100.0%)
Source of income
Home
mployment
Yes 89(89%) 86(86%) 94(94%) 97(97%)
366(91.5%)
0.0246
No 11(11.0%) 14(14%) 6(6.0%) 3(3.0%) 34(8.5%)
Total 100 (100.0%)
100 (100.0%)
100 (100.0%)
100 (100.0%)
400(100.0%)
Socio-economic Status.
The table above shows the socio-economic status in the district as most households
135 (33.75%) use piped-public and 121 (30.25%) use Borehole/well as the main
source of water; and 377(94.25%) use Pit Latrine as a main type of Toilet; 312
(78.00%) households use wood as a main type of fuel for cooking. Also 259 (64.75%)
households have houses made out of Bricks and 131(32.75%) have houses made out
40
of wood. Only 39 (9.8%) of households depend on regular employment. However, it
was found that the majority 366 (91.50%) of women depend on home employment
(income generating activities performed at home) and only 43 (10.75%) are currently
employed; and 7 (1.8%) depend on irregular employment.
By sites in general, a number of socio-economic variables show that participants from
Pakati and Busokelo divisions have significantly poorer resources than those in
Tukuyu and Ukukwe divisions. As can be seen in the table above, thirty one percent
(31%) of participants in Pakati get their household water from river or streams. In
contrast at least 24% of the participants in Tukuyu and 3% in Ukukwe have piped
water inside their houses or yards. Also it shows that in Pakati and Busokelo 100% of
participants had pit latrines while at least 15% of participants in Tukuyu and 7%
Ukukwe had flush toilets. Not only that but also 98% of the participants from Pakati
and 100% in Busokelo use wood as their main cooking fuel whilst at least 6% in
Ukukwe and 1% in Tukuyu use electricity as their main cooking fuel. In addition 4%
of participants in Pakati and 5% in Busokelo had their houses made out of wood
whilst 79% of participants in Tukuyu and 68% in Ukukwe had their houses made out
of bricks. All of these differences were statistically significant.
There were also large differences between the sites/divisions in terms households’
access to employment in the district. In Tukuyu, at least 17% of household and 15%
in Ukukwe had someone employed compared to only 5% of households in Pakati and
6% in Busokelo. In contrast, there were no large differences between the sites in terms
of home employment dependants; however, 95% of households from Pakati and 97%
in Busokelo had more home employment dependants compared to 89% of households
in Ukukwe and 85% in Tukuyu. These differences were statistically significant.

41
In terms of households’ access to education, 93% of households in the district had
someone with up to primary school education level. By sites, there were no large
difference between the sites as 97% of households in Pakati and Busokelo had
someone with up to primary school education level as well as 91% in Ukukwe and
87% in Tukuyu. In contrast, only 2.5% of households in the district had no formal
schooling and there were no large differences between the sites as there were 1% from
Pakati and 2% in Busokelo and Tukuyu and only 5% participants in Ukukwe had no
formal schooling. Also, only a total of 4.2% households in the district had someone
with up to secondary school education level. In three sites, 1% of households in
Busokelo, 2% in Pakati and 4% in Ukukwe, had someone with up to secondary school
education level compared to 11% in Tukuyu urban.
The predominant ethnic group 96.25% is Nyakyusa tribe; followed by Ndali 14
(3.5%) and the rest were one or less than one percent. Also the table shows that 385
(96.20%) of women are Christians and only 12(3.0%) are Muslims and 3(0.8%) are
Pagans. By sites, it found that there were more Christians in each division with no
large differences as 95% were in Ukukwe, 92% were in Tukuyu, 100% were in Pakati
and 98% were in Busokelo compared to other religions. However, there were not any
Muslims and pagans in Pakati and there were more Muslims (8%) in Tukuyu and only
3% in Ukukwe and lastly 1% in Busokelo. Although these differences were smaller
than the socio-economic variables they were still statistically significant.
In terms of marital status, it was found that 305(76.25%) of women are married-
monogamous in the district. There were no large differences by sites as there were
78% married-monogamous women in Pakati and Tukuyu, 84% in Busokelo and 65%
in Ukukwe. In contrast, there were only a total of 6.8% married-polygamous in the
district with mild differences by sites. However, Pakati seems to have slightly more

42
married-polyamous women (10%) compared to other sites. As 7% married-
polygamous women were in Ukukwe, 6% married-polygamous women in Tukuyu and
lastly 4% in Busokelo. Also, there were only a total of 6.2% widowed women in the
district with mild difference by sites. However, there were more widowed women in
Ukukwe (9%) and (8%) in Busokelo compared to (5%) widowed women in Tukuyu
and lastly (3%) in Pakati. Not only that but also there were a total of 5% single-never
married women in the district with significant difference by sites. As it found in
Urban areas, there were (8%) more single-never married women particularly in
Ukukwe and (7%) in Tukuyu compared to rural areas as it found that (3%) single-
never married women were in Pakati and lastly only (2%) were in Busokelo. Once
again overall these differences across sites were statistically significant.

43
Table 4 Comparing mode of travel to Clinic, Hospital and TBAs by Divisions.
Mode of travel to the nearest clinic (n =400) Ukukwe Tukuyu Pakati Busokelo Total
P-Value
Walk N
(%) 99(99) 98(98) 98(98) 100(100) 395(98.75) 0.5265
Taxi/bus N
(%) 1(1) 2(2) 2(2) 0(0) 5(1.25)
Total 100 100 100 100 400 Mode of travel to the nearest hospital (n=400) Ukukwe Tukuyu Pakati Busokelo Total
Walk N
(%) 24(24.0) 93(93.0) 50(50.0) 66(66.0) 233(58.25) 0.0000
Taxi/Bus N
(%) 76(76.0) 7(7.0) 50(50.0) 34(34.0) 167(41.75)
Total 100 100 100 100 400 Time Std Dev 43.91 13.38 79.41 69.62 70.27 Mode of travel to the nearest TBAs (n =400) Ukukwe Tukuyu Pakati Busokelo Total
Walk N
(%) 54(54.0) 16(16.0) 70(70.0) 26(26) 166(41.5) 0.0000
Taxi/bus N
(%) 0(0) 3(3) 0(0) 0(0) 3(0.75)
Not applicable N
(%) 46(46.0) 81(81.0) 30(30.0) 74(74) 231(57.75)
Total 100 100 100 100 400
Mode of Transport to Health Facilities by Sites.
The information presented in this section were collected from all the women (i.e. 400)
who participated in the semi-structured interview. The table above shows that in all
sites women predominantly walk to get the nearest clinic, hospital and TBAs.
There were significant differences between the sites in terms of the mode of transport
to reach the health facilities especially to hospital. As seen in the table above, most of
the women (94%) in Tukuyu walk to get to the hospital because the distance was
shorter, and also the most women (77%) in Ukukwe use buses/taxi to get to the
hospital because the transport was easy and distance was not very far to the hospital.

44
However, (50%) of the women in Pakati and (66%) of the women in Busokelo use
both buses/taxi and walking to get to the hospital because they lived significantly
longer distances away from the Hospital than the other two sites, P-value 0.0000
which statistically was significant.
Table 5: Mean and Standard Deviation of Socio-demographic variables By
Divisions
Type of Socio Economic
Ukukwe Mean (SD)
Tukuyu Mean (SD)
Pakati Mean (SD)
Busokelo Mean (SD)
Total Mean (SD) p-Value
Maternal Age
31.7 (7.6)
29.0 (6.8)
32.3 (8.0)
32.6 (7.4)
31.3 (7.5) 0.0021
Years living in District
17.4000 (12.88)
10.0700 (9.96)
18.9700 (11.95)
21.1500 (12.85)
16.8975 (12.63) 0.0000
Average Time to the nearest Clinic
28.63 (26.38)
28.18 (13.88)
66.26 (55.25)
33.46 (26.77)
39.1325 (37.49)
0.0000 Average Time to the nearest Hospital
60.7 (43.91)
29.75 (13.38)
126.71 (79.41)
119.55 (69.62)
84.1775 (70.27) 0.0000
Average Time to the nearest Traditional Birth attendants (BBA)
30.19 (18.08)
28.02 (31.97)
35.07 (40.30)
25.60 (38.30)
30.29 (34.78)
0.4022 Average monthly HH income
47142.85 (54329.68)
72828.57 (89410.65)
28025.64 (45796.16)
29337.50(36476.79)
43392 (61053.94) 0.0042
Average Cost to the nearest Hospital
576.25 (172.28)
1757.14 (1995.26)
1732.72 (625.40)
4733.33 (8438.81)
1953.60 (4385.16) 0.0000
Average knowledge to danger signs
3.62 (3.3175)
4.76 (2.5825)
5.33 (3.3577)
6.26 (3.3923)
4.99 (3.3098) 0.0000

45
Socio-demographic Status.
The table above show that the mean age of the participants/maternal interviewed was
between 29 and 32.6 and a total mean age in a district was 31.3 years with Std.
Dev.7.49. While their minimum age is 19 years and the maximum age is 49 years.
However, it found that women in Pakati and Busokelo divisions had higher mean age
of 32.30 and 32.60 compared to Ukukwe and Tukuyu Urban which were 31.72 and
28.97 respectively (p-value 0.0021).
Also it found that the mean years continuously living in the village were between
10.07 and 21.15 years. A total participant’s mean year continuously living in a village
was 16.89 years with Std Dev. 12.6335. While the minimum year continuously living
in a village was 1 year (per inclusion criteria) and the maximum year continuously
living in a village was 49. Busokelo and Pakati had more participants with fairly more
years living in the village than in Ukukwe and Tukuyu urban divisions (P-value
0.0000), this simply because most women in Tukuyu were either employees or in
business, hence migrant.
Also the table shows that a total mean household income was Tsh. 43, 392.62 with
Std. Dev. 61053. While their minimum household income was Tsh.2000.00 and
maximum household income was Tsh.400,000.00. By divisions it found that there
were significant differences between the sites in terms of household income. Women
in Busokelo and Pakati were the poorest in a district as they had the lowest household
income i.e. Tsh.29,337.50 and Tsh.28,025.64 respectively compared to Tukuyu Urban
and Ukukwe who had higher household income i.e.Tsh.72,828.57 and Tsh.47,142.85
respectively (p-value = 0.0042).
Average Cost during last delivery
2479.80 (7142.11)
1080.00 (4325.59)
282.00 (997.92)
10209.60 (32168.76)
3581.65 (17074.49) 0.0001

46
Also the table shows that the mean of knowledge to danger signs was 5 with Std. Dev.
3.3098. By division it found that Busokelo division had higher mean (6.26) of
knowledge of danger signs than other divisions and Ukukwe division have the lowest
mean (3.62) of knowledge of danger signs than other divisions (p-value=0.000).
Also the table above and Figure 3 below show that there were significant differences
(p-value=0.000) between the sites in term of mean time needed to reach the nearest
clinic such as 28.18 minutes in Tukuyu, 28.63 minutes in Ukukwe, and 33.46 minutes
in Busokelo. However, women in Pakati division had longer mean time (66.2
minutes) to reach the nearest clinic than the other divisions. This was because women
in Pakati lived longer distance away from the health facilities/clinics. In the district,
the total average time to the nearest clinic was 39.1325 minutes with Std Dev.
37.4937. While the minimum time to the nearest clinic was 2.0 minutes and the
maximum time was 240.0 minutes.
Also the above table and Figure 3 show that the time needed to reach the nearest
Hospital was high in the district. As a total average time to get to the nearest Hospital
was 84.177 minutes, Std. Dev. was 70. While the minimum time to get to the nearest
Hospital was 3.00 minutes and the maximum time was 360.00 minutes. By division,
there were significant differences (p-value=0.000) between the sites in terms of the
mean time needed to reach the nearest Hospital. Women in Pakati had longer mean
time (126.71 minutes) to reach the nearest hospital followed by Busokelo (119.55
minutes) than in Ukukwe (60.7 minutes) and in Tukuyu Urban had the lowest mean
time (29.75 minutes) to the nearest hospital. This was because women in Pakati and
Busokelo were lived substantially longer distances away from the nearest Hospital.
Also it was found that there were no significant difference (p-value=0.4022) between
the sites in term of mean time needed to reach the nearest traditional birth attendant

47
i.e. they were between 25.60 and 35.07. The total mean time needed to reach a
traditional birth attendant was 30.29 minutes with Std. Dev.34.78.
Also the table shows that the mean cost to the nearest hospital was Tsh.1953.00 with
Std Dev. 4385.1625. While the minimum cost to the nearest hospital was Tsh. 100.00
and the maximum cost to the nearest hospital was Tsh.30, 000.00. By division it
shows that the mean cost to the nearest hospital was fairly higher i.e. Tsh. 4733.33 in
Busokelo division possibly due to long distance to the nearest hospital compared to
the less mean cost in Pakati (Tsh.1732.72) and Tukuyu Urban (Tsh.1757.14) and least
Tsh. 576.25 in Ukukwe as possibly they were living fairly near to the nearest hospital
with Std. Dev. 8438.817, 625.404, 1995.26, 172.28 respectively and P-Value 0.0000
which statistically was significant.
There were significant difference (p-value=0.0001) in terms of cost during last
delivery by division i.e. they were between Tsh. 282.00 and Tsh. 10209.60. Women in
Pakati had the lowest mean cost during the last delivery which was Tsh. 282.00; this
was because most of women delivered at home. However, in Tukuyu was Tsh.
1080.00, because they lived short distance from the health facilities, while in Ukukwe
was Tsh. 2479.80 and in Busokelo was Tsh. 10209.60 because they lived significantly
long distance from the health facilities. A total mean cost during the last delivery was
Tsh. 3581.65 with Std Dev. 17074.49.

48
0
20
40
60
80
100
120
140
Mea
n tim
e (m
inut
es)
Average time to clinic Average time to hospital
Ukukw e Tukuyu Pakati Busokelo
Figure 3: Comparing Average Travel Times to the Nearest Clinic and Hospital
from the Four Divisions
Table 6: Comparing the gestational age when started to attend ANC by sites.
Division 1-4 months 5-8 months Total Ukukwe 44(44.4) 55(55.6) 99 Tukuyu 44(44.9) 54(55.1) 98 Pakati 49(49.0) 51(51.0) 100 Busokelo 47(47.5) 52(52.5) 99 Total 184(46.5) 212(53.5) 396
The table above show that most pregnant women 212 (53.5%) started to attend
Antenatal clinic at 5-8 months old of pregnancy and only 184 (46.5%) of pregnant
women started to attend antenatal clinic at 0-4 months old of pregnancy.

49
2.0 OBJECTIVE 1:
SOCIODEMOGRAPHIC, CULTURAL AND KNOWLEDGE FACTORS
Table 7A: Comparison of total deliveries by sites and place of delivery (in
Hospital, Clinic, Home and BBAs) during last delivery
Place of Delivery Ukukwe Tukuyu Pakati Busokelo Total
1. Hospital 36(36.0) 81(81.0) 25(25.0) 32(32.0) 174(43.5)2. Clinic 26(26.0) 4(4.0) 13(13.0) 38(38.0) 81(20.3) 3. Home with TBAs 7(7.0) 3(3.0) 17(17.0) 6(6.0) 33(8.3) 4. Home without TBAs 30(30.0) 10(10.0) 43(43.0) 24(24.0) 107(26.8)5. Birth Before Arrival. 1(1.0) 2(2.0) 2(2.0) 0(0) 5(1.25) Total 100(100) 100(100) 100(100) 100(100) 400(100)
The table above shows that there were different number of deliveries in clinics i.e.
they were between 4.0% and 38.0%. Many of women who gave birth at clinic were
mainly from Busokelo (38.0%) as they lived far away from hospital, followed by
Ukukwe (26.0%), Pakati (13.0%) where also women lived far away from hospital.
However, Tukuyu had the lowest number of deliveries during last deliveries in clinics
with only 4.0%. This was simply because in Tukuyu women prefer to deliver in
Hospital than in clinics as they live closer to hospital than to clinics compared to than
other divisions.
Also, there were significant difference (p-value =0.0000) across all divisions in terms
of total number of deliveries during the last delivery in Hospital i.e. were between
25.0% and 81.0%. Pakati and Busokelo had the lowest total number of deliveries in
hospital during last delivery i.e. 25.0% and 32.0% respectively compared to Ukukwe
and Tukuyu i.e. 36.0% and 81.0% respectively. During last delivery, many women
who delivered at home with the assistance of TBAs and without the assistance of
TBAs were from Pakati 60 (60.0%) and Ukukwe 37 (37.0%) divisions compared to

50
Busokelo 30 (30.0%) and Tukuyu 13 (13.0%) divisions. And 36.4% of the total
numbers of home deliveries 8.3% were assisted by TBAs.
Table7B: Comparison of participant’s attendance to antenatal clinic (ANC) in all
pregnancies by Division.
The table above shows that there were good attendance for antenatal care clinic in all
pregnancies and in all divisions
Division 1st 2nd 3rd 4th 5th 6th 7th 8th Total 1.UKUKWE N 97 85 64 46 22 11 7 2 334 % 97.0 98.8 95.5 100.0 100.0 100.0 100.0 66.7 2.TUKUYU MJINI (URBAN N 96 69 42 29 15 6 2 1 260 % 96.0 98.6 97.7 100.0 100.0 100.0 100.0 100.0 3.PAKATI N 99 90 76 52 28 16 5 3 369 % 99.0 98.9 100.0 98.1 96.6 100.0 100.0 100.0 4.BUSOKELO N 100 91 76 55 38 22 9 7 398 % 100.0 98.9 100.0 100.0 100.0 100.0 90.0 100.0 Total N 392 335 258 182 103 55 23 13 1361 % 98.0 98.8 98.5 99.5 99.0 100.0 95.8 92.9

51
Table 8 Comparing Socioeconomic and Cultural Variables by Place of Delivery
Socio Economic Variables
Facility Birth Before Arrival (BBAs) # (%)
Clinic # (%)
Home Delivery with TBAs # (%)
Home Delivery Without TBAs # (%)
Hospital # (%)
Total # (%)
p-value
Ethinic Group(Tribe) Nyakyusa 5 (100.0) 77 (95.1)
27 (81.8)
102 (95.3)
135 (77.6)
346 (86.5)
0.8997
Others 0 (0.0) 4 (4.9) 6 (18.2)
5 (4.7) 39 (22.4) 54 (13.5)
Total
51.3
8120.3
338.3
10726.8
174 (43.5)
400 (100.0)
Type of Religion
Christian 4 (80.0) 79 (97.5)
32 (97.0)
105 (98.1)
165 (94.8)
385 (96.3)
0.0000
Muslim 0 (0.0) 2 (2.5) 0 (0.0) 1 (0.9) 9 (5.2) 12 (3.0) Pagan 1 (20.0) 0 (0.0) 1 (3.0) 1 (0.9) 0 (0.0) 3 (0.8)
Total
5(1.3)
81 (20.3)
33 (8.3)
107 (26.8)
174 (43.5 0)
400 (100.0)
Does the Traditions/Customs/Religion/C
ulture prevent women from delivering at health facility?
No 5 (1.3) 80 (20.4)
33 (8.4)
105 (26.7)
170 (43.3)
393 (100.0)
Pvalu0.0000e
Yes 0 (0.0) 0 (0.0) 0 (0.0) 0 (0.0) 0 (0.0) 0 (0.0)
Total
5 (1.3) 80 (20.4)
33 (8.4)
105 (26.7)
170 (43.3)
393 (100.0)
Education No formal schooling
1 (20.0)
2 (2.5)
1 (3.0)
5 (4.7)
1 (0.6)
10(2.5)
0.0271
Primary School 4 (80.0)
78 (96.3)
32 (97.0)
100(93.5)
158 (90.8)
372(93.0)
Secondary School 0 (0.0)
1 (1.2)
0 (0.0)
2 (1.9)
14 (8.0)
17(4.3)
Technical/Vocational
0(0.0)
0 (0.0)
0 (0.0)
0 (0.0)
1 (0.6)
1 (0.3)
Total
5(1.3)
81 (20.3)
33 (8.3)
107 (26.8)
174 (43.5)
400 (100.0)
Marital Status
Divorced/Separated
0 (0.0)
4 (4.9)
0 (0.0)
8 (7.5)
11 (6.3)
23 (5.8)
0.9155
Married – Monogamuous Relationship
5(100.0)
65(80.2)
26 (78.8)
79 (73.8)
130 (74.7)
305(76.3)
Married – polygamous Relationship
0 (0.0)
4(4.9)
4 (12.1)
8 (7.5)
11 (6.3)
27 (6.8)
Single --Never Married
0 (0.0)
2 (2.5)
2 (6.1)
5 (4.7)
11 (6.3)
20(5.0)
Widowed 0(0.0)
6 (7.4)
1 (3.0)
7 (6.5)
11 (6.3)
25 (6.3)
Total
5 (1.3)
81 (20.3)
33 (8.3)
107 (26.8)
174 (43.5)
400100.0
Type of water Source
Borehole/well 1 (20.0)
21 (25.9)
15 (45.5)
48 (44.9)
36 20.7
12130.3
0.0000
Piped – Inside house
0 (0.0)
3 (3.7)
2 (6.1)
1 (0.9)
22 12.6
287.0
Piped - public 3 (60.0)
34 (42.0)
5 (15.2)
27 (25.2)
66 37.9
13533.8
Piped - Yard 0 (0.0)
10 (12.3)
0 (0.0)
8 (7.5)
33 19.0
5112.8
River/Stream 1 13 11 22 17 64

52
(1.6)
(20.3)
(17.2)
(34.4)
26.6
16.0
Water Tanker 0 (0.0)
0 (0.0)
0 (0.0)
1 (0.9)
0 (0.0)
1 (0.3)
Total
5(1.3)
81(20.3)
33(8.3)
107(26.8)
174 (43.5)
400(100.0)
Type of Toilet used
Flush Toilet 0(0.0)
3 (3.7)
1(3.0)
1(0.9)
17 (9.8)
22 (5.5)
0.0503
Pit Latrine 5 (100.0)
77 (95.1)
32 (97.0)
106 (99.1)
157 (90.2)
377 (94.3)
Ventilated Pit Latrine
0 (0.0)
1 (1.2)
0 (0.0)
0 (0.0)
0 (0.0)
1 (0.3)
Total
5(1.3)
81(20.3)
33(8.3)
107(26.8)
174 (43.5)
400(100.0)
Type of Main fuel used for cooking
Charcoal 2 (40.0)
10 (12.3)
2 (6.1)
7 (6.5)
59 (33.9)
80 (20.0)
0.0000
Electricity 0 (0.0)
1 (1.2)
0 (0.0)
0 (0.0)
6 (3.4)
7 (1.8)
Other 0(0.0)
0(0.0)
0 (0.0)
0 (0.0)
1 (0.6)
1 (0.3)
Wood 3(60.0)
70(86.4)
31 (93.9)
100 (93.5)
108 (62.1)
312(78.0)
Total 5 (1.3)
81(20.3)
33 (8.3)
107(26.8)
174 (43.5)
400(100.0)
Type of House
Bricks 2 (40.0)
48 (59.3)
21 (63.6)
58 (54.2)
130 (74.7)
259 (64.8)
Pvalue0.0385
Mud 3 (60.0)
30 (37.0)
11 (33.3)
45 (42.1)
42 (24.1)
131 (32.8)
Wood 0 (0.0)
3 (3.7)
1 (3.0)
4 (3.7)
2 (1.1)
10 (2.5)
Total 5 (1.3)
81 (20.3)
33 (8.3)
107 (26.8)
174 (43.5)
400 (100.0)
Source of Income
Currently Employed
No 5 (100.0)
71 (87.7)
32 (97.0)
104 (97.2)
145 (83.3)
357(89.3)
0.0027
Yes
0(0.0)
10 (12.3)
1 (3.0)
3 (2.8)
29 (16.7)
43 (10.8)
Total
5 (1.3)
81 (20.3)
33 (8.3)
107 (26.8)
174 (43.5)
400 (100.0)
Source of Income
Regular Employment
Yes
0 (0.0)
8 (9.9)
0 (0.0)
1 (0.9)
30 (17.2)
39(9.8)
0.0001
No 5100.0
7390.1
33100.0
10699.1
144 82.8
36190.3
Total
5 (1.3)
81 (20.3)
33 (8.3)
107 (26.8)
174 (43.5)
400 (100.0)
Source of Income
Irregular Employment
Yes
0 (0.0)
2 (2.5)
1 (3.0)
1 (0.9)
3 (1.7)
7(1.8)
0.9003
No 5 (100.0)
79 (97.5)
32 (97.0)
106 (99.1)
171 (98.3)
393(98.3)
Total
5 (1.3)
81 (20.3)
33 (8.3)
107 (26.8)
174 (43.5)
400 (100.0)
Source of Income
Home Employment
Yes
5 (100.0)
76 (93.8)
32 (97.0)
105(98.1)
148 (85.1)
366(91.5)
0.0015
No 0(0.0)
5 (6.2)
1 (3.0)
2 (1.9)
26 (14.9)
34 (8.5)
Total 5 (1.3)
81 (20.3)
33 (8.3)
107 (26.8)
174 (43.5)
400 (100.0)
Zeros for other sources of income (contibutions from others, state pension/grant)

53
COMPARING SOCIOECONOMIC AND CULTURAL VARIABLES BY
PLACE OF DELIVERY:
The table above shows that the Nyakyusa tribe was a predominant ethnic group which
also was leading to baby delivery at home compared to other ethnic groups with P-
value 0.0012. Also it found that the Christians were the leading religious group
compared to others (Muslims and Pagans) in the district. Although the Muslims were
fewer in the district; however they were leading to deliver in health facilities/hospital
compared to the Christians with P-value 0.0002 which statistically was significant.
Also the results show that a traditions/customs/culture variable does not have any
influence to decision making for place of delivery.
Also the table shows that home delivery was higher in those households which have
significantly lower or poorer socioeconomic status than those households which have
good resources of socioeconomic status. i.e. especially to those households who were
getting water from borehole/well or stream compared to those whose source of water
was Piped -Public, Piped -yard or inside house, P-value 0.0001 which statistically was
significant. The same findings seemed to those households who used wood as a main
source of fuel compared to those households who used charcoal and electricity as a
main source of fuel P-value 0.0000 which statistically was significant. Although, the
rest of the socioeconomic variables (type of toilet, type of house, marital status,) did
not have significant statistical p-value (i.e. p-values were more than 0.05). The same
to source of income: it found that home delivery was higher to those women who
were not currently employed, without any regular employment, with no irregular
employment and with home employment, compared to those households with
someone employed. Also to those women with primary school, technical/vocational

54
level and no formal schooling compared to those households with someone had
education level of secondary school.
Table 9: Mean and Standard Deviation of Socio-demographic variables and
Knowledge by Place of Delivery
Socio-
demographic Variable
Birth Before Arriva
l (BBA)
Mean (SD)
Home with TBAs Mean (SD)
Home without TBAs Mean (SD)
Clinics Mean (SD)
Hospitals Mean (SD)
P-Value
Maternal Age
23.20 (3.83)
32.22 (8.45)
31.40 (7.56)
30.88 (6.60)
31.41 (7.46) 0.1255
Years living in District
9.60 (9.50)
19.08
(13.91)16.76
(11.98)18.21
(12.15)14.29
(12.54) 0.067Number of eligible women in a household
1.00 (0.00)
1.05
(0.44) 1.10
(0.50) 1.10
(0.38) 1.11
(0.44) 0.89
Average Knowledge to Danger Signs
3.400 (2.07)
5.0303 (3.34)
5.56 (2.24)
5.11 (3.93)
5.24 (3.03)
0.039
Average number of danger signs known by woman
3.4 (2.07)
5.0 (3.3) 4.5
(2.2) 5.1
(3.9) 5.2
(3.0) 0.3979

55
COMPARISON OF MEAN SOCIODEMOGRAPHIC VARIABLES AND
KNOWLEDGE BY PLACE OF DELIVERY.
The table above shows that maternal mean age was higher (31.40-32.22) for those
who delivered at Home compared to those who delivered at health facilities (30.88-
31.41)-(hospital and clinics) and Birth Before arrival (23.20) (p-value 0.039 which
statistically was significant).
Also the results show that the mean years continuously living in a village was slightly
higher for those who delivered at home with TBAs and Clinics (19.08 and 18.21
respectively) compared to those who delivered at home without TBAs and at Hospital
and Birth before Arrival (BBAs) (16.76 and 14.29 and 9.60 respectively) but this
difference was P-value 0.067 which statistically was not significant.
Also the result shows that mean number of eligible woman in a household was one (1)
to every place of delivery and P-value 0.89 which statistically was not significant.
Also the table shows that there were significant difference across all places of delivery
in terms of average number of the knowledge to danger signs known by woman i.e.
were between 3.4 (for BBAs) and 5.5 (for those who delivered at home and health
facilities) however the p-value 0.39 was not statistically significant.

56
Table 10: Danger Signs known by women
DANGER SIGNS
Spontaneous Prompted Total
Previous bad obstetric history / abdominal scars / previous stillbirth 15(3.7) 0(0)
15
(3.7%)
Hypertension / high blood pressure 58(14.5) 86(21.5) 144
(36.0%)
severe headaches 22(5.5) 82(20.5) 104
(26.0%)
Swelling of face, hands, feet or legs 99(24.7) 124(31) 223
(55.75%)
fits/seizures 11(2.75) 59(14.75) 70
(17.5%) loss of consciousness 9(2.25) 5(1.25) 14(3.5%)
Anaemia 60(15) 111(27.75)
171
(42.75%)
pallor/pale 0(0) 1(0.25) 1
(0.25%) Severe fatigue/exhaustion/unable to do normal daily chores 30(7.5) 77(19.25)
107 (26.75%)
Breathlessness/problems breathing/short of breath 30(7.5) 77(19.25)
107 (26.75%)
cessation of fetal movement / baby does not move 12(3) 11(2.75)
23 (5.75%)
abnormal lie / position of foetus /breech (bottom or legs first) 12(3) 13(3.25)
25
(6.25%)
sepsis / infection 42(10.5) 19(4.75) 61
(15.25%)
Fever 55(13.75) 27(6.75) 82
(20.50%) cough that lasts several weeks or more 82(20.5) 112(28)
194 (48.50%)
loose stools (diarrhoea) that last several weeks or more 2(0.5) 3(0.75)
5 (1.25%)
foul smelling discharge from vagina (birth canal) 2(0.5) 0(0)
2 (0.50%)
loss of weight 7(1.75) 20(5) 27
(6.75%)
Bleeding/ haemorrhage 4(1) 89(22.25) 93
(23.25%)
Multiple pregnancy / large abdomen 83(20.75) 129(32.25)
212
(53.00%)
The result above show that 223(55.75%) of women interviewed knew that swelling of
face, hands, feet or legs were danger signs; followed by 212 (53.00%) of women
interviewed knew that multiple pregnancy/large abdomen was a danger sign; 194
(48.50%) knew that cough that lasts several weeks or more was a danger sign; 171
(42.75%) knew that anaemia was a danger sign; 144 (36.00%) of women knew that
hypertension/high blood pressure was a danger sign and lastly only 107 (26.75%)
knew that severe fatigue/exhaustion/unable to do normal daily chores and
breathlessness/problems breathing/short of breath were danger signs; 104(26.00%)

57
knew that severe headache was danger sign; 97 (24.25%) knew other factors were
danger signs; 93(23.25%) knew that bleeding/haemorrhage was a danger sign;
82(20.50%) knew that fever was a danger sign and for less than 20% knew the rest
danger signs. However, 41.25% of women did not know any kind of danger signs.
Table 11A: Distribution of source of information about health the mother learns
during Pregnancy.
SOURCE OF HEALTH INFORMATION.
The result above show that 98.25% of women interviewed get information about
health mostly through health care provider at clinic; followed by 44.25% through
N (%)
Health care provider at Clinic or Hospital 393(98.25)Community Health Worker 99(24.75) Family members 17(4.25) Husband 5(29.41) Mother 12(70.59) Friends 26(6.5) Traditional Healers 11(2.75) Church/Other community leaders 177(44.25) Radio 142(35.50) Television 34(8.50) Newspaper 20(5.00)
Other sources of info 55(13.75)

58
church and community leaders; then 35.50% through radio; 24.75% through
community health workers; 13.75% through other means and lastly 8.50% through
television, 5.00% through newspapers, 4.25% through family members and 2.75%
through traditional healers.
Table 11 B: Distribution of the Best source of information or Advice for Making
Decisions about Health.
Best Source of information Total 1. Health Workers 353 95.41%2.Commnuity Health Worker 3 0.81% 4. Friends 1 0.27%6. Church or Other Co 5 1.35% 7. Radio specify 4 1.08% 8.Television, specify 2 0.54% 9. Newspaper or Magazines 2 0.54% Total 370
BEST SOURCE OF HEALTH INFORMATION FOR MAKING DECISION.
The table above show that 353 (95.41%) of women interviewed used health workers
as the best source of information or advice for making decisions, followed by
5(1.35%)of women used church or other community leaders; 4(1.08%) of women
used radio, and the rest less than one per cent of women used other sources
(community health worker, television, newspaper or magazine and friends) as the best
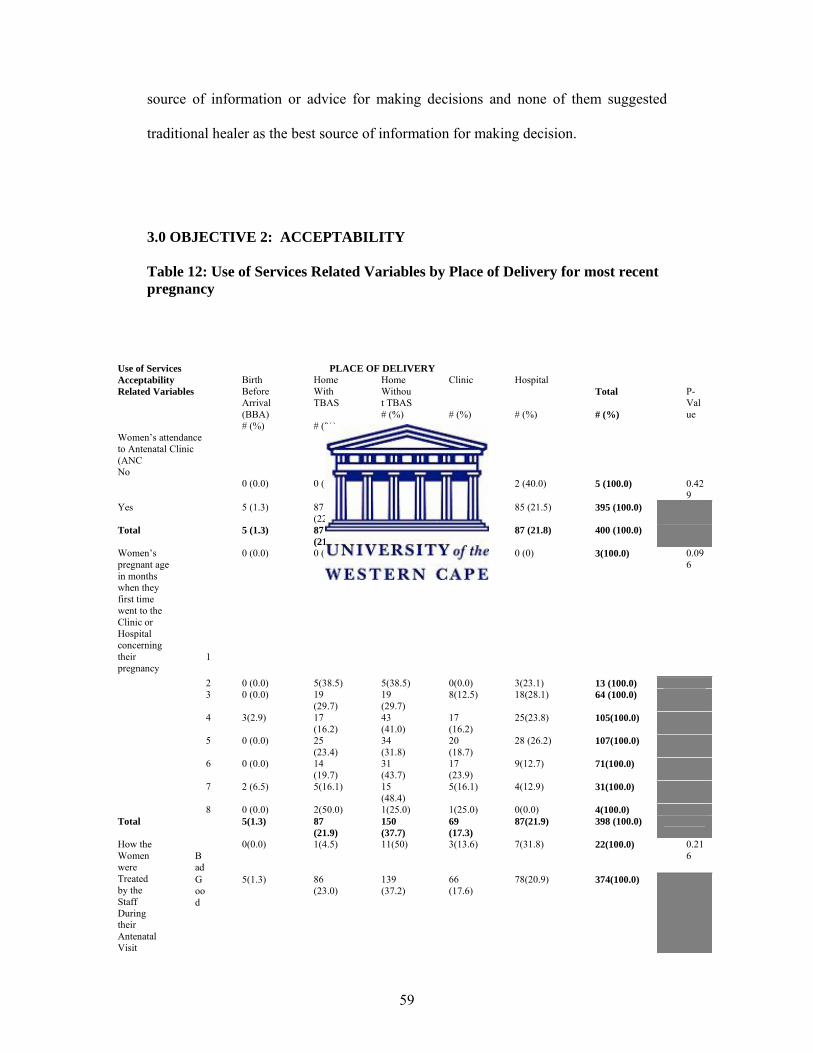
59
source of information or advice for making decisions and none of them suggested
traditional healer as the best source of information for making decision.
3.0 OBJECTIVE 2: ACCEPTABILITY
Table 12: Use of Services Related Variables by Place of Delivery for most recent pregnancy
Use of Services Acceptability Related Variables
PLACE OF DELIVERY Total # (%)
P-Value
Birth Before Arrival (BBA) # (%)
Home With TBAS # (%)
Home Without TBAS # (%)
Clinic # (%)
Hospital # (%)
Women’s attendance to Antenatal Clinic (ANC
0 (0.0)
0 (0.0)
1 (20.0)
2(40.0)
2 (40.0)
5 (100.0)
0.429
No
Yes 5 (1.3) 87 (22.0)
150 (38.0)
68 (17.2)
85 (21.5) 395 (100.0)
Total 5 (1.3) 87 (21.8)
151 (37.8)
70 (17.5)
87 (21.8) 400 (100.0)
Women’s pregnant age in months when they first time went to the Clinic or Hospital concerning their pregnancy
1
0 (0.0) 0 (0.0) 2(66.7) 1 (33.3)
0 (0) 3(100.0) 0.096
2 0 (0.0) 5(38.5) 5(38.5) 0(0.0) 3(23.1) 13 (100.0) 3 0 (0.0) 19
(29.7) 19 (29.7)
8(12.5) 18(28.1) 64 (100.0)
4 3(2.9) 17 (16.2)
43 (41.0)
17 (16.2)
25(23.8) 105(100.0)
5 0 (0.0) 25 (23.4)
34 (31.8)
20 (18.7)
28 (26.2) 107(100.0)
6 0 (0.0) 14 (19.7)
31 (43.7)
17 (23.9)
9(12.7) 71(100.0)
7 2 (6.5) 5(16.1) 15 (48.4)
5(16.1) 4(12.9) 31(100.0)
8 0 (0.0) 2(50.0) 1(25.0) 1(25.0) 0(0.0) 4(100.0) Total 5(1.3) 87
(21.9) 150 (37.7)
69 (17.3)
87(21.9) 398 (100.0)
How the Women were Treated by the Staff During their Antenatal Visit
Bad
0(0.0) 1(4.5) 11(50) 3(13.6) 7(31.8) 22(100.0) 0.216
Good
5(1.3) 86 (23.0)
139 (37.2)
66 (17.6)
78(20.9) 374(100.0)

60
Total 5(1.3) 87 (22.0)
150 (37.9)
69 (17.4)
85(21.5) 396(100.0)
Did any of their family or friends Stay in the room with them throughout their labour and Birth?
No
3(1.1) 60 (21.4)
66 (23.6)
65 (23.2)
86(30.7) 280(100.0) 0.0000
Yes
2(1.7) 27 (22.5)
85 (70.8)
5(4.2) 1(0.8) 120(100.0)
Total 5(1.3) 87 (21.8)
151 (37.8)
70 (17.5)
87(21.8) 400(100.0)
Did the women like having their family/friend (s) with them during labour or Birth?
No
2(4.1) 13 (26.5)
31 (63.3)
2(4.1) 1(2.0 49(100.0) 0.269
Yes
0(0.0) 24 (29.3)
54 (65.9)
4(4.9) 0(0.0) 82(100.0)
Total 2(1.5) 37 (28.2)
85 (64.9)
6(4.6) 1(0.8) 131(100.0)
Did the Women have any problems getting to the Hospital or Clinic or TBAs in Labour?
No
0(0.0) 40 (20.2)
21 (10.6)
56 (28.3)
81(40.9) 198(100.0) 0.0000
Yes
5(2.5) 47 (23.3)
130 (64.4)
14(6.9) 6(3.0) 202(100.0)
Total 5(1.3) 87 (21.8)
151 (37.8)
70 (17.5)
87(21.8) 400(100.0)
How the women were treated by the Health staff/TBAs/Home during the delivery
Bad
3(1.8) 6(3.6) 144 (87.3)
7(4.2) 5(3.0) 165(100.0) 0.0000
Good
2(09) 81 (34.5)
7(3.0) 63 (26.8)
82 (34.9) 235(100.0)
Totals 5(1.3) 87 (21.8)
152 (37.8)
70 (17.5)
87(21.8) 400 (100.0)
How would the Women rate the Labour and Birth services they received?
Average
1(0.7) 43 (31.2)
31 (22.5)
28 (20.3)
35(25.4) 138(100.0) 0.0000
Excellent
0(0.0) 34 (23.4)
28 (19.3)
35 (24.1)
48 (33.1) 145(100.0)
Poor
4(3.4) 10(8.5) 92 (78.6)
7(6.0) 4(3.4) 117(100.0)
Totals 5(1.3) 87 (21.8)
152 (37.8)
70 (17.5)
87(21.8) 400(100.0)
Would the women recommend the labour and birth
No
5(3.5) 26 (18.3)
108 (76.1)
2(1.4) 1(0.7) 141(100.0) 0.0000
Yes
0 (0.0) 61 (23.6)
43 (16.7)
68 (26.4)
86(33.3) 258(100.0)

61
The results above show that there were good attendance to antenatal care 395
(98.75%) across all divisions in the district. However, despite good attendance to
antenatal clinic (ANC) home delivery was higher (home delivery with TBAs and
without TBAs 22.00% and 38.0% respectively) than health facility deliveries (Clinic-
17.2% and Hospital-21.5%) and P-value 0.429 which statistically was not significant.
Also the results show that baby delivery at home is still high among all women
interviewed regardless what age of pregnancy at first time a woman started to attend
antenatal clinic (ANC) (p-value 0.096 which statistically was not significant).
Also the result show that baby delivery at home 12 (54.50%) was high among those
women who were treated badly by health staff during their antenatal visit than health
facility deliveries 10(45.40%). However, baby delivery at home 225 (60.2%) was also
high among those women who were treated well by health staff, p-value 0.216 which
statistically was not significant.
The results show that health facility delivery (clinic and hospital) 151(53.9%) was
higher among those women whose family and friends did not stay with the women
throughout their labour and birth than baby deliveries at home 126 (45.0%). Also it
was found that baby delivery at home 112 (93.30%) was higher among those women
whose family and friends stayed with women throughout their labour and birth than
health facility deliveries 6(5.00%) with p-value 0.0000 which statistically was
significant.
services to Other Women? Totals 5 (1.3) 87
(21.8) 152 (37.8)
70 (17.5)
87(21.8) 400(100.0)
Totals

62
Also the results show that baby delivery at home was high 78(95.2%) among those
women interviewed who would like having their family/friends during their labour or
birth. However, also baby delivery at home was high 44(89.8%) among women who
would not like having family/friends during their labour or birth, with p-value 0.269
which statistically was not significant
The results also show that baby delivery at home 177 (87.7%) was higher than health
facilities deliveries 20 (9.9%) among those women interviewed who had problems
getting to the hospital or clinics or TBAs. And it found that health facility delivery
was higher 137 (69.2%) than home delivery 61(30.8%) among those women who had
no problems getting to the hospital or clinics with p-value 0.0000 which statistically
was significant.
Also the results show that baby delivery at home 150 (90.9%) was higher than health
facility delivery 12(7.2%) among those women interviewed who were treated badly
by health staff during their delivery. And it found that health facility delivery
145(61.7%) was higher than home delivery 88 (37.5%) among those women who
were treated well by health staff during their delivery with p-value 0.0000 which
statistically was significant.
Also the results show that baby delivery at home 74 (53.7%) was higher than health
facility delivery 63(55.7%) among those women interviewed who would rate the
received labour and birth service were average. And 102 (87.1%) and 11(9.4%) home
and health facility deliveries respectively for those women who would rate the
received labour and birth were poor. And also, it found that health facility delivery
83(57.2%) was higher than home delivery 62(42.7%) among those women who would
rate the received labour and birth services were excellent with p-value 0.0000 which
statistically was significant.

63
Also the results show baby delivery at home 134(94.4%) was higher than health
facility delivery 3(2.1%) among those women who would not recommend the labour
and birth services to other women. And it found that health facility delivery 154
(59.7%) was higher than baby home delivery 104 (40.3%) among those women who
would recommend the labour and birth services to other women with p-value 0.0000
which statistically was significant.
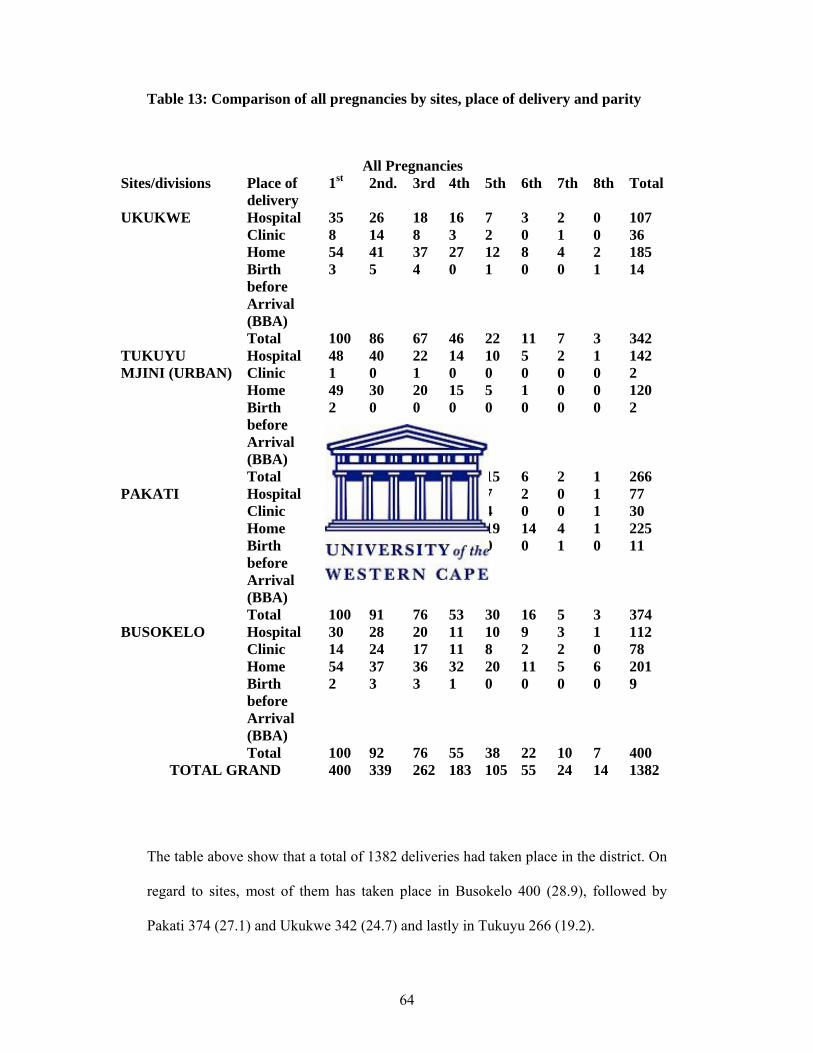
64
Table 13: Comparison of all pregnancies by sites, place of delivery and parity
The table above show that a total of 1382 deliveries had taken place in the district. On
regard to sites, most of them has taken place in Busokelo 400 (28.9), followed by
Pakati 374 (27.1) and Ukukwe 342 (24.7) and lastly in Tukuyu 266 (19.2).
All Pregnancies Sites/divisions Place of
delivery 1st 2nd. 3rd 4th 5th 6th 7th 8th Total
UKUKWE Hospital 35 26 18 16 7 3 2 0 107 Clinic 8 14 8 3 2 0 1 0 36 Home 54 41 37 27 12 8 4 2 185 Birth before Arrival (BBA)
3 5 4 0 1 0 0 1 14
Total 100 86 67 46 22 11 7 3 342 TUKUYU MJINI (URBAN)
Hospital 48 40 22 14 10 5 2 1 142 Clinic 1 0 1 0 0 0 0 0 2 Home 49 30 20 15 5 1 0 0 120 Birth before Arrival (BBA)
2 0 0 0 0 0 0 0 2
Total 100 70 43 29 15 6 2 1 266 PAKATI Hospital 21 22 14 10 7 2 0 1 77
Clinic 7 7 6 5 4 0 0 1 30 Home 68 59 54 37 19 14 4 1 225 Birth before Arrival (BBA)
4 3 2 1 0 0 1 0 11
Total 100 91 76 53 30 16 5 3 374 BUSOKELO Hospital 30 28 20 11 10 9 3 1 112
Clinic 14 24 17 11 8 2 2 0 78 Home 54 37 36 32 20 11 5 6 201 Birth before Arrival (BBA)
2 3 3 1 0 0 0 0 9
Total 100 92 76 55 38 22 10 7 400 TOTAL GRAND 400 339 262 183 105 55 24 14 1382
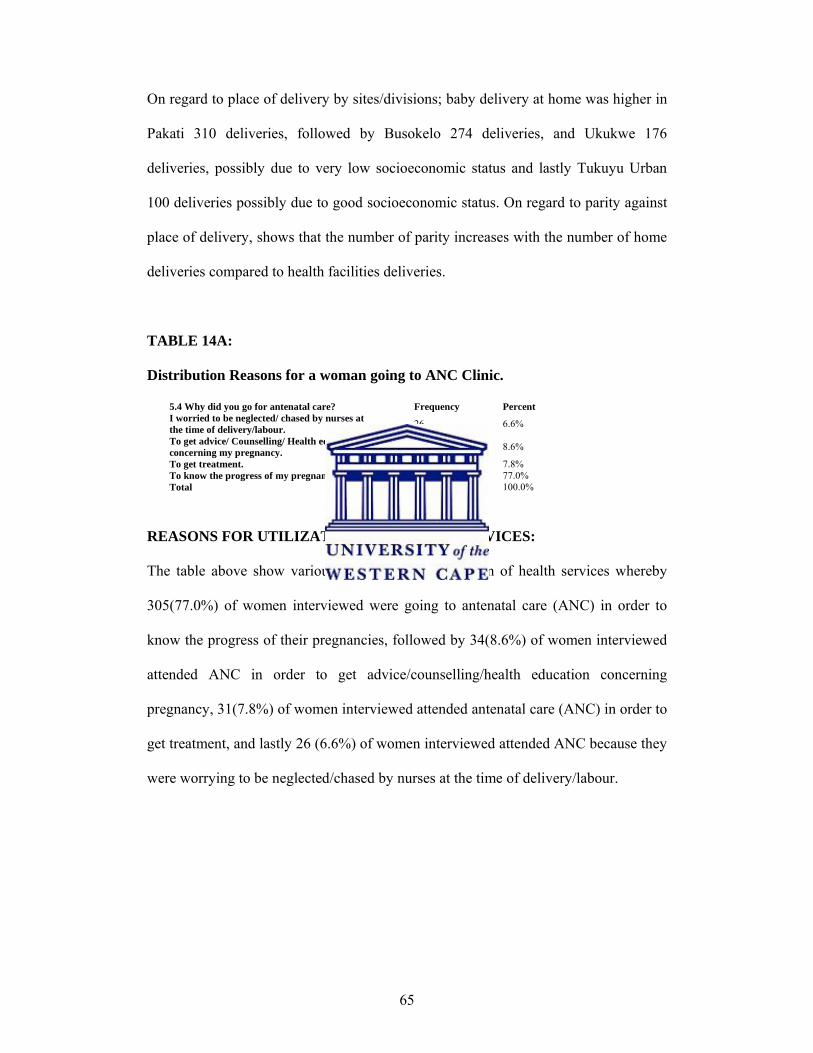
65
On regard to place of delivery by sites/divisions; baby delivery at home was higher in
Pakati 310 deliveries, followed by Busokelo 274 deliveries, and Ukukwe 176
deliveries, possibly due to very low socioeconomic status and lastly Tukuyu Urban
100 deliveries possibly due to good socioeconomic status. On regard to parity against
place of delivery, shows that the number of parity increases with the number of home
deliveries compared to health facilities deliveries.
TABLE 14A:
Distribution Reasons for a woman going to ANC Clinic.
5.4 Why did you go for antenatal care? Frequency PercentI worried to be neglected/ chased by nurses at the time of delivery/labour. 26 6.6%
To get advice/ Counselling/ Health education concerning my pregnancy. 34 8.6%
To get treatment. 31 7.8% To know the progress of my pregnancy. 305 77.0% Total 396 100.0%
REASONS FOR UTILIZATION OF HEALTH SERVICES:
The table above show various reason for the utilization of health services whereby
305(77.0%) of women interviewed were going to antenatal care (ANC) in order to
know the progress of their pregnancies, followed by 34(8.6%) of women interviewed
attended ANC in order to get advice/counselling/health education concerning
pregnancy, 31(7.8%) of women interviewed attended antenatal care (ANC) in order to
get treatment, and lastly 26 (6.6%) of women interviewed attended ANC because they
were worrying to be neglected/chased by nurses at the time of delivery/labour.

66
TABLE 14 B:
Distribution of Reasons for a woman why or why not Recommend the ANC
services to other women
5.13B Why or why not? Frequency Percent Poor services/Nurses are not cooperative/Nurses harass us 10 2.5%
To get advice/ reassurance /counselling /education on pregnancy. 57 14.4%
To get good help/services when you have problems/complications. 125 31.6%
To get treatment 20 5.1% To know the progress of pregnancy. 184 46.5% Total 396 100.0%
REASONS FOR A WOMAN WHY OR WHY NOT RECOMMEND THE ANC
SERVICES TO OTHER WOMEN:
The table above show reasons for a woman why or why not recommend the antenatal
care services to other woman whereby 184(46.5%) of women interviewed explained
that to know the progress of pregnancy was the reason for a woman why recommend
the ANC services to other women, followed by 125(31.6%) of women interviewed
explained that the reason was to get good help/services when you have
problems/complications, 57(14.4%) of women interviewed explained that the reason
was to get advice/reassurance/counselling/ education on pregnancy, 20(5.1%) of
women interviewed explained that the reason was to get treatment and lastly10 (2.5%)
of women interviewed explained that the reason not to recommend was due to poor
services/Nurses were not cooperative/nurses harass women.

67
TABLE 14 C: Distributions of reasons for a woman why or why not recommend
Labour or Birth Service to Other woman.
6.14B Why or Why not? Frequency PercentHome delivery is poor/very dangerous/risk/not safe place/may get complications/ 137 35.2%
Provide good delivery services/handles us properly/ 227 58.4%
There were no medicine/drugs/ 2 0.5% They treat roughly/left me alone/ 6 1.5% To avoid to pay fine/to be punished/ 1 0.3% Traditional Birth Attendant (TBAs) conduct well delivery services like nurses/and cheaper 16 4.1%
Total 389 100.0%
REASONS FOR A WOMAN WHY OR WHY NOT RECOMMEND LABOUR
OR BIRTH SERVICES TO OTHER WOMEN
The table above show reasons for a woman why or why not recommend labour or
birth services to other women whereby 227(58%) of women interviewed explained
that good delivery services/handling women properly in clinics or hospital was the
reason for a woman why they recommended labour or birth service to other woman,
followed by 137 (35.2%) of women explained that baby delivery at home was
poor/very dangerous/risk/not safe place/may get complications was the reason for a
woman; 16(4.1%) of women explained that Traditional Birth Attendants (TBAs)
conducted well delivery services like nurses/and cheaper was the reason for a woman
why not to recommend labour or birth service to other woman; 6(1.5%) of women
explained that they were treated roughly/left alone was the reason for a woman why
not to recommend labour or birth service to other woman; 2 (0.5%) of women
explained that there were no medicine/drugs was the reason for a woman why not to
recommend labour or birth service to other woman, and 1(0.3%) of women explained
that to avoid to pay fine/to be punished was the reason for a woman why or why no
recommend labour or birth service to other woman.
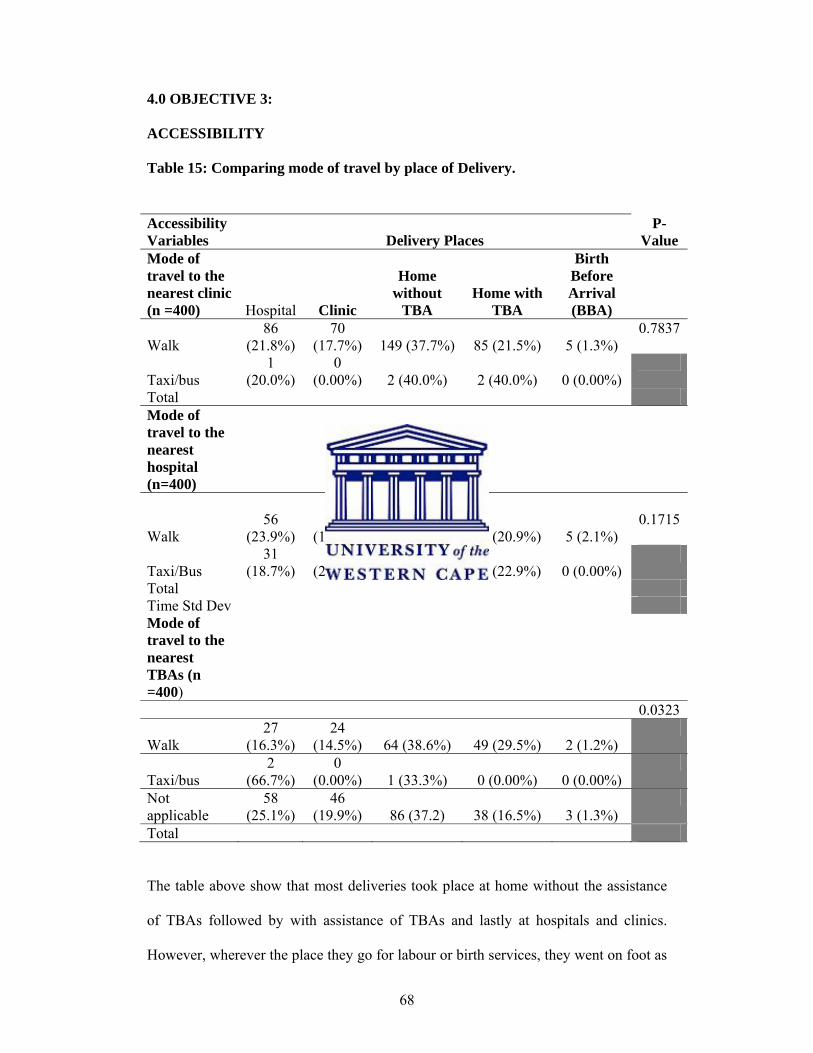
68
4.0 OBJECTIVE 3:
ACCESSIBILITY
Table 15: Comparing mode of travel by place of Delivery.
The table above show that most deliveries took place at home without the assistance
of TBAs followed by with assistance of TBAs and lastly at hospitals and clinics.
However, wherever the place they go for labour or birth services, they went on foot as
Accessibility Variables Delivery Places
P-Value
Mode of travel to the nearest clinic (n =400) Hospital Clinic
Home without
TBA Home with
TBA
Birth Before Arrival (BBA)
Walk 86
(21.8%) 70
(17.7%) 149 (37.7%) 85 (21.5%) 5 (1.3%) 0.7837
Taxi/bus 1
(20.0%) 0
(0.00%) 2 (40.0%) 2 (40.0%) 0 (0.00%)
Total Mode of travel to the nearest hospital (n=400)
Walk 56
(23.9%) 36
(15.4%) 88 (37.6%) 49 (20.9%) 5 (2.1%) 0.1715
Taxi/Bus 31
(18.7%) 34
(20.5%) 63 (38.0%) 38 (22.9%) 0 (0.00%)
Total Time Std Dev Mode of travel to the nearest TBAs (n =400)
0.0323
Walk 27
(16.3%) 24
(14.5%) 64 (38.6%) 49 (29.5%) 2 (1.2%)
Taxi/bus 2
(66.7%) 0
(0.00%) 1 (33.3%) 0 (0.00%) 0 (0.00%)
Not applicable
58 (25.1%)
46 (19.9%) 86 (37.2) 38 (16.5%) 3 (1.3%)
Total

69
the main mode of transport possibly due to lack of money or lack of other means of
transport with p-values greater than 0.005 which statistically were not significant.
Table 16: OBJECTIVE 3. Mean and Standard Deviation of Accessibility related
variables by Delivery Place
Also the table show that mean time to the nearest clinic and hospital was higher for
those who delivered at home compared to those who delivered at health facilities
(clinics and hospital) with P-value 0.0006 and 0.0000, respectively, which statistically
Accessib
ility Variable
Birth Before Arrival (BBA)
Mean (SD)
Home with TBAs Mean (SD)
Home without TBAs Mean (SD)
Clinics Mean (SD)
Hospitals Mean (SD)
P-Value
Average Time to the nearest Clinic
39.00 (20.12)
40.68 (41.66)
47.76 (42.55)
26.00 (23.90)
32.93 (29.11)
0.0006
Average Time to the nearest Hospital
51.00 (41.89)
110.80 (75.82)
90.80 (75.07)
70.85 (56.30)
58.33 (54.50)
0.0000
Average Time to the nearest Traditional Birth attendants (BBA)
10.00 (7.07)
42.28 (40.53)
48.39 (46.95)
33.59 (31.47)
35.82 (31.0)
0.3192
Average Cost to the nearest Clinic
0.00 (0.00)
100.00(0.00)
660.00 (606.63)
100.00 (0.00)
933.33 (1179.62)
0.559
Average Cost to the nearest Hospital
0.00 (0.00)
2588.64 (4832.122
0) 2162.67 (5053.438
0) 1395.00
(2819.52) 1322.22
(3632.24) 0.478
Average Cost to the nearest Traditional Birth Attendants (BBA) 0.00(0.00)
0.00 (0.00)
28.26 (110.88)
0.00 (0.00)
33.33 (121.31)
0.366
Average cost during last delivery
0.00 (0.00)
439.393 (899.28)
28.037 (290.020)
1815.00 (2247.367)
7126.2069 (25331.896)
0.0058

70
was significant. However, the mean time to the nearest Traditional Birth Attendant
(TBAs) for those who delivered at home compared to who delivered at health
facilities was similar (p-value 0.3192).
Also the table shows that the average monthly household (HH) income was slightly
higher (Tsh.60, 477.27 and Tsh. 56,171.43) for those who delivered in health facilities
(clinics and hospital) compared to lower average monthly HH income for those who
delivered at home although the P-value was 0.2433 which statistically was not
significant.
The table shows that the average cost to the nearest clinic for hospital deliveries
(933.33) was higher compared to other deliveries but his difference was not
statistically significant (p-value=0.559)
Also the table shows that the average cost to reach the nearest hospital was higher
(Tsh.2588.64 and Tsh. 2162.67) for those who deliver at home compared to those who
deliver at health facilities (Tsh.1395.00 andTsh.1322.22)-(Clinics and Hospital) but
the p-value was 0.478 which statistically was not significant.
Also the table shows that the average cost to reach the nearest Traditional Birth
Attendant was lower (Tsh.28.26) for those who deliver at home specifically at home
without (TBAs) compared to those who deliver at health facilities (clinics and
hospital) specifically at hospital (Tsh. 33.33) with P-value 0.366 which statistically
was not significant.
Also the table shows that the average cost during last delivery was higher for those
who delivered at health facilities (clinics and hospital Tsh.1815.00 and Tsh.7126.20
respectively) compared to those who delivered at home (home with TBAs and without
TBAs Tsh.439.39 and Tsh.28.03 respectively) with P-value 0.0058 which statistically
was significant.

71
Table 17: Barriers to accessing ANC by Sites/Divisions
Problems attending ANC Accessibility Related Variables Ukukwe Tukuyu Pakati Busokelo Total
P-Value
Problems attending ANC N 43 8 45 14 110
% 43.43 8.16 45 14.14 27.78
0.0000
Money N 35 6 16 8 65
% 35.71 6.12 16 8.08 16.46
0.0000
Transport N 20 7 38 10 75
% 22.22 7.14 38 10.1 19.38
0.0077
Family members or friends N 4 1 3 0 8
% 4.65 1.03 3.03 0 2.1
0.0349
Family responsibilities N 3 1 6 1 11
% 3.53 1.04 6.06 1.01 2.9
0.3905
Work/Employment N 0 0 1 0 1
% 0 0 1.02 0 0.26
0.0000
Health staff treatment… N 4 0 0 1 5
BARRIERS FOR ACCESSING HEALTH SERVICES (ANTENATAL CARE
SERVICES - ANC) BY SITES
The table above show that only 8 (8.16%) of women in Tukuyu had problems
attending ANC compared to other divisions in which 14 (14.14%) of women were
from Busokelo, 43 (43.43%) of women were from Ukukwe and lastly 45 (45%) of
women were from Pakati,. With Pakati and Ukukwe had more problems attending
ANC than other divisions. In terms of types of problems; there were significant
differences between the sites in terms of money problems in which 35 (35.71%) of
women from Ukukwe had more problem of money followed by 16 (16%) of women
from Pakati and 8 (8.08%) of women from Busokelo and lastly 6 (6.12%) of women
were from Tukuyu Urban. Also there were significant differences between the sites in
terms of transport problems in which 20 (22.22%) of women from Ukukwe had more

72
problems with transport followed by 38 (38.00%) of women from Pakati, and 10
(10.1%) of women from Busokelo and lastly 7 (7.14%) of women from Tukuyu. Also
there were significant differences between the sites in terms of health staff treatment
problems whereby 4 (4.0%) of women from Ukukwe had more problem of health
staff treatment followed by 1 (1.0%) of woman from Busokelo and none of any
woman had problem of health staff treatment from Tukuyu and Pakati. withal above
p-values were 0.0000 which statistically was significant.
Also, it found that there were slight differences between the sites in terms of problems
for attending ANC i.e. family members or friends, family responsibilities, and
work/employment problems which were between 4 (4.65%) and 0 (0.0%) for family
members or friends problems, 1 (1.01%) and 6 (6.06%) for family responsibility
problems, and between 0 (0.00%) and 1 (1.02%) for work/employment problem with
p-values (0.0077, 0.0349, and 0.3905 respectively) which statistically were not
significant. However, Pakati had more problems of family responsibilities and work
or employment than other divisions with 6 (6.06%) and 1 (1.01%) respectively and
Ukukwe had more problems of family members or friends compared to other
divisions with 4 (4.65%).
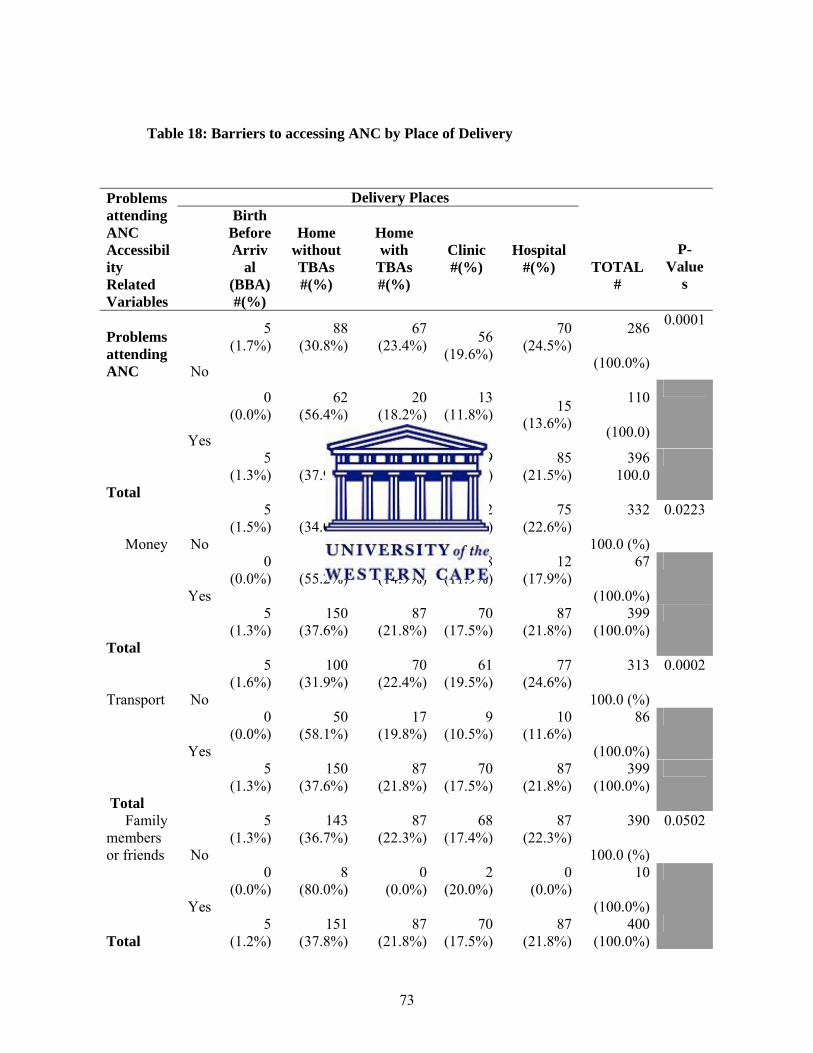
73
Table 18: Barriers to accessing ANC by Place of Delivery
Problems attending ANC Accessibility Related Variables
Delivery Places
TOTAL #
P-Value
s
Birth Before Arriv
al (BBA) #(%)
Home without TBAs #(%)
Home with
TBAs #(%)
Clinic #(%)
Hospital #(%)
Problems attending ANC No
5 (1.7%)
88(30.8%)
67(23.4%) 56
(19.6%)
70 (24.5%)
286
(100.0%)
0.0001
Yes
0 (0.0%)
62(56.4%)
20(18.2%)
13(11.8%)
15
(13.6%)
110
(100.0)
Total
5 (1.3%)
150(37.9%)
87(22.0%)
69(17.4%)
85 (21.5%)
396 100.0
Money No
5 (1.5%)
113(34.0%)
77(23.2%)
62(18.7%)
75 (22.6%)
332
100.0 (%)
0.0223
Yes
0 (0.0%)
37(55.2%)
10(14.9%)
8(11.9%)
12 (17.9%)
67
(100.0%)
Total
5 (1.3%)
150(37.6%)
87(21.8%)
70(17.5%)
87 (21.8%)
399 (100.0%)
Transport No
5 (1.6%)
100(31.9%)
70(22.4%)
61(19.5%)
77 (24.6%)
313
100.0 (%)
0.0002
Yes
0 (0.0%)
50(58.1%)
17(19.8%)
9(10.5%)
10 (11.6%)
86
(100.0%)
Total
5 (1.3%)
150(37.6%)
87(21.8%)
70(17.5%)
87 (21.8%)
399 (100.0%)
Family members or friends No
5 (1.3%)
143(36.7%)
87(22.3%)
68(17.4%)
87 (22.3%)
390
100.0 (%)
0.0502
Yes
0 (0.0%)
8(80.0%)
0(0.0%)
2(20.0%)
0 (0.0%)
10
(100.0%)
Total 5
(1.2%) 151
(37.8%)87
(21.8%)70
(17.5%)87
(21.8%) 400
(100.0%)

74
COMPARISON OF PROBLEMS RELATED VARIABLES AND REASONS
PER PLACE OF DELIVERY
The table above show that there were significant difference in delivery site in terms of
problems for attending antenatal care clinic among women interviewed in the district,
where by 110 (27.7%) of women interviewed had problem for attending antenatal care
(ANC) and 286 (72.2%) of women interviewed did not have problems for attending
antenatal care. P-value 0.0001, with those citing problems attending ANC more likely
to deliver at home without a TBA.
Family responsibilities No
5 (1.3%)
147(37.7%)
84(21.5%)
69(17.7%)
85 (21.8%)
390
100.0 (%)
0.9375
Yes
0 (0.0%)
4(40.0%)
3(30.0%)
1(10.0%)
2 (20.0%)
10
100.0 (%)
Total
5 (1.2%)
151(37.8%)
87(21.8%)
70(17.5%)
87 (21.8%)
400 (100.0%)
Work/Employment No
5 (1.3%)
150(37.6%)
87(21.8%)
70(17.5%)
87 (21.8%)
399 (100.0%)
0.7992
Yes
0 (0.0%)
1 (100.0%)
0(0.0%)
0(0.0%)
0 (0.0%)
1 (100.0%)
Total
5 (1.2%)
151(37.8%)
87(21.8%)
70(17.5%)
87 (21.8%)
400 (100.0%)
Health staff treatment… No
5 1.3
14737.8
8622.1
6717.2
84 21.6
389 100.0
0.7804
Yes
0 (0.0%)
4(36.4%)
1(9.1%)
3(27.3%)
3 (27.3%)
11 (100.0%)
Total
5 (1.2%)
151(37.8%)
87(21.8%)
70(17.5%)
87 (21.8%)
400 (100.0%)

75
However, on regard of type of problems the results show that there are high home
deliveries without traditional birth attendant (TBAs) assistance among women who
had problems of money 37 (55.2%) and transport 50 (58.1%) and the least for
problems due to family members or friends 8 (80%) and family responsibility 4
(40.0%) compared to all others. The other barriers do not show any significant
difference across groups i.e. health staff treatment, work/employment and their P-
values were greater than 0.005
Table 19:
Frequency distribution of Related Reasons/Barriers a woman had for getting to
the Hospital or Clinics or TBAs
The table above show the accessibility related reasons/barriers women interviewed
had for getting to hospital, clinic or TBAs in labour. Whereby 103(49.8%) of women
interviewed had transport problem, followed by 80(38.6%) of women had problem of
lack of Money and Transport, 14(6.8%) of women faced long distance problem to
Clinics, 6(2.9%) of women had problem of lack of Money, 2(1.0%) of women had
problem of Labour which started suddenly and lastly 1(0.5%) of women their family
didn’t like to go to the clinic.
The problems a woman had getting to the hospital or clinic or TBAs in labour
Frequency Percent
LABOUR STARTED SUDDENLY AND I GAVE BIRTH AT HOME. 2 1.0%
LACK OF MONEY 6 2.9% LACK OF TRANSPORT 103 49.8% LONG DISTANCE TO CLINIC 14 6.8% MONEY AND TRANSPORT 80 38.6% NOT APPLICABLE 1 0.5% THE FAMILY DON'T LIKE TO GO TO THE CLINI 1 0.5%
Total 207 100.0%
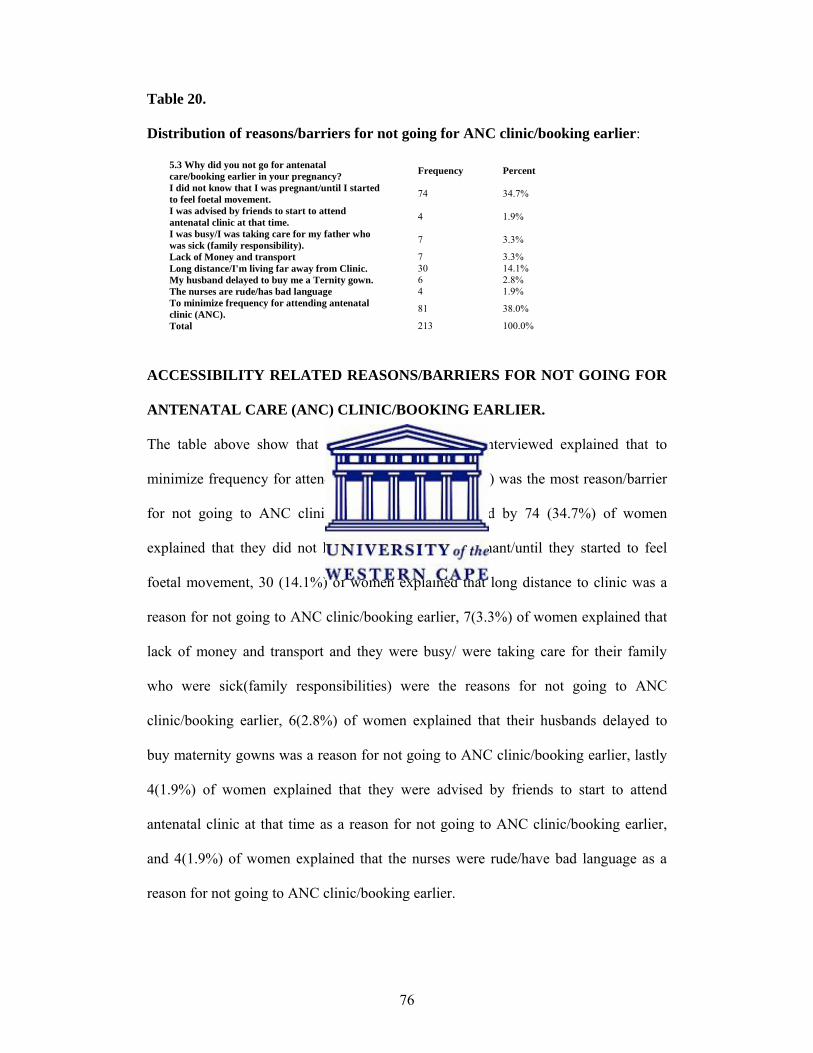
76
Table 20.
Distribution of reasons/barriers for not going for ANC clinic/booking earlier:
5.3 Why did you not go for antenatal care/booking earlier in your pregnancy? Frequency Percent
I did not know that I was pregnant/until I started to feel foetal movement. 74 34.7%
I was advised by friends to start to attend antenatal clinic at that time. 4 1.9%
I was busy/I was taking care for my father who was sick (family responsibility). 7 3.3%
Lack of Money and transport 7 3.3% Long distance/I'm living far away from Clinic. 30 14.1% My husband delayed to buy me a Ternity gown. 6 2.8% The nurses are rude/has bad language 4 1.9% To minimize frequency for attending antenatal clinic (ANC). 81 38.0%
Total 213 100.0%
ACCESSIBILITY RELATED REASONS/BARRIERS FOR NOT GOING FOR
ANTENATAL CARE (ANC) CLINIC/BOOKING EARLIER.
The table above show that 81 (38.0%) of women interviewed explained that to
minimize frequency for attending antenatal clinic (ANC) was the most reason/barrier
for not going to ANC clinic/booking earlier, followed by 74 (34.7%) of women
explained that they did not know that they were pregnant/until they started to feel
foetal movement, 30 (14.1%) of women explained that long distance to clinic was a
reason for not going to ANC clinic/booking earlier, 7(3.3%) of women explained that
lack of money and transport and they were busy/ were taking care for their family
who were sick(family responsibilities) were the reasons for not going to ANC
clinic/booking earlier, 6(2.8%) of women explained that their husbands delayed to
buy maternity gowns was a reason for not going to ANC clinic/booking earlier, lastly
4(1.9%) of women explained that they were advised by friends to start to attend
antenatal clinic at that time as a reason for not going to ANC clinic/booking earlier,
and 4(1.9%) of women explained that the nurses were rude/have bad language as a
reason for not going to ANC clinic/booking earlier.

77
Table 21. Distribution of Reasons or Things that made it EASIER to attend ANC
Clinic.
5.8 What sort of things or people made it EASIER to attend antenatal care? (Note: do not ask this question if mother did not attend ANC)
Frequency Percent
FAMILY SUPPORT 149 37.6% GOOD ATTITUDE OF STAFFS AT CLINIC. 1 0.3% MONEY 15 3.8% NOTHING AND NOBODY 47 11.9% SHORT DISTANCE TO CLINIC 154 38.9% TRANSPORT 30 7.6% Total 396 100.0%
The table above show that 154 (38.9%)of women interviewed explained short
distance to clinic was the most common reason for easier access to antenatal care
(ANC) clinic, followed by 149 (37.6%) women explained that family support as the
reasons for easier access to antenatal care (ANC) clinic, 47(11.9%) of women
explained that nothing or nobody as the reasons for easier access to antenatal care
(ANC) clinic, 30(7.6%) of women explained transport as the reason for easier access
to antenatal care (ANC) clinic, 15(3.8%) of women explained that money as the
reasons for easier access to antenatal care (ANC) clinic, and lastly 1(0.3%) of women
explained that good attitude of staff at clinic as the reasons for easier access to
antenatal care (ANC) clinic.
Table 22A:
Frequency Distribution of Reasons why a woman delivered at a particular place
(Home-withTBAs/Without TBAs/Clinic/Hospital/) during last Birth.
Reason delivered in particular place during last birth Frequency Percent Decision of the family 37 9.2% Fear of to be Operated/ They do Episiotomy 1 0.2% Fear to pay fine/be punished/ 1 0.2% I was not planned/Labour started suddenly/ 50 12.5% Lack of money/Transport/ 19 4.8% Long distance to Health centre/Could not get and afford facility 114 28.5% Nurses are uncooperative. 1 0.2% Short distance to Clinic/Health facility 12 3.0% To get good help, advice/good service to save life/ 151 37.8% Traditional Birth Attendant (TBA) was near to my home compared to Health centre/I like TBAs 14 3.5%
Total 400 100.0%

78
REASONS FOR CHOOSING PLACE OF DELIVERY:
The table above show (the reasons) that 114(28.5%) of women interviewed especially
for those who delivered at home their decisions for choosing place of delivery mostly
were influenced by problems of long distance to health facility, followed by
50(12.5%) of women their decisions were due to labour which started suddenly and
not planned, 37(9.2%) of women their decisions influenced by decisions made by
family, 19 (4.8%) of women their decisions influenced by problem of lack of
money/transport, 14 (3.5%) of women their decisions were due to short distance to
Traditional Birth Attendant (TBAs) and they liked them, and lastly 1(0.2%) of women
their decisions influenced by fear to be operated/they do episiotomy, and 1(0.2%) of
women their decisions were due to nurses who were uncooperative. And for those
who delivered at health facility their decisions mostly were influenced by good
help/advice/service and save life 151(37.8%), followed by 12(3.0%) of women were
influenced by short distance to health facility (clinic or hospital) and lastly 1(0.2%) of
women were influenced by fear to pay fine/be punished

79
Table 22B:
Comparing Reasons why a woman delivered at a particular place (Birth before
Arrival (BBA)/Home-withTBAs/Without TBAs/Clinic/Hospital/) during last
Birth By Place of Delivery during last Birth
Acceptability Variable Related
PLACE OF DELIVERY
TOTAL
p-value 0.0000
Birth Before Arrival (BBA)
Home without TBAs
Home with
TBAs Clinic Hospital
Decision of the family
0 (0.0)
19(12.6)
15(17.2)
1(1.4)
2(2.3)
37 (9.3)
Fear of to be Operated/ They
do Episiotomy
0 (0.0)
1(0.7)
0(0.0)
0(0.0)
0(0.0)
1 (0.3)
Fear to pay fine/be punished/
0 (0.0)
0(0.0)
0(0.0)
1(1.4)
0(0.0)
1 (0.3)
I was not planned/Labour
started suddenly/
2 (40.0)
35(23.2)
11(12.6)
2(2.9)
0(0.0)
50 (12.5)
Lack of money/Transport/
0 (0.0)
11(7.3)
8(9.2)
0(0.0)
0(0.0)
19 (4.8)
Long distance to Health
center/Could not get and afford
facility
3 (60.0)
79(52.3)
31(35.6)
1(1.4)
0(0.0)
114 (28.5)
Nurses are uncooperative.
0 (0.0)
1(0.7)
0(0.0)
0(0.0)
0(0.0)
1 (0.3)
Short distance to Clinic/Health
facility
0 (0.0)
0(0.0)
2(2.3)
9(12.9)
1(1.1)
12 (3.0)
To get good help/advice/good
service to save life/
0 (0.0)
4(2.6)
7(8.0)
56(80.0)
84(96.6)
151 (37.8)
Traditional Birth Attendant (TBA)
was near to my home compared
to Health center/I like TBAs
0 (0.0)
1(0.7)
13(14.9)
0(0.0)
0(0.0)
14 (3.5)
TOTAL
5 (100.0)
151(100.0)
87(100.0)
70(100.0)
87(100.0)
400 100.0

80
REASONS FOR CHOOSING PLACE OF DELIVERY:
The table above show that different factors/reasons women interviewed were
influenced women to choose place of delivery. On regard to different factors by place
of delivery, it was found that decision of the family as a factor influenced 37 (9.3%)
of women to deliver at home in which 19(12.6%) of women delivered at home
without assistance of TBAs and 15(17.2%) of women delivered at home with
assistance of TBAs compared to health facility deliveries 3 (8.1%) in which 1 (1.4%)
of woman delivered at clinic and 2(2.3%) of women delivered at hospital.
Labour started suddenly influenced 50(12.5%) of women interviewed to deliver at
home in which 35 (23.2%) of women delivered at home without assistance of TBAs
and 11(12.6%) of women delivered at home with assistance of TBAs and 2 (40.0%)
delivered before arrival compared to health facility deliveries 2(2.9%) of women in
which 2 (2.9%) of women delivered at clinic and no any woman delivered at hospital.
Lack of money/transport factor influenced 19 (4.8%) of women interviewed to deliver
at home in which 11 (7.3%) of women delivered at home without assistance of TBAs
and 8 (9.2%) of women delivered at home with assistance of TBAs and no any
woman delivered before arrival compared to health facility deliveries 0 (0.0%) of
women in which neither woman delivered at clinic nor hospital.
Problem of long distance to health facility factor influenced 114 (28.5%) of women to
deliver at home in which 79 (52.3%) of women delivered at home without assistance
of TBAs and 31(35.6%) of women delivered at home with assistance of TBAs and
only 3 (60.0%) of women delivered before arrival compared to health facility
deliveries 1 (1.4%) of woman in which 1(1.4%) of woman delivered at clinic and no
any woman delivered at hospital.
81
Living near Traditional Birth Attendant (TBAs) and they liked them as a factor
influenced 14 (3.5%) of women to deliver at home in which 13 (14.9%) of women
delivered at home with assistance of TBAs and 1 (0.7%) of woman delivered at home
without assistance of TBAs and no any woman delivered before arrival compared to
health facility deliveries 0 (0.0%) in which neither woman delivered at clinic nor
hospital.
also influenced home deliveries 1 (0.3%) of woman in which 1 (0.3%) of woman
delivered at home without assistance of TBAs and none of woman delivered at home
and before arrival with assistance of TBAs compared to health facility deliveries 0
(0.0%) of women in which neither woman delivered at clinic nor hospital.
To get good help/advice/service and save life as a factor influenced 151 (37.8%) of
women to deliver at health facility in which 84 (96.6%) of women delivered at
hospital and 56 (80.0%) of women delivered at clinic compared to home deliveries 11
(7.2%) of women in which 7 (8.0%) of women delivered at home with assistance of
TBAs and 4 (2.6%) of women delivered at home without assistance of TBAs and no
any woman delivered before arrival.
Short distance to health facilities influenced 12 (3.0%) of women to deliver at health
facilities in which 9 (12.9%) of women delivered at clinics and 1 (1.1%) of woman
delivered at hospital compared to home deliveries 2 (2.3%) of women in which 2
(2.3%) of women delivered at home with assistance of TBAs and none of woman
delivered at home and before arrival without assistance of TBAs.
And lastly, fear to be operated, uncooperativeness of nurses, and fear to pay fine/be
punished were cited by only 1 woman each.
These were coded answers to open-ended questions so no statistical testing was done
on these essentially qualitative responses.

82
4.1 Conclusion.
From these results it show that socioecnomic factors and presence of traditional birth
attendants during child birth play a role as determinants for women’s decision making
for place of delivery. These data correlate with findings of related studies done
elsewhere in the world as we shall see in the next chapter of discussion

83
CHAPTER 5
5.1 DISCUSSION
This study discusses major findings on factors contributing to home delivery among
women interviewed. The discussion will be revealed according to the study objectives
and in relation to other similar studies conducted elsewhere. Home deliveries pose a
threat not only to the mother but also to the newborn baby.
This study shows a highly prevalent home child delivery practice (60.9%) among
Rungwe district women. Socioeconomic, knowledge, acceptability, accessibility
constraints as well as poor quality of health services are the major reasons compelling
pregnant women to give birth at home. The majority of home deliveries are assisted by
unskilled attendants such as the pregnant woman herself or a close relative (i.e. mother,
father, aunts and sisters) and to some extent by traditional birth attendant (TBAs).
However, it shows a highly prevalent attendance of antenatal care clinic in all
pregnancies across all divisions in the district.
Antenatal Clinic Attendance
In line with earlier annual Rungwe district reports, almost all women interviewed in this
study attended ANC-Clinic during pregnancy (98.8%) also see table 7B. Findings of high
attendance to ANC clinic also have been reported by previous study in Tanzania which is
estimated to be 94% TDHS (2004-2005). The results of this study are complementary to

84
the emphasis on antenatal care by the Tanzanian national health policy, and a result of
free provision of maternal and child health care services in accordance with Millennium
Development Goal 5.TDHS.(2002)
Home Delivery:
Even though attendance to antenatal clinic (ANC) was high, however, home delivery
among women interviewed in this study was also high 243 (60.8%) with only 157
(39.3%) delivered at health facilities. Surprisingly, this finding shows that most of the
women interviewed confirmed having been informed about health facility as the right and
safe place of child birth. Noteworthy is that the percentage of home child delivery in
Rungwe district was much higher than that reported by the country where 53% deliver at
home (TDHS, 2004-2005). Also the respective prevalence figure in Rungwe district is
still higher than the World Health Organization (WHO) estimate for home child
deliveries in the developing world 50% of the deliveries place in home WHO (1997).
And is still higher than the UNPFA (1999) findings that show that in Sub-Saharan Africa,
where an estimated 40-50% of women deliver at home. Furthermore another study in
Rakai district Uganda show that 44.5% of deliveries take place in home. Also Kaguna et
al (2000) discovered that in Rakai district of Uganda, 32% of the sample population used
public health facilities, while 68% delivered at home. WHO (1997) reported that in
southern Sahara “less than 50% of women have access to skilled attendants, and only
36% give birth in health facilities” In Egypt there are also home delivery rates of over
50% (ENMMS, 2000).

85
Why women do not use available services
Over the years, scholars from various parts of the world have attempted to find out why
women, especially those in developing countries seem to avoid using health facilities for
child delivery. Various reasons are perceived to prevent women in low-income countries
from seeking skilled care during labour, including midwives’ attitudes, lack of
confidence in services offered, socioeconomic conditions, as well as cultural beliefs and
traditions (Hodgkin 1996, Van den Heuvel, De Mey, Buddingh, & Bots 1996). These
findings correlate with the findings of Rungwe district. In Rungwe district the results
show that there were similarities and differences in terms of socioeconomic/demographic
and knowledge factors for place of delivery across all four divisions in the district. And
home child delivery rate was higher in those divisions which were most poorly resourced.
This especially was found in Pakati and Busokelo divisions than the other two divisions
in the district.
Among the reasons that compel women from using health facilities are:
High costs for child birth services: Even when formal fees are low or non-existent,
women often face expenses for transport, drugs, and food or lodging for the women or
her family members. As a result most of poorer and rural women lack access to good
quality health services during pregnancy and child birth Abouzahr C. (1997). This finding
shows a relationship with our study findings where by in Rungwe district about 4.8%
could not afford seek child birth care during delivery, and 16.46% could not afford to
attend antenatal care services due to lack of money. In Rungwe, results show that women

86
with economic problems particularly in Pakati and Busokelo divisions had a higher rate
of home delivery than those who had less or no economic problems. Also, it found that
some women had to pay more money during for seeking child birth services. Also, in
Rungwe district the level of awareness on facilities delivery is high, however factors like
travel time and added costs at the time of delivery force women to deliver at home as
seen in table 5. In this study shows that most women delivered at home with less cost
compared to those who delivered at health facilities.
Although, the health policy of Tanzania is to provide free obstetric services in all public
health institutions, the reality is that there are many costs that individual woman and their
family have to incur due to routine stock-outs at health facilities. Hence, women were
regularly directed by health workers to purchase and bring essential medical supplies.
These costs among other cost were cost of gloves and suture materials, rubber mate, but
the most important is transport and cost of transport to health facilities (PHSDP –
MMAM 2007-2017 May, 2007). In addition, in a cohort study Hodgkin (1996) cited to
family’s economy as factors that mitigate against women seeking services in health
centres.
Lack of physical access: Among other reasons that compel women from seeking health
facilities services is lack of physical access. Most rural women (80%) live more than five
kilometres from the nearest hospital. Vehicle shortage and poor road conditions mean
that walking is often the main mode of transportation, even for women in labour. Thus
poorer and rural women lack access to good quality health services during pregnancy and

87
child birth Abouzahr (1997). This finding shows a relationship with the results of
Rungwe district where by women from Pakati and Busokelo divisions are found to travel
for long time and long distance to health facility especially hospital by mean of walking.
In addition, Biego G. et al (1995) point out that in rural Tanzania, 84% of women who
gave birth at home intended to deliver at health facility, but could not because of distance
and transport. Furthermore, in Tanzania the under funding of the health sector has
undermined the health infrastructure across the country. The inputs to the sector in terms
of equipments, transport and communication remain insufficient (PHSDP – MMAM
2007-2017 May, 2007). In addition, the results of TDHS (2004) which reported that
major barriers perceived by women to access delivery health services include lack of
money (40%), long distance to health facility (38%), lack of transport (37%) and
unfriendly services (14%). The high rates of home deliveries are also attributed by poor
geographical access to health facilities, lack of functioning referral system, inadequate
capacity at health facilities in terms of space, skilled attendants, commodities and other
socio-cultural aspects surrounding the pregnant women. The variations between the
studies and the current study can be explained in many ways such as the distribution of
health facilities in the district and level of knowledge among the respondents just to
mention but a few.
Poor information: This is another reason that make women to turn away from health
facilities utilization where by the women and community members do not know how to
recognise, prevent or treat pregnancy complications or when and where to seek medical
help (Abouzahr 1997). In Rungwe district the level of awareness on facilities delivery is

88
high, but factors like travel time and added costs at the time of delivery compel women to
deliver at home.
Health services are inadequate: Poor quality of care is one of the most common reasons
women give for choosing not to use available maternal health services. Problems include
that health facilities in developing countries face chronic shortage of equipment, drugs
and basic supplies, including blood for transfusion. Families of women in labour may be
forced to purchase drugs and supplies to bring to the hospital, which in turn can cause
fatal delays (Abouzahr 1996). The author adds that health facility staffs are often poorly
trained. They may lack essential clinical skills, and may not observe hygienic practices.
Health workers may be rude, unsympathetic and uncaring. Likewise to the Rungwe
results show that women could not use the health facilities due to poor services. Some
confirmed uncooperativeness of health workers, some confirmed lack of drugs in some
health facilities. This also reflects to poor referral system for complicated cases as
Fawcus S. et al (1996) also explain that delays in referring women from community
health facilities to hospitals are one of the most important barriers to life-saving maternal
care. Generally, in Tanzania the performance of the health sector has been negatively
affected by limited resources which have led to an unsatisfactory quality of health care
provision at all levels PHSDP – MMAM 2007-2017 (May, 2007)
Cultural preference: From our study results, in Rungwe cultural factors were not a
predictor of place of delivery. This result does not correlate with the results of other

89
scholars such as Abouzahr (1997) who explains that formal health services can conflict
with ideas about what is normal and acceptable including preferences for privacy,
modesty and female attendants. Also, Leslie J. and Gupta G. R. (1989) explain that the
Saraguro Indians in Ecuador turn away from affordable, accessible maternity care
because they feel that hospitals violate women’s privacy during childbirth and because
many health provider are men. Also presence of traditional birth attendants as
Chipfakacha et al (1994) reported in his study that the presence of traditional birth
attendants also discourage the use of health care facilities
Lack of decision making: The results from Rungwe show that some women could not
use the health facility during childbirth simply because the family did not like to the
health facility. This result correlates with the findings of other scholars such as
Abourzahr (1997) explain that “in many parts of the world, women’s power to make
decision is limited, even over matters directly related to their own health.” Also safe
motherhood (1997) point out that “in Bangladesh, it is usually the mother-in-law and
husband who make the decision to seek (or not seek) care. They are often the least likely
to know about pregnancy-related complications and their possible fatal consequences”
Additional factors include gender inequalities in decision making and access to resources
at household level (TDHS 2004-2005).
Acceptability of services delivered.
Women’s perceptions and experiences of staff and services at health facilities/home-with
TBAs and without TBAs were mixed. Some women related having a good experience

90
during delivery at health facility/home with TBAs and others were appreciative of the
medical care/TBAs and support they received from medical staff or TBAs and would
recommend to other women. However, some of them reported unprofessional,
inappropriate and unethical attitude and actions by health workers were commonplace.
For example, women explained uncooperativeness of nurses i.e. they were calling out for
assistance but being left alone to deliver, being refused services if they did not come with
the right medical supplies, being told they were dirty or their clothes were old, or being
slapped during child birth. As a consequence of abusive treatment, some women were
discouraged from using health facilities and would not recommend to other women and
instead they opted to go to traditional birth attendants (TBAs) Abourzahr (1997). As
found in this study the results show that home deliveries were higher among those
women whose family stayed with them throughout during their labour and child birth
than health facility deliveries where they were alone during their labour and child birth.
Accessibility to delivery service centres - Distance and Transport
Another compelling factor for home delivery was distance from home to health facility as
see table 19 and 22. According to TDHS (2004) it is estimated that over 80% of the
Tanzanian population live within 5km from the health facility. However, the distribution
of health facilities in the country is not equitable; some women walk up 4 hours to health
facilities while others walk less as found in our district especially in Pakati and Busokelo
divisions women walk between one hour up to 6 hours see table 4, 5 and figure 4.
91
In Rungwe district there are some areas with physical barriers to an existing facilities
though it may be within 5 kilometers of the population centre. The geographical barriers
include rivers, lakes, bad roads, valleys and mountains. This study has similar findings to
other author’s studies. For example Kibambai (2002) noted that the influence of distance
can not be underscored, studies done in Cuba, Egypt, Indonesia, Jamaica and Turkey on
maternal mortality, demonstrated that maternal complications are increased in areas
where women are likely to arrive in hospitals late, in a serious condition. World Health
Organization (WHO) (1986) mentions distance to health facility and inadequate action by
medical personnel to be a contributory factor to home delivery. And, Godfrey et al (1996)
explained that among reasons given by mothers for not delivering in health units was
distance to the health facilities. In addition to distance, sudden onset of labour was
another major factor for home delivery in this particular study.
On the other hand those women who delivered in health facilities mentioned that good
care of the mother and the child, failure to deliver at home among others were the reasons
as seen in the result of this study in table 14, 19 and 22. Other reasons were due to short
distance to health facilities, having good resources, easier transport and absence of any
other problems for accessing at health facilities.
Accessibility and Acceptability factor for Traditional Birth Attendant (TBAs).
In this study it was found that traditional birth attendants were among factors contributing
to home deliveries. The study results show that women interviewed were knowledgeable
about risk factors during pregnant and there was high attendance to antenatal care (ANC).

92
However, home deliveries still were high compared to health facilities deliveries. This
was due to that women lived short distance away from TBAs compared to health
facilities and they thought that traditional birth attendant conducted normal delivery
services as nurses and were less expensive and they liked them. These findings correlate
to the ENMMS (2000) cited in Clean and Safe Mother Birth (2005) reported that Egypt
has a home delivery rate of over 50%. Among reasons for choosing home delivery was
trust in dayas (traditional birth attendants). Also it found in this study that among other
factors that were influencing home delivery with TBAs or even without TBAs where
unfriendly services by medical staff, inadequate supplies and drugs in health facilities,
formal and informal charges incurred for deliveries at health facilities, and decision made
by individual/family.
5.2 Study limitations
A limitation of this analysis was the lack of adjustment for any clustering effect which
may have been present due to our sampling design. This was due to limited statistical
capacity of the student who is located in a rural area of Tanzania without access to
advanced statistical software. The potential decrease in precision due to cluster effect
was analysed by the supervisor and found to be approximately 3-5% (e.g. adjusted
confidence interval would be 3-5% wider). In addition a statistician was consulted who
felt in agreement with the supervisor that considering the strength of the associations seen
(most significant p-values were <0.001) it is unlikely that a change in inference and
conclusions would be expected given this level of estimated change in precision (personal
communication, Professor R. Madsen, UWC/Univ. Missouri). Another statistical

93
consideration was the need for potential weighting of estimates. This would have been
necessary if there were large differences in the proportion of the population that each
woman represented across stratum or clusters. Our population estimates suggest that the
women in the study represented a relatively consistent number of women in the
population and that weighting of estimates would not have appreciably changed our
estimates or conclusions.
In this study the researcher was a very new person in the rural setting, although the
questionnaires were translated into national language (Kiswahili) and also being a male
medical doctor; some of women interviewed might be afraid to disclose their family
affaires. Also, some women interviewed may had forgotten some of the events happened
long years ago. i.e. a mother of para eight might had difficulty to remember what
happened in her earlier pregancies.

94
5.3 CONCLUSION:
In view of results and discussion it is feasible to conclude that although ANC attendance
was revealed to be high, the majority of women have home deliveries. Most of the
women were aware of maternal risks during pregnancy as seen in table 10. However
socioeconomic factors, and less or lack of knowledge on danger signs, are among the
factors that compel women from health facility utilization. Also long distance, lack of
transport to travel to health facility and cost of service influence them to deliver at home.
Furthermore, women lack education on key elements on birth preparedness, as most of
them complain of sudden onset of labour. Poor quality of health care services in health
facilities are among the factors that contributes women to decide or not to use the
facilities. This have been cited several times by participants for instance lack of drugs and
supplies, Uncooperativeness of health staff influenced under utilization of health care
facilities.
Other social factors that compel to deliver at home are wrong advice from friends,
relatives, presence of TBAs whom they liked/trusted, and self preference. In addition, in
the majority relatives were mentioned to assist deliveries at home, while self deliveries
also existed due to experience as perceived by themselves. Functioning health facilities
are needed, staffed by trained health workers, equipped with essential medical supplies
and able to provide rapid referrals for women with obstetric complications. Actions are
required now to improve health care delivery, focussed on the most underserved areas,
informed by the experiences of women and health workers and by Tanzanian best
practice. Most Tanzanians live within 5km of a clinic, however still some suffer from
living far away to health facilities. Due to geographical barriers and difficulties for the

95
sick and pregnant women to cover such a distance when services are needed, more
facilities are still required. With strong social and political will and strategic decision-
making at all levels, maternal mortality and morbidity in Rungwe as well as Tanzania as
a whole can be dramatically reduced.
5.4 RECOMMENDATIONS.
At a community level:
• The community with support from the CHMT’s should establish a suitable
referral system linked to health facilities with reproductive and child health
services. For instance, 24 hours emergency transport services must be available
within each community for emergency obstetric and paediatric care. This is
critical in both rural areas (where other forms of public transport are often not
available and where many people do not have access to private vehicles) and in
urban areas where wellbeing is compromised if travelling alone.
• Community participation on raising awareness on child reproductive health
among community members should be designed and enforced, thus, this will raise
positive attitude towards health facilities delivery. Community education about
maternal and infant health and danger signs is crucial. Families should be
educated on maternal and infant health and danger signs and they should also
know that on time medical attention can save lives. At the same time as women
had some knowledge on danger signs this was deficient. It is known that women
trust most the information from health facility based health providers. Therefore it
is very important that health provides are active participants in health education

96
and health promotion. It is also important that health education and promotion be
comprehensive to include common symptoms of pregnancy, recognising risk
factors that need urgent treatment.
• Cooperation and communication with families and communities needs to be
enhanced. It was clear that communities and families are an untapped resource for
promoting maternal and infant health. In our result showed that families want to
be more involved in the care of women during pregnancy and birth. Enhancing
community support for antenatal care (ANC) and postnatal/infant services may be
one of the most beneficial ways to increase use of maternal and newborn services.
While essentially all women interviewed attended ANC and hospital delivery but
home delivery was high than facilities deliveries. There appeared to be a gap in
coordination and communication with families and communities. Initiatives like
better births that promote family involvement during labour and birth and
expansion of these efforts to primary care should be supported.
At level of Council Health management Teams (CHMTs):
• Need to establish a technical support to be able to carry out evidence-based
planning for maternal Health.
• Need to establish a clearly identified budget to implement maternal health
interventions.
• Health education; health education interventions to communities should have to
be designed that will focus on advising health facility delivery.

97
• Health staff capacity building such as sensitivity training for hospital staffs
working with mothers and infants and training on early detection of risk factors
during pregnancy, health promotion, and proper calculation of expected date of
deliveries (EDDs) as well as early referral of complicated cases should be
explored and communication with families needs to be enhanced. All families in
the district and elsewhere in the country have the right to be treated with respect
when they present at the health facility. And also ought to have full knowledge of
the diagnosis and treatment for themselves and their infants
• Quality of assurance; adequate provision of delivery equipment and obstetric
drugs should be given considerable attention. All facilities must be adequately
supplied with the essential medicines and other supplies to promote maternal and
infant health. Officials and staff responsible for supplies must be held directly
accountable for their actions to ensure regular flow of supplies. Improvement in
infrastructure, equipment and supply chains at health facility are essential for
enabling delivery of quality delivery care. Improvements can also positively
impact the morale and performance of health workers as well as the confidence
of women in utilizing facilities.
• Expand Coverage of Comprehensive Emergency Obstetric Care (EmOC) to all
district hospitals (at dispensaries, health centers and hospitals respectively) with
priority to the most underserved areas. Equip all dispensaries and the remaining
health centers to provide basic EmOC.
• CHMTs and council authorities should ensure that health service providers
including TBAs, VHWs, and CBDs are provided with basic supplies and

98
equipment for provision of quality reproductive child health (RCH) services.
Also should recruit and deploy trained health personnel to expand coverage of
skilled birth attendance in underserved areas. Quality services are dependent on
skilled professionals. Substantial and sustainable improvements in maternal
health services can only be achieved by deploying more trained staff with priority
on expanding coverage in underserved areas.
• Research; more research need to be designed and conducted about why home
delivery is high in this district especially in Pakati and Busokelo divisions and
other districts of the region.
At National level:
• Budgets need to have money specifically earmarked for maternal health
interventions
• Disseminate, implement and enforce nationally the government policy exempting
women from paying for maternity care. Women and their families need to know
their right to free pregnancy and delivery services, and health workers and local
authorities need to know and effectively implement the policies. With this in
place, maternal health services will be provided without charge (both official and
unofficial fees) and no pregnant women should be denied care. All delivery
supplies must be also provided to women free of charge, consistent with the
government statement that no pregnant woman should have to provide a delivery
kit for childbirth.

99
• Yet the government in collaboration with private sector, not-for- profit
organizations, and international organizations, should continue to provide free
health care to pregnant women, family planning clients and children under five
years for solving financial constraint.
• Need to strengthen the management capacity of CHMT’s to establish and sustain
quality reproductive and child health services.
• Incorporate a systemic role-out strategy of basic and comprehensive emergency
obstetric care to meet the national road map strategic plan to accelerate reduction
of Maternal, Newborn and Child Deaths in Tanzania.
What further can be done?
Governments and non-governmental agencies must expand services, improve their
quality, and tailor them to meet the needs of women and communities by:
Ensuring that health facilities are located close to where women live, have an adequate
number of trained staff, a continuous supply of drugs and equipment, and are
linked to hospitals by an emergency transport and referral system.
Enforcing standards and protocols for service delivery, management and supervision,
and using them to monitor and evaluate the quality of services, along with feedback from
clients and health providers.
Providing free or affordable maternal and infant health services that can manage any
complications as well as offer routine care.
Educating women and communities about the importance of maternal health and
appropriate services.

100
Utilization of health facilities by women can be increased by improving the quality of
existing maternal health services which is the quickest, most cost-effective way to save
women’s lives good quality care aims to:
Meet Women’s Needs:
Services should be provided in health facilities that are as close as possible to where
women live and that can provide the services safely and effectively;
Services should be sensitive to cultural and social norms, such as preferences for privacy,
confidentiality and care by female health workers;
Staff should be respectful, non-judgmental and responsive to clients;
Women should be treated as active participants in their own health, and offered
information and counselling so they can make informed decisions about their health and
treatment.
Provide Technical Competence:
Staff members should be trained in technical, clinical, management, and interpersonal
skills;
Standards of care and written protocols should be available;
Physical facilities should be adequate, clean and convenient;
Necessary drugs, equipment and supplies should be available;
Comprehensive reproductive health services (including follow up care) should be
available on-site or through established linkages to other health facilities;
A fully functional referral and transport system should exist between all levels of care
(home/community, health centres, and district/regional hospitals).

101
References:
Abreu and Potter (2001) Essential Obstetric Care. Available in:
http://www.rho.org/html/sm-b-04.html#abreu01.
AbouZahr C., "Improve Access to Quality Maternal Health Services".
Presentation at Safe Motherhood Consultation in Sri Lanka, 18–23 October 1997.
ACCESS (2004). Preliminary findings of ACCESS project. Ifakara, Tanzania:
Ifakara Health & Research Development Centre (IHRDC). Unpublished. (Quoted
in Msecha & Mtega, 2005).
Ackermann-Liebrich U, Vogeli T, Gunter-Witt K (1996) Zurich study team: home
vs. hospital deliveries: follow-up study of matched pairs for procedures and
outcomes. BMJ 313, 1313-1318.
Adapesa M. S.(2007) Household decision making about the use of maternity
services in Builsa District, Ghana Available in:
http://pubhealth.ku.dk/mih_en/studguide/job/postdoctoral_research_fellowship
[accessed in 2007]
Afful T.M (20097) Safe Deliveries In Kassena-Nankana District In Northern
Ghana: A Study To Determine Factors Influencing The Use Of Health Facilities
For Deliveries By Pregnant Women Available in:
http://pubhealth.ku.dk/mih_en/studguide/job/postdoctoral_research_fellowship
[accessed in 2007]
Amos, M. N. (2003) Community-Based study on pattern and determinants of
maternal services utilization in Karagwe district in Tanzania. Available in:
http://pubhealth.ku.dk/mih_en/thesesAbstr/04/
102
Ammoti Kaguna, B., & Nuwaha, F. (2000) Factors influencing choice of
deliveries sites in Rakai district of Uganda. Social Science & Medicine, 50: 203-
215
Beaglehole, R., Bonita, R. & Kjellstrom, T. (1997). Ch 3 – Types of study. In
Basic Epidemiology. Geneva: WHO Publications: 31-53.
Bergström and Goodburn (2001). In Skilled attendance during pregnancy and
delivery. Available in: http://www.rho.org/html/sm-b-04.html#bergstrom01
Biego G. Cutis S., Raggers H, Kapiga S & Ngallaba S, Survey on Adult and
Childhood Mortality, Tanzania. Macro International, Calverton, MD, 1995.
Bicego G., Cutis S., Raggers H, Kapiga S & Ngallaba S (1997) Sumve survey on
adult and childhood mortality, Tanzania, 1995: in-depth study on estimating adult
and childhood mortality in settings of high adult mortality. Feb 1997. xii, 92pp.
Macro International, Demographic and Health Surveys [DHS]: Calverton,
Maryland
Bolam A, Manandhar DS, Shrestha P, Elis M, Malla K & Costello A (1998)
Factors affecting home delivery in the Kathmandu Valley, Nepal. Health Policy
and Planning 13, 152-158.
Borghi et al. (2003). In Skilled attendance during pregnancy and delivery.
Available in: http://www.rho.org/html/sm-b-04.html#borghi03
Bulterys et al. (2002). In Skilled attendance during pregnancy and delivery.
Available in: http://www.rho.org/html/sm-b-04.html#bultreys02
Bureau of Statistics [Tanzania] and Macro Inc (2004-05) Tanzania Demographic
and Health Survey (2004-2005) Macro International Inc. Calrerton, Maryland.

103
Brieger W. R., Luchok, Eng E., & Earp J. A. (1994) Use of maternity services by
pregnant women in a small Nigerian community. Health care for women
international, 15:101-110.
Chipfakacha, V. (1994) Attitudes of women towards traditional midwives- a
survey in the Kgalagadi (Kalahari) region. South African medical Journal, 84:30-
32.
Clean and Safe Home birth (2005) standards of practice for Integrated MCH/RH
services
D’Ambruoso L, Abbey M & Hussein J (2002) Please understand when I cry out
in pain: women’s accounts of maternity services during labour and delivery in
Ghana. BMC Public Health 5, 140
De Brouwere, V., & Lerberghe, W. V. (Eds). (2001). Safe motherhood strategies:
A review of the evidence. Antwerpen, Belgium: ITGPRESS
District medical officer (2004) HMIS report Rungwe District medical officer.
Elo IT (1992) Utilization of maternal health-care services in Peru: the roles of
women’s education. Health Transition Review 2, 49-69
Ensor T, Cooper S. Overcoming barriers to health service access: influencing the
demand side. Health Policy Plan 2004 Mar, 19(2):69-79.
Family care International and safe motherhood inter-Agency Group (1998) Safe
motherhood. Available in:
http://safemotherhood.org/facts_and_figures/measuring_progress.htm.
104
Filippi et al. (2003); Weeks et al. (2003); Wagaarachchi et al. (2001). In Essential
Obstetric Care. Available in: http://www.rho.org/html/sm-b-
04.html#filippi03,#weeks03,#wagaarachchi01
Flinders University of South Australia (2006) Health System Research II Module
guides. - Flinders University, Adelaide, Australia: 17-145.
Ganer P., Lai D & Baea M (1994) childbirth in rural areas: maternal deaths,
village deliveries and obstetric service use. PNG Medical Journal 37, 166-172.
Gilson, L. (1997) the lesson of user-fee experience in Africa. Health policy
Planning, 12:273-285.
Gill and Ahmed (2004); Djan et al. (1997); Ifenne et al. (1997); Leigh et al.
(1997); Mbaruku and Bergstrom (1995). In Essential Obstetric Care. Available
in: http://www.rho.org/html/sm-b-04.html#gill04;#djan97;#ifenne97;#leigh97
Margaret G. S. (1996) The female client and the health care provider; intention to
deliver and delivery outcome: 1-6.
Gohou et al. (2004); Stekelenburg and Roosmalen (2002). In Essential Obstetric
Care. Available in: http://www.rho.org/html/sm-b-
04.html#gohou04;#stekelenburg02.
Goldman and Glei (2003); Goodburn et al. (2000); Hoff (1997); Kamal (1998). In
Skilled attendance during pregnancy and delivery. Available in:
http://www.rho.org/html/sm-b-04.html#goldman03
Hedges, B. (1978) Ch 4 – Sampling. In G. Hoinville & R. Jowell (Eds). Survey
Research Practice. London: Heinemann: 55-89.

105
Hodgkin, D. (1996) Household characteristics affecting where mothers deliver in
rural Kenya. Health Econ. 5, 4:333-340.
Hodnett ED, Gates S, Hofmeyr GJ and Sakala C (2003) continous support for
women during childbirth. Cochrane Database of Systematic Reviews 2003, Issue
3. Art. No.:CD003766.DOI: 10.1002/14651858.CD003766.
Hoque, A.., & Selwyn, B. J. (1996) Birth practice patterns in urban Slums of
Dhaka, Bangladesh. Womens Health, 24 1:41-58.
Odoi-Agyarko H., Dollimore N., Owusu-Argyei O., (1993)."Risk Factors in
Maternal Mortality: A Community-Based Study in Kassena Nankani District".
Paper presented at the National Consultative Meeting on Safe Motherhood, Accra,
Ghana,
J. Leslie and G.R. Gupta, Utilization of Formal Services for Maternal Nutrition
and Health Care. International Center for Research on Women, Washington, DC,
February 1989.
Katzenellenbogen, J. M., Joubert, G., Abdool Karim, S. S. (1997) Ch 8-
Sampling. In Epidemiology: A Manual for South Africa. Cape Town: Oxford
University Press: 74-82.
Lankinen, K. S., Bergstrom, S., Makela, P. H., & Peltomaa, M. (Eds.) (1994)
Health and disease in developing countries. Hong Kong: The MacMillian Press
Ltd.
Lazarus, R. S., & Folkman, S. (1984). Stress, appraisal, and coping. New York:
Springer Publishing co.
106
Maimbolwa et al. (2003). In Skilled attendance during pregnancy and delivery.
Available in: http://www.rho.org/html/sm-b-04.html#maimbolwa03
Maine et al. (1996); Figa-Talamanca (1996). In Essential Obstetric Care.
Available in: http://www.rho.org/html/sm-b-04.html#maine97;#figa96
Mbeya Region Medical officer’s three year report (2006-2008) HMIS report
McCord and Chowdhury (2003). In Essential Obstetric Care. Available in:
http://www.rho.org/html/sm-b-04.html#mccord01
Mavalankar (2002). In Essential Obstetric Care. Available in:
http://www.rho.org/html/sm-b-04.html#mavalankar02.
Mliga G R., Mwakilasa AO, Mwakalukwa E, (2005). Human Resources for
Health: Strategies to overcome the constraint. Pre-Review Health SWAP
Committee (Joint GOVT/Development Partners) Preparatory Meeting, Belinda
Ocean Resort 15-17 March.
Nahar, S. & Costello, A. (1998) the hidden cost of “free” maternity care in Dhaka,
Bangladesh. Health Policy and Planning, 13:417-422.
Nirupan and Yuster (1995); Barnes-Josiah et al. (1998) In Essential Obstetric
Care. Available in: http://www.rho.org/html/sm-b-04.html#niru95;#barnes98.
Nwakoby BN (1994) Use of obstetric services in rural Nigeria. Journal of Royal
Society of Health 114, 132-136.
Opuko, S. A., Kyei-Faried, S., Twum, S., Djan, J., Browne, E., & Bonney, J.
(1997) Community Education to improve utilization of emergency Obstetric
services in Ghana. The Kumasi PMM Team. International Journal of
Gynaecology and Obstetrics, 59, suppl 2: 201-207.

107
Paul and Rumsey (2002). In Skilled attendance during pregnancy and delivery.
Available in: http://www.rho.org/html/sm-b-04.html#paul02
Polit, D. E. & Hungler, B. P. (1993) Ch 5 – The Ethical Context of Nursing
Research. In Essentials of Nursing Research: Methods, Appraisals, and
Utilization. Philadelphia: J. B. Lippincott Company: 125 – 147.
Ministry of Health and Social Well Fare (2007) Primary Health Services
Development Programme PHSDP – MMAM 2007-2017: xi-11
Raghupathy S. Education and the use of maternal health care in Thailand. Soc Sci
Med 1996 Aug; 43(4):459-71.
Ray and Salihu (2004), Minden and Levitt (1996); and Bolam et al. (1999). In
Skilled attendance during pregnancy and delivery. Available in:
http://www.rho.org/html/sm-b-04.html#ray04
The United Republic of Tanzania (2005) The Tanzania Poverty and Human
Development Report 1:37-40
Rice, P.R. & Ezzy, D. (1999) Sampling Strategy for Qualitative Research. In
Qualitative Research Methods – A Health focus. Sydney: Oxford University
Press: 40-50.
Roosmalen JV, Walraven G, and Stekelenburg J & Massawe S (2005) Editorial:
integrating continous support of the traditional birth attendant into obstetric care
by skilled midwives and doctors: cost-effective strategy to reduce perinatal
mortality and unneccessary obstetric interventions. Tropical Medicine and
International Health 10, 393-394

108
Samizi G, Pendo (1997). Factors cntributing to late booking in Kasulu district,
Kigoma Region-Tanzania. Primary Health Care Institute of Iringa City. Masters
Thesis 1997.
S. Fawcus et al., A Community-based Investigation of Avoidable Factors for
Maternal Mortality in Zimbabwe. Studies in Family Planning, Vol. 27, No. 6,
November – December 1996.
Sibley, Sipe and Koblinsky (2004) In Skilled attendance during pregnancy and
delivery. Available in: http://www.rho.org/html/sm-b-04.html#sibley04
Sorensen HT, Steffensen FH, Rothman KJ et al. (2000) Effect of home and
hospital delivery on long term cognitive function. Epidemiology 11, 706-708
Thind A, Banerjee K.(2004) Home deliveries in Indonesia: who provide
assistance? J Community Health. 2004 Aug; 29: 285-303.
Tlebere P, Jackson D, Loveday M, Matizirofa L, Mbombo N, Doherty T, Treger
L, Wigton A, Chopra M. (2007) Community Based Situation Analysis of
Maternal and Neonatal Follow-Up Care in South Africa. Journal of Midwifery &
Women’s Health. 52:342-350.
Toan, N. V. (2001) Utilization of health services in a transitional society: Studies
in Vietnam 1991-1999. Medical dissertation. Division of International Health
(IHCAR) and Department of Public Health Sciences, Karolinska Institutet,
Stockholm
Varkevisser, C. M., Pathmanathan, I. & Brownlee, A. (1991) Designing and
conducting health system research projects. Health systems research training
series, 2. Ottawa: International development research centre.

109
Wagle RR, Sabroe S & Nielsen BB (2004) Socioeconomic and physical distance
to the maternity hospital as predictors for place of delivery: an observation study
from Nepal. BMC Pregnancy and Childbirth 4, 8
Walker, D., McDermott, J., Fox-Ruby, J., Tanjung, M. Nadjib, M., Widiatmoko,
D. et al (2002) an economic analysis of midwifery training programmes in South
Kalimantan, Indonesia. Bull World Health Organ, 80, 1:47-55.
Walraven GE, Mkanje RJ, Roosmalen J, van Dongen PW, Dolmans WM (1995)
Perinatal mortality in home births in rural Tanzania. European Journal of
Obstetrics, Gynecology, and Reproductive Biology 58,131-134.
World Health Organisation (1996). Essential Obstetric Care. Available in:
http://www.rho.org/html/sm-b-04.html#who96
World Health Organisation (1997) Coverage Maternity Care. A list of available
Information 4th Edition. Geneva, WHO, 15.
Yanagiswa S, Oum S & Wakai S (2006) Determinants of skilled birth attendance
in rural Cambodia. Tropical Medicine and International Health 11, 238-251
110
Annexes

111

112

113

114

115

116

117

118

119

120

121

122

123

124

125
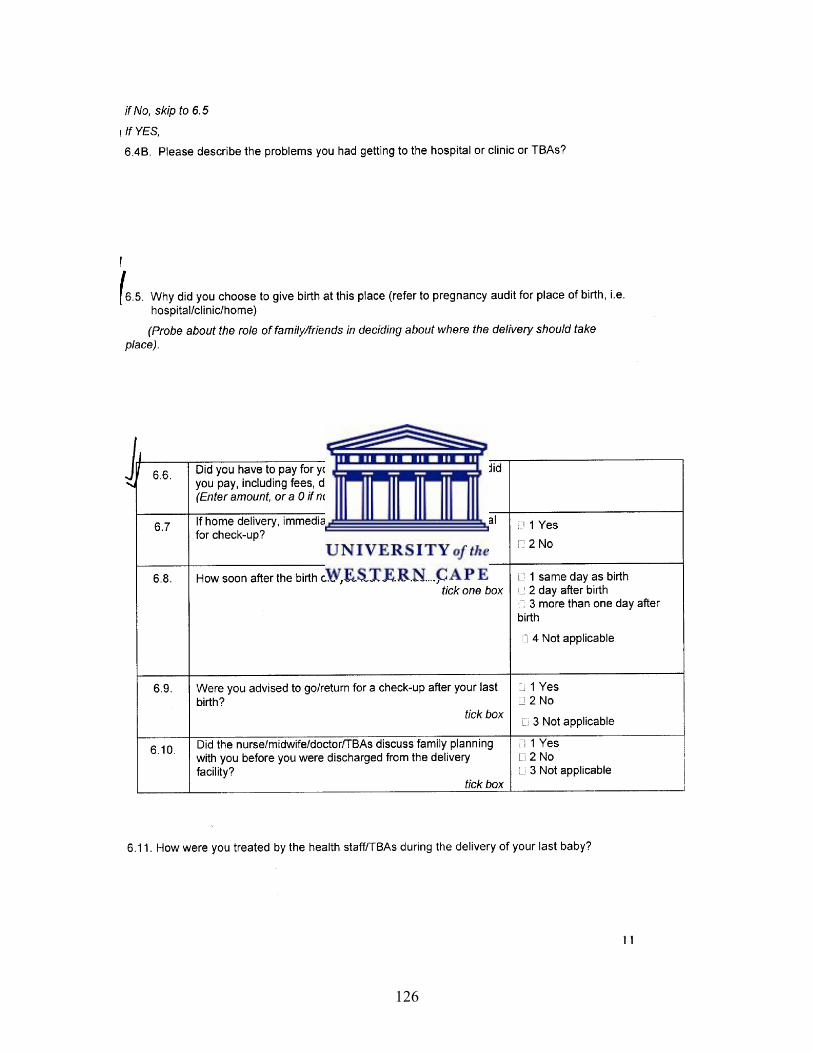
126
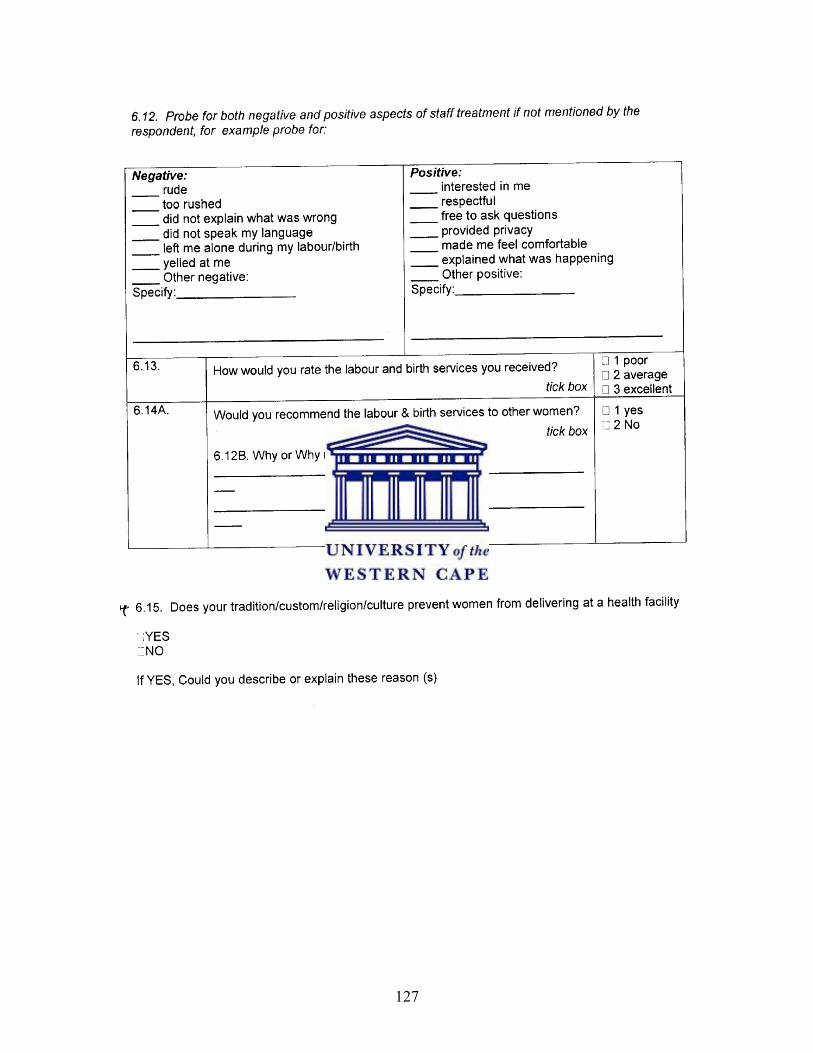
127

128