factors contributing to the increased perinatal …
TRANSCRIPT

FACTORS CONTRIBUTING TO THE INCREASED PERINATAL MORTALITY RATE
IN LIMPOPO PROVINCE
by
PHOGOLE CRAWFORD MAESELA
submitted in accordance with the requirements for
the degree of
MASTER OF PUBLIC HEALTH
at the
UNIVERSITY OF SOUTH AFRICA
SUPERVISOR: PROF KA MABOE
OCTOBER 2018

ii
DECLARATION
Name: Phogole Crawford Maesela
Student number: 44439121
Degree: Masters in Public Health
I declare that the dissertation Factors contributing to the increased perinatal
mortality rate in Limpopo province is my own work and that all the sources that I have
used or quoted have been indicated and acknowledged by means of complete
references.
20 OCTOBER 2018
SIGNATURE DATE
iii
FACTORS CONTRIBUTING TO THE INCREASED PERINATAL MORTALITY RATE
IN LIMPOPO PROVINCE
STUDENT NUMBER 44439121
STUDENT NAME PHOGOLE CRAWFORD MAESELA
DEGREE MASTERS IN PUBLIC HEALTH
DEPARTMENT HEALTH STUDIES, UNIVERSITY OF SOUTH AFRICA
SUPERVISOR PROFESSOR KA MABOE
ABSTRACT
The purpose of the study was to determine the causes, of the increased perinatal
mortality, identify and describe other factors contributing to the increased perinatal
mortality rate in a rural healthcare facility situated in Sekhukhune district in Limpopo
province, and to formulate the recommendations that will reduce the perinatal mortality
rate based on the results. A quantitative, descriptive, cross-sectional and retrospective
design was conducted. The study population was one hundred and sixty two (162)
records of babies who died in the perinatal facility from the 1st January 2015 to the 31st
December 2015 with a gestational age of about 28 weeks or more. No sampling was
done, but a census was used. The sample comprised of one hundred and sixty two (162)
of all the records related to perinatal mortality. Data were collected from patients’ records
by using a checklist. Analysis of the data was performed by the IBM Statistical Package
for Social Sciences (SPSS) version 14 computer software. Frequency tables and pie
graphs were used to present the data.
The results indicated that 75.3% (n=122) of the records were associated with health
personnel as a factor contributing to perinatal mortality. Furthermore, preterm cases
accounted for 45.1% (n=73) and prematurity accounted for 37.0% (n=60) of the cases of
perinatal mortality. Therefore, preterm births and prematurity are risk factors that should
be managed immediately after birth, and all babies should be managed prior to being
transferred to the other healthcare institutions.

iv
The recommendations are that the education of patients about early antenatal visit, signs
of labour and danger signs during pregnancy and training of healthcare workers on
record-keeping have to be done on a continuous basis. Managers should conduct quality
improvement programmes, benchmarking and implement maternal and neonatal
guidelines in the clinical area throughout pregnancy.
KEY CONCEPTS
Antenatal, Health care, Labour, Perinatal mortality, Prematurity, Still birth.

v
ACKNOWLEDGEMENTS
My grateful thanks are extended to the following people who contributed to the
successful completion of this study:
First of all, I would like to acknowledge the Trinity of Heaven, to God the Father, the Son
and the Holy Spirit. I can do all things through Christ who strengthens me (Philippians
4:13).
My supervisor, Professor KA Maboe, for her continuous guidance, support, mentoring
and patience.
Technical editor, Mrs Rinnie Matlou, for her superb technical skill in rearranging this work.
Language Editor, Dr Jackie Fourie for the great work done in editing this study.
Bishop MP Matsimela, who is a true spiritual leader. He identified me when I felt that I
was nothing, groomed and nurtured me. I appreciate that.
Upon the Rock Ministries who are my second family and contributed to me being where
I am.
Mrs Albertina Matheba for being such an inspiration to my family. She became a mother
when I needed one. Her emotional support was so helpful during my stressful times.
The Limpopo Department of Health and the managers at one rural institution for allowing
me to conduct the study.
The statistician, Ms Londiwe Msane; for her patience and support.

vi
DEDICATION
I dedicate this thesis to the following special people:
My wife Ntsetsana Suzan Maesela, I love you and thank you very much Mmabo, you
are the pillar that supports my strength, you kept the fire burning during my studies. I
am grateful.
My two boys, Oreratile and Onalerena Maesela, you always bring joy to my face
throughout.
My siblings, you are always proud of me and I did not want to disappoint you, thank
you.

vii
TABLE OF CONTENTS
DECLARATION ................................................................................................................ ii
ABSTRACT .......................................................................................................................iii
ACKNOWLEDGEMENTS ................................................................................................. v
DEDICATION ................................................................................................................... vi
LIST OF FIGURES ........................................................................................................ xiv
LIST OF TABLES ............................................................................................................ xv
LIST OF ANNEXURES .................................................................................................. xvi
LIST OF ACRONYMS AND ABBREVIATIONS ............................................................. xvii
CHAPTER 1 ...................................................................................................................... 1
ORIENTATION TO THE STUDY ...................................................................................... 1
1.1 INTRODUCTION ................................................................................................. 1
1.2 BACKGROUND OF THE STUDY ....................................................................... 2
1.3 STATEMENT OF THE RESEARCH PROBLEM ................................................. 3
1.4 RESEARCH PURPOSE ...................................................................................... 4
1.4.1 Research objectives ...................................................................................... 4
1.4.2 Research questions ...................................................................................... 4
1.4.3 Significance of the study ............................................................................... 4
1.5 DEFINITIONS OF KEY CONCEPTS .................................................................. 5
1.6 RESEARCH SETTING ........................................................................................ 6
1.7 RESEARCH DESIGN AND METHODS .............................................................. 6
1.7.1 RESEARCH DESIGN ................................................................................... 6
1.7.1.1 Quantitative approach ............................................................................... 7
1.7.1.2 Non-experimental approach ...................................................................... 7
1.7.1.3 Descriptive approach ................................................................................. 7
1.7.1.4 Cross-sectional approach .......................................................................... 7
1.7.1.5 Retrospective document analysis .............................................................. 8
1.7.2 RESEARCH METHOD ................................................................................. 8
1.7.2.1 Population .................................................................................................. 8
1.7.2.2 Sampling technique and sample ............................................................... 8
1.7.2.2.1 Sampling technique .............................................................................. 8
1.7.2.2.2 Sample.................................................................................................. 9

viii
1.7.2.3 Inclusion and exclusion criteria ................................................................. 9
1.7.2.4 Development and pre-testing of an instrument ......................................... 9
1.7.2.5 Data collection ......................................................................................... 11
1.7.2.6 Data management and analysis .............................................................. 12
1.8 VALIDITY AND RELIABILITY............................................................................ 12
1.8.1 VALIDITY .................................................................................................... 12
1.8.2 RELIABILITY ............................................................................................... 12
1.9 ETHICAL CONSIDERATIONS .......................................................................... 13
1.9.1 Researcher specific ethical considerations ................................................ 13
1.9.2 Records specific ethical considerations ...................................................... 13
1.9.2.1 Informed consent ..................................................................................... 13
1.9.2.2 Confidentiality and anonymity ................................................................. 14
1.9.2.3 Beneficence ............................................................................................. 14
1.9.2.4 Justice ...................................................................................................... 14
1.9.2.5 Privacy ..................................................................................................... 15
1.10 SCOPE AND LIMITATIONS OF THE STUDY .................................................. 15
1.11 STRUCTURE OF THE DISSERTATION .......................................................... 16
1.12 CONCLUSION ................................................................................................... 16
CHAPTER 2 .................................................................................................................... 17
LITERATURE REVIEW .................................................................................................. 17
2.1 INTRODUCTION ............................................................................................... 17
2.2 THEORETICAL BACKROUND OF PERINATAL MORTALITY RATES ........... 17
2.3 PERSPECTIVES ON PERINATAL MORTALITY RATE ................................... 18
2.3.1 SOUTH AFRICA ......................................................................................... 18
2.3.1.1 Registered perinatal mortalities in South Africa ...................................... 19
2.3.1.1.1 Age differentials in perinatal mortalities ............................................. 20
2.3.1.1.2 Age differential in early perinatal mortalities ...................................... 21
2.3.1.1.3 Distribution of mortalities by month and year of mortalities ............... 22
2.3.1.1.4 Differentials in perinatal mortalities by province ................................. 23
2.3.2 AFRICA ....................................................................................................... 24
2.3.3 INTERNATIONAL ....................................................................................... 25
2.4 CURRENT FACTORS CONTRIBUTING TO PERINATAL MORTALITY ......... 25
2.4.1 Perinatal factors ............................................................................................. 26
ix
2.5 CURRENT INTERVENTIONS TO IMPROVE PERINATAL MORTALITY ........ 27
2.5.1 Interventions to improve perinatal mortality ................................................ 27
2.5.1.1 Interventions during the antenatal period to reduce perinatal mortality .. 27
2.5.1.2 Intervention during labour and birth in the prevention of intra-partum- related perinatal mortalities. .................................................................... 28
2.5.1.3 Interventions to reduce premature-related mortalities ............................. 28
2.6 CURRENT RECOMMENDATIONS TO IMPROVE PERINATAL HEALTH CARE SERVICES IN SOUTH AFRICA ........................................................................ 29
2.6.1 Current recommendations to improve perinatal health care services (Saugstad 2011:256). .................................................................................. 29
2.7 CONCLUSION ................................................................................................... 30
CHAPTER 3 .................................................................................................................... 31
RESEARCH DESIGN AND METHODS ......................................................................... 31
3.1 INTRODUCTION ............................................................................................... 31
3.2 RESEARCH DESIGN ........................................................................................ 31
3.2.1 Quantitative approach ................................................................................. 31
3.2.2 Non- experimental approach ...................................................................... 32
3.2.3 Descriptive approach .................................................................................. 32
3.2.4 Cross-sectional design ................................................................................ 33
3.2.5 Retrospective document analysis ............................................................... 33
3.3 RESEARCH METHOD ...................................................................................... 34
3.3.1 Research setting ......................................................................................... 34
3.3.2 Population ................................................................................................... 34
3.3.3 Sampling technique and sample size ......................................................... 35
3.3.3.1 Sampling technique ................................................................................. 35
3.3.3.2 Sample size ............................................................................................. 35
3.3.4 Inclusion and exclusion criteria ................................................................... 35
3.3.5 Development and pre-testing of an instrument ........................................... 36
3.3.5.1 Pre-testing of an instrument .................................................................... 37
3.4 DATA COLLECTION ......................................................................................... 38
3.5 DATA MANAGEMENT AND ANALYSIS ........................................................... 39
3.6 VALIDITY AND RELIABILITY............................................................................ 40
3.6.1 Validity ......................................................................................................... 40
3.6.1.1 External validity ........................................................................................ 40

x
3.6.1.2 Internal validity ......................................................................................... 40
3.6.1.3 Content validity ........................................................................................ 41
3.6.1.4 Face validity ............................................................................................. 41
3 6.2 RELIABILITY ............................................................................................... 41
3.7 ETHICAL CONSIDERATIONS .......................................................................... 42
3.7.1 Researcher- specific ethical considerations ............................................... 42
3.7.2 Records- specific ethical considerations .................................................... 42
3.7.2.1 Informed consent ..................................................................................... 42
3.7.2.2 Confidentiality and anonymity ................................................................. 43
3.7.2.3 Beneficence ............................................................................................. 43
3.7.2.4 Justice ...................................................................................................... 43
3.7.2.5 Privacy ..................................................................................................... 44
3.8 CONCLUSION ................................................................................................... 44
CHAPTER 4 .................................................................................................................... 45
DATA ANALYSIS, PRESENTATION AND INTERPRETATION OF RESULTS .......... 45
4.1 INTRODUCTION ............................................................................................... 45
4.2 DATA MANAGEMENT AND ANALYSIS ........................................................... 45
4.3 RESEARCH RESULTS ..................................................................................... 46
4.3.1 SECTION A ................................................................................................. 47
4.3.1.1 Outcome of the baby’s delivery ............................................................... 47
4.3.1.2 Baby’s birth weight .................................................................................. 48
4.3.1.3 Baby’s Apgar score in the 1st and 5th minute ......................................... 49
4.3.2 SECTION B ................................................................................................. 50
4.3.2.1 Age on admission .................................................................................... 50
4.3.2.2 Reasons for admission ............................................................................ 51
4.3.2.3 Problems on admission ........................................................................... 52
4.3.2.4 Appropriate management taken by health care workers ........................ 53
4.3.2.5 Further assessments conducted by health workers ................................ 54
4.3.2.6 Maternal risk factors ................................................................................ 55
4.3.2.7 Perinatal risks .......................................................................................... 56
4.3.2.8 Perinatal risk factors ................................................................................ 57
4.3.2.9 Estimated gestational age ....................................................................... 58
4.3.3 SECTION C ................................................................................................. 58

xi
4.3.3.1 Classification of neonates according to weight for gestational age ........ 59
4.3.3.2 The plan of care available ....................................................................... 60
4.3.3.3 Resuscitation done .................................................................................. 61
4.3.3.4 Gestational age in weeks ........................................................................ 62
4.3.3.5 Days after giving birth .............................................................................. 63
4.3.3.6 Intervention taken by health care workers .............................................. 64
4.3.3.7 Referral to the neuro-surgeon ................................................................. 64
4.3.3.8 Recommendations done by patient safety incident (psi) committee ....... 65
4.3.3.9 Delay in seeking help by patient or family ............................................... 66
4.3.3.10 Declined treatment by the family or patient .......................................... 67
4.3.3.11 Other factors contributing to increasing perinatal mortality by patient or family ................................................................................................... 68
4.3.3.11.1 Logistics: delay of emergency medical service (ems) ...................... 69
4.3.3.11.2 Logistics: accessibility or availability of transport ............................. 70
4.3.3.11.3 Logistics: Other factors contributing to increasing perinatal mortality (n=162) .............................................................................................. 71
4.3.3.11.4 Facilities: Lack of services after hours .............................................. 72
4.3.3.11.5 Facilities: Lack of equipment ............................................................ 73
4.3.3.11.6 Facilities: Other factors contributing to increasing perinatal mortality ........................................................................................................ 73
4.3.3.11.7 Health personnel problems: Poor labour monitoring ........................ 74
4.3.3.11.8 Health personnel problems: Lack of education about transport ....... 75
4.3.3.11.9 Health personnel problems: Delays in taking appropriate action to reduce perinatal mortality ................................................................. 76
4.3.3.11 10 Health personnel problems: Other factors contributing to increasing perinatal mortality ........................................................................... 77
4.3.3.11.11 Health or, and illness of the neonate: Prematurity .......................... 79
4.3.3.11.12 Health or /and illness of the neonate: Pneumonia .......................... 79
4.3.3.11.13 Health or /and illness of the neonate: Birth asphyxia ..................... 80
4.3.3.11.14 Health or/and illness of the neonate: Other factors contributing to increasing perinatal mortality .......................................................... 81
4.4 IDENTIFIED CAUSES AND OTHER FACTORS RELATED TO PERINATAL MORTALITY BASED ON THE RESULTS OF THE STUDY ............................. 81
4.5 NUMBER OF DAYS IN NEONATAL UNIT ON DISCHARGE OR DEATH ....... 83
4 6 CONCLUSION ................................................................................................... 83

xii
CHAPTER 5 .................................................................................................................... 84
DISCUSSION, CONCLUSION AND RECOMMENDATIONS ....................................... 84
5.1 INTRODUCTION ............................................................................................... 84
5.2 SUMMARY OF THE RESEARCH RESULTS ................................................... 84
5.2.1 Outcome of the baby’s delivery .................................................................. 84
5.2.2 Baby’s birth weight ...................................................................................... 85
5.2.3 Baby’s Apgar score in the first and fifth minute ............................................. 85
5.2.4 Age on admission ....................................................................................... 86
5.2.5 Reasons for admission ............................................................................... 86
5.2.6 Problems on admission ............................................................................... 87
5.2.7 Appropriate management taken ................................................................. 87
5.2.8 Further assessment conducted .................................................................. 88
5.2.9 Maternal risk factors .................................................................................... 88
5.2.10 Perinatal risks ............................................................................................. 89
5.2.11 Perinatal risk factors ................................................................................... 89
5.2.12 Estimated gestational age .......................................................................... 89
5.2.13 Classification of neonate according to weight for gestational age ............. 90
5.2.14 Plan of care available .................................................................................. 91
5.2.15 Resuscitation done ..................................................................................... 91
5.2.16 Gestational age in weeks ............................................................................ 91
5.2.17 Days after giving birth ................................................................................. 92
5.2.18 Interventions taken by health care workers ................................................ 92
5.2.19 Other referral to neuro-surgeon .................................................................. 93
5.2.20 Recommendations done by patient safety incidents committee ................ 93
5.2.21 Factors identified from the patient’s family or patient: Delay in seeking help ..................................................................................................................... 94
5.2.22 Declined treatment by the family or patient ................................................ 94
5.2.23 Other factors contributing to increasing perinatal mortality according to patient or family ........................................................................................... 95
5.2.24 Logistics: Delay of emergency medical service .......................................... 96
5.2.25 Logistics: Accessibility or availability of transport ....................................... 96
5.2.26 Logistics: Other factors that contribute to increased perinatal mortality ..... 96
5.2.27 Facilities: Lack of services after hours ........................................................ 97
5.2.28 Facilities: Lack of equipment ...................................................................... 97

xiii
5.2.29 Facilities: Other factors contributing to increased mortality rate................. 97
5.2.30 Health personnel problems: Poor labour monitoring .................................. 97
5.2.31 Health personnel problems: Lack of education about transport ................. 97
5.2.32 Health personnel problems: Delays in taking appropriate action to reduce perinatal mortality ........................................................................................ 98
5.2.33 Health personnel problems: Other factors contributing to increased perinatal mortality rate ................................................................................. 98
5.2.34 Health or, and illness of the neonate: Prematurity ..................................... 99
5.2.35 Health or, and illness of the neonate: Pneumonia ...................................... 99
5.2.36 Health or, and illness of the neonate: Birth asphyxia. .............................. 100
5.2.37 Health or, and illness of the neonate: Other factors contributing to increased perinatal mortality ...................................................................................... 100
5.3 RECOMMENDATIONS ................................................................................... 100
5.3.1 Education .................................................................................................. 100
5.3.2 Clinical practice ......................................................................................... 101
5.3.3 Management ............................................................................................. 101
5.3.4 Future research ......................................................................................... 101
5.4 LIMITATIONS OF THE STUDY ...................................................................... 102
5.5 CONCLUDING REMARKS .............................................................................. 102
LIST OF SOURCES ..................................................................................................... 103
ANNEXURES ............................................................................................................... 113

xiv
LIST OF FIGURES
Figure 4.1: Baby’s birth weight (N=162) ...................................................................... 48
Figure 4.2: Reason for admission (N=162) ................................................................. 51
Figure 4.3: Appropriate management taken (N=162) .................................................. 53
Figure 4.4: Maternal risk factors (N=162) .................................................................... 55
Figure 4.5: Perinatal risks factors (N=162) .................................................................. 57
Figure 4.6: Classification of neonate according to weight for gestational age (N=162)
................................................................................................................... 57
Figure 4.7: Resuscitation done (N=162) ...................................................................... 61
Figure 4.8: Days after giving birth (N=162) ................................................................. 63
Figure 4.9: Referral to neuro-surgeon (N=162) ........................................................... 64
Figure 4.10: Delay in seeking help by patient or family (N=162)................................... 66
Figure 4.11: Other factors contributing to increasing perinatal mortality according to
patient or family (N=162) ........................................................................... 68
Figure 4.12: Logistics: Accessibility or availability of transport (N=162) ....................... 70
Figure 4.13: Facilities: Lack of services after hours (N=162) ........................................ 72
Figure 4.14: Facilities: Other factors Contributing to increasing perinatal mortality
according to facilities (N=162) ................................................................... 73
Figure 4.15: Health personnel problems (lack of education about transport) (N=162) . 75
Figure 4.16: Health personnel problems: Other factors Contributing to increasing
perinatal mortality (N=162) ........................................................................ 77
Figure 4.17: Health and/or illness of the neonate pneumonia (N=162) ........................ 79
Figure 4.18: Health and/or illness of the neonate: other factors contributed to increased
perinatal mortality (N=162) ........................................................................ 81
xv
LIST OF TABLES
Table 1.1: Structure of the dissertation ...................................................................... 16
Table 2.1: Distribution of perinatal mortality by age and year of mortality, 2011-2013
................................................................................................................... 20
Table 2.2: Distribution of early perinatal mortalities ................................................... 21
Table 2.3: Distribution of mortalities by month and year for 2011-2013 .................... 22
Table 2.4: Number and percentage of early perinatal mortality by province and year of
mortality for 2011-2013 ............................................................................. 23
Table 4.1: Outcome of the baby’s delivery (N=162) ................................................... 47
Table 4.2: Baby’s Apgar score in the 1st and 5th minute (N=162) .............................. 49
Table 4.3: Age on admission (N=162) ........................................................................ 50
Table 4.4: Problems on admission (N=162) ............................................................... 52
Table 4.5: Further assessment conducted by health care workers (N=162) ............. 54
Table 4.6: Perinatal risks (N=162) .............................................................................. 56
Table 4.7: Estimated gestational age (N=162) ........................................................... 58
Table 4.8: The plan of care available (N=162) ........................................................... 60
Table 4.9: Gestational age in weeks (N=162) ............................................................ 62
Table 4.10: Intervention taken by health care workers (N=162) .................................. 64
Table 4.11: Recommendations by PSI Committee (N=162) ........................................ 65
Table 4.12: Recommendations by PSI Committee (N=162) ........................................ 67
Table 4.13: Logistics: Delay of emergency medical services (N=162) ........................ 69
Table 4.14: Logistics: Other factors contributing to increasing perinatal mortality ....... 69
Table 4.15: Facilities: Lack of equipment (N=162) ....................................................... 71
Table 4.16: Health personnel problems: Poor labour monitoring (N=162). ................. 73

xvi
Table 4.17: Health personnel problems: Delays in taking appropriate action to reduce
perinatal mortality (N=162) ........................................................................ 74
Table 4.18: Health and, or illness of the neonate: Prematurity (N=162) ...................... 76
Table 4.19: Health and/or illness of the neonate: Birth asphyxia (N=162) ................... 76
LIST OF ANNEXURES
ANNEXURE 1: Ethical Clearance from Health Studies Higher Degrees Committee,
UNISA. ............................................................................................ 113
ANNEXURE 2: Letter seeking permission from the Department of Health: Limpopo
Province (HOD). .............................................................................. 114
ANNEXURE 3: Approval letter from Limpopo province department of health Research
Ethics Committee (HOD). ............................................................... 115
ANNEXURE 4: Letter seeking permission from the Department of Health, Sekhukhune
District where the health care facility is located (DEM). ................. 116
ANNEXURE 5: Approval Letter from the Department of Health, Sekhukhune District
where the health care facility is located (DEM). ............................. 117
ANNEXURE 6: Letter seeking permission from the Department of Health, the
management of the health care facility (CEO). .............................. 118
ANNEXURE 7: Approval letter from the Department of Health, the management of the
health care facility (CEO). ............................................................... 119
ANNEXURE 8: Letter seeking permission from the Department of Health, the neonatal
unit manager of the health care facility (Unit manager). ................. 120
ANNEXURE 9: Approval letter from the Department of Health, the neonatal unit
manager of the health care facility (Unit manager). ....................... 121
ANNEXURE 10: Checklist for data collection ............................................................ 122
ANNEXURE 11: Statistician Report ........................................................................... 132
ANNEXURE 12: Language editor’s Report ............................................................... 133

xvii
LIST OF ACRONYMS AND ABBREVIATIONS
ACCESS Accountability Connection Capacity Essential steps for sick babies
AIDS Acquired immunodeficiency syndrome
ANC Antenatal Care
APH Ante partum Haemorrhage
BANC Basic Antenatal Care
CEO Chief Executive Officer
CHW Community Health Worker
CPD Cephalo Pelvic Disproportion
C/S Caesarean Section
DEM District Executive Manager
DHP District Health Plan
EMS Emergency Medical Services
HB Haemoglobin
HIV Human immunodeficiency virus
HOD Head of Department
MDG Millennium Development Goal
MMR Maternal Mortality Rate
MSL Meconium Stained Liquor
NCU Neonatal care unit
NDOH National Department of Health
PIH Pregnancy Induced Hypertension

xviii
PMTCT Prevention of Mother to child Transmission
PROM Premature Rupture of Membranes
PSI Patient Safety Incident
RDS Respiratory Distress syndrome
SDG Sustainable Development Goal
SFH Symphysis fundal Height
SOP Standard Operating Procedures
SIDS Sudden Infant Death Syndrome
SPSS Statistical Package for the Social Science
UN United Nations
WHO World Health Organization

1
CHAPTER 1
ORIENTATION TO THE STUDY
1.1 INTRODUCTION
National Department of Health (2014b:21) has identified a need to publish statistics
reports on perinatal mortalities. This information is based on administrative records
captured on death notification forms collected from the South African civil registration
system maintained by the Department of Home Affairs .The report discussed the causes
of mortalities of which 22.6 % were related to maternal factors and to complications during
the antenatal period, labour and delivery. Maternal complications account for 13.6 % of
perinatal mortalities.
The report concludes the findings by highlighting the increase in stillbirths from 63 % to
66% between 2011 and 2013. It further recommends that the number of perinatal
mortalities can be reduced by effective and efficient care during pregnancy (National
Department 2014b:26). Furthermore, the increase in perinatal mortality rates has affected
the clinics and community health centres that refer high risk patients to the hospitals.
These institutions should be empowered to prevent pregnancy problems and to prevent
delays in accessing health care services when problems occur (National Department of
Health 2014b:22).
The focus on perinatal mortality is an important developmental measure which was
identified by the eighth (8th) Millennium Development Goals (MDGs) and seventeen (17)
sustainable development goals (SDGs). Goal number 4 of the 8th millennium
development goals (MDGs) states that reducing child mortality remains an important
measure to improve child health. Although it was hoped that there would be progress in
reducing mortality rates in children maternal mortality rates (MMR’s) have not decreased
irrespective of the 8th millennium development goals numbers 4 and 5 which state that
the target for the year 2015 is that the perinatal mortality ratio must be reduced by three-
quarters (Knight, Self & Kennedy 2013:1, Department of Health 2013a:24).

2
Paradoxically, it has not been due to a lack of effective, evidence-based interventions
that this problem persists. The sustainable development goal, number three was
considered after the failures of the 8th millennium development goals in 2015. It focuses
on healthy life styles and promotes well-being for all. Specific goals are addressed based
on the 17 sustainable development goals in line with the topic of this study. The relevant
goal developed by the United Nations (2015:12) strives to achieve the reduction of the
global mortality of new-borns and children under five years of age, aiming to reduce
perinatal mortality to at least as low as 12 per 1,000 live births and under five mortality to
at least as low as 25 per 1,000 live births by the year 2030 in all countries.
The challenges of an increased perinatal mortality rate were identified by the researcher.
Based on the identified problem and on the abovementioned discussion, the researcher
was prompted to conduct a study to determine the causes of an increased perinatal
mortality rate and to identify the factors contributing to its increase in a specific rural health
care facility in the Limpopo province.
1.2 BACKGROUND OF THE STUDY
The Minister of Health is committed to striving for a long and healthy life for all South
Africans where the national service delivery agreement reflects the commitment of the
health care sectors to the reduction of perinatal mortality. The strategies to reduce
perinatal mortality were proposed. These include among others an intention to increase
the availability of contraception to mothers (National Department of Health 2012:13).
Despite this investment in public health there is a high and increasing level of perinatal
mortality in South Africa. Poor transport facilities, lack of proper health care facilities and
lack of appropriately trained staff has contributed to increased perinatal mortality rates.
These factors are responsible for an inability to follow standard procedures, such as
failure to classify pregnancies as low or high risk cases and failure to use Partogram
during labour. These are reported to be some of the deficiencies in procedures which
perpetuate and contribute to the perinatal mortality rate. Poor initial assessments and
diagnoses were also reported to be some of the factors that hinder progress in reducing
perinatal mortality in South Africa (National Department of Health 2014b:27).
3
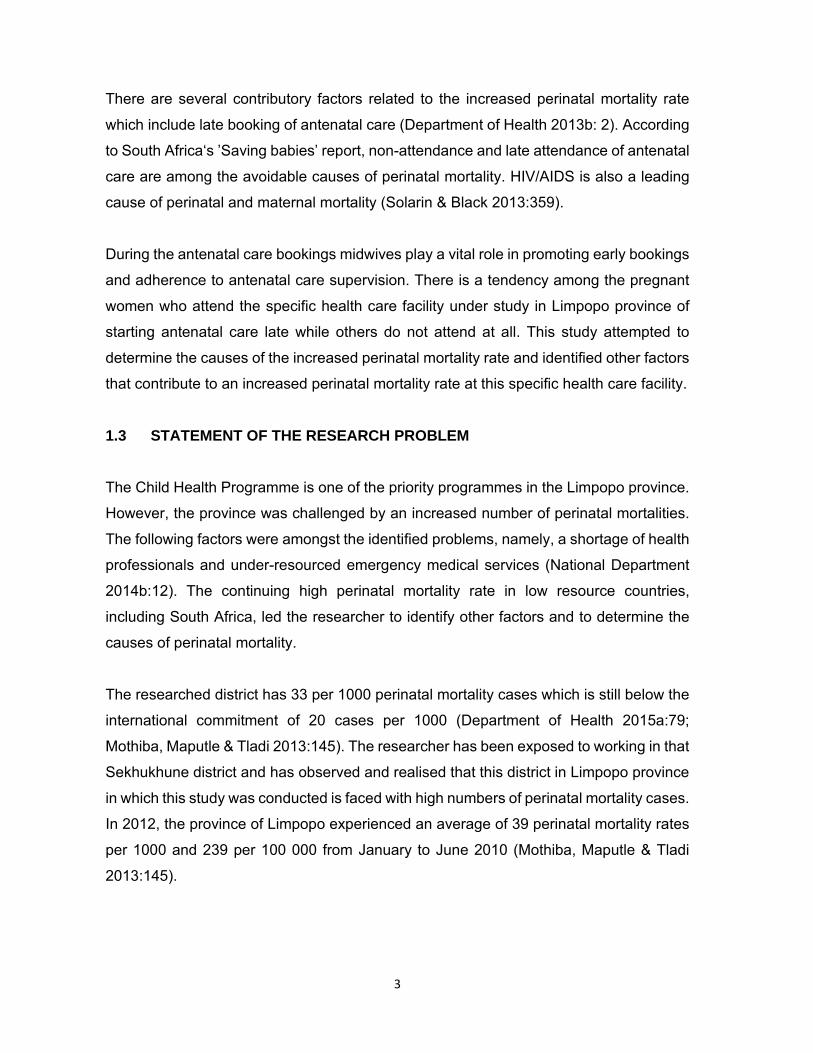
There are several contributory factors related to the increased perinatal mortality rate
which include late booking of antenatal care (Department of Health 2013b: 2). According
to South Africa‘s ’Saving babies’ report, non-attendance and late attendance of antenatal
care are among the avoidable causes of perinatal mortality. HIV/AIDS is also a leading
cause of perinatal and maternal mortality (Solarin & Black 2013:359).
During the antenatal care bookings midwives play a vital role in promoting early bookings
and adherence to antenatal care supervision. There is a tendency among the pregnant
women who attend the specific health care facility under study in Limpopo province of
starting antenatal care late while others do not attend at all. This study attempted to
determine the causes of the increased perinatal mortality rate and identified other factors
that contribute to an increased perinatal mortality rate at this specific health care facility.
1.3 STATEMENT OF THE RESEARCH PROBLEM
The Child Health Programme is one of the priority programmes in the Limpopo province.
However, the province was challenged by an increased number of perinatal mortalities.
The following factors were amongst the identified problems, namely, a shortage of health
professionals and under-resourced emergency medical services (National Department
2014b:12). The continuing high perinatal mortality rate in low resource countries,
including South Africa, led the researcher to identify other factors and to determine the
causes of perinatal mortality.
The researched district has 33 per 1000 perinatal mortality cases which is still below the
international commitment of 20 cases per 1000 (Department of Health 2015a:79;
Mothiba, Maputle & Tladi 2013:145). The researcher has been exposed to working in that
Sekhukhune district and has observed and realised that this district in Limpopo province
in which this study was conducted is faced with high numbers of perinatal mortality cases.
In 2012, the province of Limpopo experienced an average of 39 perinatal mortality rates
per 1000 and 239 per 100 000 from January to June 2010 (Mothiba, Maputle & Tladi
2013:145).

4
1.4 RESEARCH PURPOSE
The purpose of this study was to determine the causes of the increased perinatal mortality
rate and to identify and describe other factors that contribute to its increase in a rural
health care facility in Limpopo province. Furthermore, the recommendations that were
formulated will be communicated to the Department of Health, Limpopo province in order
to assist in the reduction of the perinatal mortality rate in the province.
1.4.1 Research objectives
The research objectives were the following:
To determine the causes of the increase in the perinatal mortality rate.
To identify and describe other factors that contribute to an increase in the perinatal
mortality rate in a specific rural health care facility.
To formulate and present the recommendations to the Limpopo provincial
government based on the results in order to assist in the reduction of the perinatal
mortality rate in Limpopo province.
1.4.2 Research questions
The research questions were the following:
What are the causes of the increased perinatal mortality rates in a specific rural
health care facility?
What are the factors that contribute to an increased perinatal mortality rate?
What recommendations should be made to reduce the perinatal mortality rate?
1.4.3 Significance of the study
The study will provide health care workers with informative knowledge, awareness and a
clear understanding of the factors that contribute to an increase in the perinatal mortality
rate and its effects.

5
Furthermore, the results of the study will assist the researcher to formulate and present
recommendations to the Limpopo provincial government based on the results in order to
assist in the reduction of the perinatal mortality rate in the province of Limpopo.
1.5 DEFINITIONS OF KEY CONCEPTS
1.5.1 Conceptual definitions present the abstract or theoretical meaning of the
concepts studied (Polit & Beck 2012:52). The following terms were defined
conceptually.
1.5.1.1 Cause: Cause refers to a relationship between variables with the presence or
absence of one variable determining the value of the other (Polit & Beck
2012:721).
1.5.1.2 Factor: Factor refers to a circumstance, fact, or influence that contributes to an
event, such as the death of a baby or a mother (Oxford English dictionary
2010:24).
1.5.1.3 Maternal mortality: Maternal mortality refers to the death of a woman while
pregnant or within 42 .days of termination of pregnancy, irrespective of the
duration and site of pregnancy, from any cause related to, or aggravated by
pregnancy or its management, but not from accidental or incidental causes
(World Health Organization 2014:14).
1.5.1.4 Perinatal mortality: Perinatal mortality refers a total number of stillbirths and
early neonatal deaths per 1000 live births (Fraser & Cooper 2012:479).
1.5.1.5 Record: Record refers to the data source that the researcher can use to access
the information (Polit & Beck 2012:190).
1.5.1.6 Records section: Records section refers to a distinct part of an area where the
records are filed and arranged according to a filing system (Oxford new advanced
dictionary 2015:1229).
1.5.1.7 Stillbirth: Stillbirth refers to the death of a foetus after a pregnancy lasting for six
calendar months (Fraser & Cooper 2012:479).

6
1.5.2 Operational definitions: Operational definitions refer to the definition of concept
or variable In terms of procedures by which it is to be measured (Polit & Beck
2012:736)
1.5.2.1 Cause: Cause refers to an element that causes the death of the baby or the
mother.
1.5.2.2 Factor: Factor refers to elements contributing to the death of the mother coming
to deliver irrespective of the gestational age from any cause related to pregnancy
and the number of stillbirths and neonatal death.
1.5.2.3 Maternal mortality: Maternal mortality refers to death of a woman while coming
to deliver irrespective of the gestational age from any cause related to pregnancy.
1.5.2.4 Perinatal mortality: Perinatal mortality refers to the number of still babies died
(either still or macerated and neonatal death from birth 28 weeks of gestational
till delivery at term or post-term (after 41 weeks).
1.5.2.5 Records: Records refer to the documents or piece of evidence constituting the
past information, like maternity case record that contains the information of
mother who attended antenatal care and delivery till death.
1.5.2.6 Records section: Records section refers to separated site where the records
are filed according to hospital guideline or standard operating procedure (SOP).
1.5.2.7 Stillbirth: Stillbirth refers to the death of an infant that has died in the womb after
having survived through at least the first 28 weeks of pregnancy.
1.6 RESEARCH SETTING
The research setting refers to the specific place or places where the data are collected
(Brink, Van der Walt & Van Rensburg 2012:59).The research setting in this study was a
specific rural health care facility in the province of Limpopo.
1.7 RESEARCH DESIGN AND METHODS
1.7.1 RESEARCH DESIGN
Research design refers to the overall plan for obtaining answers to the research
questions (Polit & Beck 2012:58). A quantitative, non-experimental, descriptive, cross-
sectional and retrospective document analysis was used in the form of a checklist. This
research design was utilised to achieve the objectives of this study.

7
1.7.1.1 Quantitative approach
The quantitative approach uses a structured procedure and developed instrument to
gather data. Empirical reasoning is the process of developing specific observations from
the general principles (Brink, Van der Walt & Van Rensburg 2012:6). Deduction was part
of this study since the researcher examined particulars in respect of perinatal mortality
queries and relevant answers in order to draw generalisations about the phenomenon
under study.
1.7.1.2 Non-experimental approach
The non-experimental approach was used in discussing the occurrence of the events
under study. This entailed measuring designated variable variables at a specific time
without manipulating the variables. This approach is also applicable in cases in which
other variables that could be technically manipulated are considered to be ethically non-
manipulative (Polit & Beck 2012:223).In this study, the researcher determined the causes
of increases in perinatal mortality and identified and described other factors that could
contribute to its increase in a rural health care facility in Limpopo province.
1.7.1.3 Descriptive approach
The descriptive approach is utilised when little is known about the concept. This approach
is utilised to increase more information about concept under study. No manipulation of
variables which involve dependent and independent concepts take place during this
approach (Botma, Greef, Mulaudzi & Wright 2010:110). With this approach, all records in
the neonatal unit related to perinatal mortality were used in order to identify and describe
other factors that led to an increase in the perinatal mortality rate.
1.7.1.4 Cross-sectional approach
The cross-sectional approach is approved when records of data are collected at one area
in time and one group is observed in their various stages of development, trends and
patterns. The intention of this approach is to describe the changes in the phenomenon
across different stages (Polit & Beck 2012:184).

8
In this study, the researcher collected data at one point in time and determined the causes
and identified the contributory factors which lead to an increased perinatal mortality rates.
1.7.1.5 Retrospective document analysis
Retrospective document analysis includes those studies in which data in respect of an
outcome occurring in the present is collected and is linked retrospectively to determinants
that occurred in the past. A situation existing in the present is linked to an event that
occurred in the past (Brink, Van der Walt & Van Rensburg 2012:102). The identified data
contained in the records in this specific rural health care facility in Limpopo province were
used. All records used covered the period of 12 months from the 1st January to the 31st
December 2015. A checklist was used to extract data from all the records related to
perinatal mortality.
1.7.2 RESEARCH METHOD
A research method is the technique used to structure a study and to gather and analyse
relevant information (Polit & Beck 2012:741). A quantitative research method was used
in the current study to collect data in the form of a checklist.
1.7.2.1 Population
Population refers to all individuals or objects with common and defining characteristics
(Polit & Beck 2012:13).The population comprised one hundred and sixty two (162)
records of babies who died in the perinatal unit from the 1st January 2015 to the 31st
December 2015.
1.7.2.2 Sampling technique and sample
1.7.2.2.1 Sampling technique
A sampling technique is a process of selecting a group of people, events or elements that
are representative of the population being studied (Grove, Gray & Burns 2015:37). There
was no sampling technique used, a census because the sample size was manageable.

9
All records related to perinatal mortalities were used for data collection and analysis for
this study.
1.7.2.2.2 Sample
A sample refers to a subset of population comprising those selected to participate in a
study Polit & Beck 2012:275). In this study one hundred and sixty two records identified
from the records sections. All these records were reported as perinatal mortalities
happened from the 1st January 2015 to the 31st December 2015.
1.7.2.3 Inclusion and exclusion criteria
Inclusion criteria refer to those characteristics that the subject or an element must
possess to be the part of the target population (Grove, Gray & Burns 2015:250). An
inclusion criterion of this study was all the records related to the perinatal mortality rate
in the record section of the health care facility from the 1st January 2015 to the 31st
December 2015 with the exclusion of the records used during pre-testing.
1.7.2.4 Development and pre-testing of an instrument
Pre-testing of an instrument refers to the data prior to the experimental intervention,
sometimes called the baseline data (Polit & Beck 2012:738). A data instrument was
developed and based on the related literatures which were relevant to the purpose of this
study. Furthermore, information was reviewed to ensure that the relevant items were
included in this instrument. A checklist was developed as an instrument to collect data
for this study. World Health Organization guidelines on neonatal care in South Africa were
also used in assistance to compile this checklist (Department of Health 2013b:44, WHO
2010:7).
Experts on neonatal care were consulted for the evaluation of the checklist instrument’s
internal and content validity. These experts were paediatricians, experienced nurses, a
statistician and the researcher’s supervisor. The instrument developed for data collection
from the perinatal records had three sections (refer to Annexure 10).
10
The questions in section A include items on the outcomes of the delivery, gender of the
infant, birth weight and Apgar score in the first and fifth minute after baby’s birth. The
questions in Section B include the following: age on admission, reason for admission,
problems during admission, appropriate immediate management, and any further
assessment was done to identify perinatal risks, maternal risk factors, perinatal risk,
perinatal risk factors and estimated gestational age.
Section C consists of a classification of the neonate according to the weight for
gestational age, plan of care resuscitation done, and gestational (weeks) at delivery, days
since delivery, interventions, death avoidable according to the Patient Safety Incident
(PSI) committee and contributory factors according to an assessment done (refer to
Annexure10). Elaboration on the development of checklist is addressed in the discussion
of research design and methods in chapter 3.
The checklist was pre-tested at the same health care facility in Limpopo province. Pre-
testing of the checklist for the preparation of data collection was done from the 3rd
September 2017 to the 7th September 2017.
One of the reasons for this pre-test was to test whether the content of the checklist was
relevant and sufficient. Furthermore, the pre-test was done to check the reliability and
validity of the checklist. Five (5) records from the perinatal unit at the health facility were
used to pre-test the checklist. The researcher approached the perinatal unit operational
manager. The operational manager supplied the researcher with the statistics records of
the number of cases of perinatal mortality from the 1st January 2015 to the 31st December
2015. This was found in the admission register provided which was also used to write the
numbers of perinatal mortality cases at the health care facility. The register indicated the
hospital numbers of the deceased babies. Afterwards, the researcher went to the record
section where all the records relating to perinatal mortalities were kept. These records
were requested from the clerk of the record section.
The clerk of the record section extracted five (5) records according to the hospital
numbers provided from the perinatal unit. The records used for pre-testing were not used
during the main study in order to avoid the duplication of the results. The results were
analysed and used to correct the checklists before data were collected for the main study.

11
The final corrected checklist was submitted to the supervisor and statistician for final
approval.
1.7.2.5 Data collection
Data collection is the process of selecting study subjects and gathering information from
them. The real procedure in data collection is detailed to its study and depends on chosen
research design and measuring methods utilised (Polit & Beck 2012:59). Data was
collected after approval and the permission to conduct the study was granted by the
relevant authorities. Since it was impossible to trace the deceased, the letter of
permission from the office of the CEO of the hospital to conduct the study was used as
consent to conduct the study (refer to Annexure 7).
Data was collected from the record section of the specific health care facility. The records
that were targeted to be used to collect information were kept under the supervision of a
record clerk to ensure that no records were taken out of the facility. The researcher
extracted one hundred and sixty two (162) records with the assistance of the record clerk
in the record section where records were kept safe. All these records of babies who died
in the perinatal unit from the 1st January 2015 to the 31st December 2015 were identified,
registered and given to the researcher. The pre-tested checklist was used for data
collection (refer to Annexure 10).
Data was collected from the 16th October 2017 to the 27th October 2017. Data collection
was done during the day from 08:00 to 16:00 on a daily basis from Monday to Friday for
about two weeks. Privacy, confidentiality and anonymity were maintained by allocating
the numbers to the respondents’ records and by de-identifying them. The names of health
care professionals were not used on the data collected. After the data had been collected,
the records extracted were returned to the clerk using the compiled list as evidence that
they were returned after data collection. The checklists were kept under lock and key for
safety in a locker which was purchased by the researcher and was put in the facility
manager’s office. The keys of the locker were accessed by the researcher only. The
collected data was captured in the computer by the researcher. The researcher printed
the hard copies of the collected data and put them safe where they could only be
accessed by the researcher.

12
1.7.2.6 Data management and analysis
Data management is a systematic organisation and synthesis of research data and, in
quantitative studies, the testing of hypotheses using those data (Polit & Beck 2012:725).
Descriptive statistics were used to provide answers to the research questions. This
approach allowed the researcher to organise the data in a way that gave meaning and
facilitated insight and to examine the phenomenon from a variety of angles. A
professional statistician assisted in analysing and summarising the data (refer to
Annexure 11) by using STATA Statistical Package for the Social Science (SPSS) version
14.Frequency distribution tables, figures and graphs were used to present and describe
the results of the study (LoBiondo-Wood & Haber 2010:310).
1.8 VALIDITY AND RELIABILITY
1.8.1 VALIDITY
Validity is defined as the degree to which the instrument measures what it is supposed
to measure (Grove, Gray & Burns 2015: 514). External, internal, content and face validity
were addressed. These types of validity will be discussed in the chapter on research
design and methodology.
1.8.2 RELIABILITY
Reliability refers to the degree of consistency or dependability with which an instrument
measures an attribute (Brink, Van der Walt 2012 & Van Rensburg: 126; Wood & Ross-
Kerr 2011:184).
Reliability in this study was assessed by pre-testing the instrument. The checklist was
pre-tested at the same health care facility in Limpopo but the records used for pre-testing
were not used during the main study. Five records (5) from the neonatal unit of this health
facility were used before collecting the data of the main study to ensure that it was
consistent and dependable.
13
1.9 ETHICAL CONSIDERATIONS
1.9.1 Researcher specific ethical considerations
Ethics refers to a system of moral values that is concerned with the degree to which
research procedures adhere to the professional, legal and social obligations of the study
participants (Polit & Beck 2012:727). Approval to conduct the study was granted by the
Research and Ethics Committee at the University of South Africa, Department of Health
Studies (refer to Annexure 1). Furthermore, the letters seeking permission to conduct the
study were written and letters of permission were granted to conduct the study.
Letters seeking consent to conduct the study were written and submitted to the
Department of Health, Limpopo, the Research Ethics Committee in the Limpopo
Department of Health (refer to Annexure 2), Sekhukhune District Health (refer to
Annexure 4), the management of the hospital (refer to Annexure 6) and the neonatal unit
manager (refer to Annexure 8).
Permission letters to conduct the study were granted by the Limpopo Department of
Health Research and Ethics Committee, Head of Department (HOD) (refer to Annexure
3), Sekhukhune District Health District Executive Manager (DEM) (refer to Annexure 5)
the management of the hospital, the Chief Executive Officer (CEO) (refer to Annexure 7)
and the unit manager of the perinatal unit (refer to Annexure 9).
1.9.2 Records specific ethical considerations
1.9.2.1 Informed consent
Informed consent means that the participants have adequate information about the
research, comprehend the information and have the ability to consent to, or decline
participation voluntarily (Polit & Beck 2012:177). In this study, since it was impossible to
trace the deceased, the hospital’s ethical committee gave permission and approval to
conduct the study and this was used as consent to conduct the study (refer to Annexure
7).

14
1.9.2.2 Confidentiality and anonymity
Confidentiality is a pledge that any information which participants have provided will not
be publicly reported in a manner that identifies the participants and will not be accessible
to others (Polit & Beck 2012:163). The researcher used these records in data collection
but the names of health care professionals were not used in the analysis of the data.
Confidentiality was maintained by keeping records anonymous by ensuring that the
patient’s identity could not be linked to the individual’s response. This was achieved by
removing all the identifiers from the data and removing the link between any identifiable
data so that the link could not be established between the data and identified perinatal
records. The researcher used the checklist to collect the information and kept the
checklists under lock and key in a locker after collecting the information from the records
section.
1.9.2.3 Beneficence
Beneficence encompasses three principles, one ought to prevent evil, one ought to
remove evil and one ought to do, or promote good. There should be no one, including
the experts who could be placed at a compromised, or exposed to s situation for which
they were not equipped to handle. (Brink, Van der Walt & Van Rensburg 2012:25).
Retrospective document analysis was applied where people were not directly observed
but the data were collected from the records of the babies. Thus, no harm was done to
the respondents.
1.9.2.4 Justice
The principle of justice refers to participants having the right to fair selection and treatment
and this is also the unifying principle in health and nursing. It includes principles of
fairness and the right to privacy (Brink, Van der Walt & Van Rensburg 2012:36 &37).
After the information pertaining to the deceased was collected, the researcher allocated
a specific number for identification. The information was kept anonymous and no links
were made to the deceased or care providers. No record was taken out of the record
section.

15
1.9.2.5 Privacy
The principle of privacy refers to the ethical consideration of the researcher towards the
individual to determine the interval, range and overall condition under which data will be
shared with, or in remission from others (Botma, Greef, Mulaudzi & Wright 2010:113). In
this study privacy was maintained by ensuring that the data collection was done by the
researcher, numbers allocated to the records were known only by the researcher. The
allocated to the records were de-identified that no records can be associated with the
death of the baby.
1.10 SCOPE AND LIMITATIONS OF THE STUDY
The limitation of this study was that the results cannot be generalised to other district
hospitals. The other limitation was that the records were incomplete.

16
1.11 STRUCTURE OF THE DISSERTATION
The research was structured in five chapters as follows:
Table 1.1: Structure of the dissertation
Chapters Chapter name Description of the chapters
1 Introduction The orientation to the study comprised the introduction,
background to the research problem, the research
statement, the aim of the study, its objectives and a
definition of key terms.
2 Literature Review Literature related to the study was reviewed.
3 Research design
and methods
The chapter on research design and methodology,
focused on research methodology, design, population,
sampling, data collection methods, data analysis
protocol, reliability and validity of the research design
and the data collection instrument. Ethical
considerations were detailed.
4 Data analysis,
presentation and
interpretation.
The results of the study were analysed, presented and
interpreted according to the set objectives.
5 Discussion,
conclusion and
recommendations
This chapter summarised the discussion of the results,
and presented the conclusions and recommendations
of the researcher in relation to the problem statement
and objectives of the study.
1.12 CONCLUSION
This chapter discussed the introduction to, and background of the study. The objectives
and the purpose of the study were discussed. Key terms were defined operationally and
conceptually. Research design methodology and ethical considerations were discussed.
The next chapter will be literature review.
17
CHAPTER 2
LITERATURE REVIEW
2.1 INTRODUCTION
This chapter outlines the literature reviewed in regard to the factors contributing to the
perinatal mortality rate in Limpopo. A literature review involves a search for information
on the current topic and a systemic organisation of the information. It indicates what is
currently known and lacking (Brink, Van der Walt & Van Rensburg 2012:71). The
literature review was conducted to generate a picture of what was known and not known
about the problem of perinatal mortality (Burns & Grove 2011:37).
The following items were discussed:
Theoretical background in regard to perinatal mortality rates;
Perspective of perinatal mortality rate in South Africa, Africa and countries abroad;
Possible contributory factors to the current perinatal mortality rate;
Current interventions to decrease the perinatal mortality rate; and
Current recommendations to improve perinatal health care services in South
Africa.
2.2 THEORETICAL BACKROUND OF PERINATAL MORTALITY RATES
As the 8th millennium development goals expired in 2015, a new set of goals, the
sustainable development goals (SDGs), are being discussed and are expected to shape
the development agenda in the post-2015 era. The draft SDG framework includes 17
goals and 169 targets which were developed by the United Nation’s Open Working Group
on Sustainable Development Goals. Goal 3 is a broad health goal which is to ensure
healthy lives and promote well-being for all at all ages”. It includes two targets that
influence maternal mortality and reproductive health (Department of Health 2015c:21).

18
Sustainable development goal no 3.7 is aimed at ensuring universal access to sexual
and reproductive health-care services, including family planning, information and
education and the integration of reproductive health into national strategies and
programmes by the year 2030 (UN 2015:1).
Perinatal mortalities are an indicator of the quality of pre-natal, obstetric and neonatal
care. They provide the information needed to improve care for pregnant women, new-
born babies and new mothers (Onwudiegwu & Awowole 2012:6). Specifically, recent
evidence indicates that globally, deaths during the perinatal phase are responsible for
almost 40% of all infant deaths (Ezechi & David 2012:4). According to the World Health
Organization’s (2012:357) survey on global health, there were over 6.3 million perinatal
mortality globally of which 2.64 million were stillbirths and 3.0 million were cases of early
neonatal mortality respectively.
2.3 PERSPECTIVES ON PERINATAL MORTALITY RATE
2.3.1 SOUTH AFRICA
The perinatal problem identification programme has been used as a facility-based audit
system for monitoring the quality of care and perinatal mortality. Data are collected from
different institutions where deliveries take place. According to the findings of the collected
data, the perinatal mortality rates in Limpopo province have not changed over the last 10
years. Most stillbirths and perinatal deaths occur in the specific rural health care facility
which forms part of this study. The overall perinatal mortality for all infants with birth
weight of less than 500 grams was twelve per 1000 live births and nine per 1000 live
births for those weighing more than 1000 grams. The perinatal mortality was high in
women younger than 18 years of age, that is, 65 per 1000 births, followed by women over
the age of 34 years of age, that is, 50 per 1000 births (Department of Health 2014:81).
The following obstetric causes were found to be associated with perinatal mortalities.
About 22% were unexplained uterine deaths, 12% spontaneous pre-term labour, 16%
intra-partum hypoxia and trauma, 15% maternal infections, and 11% were ante-partum
haemorrhage. The district and provincial hospitals reporting on these mortalities indicated
that less than a quarter 20% of the mortalities was absolutely avoidable (Rhoda,
Greenfield, Muller, Prinsloo, Kauchali & Kerber 2014:162).

19
Limpopo province is one of the poorest and fourth largest provinces in South Africa with
an estimated population of 5.5 million people. The birth-rate is at 21% of the total
population and the perinatal mortality rate is at 41% (Department of Health 2015a:81).
Thus, the researcher was prompted to identify the factors and make recommendations
that could reduce this perinatal mortality.
The perinatal mortality rates are a combination of the number of foetuses that are born
dead (stillbirths) and the number of those babies who die in the first week after birth (Oti
& Odimegwu 2011:1). In South Africa, the Birth and Death Registration Act (Act No 51 of
1992:) states that a stillborn infant refers to a child who has had at least 26 weeks of intra-
uterine existence but shows no sign of life after a complete birth. Furthermore, in terms
of the regulation on the registration of births and mortalities, the mortality occurs due to
natural causes, informants (Midwife, advanced midwife or doctor) shall give, within 72
hours, notice of the mortality’. If there is any doubt as to whether the mortality was due to
natural causes, such mortality must be reported to a police officer (National Department
2014b:21).
2.3.1.1 Registered perinatal mortalities in South Africa
This section indicates recent trends in perinatal mortality for the distribution of mortalities
which occurred from 2011 to 2013. It is presented by age in days and hours, month of
occurrence, population group and province where mortality occurred.
20
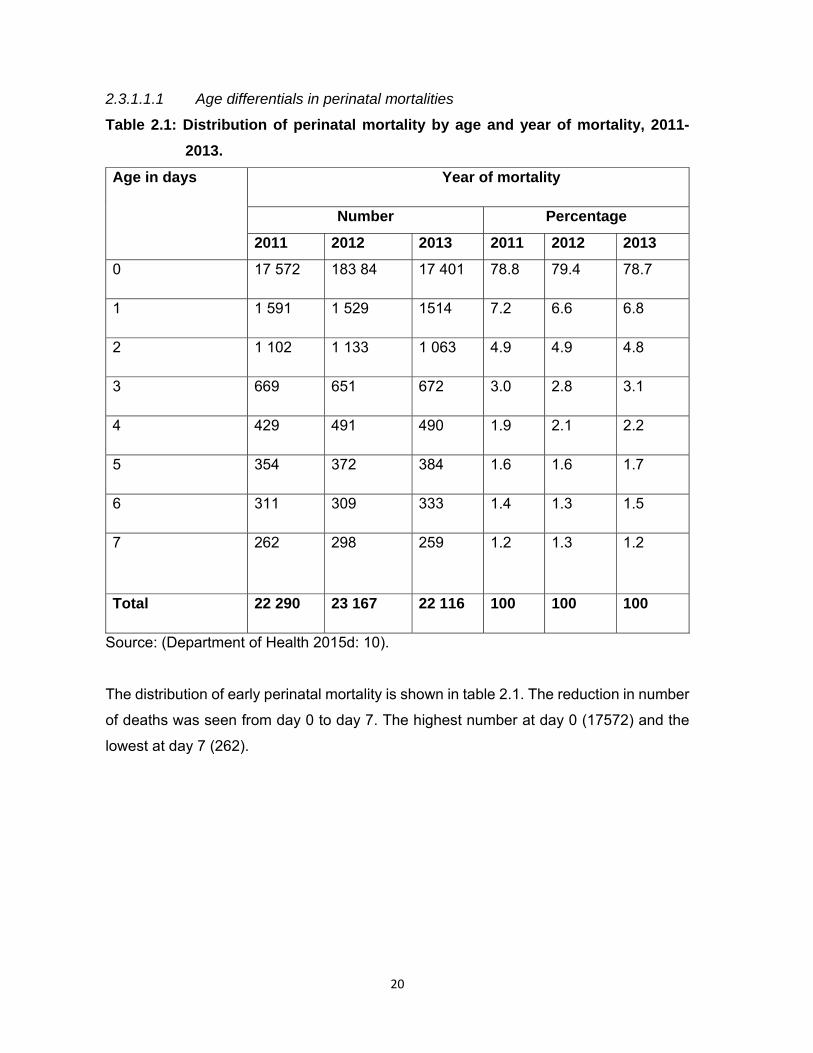
2.3.1.1.1 Age differentials in perinatal mortalities
Table 2.1: Distribution of perinatal mortality by age and year of mortality, 2011-
2013.
Age in days Year of mortality
Number Percentage
2011 2012 2013 2011 2012 2013
0 17 572 183 84 17 401 78.8 79.4 78.7
1 1 591 1 529 1514 7.2 6.6 6.8
2 1 102 1 133 1 063 4.9 4.9 4.8
3 669 651 672 3.0 2.8 3.1
4 429 491 490 1.9 2.1 2.2
5 354 372 384 1.6 1.6 1.7
6 311 309 333 1.4 1.3 1.5
7 262 298 259 1.2 1.3 1.2
Total 22 290 23 167 22 116 100 100 100
Source: (Department of Health 2015d: 10).
The distribution of early perinatal mortality is shown in table 2.1. The reduction in number
of deaths was seen from day 0 to day 7. The highest number at day 0 (17572) and the
lowest at day 7 (262).

21
2.3.1.1.2 Age differential in early perinatal mortalities
The distribution of early perinatal mortalities is shown in table 2.2 for 2011-2013
Table 2.2. Distribution of early perinatal mortalities
Age in hours
Year of mortality
Number Percentage
2011 2012 2013 2011 2012 2013
Under 1 hour 1 783 1 139 196 22.1 13.4 2.6
1-23 hours 1 577 2 589 2 601 19.5 30.4 34.6
24-167 hours 4 718 4 783 4 715 58.4 56.2 62.8
Total 8 078 8 504 7 512 100 100 100
Source: (Department of Health 2015d: 15).
Each of three years in the distribution of early perinatal mortality is shown in table 2.2.
More than 50% of the early perinatal mortalities occurred between 24 hours to 167 hours
after birth. This is followed by babies who were aged between one and twenty-three
hours. The least number of early perinatal mortalities occurred in babies aged less than
one hour.

22
2.3.1.1.3 Distribution of mortalities by month and year of mortalities
Table 2.3: Distribution of mortalities by month and year for 2011-2013.
Month of death
Year of mortality
Number Percentage
2011 2012 2013 2011 2012 2013
January 1 884 2 044 1 992 8.5 8.8 9.0
February 1 704 2 026 1 813 7.6 8.7 8.2
March 2 000 2 076 1 986 9.0 9.0 9.0
April 1 844 1 903 1 877 8.5 8.2 8.5
May 2 019 2 065 1 875 9.1 8.9 8.5
June 1 859 1 855 1 814 8.3 8.0 8.2
July 1 826 1 934 1 800 8.2 8.3 8.1
August 1 772 1 939 1 826 7.9 8.4 8.3
September 1772 1 779 1 696 7.7 7.7 7.7
October 1 808 1 828 1 847 8.1 7.9 8.4
November 1 874 1 804 1 798 8.4 7.8 8.1
December 1 938 1 914 1 779 8.7 8.3 8.0
Total 22 290 23 167 22 116 100 100 100
Source: (Department of Health 2015d: 11).
Table 2.3 shows that there is no noticeable pattern in the distribution of mortalities by
month of death for all three years, except for March and September when the proportions
remained constant in the three years despite changes in absolute numbers.

23
Mortalities were more or less fairly distributed over 12 months of the year, that is, between
7% and 9% each month. However, the month of March had on average the highest
proportion, that is, 9% of perinatal mortalities and September had on average the lowest
proportion of perinatal mortalities, that is, 7% over the three year period.
2.3.1.1.4 Differentials in perinatal mortalities by province
Table 2.4 indicates the number and percentage of early perinatal mortality by
province and year of mortality for 2011-2013.
Province of
death
Year of mortality
Number Percentage
2011 2012 2013 2011 2012 2013
Western Cape 2 161 2 267 2 186 9.7 9.8 9.9
Eastern Cape 1 196 1 240 1 185 5.4 5.4 5.4
Northern Cape 622 689 680 2.8 3.0 3.1
Free State 2 128 1 883 1 719 9.5 8.1 7.8
KwaZulu-Natal 5 231 5 377 5 377 23.5 23.2 24.3
North West 1 862 2 038 1 952 8.4 8.8 8.8
Gauteng 5 233 5 581 5 181 23.5 24.1 23.4
Mpumalanga 1 629 1 794 1 544 7.3 7.7 7.0
Limpopo 1 841 2 091 2 116 8.3 9.0 9.6
Unspecified 384 204 176 1.6 0.9 0.7
Total 22 287 23 164 22 116 100 100 100
Source: (Department of Health 2015d: 13).
24
It is important to note that the percentage distribution of mortality by province of death
occurrence shown in table 2.4 is largely similar to the distribution of the South African
population by province. The distribution of perinatal mortalities by province shows wide
disparities. Kwa-Zulu Natal and Gauteng had the highest proportion of perinatal
mortalities, but these proportions may be related to high population numbers.
2.3.2 AFRICA
A study by Mmbaga, Lie, Kibiki Olomi, Kvale and Datveit (2011:2) was conducted in
Tanzania on the factors that contribute to the transference of babies to neonatal care
units. The purpose of the study was to estimate the influence of pregnancy-related
maternal medical conditions on the health of unborn babies during the antenatal and
intra-partum periods in order to reduce mortality by focusing on morbidity. However, it is
also of importance to consider factors associated with perinatal morbidity which lead to
perinatal mortality. In the aforementioned study, perinatal morbidity led to the transfer of
babies to neonatal care units (NCU).This could serve as an indicator of morbidity which
could be used for designing and implementing interventions aimed at improving health
and increasing perinatal survival. The results indicated the strong associations between
neonatal transfer and perinatal risk factors to mortality. Generally, transfer is more likely
in the case of babies who show signs of poor health status, or in the case of a complicated
pregnancy (Mmbaga, Lie, Kibiki, Olomi, Kvale & Datveit 2011: 2).
A study by Rajab and Ghareba (2013:195) was conducted on the perinatal mortality rate
in a special care unit at the Gharian Teaching Hospital in Libya. The aim of the study was
to identify the main causes of perinatal syndrome and prematurity. The mortality was
found to be 71% for premature new-borns. The consequence of a lack of care during
delivery was also identified as a contributory factor. The problems affecting the babies
were found to be preventable, such as birth asphyxia. This study revealed that there was
poor training on resuscitation skills and the majority of the babies who died were
ventilated.
25
In a study done in Cameroon by Nkwabong, Fomulu, Hamida, Onama, Tjek, Kouam and
Ngassa (2011:2) NB, early perinatal mortalities were significant in older women primi
gravidas due to low Apgar scores. The poor Apgar scores were related to poor dilation of
the cervix despite good uterine contractions and to rigid perineum.
2.3.3 INTERNATIONAL
In a study conducted by Moura, Maesta, Rugolo, Angluski, Caldeira, Peracoli and Ruge
(2014:4) in Brazil on the factors leading to perinatal mortality at two different levels of
care, it was found that perinatal mortality occurred during the early perinatal period.
Prematurity was found to be associated with higher mortality.
A study was conducted in Bangladesh by Khatun, Rasheed, Moran, Alam, Shomik,
Sultana, Choudhury, Iqbal and Bhuiya (2012:3) in the Dhaka slums on the causes of
maternal and perinatal mortalities and its consequences for quality health care service
delivery. The study found birth asphyxia to be the main contributory factor related to the
mortalities, lack of resuscitation after birth and lack of referrals to hospital post-delivery
as the contributory factors to perinatal mortalities. Most of these perinatal mortalities
occurred within seven days after birth.
In a study conducted in Rajshahi Medical College hospital to evaluate the existing set-up
of perinatal mortality in the perinatal unit, prematurity was the common cause of
admissions (Bari, Ullah & Khatun 2008:35). The majority of these pre-term babies were
severely depressed at birth with low Apgar scores at one minute. The commonest cause
of perinatal mortality was birth asphyxia. The study found that the mortality rate was
inversely associated with birth weight during the early natal period.
2.4 CURRENT FACTORS CONTRIBUTING TO PERINATAL MORTALITY
There are general factors contributing to increased perinatal mortality. These current
factors played a role before this current study was conducted. This study focused
specifically on determining the causes and identifying and describing other factors that
contributed to an increase in the perinatal mortality rates in a specific rural health care
facility.
26
Its purpose was to present recommendations based on the results in order to reduce
perinatal mortality in a specific rural health care facility in Limpopo province in general
and specifically in the Sekhukhune district where the problem was identified.
2.4.1 Perinatal factors
Infection rate in the perinatal period contributes to neonatal mortality. The infections may
be from maternal vaginosis or untreated acquired sexual transmitted infection from a
colonised birth canal. A study was conducted in Malawi on the effect of prophylactic
antibiotics on women with premature rupture of the membrane. It is not clear whether the
antibiotics had any effect in preventing the infants from being infected (Saugstad
2011:253). The study conducted in India on Bacteriological profile of neonatal
septicaemia and antibiotic susceptibility pattern of the isolates found that neonatal sepsis
was noted as one of the factors leading to perinatal mortality in infants born prematurely
(Eichenwald 2013:1088).
The following diseases, namely, pneumonia, diarrhoea and malaria accounted for 43%
of all deaths in children under the age of five years worldwide in 2008. Pneumonia and
diarrhoea together account for one-third of all under-five deaths. According to this report,
most of these lives could have been saved through low-cost prevention and treatment
measures, including antibiotics for acute respiratory infections, oral rehydration for
diarrhoea, immunisation and the use of insecticide-treated mosquito nets and appropriate
drugs for malaria. There is a need to refocus attention on pneumonia and diarrhoea as
they are two of the three main killers of children (WHO 2010:3).
Baby asphyxia is found amongst the top five causes of under-five mortality in Africa. This
birth asphyxia is a preventable condition if a woman is managed properly during second
and third stage of labour (Velaphi & Rhoda 2012:66). In a study conducted in China on
the effect of the second stage of labour on maternal and neonatal outcomes, it was found
that a prolonged second stage of labour can decrease the Apgar score at one minute and
can increase the incidence of asphyxia at birth (Li, Zhang, Ling & Jin 2011:410).
27
2.5 CURRENT INTERVENTIONS TO IMPROVE PERINATAL MORTALITY
Various interventions were implemented before the current study was conducted. Despite
the interventions the problem of the perinatal mortality rate still persists as previously
discussed in the section on the South African perspective. Therefore, the researcher
intends to make recommendations that would contribute to reducing perinatal mortality in
a specific rural health care facility situated in Limpopo province.
2.5.1 Interventions to improve perinatal mortality
2.5.1.1 Interventions during the antenatal period to reduce perinatal mortality
Maternal health plays a major role during pregnancy and has an effect on the health of
the baby. According to the guidelines for maternity care (Department of Health 2015b:34),
the woman needs to start attending the antenatal care clinic at the time that she misses
her first menstrual period (Beauclair, Petro & Meyer 2014:2).
The following actions must be done during the first antenatal care visits: physical
examination, history taking related to the present and current pregnancy, social, medical,
obstetrical history and family history are recorded. Full examination of the pregnant
woman is performed and her weight, height, heart and respiratory rate are monitored,
including pulse and blood pressure. In addition, the pregnancy is measured by calculating
the gestational period by dates and by abdominal palpations and by measuring
Symphysis-fundal height (SFH). The Mid-upper arm circumference is measured to
determine the nutritional status of the pregnant woman (Department of Health 2015b:34).
The pregnant woman will be screened for anaemia by checking her haemoglobin level.
Iron and folic acid are given to the pregnant mother as prophylaxis. This supplementation
with iron improves the new-born’s birth weight in those women who start pregnancy with
an iron deficiency, and makes no significant difference to those women who are not
deficient (Aranda, Ribot, Garcia, Viteri & Arija 2011:791).
Tetanus toxoid was endorsed by World Health Organization (WHO) in 2014 on principles
and considerations for adding a vaccine to a national immunization programme during
antenatal care to prevent neonatal tetanus that can be fatal to the babies (WHO 2014:19).

28
A survey was conducted in India on the incidence of neonatal tetanus in pregnant women
who were immunised against tetanus. The results indicated a reduction in the perinatal
mortality rate to above 80% in the total deliveries (Khan, Zahidie & Rabbani 2013:4).
2.5.1.2 Intervention during labour and birth in the prevention of intra-partum-
related perinatal mortalities.
The interventions to reduce perinatal mortality in South Africa included improvements in
basic obstetric care (Velaphi & Rhoda.2012:70). These include:
Providing elementary and inclusive emergency obstetric care.
Identifying and categorising high risk clients at antenatal health care facilities.
Administer the antibiotics during pre-term labour, oxytocic and steroids during pre-
term labour, and continuous monitoring of women in labour;
Referral of pregnant women not meeting basic antenatal care specifically mothers
with medical conditions, such as pregnancy-induced hypertension (PIH) to the
relevant health care facilities for further assessment and management.
Immediate care of the baby after delivery and on-going perinatal health care.
2.5.1.3 Interventions to reduce premature-related mortalities
Universally, studies were completed and prematurity was identified as a challenge and
contributes to 40% to 80% of perinatal mortality cases. The study conducted in Malawi
indicated that the mothers who experience pre-term labour and premature rupture of
membranes reacts positively to an administration of antibiotics. This administration of
antibiotics demonstrated protective effect to reduce the infection that may lead to
perinatal mortality. Mothers are also advised to stop smoking during pregnancy to reduce
the incidence of intra-uterine growth restriction (Saugstad 2011:255).

29
2.6 CURRENT RECOMMENDATIONS TO IMPROVE PERINATAL HEALTH CARE
SERVICES IN SOUTH AFRICA
Maternal health plays a major role during pregnancy and has an effect on the health
outcomes of the baby. According to the Guidelines for maternity care (Department of
Health 2015b:34), the woman needs to start attending the antenatal care clinic at the time
she misses her first menstrual period. This will help in early screening and identifying the
risk factors (Beauclair, Petro & Meyer 2014:2).
In spite of the existing recommendations which are generally intended to improve
perinatal and maternal health services, there are no improvements in South Africa in
general and in Limpopo province in particular where the present study was conducted.
This situation has prompted the researcher to determine the causes and identify and
described other factors that have contributed to the increased perinatal mortality rates in
order to present recommendations to the Limpopo Department of Health for
implementation.
2.6.1 Current recommendations to improve perinatal health care services
(Saugstad 2011:256).
Record audits and keeping are suggested to recommend the measures to reduce
perinatal mortality rate.
Develop universal standard system at various level of health care in provision of
quality perinatal services.
Communicate, locally, regional and internationally to exchange good ideas on
universal perinatal health care.
Guiding scientific studies continuously on perinatal health care is to be
emphasized
Provide affordable and quality health care services and access to pre-natal and
post-natal services
Clinics, community health centres and hospitals deliveries should be encouraged
hence pregnant women are managed by qualified and experienced midwives.
30
Invest in provision of equipment (incubators and monitors) and staff in maternity
and neonatal units as required.
Draw evidence based treatment and health care facilities protocols, procedures
and guidelines.
Free essential drugs (tracer drug list) should be provided.
2.7 CONCLUSION
The literature review was outlined, and the theoretical background on the maternal and
perinatal mortality rates were discussed. Perspectives on maternal and perinatal mortality
rates in South Africa, Africa and countries worldwide were discussed. Perinatal mortality
rates were discussed. Current factors contributing to perinatal mortality rates were
discussed. Current interventions to improve perinatal and maternal mortality rates were
outlined. The following chapter deals with the research design and methodology.

31
CHAPTER 3
RESEARCH DESIGN AND METHODS
3.1 INTRODUCTION
The previous chapter addressed the literature review. In this chapter, the research design
and methodology are discussed based on the purpose and objectives of the study.
Furthermore, the following aspects were discussed: the population, sampling,
development and pre-testing of an instrument, data collection and analysis, validity,
reliability and ethical considerations.
3.2 RESEARCH DESIGN
Research design refers to the overall plan for obtaining answers to the research
questions (Polit & Beck 2012: 58). Research design involves a set of decisions regarding
the topic to be investigated in respect of a certain population using particular research
methods, and for a particular purpose. It focuses on the end- product and all the steps in
the process that can achieve the outcome anticipated (De Vos, Strydom, Fouché, &
Delport 2011:156). A quantitative, non-experimental, descriptive, cross-sectional and
retrospective research design was used to achieve the objectives of this study. The
retrospective document analysis used was in the form of a checklist.
3.2.1 Quantitative approach
The quantitative approach requires that the concepts relevant to the study should be
given operational meaning so that the concepts can be measured. A checklist was used
to collect data and a programme for data analysis was chosen. Furthermore, quantitative
approach uses a structured procedure and a formal instrument to collect data. A
quantitative approach also refers to official, unbiased methodical procedures where
statistical information is utilised to achieve evidence about the world (Burns & Grove
2011:17).

32
Cognitive thinking was integrated when the researcher describes the facts of perinatal
mortality queries and answers to draw general views about the phenomenon under
investigation. The results in this study are presented in numerical and statistical form.
The researcher used a checklist to collect data which was predetermined and planned in
advance and, therefore, it could not be changed once the data was collected and the
objectivity of the data collection process was maintained.
3.2.2 Non- experimental approach
The non-experimental design is used in describing the phenomenon under study.
Selected variables were measured at a specific time and there was no manipulation of
variables. Generally, the non- experimental approach is also applicable where another
variable could be technically manipulated and was ethically non-manipulative (Polit &
Beck 2012:223).
In this study, the researcher determined the causes of an increase in perinatal mortality
and, furthermore, identified and described other factors that contributed to its increase in
a specific rural health care facility.
3.2.3 Descriptive approach
A descriptive design approach is used when little is known about the phenomenon. This
approach is used to gain more information about the phenomenon under study. Variables
cannot be manipulated but observed as they occur (Botma, Greef, Mulaudzi & Wright
2010:110).
Burns and Grove (2011:24) state that through descriptive studies researchers describe
what exists, determine the frequency with which something occurs, discover new
meanings and categorise information. The purpose of descriptive design is to identify the
current practice, justify existing practices and determine what these practices done in a
similar situation.

33
In this study, the researcher chose a descriptive approach in order to identify and describe
other factors that contribute to an increase in the perinatal mortality rate and to determine
the causes of an increased perinatal mortality rate in a specific rural facility.
3.2.4 Cross-sectional design
In a cross-sectional approach, data collection is taking place at one place in time and one
cluster is observed in their different levels of progress, trends and patterns. The purpose
of this approach is to explain the alterations in the phenomenon across all levels (Polit &
Beck 2012:184). The advantage of this design is that it is very economical but inferring
changes overtime with this design may be problematic (Polit & Beck 2012:186).
In this study, the researcher collected data at one location where the perinatal records
were extracted in order to identify and describe other factors that contributed to an
increase in the perinatal mortality rate and to determine the causes of an increased
perinatal mortality rate in a specific rural health care facility.
3.2.5 Retrospective document analysis
Retrospective document analysis includes studies in which data is collected about an
outcome occurring in the present and it is linked retrospectively to determinants that
occurred in the past. A phenomenon existing in the present is linked to concepts that
have occurred in the past (Brink, Van der Walt & Van Rensburg 2012:102).
According to Polit and Beck (2012:157), the de–identified data refers to the information
that is eliminated from health records. De-identified data contained in the records in this
specific rural health care facility in Limpopo province were used. All records were used
to cover the period of 12 months from the 1st January to the 31st December 2015. A
checklist was used to extract data from all the records related to the perinatal mortality
rate. In this case, the researcher studied events that had occurred that had an effect on
the perinatal mortality rate. These events cannot be manipulated or controlled to affect
the phenomenon under study.

34
3.3 RESEARCH METHOD
Research method is the technique used to structure a study and to gather and analyse
relevant information (Polit & Beck 2012:741). A quantitative research method was used
to collect data in the form of a checklist.
3.3.1 Research setting
The research setting refers to the specific place or places where the data are collected
(Brink, Van der Walt & Van Rensburg 2012:59).The research setting was a specific rural
health care facility in Limpopo province.
3.3.2 Population
Population refers to all individuals or objects with common and defining characteristics
(Polit & Beck 2012: 13). The population is further deliberated as the total collection of the
incidences of interest to an investigator; these are the multitudes of individuals. However,
the population in this current study was restricted to the records of the in the health care
facility located in Limpopo province
The population can be targeted or accessible. The target population refers to the group
about which information is gathered and a conclusion drawn (Polit & Beck 2012:274).
The target population is clearly defined irrespective of person, time and place. This
contains the eligibility criteria of the study population which has common characteristics
of interest to a researcher (Joubert & Ehrlich 2010:94).
An accessible population is found within the target population from which the researcher
gains access to information. It is regarded as the population available for a particular
study and it is a sub-set of the target population that meets the target group criteria. A
researcher usually draws samples from the accessible population (Polit & Beck
2012:719).
The population in this study consisted of all the records of 162 babies who died in the
perinatal unit from 1 January 2015 to 31 December 2015.
35
3.3.3 Sampling technique and sample size
3.3.3.1 Sampling technique
Sampling involves a process of selecting a group of people, events or elements that are
representative of the population being studied (Grove, Gray & Burns 2015:37). In the
current study, no specific sampling method was used but all the records were used
because the number of infants in the sampling frame was manageable, thus a census
was used. The facility reported one hundred and sixty two (162) incidents of perinatal
mortalities in the district (Department of Health 2015a:82). These one hundred and sixty
(162) records were used to collect data related to perinatal mortality from the 1st January
2015 to the 31st December 2015 and to analyse it.
3.3.3.2 Sample size
Sample size refers to the number of subjects, events, types of behaviour, or situation
examined in a study (Grove, Gray & Burns 2015:266).In this study, the sample size was
one hundred and sixty two (162) cases reported by the health care facility in 2015. The
admission register in the perinatal unit was utilised to determine the sample. All records
which met the inclusion criteria of perinatal mortality reported from the 1st January 2015
to the 31st December 2015 were used as sample size. The records were retrieved from
the record section as it appeared in the perinatal mortality register.
3.3.4 Inclusion and exclusion criteria
An inclusion criterion refers to those characteristics that the subject or an element must
possess to form part of the target population (Grove, Gray & Burns 2015:250).
Inclusion criteria describe the essential characteristics that the participants should have
in order to be eligible to participate (Polit & Beck 2012:274).All the records of babies and
mothers who died in the perinatal unit during the relevant period mentioned above were
identified with the exclusion of the records of the babies used during pre-testing of the
study.
36
3.3.5 Development and pre-testing of an instrument
The term ‘instrument’ refers to a formal written document used to collect and record
information, such as a questionnaire or checklist (Polit & Beck 2012:191). The checklist
was the instrument which was used for data collection (refer to Annexure 10). It was
developed on the basis of a literature search about relevant topics. Thus, the literature
was also reviewed to ensure that the relevant items were included in this instrument.
The WHO guidelines on neonatal health care and the maternity guidelines in South Africa
were consulted (WHO 2010:7; Department of Health 2015b:44). Experts on neonatal
care, including paediatricians, experienced nurses, a statistician and the researcher’s
supervisor, were involved on the structuring and the content of an instrument. Thus,
internal and content validity were evaluated. The checklist as an instrument for collecting
information on the perinatal mortality rate was pre-tested (refer to Annexure 10).
The objective of the perinatal care checklist was to determine the causes of the increase
in the perinatal mortality rate and to identify and describe other factors that contributed to
its increase and to formulate recommendations for the Limpopo Department of Health
based on the results in order to assist in the reduction of the perinatal rate in the Limpopo
province.
The perinatal checklist consists of three sections (refer to Annexure 10). The questions
in section A include the outcomes of the delivery which indicates that the baby was either
a stillbirth, or a neonatal death. Further items requiring clarification related to stillbirth, its
birth weight (four digits) and the Apgar score in the first and fifth minute by indication of
a numerator and a denominator.
Section B includes the following multiple-choice questions, namely, age on admission,
reason for admission, problem during admission, appropriate immediate management,
further assessment was done to identify perinatal risks, maternal risk factors, perinatal
risk, perinatal risk factors and estimated gestational age.
37
The last section C consists of different multiple-choice questions which include,
classification of the neonate according to the weight for gestational age, plan of care
resuscitation done, and gestational (weeks) at delivery, days since delivery, interventions,
death avoidable according to the Patient Safety Incident (PSI) committee and
contributory factors according to the assessment done (refer to Annexure 10).
3.3.5.1 Pre-testing of an instrument
Pre-test refers to the collection of data prior to the experimental intervention which is
sometimes called, baseline data (Polit & Beck 2012:738). The checklist was pre-tested.
Pre-testing of the checklist for the preparation of data collection was done from the 3rd
September 2017 to 7th September 2017. The purpose of this pre-testing was to determine
the quality, validity, relevancy and the appropriateness of the checklist (LoBiondo-Wood
& Haber 2010:280).
The developed checklist was pre-tested on five (5) perinatal records which were not
included in the main study. The pre-test was conducted at the same health care facility
in the Limpopo province in which the main data was collected. The researcher requested
the statistics from 1st January 2015 to 31st December 2015 in respect of perinatal mortality
from the perinatal unit operational manager. These statistical records were found in the
admission book which indicated the name, age and hospital number of the deceased.
The operational manager of the perinatal unit gave the researcher the admission book to
choose the hospital numbers. The purpose of choosing the hospital numbers was to
retrieve the perinatal records as it was the only way of retrieving them from the record
section filing system of the hospital. The researcher went to the record section to retrieve
the records by using the hospital numbers supplied from the perinatal unit admission
book which was found at the perinatal unit. In order to retrieve the records, the hospital
numbers were given to the record section clerk by the researcher.
The clerk retrieved five (5) requested records and gave them to the researcher. The
researcher completed the information in the checklist (refer to Annexure 10). Every record
had its own checklist for collecting data and the checklists were kept under lock and key
for safety in a locker which was purchased by the researcher.

38
It was put in the facility manager’s office after data had been collected from the record
section. The keys of the locker were accessed by the researcher only.
3.4 DATA COLLECTION
Data collection is the process of selecting the study subjects and gathering information
from the subjects. The actual steps followed in collecting data is specific to each study
and depends on the selected research design and measuring methods utilised (Polit &
Beck 2012:59).
The letters seeking permission to conduct the study were written and submitted to the
following authorities:
Research Ethics in Limpopo, Department of Health (refer to Annexure 2), Sekhukhune
District Health where the facility is located (refer to Annexure 4), the management of the
hospital (refer to Annexure 6) the perinatal unit manager (refer to Annexure 8).
Data was collected after approval was provided and the permission to conduct the study
was granted by the Department of Health Studies Research and Ethics Committee at the
University of South Africa (refer to Annexure 1), Limpopo Department of Health Research
and Ethics Committee (Head of Department) (refer to Annexure 3), Sekhukhune District
Health (District Executive manager) (refer to Annexure 5), the management of the
hospital (Chief Executive Officer) (refer to Annexure 7) and the unit manager of the
perinatal unit (refer to Annexure 9).
Since it was impossible to trace the deceased, letters of approval of the hospital from the
office of the CEO was used as the permission to conduct the study (refer to Annexure 7).
The researcher requested the statistics on perinatal mortality rate from the operational
manager of neonatal mortality rate. These statistical records were found in admission
book which indicated the name, gender and hospital of the deceased baby.
Data was collected from the record section of that specific health care facility. The records
which were used to collect information in the record section were under the supervision
of a record clerk who ensured that no records were taken out of the facility.

39
One hundred and sixty two (162) records were extracted by the researcher with the
assistance of the record clerk in the record section where records are kept safe.
All the records of babies who died in the perinatal unit from 1st January 2015 to 31st
December 2015 were identified. One hundred and sixty two (162) identified records
matched the number of the extracted records. The researcher collected data by using the
developed pre-tested checklists (refer to Annexure 10). Each record had its own checklist
for the collection of the data. The data was collected from 16 October 2017 to 27 October
2017. Data collection was done during the day from 08:00 to 16:00 on a daily basis from
Monday to Friday for about two weeks.
Privacy, confidentiality and anonymity were maintained by allocating the numbers to the
babies’ records and by de-identifying the records. The names of the health care
professionals involved in each case were withheld from the data collected. No names of
health care workers were required by the checklist. The results were not associated with
the health care provider providing the health care service. The checklists were kept safe
in the facility manager’s office for safety and data analysis purposes. The keys of the
locker were accessed by the researcher only.
3.5 DATA MANAGEMENT AND ANALYSIS
Data management and analysis involves the systematic organisation and synthesis of
research data and, in quantitative studies, the testing of hypotheses using those data
(Polit & Beck 2012:725). Descriptive statistics were used to provide answers to research
questions. This approach allowed the researcher to organise the data in ways that gave
meaning and facilitated insight and examined the phenomenon from a variety of angles.
A professional statistician assisted in analysing and summarising the data (refer to
Annexure 11) by using STATA version (SPSS) version 14. Frequency distribution figures,
tables and graphs were utilised to describe and present the results of the study
(LoBiondo-Wood & Haber 2010:310).

40
3.6 VALIDITY AND RELIABILITY
3.6.1 Validity
Validity is defined as the degree to which the instrument measures what it is supposed
to measure (Grove, Gray & Burns 2015: 514; Polit &Beck 2012:336).
The validity of an instrument is a determination of the extent to which the instrument
actually reflects the constructs being examined (Polit & Beck 2012:336) In this study,
experts on neonatal care, including paediatricians, experienced nurses, a statistician and
the researcher’s supervisor, were consulted on the structure and the content of the
checklist to enhance its validity .The same checklist was being pre-tested in the same
rural health care facility where the study was conducted to determine the extent to which
it measured what it was intended to measure.
3.6.1.1 External validity
External validity refers to the degree to which the results can be generalised to settings
or samples other than the one studied (Polit & Beck 2012:727). The external validity of
the study was achieved by selecting all the records of the deceased for investigation. In
addition, there was no sampling error as all of the records were used. The results cannot
be generalised to other facilities since only one facility in the province was used.
3.6.1.2 Internal validity
Internal validity refers to the validity of inferences given that an empirical relationship
exists and it is an independent variable rather than something else that caused the
outcome (LoBiondo-Wood & Haber 2010:156).
In this study the World Health Organization (2014) guidelines on neonatal care in South
Africa were used to compile on an instrument. Experts on perinatal health care were
involved on the structure and the content of the checklist. The following experts were
involved in the compilation of the checklist: obstetricians, paediatricians, experienced
nurses, statisticians and the researcher’s supervisor.

41
3.6.1.3 Content validity
Content validity is an assessment of how well the instrument represents all the
components of the variables to be measured (Brink, Van der Walt & Van Rensburg
2012:166).
The checklist was validated by consulting the study supervisor, specialists and experts in
the field, namely, paediatricians, experienced, practicing neonatal nurses and the
neonatal unit supervisor before it was used for data collection. A professional statistician
was used to check for content validity which would help to analyse and summarise data
(refer to Annexure 11). The literature was reviewed to ensure that the significant items
were included in the instrument. Corrections were made to the checklist after it was pre-
tested and experts had indicated their inputs.
3.6.1.4 Face validity
Face validity refers to whether the instrument looks like it is measuring the target
construct, although face validity is not considered as strong evidence of validity (Polit &
Beck 2012: 336). Face validity was ensured in the study where experts, specialists and
staff with research experience in the neonatal unit were given the checklist to assess
whether it measured what it was supposed to measure and to give their views on it.
3 6.2 RELIABILITY
Reliability refers to the degree of consistency or dependability with which an instrument
measures an attribute (Brink, Van der Walt 2012 & Van Rensburg: 126; Wood & Ross-
Kerr 2011:184). Reliability in this study was assessed by pre-testing the checklist used in
the study. It was pre-tested at the same health care facility in Limpopo province. The
records used for pre-testing were not used during the main study. Five records from the
perinatal unit of this health care facility were pre-tested before the data was collected for
the main study to ensure that it was consistent and dependable.

42
3.7 ETHICAL CONSIDERATIONS
3.7.1 Researcher- specific ethical considerations
Ethics is defined as system of moral values that is concerned with the degree to which
research procedures adhere to the professional, legal and social obligations of the study
participants (Polit & Beck 2012:727).
The researcher adhered to specific ethical considerations which involved the following:
Approval to conduct research was given by the Research and Ethics Committee at the
University of South Africa (UNISA) Department of Health Studies (refer to Annexure 1).
Letters seeking consent to conduct the study at the Limpopo province Department of
Health were addressed to the Research Ethics Committee, Limpopo Department of
Health (refer to Annexure 2), Sekhukhune District where the facility is located (refer to
Annexure 4), the management of the hospital (refer to Annexure 6), and the unit manager
of the Perinatal Unit (refer to Annexure 8). Permission was granted by the Limpopo
Department of Health, Research and Ethics Committee, Head of Department (HOD)
(refer to Annexure 3), the district health District Executive Manager (DEM) (refer to
Annexure 5), the management of the hospital, the Chief Executive Officer (CEO) (refer
to Annexure 7), and the unit manager of the Perinatal Unit (refer to Annexure 9) of the
hospital under study.
3.7.2 Records- specific ethical considerations
3.7.2.1 Informed consent
Informed consent means that the participants have adequate information about the
research, comprehend the information and have the ability to consent to, or decline their
participation voluntarily (Polit & Beck 2012:177).
In this study, since it is impossible to trace the deceased, de-identified records were used
and secondary data was collected. Therefore, the permission of the hospital’s ethical
committee and their approval to conduct the study was used as consent to conduct the
study.
43
3.7.2.2 Confidentiality and anonymity
Confidentiality is a pledge that any information that respondents provide will not be
publicly reported in a manner that identifies them and will not be accessible to others
(Polit & Beck 2012: 163). These records were kept safe in the operational manager’s
office. The keys of the locker were accessed by the researcher alone. The records used
were de-identified so that no information collected could be associated with the
respondents and the names of professional health care workers were not used when the
data was analysed.
3.7.2.3 Beneficence
Beneficence encompasses three principles, namely, one ought to prevent evil, one ought
to remove evil and one ought to do or promote good. No-one, including the experts should
be put at a disadvantage or exposed to a situation for which they were not prepared
(Brink, Van der Walt & Van Rensburg 2012:25). The method used was retrospective
document analysis. Thus, people did not participate in the study but instead data was
gleaned from records. Therefore, respondents were not exposed to harm.
3.7.2.4 Justice
The principle of justice means that participants have the right to fair selection and
treatment and this is the unifying principle in health and nursing. It includes the principles
of fairness and the right to privacy (Brink, Van der Walt & Van Rensburg 2012:36).
Only information on perinatal mortality was collected and it was kept securely in a place
known only to the researcher. After the information on the deceased was collected, the
researcher allocated a specific number for identification. The information was kept
anonymous and no links were made to the deceased or care providers. No records were
taken out of the record section.

44
3.7.2.5 Privacy
It is the right of an individual to determine the time, extent and general circumstances
under which information will be shared with, or withheld from others (Bothma, Greeff,
Mulaudzi & Wright 2010: 113). Therefore, privacy was maintained by allocating specific
numbers to the perinatal records and by de-identifying them.
3.8 CONCLUSION
Chapter 3 discussed the detailed research design and the methods of the study. Ethical
considerations were addressed. The data collection checklist was validated and reliability
was addressed. Chapter 4 will discuss data analysis and presentation of the results.

45
CHAPTER 4
DATA ANALYSIS, PRESENTATION AND INTERPRETATION OF
RESULTS
4.1 INTRODUCTION
Chapter 3 describes and discusses the research design and method in detail. This
chapter discusses the analysis and management of the data. It was conducted by means
of a statistical package called SPSS version 14 with the assistance of a statistician (refer
to Annexure11). The results were analysed to ensure that the data collected were
presented clearly in the form of tables, percentages and graphs. Afterwards the
presented data were interpreted.
The main aim of the data analysis and management was to address the three research
objectives, which were to:
determine the causes of the increased perinatal mortality rate;
identify and describe other factors that contribute to an increase in the perinatal
mortality rate in a specific rural health care facility; and
Formulate and present recommendations to the authorities in the Department of
Health, Limpopo province based on the results in order to assist in the reduction
of the perinatal mortality rate in Limpopo province.
4.2 DATA MANAGEMENT AND ANALYSIS
Data analysis is the systemic organisation and synthesis of the research results (Polit &
Beck 2012:725). Data were managed and analysed quantitatively and descriptively. The
data was collected from the health care facility records by completing the checklist (refer
to Annexure 10). The very same data was analysed. Descriptive statistics described and
summarised data collected by converting and condensing it into organised and visual
representations.
46
This approach allowed the researcher to organise the data in the way that gave meaning,
facilitated insight and to examine the phenomenon from a variety of angles. The
presentation of descriptive statistics and information were grouped according to the
variables appearing on the checklist and were described in words. In addition, it was
managed descriptively by presenting and interpreting the research results in the form of
tables, graphs and figures. A professional statistician (refer to Annexure 11) assisted with
analysing and summarising the data using the STATA Statistical Package for the Social
Sciences (SPSS) version 14. Information was grouped according to the variables on the
checklist and described in words. The analysis was done according to the following
sections of the data collection checklist (refer to Annexure 10).
Section A
Section A addressed the outcomes of the delivery which indicated whether the baby was
a stillbirth or a neonatal death. An Apgar score in the 1st and 5th minute was indicated by
a numerator and denominator.
Section B
Section B addressed age on admission, reasons for admission, problems during
admission, appropriate immediate management of problems, further assessment done
to identify perinatal risks, maternal risk factors, perinatal risk factors and an estimated
gestational age.
Section C
Section C addressed the classification of the neonate according to its weight for
gestational age, plan of care, resuscitation done, gestational (weeks) at delivery, days
since delivery, interventions, death avoidable according to the Patient Safety Incident
committee (PSI) and the contributory factors according to the assessment done.
4.3 RESEARCH RESULTS
The research results presents the results obtained from data collected during the study.
The results section provides information about statistical tests which were used to test
hypotheses and evaluate the believability of the results (Polit & Beck 2012:64). In this
study the discussion to follow presents and interprets the results.

47
4.3.1 SECTION A
4.3.1.1 Outcome of the baby’s delivery
Table 4.1 Outcome of the baby’s delivery (N=162)
The outcomes of delivery Frequency
(n)
Percentage
(%)
Stillbirth 100 61.7
Neonatal death 60 37.0
Missing record 2 1.2
Total 162 100.00
The results of the study as indicated in table 4.1 shows that the majority of the babies
were stillborn 61.7% (n=100), 37.0% (n=60) were neonatal deaths and 1.2% (n=2) were
reported as missing records and there was no information about the death of the baby.
More than 50 % (n=100) of the babies died in the first week of their lives with the highest
perinatal mortality in the first day of life. These babies were born with no signs of life, and
37% (n=60) were born with signs of life but died at a later stage. This study’s results
concur with the study conducted on the risk factors for perinatal death at two various
levels of care. In that study, 46.9% (n=130) of the perinatal mortality cases occurred in
the first seven days with the highest risk of mortality on the day one of life (Moura, Maesta,
Rugolo, Angulski, Caddeira, Peracoli & Rudge2014:3).
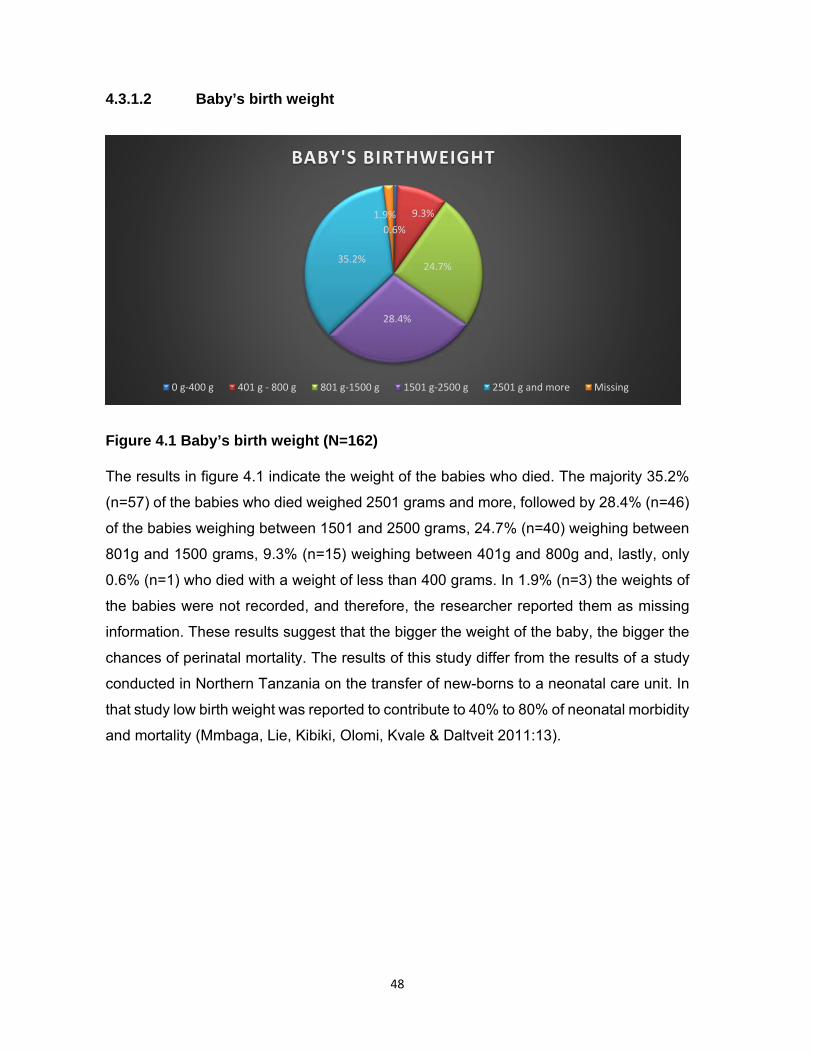
48
4.3.1.2 Baby’s birth weight
Figure 4.1 Baby’s birth weight (N=162)
The results in figure 4.1 indicate the weight of the babies who died. The majority 35.2%
(n=57) of the babies who died weighed 2501 grams and more, followed by 28.4% (n=46)
of the babies weighing between 1501 and 2500 grams, 24.7% (n=40) weighing between
801g and 1500 grams, 9.3% (n=15) weighing between 401g and 800g and, lastly, only
0.6% (n=1) who died with a weight of less than 400 grams. In 1.9% (n=3) the weights of
the babies were not recorded, and therefore, the researcher reported them as missing
information. These results suggest that the bigger the weight of the baby, the bigger the
chances of perinatal mortality. The results of this study differ from the results of a study
conducted in Northern Tanzania on the transfer of new-borns to a neonatal care unit. In
that study low birth weight was reported to contribute to 40% to 80% of neonatal morbidity
and mortality (Mmbaga, Lie, Kibiki, Olomi, Kvale & Daltveit 2011:13).
0.6%
9.3%
24.7%
28.4%
35.2%
1.9%
BABY'S BIRTHWEIGHT
0 g‐400 g 401 g ‐ 800 g 801 g‐1500 g 1501 g‐2500 g 2501 g and more Missing
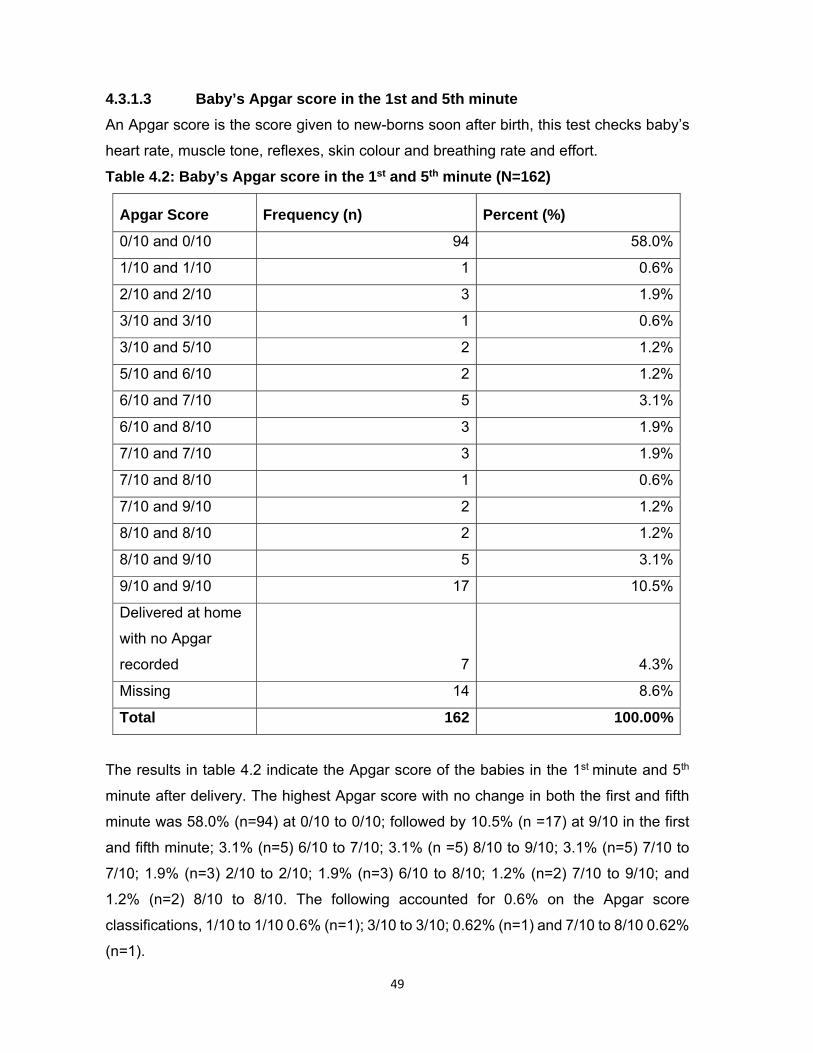
49
4.3.1.3 Baby’s Apgar score in the 1st and 5th minute
An Apgar score is the score given to new-borns soon after birth, this test checks baby’s
heart rate, muscle tone, reflexes, skin colour and breathing rate and effort.
Table 4.2: Baby’s Apgar score in the 1st and 5th minute (N=162)
Apgar Score Frequency (n) Percent (%)
0/10 and 0/10 94 58.0%
1/10 and 1/10 1 0.6%
2/10 and 2/10 3 1.9%
3/10 and 3/10 1 0.6%
3/10 and 5/10 2 1.2%
5/10 and 6/10 2 1.2%
6/10 and 7/10 5 3.1%
6/10 and 8/10 3 1.9%
7/10 and 7/10 3 1.9%
7/10 and 8/10 1 0.6%
7/10 and 9/10 2 1.2%
8/10 and 8/10 2 1.2%
8/10 and 9/10 5 3.1%
9/10 and 9/10 17 10.5%
Delivered at home
with no Apgar
recorded 7 4.3%
Missing 14 8.6%
Total 162 100.00%
The results in table 4.2 indicate the Apgar score of the babies in the 1st minute and 5th
minute after delivery. The highest Apgar score with no change in both the first and fifth
minute was 58.0% (n=94) at 0/10 to 0/10; followed by 10.5% (n =17) at 9/10 in the first
and fifth minute; 3.1% (n=5) 6/10 to 7/10; 3.1% (n =5) 8/10 to 9/10; 3.1% (n=5) 7/10 to
7/10; 1.9% (n=3) 2/10 to 2/10; 1.9% (n=3) 6/10 to 8/10; 1.2% (n=2) 7/10 to 9/10; and
1.2% (n=2) 8/10 to 8/10. The following accounted for 0.6% on the Apgar score
classifications, 1/10 to 1/10 0.6% (n=1); 3/10 to 3/10; 0.62% (n=1) and 7/10 to 8/10 0.62%
(n=1).
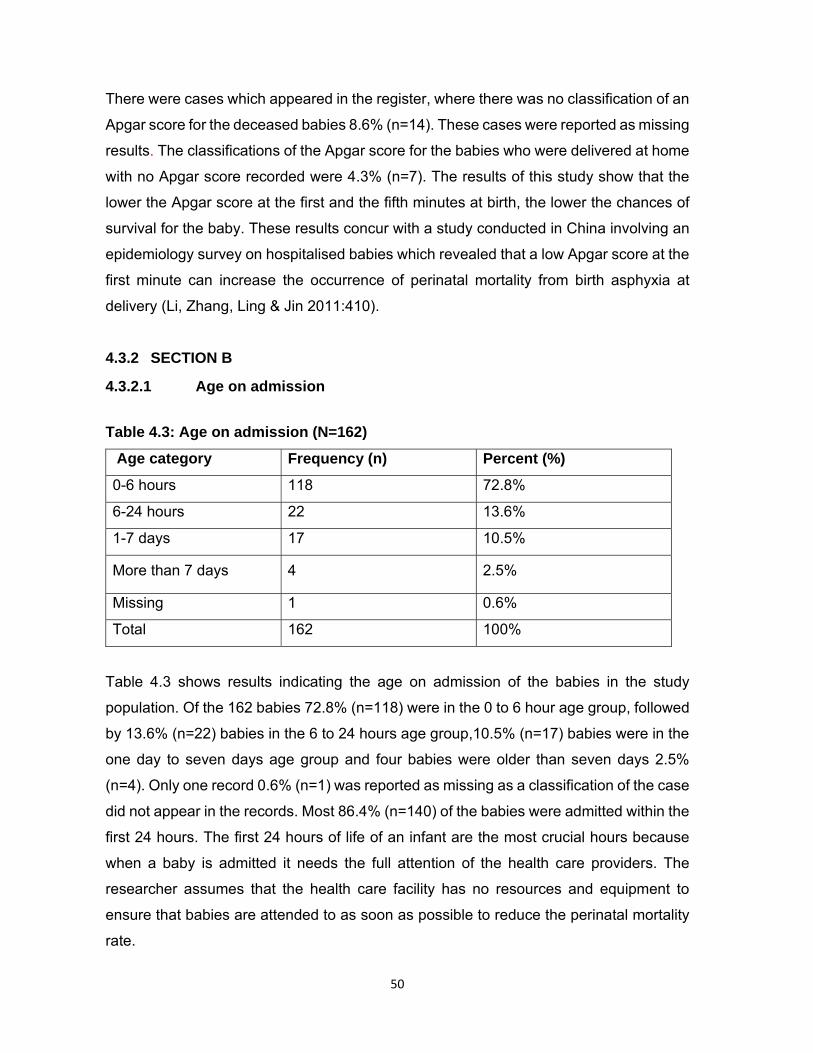
50
There were cases which appeared in the register, where there was no classification of an
Apgar score for the deceased babies 8.6% (n=14). These cases were reported as missing
results. The classifications of the Apgar score for the babies who were delivered at home
with no Apgar score recorded were 4.3% (n=7). The results of this study show that the
lower the Apgar score at the first and the fifth minutes at birth, the lower the chances of
survival for the baby. These results concur with a study conducted in China involving an
epidemiology survey on hospitalised babies which revealed that a low Apgar score at the
first minute can increase the occurrence of perinatal mortality from birth asphyxia at
delivery (Li, Zhang, Ling & Jin 2011:410).
4.3.2 SECTION B
4.3.2.1 Age on admission
Table 4.3: Age on admission (N=162)
Age category Frequency (n) Percent (%)
0-6 hours 118 72.8%
6-24 hours 22 13.6%
1-7 days 17 10.5%
More than 7 days 4 2.5%
Missing 1 0.6%
Total 162 100%
Table 4.3 shows results indicating the age on admission of the babies in the study
population. Of the 162 babies 72.8% (n=118) were in the 0 to 6 hour age group, followed
by 13.6% (n=22) babies in the 6 to 24 hours age group,10.5% (n=17) babies were in the
one day to seven days age group and four babies were older than seven days 2.5%
(n=4). Only one record 0.6% (n=1) was reported as missing as a classification of the case
did not appear in the records. Most 86.4% (n=140) of the babies were admitted within the
first 24 hours. The first 24 hours of life of an infant are the most crucial hours because
when a baby is admitted it needs the full attention of the health care providers. The
researcher assumes that the health care facility has no resources and equipment to
ensure that babies are attended to as soon as possible to reduce the perinatal mortality
rate.
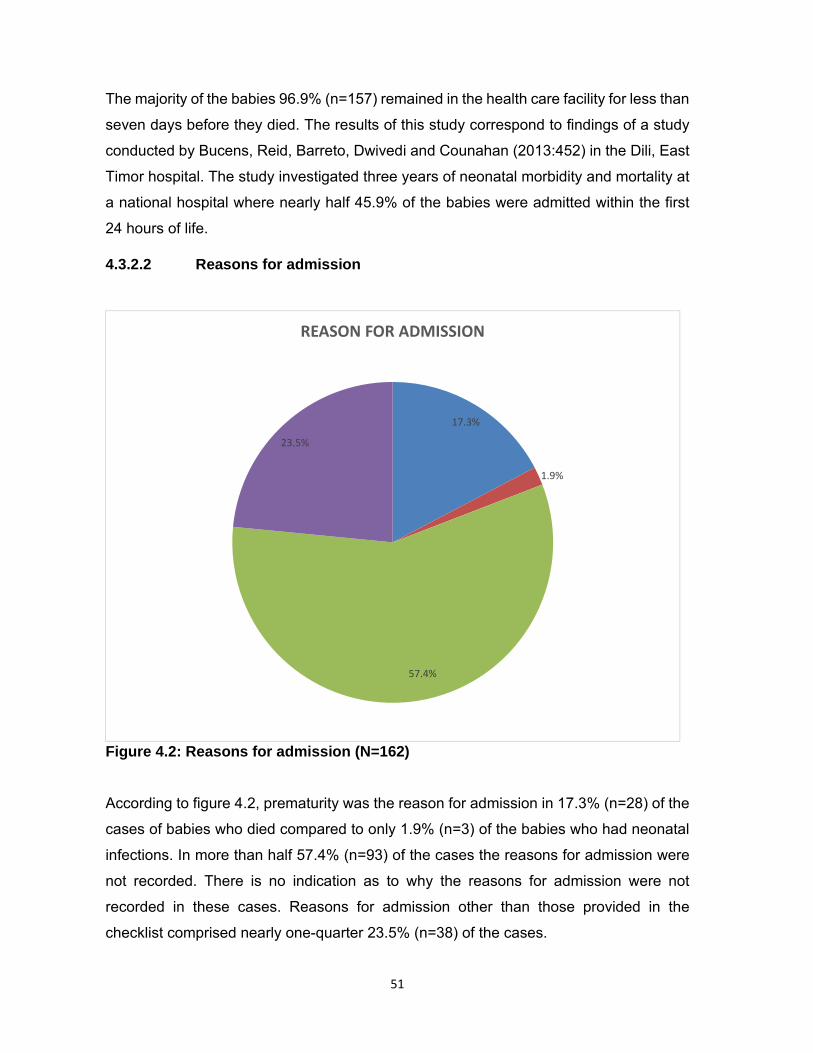
51
The majority of the babies 96.9% (n=157) remained in the health care facility for less than
seven days before they died. The results of this study correspond to findings of a study
conducted by Bucens, Reid, Barreto, Dwivedi and Counahan (2013:452) in the Dili, East
Timor hospital. The study investigated three years of neonatal morbidity and mortality at
a national hospital where nearly half 45.9% of the babies were admitted within the first
24 hours of life.
4.3.2.2 Reasons for admission
Figure 4.2: Reasons for admission (N=162)
According to figure 4.2, prematurity was the reason for admission in 17.3% (n=28) of the
cases of babies who died compared to only 1.9% (n=3) of the babies who had neonatal
infections. In more than half 57.4% (n=93) of the cases the reasons for admission were
not recorded. There is no indication as to why the reasons for admission were not
recorded in these cases. Reasons for admission other than those provided in the
checklist comprised nearly one-quarter 23.5% (n=38) of the cases.
17.3%
1.9%
57.4%
23.5%
REASON FOR ADMISSION
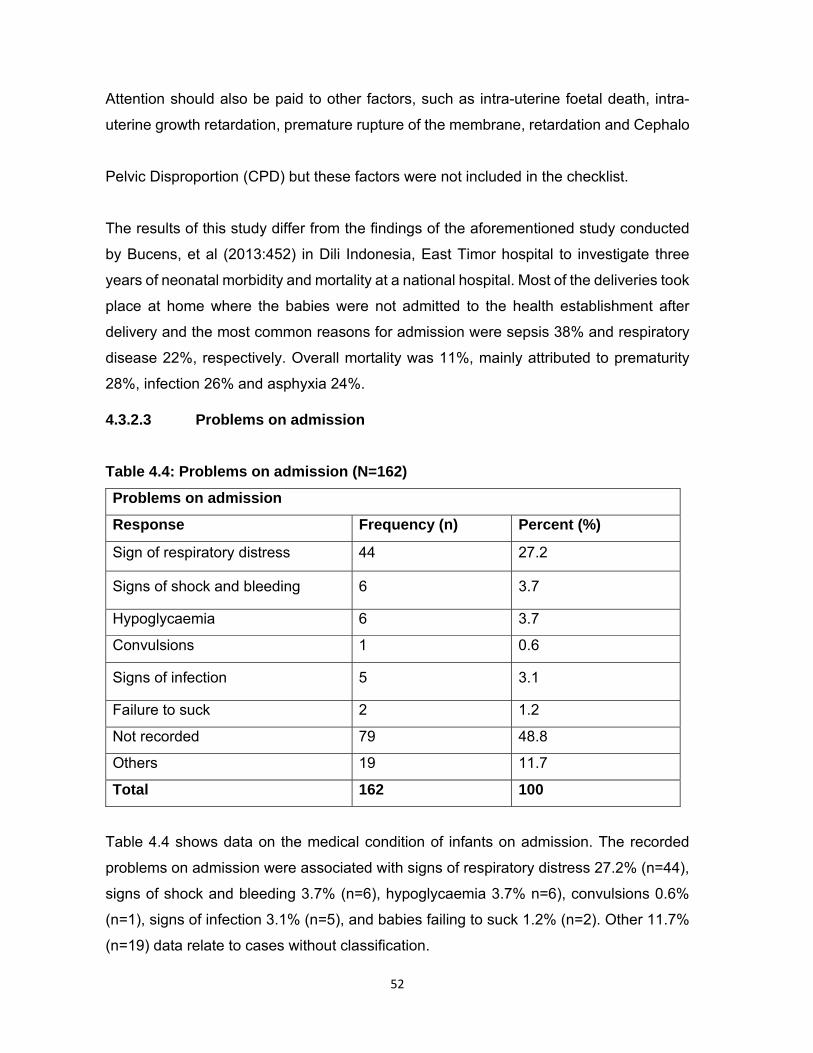
52
Attention should also be paid to other factors, such as intra-uterine foetal death, intra-
uterine growth retardation, premature rupture of the membrane, retardation and Cephalo
Pelvic Disproportion (CPD) but these factors were not included in the checklist.
The results of this study differ from the findings of the aforementioned study conducted
by Bucens, et al (2013:452) in Dili Indonesia, East Timor hospital to investigate three
years of neonatal morbidity and mortality at a national hospital. Most of the deliveries took
place at home where the babies were not admitted to the health establishment after
delivery and the most common reasons for admission were sepsis 38% and respiratory
disease 22%, respectively. Overall mortality was 11%, mainly attributed to prematurity
28%, infection 26% and asphyxia 24%.
4.3.2.3 Problems on admission
Table 4.4: Problems on admission (N=162)
Problems on admission
Response Frequency (n) Percent (%)
Sign of respiratory distress 44 27.2
Signs of shock and bleeding 6 3.7
Hypoglycaemia 6 3.7
Convulsions 1 0.6
Signs of infection 5 3.1
Failure to suck 2 1.2
Not recorded 79 48.8
Others 19 11.7
Total 162 100
Table 4.4 shows data on the medical condition of infants on admission. The recorded
problems on admission were associated with signs of respiratory distress 27.2% (n=44),
signs of shock and bleeding 3.7% (n=6), hypoglycaemia 3.7% n=6), convulsions 0.6%
(n=1), signs of infection 3.1% (n=5), and babies failing to suck 1.2% (n=2). Other 11.7%
(n=19) data relate to cases without classification.

53
These 19 other factors indicated in the checklist were reflected in the records as they
contributed to the problems experienced by the infants on admission. These problems
are diminished foetal heart and movement; intra-uterine growth retardation; cord
prolapse; and Cephalo pelvic disproportion. However, nearly half 48.8% (n=79) of the
problems experienced by infants on admission were not recorded.
Most of the 78 babies whose problems were recorded were admitted to the Neonatal Unit
with respiratory distress 27.2% (n=44). This study concurs with the study conducted in
northern Tanzania by Mmbaga, Lie, Olomi, Mahande, Olola and Daltveit (2011:8) that
indicate that during the transfer of new-borns to a neonatal care unit the majority of babies
were admitted to the neonatal unit with respiratory distress and low Apgar scores were
premature. Furthermore, the study which was conducted in Indonesia on neonatal
morbidity and mortality in the neonate hospital in Dili, East Timor over three years also
found that the common problems on admission of these babies were infection followed
by respiratory disease, asphyxia and prematurity (Bucens et al 2013:454).
4.3.2.4 Appropriate management taken by health care workers
Figure 4.3: Appropriate management taken by health care workers (N=162)
The results in figure 4.3 show whether babies were referred, or not referred, out of the
health care facility. The data shows that the majority 94.4% (n=153) of these babies were
not referred to receive appropriate management action.
4,3%
94,4%
1.2%
APPROPRIATE MANAGEMENT TAKEN BY HEALTH CARE WORKERS
Reffered Not referred Not recorded
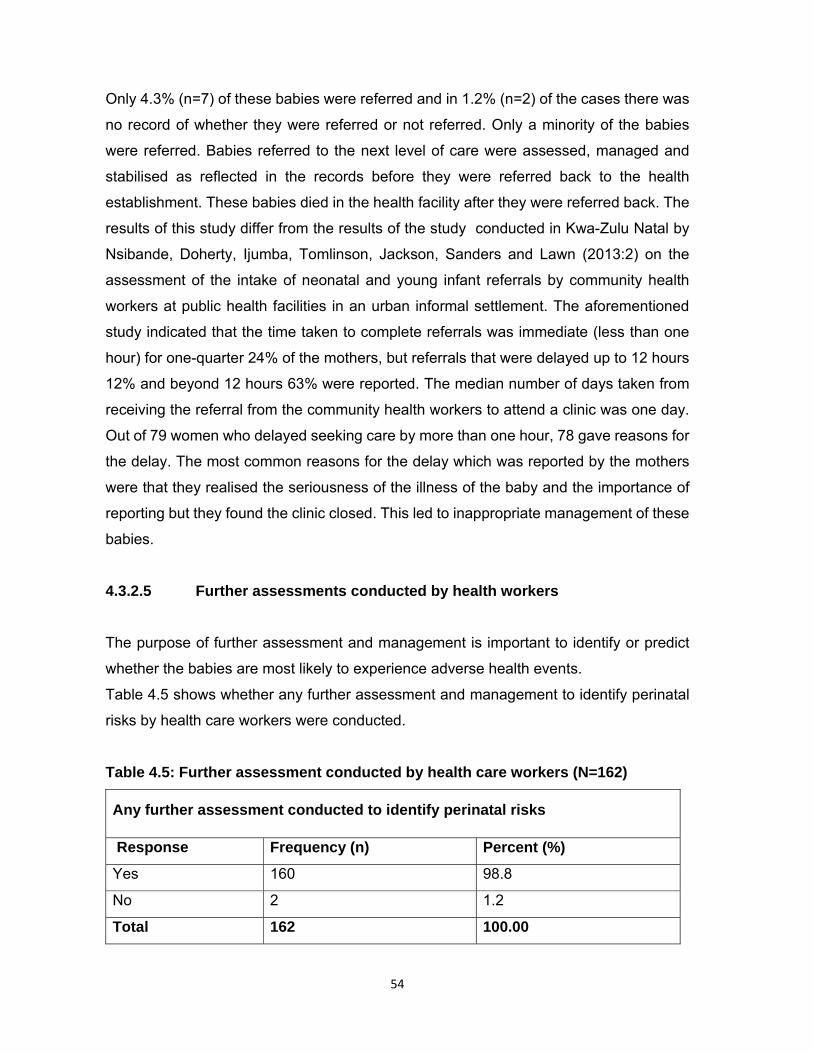
54
Only 4.3% (n=7) of these babies were referred and in 1.2% (n=2) of the cases there was
no record of whether they were referred or not referred. Only a minority of the babies
were referred. Babies referred to the next level of care were assessed, managed and
stabilised as reflected in the records before they were referred back to the health
establishment. These babies died in the health facility after they were referred back. The
results of this study differ from the results of the study conducted in Kwa-Zulu Natal by
Nsibande, Doherty, Ijumba, Tomlinson, Jackson, Sanders and Lawn (2013:2) on the
assessment of the intake of neonatal and young infant referrals by community health
workers at public health facilities in an urban informal settlement. The aforementioned
study indicated that the time taken to complete referrals was immediate (less than one
hour) for one-quarter 24% of the mothers, but referrals that were delayed up to 12 hours
12% and beyond 12 hours 63% were reported. The median number of days taken from
receiving the referral from the community health workers to attend a clinic was one day.
Out of 79 women who delayed seeking care by more than one hour, 78 gave reasons for
the delay. The most common reasons for the delay which was reported by the mothers
were that they realised the seriousness of the illness of the baby and the importance of
reporting but they found the clinic closed. This led to inappropriate management of these
babies.
4.3.2.5 Further assessments conducted by health workers
The purpose of further assessment and management is important to identify or predict
whether the babies are most likely to experience adverse health events.
Table 4.5 shows whether any further assessment and management to identify perinatal
risks by health care workers were conducted.
Table 4.5: Further assessment conducted by health care workers (N=162)
Any further assessment conducted to identify perinatal risks
Response Frequency (n) Percent (%)
Yes 160 98.8
No 2 1.2
Total 162 100.00
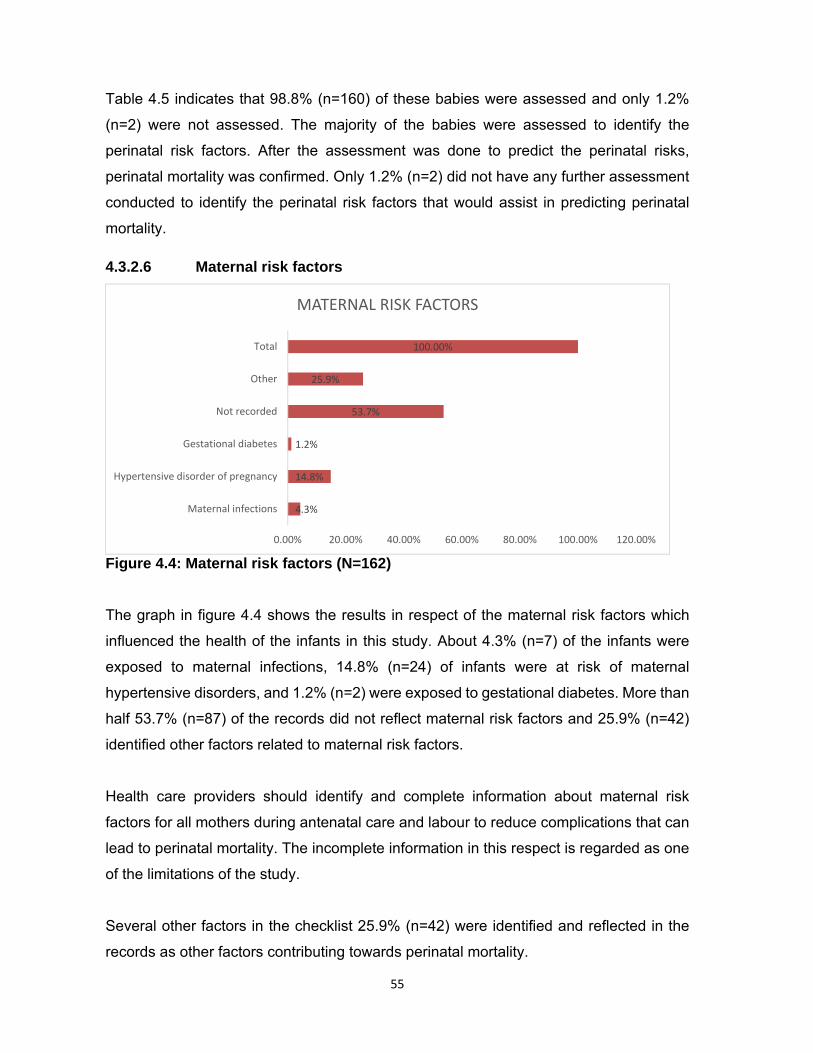
55
Table 4.5 indicates that 98.8% (n=160) of these babies were assessed and only 1.2%
(n=2) were not assessed. The majority of the babies were assessed to identify the
perinatal risk factors. After the assessment was done to predict the perinatal risks,
perinatal mortality was confirmed. Only 1.2% (n=2) did not have any further assessment
conducted to identify the perinatal risk factors that would assist in predicting perinatal
mortality.
4.3.2.6 Maternal risk factors
Figure 4.4: Maternal risk factors (N=162)
The graph in figure 4.4 shows the results in respect of the maternal risk factors which
influenced the health of the infants in this study. About 4.3% (n=7) of the infants were
exposed to maternal infections, 14.8% (n=24) of infants were at risk of maternal
hypertensive disorders, and 1.2% (n=2) were exposed to gestational diabetes. More than
half 53.7% (n=87) of the records did not reflect maternal risk factors and 25.9% (n=42)
identified other factors related to maternal risk factors.
Health care providers should identify and complete information about maternal risk
factors for all mothers during antenatal care and labour to reduce complications that can
lead to perinatal mortality. The incomplete information in this respect is regarded as one
of the limitations of the study.
Several other factors in the checklist 25.9% (n=42) were identified and reflected in the
records as other factors contributing towards perinatal mortality.
4.3%
14.8%
1.2%
53.7%
25.9%
100.00%
0.00% 20.00% 40.00% 60.00% 80.00% 100.00% 120.00%
Maternal infections
Hypertensive disorder of pregnancy
Gestational diabetes
Not recorded
Other
Total
MATERNAL RISK FACTORS

56
These factors were anaemia, premature rupture of membranes (PROM), Primi gravida,
Rhesus negative, advanced maternal age, problems associated with previous
pregnancies and antepartum haemorrhage (APH).
Maternal chronic hypertension and diabetes are significantly associated with negative
birth outcomes. It is evident that new-born babies are more likely to suffer perinatal
mortality if the mother also shows evidence of infection. The results of the current study
concur with the results of the study conducted by Ezechi and David (2012:7) in Nigeria
about the patterns of morbidity and mortality in the new-born special care unit. The study
indicated signal of the universal perinatal mortality rate that some maternal conditions
expose the babies to perinatal mortality. The following conditions such as hypertension,
diabetes mellitus and infectious diseases (HIV/AIDS and malaria) predispose the babies
to increase mortality.
4.3.2.7 Perinatal risks
Table 4.6: Perinatal risks (N=162)
Any perinatal risks
Response Frequency (n) Percent (%)
Yes 154 95.1
No 1 0.6
Not recorded 7 4.3
Total 162 100
Table 4.6 shows that in 95.1% (n=154) of the cases perinatal risks were identified and
classified, whereas only 0.6% (n=1) was not identified and classified and 4.3% (n=7) were
not recorded or classified as perinatal risks. Most of the perinatal risks were identified
although there were no follow-up questions from the checklist to identify the type of risk.
The outcomes of this study concur with the findings of the study conducted in the Nigeria
Delta region, regarding patterns of morbidity and mortality in the new-born special care
unit in a tertiary institution where the total number of babies admitted with different
conditions amounted to 35.1% that were diagnosed with neonatal sepsis, 16.4% were
premature and 24.1% suffered from birth asphyxia. The study further indicated that
perinatal risks were identified and specified (Ugwu 2012:136).
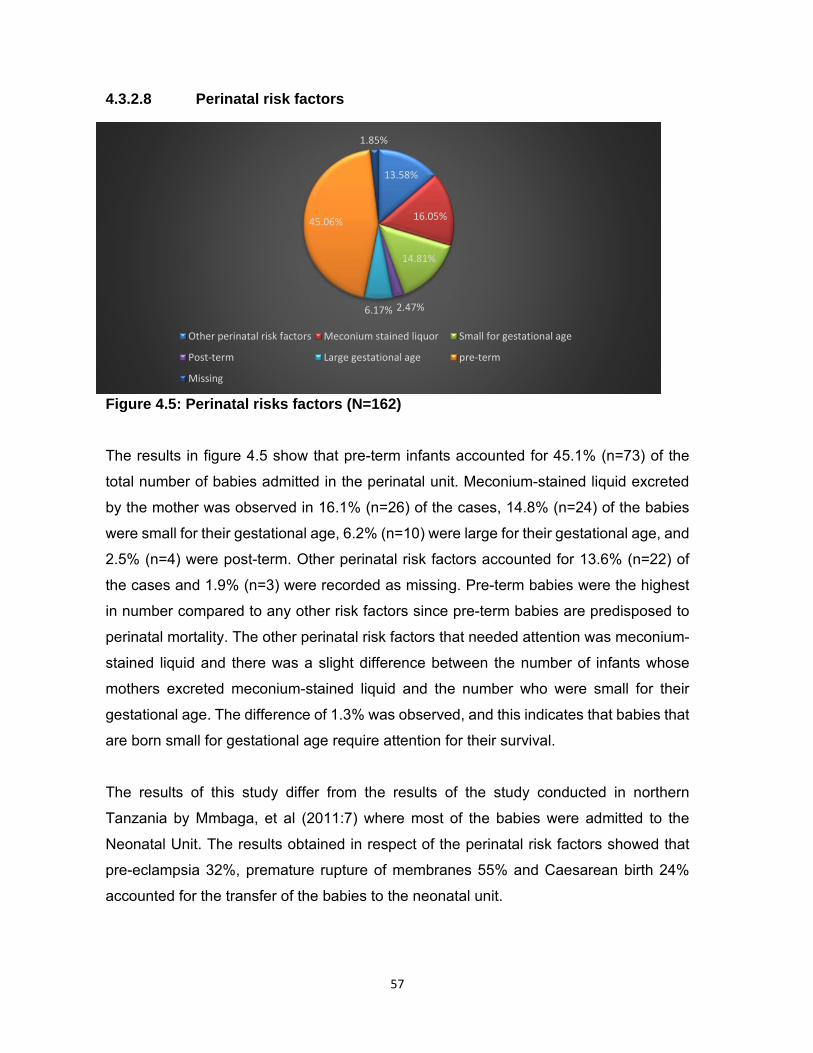
57
4.3.2.8 Perinatal risk factors
Figure 4.5: Perinatal risks factors (N=162)
The results in figure 4.5 show that pre-term infants accounted for 45.1% (n=73) of the
total number of babies admitted in the perinatal unit. Meconium-stained liquid excreted
by the mother was observed in 16.1% (n=26) of the cases, 14.8% (n=24) of the babies
were small for their gestational age, 6.2% (n=10) were large for their gestational age, and
2.5% (n=4) were post-term. Other perinatal risk factors accounted for 13.6% (n=22) of
the cases and 1.9% (n=3) were recorded as missing. Pre-term babies were the highest
in number compared to any other risk factors since pre-term babies are predisposed to
perinatal mortality. The other perinatal risk factors that needed attention was meconium-
stained liquid and there was a slight difference between the number of infants whose
mothers excreted meconium-stained liquid and the number who were small for their
gestational age. The difference of 1.3% was observed, and this indicates that babies that
are born small for gestational age require attention for their survival.
The results of this study differ from the results of the study conducted in northern
Tanzania by Mmbaga, et al (2011:7) where most of the babies were admitted to the
Neonatal Unit. The results obtained in respect of the perinatal risk factors showed that
pre-eclampsia 32%, premature rupture of membranes 55% and Caesarean birth 24%
accounted for the transfer of the babies to the neonatal unit.
13.58%
16.05%
14.81%
2.47%6.17%
45.06%
1.85%
Other perinatal risk factors Meconium stained liquor Small for gestational age
Post‐term Large gestational age pre‐term
Missing

58
4.3.2.9 Estimated gestational age
Table 4.7: Estimated gestational age (N=162)
Estimated gestational age
Response Frequency (n) Percent (%)
Pre-term 68 42.0
Term 74 45.7
Post-term 12 7.4
Not recorded 8 4.9
Total 162 100
The results on the estimated gestational age of the infants indicated that 42.0% (n=68)
were pre-term babies, 45.7% (n=74) full-term babies, 7.4% (n=12) were post-term and
4.9% (n=8) were not recorded. The information not recorded indicates that no
classification was made according to an estimated gestational age. The majority of the
babies who died were at term, followed by pre-term babies and post-term babies. A term
birth is defined as the delivery of the baby occurring from the 37th week of pregnancy
(Forrester 2014:1).
The reduction in the perinatal mortality rate can be observed in babies born at term. There
should be an evaluation of the health care providers in respect of the utilisation of
maternity resources, including maternity guidelines, maternity case records, Partogram
and human resources. Pre-term has been commonly related to perinatal mortality in an
estimated gestational age. The results of the current study concur with the results of the
study conducted in Tanzania by Mmbaga, et al (2011:7) which indicated that pre-term
deliveries accounted for 28% of the neonatal mortalities of babies transferred to the
neonatal care unit in Tanzania.
4.3.3 SECTION C
Section C consists of different multiple-choice questions which classify neonates
according to the weight for gestational age, plan of care resuscitation done, and
gestational (weeks) or at delivery, days since delivery, interventions, death avoidable
according to the Patient Safety Incident committee (PSI) and the contributory factors
according to the assessment done.
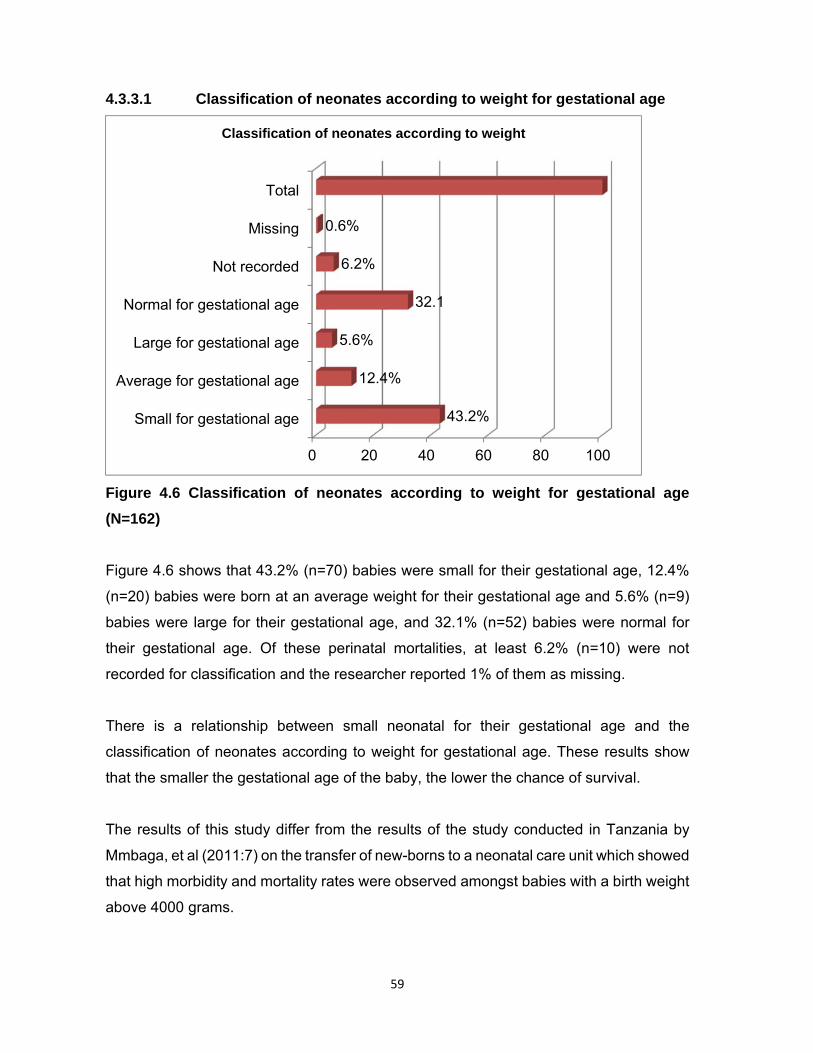
59
4.3.3.1 Classification of neonates according to weight for gestational age
Figure 4.6 Classification of neonates according to weight for gestational age
(N=162)
Figure 4.6 shows that 43.2% (n=70) babies were small for their gestational age, 12.4%
(n=20) babies were born at an average weight for their gestational age and 5.6% (n=9)
babies were large for their gestational age, and 32.1% (n=52) babies were normal for
their gestational age. Of these perinatal mortalities, at least 6.2% (n=10) were not
recorded for classification and the researcher reported 1% of them as missing.
There is a relationship between small neonatal for their gestational age and the
classification of neonates according to weight for gestational age. These results show
that the smaller the gestational age of the baby, the lower the chance of survival.
The results of this study differ from the results of the study conducted in Tanzania by
Mmbaga, et al (2011:7) on the transfer of new-borns to a neonatal care unit which showed
that high morbidity and mortality rates were observed amongst babies with a birth weight
above 4000 grams.
0 20 40 60 80 100
Small for gestational age
Average for gestational age
Large for gestational age
Normal for gestational age
Not recorded
Missing
Total
43.2%
12.4%
5.6%
32.1
6.2%
0.6%
Classification of neonates according to weight
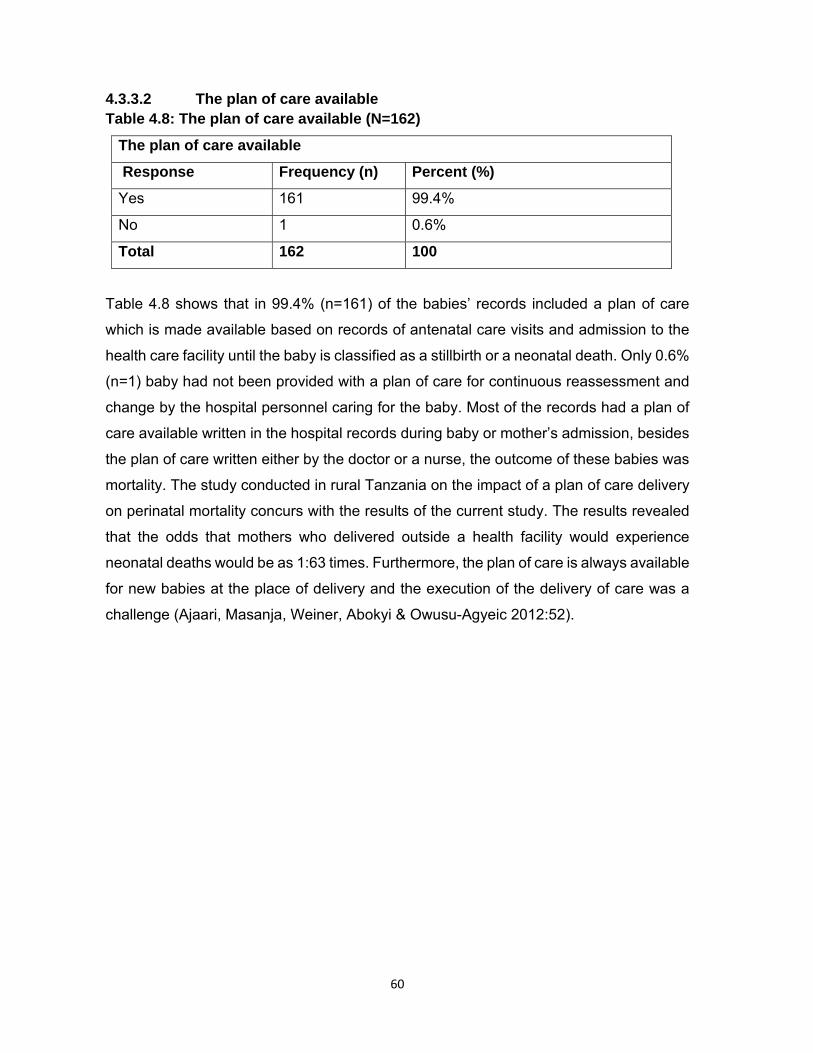
60
4.3.3.2 The plan of care available Table 4.8: The plan of care available (N=162)
The plan of care available
Response Frequency (n) Percent (%)
Yes 161 99.4%
No 1 0.6%
Total 162 100
Table 4.8 shows that in 99.4% (n=161) of the babies’ records included a plan of care
which is made available based on records of antenatal care visits and admission to the
health care facility until the baby is classified as a stillbirth or a neonatal death. Only 0.6%
(n=1) baby had not been provided with a plan of care for continuous reassessment and
change by the hospital personnel caring for the baby. Most of the records had a plan of
care available written in the hospital records during baby or mother’s admission, besides
the plan of care written either by the doctor or a nurse, the outcome of these babies was
mortality. The study conducted in rural Tanzania on the impact of a plan of care delivery
on perinatal mortality concurs with the results of the current study. The results revealed
that the odds that mothers who delivered outside a health facility would experience
neonatal deaths would be as 1:63 times. Furthermore, the plan of care is always available
for new babies at the place of delivery and the execution of the delivery of care was a
challenge (Ajaari, Masanja, Weiner, Abokyi & Owusu-Agyeic 2012:52).
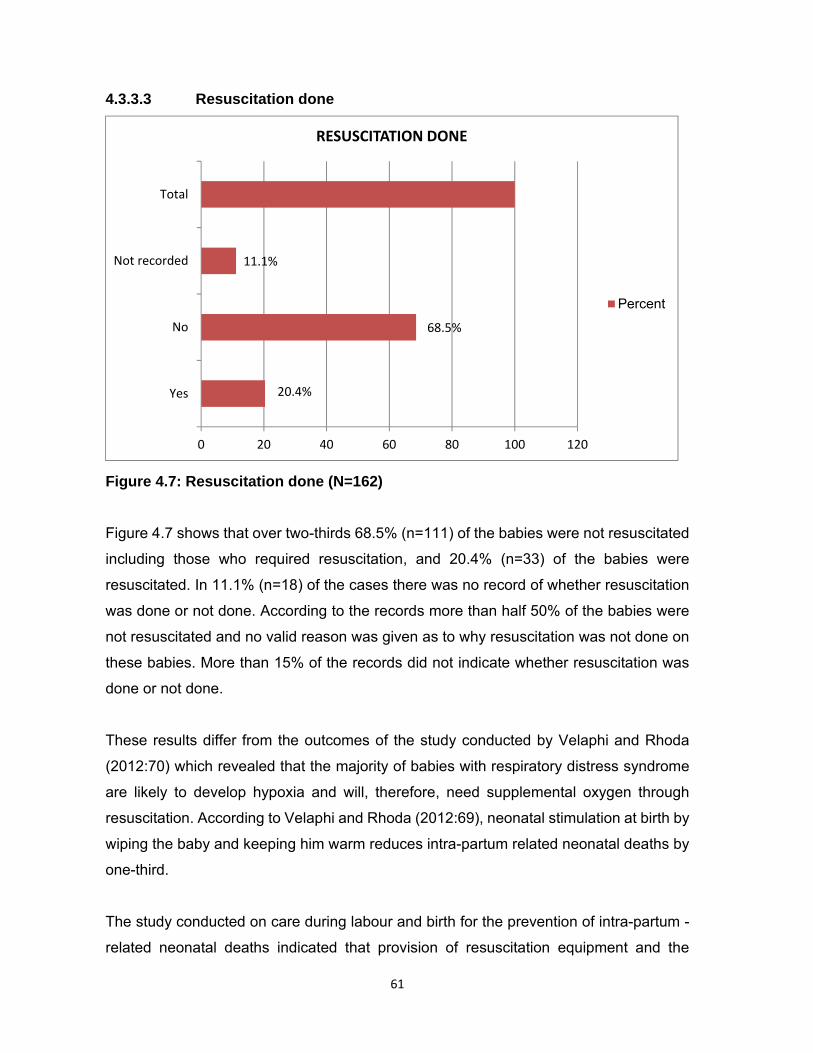
61
4.3.3.3 Resuscitation done
Figure 4.7: Resuscitation done (N=162)
Figure 4.7 shows that over two-thirds 68.5% (n=111) of the babies were not resuscitated
including those who required resuscitation, and 20.4% (n=33) of the babies were
resuscitated. In 11.1% (n=18) of the cases there was no record of whether resuscitation
was done or not done. According to the records more than half 50% of the babies were
not resuscitated and no valid reason was given as to why resuscitation was not done on
these babies. More than 15% of the records did not indicate whether resuscitation was
done or not done.
These results differ from the outcomes of the study conducted by Velaphi and Rhoda
(2012:70) which revealed that the majority of babies with respiratory distress syndrome
are likely to develop hypoxia and will, therefore, need supplemental oxygen through
resuscitation. According to Velaphi and Rhoda (2012:69), neonatal stimulation at birth by
wiping the baby and keeping him warm reduces intra-partum related neonatal deaths by
one-third.
The study conducted on care during labour and birth for the prevention of intra-partum -
related neonatal deaths indicated that provision of resuscitation equipment and the
20.4%
68.5%
11.1%
Yes
No
Not recorded
Total
0 20 40 60 80 100 120
RESUSCITATION DONE
Percent

62
training of health care providers reduces neonatal mortalities and intra-partum mortality
cases as the majority of babies only need immediate assessment at birth and simple
new-born care (Lee, Cousens, Darmstadt, Blencowe, Pattison, Moran, Hofmeyr, Haws,
Bhutta & Lawn 2011: 23).
4.3.3.4 Gestational age in weeks
Table 4.9: Gestational age in weeks (N=162)
Gestational (weeks) or during delivery
Response Frequency (n). Percent (%)
28 to 32 Weeks 47 29.0%
33 to 36 Weeks 32 19.8%
37 to 40 Weeks 38 23.5%
41 or more Weeks 15 9.3%
Not known 30 18.5%
Total 162 100.00%
Table 4.9 indicates the weeks of pregnancy when perinatal mortality occurs. Over one-
quarter 29.0% (n=47), of the perinatal mortality cases occurred from 28 to 32 weeks
followed by deaths at 37 to 40 weeks 23.5% (n=38), and 33 to 36 weeks 19.8% (n=32).
About 18.5% (n=30) cases were not known. The aforementioned cases were not
considered by the researcher because the case records were not complete. Only 9.3%
(n=15) mortality cases occurred at 41 or more weeks. The 47 babies who died at the
gestational age of 28 to 32 weeks reflect the proportion of pre-term to perinatal mortality
rates directly. More than 20% of the babies died at term and these are the babies who
should have survived because they were delivered at the correct time. More effort should
be channelled in ensuring that the babies delivered at term survive.
This current study results differ from the findings of the study conducted in Brazil on the
risk factors for perinatal mortality in two different levels of care (Moura, Maesta, Rugolo,
Angulski, Caddeira, Peracoli & Rudge 2014:3).
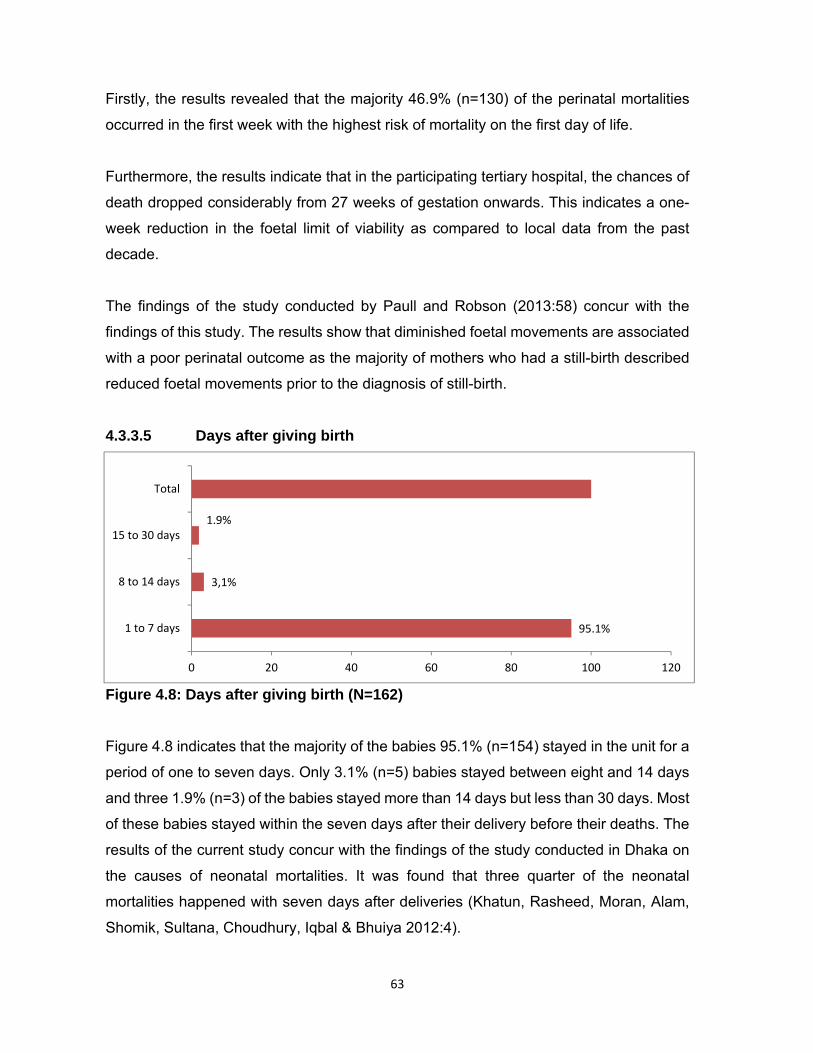
63
Firstly, the results revealed that the majority 46.9% (n=130) of the perinatal mortalities
occurred in the first week with the highest risk of mortality on the first day of life.
Furthermore, the results indicate that in the participating tertiary hospital, the chances of
death dropped considerably from 27 weeks of gestation onwards. This indicates a one-
week reduction in the foetal limit of viability as compared to local data from the past
decade.
The findings of the study conducted by Paull and Robson (2013:58) concur with the
findings of this study. The results show that diminished foetal movements are associated
with a poor perinatal outcome as the majority of mothers who had a still-birth described
reduced foetal movements prior to the diagnosis of still-birth.
4.3.3.5 Days after giving birth
Figure 4.8: Days after giving birth (N=162)
Figure 4.8 indicates that the majority of the babies 95.1% (n=154) stayed in the unit for a
period of one to seven days. Only 3.1% (n=5) babies stayed between eight and 14 days
and three 1.9% (n=3) of the babies stayed more than 14 days but less than 30 days. Most
of these babies stayed within the seven days after their delivery before their deaths. The
results of the current study concur with the findings of the study conducted in Dhaka on
the causes of neonatal mortalities. It was found that three quarter of the neonatal
mortalities happened with seven days after deliveries (Khatun, Rasheed, Moran, Alam,
Shomik, Sultana, Choudhury, Iqbal & Bhuiya 2012:4).
95.1%
3,1%
1.9%
0 20 40 60 80 100 120
1 to 7 days
8 to 14 days
15 to 30 days
Total

64
The findings of the study conducted in the National Hospital in Dili; East Timor also concur
with the results of the current study by showing that the majority of perinatal mortality
cases occur in less than seven days of their stay in the neonatal unit (Bucens, et al
2013:453). The same study came to the same conclusion that most perinatal mortality
cases occur during the first seven days of the babies’ lives.
4.3.3.6 Intervention taken by health care workers
Table 4.10: Intervention taken by health care workers (N=162)
Interventions were taken
Response Frequency (n) Percent (%)
Non-medication treatment 158 97.6%
Medication drug pharmacological administration 2 1.2%
Other 2 1.2%
Total 162 100
The results shown in table 4.10 reveal that non-medication treatment was administered
to most 97.6% (n=158) of the babies. Only 1.2% (n=2) of the babies were nursed with
medication or pharmacological drugs and a further two case records 1.2 % (n=2) showed
that there was no other intervention. In most of the cases non- medication treatment was
implemented. This means that the health workers treated these babies in their care
without medication. Prevention of Mother to Child Transmission (PMTCT) guidelines
indicate that the antiretroviral prophylaxis should be administered to all babies born to
HIV positive mothers soon after birth (Department of Health 2010:20).
4.3.3.7 Referral to the neuro-surgeon
infant was referred to the neuro-surgeon. One case record 0.6 % (n=1) had insufficient
information to link it to the referral of the baby to a neuro-surgeon. It was evident as
indicated in the records that the facility was able to manage the babies before they were
referred to a neuro-surgeon as indicated in the records.
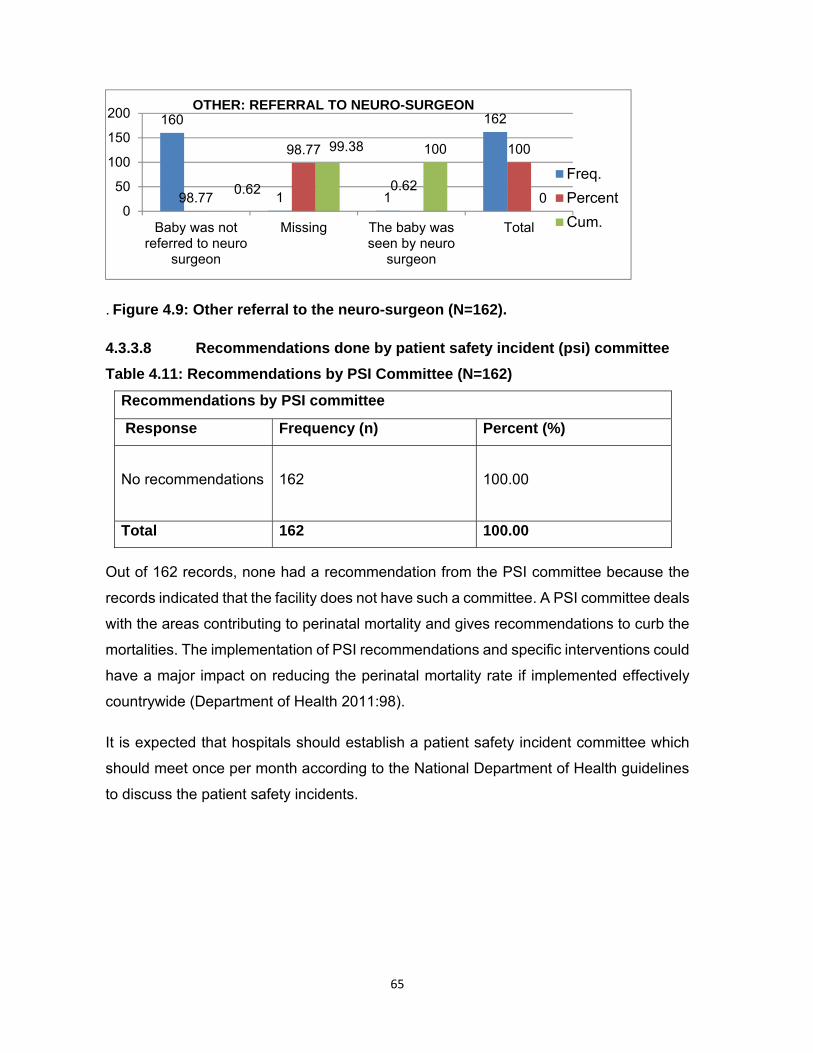
65
. Figure 4.9: Other referral to the neuro-surgeon (N=162).
4.3.3.8 Recommendations done by patient safety incident (psi) committee
Table 4.11: Recommendations by PSI Committee (N=162)
Recommendations by PSI committee
Response Frequency (n) Percent (%)
No recommendations 162 100.00
Total 162 100.00
Out of 162 records, none had a recommendation from the PSI committee because the
records indicated that the facility does not have such a committee. A PSI committee deals
with the areas contributing to perinatal mortality and gives recommendations to curb the
mortalities. The implementation of PSI recommendations and specific interventions could
have a major impact on reducing the perinatal mortality rate if implemented effectively
countrywide (Department of Health 2011:98).
It is expected that hospitals should establish a patient safety incident committee which
should meet once per month according to the National Department of Health guidelines
to discuss the patient safety incidents.
160
1 1
162
98.77
98.77
0.62
100
0.62
99.38 100
00
50
100
150
200
Baby was notreferred to neuro
surgeon
Missing The baby wasseen by neuro
surgeon
Total
OTHER: REFERRAL TO NEURO-SURGEON
Freq.
Percent
Cum.

66
4.3.3.9 Delay in seeking help by patient or family
Figure 4.10: Delay in seeking help by the patient or family (N=162)
Figure 4.10 indicates that in four 2.5 % (n=4) cases the mother or family of the infant
delayed in going to the health care facility to seek help whereas in most 97.5% (n=158)
cases the mother or family member came to seek health care services for the baby on
time. However, irrespective of the help sought by the mother or family, the outcome was
perinatal mortality. There is an inverse proportion between the delay in seeking help by
the patient or family members and the outcomes of the perinatal mortality. Although the
majority of the records indicated that the patient or family came to seek help, the same
babies died in the same health care facility.
The results of this study is in contrast to the findings of the study conducted in Nigeria by
Guerrier, Oluyide, Keramarou and Grais (2013:498) on the high maternal and neonatal
mortality rates in northern Nigeria. It was an eight- month observational study which found
that the neonatal mortality rate is related to prematurity and infection (sepsis). The study
concluded that the majority of babies died because of poor attitudes towards seeking
health care. The study further indicated that many women and neonates died in rural
Africa without presenting themselves to modern health care services.
0%
20%
40%
60%
80%
100%
Freq. Percent
4 2.5%
158 97.5%
DELAY IN SEEKING HELP BY PATIENT OR FAMILY
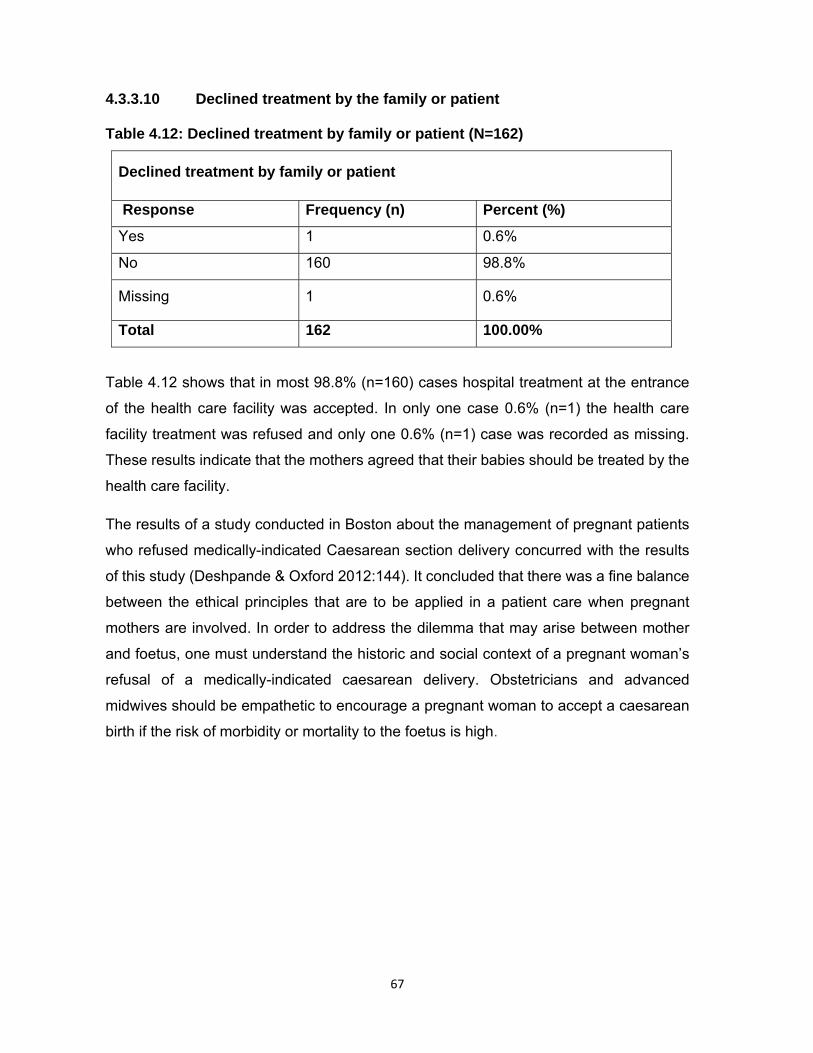
67
4.3.3.10 Declined treatment by the family or patient
Table 4.12: Declined treatment by family or patient (N=162)
Declined treatment by family or patient
Response Frequency (n) Percent (%)
Yes 1 0.6%
No 160 98.8%
Missing 1 0.6%
Total 162 100.00%
Table 4.12 shows that in most 98.8% (n=160) cases hospital treatment at the entrance
of the health care facility was accepted. In only one case 0.6% (n=1) the health care
facility treatment was refused and only one 0.6% (n=1) case was recorded as missing.
These results indicate that the mothers agreed that their babies should be treated by the
health care facility.
The results of a study conducted in Boston about the management of pregnant patients
who refused medically-indicated Caesarean section delivery concurred with the results
of this study (Deshpande & Oxford 2012:144). It concluded that there was a fine balance
between the ethical principles that are to be applied in a patient care when pregnant
mothers are involved. In order to address the dilemma that may arise between mother
and foetus, one must understand the historic and social context of a pregnant woman’s
refusal of a medically-indicated caesarean delivery. Obstetricians and advanced
midwives should be empathetic to encourage a pregnant woman to accept a caesarean
birth if the risk of morbidity or mortality to the foetus is high.
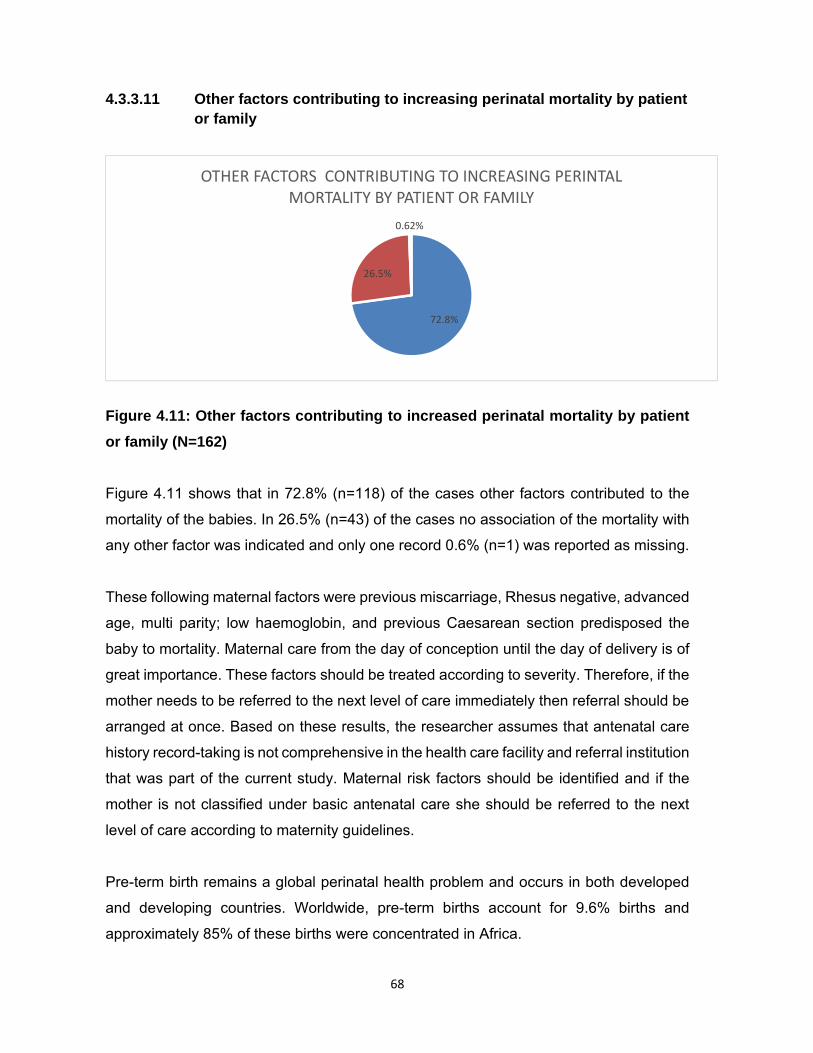
68
4.3.3.11 Other factors contributing to increasing perinatal mortality by patient or family
Figure 4.11: Other factors contributing to increased perinatal mortality by patient
or family (N=162)
Figure 4.11 shows that in 72.8% (n=118) of the cases other factors contributed to the
mortality of the babies. In 26.5% (n=43) of the cases no association of the mortality with
any other factor was indicated and only one record 0.6% (n=1) was reported as missing.
These following maternal factors were previous miscarriage, Rhesus negative, advanced
age, multi parity; low haemoglobin, and previous Caesarean section predisposed the
baby to mortality. Maternal care from the day of conception until the day of delivery is of
great importance. These factors should be treated according to severity. Therefore, if the
mother needs to be referred to the next level of care immediately then referral should be
arranged at once. Based on these results, the researcher assumes that antenatal care
history record-taking is not comprehensive in the health care facility and referral institution
that was part of the current study. Maternal risk factors should be identified and if the
mother is not classified under basic antenatal care she should be referred to the next
level of care according to maternity guidelines.
Pre-term birth remains a global perinatal health problem and occurs in both developed
and developing countries. Worldwide, pre-term births account for 9.6% births and
approximately 85% of these births were concentrated in Africa.
72.8%
26.5%
0.62%
OTHER FACTORS CONTRIBUTING TO INCREASING PERINTAL MORTALITY BY PATIENT OR FAMILY

69
The causal factors of pre-term births are maternal medical conditions during pregnancy,
multiple births, greater use of assisted reproduction techniques and Caesarean births in
developed countries (Beck, Woljdyla, Say, Betran, Meraldi, Rquejo, Rubens, Menon &
Van Look 2010:32).
According to Andargie, Berhane, Worku and Kebede (2013:168), in the developing
countries there are a number of risk factors associated with pre-term births, such as poor
socio-economic status, very young maternal age, poor diet, cigarette smoking and
infections. A birth interval of less than two years was also associated with increased
perinatal mortality. Chronic conditions, such as maternal hypertension and diabetes
mellitus increase the risk of still-births. Obstetric complications, such as multiple
pregnancy and prolonged labour increase the perinatal mortality risk if the woman is not
managed properly.
4.3.3.11.1 Logistics: delay of emergency medical service (ems) Table 4.13: Logistics: Delay of emergency medical services (N=162)
Logistic Delay of EMS
Response Frequency (n) Percent (%)
Yes 1 0.6%
No 160 98.8%
Not sure 1 0.6%
Total 162 100.00%
The results in table 4.13 indicate that in 98.8% (n=160) of the cases there was no delay
of emergency medical services, 0.6% (n=1) indicated that they were not sure whether
there was a delay by the emergency services (EMS) and only one 0.6% (n=1) record
indicated a delay by EMS. Generally, according to these results, EMS does not delay the
patient during referral. The results of the study differ from the results of a study conducted
in Gambia regarding the barriers to emergency obstetric care services in perinatal deaths
in rural Gambia which show that long distances to the hospital and lack of appropriate
means of transportation (EMS included) are major problems affecting the timely
evacuation of women with obstetric complications (Jammeh, Sundby & Vangen 2011:4).

70
4.3.3.11.2 Logistics: accessibility or availability of transport
Figure 4.12: Logistics: Accessibility or availability of transport (N=162)
The results in figure 4.12 show that most 98.8%, (n=160) of the mothers did not
experience a lack of transport but used either private or emergency medical services. In
only one 0.6% (n=1) case there was uncertainty about the accessibility or availability of
transport and in one other 0.6%, (n=1) a problem in regard to the availability or
accessibility of transport was recorded. From the facility records it would appear that in
the health education offered to patients they are encouraged to arrange their own private
transport. Private transportation of patients to the health care facility reduces the turn-
around time for emergency services. Reduced turn-around time of emergency services
to a health facility should decrease perinatal mortality. In this regard, the results of this
study differ from the results of the study conducted in Gambia by Jammeh, Sundby and
Vangen (2011: 4) on the role of emergency obstetric care services in perinatal deaths in
rural Gambia. The results show that long distances to the hospital and a lack of
appropriate means of transportation were found to be major problems affecting the timely
evacuation of women with obstetric complications.
0.6%
98.8%
0.6%
0.00% 20.00% 40.00% 60.00% 80.00% 100.00% 120.00%
Yes
No
Not sure
LOGISTICSAVAILABILITY OR ACCESSIBILITY OF TRANSPORT
Percent
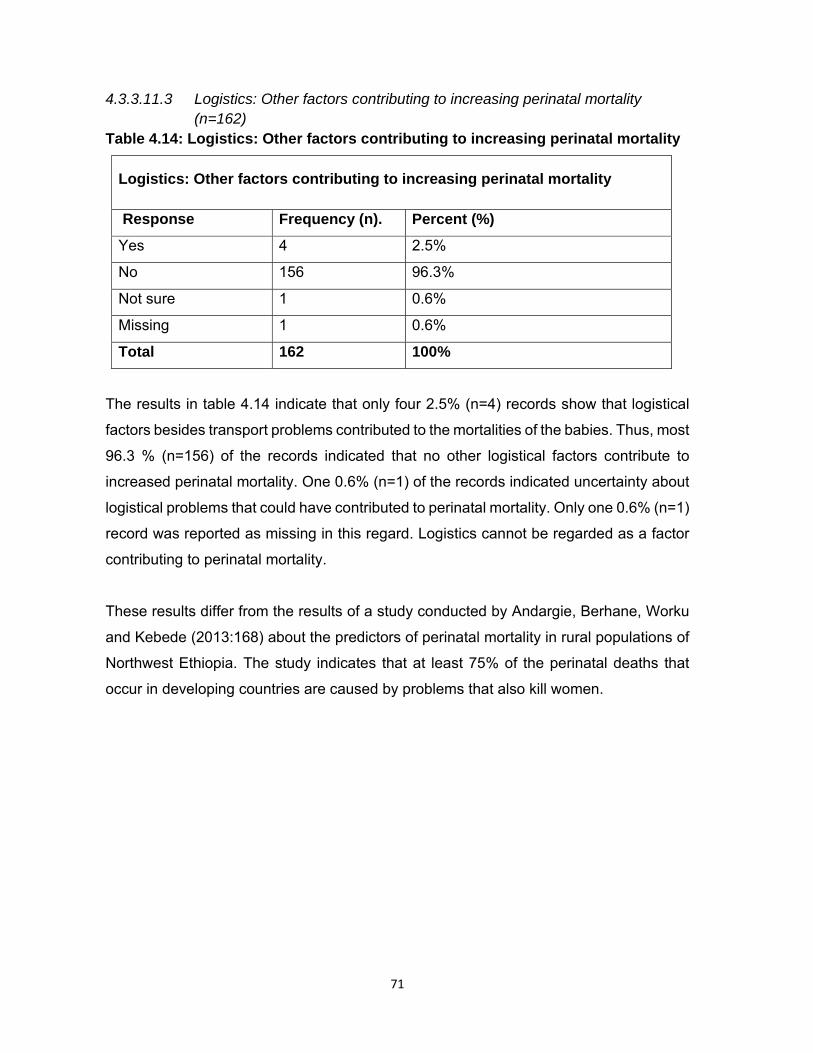
71
4.3.3.11.3 Logistics: Other factors contributing to increasing perinatal mortality (n=162)
Table 4.14: Logistics: Other factors contributing to increasing perinatal mortality
Logistics: Other factors contributing to increasing perinatal mortality
Response Frequency (n). Percent (%)
Yes 4 2.5%
No 156 96.3%
Not sure 1 0.6%
Missing 1 0.6%
Total 162 100%
The results in table 4.14 indicate that only four 2.5% (n=4) records show that logistical
factors besides transport problems contributed to the mortalities of the babies. Thus, most
96.3 % (n=156) of the records indicated that no other logistical factors contribute to
increased perinatal mortality. One 0.6% (n=1) of the records indicated uncertainty about
logistical problems that could have contributed to perinatal mortality. Only one 0.6% (n=1)
record was reported as missing in this regard. Logistics cannot be regarded as a factor
contributing to perinatal mortality.
These results differ from the results of a study conducted by Andargie, Berhane, Worku
and Kebede (2013:168) about the predictors of perinatal mortality in rural populations of
Northwest Ethiopia. The study indicates that at least 75% of the perinatal deaths that
occur in developing countries are caused by problems that also kill women.

72
4.3.3.11.4 Facilities: Lack of services after hours
Figure 4.13: Facilities: Lack of services after hours (N=162)
Figure 4.13 indicates that 99.4% (n=161) of the patients received 24-hour services from
the facilities of referral (clinics and community health centres) and the referring facility
and in only one 0.6% (n=1) of the cases the patient did not know whether services are
rendered after hours. All but one of the patients had knowledge that the facility renders a
24-hour service. This implies that the patients can seek the health care services, including
maternal and perinatal care at any time of the day. The records further indicated that the
referring facility was also rendering 24-hour services and, therefore, nearly all received
it.
The results of this study differ from the results of the study conducted in Nigeria by
Adeboye, Ojuawo, Ernest, Fadeyi and Salisu (2010:250) on the mortality patterns within
twenty-four hours of emergency paediatric admission in a resource-poor national health
facility. In the aforementioned study, the majority of the babies died because the mothers
reported late at the hospital for medical care. Furthermore, the results indicated that
facilities of referral do not render 24-hour services except in the case of the hospitals in
Nigeria.
99.4%
0.6%
0.00% 20.00% 40.00% 60.00% 80.00% 100.00% 120.00%
No
Not sure
Total
FACILITIES: LACK OF SERVICES AFTER HOURS

73
4.3.3.11.5 Facilities: Lack of equipment
Table 4.15: Facilities: Lack of equipment (N=162)
Facilities: Lack of equipment
Response Frequency (n) Percent (%)
No 161 99.4%
Yes 1 0.6%
Total 162 100.00%
The results in table 4.15 show that 99.4% (n=161) of the facilities have equipment and consumables, including intravenous infusion lines and medication. In only one 0.6% (n=1) case the record indicated that the facility experienced a lack of equipment. Lack of equipment does not appear to be a problem. The ‘Saving mothers’ report (Department of Health 2013b:27) indicates that lack of equipment does not contribute to perinatal mortality.
4.3.3.11.6 Facilities: Other factors contributing to increasing perinatal mortality
Figure 4.14: Facilities: Other factors contributing to increased perinatal mortality
(N=162)
In figure 4.14 the results indicate that most 98.2% (n=159) of the records show that other
factors related to the facilities were not contributing to increased perinatal mortality. Only
one 0.6% (n=1) record indicated uncertainty about whether other factors related to
facilities contributed to perinatal mortality, and two 1.2% (n=2) records did not have this
information.
98.2%
0.6%
1.2%
No
Not sure
Missing
0.00% 20.00% 40.00% 60.00% 80.00% 100.00% 120.00%
FACILITIES: OTHER FACTORS CONTRIBUTING TO INCREASING PERINATAL MORTALITY
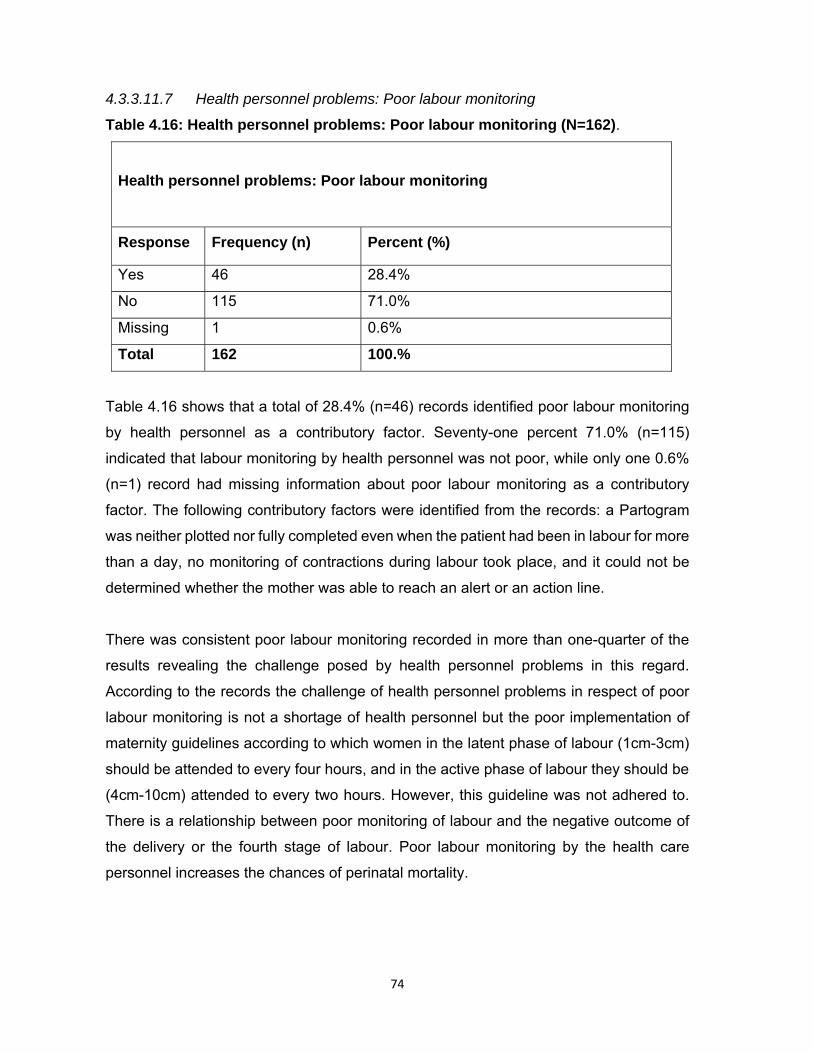
74
4.3.3.11.7 Health personnel problems: Poor labour monitoring
Table 4.16: Health personnel problems: Poor labour monitoring (N=162).
Health personnel problems: Poor labour monitoring
Response Frequency (n) Percent (%)
Yes 46 28.4%
No 115 71.0%
Missing 1 0.6%
Total 162 100.%
Table 4.16 shows that a total of 28.4% (n=46) records identified poor labour monitoring
by health personnel as a contributory factor. Seventy-one percent 71.0% (n=115)
indicated that labour monitoring by health personnel was not poor, while only one 0.6%
(n=1) record had missing information about poor labour monitoring as a contributory
factor. The following contributory factors were identified from the records: a Partogram
was neither plotted nor fully completed even when the patient had been in labour for more
than a day, no monitoring of contractions during labour took place, and it could not be
determined whether the mother was able to reach an alert or an action line.
There was consistent poor labour monitoring recorded in more than one-quarter of the
results revealing the challenge posed by health personnel problems in this regard.
According to the records the challenge of health personnel problems in respect of poor
labour monitoring is not a shortage of health personnel but the poor implementation of
maternity guidelines according to which women in the latent phase of labour (1cm-3cm)
should be attended to every four hours, and in the active phase of labour they should be
(4cm-10cm) attended to every two hours. However, this guideline was not adhered to.
There is a relationship between poor monitoring of labour and the negative outcome of
the delivery or the fourth stage of labour. Poor labour monitoring by the health care
personnel increases the chances of perinatal mortality.
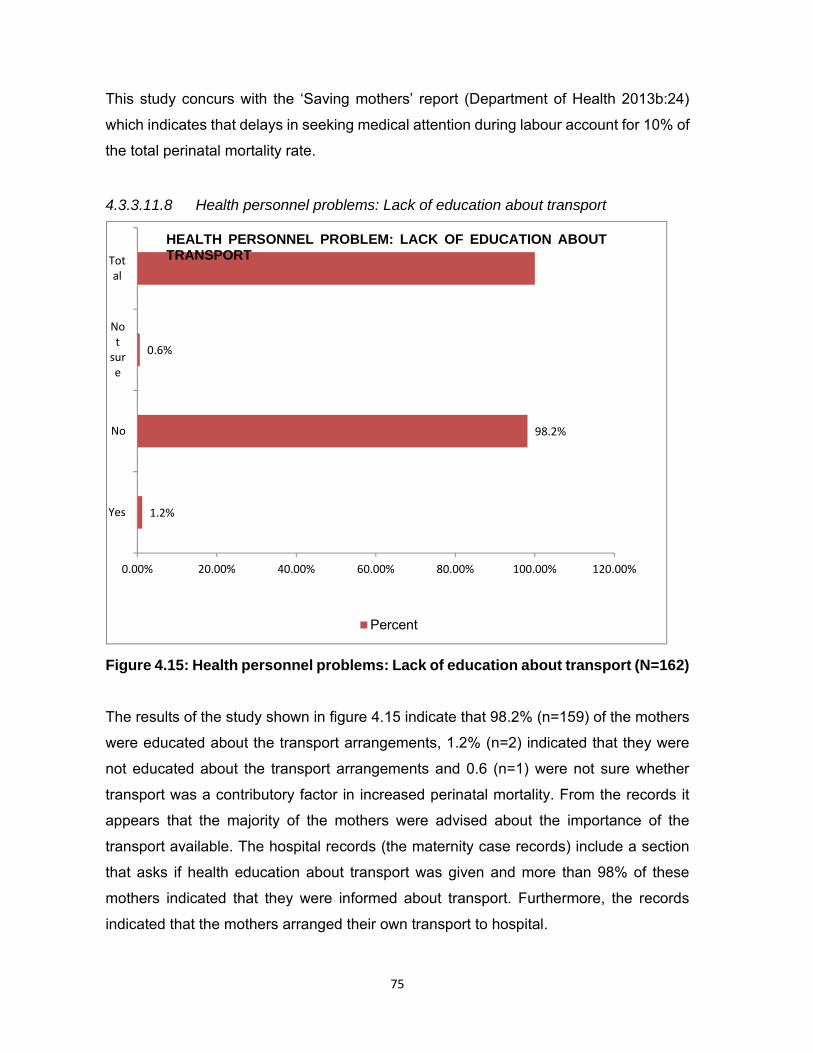
75
This study concurs with the ‘Saving mothers’ report (Department of Health 2013b:24)
which indicates that delays in seeking medical attention during labour account for 10% of
the total perinatal mortality rate.
4.3.3.11.8 Health personnel problems: Lack of education about transport
Figure 4.15: Health personnel problems: Lack of education about transport (N=162)
The results of the study shown in figure 4.15 indicate that 98.2% (n=159) of the mothers
were educated about the transport arrangements, 1.2% (n=2) indicated that they were
not educated about the transport arrangements and 0.6 (n=1) were not sure whether
transport was a contributory factor in increased perinatal mortality. From the records it
appears that the majority of the mothers were advised about the importance of the
transport available. The hospital records (the maternity case records) include a section
that asks if health education about transport was given and more than 98% of these
mothers indicated that they were informed about transport. Furthermore, the records
indicated that the mothers arranged their own transport to hospital.
1.2%
98.2%
0.6%
0.00% 20.00% 40.00% 60.00% 80.00% 100.00% 120.00%
Yes
No
Notsure
Total
HEALTH PERSONNEL PROBLEM: LACK OF EDUCATION ABOUTTRANSPORT
Percent
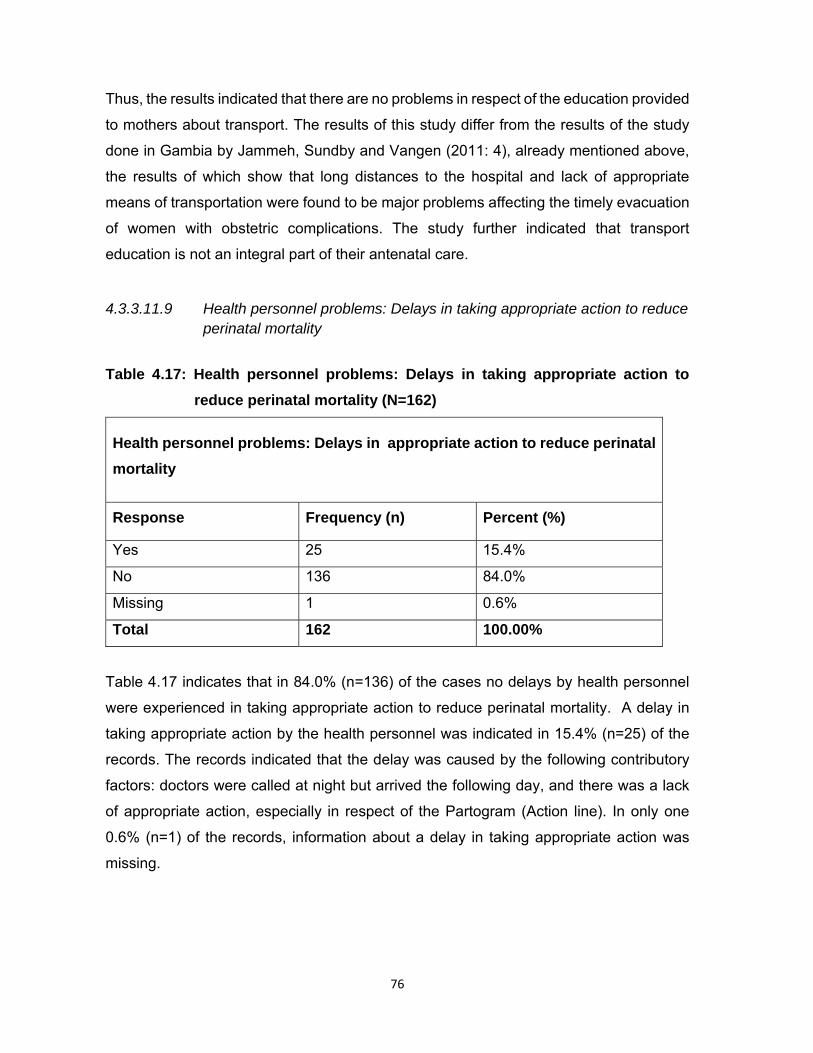
76
Thus, the results indicated that there are no problems in respect of the education provided
to mothers about transport. The results of this study differ from the results of the study
done in Gambia by Jammeh, Sundby and Vangen (2011: 4), already mentioned above,
the results of which show that long distances to the hospital and lack of appropriate
means of transportation were found to be major problems affecting the timely evacuation
of women with obstetric complications. The study further indicated that transport
education is not an integral part of their antenatal care.
4.3.3.11.9 Health personnel problems: Delays in taking appropriate action to reduce perinatal mortality
Table 4.17: Health personnel problems: Delays in taking appropriate action to
reduce perinatal mortality (N=162)
Health personnel problems: Delays in appropriate action to reduce perinatal
mortality
Response Frequency (n) Percent (%)
Yes 25 15.4%
No 136 84.0%
Missing 1 0.6%
Total 162 100.00%
Table 4.17 indicates that in 84.0% (n=136) of the cases no delays by health personnel
were experienced in taking appropriate action to reduce perinatal mortality. A delay in
taking appropriate action by the health personnel was indicated in 15.4% (n=25) of the
records. The records indicated that the delay was caused by the following contributory
factors: doctors were called at night but arrived the following day, and there was a lack
of appropriate action, especially in respect of the Partogram (Action line). In only one
0.6% (n=1) of the records, information about a delay in taking appropriate action was
missing.

77
In approximately 5% of the perinatal mortality cases reported in the ‘Saving babies’
report, (Department of Health 2013b: 24) there was a direct human resources delay in
taking appropriate action. This percentage is probably higher as other avoidable factors,
missed opportunities and sub-standard care that also include the human resource factor,
such as delays in referring patients. Furthermore, the assessments of the 25 mortalities
were performed at the site where the mortality occurred. Thus, the reporting of this factor
is mostly likely to be under-estimated.
4.3.3.11 10 Health personnel problems: Other factors contributing to increasing perinatal mortality
Figure 4.16: Health personnel problems: Other factors contributing to increasing
perinatal mortality (N=162)
Figure 4.16 shows that the majority 75.3% n=122) of the records indicated other factors
related to health personnel problems as contributing to perinatal mortality. Only 24.1%
(n=39) indicated no other factors related to health personnel problems contributed to
increased perinatal mortality and only one (0.6%) record had missing information in this
regard.
75.3%
24.1%
0.6%
100%
0.00% 20.00% 40.00% 60.00% 80.00% 100.00% 120.00%
Yes
No
Missing
Total
HEALTH PERSONNEL PROBLEM: OTHER FACTORS CONTRIBUTING TOINCREASING PERINATAL MORTALITY
Percent
78
The records indicated that health personnel identified the following factors that contribute
to increased perinatal mortality: poor completion of maternity case records by midwives,
poor utilisation of Partogram equipment during labour, incomplete recording, and poor
monitoring of gestational age during antenatal care, protocols not followed especially for
eclamptic mothers, failure of physicians on call to arrive on time and failure by clinics to
refer the mothers on time to antenatal care (ANC) at hospital. The basic antenatal care
guide indicates that antenatal care should be at a hospital but clinics continue not to refer
the patient.
Recommendations to be made should include knowledgeable, dedicated and skilled
health care providers to reduce the perinatal mortality rate in the health care facility. In-
service training, health education and symposia about perinatal care should be planned
and implemented. Consequences management should be implemented by managers of
the health care facility in cases in which protocols and procedures were violated and
negligence is evident. Consequences management can be influenced by monthly patient
safety meetings.
The majority of the records reflected that health care personnel contributed to the
mortalities that occurred between the 1st January 2015 and the 31st December 2015. The
records indicate unprofessional behaviour among doctors who do not respond to calls
and discrepancies in the training given to doctors and nurses also featured as a
contributory factor in perinatal mortality. This study concurs with the ‘saving babies’ report
(Department of Health 2013b: 25) which indicated that the following factors contribute to
perinatal mortality: personnel not sufficiently trained to manage patients personnel too
junior or inexperienced to manage patients, insufficient doctors and nurses available,
delay in doctors responding to calls, doctors lack of response to calls, delays in calling
for expert advice, delays in referring patients and delays in administering anaesthetics.

79
4.3.3.11.11 Health or, and illness of the neonate: Prematurity Table 4.18: Health and, or illness of the neonate: Prematurity (N=162)
Health and/or illness of the neonate: Prematurity
Response Frequency (n) Percent (%)
Yes 60 37.04%
No 102 62.96%
Total 162 100.00%
In table 4.18, the results reveal that prematurity as a risk factor accounted for over one-
third 37.0% (n=60) of the total babies admitted to the neonatal unit, and 63.0% (n=102)
of the records did not contain any sign of prematurity throughout the admission of the
mother or the baby. Thus, prematurity remains one of the contributory factors in the
perinatal mortality rate.
A study on 92 patterns of morbidity and mortality in a new-born special care unit revealed
that 452 babies were admitted with different conditions. The conditions were as follows,
neonatal sepsis was 35.1% (n=228) of the cases, prematurity was16.4% (n=108) and
birth asphyxia was 24.1% (n=116) of the cases (Ugwu 2012:136). The study identified
prematurity as another contributory factor in perinatal mortality. Hence, it concurs with
the current study. In the East Timor neonate hospital the common reason for admission
was infection 38% (n=868) followed by respiratory disease 22%; n=499), asphyxia 12%
(n=282) and prematurity 11% (n=242) (Bucens et al 2013:453).
4.3.3.11.12 Health or /and illness of the neonate: Pneumonia
100.00%
100.00%
0.00% 20.00% 40.00% 60.00% 80.00% 100.00% 120.00%
No
Total
HEALTH OR/AND ILLNESS OF THE NEONATE PNEUMONIA

80
Figure 4.17: Health and/or illness of the neonate: Pneumonia (N=162)
The results in figure 4.17 indicate that none of the 162 infants in the current study
experienced any pneumonic attack. The results indicate that no babies experienced
pneumonia as an illness during their stay in the health care facility. Pneumonia did not
contribute to perinatal mortality in this study. The study conducted in London on the
e�ects of 100% case management on perinatal mortality due to sepsis and pneumonia
indicates that oral or injectable antibiotics alone are highly effective in reducing deaths
from neonatal sepsis or pneumonia (Zaid, Ganatra, Syed, Cousens, Lee, Black,
Bhutta & Lawn 2011:2). The results of the current study differ from the aforementioned
study as no indication of pneumonia or pneumonic attack was recorded.
4.3.3.11.13 Health or /and illness of the neonate: Birth asphyxia Table 4.19: Health and/or illness of the neonate: Birth asphyxia (N=162)
Health or/and illness of the neonate :Birth asphyxia
Response Frequency (n) Percent (%)
No 161 99.4%
Missing 1 0.6%
Total 162 100.00%
According to table 4.19, birth asphyxia is not a factor contributing to perinatal mortality.
Birth asphyxia was not indicated as a contributory factor in all but one of the records
99.4% (n=161) and in only one 0.6% (n=1) of the cases information about birth asphyxia
was missing. Generally, birth asphyxia was not experienced by the babies during their
stay at the health facility. The results of this study differ from the results of the study
conducted by Bucens, et al (2013:454) in East Timor on neonatal morbidity and mortality
at the neonate national hospital in Dili. It revealed that the common reason for admission
was infection 38% followed by respiratory, disease 22%, asphyxia 12% and prematurity
11%). The study on patterns of morbidity and mortality in the new-born special care unit
showed different results to the current study as, of the total of babies admitted with
different conditions, neonatal sepsis was 35.1%, prematurity was 16.1% and birth
asphyxia was 24.1% (Ugwu 2012:136).
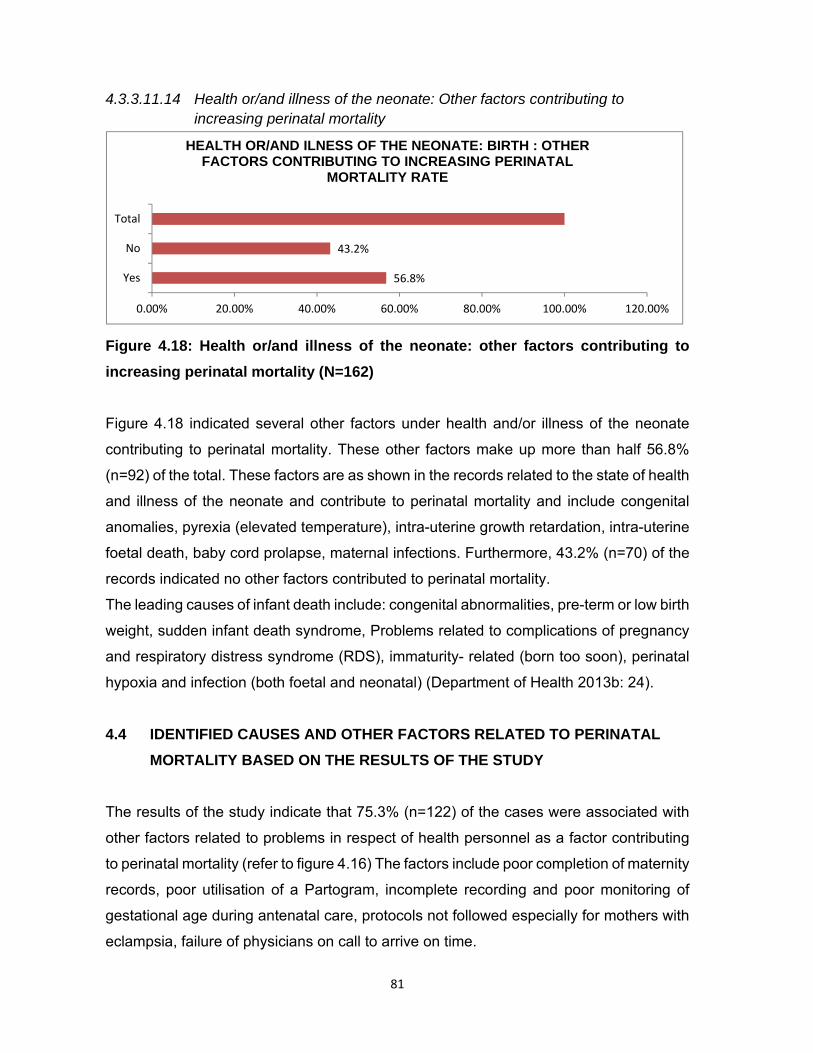
81
4.3.3.11.14 Health or/and illness of the neonate: Other factors contributing to increasing perinatal mortality
Figure 4.18: Health or/and illness of the neonate: other factors contributing to
increasing perinatal mortality (N=162)
Figure 4.18 indicated several other factors under health and/or illness of the neonate
contributing to perinatal mortality. These other factors make up more than half 56.8%
(n=92) of the total. These factors are as shown in the records related to the state of health
and illness of the neonate and contribute to perinatal mortality and include congenital
anomalies, pyrexia (elevated temperature), intra-uterine growth retardation, intra-uterine
foetal death, baby cord prolapse, maternal infections. Furthermore, 43.2% (n=70) of the
records indicated no other factors contributed to perinatal mortality.
The leading causes of infant death include: congenital abnormalities, pre-term or low birth
weight, sudden infant death syndrome, Problems related to complications of pregnancy
and respiratory distress syndrome (RDS), immaturity- related (born too soon), perinatal
hypoxia and infection (both foetal and neonatal) (Department of Health 2013b: 24).
4.4 IDENTIFIED CAUSES AND OTHER FACTORS RELATED TO PERINATAL
MORTALITY BASED ON THE RESULTS OF THE STUDY
The results of the study indicate that 75.3% (n=122) of the cases were associated with
other factors related to problems in respect of health personnel as a factor contributing
to perinatal mortality (refer to figure 4.16) The factors include poor completion of maternity
records, poor utilisation of a Partogram, incomplete recording and poor monitoring of
gestational age during antenatal care, protocols not followed especially for mothers with
eclampsia, failure of physicians on call to arrive on time.
56.8%
43.2%
Yes
No
Total
0.00% 20.00% 40.00% 60.00% 80.00% 100.00% 120.00%
HEALTH OR/AND ILNESS OF THE NEONATE: BIRTH : OTHER FACTORS CONTRIBUTING TO INCREASING PERINATAL
MORTALITY RATE
82
The basic antenatal care (BANC) protocol indicates that mothers who do not meet its
criterion of being classified under basic antenatal care from maternity case records
should be referred to hospital but some records indicated that clinics continued with
BANC even if the criterion was not met. In the majority of the cases there were delays by
the health care personnel in taking appropriate action which accounted for 15.4% (n=25)
of the cases (refer to table 4.17).
Furthermore, 72.8% (n=118) of the other factors related to patient or family contributed
to the mortalities of babies. Factors, such as previous miscarriage, rhesus negative,
advanced age, multi parity, low HB, and previous Caesarean section predisposed the
baby to mortality (refer to figure 4.11).
A total of 57.8% (n=92) records indicated that other factors related to the illness of the
neonate contributed to perinatal mortality. These factors include congenital anomalies,
pyrexia (elevated temperature), intra-uterine growth retardation, intra-uterine foetal
death, and baby cord prolapse (refer to figure 4.18).
Pre-term birth encompassed 45.1% (n=73) of the deaths and prematurity accounted for
37.0% (n=60) of the deaths (refer to figure 4.5 and table 4.18 respectively). The results
of the study differ from the report on perinatal death in South Africa which found that
respiratory and cardiovascular disorders specific to the perinatal period was the leading
cause of death in all age groups for each of the three years (National Department
2014b:21). For each of the three years, the ten leading causes of death differed greatly
in ranking and also in proportions by age.
The results of this study provide an overview of health personnel problems as the leading
contributory factor to perinatal mortality. This was followed by other factors related to
patient or family that contributed to the mortalities of babies. Other factors related to the
illness and state of health of the infant contributed significantly to perinatal mortality and
factors, such as congenital anomalies, pyrexia (elevated temperature), intra-uterine
growth retardation, intra-uterine foetal death, and baby cord prolapse should be
considered during neonatal care. Pre-term birth and prematurity are risk factors that
should be managed immediately after birth, and all babies should be managed prior to
being transferred to another health care institution.
83
4.5 NUMBER OF DAYS IN NEONATAL UNIT ON DISCHARGE OR DEATH
About 95.1% (n=154) (refer to figure 4.8) of the babies remained in the unit for less than
seven days, with 3.1% (n=5) staying between 8 days and 14 days and 5.5 (n=9%) of the
babies remained for less than 30 days. Three 1.9% (n=3) babies remained 15 and 30
days and no babies stayed for more than 30 days in the unit (refer to figure 4.5). A study
conducted on the causes of neonatal and maternal deaths indicated that most of neonatal
deaths occurred during the first seven (0-7) days (Khatun, Rasheed, Moran, Alam,
Shomik, Sultana, Choudhury, Iqbal & Bhuiya 2012:4). According to Bucens et al
(2013:454), the majority of babies stayed for less than 7 days in the neonatal unit.
Effective care of babies in the first week of care can reduce perinatal mortality. The
package of essential care includes antenatal care for the mother, obstetric care and birth
attendant's ability to resuscitate new-borns at birth. Most of the infections related to
mortality could be avoided by identifying perinatal risk factors.
4 6 CONCLUSION
In this chapter, the analysed data is presented in graphs and tables. The results were
described and discussed and references to other studies were also made in relation to
the results of this study. Chapter 5 discusses the summary and recommendations of the
study.

84
CHAPTER 5
DISCUSSION, CONCLUSION AND RECOMMENDATIONS
5.1 INTRODUCTION
The previous chapter discussed the results of the study. The data was analysed,
presented and interpreted. This chapter summarises and discusses the results and
presents the conclusions and recommendations of the researcher in regard to the
problem statement and objectives of the study. The study’s objectives were to determine
the causes of the increased perinatal mortality rate, to identify and describe other factors
that contributed to an increase in the perinatal mortality rate in a specific rural health care
facility, and to formulate and present the recommendations to the Limpopo Department
of Health based on the results in order to assist in the reduction of perinatal mortality in
Limpopo province. A summary and interpretation of the research results focused on the
outcomes of reducing the perinatal mortality rate in Limpopo province.
5.2 SUMMARY OF THE RESEARCH RESULTS
5.2.1 Outcome of the baby’s delivery
The results of the study as indicated in table 4.1 show that the nearly two thirds 61.7%
(n=100) of the infants were still-born, 37.0% (n=60) were neonatal deaths and in two
(1.2%) of the cases the records had no information about the death of the baby. More
than half (n=100) of the babies died in the first week of their lives with the highest perinatal
mortality rate on the first day of life. The results of a study conducted by Bayou and
Berhan (2012:154) in Ethiopia on perinatal mortality and associated factors concurs with
these results as it found that still-births accounted for 87% of perinatal mortalities.
85
5.2.2 Baby’s birth weight
The results in table 4.2 indicate the weights of the babies who died. More than one-third
35.2% (n=57) of the babies weighed between 2501 grams and higher, followed by babies
who weighed between 1501 and 2500 grams 28.4% (n=46), 24.7% (n=40) of the babies
weighed 801 to 1500 grams, 9.3% (n=15) weighed 401 to 800g and lastly only one baby
0.6% (n=1) died with a weight of less than 400 grams.
Three records 1.9% did not record the weight of the babies, and therefore, the researcher
reported them as missing information. This result seems to suggest the probability that
the higher the weight of the baby in this study, the bigger the chances of perinatal
mortality. High admissions were also observed amongst babies with birth weights of over
2500 grams. This result is not consistent with the report about perinatal deaths in South
Africa (National Department 2014b:1). That study found that statistics about the
distribution of still-born babies by birth weight is essential, as low birth weight is
associated with the mortality of many new-borns, developmental problems and health
risks.
5.2.3 Baby’s Apgar score in the first and fifth minute
The scores of over half 58.0% (n=94) of the babies were at 0/10 to 0/10, followed by
10.5% (n =17) at 9/10 in the first and fifth minutes, 3.1% (n=5); 6/10 to 7/10; 3.1% (n=5)
8/10 to 9/10; 3.1% (n=5) 7/10 to 7/10; 1.9% (n=3) 2/10 to 2/10; 1.9% (n=3) 6/10 to 8/10;
1.2% (n=2) 7/10 to 9/10; and 1.2% (n=2) 8/10 to 8/10. The following accounted for 0.6%
on Apgar score classifications: 1/10 to 1/10; 0.6% (n=1); 3/10 to 3/10 0.62% (n=1) and
7/10 to 8/10 0.62%. (n=1). There were cases which appeared in the register, where there
was no classification of Apgar scores of the deceased babies 8.6% (n=14). These cases
were reported as missing results. The following scores 4.3% (n=7) of the babies were
delivered at home without classifications of Apgar scores.
The lower the Apgar score at the first and fifth minutes after birth, the lower the chances
of survival. More than fifty percent (58%; n=94) of these perinatal mortality cases
occurred with scores of 0/10 and 0/10 in the first and fifth minutes of the baby’s death. All
of these records were found to be still-births.

86
The study conducted in China by Li, Zhang, Ling and Jin (2011: 409) on the effect of a
prolonged second stage of labour on maternal and neonatal outcomes found that the
Apgar score used to estimate the survival of the infants was antiquated and its predictive
value has been considerably weakened by the introduction of prompt and effective
neonatal care.
5.2.4 Age on admission
The results in table 4.3 indicated the age on admission of the babies. The highest number
for age on admission was at 0 to 6 hours 72.8% (n=118), followed by 6 to 24 hours 13.6%
(n=22), one day to seven days 10.5% (n=17) and more than seven days 2.5% (n=4). Only
0.6% (n=1) was reported as missing as there was no classification in the records. The
majority 86.4% (n=140) of the babies were admitted within 24 hours. The first 24 hours
of life of the babies are the most crucial hours when the admission of the baby needs the
full attention of health care providers. These babies should be assessed from head to
toe, a proper diagnosis should be made, a plan of action should be executed,
implementations of treatment should be carried out, and an evaluation should be done
according to treatment. The study conducted by Ali, Ahmed and Lohana (2013:428) in
Pakistan on disease patterns and outcomes of neonatal admissions at a secondary care
hospital which indicated that 51% of the babies were admitted within 24 hours concurs
with the results of this study where the majority were admitted within 24 hours.
5.2.5 Reasons for admission
Prematurity as indicated in figure 4.2 accounted for 17.3% (n=28) of the cases as the
reason for the admission of the babies who died compared to only three (1.9%) who died
of neonatal infection. In over half 57.4% (n=93) of the cases the reason for admission
was not recorded. There were some other reasons 23.5% (n=38) that were recorded
besides those provided in the checklist. The results of the study conducted by Ali, Ahmed
and Lohana (2013:428) in Pakistan on disease pattern and outcome of neonatal
admissions at a secondary care hospital indicate that the main reasons for admissions
were prematurity 27.9% and infection 20.3% respectively.
87
5.2.6 Problems on admission
Over one-quarter 27.2% (n=44) of the problems on admission shown in table 4.4 were
associated with the signs of respiratory distress, Signs of shock and bleeding,
hypoglycaemia, convulsions, signs of infection, and babies who failed to suck comprised
only 11.7% (n=20) of the cases. As nearly half 48.8% (n=79) of the problems on
admission were not recorded these cases could have an impact on the results.
The majority of problems on admission were related to signs of respiratory distress as it
accounted for more than one-quarter of the results. Attention should be directed to the
highest number of cases not classified according to problems on admission. Collection
of information during admission of the baby or the mother should be prioritised, record
auditing should be done in the health care facility to identify the challenges of data
collection and recording.
Problems associated with respiratory distress should also be addressed as they are
regarded as the second highest contributory factor in perinatal mortality. Resuscitation
should be prioritised for the baby experiencing respiratory distress. The study coincides
with the study conducted by Narayan (2012:80) in Sri Lanka on patterns of admission
and outcomes in an intensive care unit at high altitude where the results revealed that
the following problems are related to admissions, neonatal jaundice 54%, prematurity
27%, respiratory distress 11%, meconium aspiration 9% and hypoglycaemia 5%.
5.2.7 Appropriate management taken
The results in figure 4.3 show that the majority 94.4% (n=153) of the babies were not
referred out of the health care facility, only 4.3% (n=7) were referred to the next level of
care but managed within the health care establishment.
The study conducted in in an Ethiopian referral hospital identified the challenges related
to the management of babies during admission and acted decisively on them and that
yielded the positive outcome of reducing the perinatal mortality rate. The challenges
identified were that of all the 55 cases admitted the temperatures of 75% (n=43) of the
cases were recorded before the babies were referred to other institutions.

88
It was found that 67% (n=29) of the cases were unidentified hypothermic. Holistically, all
the vital signs of the babies should be taken before referral and the abnormalities
stabilised before referral (Fulton 2013:1).
5.2.8 Further assessment conducted
Babies were assessed to identify the perinatal risk factors. The results indicated in table
4.5 show that nearly all 98.8% (n=160) of the babies were assessed and only two 1.2%
(n=2) records did not indicate whether they were assessed. If assessment was done,
action should be taken if the outcomes which predicted perinatal risk factors could
predispose the babies to perinatal mortality. The results of the study conducted in Kenya
by Aluvaala, Nyamai, Were, Wasunna, Kosgei, Karumbi, Gathara and English (2015: 45)
regarding the assessment of neonatal care in clinical training facilities match the results
of this study as it revealed that in 95% of these facilities the required neonatal forms used
to assess babies during admission were available
5.2.9 Maternal risk factors
The results in figure 4.4 reflect the maternal risk factors as follows, 4.3% (n=7) was
maternal infections, 14.8% (n=24) was the maternal hypertensive disorders, 1.2% (n=2)
was due to gestational diabetes, 53.7% (n=87) records did not reflect maternal risk factors
and 25.9% (n=42) identified other factors related to maternal risk factors.
The health care providers should identify and complete information about maternal risk
factors to all mothers during antenatal care and labour to reduce complications that could
lead to perinatal mortality. The results of the study conducted by Owais, Syed, Farugue,
Das, Ahmed, Rahman and Stein (2013:3) on the maternal and antenatal risk factors for
stillbirth and perinatal mortality in rural Bangladesh differs with the results of this study.
In that study hypertension (6%), and antepartum haemorrhage, were significant risk
factors related to perinatal mortality
89
5.2.10 Perinatal risks
It is shown in table 4.6 that in 95.1% (n=154) of the cases, perinatal risks were identified
although there were no follow-up questions to identify the type of risk. The results of the
study conducted in Brazil identified risks associated with perinatal mortality.
The following risks were identified as intra-uterine infection, premature rupture of ovular
membranes and twin pregnancy (Moura, Maesta, Rugolo, Angulski, Peracoli & Rudge
2014:1).
5.2.11 Perinatal risk factors
The results in figure 4.5 show that pre-term accounted for 45.1% (n=73) of the total babies
admitted in the perinatal unit. The second highest indicated that the cause was
meconium-stained liquid 16.1% (n=26), 14.8% (n=24) were small for gestational age,
6.2% (n=10) were large for gestational age, 2.5% (n=4) were post-term, and other
perinatal risk factors accounted for 13.6% (n=22).
Pre-term babies were the highest in number compared to any other risk factors; pre-term
births predispose babies to perinatal mortality. The other factor that needed attention was
meconium-stained liquid.
The results of a study conducted in Kenya by Yego, DÉste, Byles, Nyongesac and
Williams (2014:5) regarding a case–control study of risk factors for foetal and early
neonatal deaths in a tertiary hospital differ from the results of this study as it identified the
following factors related to perinatal mortality: respiratory distress (33%), neonatal
complications (16%) and congenital malformation (11%).
5.2.12 Estimated gestational age
The results listed in table 4.7 show that the estimated gestational age is as follows: 42.0%
(n=68) were pre-term babies, 45.7% (n=74) were term babies, 7.4% (n=12) were post-
term and 4.9% (n=8) were not recorded. The information not recorded shows that no
classification was made according to an estimated gestational age.

90
The majority of the babies who died were at term followed by pre-term babies and post-
term babies. Pre-term is a direct cause of mortality but also aggravates the other risk
factors where the percentage of small infants for their gestational age may increase.
The study conducted by Marchant, Willey, Katz, Clarke, Kariuki, Kuile, Lusingu,
Ndyomugyeni, Schmiegelow, Watson-Jones and Schellenberg (2012:9) in East African
countries (Kenya, Uganda and Tanzania) on the neonatal risk associated with pre-term
births reported similar results concluding that 52% of these perinatal mortality cases were
born as pre-term babies, and 12.9% of the baby’s outcomes occurred at term.
5.2.13 Classification of neonate according to weight for gestational age
The records in figure 4.6 show that 43.2% (n=70) of the babies were small for gestational
age, 12.4% (n=20) of the babies were born at an average weight for their gestational age
and 5.6% (n=9) of the babies were large for their gestational age. Babies who were
normal for their gestational age contributed to 32.1% (n=52) of perinatal mortalities. At
least 6.2% (n=10) and only 0.6% (n=1) case was not recorded for classification and the
researcher reported it as missing. There is a relationship between small for gestational
age and the classification of neonates according to weight for gestational age. This
relationship reflected in these results was that the smaller the gestational age of the baby,
the lower the chance of survival. The results of the study by Mohangoo, Blondel, Gissler,
Velebil, Macfarlane and Zeitlin (2013:3) conducted in London on international
comparisons of foetal and perinatal mortality rates in high-income countries concur with
this study. It found that the foetal mortality rates based on gestational age were
significantly higher than those based on birth weight. Another study by Pilliod, Cheng,
Jonathan, Smowenden, Amy, Doss, Aaron and Causey (2012:2) conducted in the United
States of America on the risk of intra-uterine foetal death in the small for gestational age
group agreed with the results of this study by showing that the risk of intra-uterine foetal
death is greater for infants who are small for gestational age.
91
5.2.14 Plan of care available
The results in table 4.8 indicate that most 99.4% (n=161) of the babies were allocated a
plan of care record from antenatal care visits and admission in the health care facility until
the baby was classified as a still-birth or neonatal death. The plan of care was written on
admission, apart from the plan of care written either by the doctor or a nurse. However,
the outcome of these babies’ stay in the facility was mortality.
The plan of care needs to address the basic care of the mother and the baby from the
day of conception until the 30 days after the delivery to reduce this perinatal mortality
rate. Only one (0.6%) (n=1) record had no plan of care for continuous re-assessment and
change by the hospital caring for the patient. The study conducted by Dizikes (2014:1) in
Thailand about how improved hospital access lowered the infant death rate among the
poor within a year has led to a 13% drop in infant mortality in about a year.
5.2.15 Resuscitation done
Two-thirds 68.5% (n=111) of the babies as shown in figure 4.7 were not resuscitated,
even those who required resuscitation, and according to the records, no valid reason was
given as to why resuscitation was not done on these babies. The results of the study by
Lloyd (2013:519) about perinatal mortality in South Africa and how it can be decreased,
indicates that the cost-effective intervention, such as resuscitation of the new-born baby,
can dramatically reduce the number of deaths due to asphyxia by 30.8%.
5.2.16 Gestational age in weeks
Table 4.9 indicated that more than half 29.0% (n=47) of the babies died at 28 to 32 weeks
of gestational age. The results in respect of the pre-term and perinatal mortality rates
were in direct proportion to each other. More than 20% of the babies died at term and
these are the babies that should have survived because they were delivered at the correct
time. More effort should be channelled in ensuring that the babies delivered at term
survive.

92
These results agree with the results of the study conducted by Martinez, Aguilar, Lucena,
Vinuesa and Extremera (2013:46) in Spain on perinatal mortality in new-born infants with
a birth weight of less than 1000 grams in hospital in San Cecilio, Granada which revealed
the following distribution of mortality over the perinatal period in new born infants: 39% of
the infants were born at less than 24 weeks, 25% from 24 to 26 weeks, 22% between 27
and 28 weeks, 7% from 29 to 30 weeks and 4% from 31 to 32 weeks and 1% at more
than 32 weeks. The patterns of these results indicate that more babies were lost during
the early weeks of gestational age as shown in the results of this study.
5.2.17 Days after giving birth
The results in figure 4.8 indicate that the majority 95.1% (n=154) of the babies stayed in
the unit for a period ranging between one to seven days, 3.1% (n=5) of the babies stayed
between eight and 14 days and only three (1.9%) of the babies stayed more than 14
days, but less than 30 days. The results of the study coincide with the report in National
Department (2015a:1) about South Africa’s dying babies that indicated that more than
50% of the early neonatal deaths occur between 24 hours (1day) and 167 hours (7days)
after birth and 65% of these mortalities take place in a hospital.
5.2.18 Interventions taken by health care workers
The results in table 4.10 reveal that in 97.5% (n=158) of the cases non-medication
treatment was implemented, these babies were treated without medication while in the
care of the facility. The researcher assumes that interventions were not documented and
recommends that at all the times when the babies are seen or that interventions are done
these actions must be written down. Only two 1.2% (n=2) of the babies were nursed with
medication or pharmacological drugs and 1.2 % (n=2) of the records showed that there
was no other intervention.
The study conducted by Moura, Costa, Rodrigues, Almeida, Maia and Guimaraes
(2011:1570) in Portugal regarding the end of life in the neonatal intensive care unit differs
from the findings of this study because 95.7% of the infants received pharmacological
drug and invasive ventilator support, 75% received antibiotics, and 58.1% received
Inotropic.
93
5.2.19 Other referral to neuro-surgeon
According to figure 4.9, the following results were revealed in respect of the referral of
babies to a neuro-surgeon. Most 98.8% (n=160) of these babies were not referred to the
neuro-surgeon with only one (0.6%) being referred to the neuro-surgeon. The facility was
able to manage the babies before it was necessary to refer them to a neuro- surgeon as
indicated in the records.
The study conducted in 23 countries on child neurology in Africa indicated that only five
countries (South Africa, Senegal, Nigeria, Egypt and Cameroon) had paediatric
neurology groups. The study further indicates that although there was a clear referral
system in South Africa, babies were not referred on time as the level of training related
to neurological problems of the babies is inadequate (Wilmshurst, Badoe, Wammanda,
Mallewa, Kakooza-Mwesige, Venter & Newton 2011:1555). Therefore, a need for training
and referral guidelines to aid primary health cases is recommended in these incidences.
5.2.20 Recommendations done by patient safety incidents committee
Following the results in table 4.11, no recommendations were done by the Patient Safety
Incident committee as to whether the mortalities were avoidable or not avoidable because
the facility does not have a PSI committee. The report of the committee on morbidity and
mortality in children under five years of age recommends that the committees in the
facilities which treat children under five years must be held responsible by the institution
and the factors contributing to these incidents must be discussed.
The report further proposes that the committee should discuss the (ACCESS) issues,
namely; the accountability of managers of institutions to reduce perinatal mortality; the
connection with other institutions if referral is required; the capacity of the health care
workers to deal with the morbidity of babies; the essential steps to deal with the sick
babies; standard operating procedures and guidelines on the implementation used in
maternity cases; and support of the staff and managers experiencing patient safety
incidents (Department of Health 2014:85).
94
5.2.21 Factors identified from the patient’s family or patient: Delay in seeking
help
The outcome from the results in figure 4.10 indicate that in 2.5 % (n=4) of the cases the
patient’s family delayed in going to the health care facility to seek help but in the remaining
cases 97.5% (n=158) the family sought help in time. However, irrespective of the help
needed by the mother or family, the outcome was perinatal mortality. Although the
majority of the records indicated that the patient or family came to seek help, the same
babies died in the same health care facility.
The results of the study conducted by Pacagnella, Cecatti, Parpinelli, Sousa, Haddad,
Costa, Sousa and Pattison (2014:947) in Brazil about delays in receiving obstetric care
and poor maternal outcomes reveal different results to this study’s findings. More than
half (53.8%) of the neonatal deaths were related to different kinds of delays, such as the
user-related factors which include kinds of behaviour, and knowledge of, and attitudes
toward the use of the health system. The accessibility of facilities, transportation,
distribution of services, medical supplies, equipment and general costs also play a vital
role in reducing perinatal mortality.
5.2.22 Declined treatment by the family or patient
The results consolidated from table 4.12 show that 98.8% (n=160) of the patients or
families accepted hospital treatment at the entrance of the health care facility, only one
0.6% refused health care facility treatment and another one (0.6%) was recorded as
missing. These results indicate that mothers agreed to their babies being treated by the
health care facility.
The results of the study conducted in Boston by Deshpande & Oxford (2012:144) on the
management of pregnant patients who refuse medically indicated caesarean section
delivery concurred with this study. It concludes that there is a fine balance between the
ethical principles that are to be applied in patient care when pregnant mothers are
involved. In order to address the dilemma that may arise between mother and foetus, one
must understand the historic and social context of a pregnant woman’s refusal of a
medically indicated caesarean delivery.

95
Obstetricians and advanced midwives should work with empathy to encourage a
pregnant woman to accept a caesarean birth if the risk of morbidity or mortality to the
foetus is high.
5.2.23 Other factors contributing to increasing perinatal mortality according to
patient or family
The results in figure 4.11 show that in nearly three quarter 72.8% (n=118) of the cases
other factors contributed to the increased perinatal mortality of the babies according to
the patient or family. More than one-quarter 26.5% (n=43) indicated no association of the
mortality with any other factor. Only one record was reported as missing. The other
factors, namely, previous miscarriage, Rhesus negative, advanced age, multi parity; low
haemoglobin, and previous Caesarean section predisposed the baby to mortality.
Maternal care from the day of conception until the day of delivery should be of great
importance.
These factors should be treated according to their severity. If the mother needs to be
referred to the next level of care immediately then referral should be arranged. Based on
these results, it would appear that the antenatal care history-taking is not comprehensive
in the health care facility and referral institutions. Maternal risk factors should be identified
and if the mother is not classified under basic antenatal care she should be referred to
the next level of care according to maternity guidelines.
According to Andargie, Berhane, Worku and Kebede (2013:168), in the developing
countries there are a number of risk factors associated with pre-term births, such as poor
socio-economic status, very young maternal age, poor diet, cigarette-smoking and
infections. Birth intervals of less than two years was also associated with increased
perinatal mortality. Chronic conditions like maternal hypertension and diabetes mellitus
increase the risk of stillbirths. Obstetric complications, such as multiple pregnancy and
prolonged labour increase the perinatal mortality if the woman has not been managed
properly. The results of the aforementioned study show that the data on other contributory
factors related to the patient or family are similar to the results of current study. Both
studies indicate that there are other factors contributing to the increase in the perinatal
mortality rate.
96
5.2.24 Logistics: Delay of emergency medical service
The results in table 4.13 show that in most 98.8% (n=160) of the cases there were no
delays by the emergency medical services (EMS). Generally, according to these results
the emergency services do not delay the patient during referral.
The results of the study conducted by Indongo (2014:470) in Namibia about risk factors
and causes of neonatal deaths coincide with this study’s results in that only 0.5% of the
mothers of the babies who died experienced a delay due to transport or financial barriers
5.2.25 Logistics: Accessibility or availability of transport
The results in figure 4.12 show that 98.8% (n=160) of the mothers did not experience a
shortage of transport and that it was either private or emergency medical services. Private
transportation of patients to the facility reduces the turnaround time for the EMS. In
reducing the turnaround time to the health facility the EMS could decrease perinatal
mortality.
The study conducted in Brazil by Pacagnella, Cecatti, Parpinelli, Sousa, Haddad, Sousa
and Pattison (2014:947) on delays in receiving obstetric care and poor maternal
outcomes revealed different results to this study. More than half (53.8%) of the neonatal
deaths were related to classifications of different delays, such as user-related factors
which include behaviour, knowledge and attitudes about the use of the health system.
The accessibility, transportation, distribution of services, medical supplies, equipment
and general costs were also identified as factors.
5.2.26 Logistics: Other factors that contribute to increased perinatal mortality
Logistical contributory factors cannot be regarded as contributing to perinatal mortality
because it only contributed to 2.5% (n=4) of the total of mortality cases.

97
5.2.27 Facilities: Lack of services after hours
The outcomes of the results in figure 4.13 reveal that most 99.4% (n=161) of the patients
received 24- hour services from the facility of referral (clinics and community health
centres) and the referring facility. The records further indicated that the referring facility
was also rendering 24-hour services. The report of the National perinatal morbidity and
mortality committee (NapeMMCo) concurs with this study by indicating that the 22
community centres that were being studied were providing 24-hour services (Department
of Health 2013b:12).
5.2.28 Facilities: Lack of equipment
The results in table 4.15 show that most 99.4% (n=161) of the facilities have equipment
and consumables, including intravenous infusion lines and medication. Only one (0.6%)
indicated that they have experienced a lack of equipment. The ‘Saving mothers’ report
indicates that a lack of equipment does not contribute to perinatal mortality (Department
of Health 2013b:27).
5.2.29 Facilities: Other factors contributing to increased mortality rate
In figure 4.14, the results indicate that in 98.2% (n=159) of the cases other factors related
to facilities did not contribute to increased perinatal mortality. No other factors contributed
to perinatal mortality in the facilities.
5.2.30 Health personnel problems: Poor labour monitoring
The results in table 4.16 show a total of 28.4% (n=46) agreed that the health personnel
problems at the facility are related to poor labour monitoring as the contributory factor.
However, 71.0% (n=115) indicated that poor labour monitoring by health personnel was
not a problem. This study concurs with the ’Saving mothers’ report which indicates that
delays in seeking medical attention during labour account for 10% of the total perinatal
mortality rate ( Department of Health 2013b:24).
98
5.2.31 Health personnel problems: Lack of education about transport
The results of the study in figure 4.15 shows that in 98.2% (n=159) of the cases health
personnel were educated about the transport arrangements, two (1.2%) records
indicated that they were not educated about the transport arrangements and in one
(0.6%) case health personnel were not sure whether the transport was a contributing
factor to increased perinatal mortality. From the records it appears that the majority of the
mothers were educated about the importance of the transport.
The results of the study conducted by Indongo (2014:470) in Namibia about risk factors
and causes of neonatal deaths coincide with this study’s results in that only 0.5% of the
mothers of the babies who died experienced a delay due to transport or financial barriers.
5.2.32 Health personnel problems: Delays in taking appropriate action to
reduce perinatal mortality
Table 4.17 indicates that in 84.0% (n=136) of the cases no delay in taking appropriate
action to reduce perinatal mortality by health personnel was experienced. The results of
the study conducted in India by Upadhyay, Rai and Krishnan (2013:101) on the three
delays model to understand the social factors responsible for neonatal deaths in rural
Haryana agree with the current study in determining that out of 50 new-born deaths 44%
(n=22) was as a result of the care worker delaying in deciding to seek care. This includes
transport problems and delays in referring the babies to the next level of care as the
health care worker had the perception that the babies would never get any help.
5.2.33 Health personnel problems: Other factors contributing to increased
perinatal mortality rate
Figure 4.16 shows that in 75.3% (n=122) of the cases other factors related to health
personnel problems contribute to perinatal mortality. Only 24.1% (n=39) of the records
indicated that there are no other factors related to health personnel problems that
contribute to increased perinatal mortality.
99
The ‘Saving babies’ report, 2010-2011 (Department of Health 2013b: 16) supports the
results of this study by identifying worker-related problems in 44% of the cases in which
babies died. The following five factors were identified: foetal distress was monitored but
not detected, foetal distress was not monitored, no intervention was taken in a prolonged
second stage of labour, delays in referring the patient and delays in calling in expert
assistance.
5.2.34 Health or, and illness of the neonate: Prematurity
The results in table 4.18 reveal that prematurity is a risk factor which accounts for 37.0%
(n=60) of the total of babies admitted in the neonatal unit, 63.0% (n=102) of the records
did not note any sign of prematurity throughout the admission of the mother or the baby.
Prematurity remains one of the contributory factors in the perinatal mortality rate.
The results of the study conducted by Iyoke, Lawani, Ezugu, Ilechukwu, Nkwo, Mba and
Asinobi (2014: 884) regarding the prevalence and perinatal mortality associated with pre-
term birth in a tertiary medical centre in the South East of Nigeria concurs with this study’s
findings by suggesting that overall spontaneous pre-term births occurred in approximately
41% of the total births.
5.2.35 Health or, and illness of the neonate: Pneumonia
The results in figure 4.17 indicate that not one 100% (n=162) of the babies experienced
a pneumonic attack. The results indicate that none of the babies experienced pneumonia
as an illness during their stay in the facility. Pneumonia did not contribute to the perinatal
mortality rate in this study.
The study results reported by Ntuli, Malangu and Alberts (2013:96) and Ntuli and
Malangu (2012:142) on the causes of deaths in children under five at a tertiary hospital
in Limpopo differ from the results of this study in concluding that 31.8% of the cases were
caused by pneumonia and regarded it as the prevalent cause of the mortality rate.
100
5.2.36 Health or, and illness of the neonate: Birth asphyxia.
The results in table 4.19 show that birth asphyxia is not a contributory factor of perinatal
mortality. Almost none 99.4% (n=161) of the records indicated birth asphyxia as a
contributory factor. The results of the study conducted by Ersdal, Mduma, Svensen and
Perlman (2012:1228) in a Tanzanian rural hospital on birth asphyxia as a major cause of
perinatal mortality differs from this study as the results indicate that 61% of the infants
died due birth asphyxia.
5.2.37 Health or, and illness of the neonate: Other factors contributing to
increased perinatal mortality
The results in figure 4.18 indicate that in more than half 56.8%; (n=92) of the records,
other factors related to the state of health or illness of the neonate contribute to perinatal
mortality. These factors include congenital anomalies, pyrexia (elevated temperature),
intra-uterine growth retardation (IUGR), intra-uterine foetal death (IUFD), baby cord
prolapse, and maternal infections. Furthermore, 43.2% (n=70) of the records indicate that
no other factors contribute to perinatal mortality. The results of the study conducted by
Bayou and Berhan (2012:154) in Ethiopia regarding perinatal mortality and associated
risk factors is in agreement with the results of this study by indicating that malpresentation
also contributes to perinatal mortality.
5.3 RECOMMENDATIONS
5.3.1 Education
In view of the abovementioned findings, the following recommendations are put forward
to bring about a decrease in the mortality rates among perinatal infants:
Educate health care providers on:
Strengthening scientific services of all health care workers in maternity and
neonatal units on an uninterrupted basis;
In-service midwives and accouchers working maternity units and neonatal units
on resuscitation of the new-born.

101
Teaching and training health care providers on the importance of record-
keeping.
Educate patients
about late booking or inadequate antenatal care;
to avoid delays in seeking help during labour and
to recognise danger signs in pregnancy and symptoms of labour.
5.3.2 Clinical practice
Emphasise the importance of records audit develop quality improvement plans.
Implement national, provincial, district and health care facility policies, protocols
and procedures to reduce perinatal mortality.
Strengthen health services packages available on neonatal and maternal health
care services.
5.3.3 Management
Establish point of reference (benchmarking) from other countries on good methods
to reduce perinatal morbidity and mortality rates.
Reviewing of maternity procedures and strategies endlessly on quality perinatal
and maternal health care.
Implement quality improvement plan on perinatal and maternal health care
services.
5.3.4 Future research
Determine the barriers that hinder health care workers in record keeping during
maternal and perinatal health care services
Evaluate the knowledge and attitudes of health care workers on maternal and
neonatal care.
Assess the application of maternal and neonatal health care services by the public.
102
Assess the readiness accessibility and availability of human and material
resources in maternal and neonatal health care services.
Evaluate the National Health Insurance (NHI) impact on mother and child health
services.
5.4 LIMITATIONS OF THE STUDY
The study was conducted in one regional facility and the results of the study cannot be
generalised to the whole of the Limpopo province. Some records contained loose sheets
of paper and, therefore, information could have been lost. Data collection was time-
consuming as the researcher had to peruse each file to get information.The challenge of
this process of sampling and data collection was that information in some of the records
in the record section was missing.
5.5 CONCLUDING REMARKS
High perinatal mortality rates are still a major problem in other countries worldwide,
including Sub-Saharan regions of Africa. These high rates contribute to the burden of
disease in all countries. Maternal health and perinatal care play an important role in
reducing perinatal mortality. The challenge is for the health care providers to plan on how
to foster community participation and involvement to reach the stakeholders so that
perinatal care and mortality can be reduced.

103
LIST OF SOURCES
Adeboye, MAN, Ojuawo, A, Ernest SK, Fadeyi, A & Salisu, OT. 2010. Mortality pattern
within twenty-four hours of emergency paediatric admission in a resource-poor
nation health facility. West African Journal of Medicine 29(4): 249-252.
Ajaari,J, Masanja,H, Weiner,R, Abokyi, SA & Owusu-Agyeic, S. 2012: Impact of place
delivery on neonatal mortality in rural Tanzania. International Journal of MCH and
AIDS 1(1):49-55.
Ali, SR, Ahmed, S & Lohana, H.2013. Disease pattern and outcomes of neonatal
admissions at a secondary care hospital in Pakistan. Sultan Qaboos University
Medical Journal 1(13): 424-428.
Aluvaala, J, Nyamai, R, Were, F, Wasunna, A, Kosgei, R, Karumbi, J, Gathara, D &
English, M .2015. Assessment of neonatal care in clinical training facilities in Kenya.
Archive of Diseases in Childhood 100(1):42-47.
Andargie, G, Berhane, Y, Worku, A & Kebede, Y. 2013. Predictors of perinatal mortality
in rural population of Northwest Ethiopia: a prospective longitudinal study. BMC
Public Health 2013 13(1):168.
Aranda, N, Ribot, B Garcia, E, Viteri, E & Arija, V. 2011. Pre-pregnancy iron reserves,
iron supplementation during pregnancy and birth weight. Early Human Development
87(12):791-797.
Bari, MI, Ulla, MA & Khatun, M. 2008. Morbidity and mortality of low birth weight baby.
The Journal of Teachers Association 21(1): 35-39.
Bayou, G & Berhan, Y. 2012. Perinatal mortality and associated risk factors: A Case
Control Study. Ethiopian Journal of Health Science 22(3):153-162.

104
Beauclair, R, Petro G & Meyer, K. 2014: The association between timing of initiation of
antenatal care and stillbirths: a retrospective cohort study of pregnant women in
Cape Town, South Africa 14(204):1-10.
Beck, S, Woljdyal, D, Say, L, Betran, AP, Meraldi M, Requejo, JH, Rubens, C, Menon, R
& Van Look, PFA. 2010. The worldwide incidence of pre-term: a systematic review
of maternal mortality and morbidity. Bulletin World Health Organization 88: 31-38
Birth and Death Registration Act 51 of 1992. General Law Third Amendment act 129 of
1993: Gazette no14995, (accessed 23 July 1993).
Botma, Y, Greef, M, Mulaudzi, FM & Wright, SCD. 2010. Research in Health Science.
Cape Town: Heineman.
Brink, H, Van der Walt, C & Van Rensburg, G. 2012. Fundamentals of research
methodology for professionals. 2nd edition. Cape Town: Juta.
Bucens, IK, Reid, A, Barreto, AC, Dwivedi, V & Counahan, M. 2013. Three years of
neonatal morbidity and mortality at the national hospital in Dili, East Timor. Journal
of Paediatrics and Child Health 49(12): 452-457.
Burns, N & Grove.SK. 2011. Understanding nursing research: building evidence –based
practice. 5thedition.St Louis: Elsevier/Saunders.
Department of Health. 2010. Clinical guideline: Prevention of mother to child. Pretoria:
Government Printers.
Department of Health. 2011. National Perinatal Morbidity and Mortality Committee report,
2008-2010. Pretoria: Government Printers.
Department of Health. 2012. National contraception and fertility planning policy. Pretoria:
Government Printers.

105
Department of Health. 2013a. Millennium development goals: country report. Pretoria:
Government Printers.
Department of Health. 2013b. Saving babies report on perinatal care in South Africa:
2011-2013. Pretoria: Government Printers.
Department of Health. 2014. 2nd Triennial report of the Committee on Morbidity and
Mortality in children under 5 years. Pretoria: Government Printers.
Department of Health. 2015a. District Health plan barometer 2014/15. Pretoria:
Government Printers.
Department of Health. 2015b. Guidelines for maternity care in South Africa: A manual for
clinics, community centres and district hospitals. Pretoria: Government Printers.
Department of Health. 2015c. Millennium development goals: Country report. Pretoria:
Government Printers.
Department of Health. 2015d. National Perinatal Morbidity and Mortality Committee
report. 2011-2013. Pretoria: Government Printer.
Deshpande, NA, & Oxford, CM. 2012. Management of pregnant patients who refuse
medically indicated Caesarean delivery. Reviews in Obstetrics and Gynaecology 5
(34): 144–150.
De Vos, AS, Strydom, H, Fouché, CB & Delport, CSL. 2011. Research at grassroots for
the social sciences and human service professions. 4th edition. Pretoria: Van
Schaik.
Dizikes, P. 2014. How the heath care plan quickly lowered infant mortality. American
Economic Journal 1(1). 1-3.
Eichenwald, EC. 2013. Predictors of mortality and morbidity in extremely low birth weight
neonates. Indian Paediatrics 50(12): 1088.

106
Ersdal, HL, Mduma, E, Svensen, E, & Perlman J. 2012. Birth asphyxia: a major cause of
early neonatal mortality in Tanzania Rural Hospital. American Academy of
Paediatrics 129(5): 1228-1243.
Ezechi, OC & David, AN. 2012. Overview of global perinatal mortality. From:
http://www.intechopen.com/books/perinatal-mortality/overview-of-global-perinatal-
mortality (accessed 28 October 2014).
Forrester, R.2014.Increase the chances to carry full term. Loving and Living 1(1):1-7.
Fraser, DM & Cooper, MA .2012. Survival guide to midwifery. 2nd edition. Churchill
Livingstone: Elsevier.
Fulton, C. 2013. Improving neonatal mortality in an Ethiopian referral hospital. BMJ Open
Quality 2(2): 1-3.
Grove, SK, Gray, JR & Burns, N. 2015.Understanding nursing research: building
evidence –based practice. 6thedition.St Louis Saunders: Elsevier
Guerrier, G, Oluyide, B, Keramarou, M & Grais, R. 2013. High maternal and neonatal
mortality rates in northern Nigeria: an observational study. International Journal for
Women’s Health 5(1): 495-499.
Indongo, N. 2014. The risk factors and causes of neonatal deaths in Namibia. European
Scientific Journal Special edition 10(10): 466-471.
Jammeh, A, Sundby, J & Vangen, S. 2011. Barriers to emergency obstetric care services
in perinatal deaths in rural Gambia: a qualitative in-depth Interview study. ISRN
Obstetrics and Gynaecology 2011(1): 1-10.
Joubert, G & Ehrlich, MR. 2010. Epidemiology. A research manual for South Africa. 2nd
edition. Cape Town: Oxford University Press

107
Khan, AA, Zahidie, A & Rabbani, F .2013. Interventions to reduce neonatal mortality from
neonatal tetanus in low and middle income countries: a systemic review. Bio Med
Central Public Health 13: 1-7.
Khatun, F, Rasheed, S, Moran, AC, Alam, AM, Shomik, S, Sultana, M, Choudhury, N,
Iqbal, M & Bhuiya, A. 2012. Causes of neonatal and maternal deaths in Dhaka
slums: Implications for service delivery. Biomed Central Public Health 12(84): 1-9.
Knight, HE, Self, A & Kennedy, SH. 2013. Why are women dying when they reach
hospital on time? a systematic review of the “third delay” .Maternal Journal 8(5): 1-
8.
Lee, CC, Cousens, S, Darmstadt, GL, Blencowe, H, Pattison, R, Moran, NF, Hofmeyr,
Haws, RA, Bhutta, SZ & Lawn, JE. 2011. Care during labour and birth for the
prevention of intra-partum-related neonatal deaths: a systematic review and Delphi
estimation of mortality effect. From: htttp//www.biomedical.com/1471-
2459/11/S3/S10 (accessed 13 April 2011).
Li, W, Zhang, H, Ling, Y & Jin, S. 2011. Effect of prolonged second stage of labour on
maternal and neonatal outcomes. Asian Pacific Journal of Tropical Medicine 4(5):
409-411.
LoBiondo-Wood, G & Haber, J. 2010. Nursing research methods and critical appraisal
for evidence-based practice. 7th edition. St Louis: Mosby Elsevier.
Lloyd, LG, 2013. Neonatal mortality in South Africa: how are we doing and can we do
better? South African Medical Journal 103 (8): 518-519.

108
Marchant, T, Willey, B, Katz, J, Clarke,S, Kariuki, S, Kuile, FT ,Lusingu, J,
Ndyomugyeni,R, Schmiegelow, C, Watson-Jones, D & Schellenberg, JA. 2012. The
neonatal risk associated with pre-term birth in East Africa, adjusted by weight for
gestational age: individual participant level meta-analysis. Plos Medicine 9(8): 1-13.
Martinez, MC, Aguilar, RR, Aguilar, AC, Lucena, PC, Vinuesa, CP & Extremera, AR.
2013. Analysis of perinatal mortality in new-born infants with a birth weight of less
than 1000 grams in hospital San Cecilio in Granada. Espana. Arch Argent
Paediatric Journal, 111(1): 45-52.
Mmbaga, BT, Lie, RT, Kibiki, GS, Olomi, R, Kvale, G & Datveit, G. 2011. Transfer of new-
borns to neonatal care unit: a registry-based study in Northern Tanzania. Bio Med
central (BMC) Pregnancy and childbirth: 11(68): 1-13.
Mohangoo, AD, Blondel, B, Gissler, M, Velebil, P, Macfarlane, A & Zeitlin, J 2013:
International Comparisons of Foetal perinatal Mortality Rates in High Income
Countries: should exclusion threshold be based on birth weight or gestational age?
(Euro-peristat Scientific Committee). PLOS ONE 8(5): 1-7.
Mothiba, TM, Maputle, MS and Tladi, FM 2013: Causes of maternal deaths in a tertiary
hospital in Limpopo Province: professional‘s perspective. Maternal Journal 1(1):
138-146.
Moura, PMRSS, Maesta, I, Rugolo, LMSS, Angluski, LFRB, Calderia, AP, Peracoli, JC &
Rudge, MVC.2014. Risk factors for perinatal death in two different levels of care: a
case control study. Bio Med Central Reproductive Health 11(11): 1-7.
Moura, H, Costa, V, Rodrigues, M, Almeida, F, Maia, T & Guimaraes, H. 2011. End of life
in the neonatal intensive care unit. Clinics 66(9): 1569-1572.
Narayan, R. 2012. A study of the pattern of admission and outcome in neonatal intensive
care unit at high altitude. Sri Lanka Journal of Child Health 41 (2): 79-81.
109
National Department. 2014a. Midyear population estimates. From:
http://www.statssa.gov.za/publication 2/advancecalender (accessed 16 April 2014).
National Department. 2014b. Perinatal deaths in South Africa 2011-2013. From:
http://www.statssa.gov.za/publications 2/advance calendar (accessed 16 April
2014).
Nkwabong, E, Fomulu, JN, Hamida, A, Onana, A, Tjek, PT, Kounam, L & Ngassa, P.
2011. The risk of adverse maternal and Neonatal outcomes in Cameroonian
primiparous women aged more than 26. Clinic in Mother and Child Health 8(1). 1-
4.
Nsibande, D, Doherty, T, Ijumba, P, Tomlinson, M, Jackson, D, Sanders, D & Lawn, D.
2013. Assessment of uptake of neonatal and young infant referrals by community
health care workers. To public health care facilities in an urban informal settlement,
KwaZulu-Natal, South Africa. BMC Health Services Research: 13(47). 1-8.
Ntuli, ST, Malangu, N & Alberts, M. 2013. Causes of deaths in children under five at a
tertiary hospital in Limpopo Province of South Africa. Global Journal of Health
Science 5(3): 95-100.
Ntuli, ST, & Malangu, N. 2012. An investigation of the stillbirths at a tertiary hospital in
Limpopo Province of South Africa. Global Journal of South Africa 4(6). 141-147.
Onwudiegwu, U & Awowole, I. 2012: Current trends in perinatal Mortality in developing
countries: Nigeria as a case study. From:
https://www.intechopen.com/books/perinatal-mortality (accessed 13 June 2012).
Oti, S & Odimegwu, C. 2011. Perinatal mortality in Nigeria: Do place of delivery and
delivery assistants matter? The Open Demography Journal 4: 1-10.
Owais, A, Syed,A, Farugue, G, Das, S, K, Ahmed, S, Rahman, S & Stein, AD.2013.
Maternal and antenatal risk factors for stillbirth and perinatal mortality in rural
Bangladesh: a case control study. PLoS ONE 8(11): 1-8.
110
Oxford English Dictionary. 2010. 3rd edition. England: Oxford University Press.
Oxford Advanced Learner’s Dictionary. 2015.9th edition. England: Oxford University
Press.
Pacagnella, RC, Cecatti, JG, Parpinelli, MA, Haddad, SM, Costa, ML, Sousa, JP &
Pattison, RC. 2014. The Brazilian Network for Surveillance of Severe Maternal
Morbidity Study Group. BMC Pregnancy and Childbirth 14: 947-953
Paull, C & Robson, S. 2013. After stillbirth, what next. Stillbirth and perinatal death.
Summer 15(4): 57-59.
Pilliod, RA, Cheng, YW, Jonathan, M, Smowenden, JM, Amy E, Doss, MD, Aaron B &
Causey, MD. 2012. The risk of intrauterine foetal death in the small for gestational
age foetus. American Journal of Obstetrics and Gynaecology 207(4): 1-6
Polit, DF & Beck, CT.2012. Nursing research: generating and assessing evidence for
nursing practice. 9th edition. Philadelphia: Lippincott, Williams and Wilkins.
Rajab, AM & Ghareba, AM. 2013. Neonatal mortality rate in the Special Care Unit. The
Journal of Medical Science and Clinical Research 1(5): 195-208.
Rhoda, NR, Greenfield, D, Muller, M, Prinsloo, R, Pattison, RC, Kauchali, S & Kerber K.
2014. Experience with perinatal death reviews in South Africa- Perinatal problem
identification programme 121(4): 160-166.
Saugstad, OD. 2011. Reducing perinatal mortality is possible. Neonatology 99:250-257.
Solarin, I & Black, V. 2013 “They told me to come back “: Women‘s antenatal care booking
experience in inner city-Johannesburg. Maternal Journal, 17: 359-367.

111
Ugwu, GIM. 2012. Pattern of morbidity and mortality in the new special care unit in a
tertiary institution in the Niger Delta region of Nigeria: a two year prospective study.
Global Advanced Research Journals of medicine and medical sciences 1(6): 133-
138.
United Nations.2015. Indicators and a monitoring framework for sustainable development
goals: launching a data revolution. From https://unsdsn.org/indicators. (accessed
12 June 2015).
Upadhyay, RP, Rai, SK & Krishnan, A. 2013. Using three delays model to understand the
social factors responsible for neonatal death in rural Haryana, India. Journal of
Tropical Pediatrics 59(2): 100-105.
Velaphi, S & Rhoda, N. 2012. Reducing neonatal deaths in South Africa: are we there
yet, and what can be done? South Africa Journal of Child Health 6(3): 66-71.
Wilmshurst, JM, Badoe, E, Wammanda, RD, Mallewa, M, Kakooza-Mwesige, A, Venter
A, & Newton, CR. 2011. Child Neurology Services in Africa. Journal of Child
Neurology 26(12): 1555-1563.
Wood, MJ & Ross-Kerr, JC. 2011. Basic steps in planning nursing research: from
question to proposal. 7thedition.Canada: Jones and Bartlett publishing.
World Health Organization. 2010. Child information South Africa. From:
http://www.unicef.org/en(UNICEF) (accessed 20 November 2012).
World Health Organization. 2012. Global Health Observatory. Geneva. From:
http://www.who.org (accessed 20 November 2013).
World Health Organization. 2014. Antenatal care. From:
www.who.int/pmch,media/publications/aonsection III (accessed 30 March 2014).
112
World Health Organization.2014. Principles and considerations for adding a vaccine to a
national immunization programme. From http://.who.int/immunization/documents
(accessed 30 April 2014).
Yego, F, DÉste, D, Byles, J, Nyongesa, P & Williams, JS. 2014. A case control study of
risk factors for foetal and neonatal death in a tertiary hospital in Kenya. BMC
Pregnancy and Child Birth 14 (38): 1-9.
Zaid, AKM, Ganatra, HA, Syed, S, Cousens, S, Lee, ACC, Black, R, Bhutta, ZA, & Lawn,
JE. 2011:2. Effect of case management on neonatal mortality due to sepsis and
pneumonia. BMC Public Health 11(3): 1-15.

113
ANNEXURES
Annexure 1: Ethical Clearance from Health Studies Degree Committee (UNISA)

114
Annexure 2: Letter seeking permission to conduct the study at Sekhukhune
district health care facility: Limpopo province
P.O BOX 1115
APEL
0739
14/09/2016
Limpopo Province (HOD)
The Department of Health
POLOKWANE
0700
SIR/MADAM
REQUEST TO CONDUCT STUDY
I am Maesela Phogole Crawford a research student pursuing Master of Public Health
at the University of South Africa (UNISA) and currently employed by Department of
Health at Tshwane District office as Quality assurance coordinator. My student
number is 44439121.
I hereby request to conduct a study in Limpopo Province specifically in Sekhukhune
District. The title of my study is FACTORS CONTRIBUTING TO INCREASED
PERINATAL RATE IN LIMPOPO PROVINCE and the purpose is to identify and
describe the factors that increase perinatal mortality rate in Limpopo Province,
Sekhukhune District Health services. Based on the results the recommendations to
reduce the mortalities will be based on personal/family/patient contribution, logistics,
facilities or/and health personnel problems

115
Annexure 3: Approval letter from the Department of Health, Limpopo Province
(HOD)

116
Annexure 4: Letter seeking permission to conduct the study at Sekhukhune
district health care facility: Sekhukhune district office
P.O BOX 1115
APEL
0739
16/11/2016
District executive Manager
The Department of Health
Chuenespoort
0745
SIR/MADAM
REQUEST TO CONDUCT STUDY
I am Maesela Phogole Crawford a research student pursuing Master of Public Health
at the University of South Africa (UNISA). My student number is 44439121.
I hereby request to conduct a study in Limpopo Province specifically in Sekhukhune
District. The title of my study is FACTORS CONTRIBUTING TO INCREASED
PERINATAL AND MATERNAL MORTALITY RATE IN LIMPOPO PROVINCE and the
purpose is to identify and describe the factors that increase Perinatal and Maternal
Mortality rate in Limpopo Province, Sekhukhune District Health services. Based on
the results the recommendations to reduce the mortalities will be based on
personal/family/patient contribution, logistics, facilities or/and health personnel
problems.
Kindly refer to an Ethical Clearance certificate from UNISA as attached.

117
Annexure 5: Approval letter from the Department of Health, Sekhukhune District
(DEM)

118
Annexure 6: Letter seeking permission to conduct the study at Sekhukhune
district health care facility (CEO).
P.O BOX 1115
APEL
0739
16/11/2016
CHIEF EXECUTIVE OFFICER
The Department of Health
JANE FURSE
SIR/MADAM
REQUEST TO CONDUCT STUDY
I am Maesela Phogole Crawford a research student pursuing Master of Public Health
at the University of South Africa (UNISA). My student number is 44439121.
I hereby request to conduct a study in Limpopo Province specifically in Sekhukhune
District. The title of my study is FACTORS CONTRIBUTING TO INCREASED
PERINATAL AND MATERNAL MORTALITY RATE IN LIMPOPO PROVINCE and the
purpose is to identify and describe the factors that increase Perinatal and Maternal
Mortality rate in Limpopo Province, Sekhukhune District Health services. Based on
the results the recommendations to reduce the mortalities will be based on
personal/family/patient contribution, logistics, facilities or/and health personnel
problems.
Kindly refer to an Ethical Clearance certificate from UNISA as attached.

119
Annexure 7: Approval Letter from the Department of Health, the management of
the health care facility (CEO).

120
Annexure 8: Letter seeking permission to conduct the study at Sekhukhune
district health care facility: Limpopo province
P.O BOX 1115
APEL
0739
14/09/2016
Neonatal unit operational Manager
The Department of Health
POLOKWANE
0700
SIR/MADAM
REQUEST TO CONDUCT STUDY
I am Maesela Phogole Crawford a research student pursuing Master of Public Health
at the University of South Africa (UNISA) and currently employed by Department of
Health at Tshwane District office as Quality assurance coordinator. My student
number is 44439121.
I hereby request to conduct a study in Limpopo Province specifically in Sekhukhune
District. The title of my study is FACTORS CONTRIBUTING TO INCREASED
PERINATAL RATE IN LIMPOPO PROVINCE and the purpose is to identify and
describe the factors that increase perinatal mortality rate in Limpopo Province,
Sekhukhune District Health services. Based on the results the recommendations to
reduce the mortalities will be based on personal/family/patient contribution, logistics,
facilities or/and health personnel problems

121
Annexure 9: Approval letter from Department of Health, neonatal unit of the
health care facility: (Unit manager).

122
Annexure 10
Checklist
PLEASE NOTE THE MEANING OF THE FOLLOWING CODES:
66- UNKNOWN
77 - SELECTED MORE THAN ONE ANSWER88 - NOT AVAILABLE99 - MISSING
DATA/ INFORMATION
SECTION A
1.1 What was the Outcomes of delivery?
(1) Stillbirth (2) Neonatal
death
(3) 77 (4) 88 (5) 99
1.2 What was the baby’s Birth weight (in grams)?
1.3 Apgar score in 1st minute and 5 minutes
SECTION B
2.1 What was the Age on admission?
Age Answer
(1) Less than 6 hours
(2) 6-12 hours
(3) 1day to seven days
(4) More than seven days
(77)

123
(88)
(99)
2.2 What was the Reason for admission?
Reason for admission Answer
(1) birth asphyxia
(2) Prematurity
(3) Neonatal infections
(4) Other : Specify
(77)
(88)
(99)
2.3 What were the problems during the admission process?
Problems on admission Answer
(1) Signs of respiratory distress, Tachypnea, recession, grunting,
cyanosis or nasal flaring
(2) Sign of shock: bleeding, pallor
(3) hypoglycaemia
(4) Convulsions
(5) sign of infection, jaundice, hypothermia, vomiting and distended
abdomen
(6) Other: Specify
(77)
(88)
(99)

124
2.4 Appropriate immediate management of problems
Appropriate immediate Management Answer
(1) Referred
(2) Not referred
(3) Not recorded
(4) if not done : state the reason
(77)
(88)
(99)
2.5 Was there any further assessment conducted to identify perinatal risks?
Assessment done Answer
(1) Yes
(2) No
(3) Not recorded
(77)
(88)
(99)
2.6 Maternal risk factors
Maternal risk factors Answer
(1) Maternal infections
(2) Hypertensive disorder
(3) Gestational diabetes
(4) Assisted delivery
(5) other: specify
(77)
(88)
(99)

125
2.7 Were there any perinatal risks?
2.7.1 If yes, please specify
Perinatal risks Answer
(1) yes
(2) No
(3) Not recorded
(77)
(88)
(99)
2.8 Please indicate the perinatal risk factors involved
2.8.1 If yes, please specify
Perinatal risk factors Answer
(1) Meconium stained liquor
(2) Small for gestational age
(3) Pre-term
(4) Large for gestational age
(5) Post-term
(6) Other: Specify
(77)
(88)
(99)

126
2.9 What was the estimated gestational age?
Gestational age Answer
(1) Pre-term
(2) Term
(3) Post-term
(4) Term
(77)
(88)
(99)
SECTION C
3.1 Classification of neonate according to weight for gestational age
Classification Answer
(1) Small for gestational age
(2) Average for gestational age
(3) Large for gestational age
(4) Normal for gestational age
(77)
(88)
(99)
3.2 Was the Plan of care available?
Plan of care available Answer
(1) Yes
(2) No
(3) Not recorded
(77)
(88)
(99)

127
3.3 Was the process Resuscitation conducted?
Resuscitation done Answer
(1) Yes
(2) No
(3) Not done
(4) Not recorded
(77)
(88)
(99)
3.4.1 If No, please state the reason
3.5 Gestational (weeks) or during delivery
Gestational week at delivery Answer
(1) 28-32 weeks
(2) 33-36 weeks
(3) 37-40 weeks
(4) 41 week and more
(66) unknown
(77)
(88)
(99)

128
3.6 How many days after giving birth? (Days since delivery.)
Days since delivery Answer
(1) One day to Seven days
(2) Eight to fourteen days
(3) fifteen to thirty days
(4) Thirty one to forty two days
(66) unknown
(77)
(88)
(99)
3.7 Which interventions were taken? (Tick in appropriate box)
Interventions Answer
(1) Non medications (Non
pharmacological intervention).
(2) Medication or Pharmacological
intervention.
(3) Surgical intervention. E.g
Caesarean section
(4) Blood transfusion
(5) Other
(77)
(88)
(99)

129
3.7.1 If other, specify
3.8 Was the death of the baby avoidable according to patient safety incident
committee recommendation?
Recommendations by PSI committee Answer
(1) Yes
(2) No
(3) No recommendations
(77)
(88)
(99)
3.9 Health care system Yes No Not
sure
77 88 99
3.9.1 Family or patient: Delay in a
seeking help]
3.9.2 Family or patient: Declined
treatment by the mother]
3.9.3 Family or patient: Other
contributory factors increasing perinatal
mortality]
3.9.3.1 If other, specify
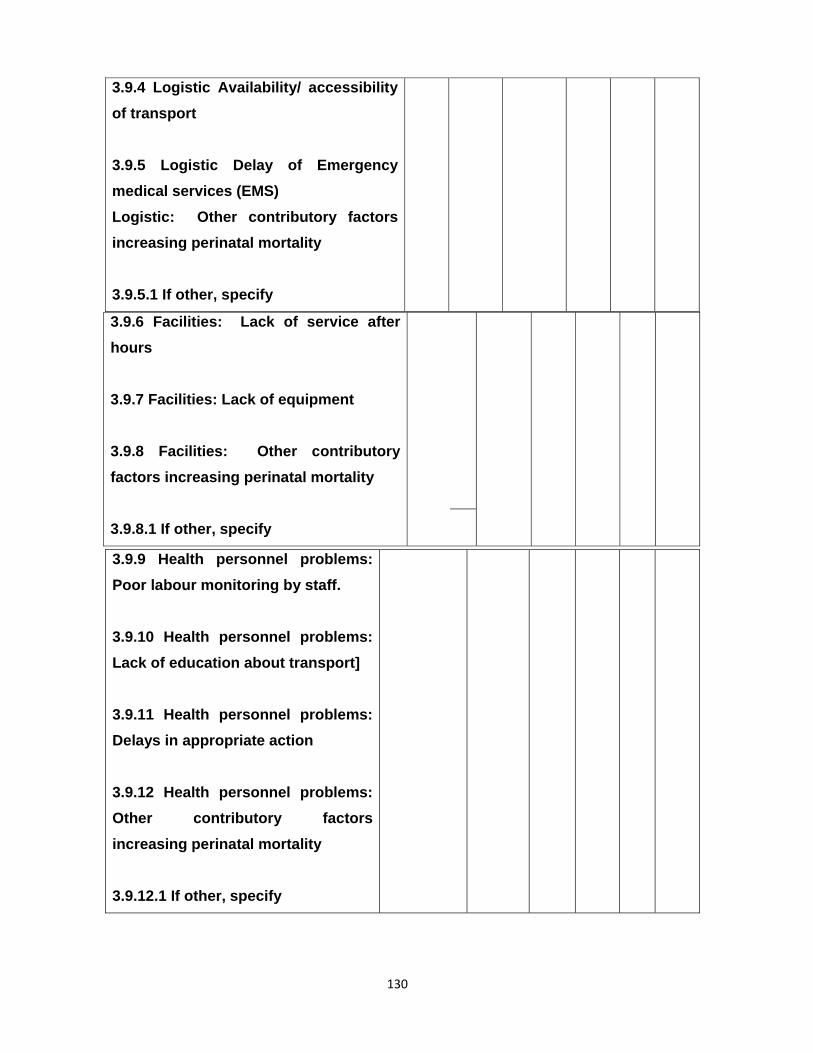
130
3.9.6 Facilities: Lack of service after
hours
3.9.7 Facilities: Lack of equipment
3.9.8 Facilities: Other contributory
factors increasing perinatal mortality
3.9.8.1 If other, specify
3.9.4 Logistic Availability/ accessibility
of transport
3.9.5 Logistic Delay of Emergency
medical services (EMS)
Logistic: Other contributory factors
increasing perinatal mortality
3.9.5.1 If other, specify
3.9.9 Health personnel problems:
Poor labour monitoring by staff.
3.9.10 Health personnel problems:
Lack of education about transport]
3.9.11 Health personnel problems:
Delays in appropriate action
3.9.12 Health personnel problems:
Other contributory factors
increasing perinatal mortality
3.9.12.1 If other, specify

131
3.9.13 Health or/and illness of the
neonate: Prematurity
3.9.14 Health or/and illness of the
neonate: Pneumonia
3.9.15 Health or/and illness of the
neonate: Birth asphyxia.
3.9.16 Health or/and illness of the
neonate: Other contributory factors
increasing perinatal mortality.
3.9.16.1 If other, specify
132
Annexure 11: Statistician report

133
Annexure 12: Language Editor’s report

134
Annexure 13: Technical Editor’s Letter

135

136