crs report for congress - benefitslink
TRANSCRIPT
Order Code RL30122
CRS Report for Congress
Pension Sponsorship and Participation: Summary of Recent Trends
Updated September 8, 2008
Patrick PurcellSpecialist in Income Security
Domestic Social Policy Division
Congressional Research Service � The Library of Congress � Washington, DC 20540
Pension Sponsorship and Participation:
Summary of Recent Trends
Summary
According to the Census Bureau’s Current Population Survey (CPS), the number ofprivate-sector workers between the ages of 25 and 64 whose employer sponsored a retirementplan rose from 51.2 million in 2006 to 53.5 million in 2007. The number of private-sectorworkers who participated in employer-sponsored retirement plans rose from 42.0 million in2006 to 44.1 million in 2007. The proportion of 25 to 64 year-old workers in the privatesector who participated in employer-sponsored retirement plans increased from 43.2% in2006 to 45.1% in 2007. Between 2000 and 2007, the number of private-sector workersbetween the ages of 25 and 64 who participated in employer-sponsored retirement plans fellfrom 46 million to 44 million. The percentage of workers who participated in an employer-sponsored plan fell from 50.3% in 2000 to 45.1% in 2007.
A CRS analysis of the Current Population Survey indicates that, among private-sectorworkers aged 25 to 64 who were employed year-round, full-time:
! The percentage of workers whose employer sponsored a retirement plan rosefrom 57.2% in 2006 to 59.9% in 2007.
! The percentage of workers who participated in employer-sponsoredretirement plans rose from 49.2% in 2006 to 52.0% in 2007.
! Only 25.5% of workers at firms with fewer than 25 employees participatedin an employer-sponsored retirement plan in 2007, compared to 45.5% ofworkers at firms with 25 to 99 employees and 65.4% of workers at firmswith 100 or more employees.
! Among men and women who were employed year-round, full-time, 51.6%of men and 52.6% of women participated in an employer-sponsoredretirement plan in 2007.
! Only 43.0% of private-sector workers aged 25 to 34 and employed year-round, full-time participated in an employer-sponsored retirement plan in2007, compared to 51.8% of workers aged 35 to 44, 57.4% of those aged 45to 54, and 57.6% of those aged 55 to 64.
! Black, Hispanic, and other non-white workers were less likely to haveparticipated in an employer-sponsored retirement plan. Fifty-eight percentof white workers participated in a company-sponsored retirement plan in2007, compared to 47.1% of black non-Hispanic workers, 30.6% ofHispanic workers, and 48.5% of other non-white workers (mainly Asian-American and Native American workers).
! Only 27.7% of workers whose earnings were in the lowest quartile in 2007(under $27,000) participated in a retirement plan at work, compared to69.2% of workers whose earnings were in the top quartile (above $63,000).
! The percentage of part-time workers in the private sector whose employersponsored a retirement plan rose from 37.8% in 2006 to 38.3% in 2007.Twenty-three percent of part-year or part-time workers in the private sectorparticipated in an employer sponsored retirement plan in 2007, essentiallyunchanged from 2006.

Contents
Background: Employment and an Aging Workforce . . . . . . . . . . . . . . . . . . . . . . . . . . . . 1Life Expectancy Continues to Increase . . . . . . . . . . . . . . . . . . . . . . . . . . . . . . . . . . . 1Labor Force Participation Begins to Drop After Age 55 . . . . . . . . . . . . . . . . . . . . . . 1Congress and Retirement Income Policies . . . . . . . . . . . . . . . . . . . . . . . . . . . . . . . . . 2Two Kinds of Retirement Plans: Defined Benefit and Defined Contribution . . . . . 3
Who Bears the Investment Risk? . . . . . . . . . . . . . . . . . . . . . . . . . . . . . . . . . . . . 3The Number of Defined Benefit Plans Is Declining . . . . . . . . . . . . . . . . . . . . . . . . . 4
Recent Trends in Retirement Plan Sponsorship and Participation . . . . . . . . . . . . . . . . . . 5Plan Participation by Full-Time vs. Part-Time Employment . . . . . . . . . . . . . . . . . . . 5Retirement Plans and Employer Size . . . . . . . . . . . . . . . . . . . . . . . . . . . . . . . . . . . . . 7Plan Participation Among Men and Women . . . . . . . . . . . . . . . . . . . . . . . . . . . . . . . 9Plan Participation by Employee Age . . . . . . . . . . . . . . . . . . . . . . . . . . . . . . . . . . . . 10Plan Participation by Employee Race . . . . . . . . . . . . . . . . . . . . . . . . . . . . . . . . . . . 12Plan Participation by Employee Earnings . . . . . . . . . . . . . . . . . . . . . . . . . . . . . . . . 14
Another Measure of Retirement Plan Participation: The National Compensation Survey . . . . . . . . . . . . . . . . . . . . . . . . . . . . . . . . . . . . 16
List of Tables
Table 1. Labor Force Participation Rates in 2007 . . . . . . . . . . . . . . . . . . . . . . . . . . . . . . . 2Table 2. Participation in Retirement Plans
by Full-Time vs. Part-Time Employment . . . . . . . . . . . . . . . . . . . . . . . . . . . . . . . . 6Table 3. Participation in Retirement Plans by Size of Firm . . . . . . . . . . . . . . . . . . . . . . . 8Table 4. Employee Participation in Retirement Plans, by Sex . . . . . . . . . . . . . . . . . . . . . 9Table 5. Employee Participation in Retirement Plans, by Age . . . . . . . . . . . . . . . . . . . . 11Table 6. Employee Participation in Retirement Plans, by Race . . . . . . . . . . . . . . . . . . . . 13Table 7. Participation in Retirement Plans by Annual Earnings . . . . . . . . . . . . . . . . . . . 15Table 8. Percentage of Private-Sector Employees Participating in
Employer-Sponsored Retirement Plans . . . . . . . . . . . . . . . . . . . . . . . . . . . . . . . . . . 17
U.S. National Center for Health Statistics, Vital Statistics of the United States.1
Pension Sponsorship and Participation:Summary of Recent Trends
Background: Employment and an Aging Workforce
The aging of the American population has made retirement income an issue ofincreasing concern to the Congress and the public. Although Americans are livinglonger than ever before, most retire before age 65. Moreover, while the nation’spopulation continues to grow, the decline in birth rates that followed the post-WorldWar II “baby boom” and the continued lengthening of life spans will result in fewerworkers relative to the number of retirees. These trends will affect the economicwell-being of future retirees because pensions and Social Security benefits will bepaid over longer periods of time; savings will have to be stretched over longerretirements; and Social Security benefits will have to be financed by a workingpopulation that is shrinking relative to the number of retirees.
Life Expectancy Continues to Increase
The average life expectancy of Americans born in 1960 was 69.7 years. It hasbeen estimated that those who were born in 2005 will live for an average of 77.8years. A man who reached age 65 in 1960 could expect to live another 13.0 years,1
while a woman who turned 65 in 1960 had a remaining life expectancy of 15.8 years.A man who reached age 65 in 2005 could expect to live another 16.8 years, while awoman who turned 65 in 2005 had a remaining life expectancy of 19.8 years. Asmore people live into old age, the age-profile of the population will shift. In 1960,16.7 million people in the United States — 9.2% of the population — were age 65or older. In 2005, there were 36.7 million Americans age 65 or older, representing12.4% of the population. By 2025, according to projections made by the Bureau ofthe Census, there will be 63.5 million people age 65 or older, comprising 18.2% ofthe U.S. population.
Labor Force Participation Begins to Drop After Age 55
The proportion of the population that is either working or looking for work iscalled the “labor force participation rate.” As indicated by the data in Table 1, thelabor force participation rate starts to drop significantly after age 55. When incomeis no longer derived from earnings, individuals depend more on pensions, interest anddividends, withdrawals from their savings, and — when they become eligible throughage or disability — Social Security. The aging of the U.S. population will placestrains on the components of the traditional “three-legged stool” of retirementincome: Social Security, pensions, and personal saving.

CRS-2
Defined benefit pensions are taxed when the employee receives benefits during retirement.2
Table 1. Labor Force Participation Rates in 2007
AgeTotal Number
of People(thousands)
Number in theLabor Force(thousands)
Labor ForceParticipation Rate
(percent)
Men
Age 25 to 54 62,081 56,408 90.9
Age 45 to 54 21,313 18,801 88.2
Age 55 to 64 15,658 10,904 69.6
Age 65 and up 15,525 3,188 20.5
Women
Age 25 to 54 63,615 47,945 75.4
Age 45 to 54 22,231 16,896 76.0
Age 55 to 64 16,876 9,846 58.3
Age 65 and up 20,703 2,615 12.6
Source: U.S. Department of Labor, Bureau of Labor Statistics, Employment and Earnings
(January 2008).
Congress and Retirement Income Policies
The Internal Revenue Code was first amended to provide favorable taxtreatment for qualified pension and retirement plans in the 1920s. These provisionshave been expanded and modified many times since then. Among the taxexemptions that apply to traditional “defined benefit” pension plans are the deductionof pension contributions from employer income, exclusion of employer contributionsto pension plans from employee income, and tax exemption of the earnings ofpension trusts. In “defined contribution” plans such as those authorized under2
section 401(k) of the tax code, income taxes are deferred until retirement onemployer and employee contributions to the plan and on the investment earnings ofthe plan.
By establishing the tax-favored status of pension programs and defining theterms under which tax exemptions and deductions are granted, federal tax law hasboth encouraged the growth of retirement plan coverage among workers and shapedthe development of pensions and retirement savings plans. Congress also has soughtto protect the pension benefits earned by workers through direct regulation of pensionplans, most notably through the Employee Retirement Income Security Act of 1974(ERISA, P.L. 93-406). ERISA, too, may have influenced the development ofemployer-sponsored retirement plans. Since its enactment, defined contribution (DC)plans have proliferated while the number of defined benefit (DB) plans has fallen.

CRS-3
Two Kinds of Retirement Plans: Defined Benefit and DefinedContribution
Retirement programs are legally classified as either defined benefit plans ordefined contribution plans. In defined benefit or “DB” plans, the retirement benefitusually is based on an employee’s salary and number of years of service. With eachyear of service, a worker accrues a benefit equal to either a fixed dollar amount permonth or year of service or a percentage of his or her final pay or average pay.
A defined contribution or “DC” plan is much like a savings account maintainedby the employer on behalf of each participating employee. The employer contributesa specific dollar amount or percentage of pay into the account, which is usuallyinvested in stocks and bonds. In some plans, the size of the employer’s contributiondepends on the amount the employee contributes to the plan. When the workerretires, the amount of the retirement benefit that he or she receives will depend on thebalance in the account, which is the sum of all the contributions that have been madeplus interest, dividends, and capital gains (or losses). The worker usually has thechoice of receiving these funds as a lump sum, a series of fixed payments over aperiod of years, or in the form of a life annuity.
In recent years, many employers have converted their traditional pensions tohybrid plans that have characteristics of both DB and DC plans. The most popularof these hybrids has been the cash balance plan. A cash balance plan looks like aDC plan in that the accrued benefit is defined in terms of an account balance. Theemployer makes contributions to the plan and pays interest on the accumulatedbalance. However, in a cash balance plan, the account balances are merelybookkeeping devices. They are not individual accounts that are owned by theparticipants. At retirement, the employee must receive a benefit that is equal to theamount contributed to the plan plus the interest that has been credited to thosecontributions. Legally, therefore, a cash balance plan is a defined benefit plan.
Who Bears the Investment Risk? In a defined benefit plan, it is theemployer who bears the investment risk of the plan, while in a defined contributionplan it is the employee who bears the investment risk. In a defined benefit plan, theemployer promises to provide retirement benefits equal to a certain dollar amount ora specific percentage of the employee’s pay. The employer contributes money to apension trust that is invested in stocks, bonds, real estate, or other assets. Retirementbenefits are paid from this trust fund. The employer is at risk for the amount of theretirement benefits that have been promised to employees and their survivors. Ifthere are insufficient funds in the pension trust to pay the accrued benefits, the firmthat sponsors the pension plan is legally obligated to make up the difference bypaying more money into the pension fund. This can be done over a period of years.
In a defined contribution plan, the employer bears no risk beyond an obligationto make contributions to each employee’s retirement account. In these plans, it is theemployee who bears the risk that his or her retirement account will increase in valueby an amount sufficient to provide adequate income during retirement. If thecontributions made to the account by the employer and the employee are insufficient,or if the securities in which the account is invested lose value or increase in value tooslowly, the employee risks having an income in retirement that is not sufficient to
CRS-4
Full-time and part-time wage and salary workers. (Source: Current Population Survey.)3
P.L. 95-600 authorized tax exemption only for employer contributions to a SEP. The Tax4
Reform Act of 1986 (P.L. 99-514) allowed workers in firms with fewer than 25 employeesto contribute to a SEP on a tax-deferred basis through salary reduction (SARSEP). P.L. 104-188 authorized SIMPLE plans to replace SARSEPs. Firms may continue to establish SEPsfunded exclusively by employer contributions, but new SARSEPs were prohibited afterDecember 31, 1996. Previously existing SARSEPs may continue as before.
Pension Benefit Guaranty Corporation, Pension Insurance Data Book 2006.5
maintain his or her desired standard of living. If this situation occurs, the workermight choose to delay retirement.
Many factors affect a firm’s decision to sponsor a retirement plan and aworker’s decision to participate in the plan. In any given year, changes in thebusiness climate — inflation, interest rates, wage increases, the cost of other benefits(such as health insurance), trends in business revenues and profits — could weighmore heavily in a firm’s decision to establish or continue a retirement plan than thepotential tax advantages it could gain by sponsoring a plan. Likewise, an employee’sdecision to participate or not to participate in a retirement plan may be affected bysuch variables as the rate of growth of wages, the rising cost of employee healthinsurance premiums, his or her confidence in the financial status of Social Security,and whether another family member already participates in a retirement plan.
Encouraging sponsorship of retirement plans by small firms is an importantissue to the Congress in part because of the large number of people employed bysmall businesses. In 2007, for example, more than 36 million wage and salaryworkers were employed by firms with fewer than 25 employees. The relatively low3
rates of employer sponsorship and employee participation in retirement plans at smallbusinesses have prompted Congress to look for ways to make it easier for smallemployers to establish and maintain retirement plans for their employees. Becausesmall employers may be reluctant to take on the financial risk and administrativeburden of establishing a defined-benefit pension plan, Congress has sought toencourage greater retirement plan sponsorship among small businesses mainly byeasing the financial and reporting requirements associated with certain types ofdefined contribution pension plans. The Revenue Act of 1978 (P.L. 95-600)authorized a defined contribution plan called the Simplified Employee Pension(SEP). The Small Business Job Protection Act of 1996 (P.L. 104-188) authorized4
another type of defined contribution plan called the Savings Incentive Match Plan forEmployees (SIMPLE). Nevertheless, rates of retirement plan sponsorship andparticipation in small firms continue to lag behind the rates achieved in larger firms.
The Number of Defined Benefit Plans Is Declining
According to the Pension Benefit Guaranty Corporation (PBGC), the numberof PBGC-insured defined benefit plans fell from 114,396 in 1985 to 30,328 in 2006.5
The decline in the number of DB plans resulted mainly from the termination of alarge number of small plans. Between 1985 and 2006, the number of single-employer defined benefit pension plans with fewer than 100 participants fell from90,061 to 18,199, a decline of 80%. The number of large DB plans fell from 22,147
CRS-5
to 10,585, a decline of 52.2%. In recent years, however, several large pension planshave been terminated, and others have been “frozen” so that participants no longeraccrue pension benefits.
Recent Trends in Retirement Plan Sponsorship and Participation
Every month, the Bureau of the Census conducts the Current Population Survey(CPS) among a nationally representative sample of approximately 100,000households, primarily for the purpose of estimating the rates of employment andunemployment. During March of each year, the survey includes supplementalquestions about employment, income, health insurance, retirement plan participation,and receipt of government benefits during the previous calendar year. Thisinformation allows analysts and researchers to calculate the number and percentageof workers who reported whether their employer offered a retirement plan andwhether they participated in the plan. Responses can then be categorized bydemographic and economic characteristics, such as the worker’s age, race, sex,income, and the size of firm at which they worked. Unfortunately, however, becausethe CPS asks only two pension-related questions — if the worker’s employer offereda retirement plan and if the worker was included in the plan — we cannot ascertainwhether the plan is a defined benefit plan or a defined contribution plan.
Plan Participation by Full-Time vs. Part-Time Employment
Table 2 compares retirement plan participation among year-round, full-timewage and salary workers in the private sector with participation among workers whowere employed part-year or part-time. Workers with part-year or part-timeemployment are much less likely to be employed by a firm that sponsors a retirementplan. Part-time and part-year workers also are less likely to participate if theiremployer sponsors a plan.
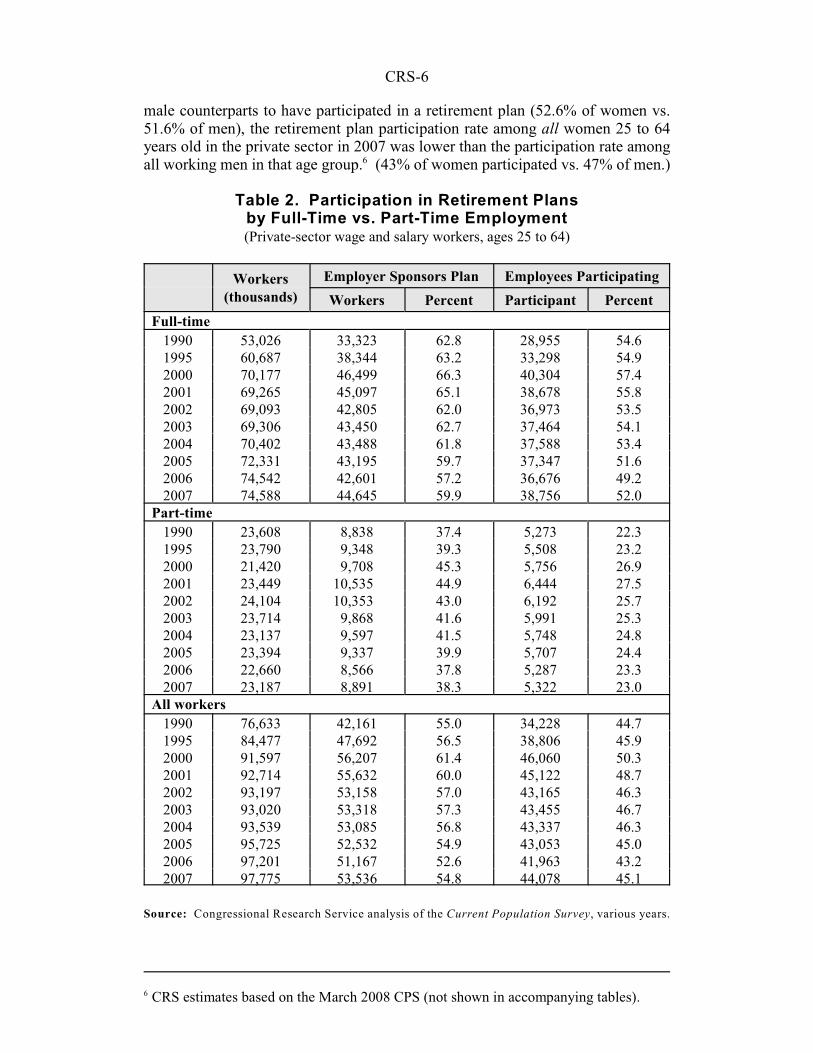
The proportion of year-round, full-time workers employed at firms thatsponsored a retirement plan increased from 57.2% in 2006 to 59.9% in 2007. Theparticipation rate among these workers rose from 49.2% in 2006 to 52.0% in 2007.Between 1990 and 2000, plan participation among full-time workers increased from54.6% to 57.4%. It has since fallen by about five percentage points. Between 2006and 2007, the proportion of part-time or part-year workers employed by firms thatsponsored a retirement plan rose from 37.8% to 38.3%. The participation rate amongpart-year and part-time workers whose employer sponsored a retirement plan wasessentially unchanged from 2006 to 2007, at approximately 23% in both years..
The lower rate of retirement plan participation among part-year and part-timeworkers is one of the reasons that women are less likely than men to participate in acompany-sponsored retirement plan. There is little difference in retirement planparticipation between men and women who work year-round, full-time. (See Table4.) Women, however, are more likely than men to work part-year or part-time. In2007, 82.7% of working men between the ages of 25 and 64 were employed year-round, full-time compared to 68.7% of working women in this age-group.Consequently, while women who worked full-time in 2007 were as likely as their
CRS-6
CRS estimates based on the March 2008 CPS (not shown in accompanying tables).6
male counterparts to have participated in a retirement plan (52.6% of women vs.51.6% of men), the retirement plan participation rate among all women 25 to 64years old in the private sector in 2007 was lower than the participation rate amongall working men in that age group. (43% of women participated vs. 47% of men.)6
Table 2. Participation in Retirement Plans by Full-Time vs. Part-Time Employment (Private-sector wage and salary workers, ages 25 to 64)
Workers(thousands)
Employer Sponsors Plan Employees Participating
Workers Percent Participant Percent
Full-time
1990 53,026 33,323 62.8 28,955 54.61995 60,687 38,344 63.2 33,298 54.92000 70,177 46,499 66.3 40,304 57.42001 69,265 45,097 65.1 38,678 55.82002 69,093 42,805 62.0 36,973 53.52003 69,306 43,450 62.7 37,464 54.12004 70,402 43,488 61.8 37,588 53.42005 72,331 43,195 59.7 37,347 51.62006 74,542 42,601 57.2 36,676 49.22007 74,588 44,645 59.9 38,756 52.0
Part-time
1990 23,608 8,838 37.4 5,273 22.31995 23,790 9,348 39.3 5,508 23.22000 21,420 9,708 45.3 5,756 26.92001 23,449 10,535 44.9 6,444 27.52002 24,104 10,353 43.0 6,192 25.72003 23,714 9,868 41.6 5,991 25.32004 23,137 9,597 41.5 5,748 24.82005 23,394 9,337 39.9 5,707 24.42006 22,660 8,566 37.8 5,287 23.32007 23,187 8,891 38.3 5,322 23.0
All workers
1990 76,633 42,161 55.0 34,228 44.71995 84,477 47,692 56.5 38,806 45.92000 91,597 56,207 61.4 46,060 50.32001 92,714 55,632 60.0 45,122 48.72002 93,197 53,158 57.0 43,165 46.32003 93,020 53,318 57.3 43,455 46.72004 93,539 53,085 56.8 43,337 46.32005 95,725 52,532 54.9 43,053 45.02006 97,201 51,167 52.6 41,963 43.22007 97,775 53,536 54.8 44,078 45.1
Source: Congressional Research Service analysis of the Current Population Survey, various years.
CRS-7
Not all employees whose employer sponsors a retirement plan are eligible to participate.7
For example, employees under age 21, those who have been employed for less than oneyear, and those who work fewer than 1,000 hours in a year can be excluded from the plan.
Retirement Plans and Employer Size
Data from the CPS show that retirement plan participation in small firms rosebetween 1990 and 2000, but has recently declined. The CPS data also indicate thataccess to a company-sponsored retirement plan remains substantially lower in smallfirms than in firms with 100 or more employees. The data displayed in Table 3 showthat from 1990 to 2007, the number of workers between the ages of 25 and 64 whowere employed in the private sector and worked year-round, full-time at firms of allsizes increased from 53.0 million to 74.6 million. At the same time, the number ofsuch workers whose employer offered a retirement plan increased from 33.3 millionto 44.6 million. The proportion of year-round, full-time workers who were employedat firms that offered a retirement plan rose from 62.8% in 1990 to 66.3% in 2000.It has since fallen to 59.9%.
The data displayed in Table 3 show that since 2000, the proportion of workersin firms with 100 or more workers whose employer sponsors a retirement plan hasfallen from 80.5% to 75.2%. Nevertheless, workers at large firms remainsubstantially more likely than employees of small businesses to work for an employerthat sponsors a retirement plan. In 2007, 29.3% of full-time workers in businesseswith fewer than 25 employees were employed at firms that sponsored a retirementplan, down from 34.2% in 2000. This was still higher than the 25.4% of workers atsmall firms whose employer sponsored a retirement plan in 1995. Among workersin firms with 25 to 99 employees, 53.1% were employed at firms that sponsored aretirement plan in 2007, compared to 58.5% in 2000 and 54.1% in 1995.
Table 3 also shows the percentage of year-round, full-time employees in theprivate sector who participated in an employer-sponsored retirement plan. This7
statistic takes into account the impact of employers that do not sponsor a plan onoverall retirement plan participation rates. Among firms of all sizes, the proportionof year-round, full-time employees between the ages of 25 and 64 who participatedin a retirement plan rose from 49.2% in 2006 to 52.0% in 2007. This was lower thanthe participation rates of 57.4% in 2000 and 54.9% in 1995. In firms with fewer than25 employees, just 25.5% of full-time employees between the ages of 25 and 64participated in a retirement plan in 2007, down from 29.3% in 2000, but higher thanthe 21.3% who participated in a plan in 1995. In firms with 25 to 99 employees,retirement plan participation rose from 42.6% in 2006 to 45.5% in 2007. This waslower than the participation rates of 49.4% in 2000 and 46.0% in 1995. Participationin retirement plans among workers in firms with 100 or more employees also rosebetween 2006 and 2007, increasing from 62.7% to 65.4%. This was about fivepercentage points lower than the participation rates of 70.2% in 2000 and 70.4% in1995.

CRS-8
Table 3. Participation in Retirement Plans by Size of Firm(Private-sector wage and salary workers, ages 25 to 64, employed year-round, full-time)
Size offirm
Workers(thousands)
Employer Sponsors Plan Employees Participating
Workers Percent Participants Percent
Under 25 employees
1990 12,119 3,042 25.1 2,619 21.61995 14,627 3,715 25.4 3,109 21.32000 16,591 5,575 34.2 4,857 29.32001 17,061 5,788 33.9 4,965 29.12002 17,878 5,658 31.7 4,880 27.32003 18,616 5,850 31.4 5,064 27.22004 18,906 5,795 30.7 5,016 26.52005 19,200 5,569 29.0 4,851 25.32006 19,406 5,160 26.6 4,434 22.92007 19,449 5,702 29.3 4,954 25.5
25 to 99 employees
1990 7,892 3,904 49.5 3,291 41.71995 9,108 4,923 54.1 4,188 46.02000 10,492 6,139 58.5 5,186 49.42001 10,466 6,086 58.2 5,067 48.42002 10,719 6,030 56.3 5,126 47.82003 10,540 6,133 58.2 5,254 49.92004 10,532 5,969 56.7 5,121 48.62005 11,214 5,975 53.3 5,070 45.22006 11,489 5,829 50.7 4,889 42.62007 11,367 6,041 53.1 5,166 45.5
100 or more employees
1990 33,014 26,378 79.9 23,045 69.81995 36,951 29,706 80.4 26,000 70.42000 43,094 34,692 80.5 30,262 70.22001 41,739 33,223 79.6 28,645 68.62002 40,496 31,116 76.8 26,967 66.62003 40,149 31,466 78.4 27,146 67.62004 40,964 31,724 77.4 27,452 67.02005 41,917 31,562 75.5 27,425 65.42006 43,646 31,612 72.4 27,353 62.72007 43,772 32,903 75.2 28,636 65.4
All firms 1990 53,026 33,323 62.8 28,955 54.61995 60,687 38,344 63.2 33,298 54.92000 70,177 46,499 66.3 40,304 57.42001 69,265 45,097 65.1 38,678 55.82002 69,093 42,805 62.0 36,973 53.52003 69,306 43,450 62.7 37,464 54.12004 70,402 43,488 61.8 37,588 53.42005 72,331 43,195 59.7 37,347 51.62006 74,542 42,601 57.2 36,676 49.22007 74,588 44,645 59.9 38,756 52.0
Source: CRS analysis of the Current Population Survey, various years.

CRS-9
Plan Participation Among Men and Women
Table 4 shows the rates of participation in employer-sponsored retirement plansby men and women between the ages 25 and 64 who were employed in the privatesector and worked year-round, full-time. Between 1990 and 2000, the proportion ofmen whose employer sponsored a retirement plan rose from 63.3% to 66.2%. Sincethen, it has dropped to 59.1%. The proportion of women who worked at firms thatsponsored a retirement plan increased from 62.1% in 1990 to 66.4% in 2000. In2007, 61.0% of women who worked year-round, full-time were employed at firmsthat sponsored a retirement plan. Thus, in 2007 women who were employed year-round, full-time were more likely than men to have worked for an employer thatsponsored a retirement plan. Men and women, however, were almost equally likelyto have participated in an employer-sponsored retirement plan. In 2007, 51.6% ofmen who were employed year-round, full-time participated in a company-sponsoredretirement plan, compared to 52.6% of women. Both of these participation rateswere lower than the 2000 participation rates of 58.3% for men and 56.1% for women.The participation rate for men was 6.7 percentage points lower in 2007 than in 2000.The participation rate for women was 3.5 percentage points lower in 2007 than in2000.
Table 4. Employee Participation in Retirement Plans, by Sex(Private-sector wage and salary workers, ages 25 to 64, employed year-round, full-time)
Workers(thousands)
Employer Sponsors Plan Employees Participating
Workers Percent Participants Percent
Men
1990 32,208 20,389 63.3 18,242 56.61995 36,504 23,008 63.0 20,359 55.82000 41,516 27,463 66.2 24,220 58.32001 40,976 26,539 64.8 23,164 56.52002 40,851 25,100 61.4 22,033 53.92003 40,963 25,306 61.8 22,083 53.92004 41,732 25,190 60.4 22,079 52.92005 42,881 25,136 58.6 22,021 51.42006 44,210 24,898 56.3 21,616 48.92007 43,844 25,897 59.1 22,600 51.6
Women
1990 20,817 12,934 62.1 10,713 51.51995 24,182 15,336 63.4 12,939 53.52000 28,661 19,036 66.4 16,083 56.12001 28,290 18,558 65.6 15,513 54.82002 28,242 17,704 62.7 14,939 52.92003 28,342 18,144 64.0 15,381 54.32004 28,670 18,298 63.8 15,509 54.12005 29,450 18,059 61.3 15,326 52.02006 30,332 17,703 58.4 15,060 49.72007 30.744 18,749 61.0 16,156 52.6
Source: Congressional Research Service analysis of the Current Population Survey, various years.

CRS-10
Some of the difference in participation rates is because workers under 35 are somewhat8
more likely to be in their first year with an employer and can be excluded from participatingin the plan. Employees who work fewer than 1,000 hours in a year and those under age 21also can be excluded from participating, but neither group is represented in Table 5.
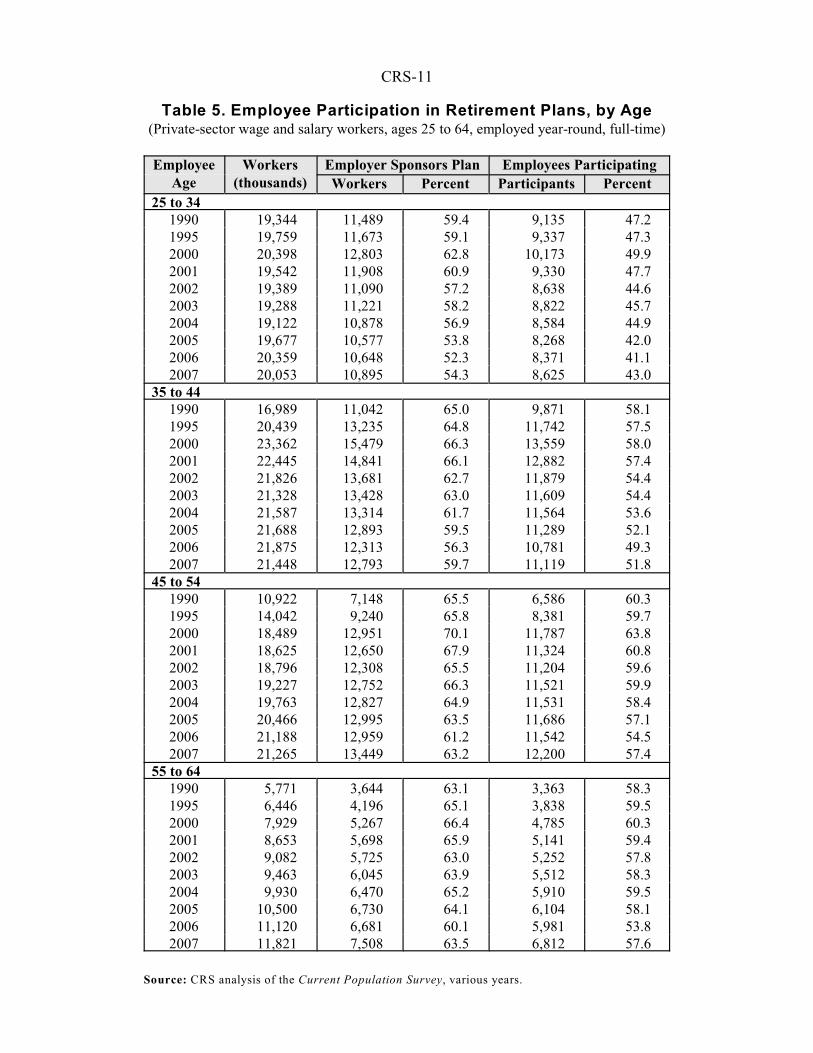
Plan Participation by Employee Age
Table 5 displays rates of participation in employer-sponsored retirement plansamong workers who were employed in the private sector and worked year-round,full-time, according to their age. Young workers — ages 25 to 34 — were lesslikely than middle-aged and older workers to be employed at a firm that sponsoreda retirement plan in 2007. They also were less likely to participate in retirementplans than are older workers. In 2007, 54.3% of workers 25 to 34 years old workedfor an employer that sponsored a retirement plan, and 43.0% of workers in this agegroup participated in a company-sponsored plan. Thus, 79.2% of those aged 25 to34 who worked for a firm that sponsored a plan participated in the plan (0.430/0.543= 0.792). In contrast, among workers 55 to 64 years old, 63.5% worked at firms thatsponsored a retirement plan, and 57.6% participated in a company-sponsored plan.Thus, among workers aged 55 to 64 who worked for a firm that sponsored aretirement plan, 90.7% participated in the plan (0.576/0.635 = 0.907).8
CRS-11
Table 5. Employee Participation in Retirement Plans, by Age(Private-sector wage and salary workers, ages 25 to 64, employed year-round, full-time)
EmployeeAge
Workers(thousands)
Employer Sponsors Plan Employees Participating
Workers Percent Participants Percent
25 to 341990 19,344 11,489 59.4 9,135 47.21995 19,759 11,673 59.1 9,337 47.32000 20,398 12,803 62.8 10,173 49.92001 19,542 11,908 60.9 9,330 47.72002 19,389 11,090 57.2 8,638 44.62003 19,288 11,221 58.2 8,822 45.72004 19,122 10,878 56.9 8,584 44.92005 19,677 10,577 53.8 8,268 42.02006 20,359 10,648 52.3 8,371 41.12007 20,053 10,895 54.3 8,625 43.0
35 to 441990 16,989 11,042 65.0 9,871 58.11995 20,439 13,235 64.8 11,742 57.52000 23,362 15,479 66.3 13,559 58.02001 22,445 14,841 66.1 12,882 57.42002 21,826 13,681 62.7 11,879 54.42003 21,328 13,428 63.0 11,609 54.42004 21,587 13,314 61.7 11,564 53.62005 21,688 12,893 59.5 11,289 52.12006 21,875 12,313 56.3 10,781 49.32007 21,448 12,793 59.7 11,119 51.8
45 to 541990 10,922 7,148 65.5 6,586 60.31995 14,042 9,240 65.8 8,381 59.72000 18,489 12,951 70.1 11,787 63.82001 18,625 12,650 67.9 11,324 60.82002 18,796 12,308 65.5 11,204 59.62003 19,227 12,752 66.3 11,521 59.92004 19,763 12,827 64.9 11,531 58.42005 20,466 12,995 63.5 11,686 57.12006 21,188 12,959 61.2 11,542 54.52007 21,265 13,449 63.2 12,200 57.4
55 to 641990 5,771 3,644 63.1 3,363 58.31995 6,446 4,196 65.1 3,838 59.52000 7,929 5,267 66.4 4,785 60.32001 8,653 5,698 65.9 5,141 59.42002 9,082 5,725 63.0 5,252 57.82003 9,463 6,045 63.9 5,512 58.32004 9,930 6,470 65.2 5,910 59.52005 10,500 6,730 64.1 6,104 58.12006 11,120 6,681 60.1 5,981 53.82007 11,821 7,508 63.5 6,812 57.6
Source: CRS analysis of the Current Population Survey, various years.

CRS-12
Plan Participation by Employee Race
The March 2003 CPS introduced newly expanded categories of race andethnicity, making comparisons with prior years problematic. In Table 6, race andethnicity are categorized as white non-Hispanic, black non-Hispanic, Hispanic, andother. The “other”category includes mainly persons whose heritage is Asian, NativeAmerican, Eskimo, or Pacific Islander. In 2007, the likelihood of being employed ata firm that sponsored a retirement plan was highest for white non-Hispanic workersand lowest for Hispanic workers. Black non-Hispanic workers and “Asian/Other”workers were about equally likely to have worked for an employer that sponsored aretirement plan. Among white non-Hispanic workers, 65.4% worked for anemployer that sponsored a retirement plan, and 57.6% participated in an employer-sponsored plan. Among Hispanic workers, just 37.5% worked for an employer thatsponsored a retirement plan and only 30.6% participated in an employer-sponsoredretirement plan. Of workers who classified their race and ethnicity as black non-Hispanic, 57.6% worked for an employer that sponsored a plan and 47.1%participated in a plan, while among Asian-American and other workers, 55.4%worked for an employer that sponsored a retirement plan and 48.5% participated ina plan.

CRS-13
Table 6. Employee Participation in Retirement Plans, by Race(Private sector wage and salary workers, ages 25 to 64, employed year-round, full-time)
EmployeeRace
Workers(thousands)
Employer Sponsors Plan Employees Participating
Workers Percent Participants Percent
White, non-Hispanic
2002 49,012 32,711 66.7 28,836 58.82003 48,524 32,800 67.6 28,759 59.32004 48,618 32,427 66.7 28,522 58.72005 49,952 32,490 65.0 28,618 57.32006 50,627 31,740 62.7 27,817 55.02007 50,835 33,251 65.4 29,291 57.6
Black, non-Hispanic
2002 7,078 4,156 58.7 3,363 47.52003 7,241 4,311 59.5 3,555 49.12004 7,556 4,570 60.5 3,753 49.72005 7,511 4,295 57.2 3,491 46.52006 7,927 4,224 53.3 3,468 43.82007 7,805 4,499 57.6 3,675 47.1
Hispanic
2002 8,942 3,582 40.1 2,777 31.12003 9,073 3,750 41.3 2,956 32.62004 9,651 3,802 39.4 2,987 31.02005 10,208 3,775 37.0 2,964 29.02006 10,982 3,843 35.0 3,032 27.62007 10,834 4,065 37.5 3,310 30.6
Other
2002 4,062 2,356 58.0 1,996 49.22003 4,468 2,588 57.9 2,193 49.12004 4,578 2,689 58.7 2,326 50.82005 4,660 2,636 56.6 2,274 48.82006 5,007 2,794 55.9 2,358 47.12007 5,114 2,830 55.4 2,481 48.5
Source: Congressional Research Service analysis of the Current Population Survey, various years.
CRS-14
Plan Participation by Employee Earnings
Table 7 shows the relationship between earnings and participation in anemployer-sponsored retirement plan. In Table 7, workers’ annual earnings fromwages and salaries — as reported on the Current Population Survey — are ranked byquartile. In 2007, one-quarter of private-sector wage and salary workers between theages of 25 and 64 who were employed year-round, full-time earned more than$63,000. Another quarter had earnings between $40,000 and $63,000. The nextquarter had earnings between $27,000 and $40,000, and those in the lowest quartileearned less than $27,000.
In 2007, 73.8% of year-round, full-time workers in the private sector withannual earnings in the top quartile were employed by firms that sponsored aretirement plan, and 69.2% of workers in the top earnings quartile participated in aretirement plan. Both of these percentages were lower than the rates in 2000 and1995. In 2000, 80.2% of year-round, full-time workers in the private sector withannual earnings in the top quartile were employed by firms that sponsored aretirement plan, and 75.5% of workers in the top earnings quartile participated in aretirement plan. The equivalent sponsorship and participation rates in 1995 were77.1% and 73.0%, respectively.
The percentage of workers employed at firms that sponsored a retirement planand the percentage who participated in these plans were progressively lower in eachof three lowest earnings quartiles. For example, among workers in the lowestearnings quartile in 2007, 38.4% were employed at firms that sponsored a retirementplan, and 27.7% of workers in the bottom quartile participated in a retirement plan.Both of these percentages were lower than the comparable rates in 2000 and 1995.In 2000, 44.9% of year-round, full-time workers in the private sector with annualearnings in the bottom quartile were employed by firms that sponsored a retirementplan, and 32.1% of workers in the bottom earnings quartile participated in aretirement plan. The equivalent sponsorship and participation rates in 1995 were42.4% and 30.4%, respectively.
Low-wage workers are not only less likely to work for an employer thatsponsors a retirement plan; they also are less likely to participate if a plan is offered.Among employees whose earnings in 2007 were in the top quartile, 73.8% workedfor an employer that sponsored a retirement plan and 69.2% participated in aretirement plan. Therefore, the participation rate among employees in the topearnings quartile whose employer sponsored a retirement plan was 93.8%(0.692/0.738 = 0.938). Among workers whose 2007 earnings were in the bottomquartile, only 38.4% worked for an employer that sponsored a retirement plan andjust 27.7% participated in a retirement plan. Thus, the participation rate among low-wage employees whose employer sponsored a retirement plan was 72.1%(0.277/0.384 = 0.721).

CRS-15
Table 7. Participation in Retirement Plans by Annual Earnings(Private-sector wage and salary workers, ages 25 to 64, employed year-round, full-time)
Worker’s AnnualEarnings
Employer Sponsors Plan Employee Participates
Percentage of Workers Percentage of Workers
Highest Earnings Quartile1990 77.9 73.71995 77.1 73.02000 80.2 75.52001 78.2 73.32002 75.3 71.02003 77.0 72.52004 75.8 71.42005 74.4 70.32006 70.9 66.72007 73.8 69.2
Second-highest Earnings Quartile1990 72.0 64.21995 72.4 65.12000 74.3 67.12001 74.2 66.72002 70.9 63.32003 71.0 63.62004 71.3 64.12005 68.6 61.52006 66.8 59.92007 69.4 62.8
Third-highest Earnings Quartile1990 61.3 51.41995 61.0 51.32000 66.0 55.52001 63.9 52.92002 61.3 51.62003 61.6 51.72004 60.9 51.02005 59.0 49.82006 56.2 46.32007 59.1 49.7
Lowest Earnings Quartile1990 41.2 30.31995 42.4 30.42000 44.9 32.12001 44.9 31.52002 41.4 29.52003 41.2 28.42004 41.6 29.92005 39.0 27.52006 36.6 26.22007 38.4 27.7
Source: CRS analysis of the Current Population Survey, various years.

CRS-16
For more information on the National Compensation Survey, see U.S. Department of9
Labor, National Compensation Survey: Employee Benefits in Private Industry in the UnitedStates, March 2007, available online at [http://www.bls.gov/ncs/ebs/sp/ebsm0006.pdf].
In the Census Bureau’s Current Population Survey, employer characteristics are reported10
at the level of the firm, which may include more than one establishment.
Another Measure of Retirement Plan Participation:
The National Compensation Survey
The Bureau of Labor Statistics collects data from employers about paid leave,health insurance, retirement plan participation, flexible spending accounts, and otheremployee benefits as part of the National Compensation Survey (NCS). This surveyis conducted among a nationally representative sample of private-sector businessestablishments. The term establishment usually refers to a single place of business9
at a particular location or all branches of a business in a particular metropolitan areaor county. An establishment might be a branch or small operating unit of a largerfirm. In contrast, a firm comprises all of the establishments that together form acorporation, partnership, or other business entity.10
According to the data collected from employers through the NationalCompensation Survey, 51% of workers in the private sector participated in employer-sponsored retirement plans in March 2007. (See Table 8.) Twenty percent of private-sector workers participated in defined benefit plans and 43% participated in definedcontribution plans. Approximately 12% of private-sector workers participated inboth types of plan. The NCS indicates that 66% of employees in establishments with100 or more workers participated in an employer-sponsored retirement plan in March2007, while only 37% of employees at establishments with fewer than 100 employeesparticipated in an employer-sponsored retirement plan. The data from the NCS alsoindicate that among full-time workers, 60% participated in an employer-sponsoredretirement plan in March 2007, compared to just 23% of part-time workers.
While it is not necessarily surprising that the results of the NCS differ fromthose of the CPS, nor that the NCS shows higher rates of participation, it is importantto note that in recent years the difference in the results shown by the two surveys hasincreased because the NCS has indicated a generally steady rate of retirement planparticipation whereas the CPS data indicate that retirement plan participation hasbeen falling. As recently as 2003, the NCS indicated that 49% of private-sectorworkers participated in a retirement plan whereas the CPS data showed aparticipation rate of 47%. This two percentage point difference was small enoughto be inconsequential for most analytical purposes. The slightly higher rate ofparticipation indicated by the NCS might partly be due to the fact that the businessowners and benefits specialists who are interviewed for the NCS could be expectedto have greater knowledge of employer-provided benefits than the householdmembers interviewed for the CPS. By March 2007, however, the NCS indicated thatthe proportion of private-sector workers participating in employer-sponsoredretirement plans was 51%, whereas the March 2008 CPS (which asks about pensionparticipation in 2007) showed that participation in retirement plans among privatesector workers had fallen to 45%. The difference in the results shown by the two

CRS-17
surveys can no longer be considered inconsequential, leaving analysts to questionwhether one or both surveys have problems related to sample selection or surveymethodology.
Table 8. Percentage of Private-Sector Employees Participating in Employer-Sponsored Retirement Plans
Type of Retirement Plan
All Types Defined Benefit Defined Contribution
Establishment Size
1-99 workers
March 2003 35 8 31
March 2004 37 9 32
March 2005 37 9 32
March 2006 37 9 33
March 2007 37 9 33
100 or more workers
March 2003 65 33 51
March 2004 67 34 53
March 2005 67 36 53
March 2006 67 33 54
March 2007 66 32 53
Work Schedule
Full-time workers
March 2003 58 24 48
March 2004 60 24 50
March 2005 60 25 50
March 2006 60 23 51
March 2007 60 23 50
Part-time workers
March 2003 18 8 14
March 2004 20 9 14
March 2005 19 9 14
March 2006 21 8 16
March 2007 23 9 18
All workers
March 2003 49 20 40
March 2004 50 21 42
March 2005 50 21 42
March 2006 51 20 43
March 2007 51 20 43
Source: U.S. Department of Labor, National Compensation Survey.
Note: Data represent 102 million workers employed in the private sector in 2003 and
108 million workers employed in the private sector in 2007.